
Full Article
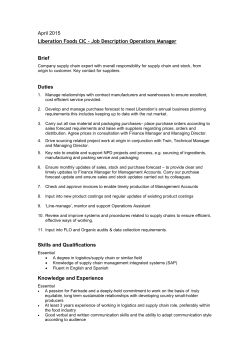
J. OF PUBLIC BUDGETING, ACCOUNTING & FINANCIAL MANAGEMENT, 14(2), 175-195
SUMMER 2002
INSTITUTIONAL STRUCTURES UTILIZED IN STATE
REVENUE FORECASTING
William Voorhees*
ABSTRACT. Approaches taken by states in their revenue forecasting are
extremely diverse. This research identifies six institutional structures that states
utilize in their revenue forecasting processes. The results show that the
“typical” state utilizes a non-consensual approach to forecast formulation with
the forecast being done by a single executive agency or cabinet office and with
the executive having the final say in the forecast. The “typical” state will not
have an economic advisory council, but will utilize faculty from local
universities. The “typical” state updates its forecast about every six months and
the forecasters perceive their forecast as binding the state budget.
INTRODUCTION
One of the most critical functions of a state government is the
production of its revenue forecast. If the actual revenue falls short of the
forecast, the state must readjust its annual plan by cutting appropriations.
On the other hand, if the actual revenue exceeds the forecast,
supplemental appropriations are in order. In either case the appropriation
levels are often modified outside of the decision making process that
produced the original fiscal plan. In order to minimize this disruption,
states must focus on improving forecast accuracy. One tool at the
disposal of the state is the institutional structure under which the forecast
is generated.
Just how important is it to states that accurate revenue forecasts are
made? Poor forecasts are manifested as either a revenue shortfall or a
revenue surplus. In the first instance, the government will be faced with
raising additional revenues, cutting expenses or some combination of
---------------------* William Voorhees, Ph.D., is an Assistant Professor, School of Public Affairs,
Arizona State University. His publications and research interests include topics
in revenue forecasting, governmental accounting, and public finance.
Copyright © 2002 by PrAcademics Press
176
VOORHEES
the two. In the early 1980s several states implemented contingency
taxes, which were automatically triggered when revenue collections fell a
certain percentage below the projected revenues (Gold, 1983).
Other states with revenue shortfalls might opt to reduce operating
expenditures to meet the reduced revenue levels. Cutback management is
a reactionary response performed after shortfalls have occurred and in
the end may not result in optimal budgetary allocations. Reductions can
take several forms including line item reductions, across the board
departmental reductions or programmatic reductions.
Line item
reductions may result in hiring and salary freezes, early retirement,
unpaid furloughs, layoffs, reduced maintenance on equipment and fixed
assets, and elimination of new equipment purchases (Lee & Johnson,
1998). Departmental cuts may be across the board with each department
required to contribute a fixed percentage, as was the case for Indiana in
1992 (Zorn, 1996). Across the board cuts, where all departments bear an
equal burden, is often contrary to optimal budget allocation. Few would
argue that state park services are of equal or greater importance than
medical services, especially when the medical services may be reduced
below needed capacities due to cutbacks. Unfortunately, in the heat of
the moment, budgetary allocations are frequently reduced by a uniform
amount across all departments.
Programmatic cuts on the other hand fall on specific programs, as was
the case in Georgia in 1992. Programmatic cuts normally fall on
programs that are allocated large amounts of funds and are not federally
funded, mandated or supported by earmarked funds (Lauth, 1996). In
this case reallocation may tend to be somewhat more desirable than an
across the board cut; it is also a redistributive process as opposed to a
distributive process. The redistributive aspect can be troubling in light of
the limited citizen and government input that occurs in the allocation of
cutbacks. It has been shown that budget adjustments tend to be “less
visible and more technically driven, giving a greater role to
administrators than to either the public or the legislature” (Forrester &
Mullins, 1992, p. 467).
While more accurate forecasts will not improve the revenue picture,
advanced notice of shortfalls can result in a more optimal allocation of
funds under greater pubic scrutiny. Additionally, the knowledge of a
INSTITUTIONAL STRUCTURES UTILIZED IN STATE REVENUE FORECASTING
177
shortfall provided by a more accurate forecast will allow the government
to take corrective action such as raising taxes or implementing user fees.
To this point the focus has been on revenue shortfalls; however, errors
that underestimate revenue are also a concern. Excess revenue usually
does not place the same kind of stress on government as do shortfalls.
However, consistent overestimation may result in citizen dissatisfaction
due to excessively held funds by the government. Indeed, Gold (1983)
suggests that excess revenues were a primary cause of Proposition 13
and the subsequent tax revolt that swept the nation in the late 1970s.
Thus, whether one speaks of shortfalls or windfalls, the importance of
accurate forecasts is obvious.
INSTITUTIONAL STRUCTURES AND REVENUE FORECASTING
While many revenue forecast errors are attributed to randomness,
studies have shown that several other factors can be attributed to forecast
error (Bretschneider & Gorr, 1992; Bretschneider, Gorr, Grizzle & Klay,
1989; Cassidy, Kamlet & Nagin, 1989; Gentry, 1989; Mocan & Azad,
1995; Voorhees, 2000). These factors include economic variability,
political composition of the state government, forecast methodology, and
institutional structure. Of these factors, institutional and methodological
factors are the only characteristics that the state can readily change.
Institutional characteristics that impact revenue forecasts are often
artifacts of previous attempts to improve the budgetary process.
Institutional structures seem to come under pressure for change when
revenues fail to meet projected revenues, as was the case in the early
1990s in Virginia. Facing revenue short falls, the state legislature ordered
a review of its forecasting procedures including both organizational and
methodological procedures. This review resulted in the state’s revising
procedures to increase both the sharing of information and the
documentation of judgmental forecasts (Jonas, Rest & Atkinson, 1992).
Contingency theory suggests that organizations often alter their
structures when faced with changing environments in order to optimize
performance (Thompson, 1967).
This research explores current institutional structures utilized by the
states and the regional variation in structures. To determine the
178
VOORHEES
institutional structures that governments are currently utilizing, a survey
was mailed in the spring and summer of 1999 to the person(s)
responsible for forecasting in each of the fifty states. Forty-eight states
responded with information on their forecasting processes. Six
institutional structures that influence the forecast are examined in this
research.
- How do states formulate the forecast?
- How do states agree to the forecast?
- Does the forecast constrain the budget?
- Does the state use university consulting?
- Does the state have a formal council of economic advisors?
- What is the frequency of the state forecast?
Forecast Formulation
Any one of a number of organizations within a state government or,
for that matter, any combination of those groups may formulate the
revenue forecast. The structure in which the forecast formulation takes
place can have a significant impact on the accuracy of the forecast
(Voorhees, 2000). Some structures are inclusive and provide for a great
deal of boundary spanning, which in turn increases information flows to
forecasters. The greater the level of information, the less likely
forecasters will experience “assumption drag” or the inability of an
organization to base its forecasts on accurate and up-to-date assumptions
(Ascher, 1978).
To offset the effects of assumption drag, states will often form
panels of forecasters with each forecaster developing his/her own
forecast. The forecasts are then compared and the panel of forecasters
will come to a consensus as to the best forecast. In some cases a new
model will be developed that includes assumptions from several of the
original models. Weltman (1996) suggests that improvements from
consensus forecasts provide additional information as to the possible
range of a forecast. This allows planners to adjust planning accordingly.
Additionally, when done regularly, the comparison of a panel of
INSTITUTIONAL STRUCTURES UTILIZED IN STATE REVENUE FORECASTING
179
forecasts will aid in determining trend changes or turning points that a
single forecast might not pick up.
From the business literature, there is substantial support for a
consensual approach to forecasting. Studies, which have examined the
accuracy of consensus forecasting, have shown the benefit of the
consensus approach. In a study of twenty-two forecasters, Batchelor and
Dua conclude that there are benefits to combining even a few different
forecasts when they are produced with different theories or techniques
(Batchelor & Dua, 1990).
In a similar study of seventy-nine forecasters, Zarnowitz, (1984)
found that the mean forecast was more accurate than three- quarters of
the individual forecasts. Confirming Zarnowitz's study, McNees found
that out of twenty-two forecasters, the mean was more accurate than all
but five individual forecasters (McNees, 1987). If the accurate forecaster
could be determined a priori, one might simply use the most accurate
forecaster. However. Batchelor concludes that there is no significant
difference in the accuracy of forecasters, so without the benefit of
hindsight, determining the most accurate forecast is problematic
(Batchelor, 1990). Of course a consensual approach must be counterbalanced by the political necessity to minimize conflict in the forecast
formulation process. The states were grouped into six categories with
each category representing a point in which a forecast may be originally
formulated:
- A single executive agency or a single cabinet department,
- A single legislative agency,
- A separate forecast by the legislature and executive,
- A forecast based upon the consensus of multiple executive agencies,
- A forecast based upon the consensus of multiple executive and
legislative agencies, and
- An independent conference.
Table 1 contains the classification assigned to each state, based on
the description the respondents provided in the survey. By far the largest
180
VOORHEES
category for formulation of a state forecast is that of a single agency (or
cabinet agency). As shown in Table 2, 42% of all respondents fall into
this category. The western states led all regions with 55% of all the states
in the region using this approach. The Midwest with 42%, the Northeast
at the mean of 40% and the South with 33% follows the West.
Frequently, the agency that is responsible for revenue collections may
be called upon to provide some or all of the revenue forecasts to the
executive. These agencies will generally have the necessary data required
for sophisticated analysis in addition to personnel who are highly
knowledgeable about the specific taxes levied by the state.
The typical collection agency or department of revenue might well
be broken into divisions that are responsible for each of the taxes a state
levies. In some instances, the forecasting for many states will be done
within these separate tax divisions (e.g., Sales Tax Division, Income Tax
Division). In other states, the department of revenue might have separate
divisions that forecast all of the taxes levied by the state.
In addition to the revenue collection agencies, the executive budget
agency may also be responsible for the revenue forecasts. In this case,
the forecast formulation is likely to work in concert with the governor's
fiscal plan and hence have more exposure to political influences than
found in a traditional agency. Of course, agencies should not be
considered immune to political influences.
TABLE 1
Institutional Characteristics by State
State
(1)
(2)
(3)
(4)
(5)
(6)
---------------------------------------------------------------------------------------Alabama
M
B
No
Yes
No
12
Alaska
E
I
No
Yes
No
6
Arizona
M
N
No
Yes
Yes
3
Arkansas
E
G
Yes
Yes
Yes
3
California
E
I
No
No
Yes
6
Colorado
E
L
Yes
No
No
3
INSTITUTIONAL STRUCTURES UTILIZED IN STATE REVENUE FORECASTING
181
TABLE 1 (Continued)
State
(1)
(2)
(3)
(4)
(5)
(6)
---------------------------------------------------------------------------------------Connecticut
E
B
Yes
Yes
No
1
Delaware
I
B
Yes
Yes
Yes
2
Florida
M
B
No
Yes
Yes
6
Georgia
E
I
No
Yes
Yes
*
Hawaii
I
N
No
Yes
Yes
3
Idaho
E
I
No
Yes
Yes
6
Illinois
E
B
No
No
No
3
Indiana
M
N
Yes
Yes
No
12
Iowa
I
C
Yes
Yes
Yes
3
Kansas
I
N
No
Yes
Yes
6
Kentucky
I
C
No
Yes
Yes
*
Louisiana
I
C
No
Yes
Yes
3
Maine
I
N
Yes
No
Yes
6
Maryland
I
I
Yes
Yes
Yes
4
Massachusetts
E
I
No
No
No
3
Michigan
M
I
No
Yes
Yes
6
Minnesota
E
I
Yes
Yes
Yes
*
Mississippi
I
B
No
Yes
Yes
6
Missouri
M
N
No
Yes
Yes
12
Montana
S
L
No
Yes
Yes
24
Nebraska
I
C
No
Yes
Yes
4
New Hampshire L
L
Yes
Yes
No
12
New Jersey
E
I
Yes
Yes
No
6
New York
M
B
No
No
No
4
North Carolina
M
N
Yes
No
Yes
3
North Dakota
E
I
Yes
Yes
Yes
6
Ohio
E
L
Yes
Yes
No
12
Oklahoma
M
C
No
Yes
Yes
12
Oregon
E
I
Yes
Yes
Yes
3
Pennsylvania
E
I
No
No
Yes
6
Rhode Island
M
B
No
Yes
Yes
6
South Carolina
I
B
Yes
Yes
Yes
1
South Dakota
E
L
Yes
Yes
Yes
12
182
VOORHEES
TABLE 1 (Continued)
State
(1)
(2)
(3)
(4)
(5)
(6)
---------------------------------------------------------------------------------------Tennessee
E
B
No
Yes
No
6
Texas
E
I
No
Yes
Yes
12
Utah
L
L
Yes
Yes
Yes
3
Vermont
M
B
Yes
Yes
Yes
6
Virginia
I
B
Yes
Yes
Yes
12
Washington
E
C
No
No
Yes
3
West Virginia
E
I
Yes
Yes
Yes
12
Wisconsin
S
N
No
Yes
No
12
Wyoming
I
B
No
Yes
Yes
6
Notes:
Column (1) = Forecast Formulation where E = Single Executive Agency; L =
Single Legislative Agency; M = Multiple Executive and Legislative Agencies;
I = Independent Conference; S = Separate Legislative and Executive Forecast;
Column (2) = Forecast Agreement where G = Governor Only; L = Legislative
Only; B = Governor and Legislative; I = Independent Cabinet/Governor; C =
Independent Conference; N = No Agreement
Column (3) = Economic Advisor;
Column (4) = University Consulting;
Column (5) = Bind Budget;
Column (6) = Forecast Frequency (in terms of average months between
forecasts) and * = as needed
Legislative bodies may also assume responsibility for generating the
official forecast. In this instance, the legislature’s fiscal committee staff
will usually be the source of the revenue forecast, although house and
senate leadership may also be participants. Only two states, New
Hampshire and Utah, use this approach. This is not to say that other
legislatures do not prepare revenue forecast; many do. However, it is
only in these two states that the legislature is responsible for the official
forecast.
In addition to legislative agencies taking the lead in forecast
formulation, Table 2 shows that two state legislatures, Wisconsin and
INSTITUTIONAL STRUCTURES UTILIZED IN STATE REVENUE FORECASTING
183
TABLE 2
Institutional Characteristics by Region (Percentages in parenthesis)
Northeast Midwest South
West Total
(N=10) (N=12) (N=15) (N=11) (N=48)
---------------------------------------------------------------------------------------Panel A. Forecast Formulation-Consensus
Single Executive Agency
or Cabinet
4 (40) 5 (42) 5 (33) 6 (55) 20 (42)
Single Legislative Agency
1 (10) 0 (0) 0 (0) 1 (9)
2 (4)
Separate Executive and
Legislative Forecast
0 (0) 1 (0) 0 (8) 1 (9)
2 (4)
Multiple Executive Agencies
0 (0) 0 (0) 1 (7) 0 (0)
1 (2)
Multiple Executive and
Legislative Agencies
3 (30) 3 (25) 3 (20) 1 (9) 10 (21)
Independent Conference2 (20) 3 (25) 6 (40) 2 (18) 13 (27)
Panel B. Forecast Agreement
No Agreement
1 (10) 4 (33) 1 (7) 2 (18) 8 (17)
Independent Cabinet or
Governor
3 (30) 3 (30) 4 (27) 4 (36) 14 (29)
Governor & Cabinet
0 (0) 0 (0) 1 (7) 0 (0)
1 (2)
Legislature Only
1 (10) 2 (20) 0 (0) 3 (27) 6 (13)
Independent Conference0 (0) 2 (20) 3 (20) 1 (9)
6 (13)
Governor and Legislature
5 (50) 1 (10) 6 (40) 1 (9) 13 (27)
Panel C. Economic Advisory Council
Yes
6 (60) 6 (50) 6 (40) 3 (27) 21 (44)
No
4 (40) 6 (50) 9 (60) 8 (73) 27 (56)
Panel D. University Consulting
Yes
6 (60) 11 (92) 14 (93) 8 (73) 39 (81)
No
4 (40) 1 (8)
1 (7) 3 (27) 9 (19)
Panel E. Forecast Frequency
As Needed
0 (0) 1 (8) 2 (13) 0 (0)
3 (6)
Monthly
1 (10) 0 (0) 1 (7) 0 (0)
2 (4)
Every 2 months
1 (10) 0 (0) 0 (0) 0 (0)
1 (2)
Every 3 months
1 (10) 2 (17) 3 (20) 6 (55) 12 (25)
Every 4 months
1 (10) 1 (8) 1 (7) 0 (0)
3 (6)
Every 6 months
5 (50) 3 (25) 3 (20) 4 (36) 15 (31)
Yearly
1 (10) 5 (42) 5 (33) 0 (0) 11 (23)
Biennially
0 (0) 0 (0) 0 (0) 1 (9)
1 (2)
184
VOORHEES
TABLE 2 (Continued)
Northeast Midwest South
West Total
(N=10) (N=12) (N=15) (N=11) (N=48)
---------------------------------------------------------------------------------------Panel G. Bind Budget
Yes
5 (50) 8 (67) 13 (87) 9 (82) 35 (73)
No
5 (50) 4 (33) 4 (27) 0 (0) 13 (27)
Montana, create separate official forecasts. In these two states, both the
executive and the legislative branches are responsible for generating a
forecast. While this provides each branch with a revenue forecast on
which to base its budget, they both must in the end come to some
agreement, either directly or indirectly, on the amount of revenue in
order to finalize appropriations for the state. Such a process may not only
delay the resolution of the forecast, but also re-open budgetary conflicts
that had previously been resolved.
The final three approaches to forecast formulation are commonly
referred to as consensus approaches. With these approaches, multiple
agencies or groups are responsible for generating the forecast. The first
of these three approaches is a consensus of multiple executive agency
departments. For instance, some states require participation from both
the department of revenue and the budget office in formulation of a
forecast. In such a setting, the more politically oriented budget office will
work in concert with the agency or agencies responsible for revenue
collections. Responses show that only Oklahoma utilizes this approach.
Another form of consensus forecasting requires members of the
legislative staff and the executive agencies to jointly formulate a
forecast. Such a consensus formulation will often include not only
members from the governor's office and executive agencies such as the
department of revenue and budget office, but also members of the house
and senate leadership and fiscal committees. Staff from the fiscal
committees will frequently sit in place of the legislators, but work under
the guidance of the legislative leadership. This form of consensus often
INSTITUTIONAL STRUCTURES UTILIZED IN STATE REVENUE FORECASTING
185
has the unique advantage of obtaining an inherent agreement to the
revenue forecast from both legislative and executive branches, thus
reducing conflict over the revenue forecasts during the appropriations
process. Survey responses indicate this is one of the more popular
approaches to revenue forecasting among the states, with 18% of the
states using this approach. The greatest usage of this approach is found in
the Northeast with 30% utilization, followed by the Midwest (25%), the
South (20%), and the West with the fewest states (9%).
A third form of consensus includes outside, independent individuals
in the formulation process and generally entails the implementation of a
forecasting conference. Membership in the conference will typically
include representatives from the legislature, the executive, and the
outside members. The governor and the legislature may appoint the
outside members from the private sector, or there may be standing
appointments, such as economists at state universities. This approach
also has the advantage of an inherent consensus on the revenue forecast
between the executive branch and the legislative branch prior to the
appropriation process.
In addition, consensus forecasting has the ability to bring to the table
the knowledge of both academics and private sector leaders who may be
able to illuminate the forecast beyond the capabilities typically found in
government. For example, many large corporations also perform
economic analysis and sales forecasts for the upcoming year. To say the
least, private sector sales forecasts and government revenue forecasts are
not unrelated. When the private sector forecasts fail to substantiate the
public sector forecasts, there is cause for concern. The utilization of
private sector members in public sector forecasting allows for the
interchange of both a public and private sector view of the economic
prospect for the forth-coming year(s). Independent conferences are
second in popularity after the single agency reporting to the executive
and are utilized by over 27% of the states that responded to the survey.
It is important to note that generation of a forecast does not
necessarily mean that the forecast is agreed upon, but rather it is merely
the starting point. Naturally, this raises the issue of partisanship both
within and between the legislative branches. Conflict is likely to increase
when both the majority and minority parties participate in formulation of
186
VOORHEES
the forecast. Likewise, a bi-cameral legislature with each body controlled
by a different party may also increase conflict in forecast formulation.
Depending on the rules governing the committee, such conflict may or
may not result in compromise forecasts being made. If unanimous
consent is needed, then more conflict and compromise is expected than if
a simple majority vote on the forecast is required.
Forecast Agreement
After the forecast is formulated, the next point at which error may be
introduced into the forecast is when the formulated forecast is agreed
upon. Depending on the state process, agreement may be required by the
executive only, the legislature only, a combination of the legislature and
the executive, or an independent conference. In some circumstances,
there need be no agreement at all.
Of the states surveyed, Table 2 shows that 29% require only the
approval of the executive, or in a few cases, an elected cabinet official. In
27% of the states, both legislative and executive agreement must be
obtained, while only legislative approval and independent conference
categories are requirements of 13% of the states. In 17% of the states, no
agreement is required at all.
Presumably, the earlier in the process that agreement is reached, the
sooner the revenue forecast is not subject to change. A forecast subject to
change in the later stages of the appropriations process is likely to be
subjected to pressures that are juxtaposed to production of an accurate
forecast. A government in the waning stages of the annual (or biennial)
session and pressured to pass appropriations bills is more likely to
modify the forecast to achieve budgetary balance if the forecast is still
subject to change. To the contrary, a forecast that has been previously
agreed upon by the parties and/or their representatives is less likely to be
subjected to revisions derived for the convenience of budgetary balance.
Second, a forecast subject to change in the latter stages of the
appropriations process will likely face the problem of satisfying the
objectives of a larger contingent with broader interests. As the number of
the decision-makers increases, there is a greater likelihood the forecast
INSTITUTIONAL STRUCTURES UTILIZED IN STATE REVENUE FORECASTING
187
will be made with a greater focus on the amount of money available for
appropriations rather than on obtaining an accurate forecast or as Charles
Lindblom (1959) termed it, a decision based on the means rather than the
ends. To clarify this point, consider a small group of conferees charged
with agreeing upon the forecast. Although sub-objectives may exist, their
primary objective is to agree on an accurate forecast. Once the entire
legislature becomes involved, the objective becomes considerably more
muddied as each legislator now introduces multiple policy objectives
into the calculus of determining the forecast.
Academic Participation
One way in which states can broaden their forecasting experience
and knowledge is to utilize faculty from local universities. The
advantages of doing this are twofold. First many university economists
develop state level economic forecasts for use by the private sector and
thus bring to the forecast additional knowledge of economic conditions.
The additional knowledge may be beneficial in setting revenue forecast
assumptions. If these forecasts are not used outright, they do provide a
good benchmark for in-house developed projections of the state
economy.
Second, faculty familiarity with forecasting methodology provides
an opportunity to infuse this technology into state government. For
instance, the University of Iowa has been instrumental in developing a
vector auto regression (VAR) approach to forecasting in Iowa (Otrok and
Whitman, 1997). It is unlikely that either the knowledge or resources
exist within the typical state level government to identify and implement
these “new” methodologies. From Table 2 the reader will see that most
states consider university faculty an important resource and include them
in their forecasting process. Over 80% of the states make some use of
university faculty, although not all of those states have faculty as
members of a consensus committee or for that matter even have a
consensus forecasting process. The South (93%) and the Midwest (92%)
make the strongest use of university faculty, while in the Northeast only
56% of the states make use of faculty in their forecasts. Many states
INSTITUTIONAL STRUCTURES UTILIZED IN STATE REVENUE FORECASTING
188
such as Iowa and Tennessee actually fund university research that aids
the state in arriving at its forecast.
Balanced Budget Requirements
One institutional measure that has been utilized in previous studies
has been the requirement of the state to balance the budget. However,
given the broad range of balance requirements summarizing this into a
single variable can be difficult (National Association of State Budget
Officers, 1995). Some states require merely the submission of a balanced
budget by the governor, while other states require the enacted budget to
be balanced; still other states require the budget be balanced when the
year is over (Mikesell, 1999). In some instances, the state constitution
prevents the state from running a deficit, but often the definitions of a
deficit are not those of common usage. Additionally, many states
operate under limitations that bind expenditures to growth in personal
income, population or inflation (Joyce & Mullins, 1991) that could make
balance requirements moot.
Instead of trying to categorize this hopeless array of requirements, it
was decided to ask the forecaster if the budget was bound by their
forecast. This also follows the format of previous surveys posing this
question (Federation of Tax Administrators, 1993; Rubin, Mantell &
Peters, 1999). In many respects this produces more desirable results in
that this captures the perception of the forecasters as to whether the
budget is bound by the forecast they are responsible for making.
Table 2 indicates that 73% of the survey states consider their budgets
to be bound by the forecast. The South lead all regions with 87%,
followed by the West with 82%, and the Midwest with 67%. The
Northeast was the lowest with 50% suggesting that the forecast bound
the budget.
Council of Economic Advisors
The underlying economic assumptions utilized in the state forecast
can have a significant impact on the accuracy of a revenue forecast.
While national estimates may provide a baseline for the states,
differences are to be expected (Shkurti, 1990). Many state governments
utilize a council of economic advisors to recommend forecast
INSTITUTIONAL STRUCTURES UTILIZED IN STATE REVENUE FORECASTING
189
assumptions in much the same manner that the President's Council of
Economic Advisors does in the United States Federal Government.
Some states such as New York actually have two councils, one for the
legislature, and one for the executive (Rubin, Mantell & Peters, 1999).
The establishment of a council of economic advisors may provide
several benefits and is recommended by the National Association of
State Budget Officers (Howard, 1989). First, this provides a means of
enlisting the best and brightest economists in the state. These economists
will presumably provide superior information as to the state of the
economy for the forthcoming forecasting periods. Second, by enlisting
an advisory council, the ability to isolate bias introduced by policy
preferences and politics can be minimized. In reality, this may not be as
true as many would like to believe. One need only look to the selection
process to realize that many council members are often closely linked to
the executive of the state because of the executive’s authority to appoint
council members.
Table 2 indicates that 44% of the surveyed states have a formal
council of economic advisors. The Northeast leads the country in use of
economic councils with 60% of the states having councils. The Midwest
follows the Northeast with 50%. The West utilizes councils the least,
with only 27% of the states having an economic advisory council. It
needs to be mentioned, however, that these are formal councils. Many
states do make use of informal councils by calling upon government
leaders, business executives, and academicians for advice and
recommendations on the forecast and its underlying assumptions
(Federation of Tax Administrators, 1993).
Frequency of Forecast Update
The final institutional factor is the frequency of the forecast update.
Various factors such as budget periodicity, volatility of the economy, and
the manpower available to perform the updates will influence the update
frequency. In fact, even within the state, different revenues may be
forecast at different frequencies. For all of these reasons and more, there
is no consistent approach to the forecast update. Because of this, the term
forecast frequency will be limited and defined as the average number of
months between a statewide forecast of all revenue sources.
190
VOORHEES
Generally speaking, many states will institute the initial forecast
three or four months prior to the submission of the forecast to the
legislature. Just prior to submission of the forecast, a second forecast
might be made to verify the accuracy of the initial forecast. Several states
indicate that yet another forecast may be made at about the time the
appropriation bills are being considered by the legislature. Several states
indicated that they forecast on an “as needed” basis, while still others
who make biennial budgets only forecast every 24 months. On Chart 1,
states that have indicated they forecast on an as-needed basis have been
coded as zero months. This is not meant to indicate that the forecast
processes are ongoing or that these states perform forecasts on less than a
monthly basis. States categorized into the “as-needed” category may
forecast at any interval. Indeed, some states in this category may forecast
on a monthly basis while others forecast on a biennial basis.
The frequency of forecasts for the 1998 sample of states shows that
on the average states forecast every 5.42 months, excluding states that
claim a forecast on an “as-needed basis.” In 1991 the same states
averaged a forecast every 5.7 months, resulting in a decrease in forecast
frequency of 0.05 months. Although the magnitude of the forecast
frequency change over this period is small and hardly worth considering,
it should be noted that the direction is one that would be expected.
Most of the study period took place during an expansionary period
resulting in revenue growth. Given the propensity of state forecasts to be
consistently biased towards underestimation (Bretschneider et al., 1989;
Cassidy, Kamlet & Nagin, 1989; Frank, 1988; Joyce & Rodgers, 1996;
Voorhees, 2000), a poor forecast during this period would in the best
case be more accurate and in the worse case result in excess revenues.
On the other hand, in times of recession it might be prudent to increase
the revenue forecast frequency to monitor potential short falls of the
projection.
Chart 1 shows that between 1991 and 1998, the number of
states that forecast on a monthly, bi-monthly, and biennial basis
was unchanged. The number of states forecasting on a quarterly basis
decreased by two for this period and states that forecast on a semi-
INSTITUTIONAL STRUCTURES UTILIZED IN STATE REVENUE FORECASTING
191
CHART 1
Forecast frequency distribution for 1991 and 1998
18
16
14
Number of States
12
10
8
1991
6
1998
4
2
0
0
1
2
3
4
6
12
24
Average M onths Between Forecasts
annual basis decreased by one, while the number of states forecasting
three times a year and annually increased by two and six states,
respectively. Perhaps most informative is the decrease in the number of
states forecasting on an “as-needed” basis.
CONCLUSION
Approaches taken by states in their revenue forecasting are
extremely diverse. States have taken different approaches to formulating
the forecast, to agreeing on the forecast, to use of university faculty and
economic advisory councils, and to the frequency of the forecast. This
research has found that the “typical” state utilizes a non-consensual
approach to forecast formulation with the forecast being done by a single
executive agency or cabinet office with the executive having the final say
192
VOORHEES
in the forecast. The typical state does not have an economic advisory
council to generate baseline assumptions for the forecast, but will almost
certainly utilize faculty from local universities in developing their
forecast. The typical state updates its forecast every six months and
forecasters in these states perceive their forecast as binding the state
budget in as to its expenditure level.
Not withstanding the profile of the “typical” state, many states have
adopted different institutional approaches that have increased
participation and information flows in both the formulation and
agreement stages of setting revenue forecasts. This is evidenced by the
large number of states that both utilize consensual approaches to forecast
formulation and require multiple parties to agree on the final forecast.
Obviously, there is no “one best way” that can be advocated but rather it
is incumbent upon each state to understand how these institutional tools
of forecasting can best be utilized within the state.
ACKNOWLEDGEMENT
The author would like to thank the Federation of Tax Administrators
for help in collecting the data used in this study.
REFERENCES
Ascher, W. (1978). Forecasting: An Appraisal for Policy-makers and
Planners. Baltimore, MD: Johns Hopkins.
Batchelor, R. (1990). “All Forecasters Are Equal.” Journal of Business
and Economics Statistics, 8(1): 143-144.
Batchelor, R., & Dua, P. (1990). “Forecaster Ideology, Forecasting
Technique and the Accuracy of Economic Forecasting”, Tenth
International Symposium on Forecasting, Greece, June.
Bretschneider, S., & Gorr, W. (1992). “Economic, Organizational and
Political Influences on Biases in State Revenue Forecasting.” Journal
of International Forecasting, 7: 457-66.
Bretschneider, S., Gorr, W., Grizzle, G. & Klay, E. (1989). “Political and
Organizational Influences on the Accuracy of Forecasting State
INSTITUTIONAL STRUCTURES UTILIZED IN STATE REVENUE FORECASTING
193
Government Revenues.” International Journal of Forecasting, 5, 30719.
Cassidy, G., Kamlet, M., & Nagin, D. (1989). “An Empirical
Examination of Bias in Revenue Forecasts by State Governments.”
International Journal of Forecasting, 5, 321-31.
Federation of Tax Administrators. (1993). State Revenue Forecasting and
Estimation Practices. Washington, DC: Author.
Forrester, J., & Mullins, D. (1992). “Rebudgeting: The Serial Nature of
the Municipal Budgetary Process.” Public Administration Review,
52(5), 467-73.
Frank, H. (1988). Model Utility along the Forecast Continuum: A Case
Study in Florida Local Government Revenue Forecasting (Ph.D.
Dissertation), Tallahassee, FL: Florida State University.
Gentry, W. (1989). “Do State Revenue Forecasters Utilize Available
Information?” National Tax Journal, 42(4), 429-39.
Gold, S. (1983). “Contingency Measures and Fiscal Limitations: The
Real World Significance of Some Recent State Budget Innovations.”
National Tax Journal, 37, 421-32.
Howard, M. (1989). Good Practices in Forecasting. Washington, DC:
National Association of State Budget Officers.
Jonas, K., Rest, G. J., & Atkinson, T. (1992). “Virginia's Revenue
Forecasting Process and Models.” Public Budgeting & Finance,
12(2), 70-81.
Joyce, P., & Rodgers, R. (1996). “The Effect of Underforecasting on the
Accuracy of Revenue Forecasts by State Government.” Public
Administration Review 56(1), 48-56.
Joyce, P., & Mullins, D. (1991). “The Changing Fiscal Structure of the
State and Local Public Sector: The Impact of Tax and Expenditure
Limitations.” Public Administration Review 51(3), 240-254.
Lauth, T. (1996). “Reductions in the FY 1992 Georgia Budget:
Responses to a Shortfall.” In Aman Khan and Bartley Hildreth
(Eds.), Case Studies in Public Budgeting and Financial Management,
pp.221-248. Dubuque, IA: Kendall Hunt.
194
VOORHEES
Lee, R., & Johnson, R. (1998). Public Budgeting Systems. Gaithersburg,
MD: Aspen.
Lindblom, C. (1959, Spring). “The Science of Muddling Through.”
Public Administration Review, 19, 79-88.
McNees, S. K. (1987, November). “Consensus Forecasts: Tyranny of the
Majority.” New England Review, 15-21.
Mikesell, J. (1999). Fiscal Administration: Analysis and Applications for
the Public Sector. New York: Harcourt Brace.
Mocan, H. N., & Azad, S. (1995). “Accuracy and Rationality of State
General Fund Revenue Forecasts: Evidence from Panel Data.”
International Journal of Forecasting, 11, 417-27.
National Association of State Budget Officers. (1995). Budget Stability:
A Policy Framework for the States. Washington, DC: Author.
Otrok, C., & Whitman, C. (1997). “What to Do When the Crystal Ball Is
Cloudy: Conditional and Unconditional Forecasting in Iowa.” Paper
presented at the National Tax Association, 90th Annual Meeting on
Taxation, Chicago.
Rubin, M., Mantell, N., & Peters, J. L. (1999). “Revenue Forecasting and
Estimation.” In Bartley Hildreth and James Richardson (Eds.).
Handbook on Taxation (1st ed.) (pp. 769-99). New York: Marcel
Dekker.
Shkurti, W. (1990). “A User's Guide to State Revenue Forecasting.”
Public Budgeting & Finance, 10(1), 79-94.
Thompson, J. D. (1967). Organizations in Action: the Social Science
Bases of Administrative Theory. New York: McGraw Hill.
Voorhees, W. (2000). “The Impact of Political, Institutional,
Methodological and Economic Factors on Forecasts Error” (Ph.D.
Dissertation). Bloomington, IN: Indiana University.
Weltman, J. (1996). “Using Consensus Forecast in Business Planning.”
The Journal of Business Forecasting, 14(4), 13-16.
INSTITUTIONAL STRUCTURES UTILIZED IN STATE REVENUE FORECASTING
195
Zarnowitz, V. (1984). “The Accuracy of Individual and Group Forecasts
from Business Outlook Surveys.” Journal of Forecasting, 3(1), 1126.
Zorn, K. (1996). “Financial Management under Budgetary Stress.” In
Aman Khan and Bartley Hildreth (Eds.), Case Studies in Public
Budgeting and Financial Management (pp.571-80). Dubuque, IA:
Kendall Hunt.


© Copyright 2026