
Impact of changes in mode of travel to work on changes in body
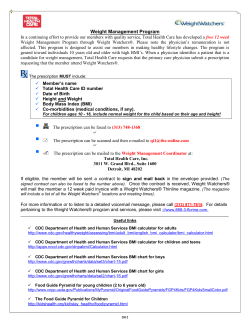
Research report
Impact of changes in mode of travel to work on
changes in body mass index: evidence from the
British Household Panel Survey
Adam Martin,1 Jenna Panter,2 Marc Suhrcke,1,3 David Ogilvie2
▸ Additional material is
published online only. To view
please visit the journal online
(http://dx.doi.org/10.1136/jech2014-205211).
1
Health Economics Group and
UKCRC Centre for Diet and
Activity Research (CEDAR),
Norwich Medical School,
University of East Anglia,
Norwich, UK
2
MRC Epidemiology Unit and
UKCRC Centre for Diet and
Activity Research (CEDAR),
University of Cambridge,
Cambridge, UK
3
Centre for Health Economics,
University of York, York, UK
Correspondence to
Adam Martin, Health
Economics Group and UKCRC
Centre for Diet and Activity
Research (CEDAR), Norwich
Medical School, University of
East Anglia, Norwich, NR4 7TJ,
UK; [email protected]
Received 5 November 2014
Revised 9 February 2015
Accepted 27 February 2015
ABSTRACT
Background Active commuting is associated with
various health benefits, but little is known about its
causal relationship with body mass index (BMI).
Methods We used cohort data from three consecutive
annual waves of the British Household Panel Survey, a
longitudinal study of nationally representative
households, in 2004/2005 (n=15 791), 2005/2006 and
2006/2007. Participants selected for the analyses
(n=4056) reported their usual main mode of travel to
work at each time point. Self-reported height and weight
were used to derive BMI at baseline and after 2 years.
Multivariable linear regression analyses were used to
assess associations between switching to and from
active modes of travel (over 1 and 2 years) and change
in BMI (over 2 years) and to assess dose–response
relationships.
Results After adjustment for socioeconomic and
health-related covariates, the first analysis (n=3269)
showed that switching from private motor transport to
active travel or public transport (n=179) was associated
with a significant reduction in BMI compared with
continued private motor vehicle use (n=3090;
−0.32 kg/m2, 95% CI −0.60 to −0.05). Larger adjusted
effect sizes were associated with switching to active
travel (n=109; −0.45 kg/m2, −0.78 to −0.11),
particularly among those who switched within the first
year and those with the longest journeys. The second
analysis (n=787) showed that switching from active
travel or public transport to private motor transport was
associated with a significant increase in BMI
(0.34 kg/m2, 0.05 to 0.64).
Conclusions Interventions to enable commuters to
switch from private motor transport to more active
modes of travel could contribute to reducing population
mean BMI.
INTRODUCTION
To cite: Martin A, Panter J,
Suhrcke M, et al. J
Epidemiol Community Health
Published Online First:
[please include Day Month
Year] doi:10.1136/jech2014-205211
Public health guidelines encourage adults to undertake at least 30 min of moderate-intensity physical
activity daily to help prevent obesity and several
other chronic conditions.1 While opportunities to
increase time spent being active at home or during
leisure or work time can be costly or limited,
incorporating walking or cycling into the journey
to and from work may represent a relatively low
cost, more feasible option for many people.2–4
Cross-sectional studies have identified individuallevel associations between walking and cycling to
work and various health outcomes including lower
body mass index (BMI)5 6 and lower prevalence of
cardiovascular disease or diabetes.5 7 Of 30
individual-level studies of the association between
active travel and BMI identified in a recent review,
25 reported statistically significant negative relationships ( p<0.05).8 However, just one study identified in the review,9 and one further study of the
relationship between active travel and overall physical activity in adults,10 used longitudinal study
designs. This limits the potential for drawing reliable causal inferences, not least because other
studies have indicated that increases in body weight
may precede reductions in physical activity.8 11 12
Other longitudinal ecological studies have demonstrated population-level correlations between
decreasing active travel,13 increasing car use14–16
and increasing prevalence of adult obesity or
average BMI over time. To the best of our knowledge, however, no longitudinal study has used a
nationally representative data set to examine the
individual-level impact on BMI of switching
between modes of travel.17 This paper uses cohort
data from the British Household Panel Survey
(BHPS) to estimate the effects on BMI of switching
between private motor transport and active travel
or public transport (which typically involves some
walking or cycling to or from stations or stops)18 19
for the journey to and from work.
METHODS
British Household Panel Survey
The BHPS is a longitudinal study of private households in Great Britain that began in 1991/1992 as an
annual survey of each adult member of a nationally
representative sample of households (BHPS waves
after 2008/2009 are encompassed in the new
‘Understanding Society’ survey, http://www.iser.essex.
ac.uk/survey/bhps).20 Self-reported height and weight
were reported in only two waves: September 2004–
May 2005 (subsequently referred to as t0,
n=15 791) and September 2006–March 2007 (t2,
n=15 392). Data from these two waves and an intermediate wave (t1, September 2005–May 2006) were
used in these analyses. Participants consented to use
their survey information, and the data for these analyses were anonymous, with access administered by
the UK Data Archive (http://www.data-archive.ac.uk).
Sample selection
Figure 1 shows how the sample used in the analyses
(n=4056) was selected from the original BHPS
sample at t0 (n=15 791). Participants eligible for
inclusion in the analyses were those aged over
18 years who reported the socioeconomic and
health status characteristics listed below (under
‘Covariates and other participant characteristics’)
Martin A, et al. J Epidemiol Community Health 2015;0:1–9. doi:10.1136/jech-2014-205211
1
Research report
Figure 1 Samples used in the
analyses and description of sample
selection criteria. (a) To assess missing
variables bias (height and weight
data), characteristics of individuals
who reported travel mode other than
‘other’ at t0 but not height and weight
at t0 are compared with individuals
who remained in the sample (see
online supplementary appendix). (b) To
assess attrition bias, characteristics of
individuals who reported height and
weight at t0 but had dropped out of
the sample before t2 are compared
with individuals who remained in the
sample (see online supplementary
appendix). (c) Of whom 10 participants
had a commute time of >30 min at t0,
42 switched between t0 and t1, and
the most common travel mode
switched to was walking (n=83).
(d) Of whom 32 participants had a
commute time of >30 min at t0, 26
switched between t0 and t1, and the
most common travel mode switched to
was rail travel (n=32). (e) Of whom 10
participants had a commute time of
>30 min at t0, 84 switched between
t0 and t1, and the most common
travel mode switched from was
walking (n=121). (f ) Of whom 59
participants had a commute time of
>30 min at t0, 56 switched between
t0 and t1, and the most common
travel mode switched from was bus/
coach travel (n=73).
and who reported their usual main mode of travel to work,
height and weight at t0 and t2. An assessment of attrition bias
and missing values bias comparing participants in the original
BHPS sample with those retained in the analytical sample is presented in the online supplementary appendix.
Change in BMI
The outcome variable used in the analyses was change in BMI
between t0 and t2. BMI in each wave was calculated by dividing
self-reported weight (reported in kg, or converted to kg from
stones and pounds) by the square of self-reported height
(reported in metres, or converted to metres from feet and
inches). Where height differed between waves, baseline height
was used to prevent small artefactual differences in height
2
affecting the results (if, eg, height was reported using metric
units in one wave and imperial units in the other). Follow-up
height measures were used to replace implausible baseline values
attributable to obvious data entry errors in three cases. A small
number of participants were excluded from the analyses due to
implausible values for weight (<30 kg, n=7) or change in
weight (>87 kg, n=7). Following contact with BHPS administrators, other adjustments were also made for coding errors in
imperial measurements ( please contact authors for details).
Change in usual mode of travel to work
Participants reported their usual main mode of travel to work at
t0, t1 and t2 in nine categories. For each wave, participants
were categorised as using active modes of travel (‘walking’ or
Martin A, et al. J Epidemiol Community Health 2015;0:1–9. doi:10.1136/jech-2014-205211
Research report
‘cycling’), public transport (‘bus/coach’, or rail: ‘train’ or ‘underground/metro’), or private motor transport (‘car or van’, ‘car/
van passenger’ or ‘motorcycle’). Participants who reported using
‘other’ modes of travel were excluded from analysis.
Covariates and other participant characteristics
Covariates were used to account for selected individual-level
characteristics reported at t0, and changes in individual-level
characteristics between t0 and t2, which have previously been
shown to be associated with active travel and obesity,5 6 16 21–25
and hence were hypothesised to act as potential confounders of
the relationship between active travel and BMI. The covariates
reported at t0 were: age, gender, occupational status (for analytical
purposes, binary variables were created for each of the seven
Registrar General’s Social Class categories), working hours
(2 binary variables: weekly hours of work ≥30 (‘full-time’) versus
<30 (‘part-time’), and night-time versus other-time work), annual
household income (quintiles to account for the impact of household size and age of children on living standards, using the
McClements equivalence scale),20 educational level (degree or
higher qualification vs less than degree), number of children under
16 in the household (one or more vs none), self-reported health
status (5 categories from ‘excellent’ to ‘very poor’), and number of
cars in the household (1 or more vs none). The covariates which
accounted for changes that occurred between t0 and t2 were:
home location (a single variable: ≥1 move between t0 and t2),
household income (2 variables: increase and decrease of >2 quintiles), health status (2 variables: increase and decrease of ≥2 categories), car access (2 variables: gaining and losing household
access to ≥1 car), pregnancy (2 variables: becoming and no longer
being pregnant).
Other variables reported at t0 were also selected for use in the
descriptive statistics: commuting time (minutes), region (13 categories), annual frequency of primary care and hospital outpatient
visits, smoking status, and frequency of leisure activities in three
separate categories: playing sport, walking or swimming (hereafter
leisure time physical activity or LTPA), gardening and eating out.
Statistical analysis
The variables and subsamples selected for use in 18 separate analytical models (models A-R) are summarised in figure 2. To assess
the effects of switching to and from active commuting, two separate analyses were conducted. First, we examined the effect of
switching from private motor transport at t0 to active travel or
public transport at t2 on change in BMI (analysis 1). Participants
who switched (‘the exposed’) were compared with those who
maintained use of the same mode of private motor transport at t0,
t1 and t2 (‘the unexposed’). Those participants in the exposed
group who had switched between t0 and t1 were also compared
with those in the unexposed group in order to study temporal
effects. Second, we examined the effect of switching from active
travel or public transport at t0 to private motor transport at t1 or
t2 on BMI (analysis 2). Participants who switched were compared
with those who maintained use of the same mode of active travel
or public transport at t0, t1 and t2. Participants who switched
between different modes of private motor transport (analysis 1) or
of active travel or public transport (analysis 2) were excluded from
the respective unexposed groups. χ2, Mann-Whitney and Student
t tests were used to compare the characteristics of the exposed and
unexposed groups.
Multivariable linear regression models were used to estimate the
association between change in usual mode of transport (binary or
Figure 2 Summary of the independent variables and sample restrictions used in the statistical models.
Martin A, et al. J Epidemiol Community Health 2015;0:1–9. doi:10.1136/jech-2014-205211
3
Research report
multinomial independent variable) and change in BMI with progressive adjustment for (1) individual characteristics (age, gender
and BMI at t0), (2) further characteristics at t0 (occupational
status, working hours, household income, education, children,
health status and car access) and (3) changes in home location,
income, health, car access and pregnancy status. Additional analyses were used to explore dose–response relationships using subsamples of participants with different baseline commute times (in
3 separate categories >10, >20 and >30 min), a reasonable proxy
for distance to work, since all participants in a given analysis used
the same usual mode of travel at t0. Statistical analyses were conducted using STATAV.13.1.
RESULTS
Characteristics of the sample
Table 1 shows basic descriptive statistics and comparisons of
groups used in the analyses at t0 and t2.
Analysis 1: Switching from private motor transport to active
travel or public transport
Of 3269 individuals included in this analysis, 179 were in the
exposed group. Of these, 109 switched to active travel (most
often walking, n=83) and 70 to public transport (most often
rail, n=32). Switchers were significantly younger on average
than non-switchers (eg, for active travel: 37.8 vs 41.2 years at
t0, table 1) and less likely to have access to a car (eg, for active
travel: 95.4% vs 98.8%). No statistically significant differences
were observed between groups in terms of mean BMI, although
those who switched to active travel were less likely to be classified as overweight or obese at baseline (52.3% vs 64.7%).
Those who switched to active travel, but not those who
switched to public transport, also had a significantly lower mean
adjusted household income (£28 087 vs £32 495); a higher likelihood of smoking (31.2% vs 22.8%); a shorter mean commute
time (16.5 vs 23.0 min at t0), which became shorter still after
taking up active travel (13.9 min at t2); and a higher likelihood
of weekly LTPA (68.8% vs 57.8% at t0) than non-switchers.
Those who switched to public transport were significantly more
likely to hold a degree or higher qualification (34.3% vs
19.4%). No statistically significant differences in household
composition or health status were observed between groups.
Attrition bias and missing values bias
Significant differences in the characteristics of individuals,
notably in terms of age, gender, income and baseline BMI were
identified when comparing participants in the original BHPS
sample with those retained in the analytical sample (see online
supplementary appendix).
Analysis 2: Switching from active travel or public transport
to private motor transport
Of 787 individuals included in this analysis, 268 were in the
exposed group. Of these, 156 switched from active travel (most
often walking, n=121) and 112 from public transport (most
often bus or coach, n=73). Again, switchers were significantly
younger on average than non-switchers (eg, for active travel:
35.1 vs 41.2 years at t0, table 1), but other differences in baseline working hours, income, education, children, health status,
mean BMI and obesity status were not significant. Car access
was more prevalent among those who switched from active
travel at t0 and t2 and also among those who switched from
public transport at t2. Those who switched from active travel
were significantly less likely than either non-switchers or those
who switched from public transport to hold a professional or
managerial occupation (eg, 24.4% for switchers from active
travel vs 34.5% for non-switchers) and more likely to undertake
weekly LTPA (74.4% vs 64.7%), and had a shorter mean
commute time (13.7 vs 27.4 min at t0) which increased after
switching to private motor transport (18.0 min at t2). In contrast, those who switched from public transport had a longer
mean commute time (42.4 min at t0) which was reduced after
switching to private motor transport (29.5 min at t2).
Effect on BMI
Switching from active travel or public transport to private
motor transport was associated with a significant increase in
BMI of 0.34 kg/m2 (0.05 to 0.64) after adjustment for all covariates (table 2, model L). When the effects of switching from
active travel and public transport were modelled separately, a
statistically significant adjusted effect size was associated with
switching from public transport (model M: 0.46 kg/m2, 0.06–
0.86). Statistically significant effects were not observed in the
models restricted to participants who switched between t0 and t1.
Effect on BMI
DISCUSSION
Principal findings
Switching from private motor transport to active travel or
public transport was associated with a significant reduction in
BMI of −0.32 kg/m2 (95% CI −0.60 to −0.05) after adjustment
for all covariates (table 2, model C). Smaller, statistically insignificant effect sizes were estimated in the two models that did
not control for time-varying potential confounding factors
(eg, model B: −0.21 kg/m2, 95% CI −0.47 to 0.06). When the
effects of switching to active travel and public transport were
modelled separately, larger and statistically significant adjusted
effect sizes were associated with switching to active travel
between t0 and t2 (model D: −0.45 kg/m2, −0.78 to −0.11)
and in the analysis restricted to participants who switched to
active travel between t0 and t1 (model F: −0.59 kg/m2, −1.11
to −0.06). Effect sizes associated with switching from private
motor transport to active travel also consistently became larger
as participants with shorter baseline journeys were excluded
from the analysis, rising to −0.75 kg/m2 among those switching
to active travel with journey times >10 min to −2.25 kg/m2 for
those >30 min (table 2, models G–I).
Our observation that switching from private motor transport to
active travel or public transport was associated with a reduction
in BMI, even in a relatively short-time period of under 2 years,
suggests that a shift in the proportion of commuters using more
active modes of travel could contribute to efforts to reduce
population mean BMI. While previous studies have demonstrated cross-sectional associations between BMI and mode of
travel to work, to the best of our knowledge this is the first
study using cohort data from a longitudinal study of nationally
representative households to link changes in BMI with changes
in the usual main mode of travel to work. Combined with other
potential health, economic and environmental benefits associated with walking, cycling and public transport,5 7 8 26–30
these findings add to the case for interventions to promote the
uptake of these more sustainable forms of transport.2 4 31
If large numbers of people could be enabled to take up active
travel to work, for example through environmental and policy
interventions in the transport and planning sectors, the benefits
for population health may be larger than those of alternative
4
Martin A, et al. J Epidemiol Community Health 2015;0:1–9. doi:10.1136/jech-2014-205211
Research report
Table 1
Descriptive statistics
Descriptive statistics and group comparisons for participants used in analysis 1
N (minimally adjusted models A and B)†
Unexposed
3090
Switched to active travel
109
Characteristic (at t0 unless shown otherwise)
Per cent or mean
Per cent or mean
41.2
61.7%
44.1%
85.5%
2.2%
32 495
45.2%
19.4%
17.1%
11.7%
37.8**
58.7%
41.3%
77.1%*
2.8%
28 087 **
33.9%*
13.8%
22.0%
10.1%
0.002
0.527
0.559
0.014
0.701
0.002
0.020
0.139
0.184
0.617
36.8**
57.1%
41.4%
78.6%
1.4%
35 141
47.1%
34.3%**
10.0%
18.6%
0.001
0.437
0.655
0.103
0.662
0.460
0.748
0.002
0.117
0.076
26.9
64.7%
3.6%
22.8%
10.4%
9.1%
26.1
52.3%**
4.6%
31.2%*
9.2%
8.3%
0.056
0.008
0.585
0.041
0.675
0.765
26.0
54.3%
7.1%
21.4%
11.4%
10.0%
0.140
0.071
0.118
0.784
0.785
0.794
98.8%
99.0%
1.8
1.8
91.9%
23.0
23.6
95.4%**
93.6%***
1.8
1.6**
70.5%***
16.5***
13.9***
0.003
<0.001
0.707
0.002
<0.001
0.001
0.001
57.8%
59.2%
25.8%
28.8%
16.8%
16.7%
68.8%*
78.9%***
17.4%
22.0%
14.7%
14.7%
0.022
0.001
0.050
0.122
0.555
0.578
Sociodemographic characteristics
Age (mean years)
Male§
Professional or managerial occupation§
Full time work§
Works at night time§
Household income (mean £)
High income§
Education: degree or higher qualification§
One or more children in the household§
Lives in London or South-East England§
Health related characteristics
BMI (mean kg/m2)
WHO-classified overweight§
‘Poor’ or ‘very poor’ self-assessed health§
Self-reported smoker§
More than 3 annual hospital visits§
More than 6 annual primary care visits§
Travel related
One or more cars in household§
One or more cars in household (t2)§
Number of cars in household (mean)
Number of cars in household (t2, mean)†
Private motor transport user in t0–t1 and t0–t2§†
Commute time (mean minutes)†
Commute time (t2, mean minutes)†
Other lifestyle-related characteristics
At least weekly LTPA§
At least weekly LTPA (t2)§
At least weekly gardening§
At least weekly gardening (t2)§
At least weekly eating out§
At least weekly eating out (t2)§
Switched to public transport
70
p Value‡
Per cent or mean
90.0%***
80.0%***
1.4***
1.2***
64.4%***
33.7***
45.8***
58.6%
68.6%
14.3%*
15.7%*
20.0%
17.1%
p Value‡
<0.001
<0.001
<0.001
<0.001
<0.001
<0.001
<0.001
0.901
0.113
0.029
0.016
0.484
0.922
Descriptive statistics and group comparisons for participants used in analysis 2
N (minimally adjusted models J and K)†
Unexposed
519
Switched from active travel
156
Switched from public transport
112
Characteristic (at t0 unless shown otherwise)
Per cent or mean
Per cent or mean
p Value‡
Per cent or mean
p Value‡
41.2
49.9%
34.5%
73.0%
1.7%
31 829
37.2%
20.4%
17.0%
20.2%
35.1***
54.5%
24.4%*
71.8%
0.6%
29 842
32.1%
13.5%
16.0%
14.1%
<0.001
0.315
0.018
0.762
0.322
0.131
0.241
0.051
0.785
0.086
33.9***
52.7%
38.4%
77.7%
0.9%
33 865
39.3%
19.6%
14.3%
22.3%
<0.001
0.594
0.433
0.309
0.518
0.421
0.677
0.852
0.490
0.620
26.1
54.7%
4.2%
26.6%
26.3
49.4%
4.5%
27.6%
Sociodemographic characteristics
Age (mean years)
Male§
Professional or managerial occupation§
Full time work§
Works at night time§
Household income (mean £s)
High income§
Education: degree or higher qualification§
One or more children in the household§
Lives in London or South-East England§
Health-related characteristics
BMI (mean kg/m2)
WHO-classified overweight§
‘Poor’ or ‘very poor’ self-assessed health§
Self-reported smoker§
Martin A, et al. J Epidemiol Community Health 2015;0:1–9. doi:10.1136/jech-2014-205211
0.634
0.239
0.893
0.810
25.7
49.1%
7.1%
27.7%
0.339
0.280
0.190
0.813
Continued
5
Research report
Table 1
Continued
Descriptive statistics and group comparisons for participants used in analysis 2
N (minimally adjusted models J and K)†
Unexposed
519
Switched from active travel
156
Switched from public transport
112
Characteristic (at t0 unless shown otherwise)
Per cent or mean
Per cent or mean
Per cent or mean
More than 3 annual hospital visits§
More than 6 annual primary care visits§
Travel related
One or more cars in household§
One or more cars in household (t2)†§
Number of cars in household (mean)
Number of cars in household (t2, mean)†
Private motor transport user in t0–1 and t0–2†§
Commute time (mean minutes)†
Commute time (t2, mean minutes)†
Other lifestyle-related characteristics
At least weekly LTPA§
At least weekly LTPA (t2)§
At least weekly gardening§
At least weekly gardening (t2) §
At least weekly eating out§
At least weekly eating out (t2)§
11.2%
10.4%
7.7%
10.3%
73.4%
74.9%
1.0
1.0
4.6%
27.4
28.2
81.4%*
92.3%***
1.2**
1.5***
22.0%***
13.7***
18.0**
64.7%
65.5%
20.2%
20.8%
17.1%
15.6%
74.4%*
65.4%
21.8%
21.2%
21.2%
17.9%
p Value‡
0.211
0.958
0.042
<0.001
0.001
<0.001
<0.001
<0.001
0.002
0.025
0.977
0.672
0.926
0.254
0.486
15.2%
6.3%
72.3%
91.0%***
1.0
1.4***
17.8%***
42.4***
29.5
56.3%
65.2%
17.0%
17.9%
17.9%
20.5%
p Value‡
0.235
0.177
0.813
<0.001
0.624
<0.001
<0.001
<0.001
0.115
0.091
0.947
0.430
0.481
0.857
0.202
*p<0.05, **p<0.01 and ***p<0.001.
†Values for some variables were not reported for all individuals included in the minimally adjusted models.
‡The results of χ2 test (or Mann-Whitney U test for number of cars, age, income and commute time, or student t test for BMI), where the null hypothesis was that the difference
between the exposed and unexposed group was equal to 0.
§Binary variables were created as described in the Methods section. Additionally, binary variables were created for the highest occupational status (professional/managerial=1)
compared with all other occupations (=0), the two highest income quintiles (=1) compared with all other income quintiles (=0), resident in London or South East England (=1)
compared with all other regions (=0), being classed as overweight or obese (=1) compared with any other weight status (=0), poor or very poor self-assessed health (=1) compared
with fair or good self-assessed health (=0), and for three indicators of leisure activities (=1 if undertaken at least once a week,=0 if undertaken less frequently).
BMI, body mass index; LTPA, leisure time physical activity. WHO, World Health Organization.
interventions targeted at producing larger individual health benefits for relatively small numbers of people.32
be indicative of the potential for interventions in the transport
and planning sectors to support strategies to reduce health
inequalities.5 36
Switching to active travel
We found significant negative associations between change in
BMI and switching from private motor transport in models that
accounted for the uptake of active travel and public transport
both together (model C) and separately (model D). The case for
causal inference is further strengthened by three key findings.
First, we found a statistically significant effect in the analysis
restricted to participants who switched to active travel between
t0 and t1 (model F) in which the exposure is more likely to
have temporally preceded the outcome. Second, we found stronger effect sizes when participants with shorter commutes were
excluded from the analysis (models G–I), which is indicative of
a dose–response relationship. Third, significant positive associations were observed in a separate sample of commuters who
switched in the opposite direction (Models J–L).33 The direction
and size of effects observed in this study are comparable to those of
recent cross-sectional analyses of UK commuters which showed
negative associations between BMI and walking (eg, −0.48 kg/m2,
95% CI −0.70 to −0.25)5 and cycling (−0.97 kg/m2, −1.30 to
−0.63)5 compared with private motor transport,5 6 and with those
reported in reviews of interventions to promote walking,34 including a review of 23 randomised controlled trials which reported an
average reduction in BMI of −0.53 kg/m2 (−0.72 to −0.35) associated with uptake of regular walking.35
The finding that participants who switched to active travel
were, on average, from lower income households, less likely to
be educated to degree-level or higher and more likely to work
part-time than other participants in the study (see table 1) could
6
Switching to public transport
The significant negative association observed between change in
BMI and switching from private motor transport to active travel
or public transport (model C), and the significant positive association with switching from public transport to private motor
transport (models J–M), supports the implications of existing
studies showing that public transport users can undertake meaningful levels of physical activity when accessing stations or
stops.5 18 19 37–39 The cross-sectional UK studies referred to
above also identified an association between BMI and public
transport use compared with private motor transport
(eg, −0.24 kg/m2).5 6 Nevertheless, we did not observe significant associations in our analyses of switching from private
motor transport which accounted for public transport separately
from active travel (models D and F). This may reflect important
differences between bus and rail travel—for example, that rail
passengers walk further on average to access stops than bus passengers5 18 19 37–39—which could not be adequately explored in
this study because of small sample sizes. Large differences were
also identified in the socioeconomic characteristics of participants who switched to rail travel compared with those who
switched to bus travel (eg, mean household income: £45 113 vs
£25 959). While rail travel in Great Britain has grown at a much
faster rate than road traffic or bus travel in recent years,40 future
studies could explore the size and distribution of benefits associated with these changes and their implications for strategies to
reduce health inequalities.
Martin A, et al. J Epidemiol Community Health 2015;0:1–9. doi:10.1136/jech-2014-205211
3269
3253
Martin A, et al. J Epidemiol Community Health 2015;0:1–9. doi:10.1136/jech-2014-205211
N/a
787
785
Values tabulated are β-coefficients and 95% CIs.
*p<0.05, **p<0.01 and ***p<0.001.
†See figure 2 for details of the variables and samples used in each statistical model.
n/a, Not applicable.
Observations
0.26 (−0.09 to 0.62)
0.34* (0.05 to 0.64)
Switch to private motor from
active travel
0.33* (0.04 to 0.62)
0.46* (0.06 to 0.86)
0.34** (0.06 to 0.62)
Model M
658
0.37 (0.00 to 0.75)
0.33 (−0.13 to 0.79)
0.44 (−0.10 to 0.98)
N/a
Model O
Model N
Model L
Model J
Model K
All participants
Maximally adjusted models
3144
As models L and M, except restricting the
exposed group to participants who switched
between t0 and t1
Minimally adjusted models
Switch to private motor from
public transport
Switch to private motor from
public transport or active travel
Model characteristics†
Analysis 2: Impact of switching to private motor transport from active travel or public transport
Observations
−0.59*
(−1.11 to −0.06)
−0.45**
(−0.78 to −0.11)
Switch from private motor to active travel
N/a
Model F
0.12
(−0.57 to 0.80)
N/a
−0.12
(−0.55 to 0.30)
−0.32*
(−0.60 to −0.05)
−0.33
(−0.76 to 0.09)
Model E
−0.18
(−0.45 to 0.0)
Model D
−0.21
(−0.47 to 0.06)
Model A
Model C
Model B
All participants
Maximally adjusted models
As models C and D, except restricting the
exposed group to participants who
switched between t0 and t1
Minimally adjusted models
Switch from private motor to public transport
Switch from private motor to public transport
or active travel
Model characteristicsa
Analysis 1: Impact of switching from private motor transport to active travel or public transport
Table 2 Associations between change in mode of travel to work and change in body mass index
1289
−1.64***
(−2.35 to −0.94)
−0.23
(−0.75 to 0.29)
>30 min
752
−2.25***
(−3.33 to −1.18)
−0.42
(−1.05 to 0.22)
N/a
Model I
342
0.52 (−0.19 to 1.22)
0.39 (−0.14 to −0.93)
500
0.61* (0.13 to 1.1)
0.51* (0.06 to 0.96)
N/a
Model Q
Model P
N/a
>20 min
>10 min
239
0.52 (−0.53 to 1.58)
0.35 (−2.22 to 0.93)
N/a
Model R
>30 min
As model M, except restricting analysis to participants with
longer commuting times at t0
2244
−0.75**
(−1.23 to −0.28)
−0.20
(−0.67 to 0.27)
N/a
Model G
N/a
>20 min
Model H
>10 min
As model D, except restricting analysis to participants with longer
commuting times at t0
Research report
7
Research report
Strengths and limitations
Acknowledgements Data from the BHPS were supplied by the UK Data Archive.
In contrast to existing cross-sectional studies, the main strength
of this study lies in its use of cohort data from a longitudinal
study of nationally representative households to examine associations between changes in mode of travel to work and changes
in BMI over time. This study design was also able to account
for a number of potential time-varying confounding variables
(such as substantial changes in health and income).
Nevertheless, because the BMI outcome variable was not
reported at t1 we cannot be sure that the changes in mode of
travel preceded the changes in BMI. A further limitation is that
BMI was based on self-reported measures, which are typically
biased when compared with direct measurements.41 However,
our reliance on within-individual changes over a 2-year period
was probably subjected to a lower risk of bias than might be the
case for between-individual comparisons. Since the main exposure of interest was the usual main mode of travel to work, the
analysis could not take full account of multimodal trips such as
park-and-ride, or other trips undertaken during leisure or work
time. Missing data, attrition (see online supplementary appendix
and figure 1) and the differences in some observed characteristics between exposed and unexposed groups (see table 1)
appears to have introduced some bias; some potential timevarying confounding variables, including other physical activity
and dietary behaviours, were unobserved; and the relatively
short follow-up time precluded the examination of longer term
health effects. While small sample sizes and limited
within-individual variation prevented the use of more advanced
analytical approaches such as fixed effects models or instrumental variables, these could contribute to mitigating the impact of
various sources of bias and might therefore be considered in
future research.25
Contributors This study design was originated by AM, JP, MS and DO. AM
undertook the literature review, conducted the data analysis and drafted the
manuscript. JP, MS and DO contributed to interpreting the results and drafting of
the manuscript. All authors approved the final version of the manuscript.
Funding The work was undertaken by the Centre for Diet and Activity Research
(CEDAR), a UKCRC Public Health Research Centre of Excellence. Funding from the
British Heart Foundation, Cancer Research UK, Economic and Social Research
Council, Medical Research Council (MRC), the National Institute for Health Research
(NIHR), and the Wellcome Trust, under the auspices of the UK Clinical Research
Collaboration, is gratefully acknowledged. JP is also funded by an NIHR
Post-Doctoral Fellowship (PDF 2012-05-157), and David Ogilvie is supported by the
MRC (Unit programme number MC_UU_12015/6).
Competing interests None.
Ethics approval The British Household Panel Survey has adopted, in full, the
ethical guidelines of the Social Research Association.
Provenance and peer review Not commissioned; externally peer-reviewed.
Data sharing statement All data from the British Household Panel Survey are
published and accessible to researchers through the UK Data Archive.
Open Access This is an Open Access article distributed in accordance with the
terms of the Creative Commons Attribution (CC BY 4.0) license, which permits
others to distribute, remix, adapt and build upon this work, for commercial use,
provided the original work is properly cited. See: http://creativecommons.org/
licenses/by/4.0/
REFERENCES
1
2
3
4
5
CONCLUSION
This study has extended existing literature on the health benefits
of active travel by providing longitudinal evidence from a
national survey of a relationship between switching to and from
more active modes of travel to work and modest changes in BMI.
6
7
8
What is already known on this subject
9
Previous cross-sectional studies have shown that commuters
who used active travel or public transport had significantly
lower body mass index (BMI) than their counterparts who used
private motor transport. However, no longitudinal study has
used cohort data from a nationally representative survey to
explore the impact on individual-level BMI of switching between
different modes of travel.
10
11
12
13
What this study adds
14
15
This study used cohort data from the British Household Panel
Survey and identified a statistically significant net reduction in
body mass index over a 2-year period among commuters who
switched from private motor transport to active travel or public
transport. The results provide more robust support for causal
inference than existing cross-sectional studies and strengthen
the case for policymakers to promote population health by
incentivising walking or cycling.
8
16
17
18
19
World Health Organisation. Global recommendations on physical activity for health.
Geneva, 2010.
Ogilvie D, Foster CE, Rothnie H, et al. Interventions to promote walking: systematic
review. BMJ 2007;334:1204.
House of Commons Health Committee. Third report of session 2003–04: obesity.
London: The Stationary Office Limited, 2004.
Martin A, Suhrcke M, Ogilvie D. Financial incentives to promote active travel: an
evidence review and economic framework. Am J Prev Med 2012;43:e45–57.
Laverty AA, Mindell JS, Webb EA, et al. Active travel to work and cardiovascular
risk factors in the United Kingdom. Am J Prev Med 2013;45:282–8.
Flint E, Cummins S, Sacker A. Associations between active commuting, body fat,
and body mass index: population based, cross sectional study in the United
Kingdom. BMJ 2014;349:g4887.
Millett C, Agrawal S, Sullivan R, et al. Associations between active travel to work
and overweight, hypertension, and diabetes in India: a cross-sectional study. PLoS
Med 2013;10:e1001459.
Wanner M, Götschi T, Martin-Diener E, et al. Active transport, physical
activity, and body weight in adults: a systematic review. Am J Prev Med
2012;42:493–502.
Wagner A, Simon C, Ducimetiere P, et al. Leisure-time physical activity and regular
walking or cycling to work are associated with adiposity and 5 y weight gain in
middle-aged men: the PRIME Study. Int J Obes Relat Metab Disord
2001;25:940–8.
Sahlqvist S, Goodman A, Cooper AR, et al. Change in active travel and changes in
recreational and total physical activity in adults: longitudinal findings from the
iConnect study. Int J Behav Nutr Phys Act 2013;10:28.
Petersen L, Schnohr P, Sørensen T. Longitudinal study of the long-term relation
between physical activity and obesity in adults. Int J Obes 2003;28:105–12.
Levine JA, McCrady SK, Lanningham-Foster LM, et al. The role of free-living daily
walking in human weight gain and obesity. Diabetes 2008;57:548–54.
Bassett DR Jr, Pucher J, Buehler R, et al. Walking, cycling, and obesity rates in
Europe, North America, and Australia. J Phys Act Health 2008;5:795–814.
Jacobson SH, King DM, Yuan R. A note on the relationship between obesity and
driving. Transport Policy 2011;18:772–6.
Behzad B, King DM, Jacobson SH. Quantifying the association between obesity,
automobile travel, and caloric intake. Prev Med 2013;56:103–6.
Frank LD, Andresen MA, Schmid TL. Obesity relationships with community design,
physical activity, and time spent in cars. Am J Prev Med 2004;27:87–96.
Cavoli C, Christie N, Mindell J, et al. Linking transport, health and sustainability:
better data sets for better policy-making. J Transp Health 2014.
Rissel C, Curac N, Greenaway M, et al. Physical activity associated with public
transport use—a review and modelling of potential benefits. Int J Environ Res
Public Health 2012;9:2454–78.
Morabia A, Mirer FE, Amstislavski TM, et al. Potential health impact of switching
from car to public transportation when commuting to work. Am J Public Health
2010;100:2388–91.
Martin A, et al. J Epidemiol Community Health 2015;0:1–9. doi:10.1136/jech-2014-205211
Research report
20
21
22
23
24
25
26
27
28
29
30
Taylor M, Brice J, Buck N, et al. British Household Panel Survey-User Manual—
Volume A: introduction, technical report and appendices. Institute for Social and
Economic Research, University of Essex, Colchester 2001.
Courtemanche C. Longer hours and larger waistlines? The relationship between
work hours and obesity. Forum Health Econ Policy 2009;12.
Antunes L, Levandovski R, Dantas G, et al. Obesity and shift work: chronobiological
aspects. Nutr Res Rev 2010;23:155–68.
Clark B, Chatterjee K, Melia S, et al. Life events and travel behaviour: exploring the
inter-relationship using the UK Household Longitudinal Study. Transport Res Rec
2014;2413:54–64.
Hirsch JA, Diez Roux AV, Moore KA, et al. Change in walking and body mass index
following residential relocation: the multi-ethnic study of atherosclerosis. Am J
Public Health 2014;104:e49–56.
Martin A, Ogilvie D, Suhrcke M. Evaluating causal relationships between urban built
environment characteristics and obesity: a methodological review of observational
studies. Int J Behav Nutr Phys Act 2014;11:142.
Martin A, Goryakin Y, Suhrcke M. Does active commuting improve psychological
wellbeing? Longitudinal evidence from eighteen waves of the British Household
Panel Survey. Prev Med 2014;69:296–303.
Hamer M, Chida Y. Active commuting and cardiovascular risk: a meta-analytic
review. Prev Med 2008;46:9–13.
Saunders LE, Green JM, Petticrew MP, et al. What are the health benefits of active
travel? A systematic review of trials and cohort studies. PLoS ONE 2013;8:e69912.
Pratt M, Sarmiento OL, Montes F, et al. The implications of megatrends in
information and communication technology and transportation for changes in global
physical activity. Lancet 2012;380:282–93.
Woodcock J, Banister D, Edwards P, et al. Energy and transport. Lancet
2007;370:1078–88.
31
32
33
34
35
36
37
38
39
40
41
Martin A, et al. J Epidemiol Community Health 2015;0:1–9. doi:10.1136/jech-2014-205211
Ogilvie D, Egan M, Hamilton V, et al. Promoting walking and cycling as an
alternative to using cars: systematic review. BMJ 2004;329:763.
Hill JO. Can a small-changes approach help address the obesity epidemic? A report
of the Joint Task Force of the American Society for Nutrition, Institute of Food
Technologists, and International Food Information Council. Am J Clin Nutr
2009;89:477–84.
Hill A. The environment and disease: association or causation? Proc R Soc Med
1965;58:295–300.
Hanson S, Jones A. Is there evidence that walking groups have health benefits?
A systematic review and meta-analysis. Br J Sports Med 2015.
Murtagh EM, Nichols L, Mohammed MA, et al. The effect of walking on
risk factors for cardiovascular disease: an updated systematic review and
meta-analysis of randomised control trials. Prev Med 2015;72:
34–43.
Hutchinson J, White PC, Graham H. Differences in the social patterning of active
travel between urban and rural populations: findings from a large UK household
survey. Int J Public Health 2014;59:993–8.
Besser LM, Dannenberg AL. Walking to public transit: steps to help meet physical
activity recommendations. Am J Prev Med 2005;29:273–80.
Edwards RD. Public transit, obesity, and medical costs: assessing the magnitudes.
Prev Med 2008;46:14–21.
MacDonald JM, Stokes RJ, Cohen DA, et al. The effect of light rail transit on body
mass index and physical activity. Am J Prev Med 2010;39:105–12.
Le Vine S, Jones P. On the move: making sense of car and train travel trends in
Britain. London: RAC Foundation, 2012.
Gorber SC, Tremblay M, Moher D, et al. A comparison of direct vs. self-report
measures for assessing height, weight and body mass index: a systematic review.
Obes Rev 2007;8:307–26.
9


© Copyright 2026