
Large Cap Equity Fund
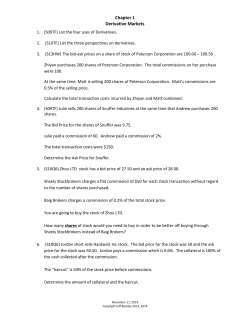
1st Quarter 2015
RAINIER INVESTMENT MANAGEMENT, LLC
RAINIER FUNDS
Large Cap Equity Fund
RIMEX - Original Shares
RAIEX - Institutional Shares
ASSETS UNDER MANAGEMENT
OBJECTIVES AND PHILOSOPHY
The Large Cap Equity Fund seeks to maximize long-term capital appreciation. In
pursuing its goal, the Fund invests in a diversified Fund of common stock of largecapitalization companies traded in the U.S. Highly speculative or illiquid stocks are not
candidates for the Fund. Risk control is an important element in the construction of the
Fund. To control risk, extreme overweighting or underweighting of the Fund relative to
the S&P 500® Index is normally avoided. To thoroughly diversify, the Fund consists of
50 to 100 different stocks, each making up a relatively small portion of the Fund.
The Adviser employs a Growth at a Reasonable Price (GARP) investment philosophy in
the management of the Fund. The GARP approach provides an opportunity to invest in
companies with superior earnings growth selling at attractive valuations.
Firm
$5.6 billion
Strategy Assets
$1.1 billion
Fund Assets
$351.3 million
FUND INFORMATION
Cash and Equivalents
3.4%
Market Capitalization (Wtd. Avg.)
$113.9 B
Total Number of Stocks
56
Ten Largest Holdings:
Apple Inc.
4.3%
Citigroup Inc.
3.2
Rainier Investment Management, LLC (“Rainier”) is headquartered in Seattle,
Washington, and is registered as an advisor under the Investment Advisers Act of 1940.
The firm manages $5.6 billion of client assets and also serves as investment adviser for
the Rainier Funds. Rainier’s performance has made it the choice of a growing national
and international clientele of corporate, public and Taft-Hartley retirement plans, as well
as financial institutions, foundations, charitable endowments and mutual fund investors.
Actavis Plc
3.0
Google Inc.
3.0
Walt Disney Co.
2.9
Visa Inc.
2.8
Microsoft Corp.
2.7
Sherwin-Williams Co.
2.6
TOTAL RETURN
Home Depot, Inc.
2.3
EOG Resources, Inc.
2.3
ABOUT THE ADVISER
As of 3/31/2015
Rainier Large
Cap Equity Orig.
Rainier Large
Cap Equity Instit. +
S&P 500®
Index
Russell 1000
Growth®
Index
SECTOR WEIGHTINGS
Rainier
S&P
500®
Information Technology
23.4%
19.7%
Quarter
3.16%
3.23%
0.95%
3.84%
YTD
3.16
3.23
0.95
3.84
Health Care
15.6
14.9
1 Year
14.12
14.45
12.73
16.09
Consumer Discretionary
18.2
12.6
Consumer Staples
9.9
9.7
Energy
5.8
8.0
Materials
2.7
3.2
Industrials
9.1
10.4
Financials
15.3
16.2
Telecommunication Services
0.0
2.3
Utilities
0.0
3.0
3 Years*
13.90
14.22
16.11
16.34
5 Years*
12.37
12.68
14.46
15.63
10 Years*
7.17
7.45
8.01
9.35
Since Inception (5/10/1994)*
9.74
10.02
9.70
9.22
The Gross and Net Expense Ratios for Institutional Shares are 0.90% and 0.83%,
respectively, and Original Shares are 1.19% and 1.12%, respectively, which are the
amounts stated in the current prospectus as of the date of this report. Investment
performance reflects fee reductions. In the absence of such reductions, total return
would be reduced. The Investment Adviser has contractually agreed to waive/
reimburse expenses through 7/31/15.
GROWTH/VALUATIONS
EPS Growth Rate
P/E Ratio
* Average annualized returns.
+ Institutional Shares commenced operations on 5/2/02. Performance for periods prior
to 5/2/02 is based on the performance of the Original Shares adjusted for the 12b-1 fee
of the Original Shares.
Performance data quoted represent past performance, which does not guarantee future
results. The investment return and principal value of an investment will fluctuate so that
an investor’s shares, when redeemed, may be worth more or less than their original cost.
Current performance to the most recent month-end may be lower or higher than what
is shown and may be obtained at 800-280-6111. The table does not
reflect the deduction of taxes that a shareholder would pay on Fund
distributions or redemption of Fund shares.
Diversification does not assure a profit or protect against loss in a
declining market.
20.5 x
17.3 x
14.8 %
6.3 %
Rainier
S&P 500®
EPS growth is not a measure of the Fund’s future performance. Based on one-year forward earnings estimates.
RAINIER INVESTMENT MANAGEMENT, LLC
1st Quarter 2015
COMMENTARY
RAINIER FUNDS
MARKET CAPITALIZATION %
U.S. equities continued to ascend in the first quarter. Growth stocks decisively
outperformed value shares, and large-capitalization stocks meaningfully lagged mid- and
small-cap shares. Both of these trends were tailwinds for investment results.
60
50
In consumer staples, we added CVS Health, one of the two dominant drug store chains.
In recent years CVS has expanded its prescription benefit management business and
improved its retail operations. In financials, we initiated a position in American Tower,
a leading provider of communications services and an essential participant in the ever
expanding data usage by wireless communications devices. In industrials, we shifted
the exposure in the railroad industry through the sale of Kansas City Southern. We also
sold diesel engine manufacturer Cummins.
10
At the beginning of the year we noted that our outlook for U.S. stock returns was lower
than for 2013 and 2014. While double-digit returns are certainly possible, uncertainty
regarding Federal Reserve policy on interest rates, erosion in earnings for the energy
sector and lower returns from overseas businesses due to the strength of the U.S. dollar
combine to restrain our outlook. Moreover, the implementation of quantitative easing
in Europe and ongoing bond purchases by the Bank of Japan may attract incremental
equity investment to those markets.
Despite somewhat reduced return expectations we are still identifying attractive
investment opportunities with what we believe to be significant long-term price
appreciation potential.
FIRM NEWS AND INFORMATION
For more extensive commentary, insights and videos on our strategies, we invite you to
visit our website www.rainierfunds.com.
Mutual fund investing involves risk. Principal loss is possible. Growth stocks typically are
more volatile than value stocks; however, value stocks have a lower expected growth rate
in earnings and sales. Investment in IPO’s can be volatile and can fluctuate considerably.
IPO’s can have a magnified impact on funds with a small asset base. Investments in foreign
securities involve greater volatility and political, economic and currency risks and differences in
accounting methods.
The S&P 500® Index is an unmanaged index composed of 500 industrial, utility, transportation
and financial companies of the U.S. markets. The Russell 1000® Growth Index measures the
performance of the large-cap growth segment of the U.S. equity universe. It includes those Russell
1000 companies with higher price-to-book ratios and higher forecasted growth values. The Russell
1000® Index measures the performance of the large-cap segment of the U.S. equity universe. It is a
subset of the Russell 3000® Index and includes approximately 1000 of the largest securities based on
a combination of their market cap and current index membership. Index vendor sources may vary,
resulting in slight variations in the index returns that are displayed in performance reporting for the
Rainier Funds. The Indices are not available for investment and do not incur charges or expenses.
46.0
41.5
In the first quarter, the S&P 500® Index returned just under 0.95%. The Large Cap Fund
returned 3.23%, outperforming the Index by over 2.28%. On a sector basis the strongest
results came from consumer staples and health care shares, while financial and industrial
shares were modest detractors.
40
36.1
32.9
30
19.9
20
18.2
2.5
2.8
0.0
0
Large
93.08 B+
Med/Large
25.49 - 93.08 B
Rainier
Medium
8.79 - 25.49 B
Med/Small
3.38 - 8.79 B
0.0
Small
< 3.38 B
S&P 500® Index
Market Capitalization (Wtd. Avg.)
$113.9 B
1 Year Estimated EPS Growth Rate
14.8%
GENERAL INFORMATION
Original
Institutional
$25.43
$25.87
None
None
Dividend
Annual
Annual
Assets (in Millions)
$125.8
$225.5
NASDAQ symbol
RIMEX
RAIEX
Initial Minimum Direct Inv.
$2,500
$100,000
NAV (as of 3/31/2015)
Sales Load
PORTFOLIO MANAGERS
Mark H. Dawson, CFA
Michael Emery, CFA
FOR FURTHER INFORMATION, CONTACT:
Adviser Services:
Ron Alvares
Mark Wolff
Jim Collins
206.518.6742
206.518.6698
206-518-6714
Phone: 1.800.280.6111
E-mail: [email protected]
Fund Holdings and sector weightings are subject to change at any time due to ongoing portfolio
management. References to specific investments should not be construed as a recommendation
of the fund or the Adviser to buy or sell securities and these investments do not represent all, and
may represent a small percentage of, the Fund’s holdings. There is no assurance that the securities
purchased remain strategy investments or that securities sold have not been repurchased. Current
and Future fund holdings are subject to risk.
Although the Fund is no-load, management and distribution fees do apply.
Market capitalization is the total dollar market value of all company’s outstanding shares.
The Price to Earnings (P/E) Ratio reflects the multiple of earnings at which a stock sells. Earnings
per share (EPS) is total earnings divided by the number of shares outstanding. Growth at a
Reasonable Price (GARP) is an equity investment strategy that seeks to combine tenets of both
growth investing and value investing to find individual stocks. Earnings growth is the annual rate
of growth of earnings from investments. Beta is a measure of the volatility, or systematic risk, of a
security or a portfolio in comparison to the market as a whole.
Must be preceded or accompanied by the Large Cap Equity Fund prospectus.
Quasar Distributors, LLC., Distributor
WWW.RAINIERFUNDS.COM


© Copyright 2026