
UTI Rainbow Funds
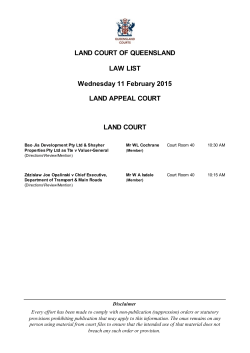
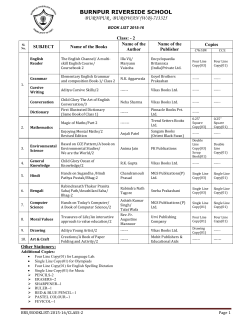
29th May 2015
UTI Rainbow Funds
For private circulation only
Not for sale
Contact Us
UTI International Ltd.
UTI International Ltd., Kingsway House, Havilland Street,
St. Peter Port, Guernsey, Channel Islands, GY12QE
T: +44 1481 726141
F: +44 1481 726142
[email protected]
www.utifunds.com
Country Offices
London
Europe
Dubai
UTI International Ltd.
Mr. Gaurav Maleri
Vice President - Institutional Sales, Distribution and Strategic Alliances
Email: [email protected]
UTI International Ltd., 32 City Road, London, EC1Y 2BD,
United Kingdom
T: + 44 203 370 0158
F: + 44 207 374 4720
www.utifunds.com
UTI International
Mr. Sameer Bhatia
Regional Head (Middle East)
Email: [email protected]
UTI International, Office No 4, Level 4, Al Attar Business Towers,
Near DIFC, Po Box 29288, Sheikh Zayed Road, Dubai (UAE)
T: + 971 4 3857707
F: + 971 4 3857702
www.utifunds.com
Investment Manager
UTI Asset Management
Company (Mauritius) Ltd.
UTI Investment Management Company (Mauritius) Limited
2
UTI Investment Management Company (Mauritius) Limited,
Suite 450, 4th Floor, Barkly Wharf East, Le Caudan Waterfront,
Port Louis
UTI Rainbow Fund Class G (Opportunities Fund)
Fund Details
The investment objective of the G Fund is to provide investors with opportunities for long-term capital
growth through active management of investments primarily in equity stocks of companies or institutions
engaged in the promising sectors of the economy in a concentrated way (Sector Rotation Strategy) in India.
The G Fund will seek to achieve this objective principally by investing in units of UTI Opportunities Fund.
Portfolio as on 29th May 2015
Name of the Company
% of NAV
HDFC Bank Ltd.
7.21
Infosys Ltd.
6.14
Bharti Airtel Ltd.
2.33
Titan Company Ltd.
2.02
Crisil Ltd
2.01
Adani Ports And Special Economic Zone Ltd
1.94
1.84
Launch Date
7th December, 2009
Investment Manager:
UTI Investment Management Company
(Mauritius) Ltd
Investment Manager (Onshore Scheme):
UTI Asset Management Company Ltd
NAV per unit (US$) as on 29th May 2015
Class G
13.066
ICICI Bank Ltd
5.92
Bharat Forge Ltd.
Axis Bank Ltd.
5.36
Oil & Natural Gas Corporation Ltd.
1.81
Maruti Suzuki India Ltd.
5.04
Punjab National Bank
1.59
Larsen & Toubro Ltd.
3.93
Apollo Tyres Ltd.
1.56
Tata Consultancy Services Ltd.
3.85
Tech Mahindra Ltd
1.48
Reliance Industries Ltd.
3.33
Sun Pharmaceuticals Industries Ltd.
3.04
Vedanta Ltd
1.45
Tata Motors Ltd.
3.03
Nestle India Ltd.
1.40
State Bank Of India
3.01
Cipla Ltd.
1.38
Ultratech Cement Ltd.
2.82
IRB Infrastructure Developers Ltd.
1.29
Load Structure
Others
9.69
Entry Load
Up to 5%
2.32
Exit Load
Nil
Shree Cement Ltd.
2.78
MRF Ltd.
2.78
Net Current Assets
Lupin Ltd.
2.76
TOTAL
ITC Ltd.
2.47
Hero Motocorp Ltd.
2.42
100.00
Fund Performance as on 29th May 2015 (US$ & %)*
Absolute Returns
Annualized returns
Current month
3 months
6 months
1 year
3 years
5 years
G share ($)
13.066
-6.84%
-3.09%
12.53%
14.36%
6.01%
BSE 100 ($)
134.101
-6.98%
-3.86%
7.78%
15.25%
3.50%
63.76
-3.09%
-2.80%
-7.42%
-3.99%
-6.14%
Exchange Rate
(Rs/US$)
NAV High/Low (US$) in the Month
High
13.129
Low
12.436
Minimum Investment Amount
USD
5,000/-
Administrator
Deutsche International Trust Corporation
(Mauritius) Ltd.,
4th Floor, Barkly Wharf East,
Le Caudan Waterfront,
Port Louis, Mauritius.
ISIN No.
MU0233S00165
* The performance returns are calculated using the last day of the month for the respective time periods
Performance of UTI Rainbow Fund - Class G Shares ($)
vis-à-vis the benchmark BSE 100 Index ($)
UTI Rainbow Fund Class G (Opportunities Fund) NAV $ vs BSE 100 Index $
150
140
130
120
110
100
90
80
70
60
BSE 100 Index ($)
Class G NAV ($)
“Past performance is not indicative of future returns” “Please refer to important disclaimers on last page”
6
Asset Allocation as on 29th May 2015
May 2015
Fund Manager’s Report
World’s markets and Economy
The U.S. economy shrunk in the first three months of 2015. U.S. gross domestic
product, contracted at a seasonally adjusted annual rate of 0.7 percent in the
first quarter. However, economists believe that the first-quarter numbers are
distorted by the unwinding of a backlog of exports and imports at West Coast
ports. Harsh winter weather and a strong U.S. dollar also contributed to the
slowdown in growth in the first quarter. The GDP advance estimates reported
last month had put the growth at 0.2%, much of this revision was spurred by
new data showing that exports fell more than first thought and imports rose
higher.
In the Euro Area, financial conditions have eased due to the European Central
Bank’s (ECB) quantitative easing and a depreciating Euro. There has been
some moderation in composite PMI, economic sentiment and consumer
confidence. Over all, the gross domestic product of the 19 nations that form
the euro currency bloc grew 0.4 percent in the period from January to March
from the previous three months, when it grew 0.3 percent. Economists credit
the happy combination of a weak euro, low oil prices and the European Central
Bank’s effort to drive down interest rates with aggressive monetary policy for
keeping the expansion alive. The German economy grew 0.3 percent at a
quarterly pace, slowing from a 0.7 percent rate in the last three months of last
year and slightly disappointing market expectations of a 0.5 percent increase.
The biggest surprise came from France, where first-quarter growth of 0.6
percent was the strongest in nearly two years and well ahead of expectations
of 0.4 percent after stagnating in the final quarter of 2014.
Commodities and Inflation
NYMEX Crude Oil prices remained flattish with a growth of 1.1% over the
month after having risen sharply by 25% in the previous month; prices are
however down 41% yoy. OPEC has scheduled its next meeting in the first
week of June, decision by OPEC with regards to oil output would be critical to
the future of oil prices. LMEX closed at 2736 – down 7% over the month. Gold
prices closed at USD 1189/oz down 1.2% over the month. The USD Index
strengthened vs. other currencies with USD appreciating 2.4% over the month;
it is now up 21% over the year.
On the domestic front, April CPI inflation fell to 4.87% yoy (vs. an upwardly
revised 5.25% in March), lower than consensus expectations of 4.93% and
despite a month-on-month pick-up in food inflation. ‘Core’ inflation rose
to 4.32%yoy from 4.2% in March, and fuel inflation edged higher by 45bps
(second big jump in a row) to 5.6%yoy. India’s Inflation is has come down
significantly over the past few months partly driven by lower commodity prices
and by sluggishness in the economy. The latest data from RBI projects the midpoint of CPI (est) to fall further in next few months and rise thereafter to reach
6.4-6.5% range by the Mar’16. This decline in inflation is further corroborated
by latest GDP data which indicates that the GDP deflator for Q4FY15 was
0.2% vs. 8.4% in Dec’13.
Banking Sector
As per the latest data released by RBI, the Overall deposits grew 11.3 % yoy.
The non-Food credit growth for last 12 months has been 10% (last year 13.8%),
the Investments growth has been 13.7% (last year 12.4%). The credit-deposit
ratio for banks was 75.9% and investment-deposit ratio was 29.9%. The credit
growth continues to be sluggish due to underutilized existing capacity in the
system and also competition from money/bond market. We expect the bank
credit to pick up with revival in GDP.
Debt Markets, Balance of Payments & Real Economy
The Gsec market was range bound as the previous (off the run) 10 year
benchmark Gsec fell from 7.86% to 7.82% during the month. This month
saw the issuance of a new 10 year Gsec which shall be the benchmark going
forward (on the run) which last traded at 7.64%. The three month CD rates
were lower at 7.96% vs. 8.25% last month.
IIP growth corrected to 2.1% yoy in March’2015 from 4.9% in Feb, lower
than consensus expectations of 2.8%. Analysis reveals that the underlying
momentum remained strong with growth reaching ~11% on 3M/3M, SAAR
basis. Sector-wise, manufacturing, electricity and mining reported 2.2%, 2.0%
and 0.9% respectively. On use-based basis, capital goods remained strong
at 7.6%, even though it slowed from 8.5% in February. Consumer durables
continued to remain in negative territory, printing (-)4.7%. Consumer nondurables decelerated to 1.9%. For FY2015, IIP averaged 2.8% as against
(-)0.1% in FY2014.
The Forex reserves position for the month rose to USD 352 Bn vs. USD 345 Bn
in the previous month. The Rupee closed 0.3% weaker over the month closing
at 63.8 Rs/USD vs. 63.6 Rs/USD last month.
GDP Growth
India’s Q4 FY 14-15 GDP (January-March) grew 7.5% y/y (consensus: 7.0%),
as per the new FY 11-12 base. This was up from a downwardly revised 6.6%
y/y growth in Q3FY15, and brings annual growth of 7.3% for FY15. This is only
marginally below the advance estimate of 7.4% released earlier in February.
Latest data shows that growth was largely driven by services, especially
onshore trade & transportation and financial services. Manufacturing growth
improved, in line with industrial production figures. Construction growth also
improved, in line with greater public sector spending on roads & highways.
Private consumption and gross fixed capital formation grew at healthier
rates than before, even as government consumption plunged as authorities
scrambled to meet the fiscal deficit target. A larger fall in imports than in exports
contributed substantially to growth. On the expenditure side, investment
demand continues to inch up, rising 4.1% y/y. Market expects public investment
to improve in FY 15-16, as the government’s underlying fiscal position improves,
while the fiscal deficit is kept in check. Private consumption improved as well,
rising 7.9% y/y in Q4 FY14-15. Looking ahead, with government spending
normalizing and the subsidy bill falling, GDP growth is expected to improve.
Various market indicators indicate that Indian economy is gradually improving
as most macro indicators are showing positive trends. While private capex is
yet to pick up, public capex may be needed to drive growth initially. Inflationary
trends too are positive and are supportive of favorable monetary outcomes.
Equity Markets
Sensex started the month at 27,011 and closed at 27,828 up 3% over the
month. Nifty started at 8,182 and closed at 8,434 up 3.1%. As per latest data,
FIIs were net sellers in Equity with outflow of USD 300 Mn vs. inflow of USD
1.4 Bn seen last month. FIIs sold USD 876 Mn from Indian debt vs. an inflow of
USD 608 Mn last month. Domestic Mutual Funds were net buyers in equities
with net purchase of USD 655 Mn in the month.
Sector wise performance
The sectors that outperformed during the month were Information Technology
and Healthcare. Both sectors had seen some correction during the previous
month and had underperformed the market. This month saw an outperformance
by stocks within both the sectors as buying interest revived at lower prices. In
addition, as exports revenues play a significant role in the business model of
companies within IT and Healthcare sectors, INR depreciation is also beneficial
and should give some respite from the cross currency impact witnessed by
earlier. We are confident about the long term growth potential of companies
within both Information Technology and Healthcare sectors and maintain a
positive outlook.
The key underperforming sectors were Metals and Industrials. Companies
within the metals sector continue to suffer from subdued global demand as a
result of which, there is pressure on prices of most global commodities. As a
result, both volumes and realizations are suppressed leading to pressure on
the stocks of metal companies. We are of the opinion that global commodities
will continue to be under pressure going forward as well. As such, we have
a negative outlook on the sector. Stocks within the Industrial sector have
seen sharp run up in the market rally over the last one year leading to higher
valuations. This has resulted in some profit booking. While there are initial
signs of economic recovery, it will take some time before large scale capital
investments materialize leading to growth for the sector. We remain cautious
and will look to selectively invest in companies with healthy balance sheets and
strong execution track record.
Market Outlook
During the month of April, concerns over applicability of MAT on capital gains
made by foreign investors had led to a fall in the market. The government has
tried to pacify these concerns to some extent and the market has bounced
back during May. While some concerns still remain, the focus has shifted back
on revival in growth and the long term growth potential of the economy. The
government continues to focus on bringing in key reforms, although creating a
consensus on these measures may take slightly longer time. Improvement in
rate of GDP growth as well as moderation in inflation are key positive trends.
Valuations continue to remain near long term average giving us confidence of
the potential to generate healthy returns over the long term.
Disclaimer:
“This report is not an offer for sale in or into the United States of any equity shares or any other security of the company. The securities of the company have not been and will not be registered under the
US Securities Act of 1933, as amended from time to time and may not be sold in the United States absent registration under US securities laws or an exemption from such registration.”
7
Disclaimer
These factsheets have been prepared by UTI Asset Management Company Ltd.
Nothing in these factsheets or the materials referred to herein constitutes or is intended to constitute investment or other advice. You should seek your own legal, investment
and tax advice as you see fit and you should not act upon any information contained in these factsheets or the materials referred to herein without first consulting a financial
or other professional adviser.
Neither these factsheets nor any of the information contained in them forms or constitutes an offer or invitation to any person to sell or issue, or any solicitation of any
offer to purchase or subscribe for, any interest in the UTI Offshore Funds (the “Funds”) nor will it form the basis of any contract for the purchase of or subscription for any
such interest. Recipients of these factsheets who intend to apply for interests in the Funds are reminded that any such application may be made solely on the basis of the
information and opinions contained in the final information memorandum or other document relating thereto, which may differ materially from the information and opinions
contained in these factsheets. Accordingly, no reliance may be placed for any purpose whatsoever on the contents of these factsheets or on their completeness.
Recipients of these factsheets are further reminded that they are responsible for ascertaining and observing any applicable laws or regulations in their jurisdiction in respect
of any application or subscription for interests in the Funds.
Neither of UTI Asset Management Company Ltd, UTI International Limited, or any of their respective directors, management, officers, employees, agents or advisers or any
other person makes any representation or warranty, express or implied, as to the accuracy or completeness of the contents of these factsheets. In particular, but without
prejudice to the generality of the foregoing, no representation or warranty is given as to the achievement or reasonableness of, and no reliance should be placed on, any
assumptions, targets, forecasts, projections, estimates or prospects with regard to the anticipated future performance of the Funds. No responsibility or liability is accepted
by any such person for any errors, misstatements or omissions in these factsheets. The exclusions set out in this paragraph do not extend to an exclusion of liability for, or
remedy in respect of, fraudulent misrepresentation.
The distribution of these factsheets in other jurisdictions may be restricted by law and persons into whose possession these factsheets come should inform themselves
about, and observe, any such restrictions.
These factsheets may contain forward-looking statements including, but not limited to, statements as to the Funds’ business, results of operations, financial condition,
liquidity, performance and prospects and trends and developments in the markets in which it is proposed the Funds will operate. These statements and forecasts involve
risk and uncertainty because they relate to events and depend on circumstances that will occur in the future. There are a number of factors that could cause actual results
or developments to differ materially from those expressed or implied by these forward-looking statements and forecasts. Nothing in these factsheets should be construed
as a profit or dividend forecast.
The interests in the Funds have not been and will not be registered under the United States Securities Act of 1933 (as amended). The Funds will not be registered under
the United States Investment Company Act of 1940. Accordingly, the interests in the Funds may not be offered or sold, directly or indirectly, in the United States of America
or to any citizen or resident thereof other than in accordance with certain exemptions.
The interests in the Funds are not being offered or sold, and may not be offered or sold directly or indirectly in India or to, or for the account or benefit of, any resident of India.
Investment in the Funds is only suitable for sophisticated investors who are aware of the risks of investing in India and should be regarded as long-term. The Funds’
investments are subject to market fluctuations and the risks inherent in all investments and there are no assurances that appreciation will occur. The Funds are denominated
in GDP/USD but the underlying investments are denominated in INR. Accordingly, the value of your investment may rise and fall due to exchange rate fluctuations.
UTI International Ltd, Guernsey (UTI IL) is a regulated entity in Guernsey, governed by Guernsey law, and is under the Protection of Investors (Bailiwick of Guernsey) Law 1987.
The Funds are open-ended and investors may realise their shares by way of daily dealing based on net asset value, by contacting the Manager at the address below:
UTI International Ltd.,
Kingsway House, Havilland Street,
St. Peter Port, Guernsey, Channel Islands,
GY12QE
Phone +44 1481 726141
Fax number +44 1481 726142


© Copyright 2026