
View/Open - UNAM Scholarly Repository
UNDERSTANDING AND USES OF CONCEPT MAPPING IN TEACHING
NATURAL SCIENCE: CASES OF TWO PRIMARY SCHOOLS IN
WINDHOEK, KHOMAS REGION
A THESIS SUBMITTED IN PARTIAL FULFILMENT OF THE REQUIREMENTS
FOR THE DEGREE OF MASTER OF EDUCATION
(SCIENCE EDUCATION)
OF
THE UNIVERSITY OF NAMIBIA
BY
JAFET SHIKONGO UUGWANGA
(201176939)
APRIL 2015
Main Supervisor: Dr H.U. Kandjeo-Marenga
Co-supervisor: Mrs M. Vries
APPROVAL PAGE
This research has been examined and is approved as meeting the required standards for
partial fulfilment of the requirements of the degree of Master of Education.
____________________________________
Internal examiner
___________________________
Date
___________________________________
Dean of Education
___________________________
Date
___________________________________
External examiner
___________________________
Date
i
DECLARATION
I, Jafet Shikongo Uugwanga, hereby declare that “Understanding and uses of concept
mapping in teaching Natural Science: cases of two primary schools in Windhoek,
Khomas Region” is a true reflection of my own research, and that this work, or part
thereof has not been submitted for a degree in any other institution of higher education.
No part of this thesis may be reproduced, stored in any retrieval system, or transmitted
in any form, or by means (e.g. electronic, mechanical, photocopying, recording or
otherwise) without the prior permission of the author, or The University of Namibia in
that behalf.
I, Jafet Shikongo Uugwanga, grant The University of Namibia the right to reproduce
this thesis in whole or in part, in any manner or format, which The University of
Namibia may deem fit, for any person or institution requiring it for study and research;
providing that The University of Namibia shall waive this right if the whole thesis has
been or is being published in a manner satisfactory to the University.
___________________________________
Jafet Shikongo Uugwanga
____________________________
Date
ii
DEDICATION
First and foremost, this thesis is dedicated to my mother, Taimi Kaapangelwa
Shamena-Iipinge and my late father, Junias Shapaka-Kasamane Uugwanga (may his
soul rest in peace). They have sacrificed their lives for my education although they
didn’t get formal education; they have been very enthusiastic about my education. They
have positively shaped my life and made me who I am today. Thank you very much
Meme gwaShamena and Tate Kasamane for being my mentors and for giving me an
opportunity to realise my life dreams and ambitions.
Secondly, I dedicate this thesis to my wife, Klaudia Ndeshipanda Iimene and my son,
Ndeshipanda Kagadhinwa Uugwanga for their unwavering love, kindness, patience,
understanding and support, as well as for the good and bad times that I ripped-off from
them during my entire study period.
Thirdly, I dedicate this thesis to all the teachers who live and teach in rural schools in
Namibia and the rest of the world. Your commitment and dedication to live and travel
long distances, often in harsh and unsafe conditions to serve and make a difference in
the lives of thousands of children are highly acknowledged and saluted.
“…MAY OUR HEAVENLY FATHER KEEP BLESSING THE WORK OF OUR
TRUE MOTHERS, FATHERS AND TEACHERS…”
iii
ACKNOWLEDGEMENTS
If it were not for their remarkable and valuable contributions, I would not have been
able to complete this study and it is, therefore, my privilege and honour to take this
opportunity to express my sincere thanks and appreciation to:
The Almighty God for giving me wisdom, strength, knowledge and His grace and spirit
to complete the study.
My supervisor, Dr. Hedwig Utjungirua Kandjeo-Marenga, for her incredible and
infinite perseverance and support, her professional guidance and advice, her being an
approachable and dedicated mentor, her sympathy, kindness and constructive criticism
for which all made the study a success.
The Ministry of Education that funded my study under Namibia Government
Scholarship and Training Programme (NGSTP), the Permanent Secretary as well as the
Khomas Directorate of Education, for granting me permission to conduct the study in
schools in the Khomas Educational Region.
The principals, for giving me the opportunity, freedom and support to conduct the study
as well as the teachers and learners, for their whole-hearted consent and valuable
contributions.
iv
All my colleagues and friends who supported and encouraged me, made a huge
difference in many ways to my study.
Ms. Martha Amupolo, for being a humble mother and always taking care of me,
especially, during the hectic times of my study. Your generosity and tirelessness is
greatly appreciated.
My family, especially my parents, my wife, Klaudia Ndeshipanda Iimene, and my
brothers Junias Hiskia ‘Shamavi’ and Ismael Shoopala Uugwanga. Thank you for your
love, care, support and motivation. This kept the candle burning.
“A sacrifice to be real, it must cost, must hurt, and must empty ourselves. The fruit of
silence is prayer; the fruit of prayer is faith; the fruit of faith is love; the fruit of love is
service; and the fruit of service is peace.”
Mother Teresa of Calcutta (1910 - 1997)
“The love and peace be with you all”!!
v
ABSTRACT
The purpose of the study was to investigate the Grade six Natural Science teachers’
understanding of concept mapping. The study also investigated learners’ understanding
of science concepts on “matter and its properties” taught through the use of concept
mapping as compared to traditional lecture method. The study was conducted with two
science teachers who taught Natural Science to Grade six, thirty-three learners at Alpha
Primary School and thirty-seven learners at Omega Primary School in the Khomas
Educational Region, Namibia. Mixed research methods were used.
A semi-structured interview schedule and a video recorder were used to collect data
from teachers. The researcher was an active participant in the collection of data and a
video recorder was also used to capture his own instructions. A pre- and post-tests were
conducted in order to find out the difference in learners’ understanding of “matter and
its properties” when taught through concept mapping as compared to traditional lecture
method. Each test had 22 items. All learners were given the same pre-test, followed by
an intervention (treatment) and then a post-test was administered.
Learners at Alpha Primary School were taught through the traditional lecture method
while those at Omega Primary School were taught through the concept mapping
method. The scores on both tests were analysed to see if there are statistically
significant difference between learners’ understanding of “matter and its properties”
taught through the concept mapping and those taught through the traditional lecture
methods. It was found that learners taught through concept mapping out-performed
vi
those who were taught through the traditional lecture at statistically significant
difference of alpha 0.05. That means that the overall critical value of 1.998 is
significant (t-tests = -4.574 and -2.830, at p < 0.05). As the critical value of 1.998
obtained for the degree of freedom (df) = 63, p = .000. The calculated t-value is higher
than the critical value, therefore, the Null hypothesis is rejected and the results are
significant at p = 0.05. The study also found that both science teachers have vague
ideas about what the concept mapping strategy was hence they did not even use the
strategy in their instructions.
vii
TABLE OF CONTENTS
Approval page .............................................................................................................. i
Declaration .................................................................................................................. ii
Dedication .................................................................................................................. iii
Acknowledgements .....................................................................................................iv
Abstract .......................................................................................................................vi
List of tables ............................................................................................................. xiii
List of figures ............................................................................................................ xiv
Acronyms ................................................................................................................... xv
CHAPTER ONE: INTRODUCTION ........................................................................ 1
1.1 Introduction ............................................................................................................ 1
1.2 Background of the study ......................................................................................... 1
1.3 Research problem ................................................................................................... 7
1.4 Research questions.................................................................................................. 9
1.5 Hypothesis of the study ......................................................................................... 10
1.6 Significance of the study ....................................................................................... 10
1.7 Limitations of the study ........................................................................................ 11
1.8 Delimitations of the study ..................................................................................... 12
1.9 Definition of terms as used in this study ................................................................ 13
1.10 Research synopsis ............................................................................................... 14
CHAPTER TWO: LITERATURE REVIEW ......................................................... 16
2.1 Introduction .......................................................................................................... 16
viii
2.2 Theoretical framework .......................................................................................... 16
2.2.1 Ausebel’s Assimilation Theory of cognitive learning ......................................... 17
2.2.2 Conceptual change framework ........................................................................... 19
2.2.3 ED3U Model for teaching science for conceptual change ................................... 22
2.3 Science teaching for conceptual understanding ..................................................... 28
2.4 Uses and importance of a concept mapping in science teaching ............................ 31
2.5 Science pedagogy in relation to scientific concepts ............................................... 32
2.6 Exposing learners to scientific concepts ................................................................ 33
2.7 Teaching science concepts for conceptual understanding ...................................... 34
2.8 Conclusions .......................................................................................................... 36
CHAPTER THREE: METHODOLOGY................................................................ 38
3.1 Introduction .......................................................................................................... 38
3.2 Research design .................................................................................................... 38
3.3 Population and sample .......................................................................................... 43
3.3.1 Schools’ profiles ................................................................................................ 44
3.3.1.1 Alpha Primary School ..................................................................................... 44
3.3.1.2 Omega Primary School ................................................................................... 45
3.3.1.3 Middle-Class Primary School .......................................................................... 46
3.3.2 Teachers’ profiles .............................................................................................. 47
3.3.2.1 Teacher 1: Mr Golden ..................................................................................... 48
3.3.2.2 Teacher 2: Mr Silveren.................................................................................... 48
3.3.2.3 Teacher 3: Ms Bronzen ................................................................................... 49
3.4 Sampling procedure .............................................................................................. 50
ix
3.5 Research instruments ............................................................................................ 51
3.5.1 Pre- and post-tests .............................................................................................. 51
3.5.2 Interviews .......................................................................................................... 56
3.5.3 A video recorder ................................................................................................ 57
3.5.4 Treatment .......................................................................................................... 58
3.6 Data collection procedure ..................................................................................... 58
3.7 Data analysis......................................................................................................... 60
3.7.1 Pre- and post-tests .............................................................................................. 60
3.7.2 Interviews .......................................................................................................... 60
3.8 Research ethics ..................................................................................................... 61
3.9 Conclusions .......................................................................................................... 62
CHAPTER FOUR: RESULTS AND DISCUSSION ............................................... 63
4.1 Introduction .......................................................................................................... 63
4.2 Research question one........................................................................................... 63
4.3 Research question two .......................................................................................... 73
4.4 Difference in pre-test and post-test mean of scores ................................................ 78
4.4.1 Mean scores for learners exposed to the traditional lecture method .................... 78
4.4.2 Mean scores for multiple choice items for the traditional lecture group .............. 78
4.4.3 Mean scores for structured questions for the traditional lecture group................. 82
4.4.4 Mean scores for multiple choice items for the concept mapping group ............... 90
4.4.5 Mean scores for the structured questions concept mapping group... .................... 95
4.5 Conclusions ........................................................................................................ 100
x
CHAPTER FIVE: SUMMARY, CONCLUSIONS AND RECOMMENDATIONS..102
5.1 Introduction ........................................................................................................ 102
5.2 Summary ............................................................................................................ 102
5.2.1 Research question one ...................................................................................... 102
5.2.2 Research question two ..................................................................................... 103
5.3 Recommendations............................................................................................... 104
5.3.1 Research question one ...................................................................................... 104
5.3.2 Research question two ..................................................................................... 106
5.4 Conclusions ........................................................................................................ 106
5.5 Summary ............................................................................................................ 107
REFERENCES ....................................................................................................... 108
APPENDICES ........................................................................................................ 125
Appendix 1: A granted permission letter from the University of Namibia to carry out a
research .................................................................................................................... 125
Appendix 2: A letter requesting permission from the permanent secretary (Ministry of
Education) ................................................................................................................ 126
Appendix 3: A letter requesting permission from the director of education (Khomas
Region)..................................................................................................................... 127
Appendix 4: A follow-up letter requesting permission from the director of education
(Khomas Region) ..................................................................................................... 128
Appendix 5: An approval letter from the permanent secretary (Ministry of Education)129
Appendix 6: An approval letter from the director of education (Khomas Region) ..... 130
Appendix 7: A letter requesting permission from the school principals ..................... 131
xi
Appendix 8: A letter requesting permission from the teachers (consent form) ........... 132
Appendix 9: A letter requesting permission from the learners (consent form) ........... 134
Appendix 10: Pre-test items on “matter and its properties” ....................................... 136
Appendix 11: Post-test items on “matter and its properties” ...................................... 142
Appendix 12: An individual interview schedule for teachers ..................................... 148
xii
LIST OF TABLES
Table 1: Scheme of work for twelve days spent during data collection ........................ 52
Table 2: Pre- and post-test items spread across the concepts (A) ................................. 55
Table 3: Pre- and post-test results of traditional lecture group ..................................... 75
Table 4: Pre- and post-test results of concept mapping group ...................................... 75
Table 5: Pre- and post-test items spread across the concepts (B) ................................. 90
xiii
LIST OF FIGURES
Figure 2.1: The ED3U Model of teaching science for conceptual change..................... 23
Figure 3.1: Alpha Primary School as seen from outside .............................................. 44
Figure 3.2: Omega Primary School as seen from outside ............................................ 45
Figure 3.3: Middle-Class Primary School as seen from outside ................................... 47
Figure 4.1: Learners’ mean scores for each multiple choice item of traditional lecture
group .......................................................................................................................... 79
Figure 4.2: Mean difference of improvement between pre- and post-test results (A) ... 80
Figure 4.3: Mean difference of slight decrease between pre- and post-test results ....... 81
Figure 4.4: Learners’ mean scores of science concepts taught through traditional lecture
method ....................................................................................................................... 83
Figure 4.5: Science concepts presented using traditional lecture strategies .................. 84
Figure 4.6: Learners’ performance on ice concept on pre- and post-tests ..................... 88
Figure 4.7: Learners’ performance on freezing concept on pre- and post-tests............. 89
Figure 4.8: Learners’ mean scores for each multiple choice item of concept mapping
group .......................................................................................................................... 91
Figure 4.9: Mean difference of improvement between pre- and post-test results (B).... 92
Figure 4.10: Learners’ mean scores of science concepts taught through concept
mapping method ......................................................................................................... 95
xiv
ACRONYMS
AAT
Ausubel’s Assimilation Theory
ACE
Advanced Certificate in Education
BETD
Basic Education Teachers Diploma
CA
Continuous Assessment
HODs
Heads of Department
LCE
Learner Centred Education
M
Mean scores
NAEP
National Assessment of Educational Progress
NAMCOL
Namibia College of Open Learning
NGSTP
Namibia Government Scholarship and Training Programme
NIED
National Institute for Educational Development
NSATs
National Standardise Achievement Tests
UNAM
University of Namibia
WCE
Windhoek College of Education
ZPD
Zone of Proximal Development
xv
CHAPTER ONE
INTRODUCTION
1.1
Introduction
This chapter introduces the study on the understanding and uses of concept mapping in
teaching Natural Science. The background of the study, research problem, research
questions, hypothesis, significance, limitations, delimitations and operational definition
of terms used in the present study are described in his chapter.
1.2
Background of the study
The difficulty of teaching and learning in science is not unique to African countries but
manifests itself in Western countries too, such as the United States of America
(Ottevanger, van den Akker, & de Feiter, 2007). In Namibia, most teachers seem to
focus on using the lecture methods of teaching rather than new and innovative methods
of teaching (Amoonga & Kasanda, 2011; Kapenda, Kandjeo-Marenga, & Kasanda,
2002).
Kasanda (2005) conducted a study on problems that prevent effective development of
the teaching of mathematics and science education in Namibia and Zambia in primary
and secondary school levels. He found that teachers concentrated on teaching rules
more than employing innovative teaching strategies in teaching science content.
Amoonga and Kasanda (2011) also found that teachers in Namibian schools prefer to
use the lecture method. The lecture method is not only used by Namibian teachers, but
1
globally (Mwakapenda, 2006; Safdar, Hussain, Shah, & Rifat, 2012). Lubben,
Kasanda, Gaoseb, Kandjeo-Marenga, Kapenda, and Campbell (2005) also found that
the lecture method was preferred by many teachers since many teachers think that the
lecture strategy could contribute to rote learning and, thus, high retention of subject
content by most learners and consequently high performance in examinations.
Therefore, there is a need to practice innovative teaching strategies such as “concept
mapping” in teaching and learning science concepts rather than the lecture method in
order to nurture learners’ scientific skills and understanding.
Concept mapping is a teaching and learning tool that was derived from Ausubel’s
learning theory which is used to help learners explain and generate individual
understanding about certain concepts (Novak, 1990, Novak & Canas, 2008). According
to Prediger (2008), cross-links or relationships between concepts in different domains
of the concept map, for example, events or objects help learners to understand
relationships amongst given concepts.
The process of teaching and learning by using concept mapping, gives learners a
structured space in which to reflect upon a specific theme and topic, that is “matter and
its properties” (Elizabeth, 2013) and to scientifically clarify their ideas on that theme
and topic. According to Vitale and Romance (1992) mastery of core science concepts
could assist learners to improve in understanding and learning science. Elizabeth
(2013) notes that concept mapping teaching strategy gives learners a clear
understanding on how science concepts are inter-linked when learning through concept
mapping rather than given the traditional lecture.
2
In addition, the concept map is a “graphical representation of the relationship among
terms” (Vanides, Yin, Tomita, & Ruiz-Primo, 2005, p. 27). This means that specific
concepts in concept mapping are connected together by arrows labelled with short
phrases that describe the relationship between the two connected concepts. These
connected concepts could be read as a sentence to describe the connection and
relationship between these concepts. Studies (Canas & Novak, 2009; Vanides et al.,
2005) define concept mapping as a graphical tool for organising and representing
science concepts. In other words, learners tend to learn and perceive science concepts
from concept maps in a visual manner that enables them to organise, remember,
represent and recognise scientific concepts reasonably well. Ebenezer and Conner cited
in Safdar, Hussain, Shah and Rifat (2012) state that a concept map is a “semantic
network showing the relationships among concepts in a hierarchical fashion” (p. 57).
When concepts are written in a hierarchical approach, learners tend to remember them
easily than when written in text format and that concepts in semantic network help
learners and teachers to organise their thoughts and ideas in an orderly way.
Generally, teachers tend to use the concept mapping strategy in teaching science
concepts for different reasons. Some teachers tend to use it in order to determine the
nature of learners’ existing ideas on what they already know and what they need to be
taught (Asan, 2007). Other teachers use concept maps in order to provide learners with
opportunities to operate at all six levels of Bloom’s educational objectives of cognitive
domain (Safdar et al., 2012). Thus, allowing learners to engage with subject matter at
all the levels of the cognitive domain. For example, Vanides, Yin, Tomita, and RuizPrimo (2005) conducted a study on using concept maps in the science classroom. They
3
found that the concept mapping teaching strategy provides learners with opportunities
to:
•
discover the connections between the science concepts;
•
organise their thoughts in making sense of the science concepts;
•
visualise the relationships between key concepts in a systematic way in learning
science concepts;
•
reflect on what they have learned in constructing meaning; and
•
show their understanding of science concepts by illustrating what they have learned
in visual concept map (p. 28).
It is, for the above reasons that teachers tend to use the concept mapping strategy in
order to allow learners to discover the connections between the science concepts first
and in so doing be able to understand the science concepts manner which is easy
(Mwakapenda & Adler, 2003). For example, it becomes important for learners to
connect and link concepts by using new linking words such as “formed by”, “can be
changed to”, “taken up by”, “released from” in order to construct new understanding
about the science concepts learners are taught (Asan, 2007). Moreover, such an
exercise is used to determine the nature of learners’ existing knowledge and the
acquisition of the taught concepts.
In addition, concept mapping strategy could be used in assessing learners’
understanding of what have been taught (Mwakapenda, 2004). In other word, learners’
understandings of science concepts could be assessed by examining the connections
learners make in producing a concept map of what was taught. For instance, learners
4
could make connections and links about science “matter” by using other related
concepts such as sublimation, condensation, energy released, melting, freezing, liquid
and boiling in order to indicate how these concepts are related to each other. By
connecting and linking concepts, studies (Mwakapenda, 2003; Brinkmann, 1999) show
that concept mapping could help learners to understand science concepts in an easy
way within a short period of time and meaningful manner.
Concept mapping strategy seems to have many positive contributions to learners’
thinking capacities, problem solving skills, academic achievements, understanding of
content, knowledge and attitudes toward science and the development of appropriate
thinking skills (Asan, 2007; Brinkmann, 1999; Mwakapenda, 2003; Mwakapenda &
Adler, 2003; Vanides et al., 2005). According to Chiou (2008) concept mapping
enhances learning effectively and it is effective “for learning and understanding the
structure and inter-relations of the curriculum content” (p. 383). Candan, Türkmen and
Cardak (2006) point out that concept mapping is an effective tool as it “reveals the
misconceptions, and it is effective to teach scientific concepts” (p. 29). Furthermore,
the strategy facilitates learners’ independent learning and thinking and it reduces the
barriers and promotes learners’ interests in learning science concepts (Asan, 2007;
Candan, Türkmen, & Cardak, 2006; Chiou, 2008). Concept mapping could also be used
in documenting the hierarchical relationships as described by learners before, during,
and after learning experiences in classrooms (Wehry, Algina, Hunter, & Monroe-Ossi,
2007) as well as to assess what learners know about science concepts (Asan, 2007;
Prediger, 2008).
5
Despite the positive contributions listed above, the use of the concept mapping strategy
seems to have challenges too. Learners seem to experience many challenges when they
are not properly introduced to how to use and/or presented science concepts in a
concept map hierarchy. Mwakapenda (2004) stated that learners may experience some
challenges even if they were taught specific concepts, for example, some learners may
not have understood the content well enough in order to be able to communicate the
knowledge gained. In this case, he argued that the concept mapping strategy might
prevent learners to meaningfully learn. Give learners an opportunity to understand
science concepts as well as to critically and freely reflect on relationships between
science concepts or ideas (p. 33).
Chiou (2008) conducted a study on the effect of the concept mapping strategy on the
Taiwan University students’ learning, achievements and interests and found that nearly
half of the students could not quickly adapt to the concept mapping strategy.
Furthermore, he indicated that a lack of familiarity with concept mapping technique
could be frustrating and that the training of learners to use the concept mapping
learning strategy can be tiresome and time-consuming.
Several studies have been conducted in the Namibian context in the field of science
education on characteristics of practical work in science classrooms; post colonialism
and globalisation in science education; the role of everyday contexts in learner-centred
teaching; and the use of constructivism in teaching mathematics for understanding
(Amoonga & Kasanda, 2011; Kapenda et al., 2002; Kasanda, 2005; Lubben, Kasanda,
Gaoseb, Kandjeo-Marenga, Kapenda, & Campbell, 2005). Thus far, no study seems to
6
have been conducted in Namibia on the uses of innovative teaching strategies such the
concept mapping strategy in teaching science.
1.3
Research problem
Concept mapping is one of the new innovation teaching strategies in teaching science
subjects in schools. Although some studies (Amoonga & Kasanda, 2011; Asan, 2007;
Lubben et al, 2005; Mwakapenda, 2006) consider the concept mapping teaching
strategy to be an effective teaching strategy, not many teachers seem to be equipped in
using this strategy during instruction (Crawford, 2007; Grosser, 2007).
Moreover, concept mapping is seen to be an effective teaching strategy in science
education due to its contribution to developing learners’ thinking capacities, problem
solving skills, promoting learners’ understanding of content knowledge (Novak, 2008;
Trochim, 2006). Concept mapping strategy seems to have several purposes for learners
such as:
•
assisting leaners to brainstorm and generate new ideas;
•
encouraging learners to discover new concepts and the propositions that connect
science concepts;
•
allowing learners to clearly communicate science ideas, thoughts and information;
•
assisting leaners to integrate new science concepts with old or acquired concepts;
and
•
enabling learners to gain enhanced knowledge of any topic and assess the
information (http://www.inspiration.com/visual-learning/concept-mapping).
7
One of the fundamental aims in the use of concept mapping is to foster meaningful
learning as compared to rote learning. Ausubel, cited in Canas (2003) described three
conditions that seem to be important in increasing learners’ performance in school
science, in particular, to the Namibian learners who are prone to rote learning. Firstly,
concept mapping need to be conceptually clear and be presented with language and
examples relatable to the learners’ prior knowledge. Secondly, learners must possess
relevant prior knowledge and lastly, learners must be motivated in order to choose to
learn
meaningfully
(http://www.ihmc.us/users/acanas/Publications/ConceptMapLit
Review/).
In Namibia, the application of concept mapping in teaching is still a new teaching
strategy and teachers are not well equipped to use it (Amoonga & Kasanda, 2011;
Kapenda et al., 2002; Lubben et al., 2005). Therefore, Namibian science teachers seem
to experience some problems, particularly in classrooms. It is also a new teaching
strategy and teachers are not familiar with it. It seems to take time for teachers to shift
from their usual lecture method to the concept mapping strategy and this shift might
frustrate teachers. If teachers are frustrated, then, they might not motivate learners for
deeper and meaningful learning to take place. It is also possible that teachers may also
find it difficult to get information on how to use concept mapping as compared to the
text-rich lecture teaching strategy. In addition, training teachers on how to use the
concept mapping strategy might be seen as tedious and time-consuming by many
lecturers and, thus, and many teachers may not be willing to adopt the concept mapping
strategy (Chiou, 2008).
8
Another factor that seems to influence teachers not to apply concept mapping is the
teacher-learner ratio (Black, 2005). In overcrowded classrooms, teachers do not pay
attention to each learner to oversee the usefulness of concept mapping. Another
problem might be the language barriers amongst teachers and learners (Jarvis & Pell,
2005). Teachers and learners might find some linking words, phrases and prepositions
used on the concept map as unfamiliar, too complicated and difficult to use as they
themselves seem to struggle to understand science concepts.
Therefore, this study is twofold and aims to (i) investigate the Grade six Natural
Science teachers’ understanding and use of concept mapping; (ii) examine the
usefulness of concept mapping by assessing learners’ understanding of the concept of
“matter and its properties” taught through the concept mapping method as compared to
the traditional lecture method.
1.4
Research questions
The purpose of the study was to investigate the Grade six Natural Science teachers’
understanding of concept mapping and use of the concept mapping strategy in relation
to the lecture strategy in teaching science content. Therefore, the following are the main
research questions of the study:
1. How do Grade six Natural Science teachers understand and use concept mapping?
9
2. Is there a significant difference in learners’ understanding of “matter and its
properties” taught through concept mapping as compared to traditional lecture
strategy?
1.5
Hypothesis of the study
The following is the hypothesis for the current study:
There is no statistically significant difference in learners’ understanding of “matter and
its properties” taught through concept mapping and those taught through traditional
lecture.
1.6
Significance of the study
The importance of this study was to find the usability of a teaching tool ‘concept
mapping’ that could be used to enhance learners’ conceptual understanding of science
concepts. Some science concepts on ‘matter and its properties’ that the study focused
on are: evaporation, condensation, boiling, deposition, steam, water, ice, sublimation,
melting, freezing and energy. The researcher was curious in trying to find out the
usefulness of concept mapping as a tool that could help learners to understand the
relationship between the various scientific concepts in relation to the lecture method.
Also, the study could serve as a guiding tool and an eye-opener to other science
teachers and curriculum planners by informing them that concept mapping could
contribute positively if it is used appropriately in teaching learners.
10
Moreover, this study may also be useful in different ways. Firstly, the study might
bridge the gap in the contemporary literature and transform the notion of instructional
practice from rote learning to meaningful learning. The study might, thus, provide some
information in trying to discover challenges associated with innovative strategies of
teaching as compared to traditional lecture teaching strategy in teaching science and by
so doing serve as reference material for further studies. Secondly, the study may lead to
discovering some misconceptions or alternative concepts in learners’ understanding of
science concepts such as evaporation, condensation, boiling, deposition, steam, water,
ice, sublimation, melting, freezing and energy. Thirdly, the study could be useful to
educators in training student-teachers on what to avoid and what to apply in using the
concept mapping strategy during instruction. Fourthly, this study might consequently
enhance a deeper understanding of the subject content if such a tool is used
appropriately. Finally, the study may directly inform other researcher about the benefits
and weaknesses of concept mapping strategy when teaching science.
1.7
Limitations of the study
Limitations are possible weaknesses and shortcomings that the researcher identified
during the research study (Pajares, 2007). The limitations for this study were: Firstly,
the study focused only on few government primary schools in the Khomas Educational
Region. Therefore, the outcomes of the study are not generalizable to larger primary
school teachers and learners’ understandings of science concepts because of the small
sample that was used for data gathering. In the same breath, the researcher would want
to say that the success of the method lies in how the teachers use the concept mapping
11
and these might differ from one school to another and from one educational region to
another.
Secondly, a sample size of two schools and two teachers seem be too small and if a
larger sample is used, it might have delivered different results. Thirdly, the targeted
science teachers were too nervous as they seemed to be deliberately provided
information that they thought the researcher wanted to hear and by so doing
unknowingly they did not provide useful information as to how they assessed
themselves on how they understood the concept mapping strategy. Fourthly, analysis of
the recorded video was not an easy task to carry out but it was possible by developing
an appropriate analysis scheme for lesson presentations during the piloting sessions.
Fifthly, analysing own teaching was challenging as one was likely tempted to look at
the video recorded data with biased eyes (Kinchin, Streatfield, & Hay, 2010). In order
to avoid bias, the researcher developed an analysis tool that was used by two
experienced educators and then it was corrected before analysing the videos content.
1.8
Delimitations of the study
The study targeted only three government primary schools in the Khomas Educational
Region. These schools were studied in terms of performance, locations and resources
and there were no difference in their settings as to avoid discrepancy. Only two Grade
six Natural Science teachers and their learners were included in the study in order to
minimize the number of case study sites. The study deliberately focused only on the
understanding and uses of concept mapping strategy on “matter and its properties” and
12
wanted to have in-depth information relating to the practices of the concept mapping
teaching strategy rather than focusing on many schools.
1.9
Definitions of terms as used in this study
Concept mapping refers to a diagrammatic representation of what is in order to show
meaningful relationships between concepts. Arrows and linking words are used in the
form of propositions (Stoica, Moraru, & Miron, 2011).
Conceptual understanding refers to the ability to transfer and to understand ideas
which are based on facts, laws, principles and basic scientific concepts such as energy,
matter, solubility and photosynthesis, and tools used in the process of a scientific
investigation (Mbano, 2004).
Science refers to the study of facts, principles and theories that describe the world
around us. It is also described as a set of processes by which people systematically
acquire and refine knowledge (Merki, 1993; Snively & Corsiglia, 2001)
Science teaching refers to the systematic process of presenting science facts, skills,
concepts, ideas and techniques to the learners (Brown, 2009; Duit & Treagus, 1998).
Scientific concepts refer to mental representations of a single concept, for example,
water, weight, electricity, chemical change and matter (Department of Education,
2006).
13
Traditional lecture refers to the practice when teachers provide the subject content to
the learners with the help of a textbook, and then learners have to learn it (Marsh,
Ontero, & Shikongo, 2002).
1.10
Research Synopsis
In Chapter One, the background of the study, research problem, research questions,
hypothesis, significance, limitations, and delimitations of the study and definitions of
terms are described.
In Chapter Two, the following subtitles: theoretical framework including models of
science teaching for conceptual change, science teaching for conceptual change, the
meaning of concept mapping with its uses and importance, science pedagogy in relation
to scientific concepts, learners’ exposure to scientific concepts, teaching science for
conceptual understanding will be covered.
In Chapter Three, the following subtitles are described: research design, population
and sample, the profiles of the schools, profiles of the teachers, sampling procedure,
research instruments, data collection procedure, data analysis and research ethics.
In Chapter Four, the results are presented, interpreted and discussed under the
following subtitles: research question one and two.
14
In Chapter Five, summary, conclusion and recommendations are described under the
following subtitles: the summary, conclusions and the recommendations will be given
based on the two research questions.
15
CHAPTER TWO
LITERATURE REVIEW
2.1
Introduction
This chapter presents a review of the literature conducted locally and internationally on
the focus and purpose of the current study. The literature review also presents a critical
discussion of the uses and classroom practices of the concept mapping teaching
strategy in enhancing learners’ conceptual understanding in science teaching. The main
points for discussion are the theoretical framework of Ausubel’s Assimilation Theory
(AAT) of cognitive and meaningful learning; Conceptual Change Framework (CCF)
and ED3U models for conceptual understanding, science teaching for conceptual
change;
science teaching for conceptual change, uses and importance of concept
mapping; science pedagogy in relation to scientific concepts, importance of exposing
learners to scientific concepts and teaching science concepts for conceptual
understanding.
2.2
Theoretical framework
The theoretical framework is derived from Ausubel’s Assimilation Theory (AAT) of
cognitive learning, the Conceptual Change Framework (CCF) in making meaning, and
the ED3U Model, teaching science for conceptual change.
16
2.2.1 Ausubel’s Assimilation Theory of cognitive learning
The theory emphasises how learners gain conceptual understanding and how concepts
are structured in the minds of leaners. According to Ausubel, learning relies on what is
already known, that is, what is referred to as prior knowledge. In other words,
knowledge construction starts with what learners are observing and recognising as
events and objects as concepts that are already established in their minds. According to
Ausubel’s theory of learning, learners learn by constructing a network of science
concepts and by adding new scientific concepts to prior learnt concepts.
In addition, Ausubel’s theory of learning focuses on reception and meaningful learning
rather than rote learning (Novak, 2011). Novak (2011) argues that understanding
concepts, principles and ideas are best achieved through deductive reasoning rather
than rote learning. Furthermore, assimilation theory of cognitive learning emphasises
meaningful learning as well as provision of opportunities to learners in order to
enhance meaningful learning by relating new knowledge (science concepts) to relevant
science concepts that are already known to learners. For example, new information is
gained from well-planned class activities and the knowledge levels of the learners
expand in order to accommodate the gained information (Cantú, Farines, & Angotti,
2004).
The assimilation theory of cognitive learning also involves recognition or what Ausubel
refer to as “reception” of the links or connection between concepts. Ausubel (1962)
believes that knowledge is hierarchically organised and that new knowledge would be
17
meaningful if it could be anchored to what is already known (Novak and Canas (2008).
In the current study, in order to teach meaningfully and for the learners to learn
meaningfully, concept mapping is used as a tool for creative productions of science
concepts. The researcher as well as the teacher provided learners with well organised
and relevant structures of knowledge. The researcher also used a tool (concept
mapping) to illustrate how science concepts were linked in order to enhance learners’
understanding of the “matter and its properties”.
One of the powerful uses of concept mapping is evaluation of learnt information
(Novak & Canas, 2008; Novak, 2011). It is, thus, encouraging learners to continuously
use concept mapping as an evaluation tool to assess their understanding of the learnt
science concepts which is in accordance with conceptual change framework. The
concept mapping strategy involve three conditions that satisfy the assimilation theory
of cognitive learning, namely: (i) strategy used in concept mapping as an organiser to
link concepts to one another, (ii) processing new science concepts with existing
concepts and (iii) a comparative organiser in activating existing structures to integrate
new science concepts with acquired science concepts in cognitive structures (Ausubel,
1962). In addition, the concept mapping strategy acts as an expository organiser – when
new science concepts are familiar to learners they relate to what they already know
easily.
In the same vein, Ausubel’s assimilation theory of cognitive learning also relates to the
conceptual change framework. The conceptual change framework is considered in the
next subsection.
18
2.2.2 Conceptual change framework
Conceptual change framework is defined as a learning approach that changes existing
conceptions such as ideas, beliefs (Davis, 2001; Wood, 2011). According to Duit and
Treagust (2010), conceptual change framework tries to explain how learners learn in a
meaningful way. Duit and Treagust (2010) describe two types of conceptual change,
namely: (i) “the weak knowledge restructuring, assimilation or conceptual capture” and
(ii) “the strong/radical knowledge restructuring, accommodation or conceptual
exchange” (p. 672). Concept mapping is seen as a tool that can provide opportunities to
learners in order to acquire science concepts in a meaningful manner. Concept mapping
approach encourages and guides learners to take an active role in re-organizing their
ideas, thoughts and knowledge about science concepts (Mbano, 2004; Wood, 2011).
The use of concept mapping strategy requires a supportive and conducive classroom
environment in which learners feel comfortable in expressing and discussing their
scientific ideas with the teacher (Ozdemir & Clark, 2007). In other words, the teacher
as a facilitator needs to prepare learners for emotional commitment in order to allow
then to integrate new knowledge with existing knowledge as explained in Ausubel’s
assimilation theory of cognitive learning above. Thus, learners are required to acquire
knowledge through active participation through the process of sharing ideas.
Science teachers are encouraged to develop and adapt effective teaching and learning
strategies so that the new knowledge could be integrated into learners’ existing
cognitive structures (Davis, 2003; Prediger, 2008). Teaching science for conceptual
19
change offers opportunities to teachers to guide learners towards meaningful learning
by:
•
considering learners’ prior knowledge and experience;
•
identifying learners’ common misconceptions;
•
planning activities through which learners shift from less accurate to more accurate
understanding of science concepts; and
•
guiding learners in order to modify or create a place of newly constructed
knowledge within their conceptual understanding (Hewson, 1992, p. 43).
One way to do that is to develop and adapt teaching strategies that could provide
learners with intelligible, plausible, and fruitful learning opportunities and activities.
According to Hewson and Hewson (1984), intelligible opportunities, learners are
provided with learning opportunities of concepts which are familiar to them. Thus, they
know the meaning of these concepts and how these concepts make sense in their
everyday life. Plausibility comes in when provided opportunities and activities are
interesting yet challenging to learners. However, learners do believe in their potential
and that these are true in their own nature. Usually learners tend to weigh the
meaningfulness of such new knowledge and they might decide whether such learnt
concepts can offer a better explanation than the existing concepts or not. Lastly,
fruitfulness comes in when learners start to reason as to how these learnt concepts
could be incorporated in their understanding, and whether such concepts could be
useful in explain phenomena in a broader context.
20
In addition, teaching for conceptual change provides teachers with opportunities to
guide learners through a five-phased, interative process of shifting from the naïve
towards a more advanced scientific understanding. According to Shope (2006), the
following processes are involved in guiding learners for meaningful learning to take
place:
•
diagnosis strategies that form a true teacher-learner interaction in order to identify
learners’ personal conceptions of science concepts;
•
mentoring individual learners’ progress in restructuring their existing knowledge in
order to accommodate new science ideas;
•
scaffolding strategies are provided in order to guide;
•
challenges ideas;
•
move learners through scientific inquiry experiences, in proximal leaps, towards
new scientific conceptual understanding; and
•
engage learners in a real learning experience that initiates them into the way
scientists think about science and do science through mentoring strategies
(http://theaste.org/pubs/proceedings/2006proceedings/ Shope_1% 201 %20.htm).
Such process of teaching approach will involve confronting learners with new science
concepts concerning particular concepts and through that allow learners to reconstruct
their prior knowledge. It becomes necessary as new knowledge becomes old
mismatched knowledge (Prediger, 2008).
21
2.2.3 ED3U Model for teaching science for conceptual change
The ED3U model focuses on teaching science for conceptual change by developing the
learners’ zone proximal development. It becomes important for teachers to create
opportunities in order to allow their learners to participate in active inquiry activities
(Shope, 2006). In such teaching and learning environment, it is expected from a teacher
to diagnose the nature of the learners’ personal conceptions (Chapman, 2001; Shope,
2006). Thus, exploration of the phenomenon, generation of questions, make or propose
explanations, design and carry out investigations as well as arrange participatory
discourses are important aspects that actively involve learners in order to grasp
scientific concepts meaningfully. Figure 2.1 below shows the ED3U Model for teaching
science for conceptual change that focuses on the following concepts: explore,
diagnose, design, discuss and use.
22
Science Content Knowledge
Coherence Of Conceptual Understanding:
Personal Science Conceptions Compared to
Scientific Conceptualization
Diverse Contexts of Meaning
Conceptual Change Dynamics
Affinities, Capabilities,
Culture, Language,
Economics, Well-Being
Active inquiry skills, Zone of
Proximal Development (ZPD),
Nature of Science awareness
ED3U Conceptual
Change Phases
Zones of
Proximal
Inquiry
Underlying
Learning Cycle
Structure
Exploratory
Zone
Constructive
Zone
Concept
Exploration
Concept
Formation
Application
Zone
Concept
Application
Figure 2.1: The ED3U Model of teaching science for conceptual change
Source: Shope (2006). http://theaste.org/pubs/proceedings/2006proceedings/Shope_1%
201 %20.htm
23
In the exploring phase, teachers allow learners to explore the scientific phenomenon in
the form of a visual display such as concept mapping and hands-on activities as
learners connect and link words. In so doing, teachers expose learners to a variety of
information sources that enable them with a common base of experiences where
concepts, processes, and skills are identified and developed through practical work to
think toward proposing explanations of the phenomenon and other concepts selecting
from a substrate of ideas (Bybee, 1997). One such practical experience that a teacher
can provide is by introducing learners to concept mapping as a learning tool that could
enable them to understand science concepts and learn new science concepts
meaningfully. Furthermore, exploration could be used in a variety of formats such as
practical techniques, investigations, training skills, and teacher demonstration in order
to promote discussion about phenomena as well as to raise questions and generate
problem-solving activities. According to Watson (2000), exploration phase seem to
have the following uses:
•
encourage accurate observation and description;
•
make phenomena more real;
•
arouse and maintain interest; and
•
promote a logical and reasoning method of thought (p. 58).
The researcher’s idea was to include some of the mentioned ideas in preparing lessons
by using concept mapping as a tool for exploration activities. Turning to the diagnosing
phase, now during this phase teachers are supposed to: evoke learners’ expressions of
their personal science conceptions; assess learners understanding of science concepts
on how they view alternative conceptions to being reasonable; select strategy that
24
brings misconceptions to front as well as to guide learners to search for more accurate
explanations (Piaget, 1985; Shope & Chapman, 2001). It is, thus important to provide
opportunities to learners in order for them to become aware of their alternative science
conceptions and their hypothetical nature of their beliefs and presuppositions (Piaget,
1985; Vosniadou, Ioannides, Dimitrakopoulou, & Papademetriou, 2001). It is,
therefore, important for science teachers to be able to: plan their instructions; sequence
science activities in such a way that new knowledge is more easily built on previous
learning; use strategies that aim to help learners restructure their scientific
understanding (Morrison & Lederman, 2003). Thus, it is important to accommodate
these ideas by using concept mapping in order to diagnose learners’ prior science
conceptions that are not in alignment with accepted scientific beliefs. However, the
present study did not accommodate this phase as the purpose of the study was to
investigate the teachers’ understanding of concept mapping and use of concept
mapping in teaching science content.
In the designing phase, learners design strategies and procedures for collecting data to
investigate science related problem in order to test strength or weakness of a proposed
explanation in both its explanatory and predictive value (Novak, Mintzes, &
Wandersee, 2000). The designing phase involves learners in activities that could
enhance their conceptual understanding as they discuss procedures as designed to be
followed in their investigation process (Hinrichsen, Jarrett, & Peixotto, 1999).
Therefore, such activities provide learners with opportunities to explore the
phenomenon in new ways. During such activities, learners could be able to identify and
explain why certain variables were selected and controlled. Designing activities also
25
seem able to provide room for learners to explain why certain materials were used or
why one approach was favoured over another, as well as describe constraints they
encountered in the design of the investigation activities. Designing activities also allow
learners to analyse gathered data and how they could be used in explaining the
definitions and existence of some science concepts. Thus, concept mapping seems to
offer such opportunities to teachers and it was constructively used in designing
classroom activities for the present study.
In the discussion phase, learners are involved in discussions, both in small groups and
whole class situations. Discussion provides the means by which learners become more
aware of their own - and other learners’ ideas and understandings (Hewson, 1996;
Hewson, 1996; Westbrook & Rogers, 1996). Discussion sessions, generally make
various demands on learners such as the need to listen to, construct the meaning of, and
evaluate another point of view. Learners seem to build meaningful understanding
through discussion and it is also through discussions that learners shape their existing
cognitive structures to accommodate new ideas after being confronted with different
viewpoints that enable them to apply such understandings to other event in a
meaningful manner (Scott, Asoko, & Driver, 1992; Vosniadou, Ioannides,
Dimitrakopoulou & Papademetriou, 2001). However, one has to keep in mind that not
all discussions are fruitful. Some may have little or no effect on learners’ thinking if not
arranged appropriately (Scott et al., 1992; Westbrook & Rogers, 1996). Teachers,
therefore, need to be responsive to the ideas and understanding of the learners to enable
them to learn new concepts, which could be achieved by using different approaches
such as the concept mapping provide opportunities for class discussions.
26
In the using phase, any approach to teaching and learning science needs to consider the
nature of the knowledge to be taught. Literature in the field of science emphasises that
scientific practices cannot be characterised in a simplistic, unitary way, i.e. there is no
single nature of science (Millar et al., 1993). For example, it is important in science
education to appreciate that scientific knowledge is symbolic in nature and is socially
negotiated by both teachers and learners together. Therefore, the best way considering
learners’ new knowledge in science instructions, is to expose learners to natural
phenomena in order to enable them to interpret nature (Millar et al., 1993). Therefore, it
becomes a need for science teachers to provide opportunities to their leaners that would
allow them to encounter science phenomena that could initiate impressions and activate
curiosity (Carey, 2000; Millar, Driver, & Leach, 1993). Carey (2000) states that:
“teachers and science educators should be made aware of the important and
perhaps surprising consequences of looking at the problem of science education
in terms of conceptual change. For example, I have often heard teachers and
science educators blame students’ misconceptions on faulty education to the
earlier stage in the curriculum. Rather, student misconceptions are inevitable.
Not having the target concepts is not an undesirable stage in students but an
absolutely necessary one. Indeed, students will construct intermediate steps and
misconceptions that do not conform to the views of developed science, and
educators should recognize when these steps constitute progress not problems”
(p. 15).
In short, the model provides a guiding tool which science teachers could use in
designing constructive learning cycles. Scott, Asoko, and Driver (1992) defined six
stages of pedagogical strategy in teaching science concepts and theoretical learning for
conceptual change:
27
•
preparation: the teaching process which precedes the intervention, and which may
contain tools and concepts that may be drawn on;
•
initiation: an open-ended problem is posed;
•
performance: this comprises all or part of the following sequence: formulating
questions or hypotheses; planning and performing experiments; making
observations; theoretical discussions; formulating findings;
•
discussion of findings: in a class forum;
•
comparison with science: class findings are compared with similar historical
theories or modern ideas. Differences are stated and possible reasons for those
differences are discussed; and
•
reflection: students are encouraged to look back on the performance process and to
consider particular questions or difficulties which arose (pp. 317 – 318).
It is, however, not only teachers who have roles to play in teaching science for
conceptual change. Learners also have a role. They must be convinced that the goal of
learning is to understand the topic under consideration (Zoldosova & Prokop, 2006).
2.3
Science teaching for conceptual understanding
According to Mbano (2004), conceptual understanding is the “ability to transfer and
understand ideas in science which are based on facts, laws, principles and basic
scientific concepts such as energy, matter, solubility and photosynthesis, and tools used
in the process of a scientific investigation” (p. 105). This process is a connection
between science concepts in everyday life and connections between different science
28
concepts in a discipline. American National Assessment of Educational Progress
(NAEP) (2005) defines conceptual understanding as “a suggestion of what students
should learn … and be assessed on … how to apply efficiency in the design and
execution of scientific investigations and in practical reasoning” (p. 16). Learners need
to develop the scientific skills crucial for them to be able to think critically and reason
scientifically when conducting an investigation (Osborne, Erduran, & Simon, 2004).
Such activities should allow learners to shift from error-laden but personally relevant
conceptions, toward broader, deeper, and more coherent conceptions of scientific
phenomena (Hewson, 1992; Strike & Posner, 1992; Tobin, 1993). The mastery of basic
science concepts can best be demonstrated by a learner’s ability to use information to
conduct a scientific investigation, or to engage in practical reasoning (NAEP, 2005).
Some areas of conceptual understanding which are regarded as optimal and essential in
the science assessment measures of science concepts involve a variety of forms of
information, according to NAEP (2005), these are:
•
facts and events learned from science instruction and through experiences with the
natural environment;
•
scientific concepts, principles, laws, and theories that scientists use to explain and
predict observations of the natural world;
•
information about procedures for conducting scientific inquiries;
•
procedures for the application of scientific knowledge in the engagement of
practical tasks;
•
procedures about the nature, history, and philosophy of science; and
•
types of interaction between and among science, technology and society (p. 34).
29
For these reasons, the goal of school science is to engender conceptual understanding.
Learners should therefore acquire information in ways that enable efficient application
in the design and execution of scientific investigations and in practical reasoning; and it
is acknowledged that the emphasis should be shifted from the richness of experience to
a reasonable scientific interpretation of observations. This should be done in
accordance with how well reasoned an interpretation learners present, and not whether
it reflects the most sophisticated scientific reasoning (NAEP, 2005).
Conceptual understanding addresses teaching challenges such as, how to help learners
to advance in science concepts. In fact, teaching science for conceptual understanding
creates an innovative approach in learners. According to Hewson (1992), an innovative
approach helps learners to use constructivist learning theory to respond to various
misconceptions which can be difficult to change. Teaching science for conceptual
understanding should increasingly be concerned with the congruence of learners’
interpretations. If conceptual understanding is developed maximally, learners
understanding could shift from alternative to accepted scientific interpretations, as well
as to the sophisticated reasoning where learners could progress from observations of
the natural world to more and deeper explanations and predictions of science
phenomena. In a similar view, Costu, Ayas, Niaz, Ünal, and Calik (2007) conducted
research in Turkey and Venezuela, and found that learners lacked conceptual
understanding in science education. This study shows that learners struggled to become
active participants in the learning context, assuming instead a more passive state of
being “an empty cup that needs to be filled” (Costu, Ayas, Niaz, Ünal, & Calik, 2007,
30
p. 525). Therefore, incorporation of applications when learning science concepts is
relevant to learners’ daily lives (Haney, Czerniak, & Lumpe, 1996).
Moreover, science teachers themselves should understand the science concepts being
investigated in order to assist learners through the process of conceptual understanding
(Perkins, 1993). This conforms to Haney, Czerniak, and Lumpe (1996) views who state
that science teachers should teach the concepts needed for the higher order thinking
capacity and processing skills that foster conceptual understanding amongst the
learners.
2.4
Uses and importance of a concept mapping in science teaching
The most common uses of concept maps fall under three basic categories, namely:
brainstorming, study aid and instructional tool. Brainstorming supports the importance
of generating ideas (Prediger, 2008). For example, the teacher will use flash cards
(various sizes) written concepts such as solid, liquid, gas, wood and water. Some cards
contain linking words such as is a type of and has a property of. Then learners will be
asked to place them in a meaningful order. The study aid facilitates the effectiveness of
newly taught concepts and leads itself to reflective thinking (Young, 2009). For
example, the teacher will check how learners categorised concepts for clear
explanation. It helps learners’ discovery of the meaningful relationship among concepts
and connections between concepts, rather than memorisation of facts. The instructional
tool serves as visual aid to demonstrate complex relationships and to assess learners’
understanding of concepts (Safdar et al., 2012).
31
Elhelou (1997) conducted a study on the use of concept mapping in learning science
with Arab learners. The study found that Arab learners in the experimental class
achieved better results than those of the control class. Elhelou (1997) also revealed that
concept mapping is more flexible to use and it allows teachers to express their subjects’
knowledge boarder and present topics in a simplicity way (Rollnick, Mundalamo, &
Booth, 2012; Wilson, 1996). A study conducted by Cantú et al. (2004) found that
concept mapping allows learners and teachers to engage in extended science
discourses, organise and structure their subjects’ knowledge.
2.5
Science pedagogy in relation to scientific concepts
According to Duit and Treagust (1998), science pedagogy involves a systematic
presentation of science facts, ideas, skills, and techniques which are used by learners in
their daily lives. Generally, people learn new knowledge through investigation and the
use of appropriate cultural tools such as semiotics, graphs, pictures and symbols. In this
way the process stimulates a way of synthesising, comparing new discoveries with
existing knowledge, and predicting how things will behave in the universe (HartmannPetersen, Gerrans, & Hartmann-Petersen, 2004). Therefore, using concept mapping
properly in science pedagogy could create opportunities for learners to assimilate and
accommodate science concepts.
32
2.6
Exposing learners to scientific concepts
Science is observed and experienced in everyday life and scientific knowledge and
skills are, therefore, required in order to scientifically discover and explore the natural
phenomena. It is through exposure to the natural environment that learners acquire
knowledge and skills of the natural environment. In fact, learners’ knowledge of the
natural environment start to increase alongside increased exposure to natural
environment. Eshach and Fried (2005) are of the assumption that there is a need to
expose children to natural environment. They further reasoned that:
•
children naturally enjoy observing and thinking about nature;
•
exposing learners to science develops positive attitudes towards science;
•
early exposure to scientific phenomena leads to better understanding of scientific
concepts later studied in a formal way;
•
the use of informed scientific language at an early age influences the eventual
development of scientific concepts;
•
children can understand scientific concepts and reason scientifically; and
•
science is an efficient means for developing scientific thinking (p. 319).
The advantages lie not only in the exposure of learners to the natural world, but also in
the exposure to a world constructed by human beings, in which learners observe many
objects of fascination and objects to which they apply their scientific understanding.
Such information leads to the formation of deep reservoirs of science materials which
may gradually become organised into adequate science concepts (Lee, 1992).
Furthermore, Lee (1992) argues that children may be in danger of losing interest and a
33
sense of speculation and, in order to avoid this, science teachers are required to nourish
learners and expose them to teaching and learning environment in which they would
better understand scientific concepts. Thus, exploration of science activities could be
used in order to guide learners to the eventual formation of scientific concepts (Galili &
Hazan, 2000; Eshach & Fried, 2005).
As alluded above, exploration activities are important in science teaching. Concept
mapping could be used as teaching and learning tool in order to expose learners to the
natural environment where science is observed and experienced in our daily life.
Concept mapping could be used to expose learners to a variety of science concepts as
observed and identified in the natural environment. Such activities could allow learners
to observe, identify and categories things as is they are in the natural environment.
Therefore, the use of concept mapping during class activities could open doors for
learners to be equipped with a sense of speculation (So, 2003). In other words,
exposing learners to science concepts at an early age may enhance their motivation,
further their natural interest and instil positive attitudes towards science.
2.7
Teaching science concepts for conceptual understanding
Conceptual understanding is a sensible word to use, and is described in reference to
how teachers and learners settle in handling scientific knowledge (Biddulph &
Osborne, 1984). For example, learners normally change their conceptual understanding
through reflection by using a variety of strategies including concept mapping
(Mwakapenda, 2004). For example, in science teaching, the role of science teachers is
34
to work alongside learners in order to re-shape, expand, apply, and build on what
learners already know (Wang & Lin, 2008). It becomes important for science teachers
to play a pivotal role in teaching science concepts in order to mediate and transform
learners’ conceptual understanding. Wang and Lin (2008) outline the following as the
critical roles of science teachers in the transformation of learners’ understanding of
science concepts. These are:
•
to help learners to understand the basic principles, concepts, and theories of science;
•
to help learners to understand the nature of science;
•
to provide learners with the process of learning scientific concepts and researching
skills within all the science disciplines;
•
to promote an open-minded, rigorous attitude towards science in learners;
•
to help learners to understand the inter-relationship between all science related
disciplines; and
•
to demonstrate applications of science and technology in daily life and society (pp.
462 – 463).
There is, therefore, need for teachers to collaborate in developing scientific
understanding, thus, assisting learners to construct their understanding of science
concepts. Science teachers should, hence, first understand how to best support and
encourage learners in learning science before learners engage in such activities
(Crawford, 2007). Teachers should facilitate learning by providing opportunities which
encourages learners to interact with each other and – which would be effective in
promoting conceptual understanding in science (Costu et al., 2007). Science teachers
should, therefore, assist learners to explore and make sense of science concepts thereby
35
forming a network that transforms learners’ knowledge, skills and ideas within, and
across, all disciplines of science pedagogy (Davis, 2003).
On the other hand, science teachers should keep in mind that ‘conceptual
understanding’ is demonstrated when learners create their own relational structures that
reflect upon the taught science concept and refers to the changes in thinking that result
from discussing ideas in a science context (Prawat, 1996). Moreover, several studies
(Guba & Lincoln, 1989; Lincoln & Guba, 1985; Osborne, 1996; Wang & Lin, 2008)
describe the wider sets of teaching practices which are likely to promote learners’
understanding of science concepts. One such strategy that could be used to explore
learners’ conceptual understanding in science teaching is the concept mapping stategy.
Concept mapping has the power to visualize and transform science concepts in an
understandable manner as well as making science concepts more accessible to learners
(Roth, 1995). Therefore, concept mapping seem to be the tool that could be used in
teaching and learning environment to promote classroom discussions as well as to
enhance learners’ learning of science concepts (Mwakapenda, 2004).
2.8
Conclusions
This chapter presented a review of the literature on the theoretical framework by
Ausubel’s Assimilation Theory (AAT) of cognitive and meaningful learning,
Conceptual Change Framework (CCF) and ED3U models for conceptual understanding,
science teaching for conceptual change; science teaching for conceptual change, uses
and importance of concept mapping, science pedagogy in relation to scientific
36
concepts, importance of exposing learners to scientific concepts, and teaching science
concepts for conceptual understanding. The literature discusses the importance of
concept mapping and its application in science teaching in enhancing learners’
conceptual understanding as compared to traditional teaching methods of rote learning.
The next chapter will discuss the research methodologies and procedures used to
collect data for the current study.
37
CHAPTER THREE
METHODOLOGY
3.1
Introduction
This chapter provides a brief description of methods and procedures used and followed
to collect data in this study as well as strategies used in analysing data such as the
research design, population and sample, sampling procedure, research instruments, data
collection procedure, data analysis and research ethics.
3.2
Research design
Research design is a plan or the structure that researchers use during investigation
(McMillan & Schumacher, 1989; 2010) in order to facilitate the most valid and
accurate possible answers to research questions. In this study, both the qualitative and
quantitative research methods were used.
Qualitative approach was used to collect primarily descriptive narrative as well as to
probe deeply and gain a clear understanding of “matter and its properties” during
investigations (Gay, Mills, & Airasian, 2011). In this regard, a case study design was
used to explore science teachers’ understanding of concept mapping teaching strategy.
According to Creswell (2012), a case study research is “an in-depth exploration of a
bounded system (e.g., activity, event, process or individuals) based on extensive data
collection” (p. 465). In addition, a case study involves the conceptualization of a
38
research problem, the investigation, interpretation of findings and their application in
the world beyond the study (Cohen, Manion, & Morrison, 2007; Leedy & Ormrod,
2005).
In this study, the researcher employed a case study because he wanted to explore indepth how Grade six Natural Science teachers understand and use concept mapping as
a strategy for meaningful teaching and learning of science concepts. As a case study,
the data collected from each school were presented and analysed as a single case study.
Then, the results were compared and discussed as a multiple case studies in terms of
learners’ outcomes (McMillan & Schumacher, 2010).
A case study is a strategy of inquiry in which the researcher explores in depth about a
program, event, activity and/or process of one or more individuals (Creswell, 2007). A
case study design was appropriate to use here because the research was conducted at
two schools to gather information about the teachers’ understanding of concept
mapping as well as to understand opinions about concept mapping (Cohen, Manion, &
Morrison, 2002).
Case study has advantages and disadvantages. The advantages of a case study among
others are that: it is able to deal with a variety of evidence collected from documents,
interviews and observations; it observes effects in real context, recognising that context
as a powerful determinant of both causes and effects; and it also allows a lot of detail to
be collected and produce richer and greater depth that would not normally be easily
39
obtained by other research and/or experimental designs (Cohen et al. 2007; Creswell,
2004).
However, there are some disadvantages as noted by Denzin and Lincoln (2000).
Researchers should watch on being subjective or being bias in gathering and analysing
data. For example, researcher might push their viewpoints on data in the way they think
that the data might mean and by so doing they do not actually let the data talk to them
freely. Therefore, it is important for researchers to guard against potential biasness and
limit their biasness in order to ensure the essence of live experiences of the participants
and be able to capture such experiences as portrayed in natural settings (Lincoln &
Guba, 1994).
The researcher was aware of not being involved in biasness activities and not being
subjective during the research process. Therefore, he also constantly remained objective
during the data collection and data analysis processes. The researcher was an active
participant during data collection, particularly in the teaching process in order to get
involved with the learners physically, collect the desired and reality data, and to avoid
the outsiders who might contaminate the data and influence the expected outcomes.
Being an active participant, the researcher presented the lessons on “matter and its
properties” to both schools using traditional lecture and concept mapping methods;
actively involved with learners in teaching and learning process while observing their
participations; administered and marked learners’ pre-test and post-test; captured and
documented teachers and schools’ background information; and took field notes during
the interviews with teachers. For validity purpose, the researcher did cross-checking of
40
many of his doubts, prejudices and expectations (Rajendran, 2001) to avoid personal
influence and biases in the study. In addition, the researcher used the research assistant
to help him during data collection process.
A research assistant seemed to be an ambitious and self-motivated young lady who
completed her Grade 12 in 2011. She is currently upgrading her results in Mathematics
and Biology through the Namibia College of Open Learning (NAMCOL). She did
computer literacy in school from Grade 8 and she is 22 years old. Due to her
background knowledge of technology, it only took the researcher two days to train her
on how to operate the video recorder and capture quality video pictures during the
entire treatment period at both schools. The assistant was trained for two days by
focusing on class activities that took place during instruction and she needed strongly
avoid being tempted to focus on unnecessary events rather than the main aim of
instruction.
A quantitative research approach in particular, quasi-experimental was used to collect
numerical data (Creswell, 2012; 2014) and to find out whether concept mapping could
be used to enhance learners’ understanding or not. The two variables that were studied
in quantitative approach were the traditional lecture and the concept mapping
strategies. Quasi-experimental design is a design that does not meet all requirements
necessary for controlling influences of irrelevant variables (Moore, 2008). According to
Gay, Mills and Airasian (2011), a quasi-experiment is an empirical study that is used to
estimate the causal impact of an intervention on its target population. Quasi-experiment
also allowed the researcher to control the assignment to the treatment condition using
41
some criterion other than random assignment (Creswell, 2012, Moore, 2008). In quasiexperimental design, the researcher assigns two selected groups (experimental and
control), administer a pre-test to both groups, conducts experimental treatment
activities with experimental group only, and then administers a post-test to both groups
to assess the differences between the two groups (Cohen et al. 2007; Creswell, 2012).
Therefore, this study is a quasi-experimental in nature because it assessed the uses of
concept mapping in improving learners’ understanding of science concepts as
compared to traditional method of teaching. Learners at Omega Primary School were
exposed to treatment (concept mapping) whereas learners at Alpha Primary School
were given a normal teaching (traditional lecture). In short, this study administered pretests (at both schools), conduct a treatment (at one school), then post-tests (at both
schools). Thereafter, the differences of means scores between the two groups of
learners were determined.
Quasi-experimental design has advantages and disadvantages. The advantages are that:
it is a valuable tool that the researcher has control over assignment to treatment
condition; it does not allow anyone to make final causal link between the treatment
condition and observed outcomes; it can also provide necessary and valuable
information that cannot be obtained by other experimental methods alone; and it
minimises the threats to external validity as the natural environments do not suffer the
same problems of artificiality as compared to a well-controlled setting (Creswell, 2012;
Moore, 2008; Over, 2011). The disadvantages are that: it lacks the element of random
assignment of participants to treatment or control group and this may allow the study to
42
be more feasible, but this also poses many challenges for the researcher in terms of
internal validity that might provide weaker evidence; and due to lack of randomness, it
brought less useful information to the study because it narrows the results and therefore
it gives a poor representation of the population as a whole (Creswell, 2012; Moore,
2008; Over, 2011).
3.3
Population and sample
A purposeful sampling was used to select the participants. Cohen, Manion, and
Morrison (2007) state that purposeful sampling “is used in order to access
knowledgeable people who have in-depth knowledge about particular issues…” (p.
115). They concur with Creswell (2012) who says in purposeful sampling, the
“researcher intentionally selects individuals and sites to learn or understand the central
phenomenon” (p. 206). Three schools were used from the population of 45 public
primary schools in the Khomas Educational Region. One of the three schools was used
for piloting instruments whilst the other two schools were used in order to collect data
for the main study. At each school, one teacher participated in the study; that means,
one Grade six Natural Science teacher with his class that he was teaching was selected
for the study. The targeted schools were given pseudonym names as Alpha Primary
School and Omega Primary School with a class of 33 and 37 learners respectively. In
the same vain, the piloting school was also given a pseudonym name as Middle-Class
Primary School with 31 learners.
43
3.3.1 Schools’ profiles
3.3.1.1
Alpha Primary School
Alpha Primary School is an old school that was established during the apartheid era in
early 1969 and it is about 44 years old at the time of data collection. There are 38
teachers altogether including the principal and four Heads of Department
(HODs).There are approximately 1005 learners, with close to 27 classrooms ranging
from Pre-primary to Grade seven. In addition to the teaching staff, there are two
secretaries and four institutional workers. Figure 3.1 below portrays Alpha Primary
School.
Figure 3.1: Alpha Primary School as seen from outside
Unfortunately, the school does not have a science laboratory or science kits /
equipments to enable learners do science practical work but it has a library and
computer laboratory. Besides Internet as a source of information, each learner was in
possession of Natural Science textbook as a teaching aid.
44
3.3.1.2
Omega Primary School
Omega Primary School one of the oldest school in the country that was established in
early 1956. It is about 56 years old at the time of data collection. There are 25 teachers
altogether including the principal and two HODs and about 635 learners, with close to
25 classrooms including three storerooms. Classrooms ranged from Pre-primary to
Grade seven. In addition to the teaching staff, there is one secretary and two
institutional workers. Omega Primary School is allocated in the same circuit with
Alpha Primary School. Figure 3.2 below portrays Omega Primary School.
Figure 3.2: Omega Primary School as seen from outside
Omega Primary School is an old school but it still does not have a science laboratory.
However, the school only has a science kit that it received from the Ministry of
Education to enable learners do science practical work. The science kit consisted of
equipments such as blue litmus papers; battery holders; wood cuboids; metal cuboids;
rubber bands; magnification glass; magnet; full circuit equipment. Apart from the
45
science kit, the school has a library and computer laboratory. Computers at Omega
Primary School are also connected to the Internet to allow some teachers and learners
to access relevant science information. Each learner had a Natural Science textbook as
another source of information and teaching aid.
According to the National Standardise Achievement Tests’ (NSATs) report of 2009,
2011 and 2013 in English in Namibia primary schools, Mathematics and Natural
Science, learners at Omega Primary School always perform higher than Alpha Primary
School learners (Ministry of Education, 2013).
3.3.1.3
Middle-Class Primary School
Middle-Class Primary School is a new school that was established after independence
in mid 2001. The school opened its doors with Grade one, two and three only. In 2002,
Grades four to Grade six were introduced while Grade seven was commenced in 2003.
In 2004, the school had only a principal, two HODs, one secretary and three
institutional workers. Now there are 46 teachers altogether including the principal and
four Heads of Department (HODs) and approximately 1545 learners. It has close to 35
classrooms ranging from Pre-primary to Grade seven. In addition to the teaching staff,
there are presently two secretaries, four institutional workers and one computer
technician who is also a computer instructor. Middle-Class Primary School is also
allocated in the same circuit with Alpha Primary School and Omega Primary School.
Figure 3.3 below portrays Middle-Class Primary School.
46
Figure 3.3: Middle-Class Primary School as seen from outside
Unfortunately, Middle-Class Primary School does not have a science laboratory and
enough Natural Science textbooks as another source of information and teaching aid
but fortunately it has a library and computer laboratory. Computers in the laboratory
are not connected to the Internet but only the computers in the staffroom that used by
the teachers. Some teachers use Internet to access relevant science information. The
secretaries’ computers were also connected to the Internet.
3.3.2 Teachers’ profiles
As described under the section on population, the sample consisted of two primary
school science teachers for the main study and one primary school science teacher for
the piloting school. The researcher used pseudonym names in order to protect the
teachers.
47
3.3.2.1
Teacher 1: Mr Golden
Mr Golden is 30 years old. He is a qualified teacher and holds a Basic Education
Teachers Diploma (BETD) of former colleges of education in Namibia. He taught for
approximately six years at Alpha Primary school. He is has been teaching Natural
Science to Grade six at Alpha Primary School since 2009. In addition to Natural
Science, Mr Golden is also teaching Mathematics to Grade six, both which are
promotion subjects.
Mr Golden appears to be an open-minded person when it comes to discussions. During
our interview, he told me that he prefers to teach in a learner-centred arranged
classroom that allows him to interact easily with learners during the teaching process.
My first day entering in Mr Golden’s class, he was teaching learners Natural Science
using teacher-centred approach.
3.3.2.2
Teacher 2: Mr Silveren
Mr Silveren is 33 years old. He is a qualified teacher and holds a Basic Education
Teachers Diploma (BETD) and Advanced Certificate in Education (ACE). Mr Silveren
obtained his first diploma from the same college of education where Mr Golden was
trained and Mr Silveren taught for approximately eight years at Omega Primary School.
He has been teaching Natural Science to Grade six at Omega Primary School since
2008. In addition to Natural Science, Mr Silveren is also teaching Social Studies to
Grade six, both subjects are promotion subjects.
48
Mr Silveren is a friendly and broad-minded teacher who seems not to tolerate nonsense
when it comes to learners’ discipline. Mr Silveren was using teacher-centred method
besides his classroom’s arrangements that portray learner-centred.
3.3.2.3
Teacher 3: Ms Bronzen
Ms Bronzen is 37 years old. She is a qualified teacher and holds two teaching
diplomas: a Basic Education Teachers Diploma (BETD) and Diploma in Education
from the former colleges of education in Namibia and Belveder Technical Teachers’
College in Zimbabwe respectively. She has approximately ten years of teaching
experience and she taught about five years at Middle-Class Primary school. She has
been a science teacher and she has been teaching Natural Science to Grade six at
Middle-Class Primary School since 2009. In addition to Natural Science, Ms Bronzen
is also teaching Mathematics to Grade five and seven and both subjects are promotion
subjects.
Ms Bronzen is a bit tall with a skinny body and a friendly lady. In addition, Ms
Bronzen appears to be an out-spoken and open-minded person when it comes to
discussions and she seems not to tolerate undisciplined learners. During our interview,
she articulated to me that she taught her classes using both learner-centred and teachercentred approaches. Apparently, her teaching approach depends merely on the topic
that she teaches and the number of learners in the classes. Like Mr Silveren, Ms
Bronzen was using the teacher-centred approach besides her classroom’s arrangements
that portray learner-centred arrangement.
49
3.4
Sampling procedure
The researcher used the following criteria to select the schools and teachers: (a) the
schools must not be adjacent to one another in order to reduce the possibilities of
learners communicating to one another about how the teacher is instructing them and,
thus, contamination of data; (b) the schools must be in the same circuit within the
selected educational region; and be kept confidential in order to keep the homogeneity
of the groups as far as possible as well as to prevent teachers and learners to
communicate to one another for consistency purposefully; (c) the schools must have
internet connections to enable teachers to access information as part of teaching aids
and must have a resourced library; and (d) teachers must have at least five years
teaching experience.
Permission to conduct this study at the two schools was sought and granted by the
Ministry of Education and the two schools’ principals. After having been granted
permission, the researcher approached the two Natural Science teachers and explained
to them the purpose of the study and procedures involved. After the teachers’
expression of their willingness to participate, the researcher was shown the classes,
given the timetables, textbooks and syllabuses. Thereafter, the timeframe for the
interviews, teaching practices and administering of tests were arranged
50
3.5
Research instruments
The researcher used the pre-test and post-test, interviews and video recorder to collect
data. Multiple research instruments are, generally, considered to be superior as multiple
instruments allow for data triangulation. They are more likely to capture complex,
multifaceted aspects information during investigations (Kagan, 1990). Triangulation is
a technique that attempts to arrive at the same findings by using at least independent
different research instruments or multiple case studies. In addition, triangulation tends
to improve trustworthiness of the research findings (Schwandt, 2007). The researcher
used triangulation to ensure validity and reliability of the data obtained through the
tests and interviews questions. These questions were similar in intent, structure and
format but yielded different results. The researcher also used triangulation to re-play
back the video recorder and re-read again the tests’ scripts as much as possible to look
for commonalities and differences within the collected data in the two case studies of
Alpha Primary School and Omega Primary School.
3.5.1 Pre- and post-tests
The pre-test and post-test were used to collect data from the learners in order to assess
their understanding of science concepts on “matter and its properties” after being
exposed to science content by using two different teaching strategies, namely the
traditional lecture and the concept mapping teaching strategies. The tests were used to
collect data as an indirect method of finding out about the use of the concept mapping
teaching strategy in teaching and learning science concepts. Learners were given a pre51
test, followed by treatment lectures for about two weeks, followed by a post-test. Table
1 below shows the scheme of work for twelve days that the researcher spent at the two
main schools during data collection. This scheme of work was adapted from the one
that the researcher used at the piloting school except the date change.
Table 1: Scheme of work for twelve days spent during data collection
SCHEME OF WORK
Day 1
28.09.13
Day 5
02.10.13
Day 4
01.10.13
Day 3
30.09.13
Day 2
29.09.13
52
•
Lesson 4: Explained and discussed matter and its
properties in terms of concepts such as evaporation,
condensation, freezing point (0°C), melting and
boiling point (100°C).
Analyse everyday materials in their local environment to establish properties
and uses of the materials.
Collect and classify different types of plastic, paper, glass, wood, fabric and
metal.
Identify and compare properties (such as hardness, texture, colour, lustre,
flexibility, smell, brittleness and malleability) of paper, glass, cotton, plastic,
wood, and metal.
Lesson 2: Introduced “matter and properties” to the
learners and its states/phases: solid, liquid and gas
and gave practical examples to each state/phase by
making use of everyday materials like wood, water,
balloon, smoke, ice cubes, stones, perfume bottle
etc.
Lesson 3: Explained and compared the properties of
matter in terms of particles and discussed the uses of
local materials used.
•
•
Subject: Natural Science
Grade: 6
Theme: Matter
Topics: Properties of matter
Date
Basic Competencies
Researcher introduced himself and explained the
purpose of the study to the participants and gave
them an informed consent forms to sign as an
agreement. The researcher received the timetables
and teaching materials such as syllabi and textbooks.
He arranged the day and time for interviews and he
also informed the learners about the pre-test,
treatments and post-tests.
Lesson 1: Conducted the interviews with teachers
and administered the pre-tests to the learners.
Day 6
03.10.13
Day 7
04.10.13
Day 8
07.10.13
Day 9
08.10.13
Day 10
09.10.13
Day 11
10.10.13
Day 12
11.10.13
Lesson 5: Explained and discussed matter and its
properties in terms of concepts such as steam, water
vapour, deposition, sublimation, energy absorbed
and energy released.
Lesson 6: Differentiated between physical change
and chemical change in terms of matter and its
properties and provided examples to each type of
change.
Lesson 7: Used materials such as paper, glass,
plastic, wood and metal so that learners can identify
and compare the properties of matter in terms of
hardness, texture, colour, lustre, flexibility, smell,
brittleness and malleability.
Lesson 8: Learners wrote the summary on what is
matter, states/phases of matter and examples on
each, particles (drawings) of matter with
explanations and examples of each state/phase.
Lesson 9: Learners wrote the summary on concepts
such as melting, boiling, freezing, sublimation,
deposition, condensation, evaporation, physical
change and chemical change.
Lesson 10: Administered the pre-tests to the
learners.
Discussed the results of the pre-tests and post-tests
with the learners and thanked them for their
participations and immerse contributions.
A forty-four multiple choice questions and six structured questions for pre- and posttests were drafted and pilot tested at a school within the same educational circuit in
order to check the questions’ validity and reliability (Creswell, 2012; Gay, Mills, &
Airasian, 2009; Gay, et al., 2011). At the piloting school, the researcher administered a
pre-test to two classes, then taught “matter and its properties” to the two classes. The
researcher taught one class used traditional lecture method and concept mapping to
another class. After nine days of teaching, he administered a post-test to the learners.
53
The main reason behind piloting the study was to check the questions’ validity and the
piloting process took about two weeks to be completed. As a result, the pre-test item 2,
15 and 21 on multiple questions were found to be not well structured. On the pre-test
structured questions, there were no arrows indicated and learners found it hard to
understand what was expected from them. The researcher had to re-structure the
mentioned questions to enable them to collect the required data in the main study.
For the main study, half of the multiple choice questions were used for the pre-test and
another half of the drafted multiple choice questions were used for the post-test, that is,
22 questions for the pre-test and 22 questions for the post-test focused on evaporation,
condensation, boiling, deposition, steam, water, ice, sublimation, melting, freezing and
energy. The six structured questions contained 22 science concepts and these are
evaporation, condensation, boiling, deposition, steam, water, ice, sublimation, melting,
freezing and energy on “matter and its properties” and again half of the science
concepts were used for the pre-test and another half for the post-test. That means 11
science concepts (evaporation, condensation, boiling, deposition, steam, water, ice,
sublimation, melting, freezing and energy) were used for each test. The test questions
were structured in such a way that they focused on the same concept for both the preand post-test.
However, the pre-test and post-test questions were not exactly the same but both tested
learners on same science concepts about “matter and its properties”. Both multiple
choice and structured questions were compiled by the researcher based on “matter and
its properties”. Some pictures and sketches used in the questions were taken from the
54
Natural Science textbook and Internet. Table 2 below illustrates how the pre- and posttest items were set-up and spread across the eleven concepts.
Table 2: Pre- and post-test items spread across the concepts (A)
Concepts
Pre-test item
Post-test item
Evaporation
1
20
Condensation
9
12 & 17
Boiling
1&8
3, 7, 10, 18 & 21
Deposition
2
19
Steam
3, 5, 11, 18 & 20
1
Water
16
8
Ice
10, 12, 15, 19 & 21
6, 9 &16
Sublimation
7 & 22
22
Melting
6
11
Freezing
4 & 17
2&5
Energy
13 & 14
4, 13, 14 & 15
At both schools, the pre-tests and post-tests were administered in the classrooms where
the treatment took place. The pre-test was administered to learners at both schools at
the same time, on the same day. A researcher assistant invigilated at Alpha primary
school while the researcher invigilated at Omega primary school. Each test paper (preand post-test) consisted of two sections (multiple choice and structured questions) and
it took learners approximately 45 minutes to complete.
55
3.5.2 Interviews
The researcher used the semi-structured interview schedules to collect data from the
science teachers in order to determine their understanding of concept mapping in
teaching science. Cohen et al. (2007) define interview as “a two-person conversation
initiated by the interviewer for the specific purpose of obtaining research relevant
information” (p. 351). The purpose of such an interview is to allow researchers to
“enter into another person’s perspectives” (Patton, 2002, p. 341) with the view of
obtaining relevant information as seen from that particular person’s viewpoint.
The semi-structured interview schedules was used to conduct an individual face-to-face
interview (Creswell, 2003) with the selected science teachers with the purpose of
determining their understanding of the concept mapping teaching strategy. The
interview guide questions (See appendix 12) were first piloted before the main study.
During the piloting period, the researcher informed the participants about the purpose
of the study and sought their permission which was granted. Then, the teacherparticipant was interviewed to determine the validity of the questions. The interview
questions were found to be relevant and no amendment was done.
The interview guide consisted of five open-ended questions and it was conducted
within the first week of the study during break time with Mr Golden and after school
with Mr Silveren. Each teacher was interviewed once for 10-15 minutes. Due to the
sensitivity of the video recorder and to avoid outside distractions, the researcher
conducted interviews with the participants in their Heads of Department’s offices.
56
During the interviews, the researcher was handling the video recorder simply because
the research assistant was handling the pre-test process at Alpha Primary School. The
permissions to video record the interviews were given by the two participants.
3.5.3 A video recorder
A video recorder was used to capture the face-to-face interviews and the instructions/
teachings. The research assistant was trained by the researcher on how to operate the
video recorder. She was also oriented on how to capture quality video sounds and
pictures during the entire teaching practices at both schools. The research assistant was
trained for two days before piloting the interviews’ instrument.
A video recorder was used to capture the interviews sessions with the permission of the
teachers involved (Jorde, 2002). According to Jackson (2000) a video recorder allows
the researchers to “record the nonverbal behaviour of the participants” (p. 5).
To maintain validity and trustworthiness of the study, the researcher played and
listened to the whole video recordings many times to familiarise, validate and
comprehend what was said by the participants in the interview sessions. Thereafter, the
researcher transcribed the whole interview taking into consideration part of the
interview that had pauses and inaudible parts. The researcher managed to transcribe and
describe the interviews in detail so that the readers would “draw their own conclusions
from the data presented” (Leedy & Ormrod, 2005, p. 100).
57
3.5.4 Treatment
The treatment was offered in a way of instruction and focused on science concepts
about ‘matter and its properties’. Two types of lessons were prepared each day in
advance, one as a traditional lecture and another lesson that involved the use of concept
mapping. The traditional lectures were offered at Alpha Primary School while the
concept mapping lessons were offered at Omega Primary School. In this case, the
researcher presented lessons used concept mapping as treatment or an intervention
while traditional lecture method was used as a normal daily lecture. During the
treatment, learners were exposed to concept mapping on which they were taught and
wrote the summary using concept mapping and both lessons were offered over, about,
two weeks. Both groups were pre-tested and post-tested using the same test on both
occasions.
3.6
Data collection procedure
The data collection commenced immediately after permission was granted (approval)
from the Ministry of Education, principals, teachers and learners. Creswell (2012)
urges that “permission is often necessary before you can enter a site and collect data”
(p. 147). The participants were given the informed consent form to sign as an
agreement. Informed consent is defined by Cohen et al. (2007) as “the procedures in
which individuals choose whether or not to participate in an investigation” (p. 52). The
researcher made further arrangements concerning the teaching timetable, teaching
materials such as syllabus and textbooks including the day and time for the interviews.
58
Learners were also notified in advance when they were expected to write the pre- and
post-tests.
Firstly, teachers’ interviews were conducted a day before the teaching and
administration of the pre-test to learners. Secondly, the pre-test was administered to
learners at both schools at the same time, on the same day before starting with
instruction about ‘matter and its properties’. The researcher made use of the research
assistant who invigilated at one school while the researcher invigilated at another
school. Thirdly, ten lessons (one lesson per day) were conducted on science “matter
and its properties” for two weeks. Each lesson took approximately 45 minutes. As an
active participant, the researcher conducted the lessons at the two schools, that is, one
period of traditional lecture and a concept mapping lesson per day per school for two
weeks.
Fourthly, after the teaching was completed, the post-test was administered at both
schools at the same time. The data collection process took the researcher about two
weeks to finish. The twelve days of data collection included ten lessons (one lesson per
day and two days of administering the tests) both focused on “matter and its
properties”, one day of introduction and one day of discussing the practice and tests’
results (See Table 1).
59
3.7
Data analysis
Data analysis is a process of making sense and meanings of the raw data as well as
interpreting data (Cohen et al., 2007; Gay et al., 2009). Two types of data were
gathered, namely (i) qualitative data through interviews and (ii) quantitative data
through pre- and post-test.
3.7.1 Pre- and post-tests
The pre- and post-tests scores were analysed in order to determine the t-test value at
alpha level = 0.05. The data of both pre- and post-tests were analysed to find the mean
(M) scores and t-values the two groups (schools) separately. The p and t values were
determined on both scores (pre- and post-test) to determine differences between the
means of the two groups. The results were analysed per case site. Then the researcher
compared the two groups in terms of the outcomes of the results (McMillan &
Schumacher, 2010).
3.7.2 Interviews
The researcher transcribed the interviews verbatim and returned the transcribed papers
to the teachers to verify the written version of what they had said in order to establish
the trustworthiness of the data (Creswell, 2012). During the analysis process, the
researcher perused through all the transcripts and made notes on the interview
transcribed papers. The researcher read through the transcribed data carefully again and
60
again, line by line in order to code the data by labelling relevant words, phrases,
sentences, concepts and opinions before organising them into themes, then broke down
the themes into categories. Finally, the researcher synthesised and searched for patterns
of similarities and differences within the identified categories (Cohen et al., 2007).
3.8
Research ethics
The researcher sought permission to conduct the study from the Permanent Secretary
and the office of the Khomas Education Director, schools’ principals, teachers and
learners. The researcher explained the nature of the study to both parties and they were
ensured that the information provided was for study purposes only. The researcher also
obtained informed consent from the participants for further reference.
Furthermore, the participants were informed that their participation was a free will
exercise (Creswell, 2012). Participants’ personal information would be kept
confidential and no real names of the schools, teachers and learners would be used to
ensure that the dignity and integrity of the participants were protected (Gay et al.,
2011). Despite the photos inserted, the permission to take photos and publish them was
granted by the participants. The researcher maintained the well-being of the participants
and built trust between the participants him and. There were no risks foreseen,
unpleasant or damaging effects on the individual, the team and the setting (workplace)
involved. The participants were informed of the expected outcomes, and there was no
compensation involved during the study. Scherman (2007) states that “in any research
project the researcher has a responsibility not to act unethically” (p. 57).
61
3.9
Conclusions
In this chapter, the researcher explained the research designs, population, sample,
sampling procedures and research instrument used in the study. The background and
biographical information of the schools and teachers who were included in the study
were described in details. The data collection procedure was also discussed followed by
the data analysis and the research ethics. The next chapter presents the findings and
discussions of the study.
62
CHAPTER FOUR
RESULTS AND DISCUSSION
4.1
Introduction
This chapter is divided into two main sections in line with the research questions of the
study. The results are presented, analysed and discussed according to the two main
research questions as indicated above, starting with the first research question and then
the second question:
1. How do Grade six Natural Science teachers understand and use concept mapping?
2. Is there a significant difference between learners’ understanding on “matter and its
properties” taught through concept mapping as compared to the learners taught
through the traditional lecture method?
4.2
Research question one: How do Grade six Natural Science teachers
understand and use concept mapping?
In presenting the above research question, the researcher interviewed primary school
teachers who were teaching the Integrated Natural Science subject at two urban
schools. The interview consisted of five open-ended items in order to explore how
Natural Science teachers understand the concept mapping as a teaching method. The
interview schedule consisted of five open-ended items in order to explore the
understanding the concept mapping as a method of teaching by Natural Science
teachers. The five open-ended items of the interview schedule are as follows:
63
1. Have you ever come across the word “concept mapping”? If yes, when? What was
the concept map all about? In your own words, can you describe what a concept
map is all about?
2. Have you ever tried to make use of concept mapping in your teaching? If yes, what
content did you teach?
3. Can you describe to me how you use the concept mapping strategy during that
instruction?
4. To what extent did you use concept mapping strategy in teaching science? Is it
poor, adequate, good, very good or excellent?
5. Did your studies or professional development courses prepare you to teach using
concept mapping?
A total of two male teachers were interviewed one-to-one separately at a quiet place
during school hours during their free timeslots. Mr Golden taught at Alpha Primary
School and Mr Silveren taught at Omega Primary School in the Windhoek urban areas.
The results are presented as per teacher in order to provide answer to the main research
question one. The interview with Mr Golden went as follows:
Researcher:
Have you ever come across the word “concept mapping”?
Mr Golden:
Yes, I came across it.
Researcher:
When did you come across it?
Mr Golden:
When I was trained at the college.
Researcher:
What is a concept map about then? In your own words, can you describe
what a concept map is about?
64
Mr Golden:
Yes, my understanding of it… (pausing); let me take it the way I
understand it… It is a diagram, it is a diagram actually that’s made to
generate ideas… (pausing), generate different ideas. So, it has different
lines where you can fill in and obviously at the end you come up with
conclusion about the topic that you what to understand. Yes, the ideas
normally are… (pausing) the way I know it you generate ideas, for
example, from the learners that’s the ideas according to the topic. So,
different learners can come up with different ideas so you fit them on the
concept map”.
Researcher:
Have you ever tried to make use of concept maps in your teaching?
Mr Golden:
Yes, I did! Ok.
Researcher:
What content did you teach?
Mr Golden:
I used it… (Mr Golden paused) it on the characteristics of living
organisms, normally.
Researcher:
Can you describe to me how you used the concept map during that
instruction?
Mr Golden:
So, I grouped different characteristics of living organisms. But I also
used it in other topics… Yes, I tried some but I did not go in detail
maybe just a little bit. I never, actually tried to go into details. I only
used it more on that topic.
Researcher:
To what extent can you understand the concept map in teaching
science? Is it poor, adequate, good, very good or excellent?
Mr Golden:
Very good, let me say very good.
Researcher:
Did your studies or professional development prepare you on how to use
concept mapping during instructions?
Mr Golden:
I would say… the exposure was not that much… So, on certain topics,
but it was not that much.
Mr Golden seems to have a vague idea about what concept mapping is about and he
was unable to provide a clear description of a concept mapping although he
acknowledged that he was introduced to concept mapping as a method of instruction
65
during his college education where he was trained as a teacher. Mr Golden’s
description of concept mapping goes along with Novak and Canas (2008) definition of
concept mapping. However, Mr Golden mentioned that a concept map consists of
different lines that are completed during teaching. He does not seem to have a deeper
understanding of concept mapping. His description does not include any explanation of
the relationships that exists between science concepts in different science topics. He
seemed to have failed to provide relevant examples in order to illustrate some scientific
phenomena amongst certain science concepts or ideas (Prediger, 2008).
When Mr Golden was asked if he was using concept mapping during instruction, he
simply provided a science topic without relevant examples on how he used it during
instructions. Concept mapping is used in different ways such as to generate new ideas
about a particular science concept, to illustrate relationships amongst science concepts,
to visualize some abstract concepts in relation to an overegging science concept, to
promote meaning making amongst different science concepts including engaging
learners in constructive and transformative operations during learning and revising
previous concepts taught (Asan, 2007; Safar et al., 2012; Young, 2009; Wang & Lin,
2008). However, Mr Golden mentioned one of the functions of the concept mapping
strategy during instruction which is brain-storming in generating innovative ideas about
concepts under discussion (Pediger, 2008).
Furthermore, using the concept mapping strategy requires time from the side of the
teacher in order to pose constructive questions and to provide useful and relevant
answers. It helps the teacher to assess learners’ understandings and takes quick
66
decisions on whether the answers are correct or wrong as well as provides information
about what was correct. In addition, meaningful connections and relationships of
concepts are also important in teaching and needs to be considered when using concept
mapping. Teaching science for understanding is more important than teaching science
in a vacuum. It makes learners to understand science concepts better and get science
ideas more easily when taught through concept mapping than pure lectures (teachertalk) method. Therefore, concept mapping seems to be more encouraging and
recommendable in teaching science than the traditional lecture method. Moreover,
learners seemed to remember science concepts easier and in better way when teachers
use illustrative and visual teaching aids in stimulating their thinking (Asan, 2007;
Novak & Canas, 2008; Safdar et al., 2012). In Mr Golden’s case, he didn’t go extra
miles in his explanation on how he used concept mapping during instruction of living
organisms.
Mr Golden said that his exposure to the use of concept mapping at the college during
his studies was not that much. It appears that he was only introduced to how to use the
concept mapping on certain topics and not in details whilst at the college. If Mr Golden
happened to be properly and well trained on how to use concept mapping during his
career training, then he would have applied the concept mapping strategy in his daily
teaching. Although, Mr Golden was not well exposed to the use of concept mapping at
the college, he rated his understanding of concept mapping as “very good” though in a
hesitant manner. Mr Golden hardly defined a concept map and could not recall that he
was taught at the college on how to use a concept map at all. For Mr Golden to rate
himself high while he knew that he did not know much about concept mapping, it
67
remains uncertain as to whether he knows / understands concept mapping. It seems that
Mr Golden was trying to deceive and/or lie purposefully to the researcher by making
false assertions so that the researcher wouldn’t notice that he did not know much about
concept mapping. His rating also appeared to impress the researcher and not as to be
seen as unqualified, incompetent and unskilled teacher if he happened to be honest and
told the truth that he had no much idea about concept mapping or did not apply it in his
teachings after his graduation or training.
According to Okebukola and Jegede (1991), science teachers who received training and
practice session in concept mapping developed a favourable attitude towards the use of
concept mapping. The researcher’s opinion is that teachers who were trained and know
how to use concept mapping also tend to use it in their daily teaching and learning
process (Safdar, cited in Safdar et al., 2012).
The following section presents and discusses the interview with Mr Silveren, the
primary school teacher at Omega Primary School.
Researcher:
Have you ever come across the word “concept mapping”?
Mr Silveren: Concept map… (he paused then he said), aahh… never at all. Not even
to use it in my teaching. After a pause, Mr Silveren said: yes, concept
map… concept map… I use it (although the researcher was not sure that
he knew what he was saying).
Researcher:
When did you come across it?
Mr Silveren: Aahh… not remember.
Researcher:
What was the concept map about? In your own words, can you describe
what a concept map is about?
68
Mr Silveren: Concept map… Can you put it in… concept map, is it this… (illustrating
a diagram of the concept map in the air), no this one we are doing it.
Researcher:
Have you ever tried to make use of concept maps in your teaching?
Mr Silveren: Concept map…, that, that term… yes I did use it.
Researcher:
What content did you teach?
Mr Silveren:
I used it in solid, liquid and gas.
Researcher:
Can you describe to me how you use the concept map during that
lesson?
Mr Silveren: That concept… (he then stopped).
Researcher
To what extent can you say you understand concept map in teaching
science? Is it poor adequate, good, very good or excellent?
Mr Silveren: Very good, let me say very good… because nothing is excellent. (he
laughed) … very good to excellent (laughed sarcastically).
Researcher:
Did your studies or professional development courses prepare you on
how to use concept maps during instruction?
Mr Silveren: It was very excellent because they were preparing us at the very
experienced teachers.
Mr Silveren’s understanding of concept mapping was not clear. Simply because he
initially responded that he never came across concept mapping strategy and he was
unable to remember whether he used concept mapping in his teaching or not. When he
was asked to explain the term “concept mapping” in his own words, he struggled. He
was trying to get a clue from the researcher when he requested the researcher to put it
differently. In Mr Silveren’s case, he admitted that he never attempted to use concept
mapping in his teachings. One moment he also said that he never came across the term
“concept mapping” and on the other hand he proclaim to have used it in solid, liquid
and gas although he said it in a sarcastic manner. When he was asked to describe how
he used the concept mapping in teaching solid, liquid and gas, he didn’t even say a
69
word to respond to the question. Then later, he tried to explain what concept mapping
was, by illustrating it in the air and still he was not getting to its meaning. This implies
that Mr Silveren appears to have no knowledge and idea of what concept mapping was
about.
In addition to the above mentioned information, Mr Silveren rated himself high and to
be knowledgeable on how he understood and used concept mapping. He rated himself
as to being “very good” and even to the extent of “being excellent” as well, although he
seemed to have a vague understanding of what concept mapping is about. Mr Silveren
also said that he was well trained on how to use concept map and that he was prepared
to be a good teacher although he said that he never came across the term concept
mapping during his education. Mr Silveren said “it was very excellent because they
(lecturers) were preparing us”. Still, it remains unclear as to whether to conclude that
he was trained during his professional development career. Thus, it implies that he
seems neither to know nor to understand what concept mapping is about at all. The fact
that some studies at the college prepared him on how to use the concept mapping and
ending up not using it is another question on its own.
Mr Silveren’s lack of knowledge, ideas and understanding of concept mapping could be
seen as a result of not being introduced to the strategy or may be lack of interest in the
strategy or even having some difficulties in using the strategy in teaching. Mwakapenda
(2003) and Nyambe and Griffiths (2010) noted that lack of understanding is more likely
due to the fact that science teachers seem not to implement proper teaching strategies in
practice. It seems clearly that Mr Silveren lacked sufficient information and appears to
70
lack knowledge and understanding of concept mapping besides his self-proclaimed
knowledge.
Certainly, the literature argues that teachers should possess knowledge and understand
the teaching methods they use to facilitate meaningful learning (Ausubel, 1963; Safdar
et al., 2012). Meaningful learning takes place when the science teachers allow learners
to draw together concepts they learned in a resourceful and fundamental manner (Asan,
2007; Mwakapenda, 2003).
According to Carey (2000), teachers’ knowledge and understanding of teaching
strategies can only be gained through practice and professional development. Carey’s
views concur with Okebukola and Jegede (1991) who claim that teachers who received
a training and practice session in concept mapping developed a favourable attitude
towards the use of concept mapping. Therefore, Mr Silveren’s professional
development and/or training seem to be opposing with the literature review. He claimed
to be well trained on how to use concept mapping and rated his understanding of
concept mapping as being very good to excellent but at the same time he failed to
define what concept mapping was about. Mr Silveren’s responses found to be
contradicting and appeared to be too vague and ambiguous. Mr Silveren appeared not
to tell the truth about his knowledge or understanding of concept mapping.
Both Mr Golden and Mr Silveren seemed to have a vague understanding of what
concept mapping is about although they went through the same teacher education
training system.
71
According to Slabbert and Greenhalgh (1998), one of the main aims of the BETD
programme was train teachers to become professional expertise in the areas of their
specialisations. In Namibia, learner-centred approach is accepted as an approach that
should be used during instruction and is compulsory for teachers to apply learnercentred approach in their instruction. Concept mapping as one of the learner-centred
strategies was taught at colleges of education and most student teachers are trained and
equipped with skills and knowledge in applying concept mapping during instructions
(Alausa, 2000).
Amongst other aspects of teacher education, teachers were expected to develop
reflective attitude and creative, analytical and critical thinking. For example, the
programme of the Natural Science focuses on the following aspects in training the
primary school teachers: inculcates teachers to create effective and conducive
classrooms, empowers science teachers with subject content knowledge and subject
teaching methodologies, underscores on specific ideas related to the Learner Centred
Education (LCE) and Continuous Assessment (CA) strategies that teachers had to use
in science teaching, focuses on continuous professional development of teacher
educators rather than on qualification upgrading, introduces learners to the scientific
concepts and explanation of the phenomena by using scientific terminologies and
inculcating new strategies of teaching science such as concept maps (Pomuti, Shilamba,
Dahlström, Kasokonya, & Nyambe, 1998). This however was not demonstrated in the
participating classrooms.
72
Overall, Mr Golden seemed to have slight idea of what concept mapping is about than
Mr Silveren. Both teachers seemed to lack adequate knowledge on how to use it in their
teachings. The results of this study seem to lack broader understanding of concept
mapping due to the limited numbers of participants, thus, few teachers as subjects were
targeted for this study. The researcher suggests that further research should be
conducted in order to broaden the scope of such studies.
The following section presents results and discussion about research question two of
the study.
4.3
Research question two: Is there a significant difference between learners’
understanding on “matter and its properties” taught through concept
mapping as compared to the learners taught through the traditional lecture
method?
The sequence of presentation and discussion of the results obtained in this study is in
accordance with the hypothesis formulated for this question.
Hypothesis: There is no a statistically significant difference in learners’ understanding
of science on “matter and its properties” taught through concept mapping and those
taught through a traditional lecture.
To answer the aforementioned hypothesis, the researcher administered pre- and posttests to explore the understanding of learners on “matter and its properties” and focused
73
on evaporation, condensation, boiling, deposition, steam, water, ice, sublimation,
melting, freezing and energy in order to assess the use of concept mapping as a
teaching strategy. Learners at both schools (Alpha primary school and Omega primary
school) were given the same pre-test and post-test. Treatment (teaching) was provided
for two weeks at both schools after the administration of the pre-test. At Alpha primary
school, learners were taught using traditional lecture method whilst at Omega primary
school learners were taught using concept mapping and the whole research study took
the researcher two weeks and two days to be completed. Forty-four multiple choice
questions and six structured questions were drafted.
A t-test was applied to determine whether there was a significant difference (at the
alpha level of 0.05) on multiple choice questions and structured questions between the
mean scores of the two groups of 31 and 34 learners (traditional lecture group versus
concept mapping group) at Alpha Primary School and Omega Primary School
respectively. The results of both pre- and post-tests were analysed to find the Mean (M)
scores in order to determine which group scored and/or performed better than the other
on pre-test and post-test. The p and t values for the two-tailed means were calculated on
both scores’ pre-test and post-test. The t-test was used because of its powers to detect
differences between the means of two groups (at the alpha level of 0.05) (Tolley,
Johnson, & Koszalka, 2012; Wambugu & Changeiywo, 2008). Similarly, the two-tailed
test was used than one-tailed test because it focuses on the differences in the mean
scores and it is best for non-directional hypothesis that only indicates the difference and
not where the differences lie (Cohen et al, 2007). Moreover, the paired samples t-test
was the appropriate statistical test because of measuring the same group of participants
74
twice on pre-test and post-test (Krause, Kelly, Tasooji, Corkins, Baker, & Purzer,
2010). Table 3 and 4 show the M-scores and t-value of the traditional lecture group and
concept mapping group respectively on pre- and post-tests.
Table 3: Pre- and post-test results of traditional lecture group
Traditional
Mean N
Std.
Std. Err Mean
Lecture
Deviation
Group
Pre-test
20.29 31
6.948
1.248
Post-test
27.94 31
14.606
2.623
p<0.05
t
Sig.(2tailed)
-2.830
.348
The results in Table 3 revealed that there was no significant difference in learners’
understanding of “matter and its properties” taught through normal lecture strategy
when comparing their scores in the pre- and post-test (t-test = -2.830, at p < 0.05). That
means that the critical value of 2.042 is significant (t-test = -2.830, at p < 0.05) within
the same group. As the critical value of 2.042 obtained for the degree of freedom (df) =
30, p = .348. The calculated t-value is higher than the critical value, therefore, the Null
hypothesis is rejected and the results are significant at p = 0.05.
While looking at, Table 4 below, the results of learners taught through concept
mapping indicate otherwise.
Table 4: Pre- and post-test results of concept mapping group
Concept
Mean
N
Std.
Std. Err Mean
Mapping
Deviation
Group
Pre-test
33.97
34
14.400
2.470
Post-test
47.32
34
21.506
3.688
p<0.05
75
t
Sig.(2tailed)
-4.574
.000
Table 3 and 4 also show that the overall achievement of mean of scores of the learners
taught through traditional lecture strategy and concept mapping strategy, with a grand
mean of 33.97, the learners exposed to concept mapping had the highest adjusted posttest mean achievement score of 47.32. When comparing the scores of learners in
concept mapping on the pre- and post-test (t-test = -4.574, at p < 0.05). That means that
the critical value of 2.035 is significant (t-test = -4.574, at p < 0.05) within the same
group. As the critical value of 2.035 obtained for the degree of freedom (df) = 33, p =
.000. The calculated t-value is higher than the critical value, therefore, the Null
hypothesis is rejected and the results are significant at p = 0.05. The results indicated
that there is less improved learning in learners who were taught through the traditional
lecture strategy as compared to those taught through the concept mapping strategy.
It is observed that the mean scores of the two groups on pre-test were different,
traditional lecture group is 20.29 as compare to 33.97 of concept mapping group. As a
result, some learners chose wrong answers and/or left some items not answered on pretest as compared to learners who were taught through concept mapping. Learners who
were taught through concept mapping strategy, out-performed learners who were taught
through traditional lecture strategy at alpha level of 0.05. The t-test results show that
the improvement of concept mapping group in scores from the pre-test to the post-test.
For example, Sarina is one of the learners who left some questions unanswered on pretest but she managed to answer all the questions on post-test. These also may illustrate
that most learners with reading difficulties could learn easily through concept mapping
rather than reading long sentences.
76
The results presented above showed that teaching strategies through the use of concept
mapping intervention has a potential to improve learners’ understanding in primary
school Natural Sciences than the traditional lecture intervention. This finding provides
contradicting empirical information that the traditional lecture strategy contributes to
better performance as supported by Cravalho (2010). On the contrary, learners in the
traditional lecture intervention performed poorly as compared to the concept mapping
intervention group. The findings also provide empirical evidence supported by earlier
findings that established that generally learners taught through traditional lecture
strategies performed poorly as compared to learners taught through concept mapping
strategy (Safdar et al., 2012; Tolley et al., 2012; Wambugu & Changeiywo, 2008).
Therefore, concept mapping could be considered as an excellent teaching and learning
strategy that could allow both learners and teachers to engage in extended science
discourses, organise and structure subjects’ content (Krause et al., 2010).
Despite the benefits of using concept mapping, there are some challenges in using
concept mapping especially by the novice teachers and learners. These are: lack of
communication – not all the learners understood well and gained the knowledge from
concepts taught because they learn differently, prevent meaningful learning – learners
might not be given an opportunity to critic and reflect on the relationships between
concepts; unfamiliarity with the strategy – it might take time for the learners to adapt to
the concept mapping if not well explained to them and it can be frustrating for novice
map makers; time-consuming and tedious – training learners to use concept mapping
technique seem to take time and unexciting (Chiou, 2008; Mwakapenda, 2004). Using a
concept mapping tool seems to require sufficient time so that learners and teachers may
77
engage in the meaningful teaching and learning. According to the ministerial policy,
the allocated teaching time is 40 minutes per period (Ministry of Education, 2010).
From the researcher’ experience, 40 minutes period is not sufficient to teach and assess
learners’ understanding through concept mapping.
4.4
Difference in pre-test and post-test mean of scores
4.4.1 Mean scores for learners exposed to the traditional lecture method
In order to establish the differences in the mean of scores between the learners taught
through traditional lecture strategy and concept mapping strategy, further analysis of
results were conducted. A mean score for each pre-test and post-test item were
determined in order to find out how learners performed for multiple as well as for
structured items. The next section presents the mean scores of how learners performed
on each pre- and post-test item (multiple choice items).
4.4.2 Mean scores for multiple choice items for the traditional lecture group
The following graph shows the mean scores of traditional lecture group on multiple
choice questions (items) on pre-test and post-test.
78
Figure 4.1: Learners’ mean scores for each multiple choice item of traditional lecture
group
Figure 4.1 shows an improvement in item 2, 8, 16 and 22 from the pre-test mean scores
of 28%, 19%, 19% and 16% to the post-test mean scores of 53%, 53%, 59% and 47%
focusing on freezing, water, ice and sublimation. The improvement can be found on
questions answered in the post-test. Figure 4.2 shows the mean difference of
improvement in item 2, 8, 16 and 22 between pre- and post-test results of traditional
lecture group.
79
60
50
40
Pre-test
30
Post-test
20
10
0
Item 2
Item 8
Item 16
Item 22
Figure 4.2: Mean difference of improvement between pre- and post-test results (A)
Although the levels of the questions of post-test were similar to those on the pre-test,
learners seem not to have performed well on pre-test. One could explain this difference
due to learners’ anxieties of not knowing the content, not having enough knowledge
about specific concepts such as energy and condensation as well as the fact that it is
their first time to be involved in research hence the mean scores improved after the
intervention in item 2, 8, 16 and 22 as seen from Figure 4.2.
Figure 4.1 also shows that there is a slight decrease in learners’ performance in item 11
12, 13, 15, 19 and 21 that focused on melting, condensation, energy, deposition and
boiling. Figure 4.3 shows the mean difference of a slight decrease in item 11 12, 13, 15,
19 and 21 between pre- and post-test results of traditional lecture group.
80
70
60
50
40
Pre-test
Post-test
30
20
10
0
Item 11
Item 12
Item 13
Item 15
Item 19
Item 21
Figure 4.3: Mean difference of slight decrease between pre- and post-test results
Figure 4.3 shows that learners performed badly on some items of the post-test. It
seemed that learners experienced some problems in comprehending some of the science
concepts. For instance, learners lacked understanding on what physical changes involve
in order for them to differentiate between boiling and condensation concepts. The
common mistakes that were observed from the learners were that they seemed not to
differentiate between vaporisation and evaporation and also to distinguish between the
states of matter in terms of their particles.
This view is supported by Candan et al. (2006), who states that “it is widely concerned
that students in early grades have difficulty to comprehend the concepts…” (p. 28).
Therefore, for learners to learn science concepts they should comprehend the
similarities and differences between concepts presented and what they already know to
avoid confusion (Duit & Treagust, 2010; Safdar et al., 2012). It might be also the case
that learners in control group answered questions by guessing. The study that was
81
conducted by Fauzan (2002) on applying realistic mathematics education in teaching
geometry in Indonesian primary schools found that most learners at lower grades in
control classes answered the items by guessing or by using their impressions while in
experimental group solved the item by using the formula.
4.4.3 Mean scores for structured questions for the traditional lecture group
Learners who were exposed to the lecture intervention were assessed on eleven
concepts on matter and its properties through structured questions in the pre- and posttests. The scheme of work and content presented to the learners during the two weeks is
shown in Table 1.
Figure 4.4 shows the results of learners’ performance on some of the science concepts
on matter and its properties that they were tested on.
82
40
34 35
35
Mean scores
30
25
25
22
19
20
15
15
10
5
22
20
22
25 25
22
20
22
17
13
13 13
9 9
3 3
0
Science concepts taught
Pre-test
Post-test
Figure 4.4: Learners’ mean scores of science concepts taught through traditional
lecture method
Figure 4.4 shows that there was no change in learners’ performance in relation to
understanding science concepts such as ‘evaporation’, condensation’ and ‘sublimation’.
While there was a slight increase in learners’ performance in other concepts such as
‘deposition’, ‘steam’, ‘water’, ‘melting’ and ‘energy’. There was also a slight decrease
in learners, performance on ‘boiling’, ‘ice’ and ‘freezing’ concepts.
Looking at structured questions, it seemed to offer a better explanation of learners’
performance. When analysing the learners’ work, they seemed not to have provided
answers to some items in the post-test while they provided answers to all items in pretest. Such conditions also tend to bring down the average performance of the learners.
Another reason could be that learners did not have enough content information when
they wrote the pre-test and this too, brought down their performances. The next extracts
83
show how some learners performed on pre-test as compared to post-test. Looking at
Katherine’s performance on structured choice items focusing on evaporation, she
gained higher scores on pre-test than on post-test.
Pre-test question
vs
Post-test question
Extract above shows Katherine’ work on both tests focusing on evaporation. Katherine
appears to confuse concept mapping with bar graph when looking at her answer in the
post-test. She also seemed not to have comprehended the meaning of what a diagram
was and how to relate the concepts to each other. The extract below shows the concepts
presented at Alpha Primary School using the traditional lecture strategy.
Figure 4.5: Science concepts presented using traditional lecture strategy
84
During instructions, learners were exposed to class participations and discussions so
that they can clarify their understanding of the concepts and their relationships
(Crawford, 2007; Nyambe, & Griffiths, 2010; Waters-Adams, 2006).
The following extract shows Job’s work on pre-test and post-test (structured questions)
focusing on energy, boiling, evaporation, condensation, freezing and melting.
Pre-test question
vs
Post-test question
Looking at how Job answered the above item focusing on evaporation (pre-test), it is
noticeable that he could not use the processes properly, just like Katherine. The process
that takes place through which a solid changed to a liquid state is melting which is
already given in the diagram and then from liquid to gas which is evaporation.
However, Job did not recognise that and he added boiling as a process.
On post-test, Job only used few concepts from the given list. Instead, he concentrated
only on the state of matter (solid, liquid and gas) but not on the processes. However,
85
Job shows some understanding of what was asked in the question. He, at least, provided
a concept map although the linking words were missing and not graph like Katherine.
Some problems that were observed during instructions were as follow: firstly, most
learners seemed to misunderstand the difference between processes of boiling and
evaporation, that is, the process that takes place when liquid (water) change to gas state
(water vapour); secondly, boiling is a term that many people use in their daily lives.
However, boiling has another meaning as a science concept, particularly, in this
context. Thus there is a need that teachers should teach with care when using some of
these terminologies in science context. Heating and boiling do not have the same
meaning in scientific context, in particular, as used in changing the state of matter.
They seem not to know that evaporation can take place from boiling water from the
kettle or pot on the stove too and change the state of water to water vapour. Similarly,
most of the learners seem to know the process of freezing as solidifying or
condensation and not as freezing. Not knowing the meaning of some words also seem
to have contributed to learners’ misunderstanding of some science concepts and also
may have contributed to the slight decrease in learners’ performance. It also seems that
the treatment was not plausible enough in order to change their mind set on
evaporation, condensation, boiling, ice, sublimation, and freezing as well as energy.
Looking at the boiling concept (structured items), the result shows that 24 learners got
correct answers on pre-test as compared to 11 learners on the post-test. In addition, 1
learner left questions on boiling concept unanswered on pre-test as compared to 2
learners on post-test. The two items: 1 and 8 on pre-test were testing learners’
86
understanding of boiling and most of the learners seemed to have been confused by the
concept temperature which was in the items.
Again, in multiple choice items, learners were assessed in five items (10, 12, 15, 19 and
21) on pre-test and three items (6, 9 and 16) on post-test based on ice concept. On pretest items, 12 learners got the item correct. Besides the correct answers, 17 learners got
the item wrong. It seemed as if learners were not fully aware that an ice is also part of a
solid state like other substance such as stones, wood block etc. and the ice particles are
also fixed together. The poor performance of the learners on pre-test was not only
caused by the wrong answers given by the learners but 2 learners also left items
unanswered specifically item 17 which was on the arrangement of particles in an ice
concept. On post-test, 18 learners got the ice concept correct whilst 13 learners got the
concept wrong. Figure 4.6 shows how learners performed in items focused on ice
concept on pre- and post-tests of traditional lecture group.
87
70
60
50
40
Pre-test
Post-test
30
20
10
0
Item 6
Item 9
Item 10 Item 12 Item 15 Item 16 Item 19 Item 21
Figure 4.6: Learners’ performance on ice concept on pre- and post-test
There seem to be a need for teachers not only to consider learner’s misconceptions and
challenges as barriers but also to find the sources and causes of these misconceptions
and challenges (Kang, Scharmann, Kang, & Noh, 2010). The study that was conducted
by Rice with the in-service elementary science teachers on their subject content
knowledge in the USA reveals that many similar misconceptions such as to
differentiate between boiling and condensation concepts are weakening learners’
understandings (Rice, 2005). Markow & Lonning (1998) state that learners are
normally confused about what constituted concepts and examples in questions and
unclear about general map structure (hierarchy).
In multiple choice items, there were four questions (two on pre-test and two on posttest) on freezing concept. This indicated that 8 learners got the question correct while
23 learners got it wrong on pre-test. On the post-test, 12 learners got the questions
correct whilst 19 learners got the questions wrong. The results show that not only on
88
structured questions did learners perform badly about freezing but also in the multiple
choice items. On pre-test, most of the leaners seemed not to have understood that 0°C is
the freeing point of any pure liquid. On post-test, it appeared that learners didn’t know
that freezing point is the opposite of melting point. Figure 4.7 shows how learners
performed in multiple choice items focused on freezing concept on pre- and post-tests
of traditional lecture group.
60
50
40
Pre-test
Post-test
30
20
10
0
Item 2
Item 4
Item 5
Item 17
Figure 4.7: Learners’ performance on freezing concept on pre- and post-test
Aldous (204) indicates that the plainly incorrect or misinterpretations of concepts can
develop into misconceptions that can cause failure. According to Aikenhead and Ryan
(1992), the language can create a barrier, particularly when learners hold a different
view or meaning of such scientific terminology and may lead to misinterpretations of
terms. In addition, teaching science could also contribute to learners’ misunderstanding
of the science concepts as well as discourage learners. Teachers need to provide
89
opportunities - exploratory activities for leaners in order to identify and reveal a
common misunderstanding, that is, plausible teaching.
4.4.4 Mean scores for multiple choice items for the concept mapping group
Table 5 below illustrates how the pre- and post-test items were spread across the eleven
concepts.
Table 5: Pre- and post-test items spread across the concepts (B)
Concepts
Pre-test item
Post-test item
Evaporation
1
20
Condensation
9
12 & 17
Boiling
1&8
3, 7, 10, 18 & 21
Deposition
2
19
Steam
3, 5, 11, 18 & 20
1
Water
16
8
Ice
10, 12, 15, 19 & 21
6, 9 &16
Sublimation
7 & 22
22
Melting
6
11
Freezing
4 & 17
2&5
Energy
13 & 14
4, 13, 14 & 15
The following graph shows the results of the mean scores of twenty-two multiple
choice questions (items) of concept mapping group focused eleven concepts mentioned
in Table 5 above.
90
Figure 4.8: Learners’ mean scores for each multiple choice item of concept mapping
group
Figure 4.8 shows that learners performed well on most of the pre- and post-test
questions except item 5 where there is a slight decrease in learners’ performance (34%
to 33%). Pre-test, item 5 focused on steam whilst post-test focused on freezing. Figure
4.8 also shows improvement in learners’ performance on several questions such as
item 4, 6, 8, 12, 18, 20 and 22 from the pre-test mean scores of 37%, 26%, 29%, 20%,
14%, 23% and 17% to the post-test mean scores of 81%, 64%, 67%, 55%, 64%, 72%
and 56% respectively. The items focused on freezing, melting, boiling, ice, steam,
sublimation, energy, water, condensation, boiling and evaporation (See Table 5).
Figure 4.9 shows the mean difference between the pre-test and post-test results of the
concept mapping group in the seven items whereby learners have improved well after
intervention.
91
90
80
70
60
50
Pre-test
Post-test
40
30
20
10
0
Item 4 Item 6 Item 8 Item 12 Item 18 Item 20 Item 22
Figure 4.9: Mean difference of improvement between pre- and post-test results (B)
Although there is no huge difference in performance in learners’ mean of scores on
item 5, it seems to be challenging to the learners both on pre- and post-tests. Learners
performed poorly on this specific item as compared to other items. The mean score for
item 5 is below 40 on both pre- and post-test as compared to other items. There were 35
learners who wrote item 5 on pre-test and one learner was absent during the pre-test of
which 12 learners got correct answer while 23 learners got wrong answer. Looking at
the learners who provided answers, one can observe that learners experienced a
problem in answering this item. The item was posed as follows and it focused on
steam:
92
Item 5 on pre-test was posed as:
Which state of matter has no definite shape and no definite volume?
A
Gas
B
Liquid
C
Solid
D
Plasma
Thirty-six learners provided an answer to item 5 in the post-test. The results show that
12 learners provided correct answers while 24 learners provided incorrect answers. The
item was as follows and it focused on freezing:
Item 5 on post-test was posed as:
What is likely to be the same as the freezing point of water?
A
Melting point
B
Boiling point
C
Sublimation point
D
Evaporation point
The mean scores slight decreased from pre-test (34%) to post-test (33%). On post-test,
learners performed badly. The following extract shows how Tania performed in item 5
on pest-test compared to post-test.
93
Pre-test item
vs
Post-test item
The following extract was taken from Sangula’s tests to show how he performed in
item 5 on pest-test compared to post-test.
Pre-test item
vs
Post-test item
Learners performed badly on post-test because it appears that they made a common
mistake since many learners happened to choose sublimation point as an opposite to
‘freezing’ point instead of choosing melting point.
It seems that learners experienced problems in understanding the science concepts
about matter and its properties. One possible effect of making wrong choices and
diminishing learners’ own understanding of concepts is the science language which is
likely to limit learners’ abilities to identify conceptual links between science concepts
(Mwakapenda, 2004, Stoffels, 2005; Koosimile (2005).
94
4.4.5 Mean scores for structured question for the concept mapping group
Learners taught through concept mapping were also tested in eleven science concepts
on matter and its properties which are evaporation, condensation, boiling, deposition,
steam, water, ice, sublimation, melting, freezing and energy. Figure 4.10 shows the
mean scores of learners’ performance for both pre- and post-test.
Figure 4.10: Learners’ mean scores of science concepts taught through concept
mapping method
Figure 4.10 shows improvement in learners’ performance in almost all of the science
concepts except on the deposition and sublimation concepts where learners show a
slightly lower improvement in their performance. The following extract shows how
Temus got wrong answers on the question items focusing on the deposition concept.
95
Pre-test item
vs
Post-test item
Temus with other learners who happened to get the deposition concept wrong from the
multiple choice item appear to be confused with the word amount used in the question
and weight from the stems since most of the learners chose weight as their option. Still,
most learners did not comprehend how atom is related to matter as the smallest part of
it. These confusions lead to poor performance or slightly improvement on learners’
work.
The following extract was taken from Selma’s work to illustrate how she performed on
the items that were focused on sublimation concept. She got wrong answers on both
items.
Pre-test item
vs
Post-test item
96
There were three items that focussed on sublimation concept, that is, item 7 and 22 on
pre-test and item 22 on post-test. The results of multiple choice items indicate that 9
learners got item 7 correct. Most learners including Selma did not realise that inside the
fire extinguisher there is powder (dry ice) in a form of solid and when it started to be
sprayed out, it turned to a gas and that is sublimation. The learners seemed to have
experienced problems with words such as extinguishers, cylinder and dry ice used in
item 7 on pre-test where most learners performed badly. Instead of choosing
sublimation, they choose distillation which is the process of purifying impurity water.
In addition, learners did not realise the diagram in item 22 as in a gas state only and that
it could be changing from the solid state directly to the gas state such as burning
cigarette or wood. These were some of the common mistakes that most learners made.
However, this shows that learners’ performance on sublimation concept slightly
improved in multiple choice from pre-test to post-test as compared to the slight
improvement in structured questions. The next extracts show how Angeline answered
the structured item 1 focused on concept mapping involving concepts such as
evaporation, condensation, boiling, deposition, steam, water, ice, sublimation, melting,
freezing and energy.
97
Pre-test question
vs
Post-test question
Looking at Angeline’s work on structured question item 1 on pre-test and post-test, it
comes out that she failed to conceptualise or figure out where the correct concepts
should be placed in the given spaces. Angeline performanced badly on both the pre-test
and post-test in the structred questions. She might have experienced some
misconceptions and misunderstandings in drawings and placement of concepts in the
right places. Those misunderstandings of the drawing lead her not to write or fill in any
of the concepts to make a meaningful sketch of a concept map and not filling in almost
all the concepts correctly. The misunderstandings might have been caused by not
reading the instructions well.
98
Hindjou’s responses are as follows:
Pre-test question
vs
Post-test question
The extracts above show how Hindjou performed on a structured question focused on
concept mapping both on pre-test and post-test. He also failed to fill in concepts such as
evaporation, condensation, boiling, deposition, steam, water, ice, sublimation, melting,
freezing and energy in the right spaces on the post-test question. In addition, his way of
drawing a concept map on the post-test question demonstrates unwillingness or
misunderstanding of what should be done with respect to the science concepts. It also
appears that Hindjou experienced more difficulties with regard to drawing a concept
map, that’s why he performed poorly on both the pre-test and the post-test.
Overall results seem to show that learners who were taught through concept mapping
out-performed learners who were taught through the traditional lecture method, again
some learners seemed to have experienced problems with drawing up concept maps. It
is noticed that concept mapping has a positive impact on learners’ performance. Chiou
99
(2008) also argue that concept mapping strategy has the capability to enhance learners
understanding and engaging them in the teaching and learning activities with positive
results. In addition, using concept mapping especially by the novice learners might not
be easy because they are unfamiliar with the strategy and might take time to adapt it
especially if the concept is not well explained to them (Mwakapenda, 2004). Learners
seem to be frustrated and lose interest when they spend much of their time struggling
with the work that they do not understand well and not making connections between
concepts (Chiou, 2008; Elhelou, 1997; Krause et al., 2010).
However, it is important to provide opportunities to learners to participate and discuss
science concepts during instructions in order for them to clarify their understanding of
the concepts and their relationships to each another (Crawford, 2007; Nyambe, &
Griffiths, 2010; Waters-Adams, 2006). Most importantly, learners need to be taught
how the arrows and words in concept maps linked to each other (Canas, 2003; Safdar et
al., 2012; Stoica et al., 2011). For the learners to achieve high academic standards and
improve achievement in core subjects including science, the correct reading of
instructions should be prioritised (Shaver, Cuevas, Lee, & Avalos, 2007).
4.5
Conclusions
In this chapter, the researcher presented the results and discussions of the data collected
from the two primary schools, the two science teachers and their learners. The study
found that Mr Golden seemed to have a slight idea and understanding of what the
concept mapping strategy was about than Mr Silveren. Both teachers seemed to lack
100
adequate knowledge on how to use concept mapping in their teachings. It was also
found that the two teachers did not also try to use the strategy in their daily
instructional practices since they started with their professional career.
It was also found that learners taught through concept mapping out-performed the
learners who were taught through the traditional lecture method at statistically
significant difference of alpha 0.05. That means that the overall critical value of 1.998
is significant (t-tests = -4.574 and -2.830, at p < 0.05). As the critical value of 1.998
obtained for the degree of freedom (df) = 63, p = .000. The calculated t-value is higher
than the critical value, therefore, the Null hypothesis is rejected and the results are
significant at p = 0.05.
Both learners mostly of the traditional lecture group seemed to have encountered some
problems with regard to concept mapping. For example, these learners were requested
to sketch a concept map using the given concepts and instead of sketching, some
learners drew bar graphs and made long chains with concepts, some learners seemed
not to have read the instructions given, not to comprehend the meanings of each
concept and its application, and/or not even contextualise linking words and how they
relate to each other.
The next chapter presents the conclusions and recommendations that emerged from the
findings of the study.
101
CHAPTER FIVE
SUMMARY, CONCLUSIONS AND RECOMMENDATIONS
5.1
Introduction
This chapter presents a summary of the findings, conclusions and recommendations
that emerged from the study.
5.2
Summary
5.2.1 Research question one: How do Grade six Natural Science teachers
understand and use concept mapping?
The results revealed that:
•
The two science teachers who participated in the study have a vague idea about the
uses of concept mapping during instruction.
•
The two science teachers appeared not to have practiced the concept mapping
strategy at all in their classes since they started with their professional careers.
102
5.2.2 Research question two: Is there a significant difference between learners’
understanding on “matter and its properties” taught through concept
mapping as compared to the learners taught through the traditional lecture
method?
The results revealed that:
•
Some facts such as learners’ of not knowing the subject content; not having enough
knowledge about specific concepts; not knowing the meaning of some words like
fire extinguisher used in the items and having experienced some problems in
comprehending some of the science concepts contributed to the learners’ poor
performance on both pre- and post-tests.
•
Some learners appear to confuse themselves and not knowing that evaporation can
take place from boiling water, from the kettle or pot on the stove too and change the
state of water to water vapour. Similarly, most of the learners seem to know the
process of freezing as solidifying or condensation and not as freezing.
•
Some learners performed badly on post-tests because of the possible effect of
making wrong choices and diminishing learners’ own understanding of concepts is
the science language which is likely to limit learners’ abilities to identify
conceptual links between science concepts and by not reading the instructions well.
•
Learners mostly taught through traditional lecture seemed to have encountered
some problems with regard to using concept maps. For example, learners were
requested to use sketches to illustrate the particular concept instead some learners
drew bar graphs. Some learners seemed not to have read the instructions given, not
comprehended the meanings of each concept and its application, and/or not even
103
contextualised linking words and how they relate to each other.
•
Learners taught through concept mapping out-performed those learners who were
taught through the traditional lecture at statistically significant difference of alpha
0.05. That means that the overall critical value of 1.998 is significant (t-tests = 4.574 and -2.830, at p < 0.05). As the critical value of 1.998 obtained for the
degree of freedom (df) = 63, p = .000. The calculated t-value is higher than the
critical value, therefore, the Null hypothesis is rejected and the results are
significant at p = 0.05. This proves that the concept mapping strategy has a
noticeable positive impact on learners’ achievements than the traditional lecture
method in teaching science concepts.
5.3
Recommendations
5.3.1 Research question one: How do Grade six Natural Science teachers
understand and use concept mapping?
The institutions of higher learning, that is, the University of Namibia, Colleges of
Education as well as the Ministry of Education in collaboration with curriculum
developers (NIED) are, thus, encouraged to include the concept mapping strategy into
their curriculum. The involvement of the Continuing Professional Development (CPD)
unit in partnership with NIED is also very crucial in propagating the use of concept
mapping offered to practicing teachers. For the meaningful teaching and learning of
science concepts, learners need to be taught how to use concept mapping as from
primary school level to university level. According to Mwakapenda (2008), introducing
104
concept mapping strategy at primary level of schooling will provide learners with
opportunities to display relationships among concepts in a topic, between topics and
between domains. Therefore:
•
Concept mapping will, thus, equip student-teachers well in advance and impart
them with necessary skills and knowledge on how to construct and use concept map
for the effectiveness of teaching and learning of science concepts.
•
As a new teaching strategy in the Namibian context, learners are unfamiliar with it;
therefore, teachers are warned not to rush when introducing a concept map to the
learners; otherwise, learners get frustrated and discouraged as learners learn
differently. For the science teachers who practice and plan to use concept mapping
strategy in their classrooms, they should make sure that concept maps need to be
well planned in advance with correct and meaningful linking words. Learners’ ideas
as presented on concept maps need to be properly monitored and corrections should
be
done
immediately
to
avoid
misconceptions,
misunderstandings
and
misinterpretations of concepts.
•
Teachers are also advised to use correct language when teaching science concepts
using concept mapping. In so doing, it gives learners an opportunity to learn with
excitement, understand concepts well in relation to linking words and enhance
learners’ meaningful learning.
•
Most teachers in Namibia seem to focus on using lecture methods of teaching rather
than new and innovative methods of teaching (Kapenda et al., 2002). Therefore,
this study argues for a shift from traditional lecture method to concept mapping
strategy because knowledge acquired through traditional method will not be
remembered.
105
5.3.2 Research question two: Is there a significant difference between learners’
understanding on “matter and its properties” taught through concept
mapping as compared to the learners taught through the traditional lecture
method?
•
The use of concept mapping should be extended to other subject areas in order to
enhance effective teaching and learning.
•
It is, thus, recommended that further researches on concept mapping should focus
on the implementation and application of concept mapping strategy in all areas of
science subjects including Mathematics.
•
The study should also caution that the findings could be as obtained because the
two schools were so different – therefore, more and in-depth studies are needed for
future concept mapping applications in teaching science concepts.
5.4
Conclusions
The curiosities behind the research questions of this study were answered in terms of
teachers’ understanding of concept mapping and learners’ achievements through the
interventions (concept mapping and traditional lecture). Despite the challenges that
concept mapping strategy might have in teaching and learning of science concepts, this
study proved that concept mapping strategy is one of the effective and useful teaching
strategies of science concepts that promotes meaningful learning among the learners.
The concept mapping strategy can enhance learners’ thinking capacities and promote
their scientific skills. As a result, learners’ achievements are improved. However,
106
concept mapping strategy itself would not emerge as a success in teaching and learning
without the interest and seriousness of teachers and learners. Therefore, teachers and
learners should be more widely encouraged to use concept mapping for the
effectiveness of teaching and learning of science.
5.5
Summary
This chapter presented a summary, conclusions and recommendations of the study in
relation to the use of concept mapping in teaching of science concepts.
107
REFERENCES
Aikenhead, G. S. & Ryan, A. G. (1992). The development of a new instrument: “Views
on science-technology-society” (VOSTS). Science Education, 76(5), 477–491.
Afsar, B., Qureshi, J. A., Rehman, A. & Bangash, R. U. (2011). Consumer panacea
over
internet
usage
in
Pakistan.
Retrieved
from
http://www.mnmk.ro/documents/2011/4_Pakistan %20FFF.pdf
Alausa, Y. A. (2000). BETD first year students’ disposition to mathematics: Reform
forum. Retrieved from http://www.nied.edu.na/publications/journals/journal12/
Journal%2012%20Article%203.pdf
Aldous, C. (2004). Science and mathematics teachers’ perceptions of C2005 in
Mpumalanga secondary schools. African Journal of Research in SMT
Education, 8(1), 65–76.
Alexandra, G. J. (2013). Towards a learner-centred approach to teaching English.
Professional Communication and Translation Studies, 6(1-2), 205–210.
Amoonga, T. & Kasanda, C. D. (2011). The use of constructivism in teaching
mathematics for understanding: A study of the challenges that hinder effective
teaching of mathematics for understanding. A Journal for the Namibian
Educational Research Association, 11(1), 81–97.
Asan, A. (2007). Concept mapping in science class: A case study of fifth grade
students. Educational Technology & Society, 10(1), 186–195.
Ausubel, D. P. (1962). Learning by discovery. Retrieved from http://www.ascd.org/
ASCD/pdf/journals/ed_lead/el_196211_ausubel.pdf
108
Ausubel, D. P. (1963). The psychology of meaningful verbal learning. New York, NY:
Gune and Stratton.
Barnett, J. (2001). Pedagogical context knowledge: Toward a fuller understanding of
what good science teachers know. Science Education, 85, 426–453.
Biddulph, F. & Osborne, R. (1984). Making sense of our world: An interactive teaching
approach. Hamilton, NZ: University of Waikato.
Black, A. A.
(2005). Spatial ability and earth science conceptual understanding,
Journal of Geoscience Education, 53(4), 402–414.
Brinkmann, A. (1999). “Investigating the use of concept mapping as tools in
mathematics education.” Network, 48, 1–13.
Brown, J. (2009). Concept maps: Implications for the teaching of function for
secondary
school
students.
Retrieved
from
http://www.merga.net.au/documents/BrownJ_RP09.pdf
Bybee, R. W. (1997). Achieving scientific literacy: From purposes to practices.
Portsmouth, New Hampshire: Heinemann.
Canas, A. J. (2003). A summary of literature pertaining to the use of concept mapping
techniques and technologies for education and performance support. Retrieved
from http://www.ihmc. us/users/acanas/Publications/ConceptMapLitReview/
Canas, A. J. & Novak, J. D. (2009). What is a concept map? Retrieved from
http://cmap. ihmc.us/docs/conceptmap.html
Candan, A., Türkmrn, L. & Cardak, O. (2006). The effects of concept mapping on
primary school students’ understanding of the concepts of force and motion.
Journal of Turkish Science Education, 3(1), 66–75.
109
Cantú, E., Farines, M. J. & Angotti, A. J. (2004). Using a thematic approach and
concept
maps
in
technological
courses.
Retrieved
from
http://cmc.ihmc.us/papers/cmc2004-192.pdf
Carey, S. (2000). Science education as conceptual change. Journal of Applied
Developmental Psychology, 21, 13–19.
CenterSpan (2001). What is the Internet? Retrieved from http://www.centerspan.
org/tutorial /net.htm
Chiou, C. C. (2008). The effect of concept mapping on students’ learning achievements
and interests. Innovations in Education and Teaching International, 45(4), 375–
387.
Cohen, L., Manion, L. & Morrison, K. (2002). Research methods in education (5th ed.).
London: Routledge Falmer.
Cohen, L., Manion, L. & Morrison, K. (2007). Research methods in education (6th ed.).
London: Routledge Falmer.
Costu, B., Ayas, A., Niaz, M., Ünal, S. & Calik, M. (2007). Facilitating conceptual
change in students’ understanding of boiling concept. Journal of Science
Education and Technology, 16, 524–536.
Cravalho, P. F. (2010). Learning statistics using concept maps: Effects on anxiety and
performance. Retrieved from http://scholarworks.sjsu.edu/etd_theses
Creswell, J. W. (2003). Research design: Qualitative, quantitative and mixed methods
approaches (2nd ed.). Thousands Oaks: Sage Publications.
Creswell, J. W. (2004). Educational research: Planning, conducting, and evaluating
quantitative and qualitative research (1st ed.). Boston: Pearson Education Inc.
110
Creswell, J. W. (2007). Qualitative inquiry and research design: Choosing among five
approaches (3rd ed.). Boston: Pearson Education Inc.
Creswell, J. W. (2012). Educational research: Planning, conducting, and evaluating
quantitative and qualitative research (4th ed.). Boston: Pearson Education Inc.
Creswell, J. W. (2014). Educational research: Planning, conducting, and evaluating
quantitative and qualitative research (5th ed.). Boston: Pearson Education Inc.
Crawford, B. A. (2007). Learning to teach science as inquiry in the rough and tumble of
practice. Journal of Research in Science Teaching, 44(4), 613–642.
Davis, J. (2001). Conceptual Change. Retrieved from http://epltt.coe.uga.edu/index.
php?title=Conceptual_Change
Davis, K. S. (2003). “Changing is hard”: What science teachers are telling us about
reform and teacher learning of innovative practices? Science Education, 87, 3–
30.
Denzin, N. K. & Lincoln, Y. S. (2000). Methods of collecting and analysing empirical
materials. In N. D. Denzin, & Y. S. Lincoln (Eds.). Handbook of qualitative
research (2nd ed.). Thousand Oaks, CA: Sage Publications.
Department of Education (2006). National curriculum statement: Grade 10-12 (general
overview). Pretoria: Government Printer.
Duit, R. & Treagust, D. F. (1998). Learning in science from behaviourism towards
social constructivism and beyond. In B. Fraser, & K. Tobin, (Eds.).
International handbook of science education. Great Britain: Kluwer Academic
Publishers.
111
Duit, R. & Treagust, D. F. (2010). Conceptual change: A powerful framework for
improving science teaching and learning. International Journal of Science
Education, 25(6), 671–688.
Elhelou, A. M. (1997). The use of concept mapping in learning science subjects by
Arab students. Educational Research, 39(3), 311–317.
Elizabeth, C. M. (2013). An example of a concept map. Retrieved from
http://blogs.ubc.ca /projectportfolio/files/2013/03/elizabethconcept map.gif
Eshach, H. & Fried, M. N. (2005). Should science be taught in early childhood?
Journal of Science Education and Technology, 14(3), 315–336.
Fauzan, A. (2002). Applying realistic mathematics education in teaching geometry in
Indonesian
primary
schools
(Master
thesis).
Retrieved
from
http://core.kmi.open.ac.uk/download /pdf/11462400.pdf (ISBN 90 365 18 43 1)
Galili, I. & Hazan, A. (2000). Learners’ knowledge in optics: interpretation, structure
and analysis. International Journal of Science Education, 22, 57–88.
Gay, L. R., Mills, G. E. & Airasian, P. (2009). Educational research: Competencies for
analysis and applications (9th ed.). London: Pearson Education Inc.
Gay, L. R., Mills, G. E. & Airasian, P. (2011). Educational research: Competencies for
analysis and applications (10th ed.). London: Pearson Education Inc.
Grosser, M. (2007). Effective teaching: Linking teaching to learning functions. South
African Journal of Education, 27(1), 37–52.
Guba, E. G. & Lincoln, Y. S. (1989). Fourth generation evaluation. Thousand Oaks,
CA: Sage Publications.
112
Haney, J. J., Czerniak, C. M. & Lumpe, A. T. (1996). Teacher beliefs and intentions
regarding the implementation of science education reform strands. Journal of
Research in Science Teaching, 33(9), 971–993.
Hartmann-Petersen, P., Gerrans, G. C. & Hartmann-Petersen, R. (2004). SASOL
reaching new frontiers: Encyclopaedia of science & technology. South Africa:
New Africa Books (Pty) Ltd.
Hewson, M. G. & Hewson, P. W. (1984). The role of conceptual conflict in conceptual
change and the design of science in situation. Instructional Science, 13, 1–13.
Hewson, P. W. (1992). Conceptual change in science teaching and teacher education.
Paper presented at a meeting on “research and curriculum development in
science teaching” under the auspices of the national center for educational
research, documentation, and assessment: Ministry for Education and Science,
Madrid, Spain. Retrieved from http://aste.chem.pitt.edu/proceedings/2006
proceedings/Shope1%201%20.htm
Hewson, P. W. (1996). Teaching for conceptual change. In D. F. Treagust, R. Duit, &
B. F. Fraser (Eds.). Improving teaching and learning in science and
mathematics. Danvers, MA: Teacher College Columbia.
Hinrichsen, J., Jarrett, D. & Peixotto, K. (1999). Science inquiry for the classroom: A
literature review. Programme report. Oregon: The Northwest Regional
Educational Laboratory.
Jackson, J. (2000). The power of questions in second language case discussions. In H.
E. Klein (Ed.) Complex demands on teaching require innovation: Case method
& other techniques. Needham, MA: World Association for Case Method
Research & Application.
113
Jarvis, T. & Pell, A (2005). Factors influencing elementary school children’s attitudes
toward science before, during, and after a visit to the UK National Space
Centre, Journal of Research in Science Teaching, (1)42, 53–83.
Jorde, D. (2002). Good practice in using the internet and information technology in
teaching and learning science: Nobel Symposium (NS 120) “virtual museums
and public understanding of science and culture”. Sweden: Stockholm.
Kagan, D. M. (1990). Ways of evaluating teacher cognition: Inferences concerning the
Goldilocks principle. Review of Educational Research, 60, 419–469.
Kang, H., Scharmann, L. C., Kang, S. & Noh, T. (2010). Cognitive conflict and
situational interest as factors influencing conceptual change.
International
Journal of Environmental & Science Education, 5(4), 383-405.
Kapenda, H. M., Kandjeo-Marenga, H. U. & Kasanda, C. D. (2002). Characteristics of
practical work in science classrooms in Namibia. Research in Science &
Technology Education, 20(1), 53–65.
Kasanda, C. (2005). Education in Africa: Post colonialism and globalisation in science
and mathematics education: The case of Namibia and Zambia. Education in
Namibia: A Collection of Essays, 106–126.
Kinchin, I. M., Streatfield, D. & Hay, D. B. (2010). Using concept mapping to enhance
the research interview. International Journal of Qualitative Methods, 9(1), 53–
68.
Koosimile, A. T. (2005). Induction of pupils into secondary school science in
Botswana. African Journal of Research in SMT Education, 9(1), 39–48.
114
Krause, S., Kelly, J., Tasooji, A., Corkins, J., Baker, D. & Purzer, S. (2010). Effect of
pedagogy on conceptual change in an introductory materials science course.
International Journal of Engineering Education, 26(4), 869–879.
Lee, C. (1992). Literacy, cultural diversity and instruction. Education and Urban
Society, 24, 279–291.
Leedy, P. D. & Ormrod, J. E. (2005). Practical Research (8th ed.). Pearson Prentice
Hall: Pearson Educational Inc.
Lemberger, J., Hewson, P. W. & Park, H. (1999). Relationships between prospective
secondary teachers’ classroom practice and their conceptions of biology and of
teaching science. Science Education, 83, 347–371.
Lincoln, Y. S. & Guba, E. G. (1985). Naturalistic inquiry. Thousand Oaks, CA: Sage
Publications.
Lincoln, Y. S. & Guba, E. G. (1994). Competing paradigms in qualitative research. In
N. K. Denzin, & Y. S. Lincoln (Eds.). Handbook of qualitative research.
Thousand Oaks, CA: Sage Publications.
Ling, Y. & Kwen BOO, H. (2007). Concept mapping and pupils’ learning in primary
science in Singapore. Asia-Pacific Forum on Science Learning and Teaching,
8(2), 1–29.
Lubben, F., Kasanda, C., Gaoseb, N., Kandjeo-Marenga, U., Kapenda, H. & Campbell,
B. (2005). The role of everyday contexts in learner-centred teaching: The
practice in Namibian secondary schools. International Journal of Science
Education, 150(27), 1805–1823.
115
Markow, P. G. & Lonning, R. A. (1998). Usefulness of concept maps in college
chemistry laboratories: Students’ perceptions and effects on achievement.
Journal of Research in Science Teaching, 35(9), 1015–1029.
Marsh, D., Ontero, A. & Shikongo, T. (2002). Content and language integrated
learning in Namibia: Using language to learn and learning to use language.
Finland: University of Jyväskylä.
Mbano, N. (2004). Pupils’ thinking whilst designing an investigation. African Journal
of Research in SMT Education, 8(2), 105–114.
McMillan, J. H. & Schumacher, S. (1989). Research in education (2nd ed.). Glenview,
Illinois: Scott, Foresman and Company.
McMillan, J. H. & Schumacher, S. (2010). Research in education. San Fransisco:
Jossey – Bass Publishers.
Mellado, V. (1998). The classroom practice of preservice teachers and their
conceptions of teaching and learning science. Science Education, 82, 197–214.
Merki, T. (1993). Applied science/health 11 – 12 teaching modules, San Diego City
schools, 1993, stock no. 41-S-8400. Retrieved from http://www.sandi.net/course
/html/Science.html
Millar, R., Driver, R., Leach, J. & Scott, P. (1993). Students understanding of the
nature of science: Philosophical and sociological foundations to the study.
Working paper 2 from the project “the development of understanding of the
nature of science”. Centre for students in science and mathematics education.
United Kingdom: University of Leeds.
Ministry of Education, (2010). The National Curriculum for Basic Education.
Okahandja: National Institute for Educational Development (NIED).
116
Ministry of Education, (2013). Report on the National Standardised Achievement Tests
(NSAT). Ministry of Education: Government Printer.
Moore, K. A. (2008). Quasi-experimental evaluations: Part six in a series on practical
evaluation methods. Retrieved from http://www.childtrends.org/wp-content
/uploads/2008 /01/Child_Trends-2008_01_16_Evaluation6.pdf
Morrison, J. A. & Lederman, N. G. (2003). Science teachers’ diagnosing and
understanding of students’ preconceptions. Science Education, 87, 849–867.
Mwakapenda, W. (2003). Concept mapping and context in mathematics education. The
mathematics education into the 21st century project proceedings of the
international conference. The decidable and the undecidable in mathematics
education, Brno, Czech Republic. Retrieved from http://www.math.unipa.
it/~grim/21_project/21_brno03_ Mwakapenda.pdf
Mwakapenda, W. (2004). Understanding student understanding in mathematics.
Pythagoras, 60, 28–35.
Mwakapenda, W. (2006). Student understanding of function concepts. In E. Gaigher,
L. Goosen, & R. de Villiers (Eds.). Proceedings of the 14th Annual SAARMSTE
Conference, Africa, 540–546. South Africa: University of Pretoria.
Mwakapenda,
W. (2008).
Understanding connections in the school mathematics
curriculum. South African Journal of Education, 28, 189–202.
Mwakapenda, W. & Adler, J. (2003). Using concept mapping to explore student
understanding and experiences of school mathematics. African Journal of
Research in SMT Education, 7, 51–62.
117
National Assessment of Educational Progress (NAEP), (2005). The science framework
for the 1996 and 2000 project. Washington, DC: Department of Education
Press.
National Institute for Educational Development (NIED) (1999). How learner centred
are you? Okahandja: NIED Printer.
Novak, J. D. (1990). “Concept mapping: A useful tool for science education”. Journal
of Research in Science Teaching, 27(10), 937–949.
Novak, J. D. (2008). Concept maps: What the heck is this? Retrieved from http://cmap.
ihmc.us/Publications/ResearcPapers/TheoryCmaps/TheoryUnderlyingConcept
Maps.htm
Novak, J. D. (2011). A theory of education: Meaningful learning underlies the
constructive
integration of thinking, feeling, and acting leading to
empowerment for commitment and responsibility. Meaningful Learning
Review, 2(1), 1–14.
Novak, J. D. & Canas, A. J. (2008). The theory underlying concept maps and how to
construct and use them. Retrieved from http://cmap.ihmc.us/publications
/researchpapers/theory cmaps/theoryunderlyingconceptmaps.htm
Novak, J. D., Mintzes, J. J. & Wandersee, J. H. (2000). Learning, teaching, and
assessment: A human constructivist perspective. In J. J. Mintzes, J. H.
Wandersee, & J. D. Novak (Eds.). Assessing science understanding: a human
constructivist view. San Diego, CA: Academic Press.
Nyambe, J. & Griffiths, J. (2010). Deconstructing educational dependency: Insights
from
a
Namibian
college
of
118
teacher
education.
Retrieved
from
http://www.nied.edu.na/publications/journals/journal10/Journal%2010%20Artic
le%203.pdf
Okebukola, P. A. (1991). The concept mapping heuristic as viewed by some Australian
and Indonesian science teachers. Research in Science Education, 21, 263–270.
Oliver, E. (2007). Effective teaching strategies for promoting conceptual understanding
in secondary science education (Master thesis). Retrieved from http://archives.
evergreen.edu/masterstheses/Accession890MIT/%20OliverEmma%20MITthesi
s%202007.pdf
Osborne, J. F. (1996). Beyond constructivism. Science Education, 80(1), 53–82.
Osborne, J. F., Erduran, S. & Simon, S. (2004). Enhancing the quality of argumentation
in school science. Journal of Research in Science Teaching, 41(10), 994–1020.
Ottevanger, W., van den Akker, J. & de Feiter, L. (2007). Developing science,
mathematics, and ICT education in Sub-Saharan Africa: Patterns and
promising
practices.
Retrieved
from
http://siteresources.worldbank.org/
INTAFRREGTOPSEIA/Resources/No.7SMICT.pdf
Over, M. (2011). Impact evaluation using quasi-experimental design. Retrieved from
http://cega.berkeley.edu/assets/cega_events/33/2.04_Quasi-ExperimentalDesign
sOver. pdf
Ozdemir, G. & Clark, D. B. (2007). An overview of conceptual change theories.
Eurasia Journal of Mathematics, Science & Technology Education, 4(3), 351–
361.
Pajares, F. (2007). The elements of a proposal. Retrieved from http://www.
des.emory.edu/mfp/proposal. html
119
Patton, M. Q. (2002). Qualitative research and evaluation methods (3rd ed.). Thousand
Oaks: Sage Publications.
Perkins, D. N. (1993). Teaching for understanding. American Educator, 17(3), 28–35.
Piaget, J. (1985). The equilibration of cognitive structures: The central problem of
intellectual development. Chicago: University of Chicago Press.
Pomuti, H., Shilamba, P., Dahlström, L., Kasokonya, S. & Nyambe, J. (1998). Critical
practitioner inquiry: The first steps towards a critical knowledge base of
education in Namibia, Reform Forum: Journal for Educational Reform in
Namibia, 6, 1–5.
Prawat, R. S. (1996). Learning community, commitment and school reform. Journal of
Curriculum Studies, 28(1), 91–110.
Prediger, S. (2008). The relevance of didactic categories for analysing obstacles in
conceptual change: Revisiting the case of multiplication of fractions. The
Journal of the European Association for Research on Learning and Instruction,
18(1), 3–17.
Rajendran, N. S. (2001). Dealing with biases in qualitative research: A balance act for
researchers. Retrieved from http://nsrajendran.tripod.com/Papers/Qualconfe
2001.pdf
Rice, D. C. (2005). I didn’t know oxygen could boil! What preservice and inservice
elementary teachers’ answers to ‘simple’ science questions reveals about their
subject matter knowledge. International Journal of Science Education, 27(9),
1059–1082.
120
Rollnick, M., Mundalamo, F. & Booth, S. (2012). Concept maps as expressions of
teachers’ meaning-making while beginning to teach semiconductors. Research
Science Education, 10, 1–20.
Roth, W. M. (1995). Authentic school science: Knowing and learning in open-inquiry
science laboratories. London: Kluwer Academic Publishers.
Safdar, M., Hussain, A., Shah, I. & Rifat, Q. (2012). Concept maps: An instructional
tool to facilitate meaningful learning. European Journal of Educational
Research, 1(1), 55–64.
Scherman, V. (2007). The validity of value-added measures in secondary schools.
(Unpublished doctoral dissertation). University of Pretoria, Pretoria.
Schwandt, T. A. (2007). The Sage Dictionary of Qualitative Inquiry (3rd ed.). USA:
Sage Publications.
Scott, P. H., Asoko, H. M. & Driver, R. H. (1992). Teaching for conceptual change: A
review of strategies. In R. Duit, F. Goldberg, & H. Niedderer (Eds.). Research
in physics learning: Theoretical issues and empirical studies. Kiel, Germany:
Institute for Science Education.
Shaver, A., Cuevas, P., Lee, O. & Avalos, M. (2007). Teachers’ perceptions of policy
influences on science instruction with culturally and linguistically diverse
elementary students. Journal of Research in Science Teaching, 44(5), 725–746.
Shope, R. E. (2006). The ED3U science model: Teaching science for conceptual
change. Retrieved from http://theaste.org/pubs/proceedings/2006proceedings/
Shope_1% 201 %20.htm
121
Shope, R. E. & Chapman, L. (2001). The space exploration team inquiry model:
Linking
NASA
to
Urban
Education
Initiatives
(ASTE
Proceedings).
Washington, DC: National Aeronautics and Space Administration Press.
Snively, G. & Corsiglia, J. (2001). Discovering indigenous science: Implications for
science education. Science Education, 85, 6–34.
So, W. W. M. (2003). Learning science through investigations: An experience with
Hong Kong primary school children. International Journal of Science and
Mathematics Education, 1, 175–200.
Stichweh, R. (1992). The sociology of scientific disciplines: On the genesis and
stability of the disciplinary structure of modern science. Science in Context, 5,
3–15.
Stoffels, N. T. (2005). ‘Sir, on what page is the answer?’ Exploring teacher decision
making during complex curriculum change, with specific reference to the use of
learner support material. International Journal of Educational Development, 25,
531–546.
Stoica, I., Moraru, S. & Miron, C. (2011). Concept maps, a must for the modern
teaching-learning process. Romanian Reports in Physics, 63(2), 567–576.
Strike, K. A. & Posner, G. J. (1992). A revisionist theory of conceptual change. In R.
A. Duschl, & R. J. Hamilton (Eds.). Philosophy of science, cognitive
psychology, and educational theory and practice. Albany, NY: Suny Press.
Tobin, K. (1993). Referents for making sense of science teaching. International
Journal of Science Education, 15, 241–254.
122
Tolley, L. M., Johnson, L. & Koszalka, T. A. (2012). An intervention study of
instructional methods and student engagement in large classes in Thailand.
International Journal of Educational Research, 53, 381–393.
Trochim, W. M. K. (2006). Concept mapping. Retrieved from http://www.
socialresearchmethods.net/kb/conmap.php
Vanides, J., Yin, Y., Tomita, M. & Ruiz-Primo, M. A. (2005). Using concept maps in
the science classroom. Science Scope, 28(8), 27–31.
Van Zele, E., Lenaerts, J., Wieme, W. (2004). Improving the usefulness of concept
maps as a research tool for science education. International Journal of Science
Education, 26(9), 1043–1064.
Vitale, M. R. & Romance, N. R. (1992). Using videodisk instruction in an elementary
science methods course: remediating science knowledge deficiencies and
facilitating science teaching attitudes. Journal of Research in Science Teaching,
29(9), 915–928.
Vosniadou, S., Ioannides, C., Dimitrakopoulou, A. & Papademetriou, E. (2001).
Designing learning environments to promote conceptual change in science.
Learning and Instruction, 11, 381–419.
Wambugu, P. W. & Changeiywo, J. M. (2008). Effects of mastery learning approach
on secondary school students’ physics achievement. Eurasia Journal of
Mathematics, Science & Technology Education, 4(3), 293–302.
Wang, J. R. & Lin, S. W. (2008). Examining reflective thinking: A study of changes in
methods students’ conceptions and understandings of inquiry teaching.
International Journal of Science and Mathematics Education, 6, 459–479.
123
Waters-Adams, S. (2006). The relationship between understanding of the nature of
science and practice: The influence of teachers’ beliefs about education,
teaching and learning. International Journal of Science Education, 28(8), 919–
944.
Wehry, S., Algina, J., Hunter, J. & Monroe-Ossi, H. (2007). Using concept maps
transcribed from interviews to quantify the structure of preschool children’s
knowledge about plants. Florida: University of Northern Florida.
Westbrook, S. L. & Rogers, L. N. (1996). Doing is believing: Do laboratory
experiences promote conceptual change? School Science and Mathematics,
96(5), 263–271.
Wilson, J. (1996). Concept maps about chemical equilibrium and students’
achievement scores. Research in Science Education, 26(2), 169–185.
Wood, A. (2011). Technology mediated assessment in the physical sciences: A
conceptual change approach. Retrieved from http://online.education.ed.ac.uk/
gallery/wood_oa_critical_review.pdf
Young, E. (2009). An example of a concept map. Retrieved from http://blogs.
ubc.ca/projectport folio/files/2009/03/elizabeth concept map.gif
Zoldosova, K. & Prokop, P. (2006). Education in the field Influences children’s ideas
and interest towards science. Journal of Science Education and Technology.
Retrieved from http://0-www.springerlink.com.innopac.up.ac.za:80/%28c2um
clz3ybpjnm554g1ntxje%29
124
APPENDICES
Appendix 1: A granted permission letter from the University of Namibia to carry
out a research
125
Appendix 2: A letter requesting permission from the permanet secretary
(Ministry of Education)
126
Appendix 3: A letter requesting permission from the director of education
(Khomas Region)
127
Appendix 4: A follow-up letter requesting permission from the director of
education (Khomas Region)
128
Appendix 5: An approval letter from the permanent secretary (Ministry of
Education)
129
Appendix 6: An approval letter from the director of education (Khomas Region)
130
Appendix 7: A letter requesting permission from the school principals (Khomas
Region)
P.O. Box 2588
Windhoek
NAMIBIA
19 September 2013
The School Principal
(School name)
Attention: (Principal’s name)
RE: APPLICATION FOR CONDUCTING A RESEARCH PROJECT
I am Jafet Shikongo Uugwanga, student number: 201176939, a maths & science teacher by profession
and Head of Department at (school name) in Khomas Region. Currently, I am a final year student doing
my Master degree (M. Ed) in Science Education with the University of Namibia.
This letter serves to request your permission to conduct a research study at your school as part of my
degree. This research study is funded by the Namibia Government Scholarship and Training Programme
(NGSTP) – Ministry of Education and an approval to carry out this research project is granted from the
University of Namibia, Director of Education and office of the Permanent Secretary – Ministry of
Education (see attached letters).
The topic of my research project is “Investigating the effectiveness of concept mapping in teaching
Natural Science: cases of two primary schools in Windhoek, Khomas Region” under the supervision of
Dr. Hedwig U. Kandjeo-Marenga and Mrs. M. Vries. The study explores the Natural Science teachers
understanding of concept mapping and the effectiveness of concept mapping on learners’ understanding.
I will conduct a research study with one of your Grade six Natural Science teacher together with his/her
class on “matter” as a topic. I will be an active participant-observer during the data collection, administer
a pre- and post-tests to the learners, conducting a short interview with the teacher for approximately ±15
minutes. The findings of this research will be shared with the participants, the schools and the Ministry
of Education.
I would like to assure you that your school, teachers and learners will not be named in any further
correspondences or in any reports. The participation of your school, teachers and learners in this research
is entirely for educational purposes, and all the information will be treated with utmost confidentiality.
I am looking forward to receive your favourable response.
Thank you for your time and understanding in advance.
Yours faithfully,
………………..……….
Mr. Jafet S Uugwanga
Cell: 085 555 302 0
E-mail: [email protected]
131
Appendix 8: A letter requesting permission from the teachers (consent form)
P.O. Box 2588
Windhoek
NAMIBIA
07 October 2013
Enquiries: Mr. Jafet S Uugwanga
Cell: 085 555 302 0
E-mail: [email protected]
Dear Teacher
Teacher’s name: ………………………………………………….
RE: REQUESTING YOUR PERMISSION TO PARTICIPATE IN THE
RESEARCH STUDY
The World is proud of having truly maths & science educators, as beings
who are positively changing the world in numerous ways. This is a small
gesture, but an enormously significant one. As a matter of fact, “we are
producing the best citizen, and --- producing the best workers, we are
building the strongest society and the most prosperous economy, and
teachers are the role models of any other professions” (McGuinty, in
Andrews, 2006, p.299)1.
I am Jafet Shikongo Uugwanga, student number: 201176939, a maths & science
teacher by profession and Head of Department at (school name) in Khomas Region.
Currently, I am a final year student doing my Master degree (M. Ed) in Science
Education with the University of Namibia.
This letter serves to request your permission to participate in this research study that I
am currently conducting as part of my degree. This research study is funded by the
Namibia Government Scholarship and Training Programme (NGSTP) – Ministry of
Education and an approval to carry out this research project is granted from the
1 Remarks made by Dalton McGuinty, Premier of Ontario. In Andrews, H. A. (2006). Awards and Recognition for
Exceptional Teachers: K-12 and Community College. Programs in the U.S.A., Canada and Other Countries. USA: Matilda
Press.
132
University of Namibia, Director of Education, office of the Permanent Secretary –
Ministry of Education and your school principal (see attached letters).
The topic of my research project is “Investigating the effectiveness of concept
mapping in teaching Natural Science: cases of two primary schools in Windhoek,
Khomas Region” under the supervision of Dr. Hedwig U. Kandjeo-Marenga and Mrs.
M. Vries. The study explores the Natural Science teachers understanding of concept
mapping and the effectiveness of concept mapping on learners’ understanding. I will
conduct a research study with one of your Grade six Natural Science teacher together
with his/her class on “matter” as a topic. I will be an active participant-observer during
the data collection, administer a pre- and post-tests to the learners, conducting a short
interview with you for approximately ±15 minutes.
You reserve the right to withdraw from the study at any time after its commencement.
The data will be shared with you during the analysis for the verification before the final
report is written. Thereafter, the findings of this research will be shared with you, the
school and the Department of Education.
I would like to assure you that in the final report, your identity will be disguised and
pseudonyms will be used. Your participation in this research is entirely for educational
purposes and all the information will be treated with utmost confidentiality.
……………………………………………..……………………………………………
INFORMED CONSENT
In terms and conditions of the ethical requirements of the University of Namibia and
the Ministry of Education, you are now requested to complete the following section to
declare yourself.
I understand the contents of this letter and I am willing to take part in this research
project. I understand that I may withdraw from the study at any time and that
anonymity will be guaranteed.
Participant’s Signature: _________________________
Date: ________________
Researcher’s Signature: _________________________
Date: ________________
133
Appendix 9: A letter requesting permission from the learners (consent form)
P.O. Box 2588
Windhoek
NAMIBIA
07 October 2013
Mr. Jafet S Uugwanga
Cell: 085 555 302 0
E-mail: [email protected]
Dear Learner
Learner’s name: ………………………………………………….
RE: REQUESTING YOUR PERMISSION TO PARTICIPATE IN THE
RESEARCH STUDY
I am Jafet Shikongo Uugwanga, student number: 201176939, a maths & science
teacher by profession and Head of Department at (school name) in Khomas Region.
Currently, I am a final year student doing my Master degree (M. Ed) in Science
Education with the University of Namibia.
This letter serves to request your permission to participate in this research study that I
am currently conducting as part of my degree. This research project is granted from the
University of Namibia, Director of Education, office of the Permanent Secretary –
Ministry of Education, school principal and your class teacher (see attached letters).
The study explores the Natural Science teachers understanding of concept mapping and
the effectiveness of concept mapping on learners’ understanding. You reserve the right
to withdraw from the study at any time after its commencement. I would like to assure
you that in the final report, your identity will be disguised and pseudonyms will be
used. Your participation in this research is entirely for educational purposes and all the
information will be treated with utmost confidentiality.
……………………………………………..……………………………………………
134
INFORMED CONSENT
In terms and conditions of the ethical requirements of the University of Namibia and
the Ministry of Education, you are now requested to sign the attached class list to
declare yourself.
I understand the contents of this letter and I am willing to take part in this research
project. I understand that I may withdraw from the study at any time and that
anonymity will be guaranteed.
Learner’s Signature: _________________________
Date: ________________
Researcher’s Signature: ______________________
Date: ________________
135
Appendix 10: PRE-TEST ITEMS ON “MATTER AND ITS PROPERTIES”
SECTION A (Multiple Choice Questions)
Learner’s No: _______
Date: _______________
Answer all the questions. For each question there are four possible answers: A, B, C
and D. Choose the one that you consider as correct and mark your choice in SOFT
pencil. If you want to change your answer, thoroughly erase the one you wish to delete.
1.
Which factors influence evaporation in nature?
A
Condensation
B
Frosting
C
Raining
D
Temperature
2.
What do we call the amount of matter in an object?
A
Mass
B
Weight
C
Volume
D
Capacity
3.
What can we say when two gases mix together?
A
B
C
D
4.
Condense
Melt
Diffuse
Evaporate
o
o
o
The freezing point of a substance X is 0 C. If X is heated from 0 C to 100 C, it
changes from which state to which one?
A
Gas to liquid.
B
Liquid to gas.
C
Solid to liquid
D
Liquid to solid.
136
5.
Which state of matter has no definite shape and no definite volume?
A
Gas
B
Liquid
C
Solid
D
Plasma
6.
Which state(s) of matter takes the shape of the container they are placed in?
A
Liquid only
B
Liquid and gas
C
Gas only
D
Liquid and solid
7.
Dry ice is used in fire extinguishers. The dry ice is stored in the cylinder in a solid
form. When it sprayed on a fire, it quickly changes into the gas known as carbon
dioxide (CO2).
What is this change of state called?
A
Sublimation
B
Distillation
C
Evaporation
D
Condensation
8.
When the temperature of a liquid is increased a little, what happens to its particles?
A
They come closer together.
B
They start vibrating more.
C
They move so far apart that the liquid becomes a gas.
D
They stop vibrating.
9.
What has mass and takes up space?
A
Weight
B
Volume
C
Space
D
Matter
137
10. A solid is a state of matter. What does it has?
A
An indefinite volume and an indefinite shape.
B
An indefinite volume and a definite shape.
C
A definite volume and definite shape.
C
A definite volume and an indefinite shape.
11. Study this diagram carefully. It shows the way that the particles of a gas occupy
space.
The particles of gas have lots of space and move randomly at high speeds in three
dimensions and collide with each other and with their container. The arrows
represent the velocities of the gas particles. Select the property of a gas from the
list below which is consistent with (matches) this micro-view of this state of
matter.
A
Does not flow.
B
Definite volume.
C
Definite shape.
D
Can be compressed.
12. What happens to the particles of ice when it melts?
A
They lose energy and begin to move.
B
They come close together and lose energy.
C
They gain energy and begin to move.
D
They move very far apart and gain energy.
Mr Uugwanga made observations as he watched a white candle burn. Use his data to
answer the next two questions.
Time
Observations
0 minute
Candle is lit, black smoke rises, flame starts
1 minute
Flame glows red and orange
2 minutes
Wax drips down sides
3 minutes
Candle is shorter than when it started
4 minutes
Hot gases are rising
138
13. Which of Mr Uugwanga’s observations would show that a burning candle has
chemical change?
A
Black smoke is given off; hot gases are rising.
B
The wax starts to melt.
C
The candle is white and made of wax and a wick.
D
Time passes one minute at a time.
14. Which of Mr Uugwanga’s observations would show that a burning candle has
physical change?
A
Black smoke is given off; hot gases are rising.
B
The wax starts to melt.
C
The flame glows red and orange.
D
Time passes one minute at a time.
15. Which one of the following is not a property of a solid?
A
Definite colour
B
Definite mass.
C
Definite shape
D
Definite volume
16. How can we describe the particles of a liquid?
A
Are tightly packed together and stay in a fixed position.
B
Have no viscosity.
C
Decrease in volume with increasing temperature.
D
Are free to move in a container but remain in close contact with one
another.
17. Which one of the following diagrams best represents a model of the particles in a
solid?
A
B
C
D
18. The term fluid may describe more than one state of matter. Which one of the
following best describes a fluid?
A
Liquid or solid
B
Solid or liquid or gas
C
Gas or liquid
D
Solid or gas
139
19. A house made of toy blocks is weighed. It is taken apart and each block weighed
separately. If the weight of all the blocks is added, what will it total?
A
A little less than the weight of the house.
B
The same as the house.
C
A little more than the weight of the house.
D
It would depend on how large the house was.
20. In which state of matter do the particles spread apart and fill all the space available
to them?
A
Plasma
B
Liquid
C
Gas
D
Solid
21. Which one is an example of man-made materials?
A
Wood
B
Glass
C
Oil
D
Rocks
22. What happens during the process of sublimation?
A
A solid turns directly into a gas.
B
A solid turns into a liquid.
C
A gas turns directly into a solid.
D
A liquid turns into a gas.
140
SECTION B
OPEN-ENDED (STRUCTURED) QUESTIONS
1.
Complete this diagram with suitable processes and state whether energy is
absorbed or released at each process.
melting
(_____________________ energy)
Solid
Liquid
__________________________
(____________________energy)
_____________________________
(_______________________ energy)
Gas
____________________________
(______________________energy)
2.
Fifty (50) grams of vinegar and 2 grams of baking soda are mixed together. A
bubbling reaction takes place. The mixture is weighed again and now weighs 49
grams. Clearly describe what happens to the missing weight by using diagrams?
3.
Use a diagram in order to show the physical change (property) of any substance.
141
Appendix 11: POST-TEST ITEMS ON “MATTER AND ITS PROPERTIES”
SECTION A (Multiple Choice Questions)
Learner’s No: _______
Date: _______________
Answer all the questions. For each question there are four possible answers: A, B, C
and D. Choose the one that you consider as correct and mark your choice in SOFT
pencil. If you want to change your answer, thoroughly erase the one you wish to delete.
1.
Which one of the following diagrams best represents a model of the particles in a
gas?
A
B
C
D
2.
What do we call the change from liquid to solid or the reverse of melting?
A
Condensation
B
Boiling
C
Sublimation
D
Freezing
3.
Water is boiled in a flask with a balloon over the top. As the water heats, the
balloon expands. What has happened to the weight of this flask and balloon in this
experiment?
A
It has increased as the balloon expands.
B
It has decreased as the water boiled away.
C
It has stayed the same.
D
It is unpredictable because the balloon is flexible.
4.
Stretching of a rubber band is an example of what force?
A
Pushing force
B
Pulling force
C
Non-contact force
D
Man-made force
142
5.
What is likely to be the same as the freezing point of water?
A
Melting point
B
Boiling point
C
Sublimation point
D
Evaporation point
6.
How do you know when something is a solid?
A
It will pour.
B
It takes the shape of its container.
C
It cannot be seen easily.
D
It will hold its shape.
7.
When a beaker of water is heated its volume increases a little. What is happening
to the particles in the liquid?
A
B
C
D
They are moving slower.
They are getting bigger.
They are getting smaller.
They are moving faster.
8.
Which of these objects sink in water?
A
A balloon filled with air.
B
A glass bottle full of liquid.
C
An old bicycle tyre.
D
An old piece of mattress.
9.
What evidence shows that ice has a physical change when left out in a room?
A
It reacts with oxygen in the air.
B
It changes to water.
C
It is hard and white.
D
It is cold to the touch.
10. What is vaporisation?
A
A gas becoming a liquid.
B
A liquid becoming a solid.
C
A gas becoming a solid.
D
A liquid becoming a gas.
143
11.
Which change of state occurs when particles in a solid begin to move slowly past
each other?
A
B
C
D
Subliming
Condensing
Boiling
Melting
12. What is the opposite of vaporisation?
A
Condensation
B
Sublimation
C
Evaporation
D
Freezing
The following data were collected by testing four substances. Each was tested to see if
it floated in water, burned when lighted with a flame, or melt when heated. Use this
data to answer the next two questions.
Substance
Floated in water Burned when lighted Melted when heated
Yes
Yes
No
1
No
No
No
2
Yes
Yes
No
3
No
No
Yes
4
13. Which substance had a physical change?
1
A
2
B
3
C
4
D
14. Which of the tests is reversible?
A
Floating in water
B
Burning when lighted
C
Melting when heated
D
Burning and melting in water
144
15. What do we call the materials that can break easily?
A
Flexible
B
Brittle
C
Waterproof
D
Malleable
16. In which state of matter are particles packed tightly together in fixed positions?
A
Gas
B
Solid
C
Liquid
D
Plasma
17. The diagram shows the changes in state of water (H2O). What is the process W
called?
A
B
C
D
Melting
Condensation
Boiling
Freezing
18. What does solar energy used for in our daily life?
A
To pollute our environment.
B
To cook our food.
C
To generate income.
D
To switch off the TV.
19. What do we call the smallest part of matter that can exist independently?
A
Molecule
B
Proton
C
Atom
D
Compound
145
20. It is an example of anything that has mass and takes up space.
A
Energy
B
Chemical change
C
Matter
D
Temperature
21. What is the difference between boiling and evaporation?
A
Evaporation occurs at one temperature only, while boiling may occur at
different temperatures.
B
Boiling occurs at one temperature only, while evaporation may occur at
different temperatures.
C
There is no difference between boiling and evaporation as in each case a
liquid is changed into a gas.
D
Boiling changes the liquid into a gas while evaporation makes the liquid
disappear.
22. Which state of matter is represented in this diagram?
A
B
C
D
Gas or liquid
Gas
Liquid
Solid
146
SECTION B
(OPEN-ENDED/STRUCTURED) QUESTIONS
1.
Use the concepts given below to draw a diagram in order to show how these
concepts link to each other:
Evaporization, condensation, boiling, melting, freezing, boiling, 0°C, 100°C,
absorbed energy, deposition, released energy, steam, water, ice, sublimation
2.
What happens to an ice cube left out on a plate in a warm room? Describe what the
ice cube looks like at first and what will happen next by using drawings.
3.
Use a diagram to explain why burning a piece of wood is a chemical reaction.
147
Appendix 12: An individual inteview schedule for teachers
Opening statement
Mr (teacher name), it is my please to thank you for allowing me to interview you. The
interview consists of five open-structured questions based on your understanding and
use of concept mapping during your instruction process. You are therefore reminded
that your responses will be treated with utmost confidentially and pseudonym will be
used instead of your real name.
SEMI-STRUCTURED INTERVIEW:
1.
Have you ever come across the word “concept mapping”? If yes, when did you
come across it? What was the concept map all about? In your own words, can you
describe what a concept map is all about?
2.
Have you ever tried to make use of concept mapping in your teaching? If yes, what
content did you teach?
3.
Can you describe to me how you use the concept mapping strategy during that
instruction?
4.
To what extend did you use concept mapping strategy in teaching science? Is it
poor, adequate, good, very good or excellent?
5.
Did your studies or professional development courses prepare you on how to teach
through the use of concept mapping?
Thank you for your time and valuable contribution!!
148
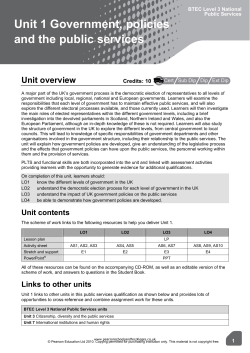
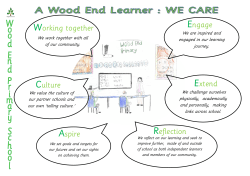


© Copyright 2026