
Pakistan Banks - BMA Capital Management
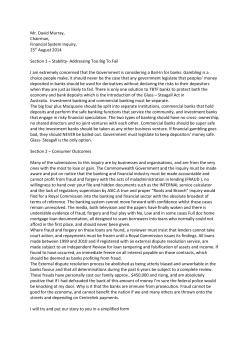
Pakistan
Pakistan Banks
27 May 2015
Pakistan Banks Sector Report
Undergoing a Paradigm Shift!
Banking Sector Performance
Absolute %
Relative to KSE %
1M
3M
-10%
-13%
-6%
-6%
-9%
-19%
Amidst continued monetary easing, with a reduction in the discount rate (DR) by a
further 100bps in the latest round, the State Bank of Pakistan has also introduced the
target rate (TR) at 50bps below the DR. This has resulted in an effective easing of
150bps, with lending benchmarks dependant on banking sector liquidity. At the same
time, the SBP has also squeezed the interest rate corridor (IRC) by 50bps, resulting in net
interest margin (NIM) compression for the banking sector. In the wake of aforementioned
variation in interest rate structure, we have downward revised earnings outlook by an
average of 8%-15% for the Big-5 banks across a 5 year investment horizon barring NBP,
the earnings of which are likely to recede by 20%. Amongst the mid-tier banks, earnings
suppression will be more profound given higher operating costs coupled with
concentration in traditional revenue avenues. Consequently, we have also reduced our
TPs by 7%-20% across the BMA Banking space. Within our coverage universe, we
continue advocate a preference for UBL and HBL due to their i) geographical
diversification, ii) growing non-funded income, iii) tamed admin cost and iv) de-risked
balance sheet. Based on revised earnings and TPs, UBL and HBL offer total returns of
34% and 18% from their respective TPs of PKR200/sh and PKR215/sh. 12M
Relative Chart KSE100 vs Banking Sector
Commercial Banks
KSE100 Index
May-14
Jun-14
Jul-14
Aug-14
Sep-14
Oct-14
Nov-14
Dec-14
Jan-15
Feb-15
Mar-15
Apr-15
May-15
30%
25%
20%
15%
10%
5%
0%
-5%
-10%
-15%
Source: KSE, BMA Research
Valuations (TPs)
New Old S HBL 215 243 ‐11.5% UBL 200 216 ‐7.4% NBP 56 70 ‐20.0% MCB 263 287 ‐8.4% ABL 116 135 ‐14.1% BAFL 29 36 ‐19.4% BAHL 51 58 ‐12.1% HMB 32 38 ‐15.8% AKBL 18 21 ‐14.3% FABL 16 20 ‐20.0% Source: BMA Research
Tweaking estimates post modification in interest rate structure: Following developments in
the May’15 MPS, we have downward revised our estimates for the Banking sector by 8%-15%
in CY15F & CY16F for the Big-5 (barring NBP) and 10%-20% for the mid tier banks. Given a
weaker asset quality and higher credit and operating costs, we downward revise NBP’s
earnings by a whopping 7% and 22% for CY15F and CY16F. Mid tier banks’ earning revision
far outpaces the Big-5 due to higher admin expenses, fewer avenues to augment non-funded
income and higher risk on asset re-pricing due to higher ADR.
Banks with diversified revenue base to be better placed: We believe the banks with a
diversified revenue mix, particularly growing proportion of non-funded income, are likely to
witness comparatively lower pressure on overall profitability. As such, UBL and HBL which have
the widest product range for catering to the growing demand from branchless banking, cross
selling and cash management services etc. will likely be better placed than peers.
Operating efficiencies; Big banks are efficiently placed: Given potent headwinds, banks
with notable cost efficiencies may potentially be better placed to tread through earnings growth
pressures. As such, big banks are well positioned due to <40% cost to income ratio, barring
NBP and BAFL. To mention, ABL and MCB have the lowest admin cost per branch at
PKR16.5mn and PKR17.4mn per annum, bringing cost to income to remarkable low levels of
31% and 36%, respectively.
Credit off-takes on the verge of take off: Given lowest DR of 7.0% in past 42 years and
muted private sector credit growth over the past 7 years, we foresee a faster than expected
growth in credit demand, going forward. To recall, in previous monetary easing cycle where
average DR stood at 8.0% (CY03-CY06), advances registered an average growth of 25%. We
believe banks with lower ADR (HBL: 38%, HMB: 39%, MCB: 41%, UBL: 44%) will potentially
post above average growth in advances.
Investment Perspective: On account of modification in the interest rate structure, we have
downward revised our valuations for the BMA Banking space by 7%-20% wherein UBL (down
7%), HBL (down 11%) and MCB (down 8%) are likely to be the least impacted. Mid-tier banks
are likely to take a larger hit due to higher admin expenses coupled with concentration in
traditional earning avenues. Within our coverage universe, we reiterate our preference for UBL
and HBL as the ideal proxies for economic re-rating.
Iqbal Dinani +92 111 262 111 [email protected] www.bmacapital.com Pakistan
Pakistan Banks
Tweaking estimates post modification in interest rate structure The State Bank of Pakistan (SBP) in its May’15 MPS has reduced the Discount Rate (DR) by 100bps to 7.0% (cumulatively 250bps cut in CY15TD). At the same time, SBP has also introduced the much awaited Target Rate (TR) at 6.5%, 50bps below the ceiling rate (DR). In addition, SBP has also shortened the Interest Rate Corridor (IRC) by 50bps to 200bps (250bps prior to MPS), consequently exerting further strains on banking spreads. While negative for the Banking sector as a whole, slow‐down in earnings growth will likely be mitigated by i) diversified revenue mix particularly increasing share from non‐funded income (HBL, UBL, NBP), ii) tamed operating costs leading to lower cost to income ratio (big 5 banks barring NBP), iii) asset mix tilted toward long duration GoP securities (MCB, UBL, ABL), iv) geographical diversification (UBL and HBL) and v) deposit mix skewed toward current account (BAFL, MCB). Incorporating the recent developments, we have downward revised earnings outlook of Big‐5 banks for CY15F/CY16F by 8%/15%, barring NBP the earnings of which are likely to plunge by a whopping 7%/22% primarily due to weak asset quality. Amongst mid‐tier banks, earnings suppression is more profound at 10%/20% for CY15F/CY16F due to higher admin expenses, fewer avenues to augment non‐funded income and increased risk of asset re‐pricing due to their higher ADR. Downward revision in earnings profile of BMA Banking Universe EPS CY15F S CY16E‐CY19E Old New S Old New HBL 24.4 22.6 ‐7.5% 26.3 23.1 ‐12.4% ‐9.7% EPS CY16F S UBL 21.2 20.1 ‐4.9% 23.6 21.3 ‐10.0% ‐8.3% NBP 8.4 7.8 ‐6.3% 9.9 7.7 ‐21.9% ‐19.8% MCB 26.0 25.0 ‐4.0% 28.0 25.9 ‐7.5% ‐7.0% ABL 15.0 14.0 ‐6.9% 16.9 14.6 ‐13.6% ‐13.0% BAFL 4.6 4.3 ‐7.2% 5.4 4.3 ‐20.3% ‐14.4% BAHL 6.3 5.8 ‐8.0% 7.0 6.0 ‐14.7% ‐15.0% HMB 5.1 4.6 ‐9.2% 5.5 4.6 ‐16.2% ‐16.5% AKBL 3.2 2.9 ‐9.7% 3.5 2.9 ‐16.9% ‐16.0% FABL 3.2 2.9 ‐8.8% 2.6 2.1 ‐19.9% ‐22.5% ‐15.3% ‐14.5% BMA Universe ‐7.2% Source: BMA Research Banks with diversified revenue base to be better placed Non Funded Income to mitigate pressures: With mounting strain on banking spreads in the wake of recent easing and narrowing of the IRC, banks with a higher proportion of non‐funded income are likely to witness comparatively lower pressure on profitability. As such, UBL and HBL, which have the widest product range for catering to the growing demand from branchless banking, cross selling, cash management services etc will likely be better placed than peers. Barring NBP, UBL has the highest contribution at 34% from non‐funded income (NFI) in total income followed by HBL (30%) and MCB (30% due to one‐off higher capital gains). Amongst mid‐tier banks, HMB and FABL have the largest contribution from NFI at 42% and 38%, respectively however; these are mainly driven by one‐off windfall gains on account of capital gain realization. 27 May 2015
1
Pakistan
Pakistan Banks
Capital gains to streamline earnings: At the same time, given a sizable PIB holding across the sector and a notable downward adjustment in PKRVs, there are likely to be substantial revaluation surpluses to be available on books. Going forward, we believe banks are likely to maneuver realization of capital gains in order to stream line their earnings with historical levels. Within Big‐5 banks, NBP & UBL may pose the biggest earnings surprises due to robust accumulated revaluation gains. Geographical presence aiding bottomline: In terms of geographical presence, HBL has widest outreach with 48 branches in 25 countries followed by NBP with 28 branches and UBL mainly located in Middle Eastern region with 18 branches. Since overseas operations are immune from domestic interest rate structure, we believe offshore operations would play a pivotal role in banking profitability. Revaluation Surplus (PKRbn) NII and NFI
NII
NFI
70
66
60
30% 34%
54%
19%
30% 28% 26%
42%
50
33% 38%
36
40
26
30
81%
70% 66%
70% 72% 74%
67% 62%
46%
58%
26
21
20
9
10
7
6
5
4
FABL
AKBL
HMB
BAHL
BAFL
ABL
MCB
HBL
UBL
NBP
FABL
AKBL
HMB
BAHL
BAFL
ABL
NBP
UBL
HBL
0
MCB
100%
80%
60%
40%
20%
0%
120%
Source: BMA Research Operating efficiencies; Big banks are efficiently placed Given potent headwinds, banks with notable cost efficiencies are likely to be better placed to tread through earning growth pressures. As such, big banks are well positioned due to <40% cost to income ratio, barring NBP and BAFL. To mention, ABL and MCB have the lowest admin cost per branch at PKR16.5mn and PKR17.4mn per annum, bringing cost to income to remarkable low levels of 31% and 36%, respectively. At the same time, BAFL has shown consistent improvement in operating cost as cost per branch stands at PKR31mn (down from PKR34mn in CY11), however, it still lags behind the Big 5. 40
35
38% 39% 40%
30
31%
40
40
31
26
22
17
17
ABL
MCB
25
20
30
BAFL
36%
39
35
NBP
46%
15
10
5
HMB
AKBL
HBL
UBL
BAFL
AKBL
BAHL
FABL
HMB
HBL
UBL
ABL
MCB
0
Source: BMA Research 27 May 2015
45
FABL
55% 55% 57%
50%
NBP
50%
40%
30%
20%
10%
0%
60%
BAHL
Admin Cost/Branch (PKRmn) Cost to income
2
Pakistan
Pakistan Banks
Credit off‐takes on the verge of take off Given lowest DR at 7.0% over the past 42 years and muted private sector credit growth in past 7 years, we foresee a faster than expected growth in credit demand, going forward. To recall, in previous monetary easing cycle where average DR stood at 8.0% (CY03‐
CY07), advances registered an average growth of 25%YoY. However, we believe banks will likely pursue a cautious credit expansion theme this time around where higher exposure will remain contingent to overall credit worthiness of the client. Moreover, gradual implementation of the China‐Pak Economic Corridor will further boost domestic appetite for investment and may augment private sector lending. Thus, we expect banking sector advances to register a compounded annual growth rate of 15%‐18% over the next five years. Banks with lower ADRs (HBL: 38%, HMB: 39%, MCB: 41%, UBL: 44%) will potentially post above average growth in advances, going forward. Historical Perspective Low ADR to benefit more
Dec‐17F
Dec‐15F
NBP
FABL
BAFL
AKBL
ABL
UBL
MCB
BAHL
HBL
HMB
30%
Dec‐13
40%
35%
30%
25%
20%
15%
10%
5%
0%
‐5%
48%
Avg. DR
Dec‐11
44% 45% 45%
Dec‐09
20%
10%
0%
41%
38% 39% 40%
Dec‐07
40%
54%
Dec‐03
60%
50%
Advances Growth
64%
Dec‐05
70%
Source: BMA Research Investment Perspective On account of recent modification in interest rate structure, we have downward revised our valuations for the BMA Banking space by 8%‐20% wherein UBL (down 7%), HBL (down 11%) and MCB (down 8%) are likely to be the least impacted. At the same time, NBP and BAFL are likely to be the worst hit with their TPs downward revised by 20% and 15%, respectively due to i) unabated cost pressures (BAFL, NBP) and ii) higher provisions (NBP). Within mid‐tier banks, FABL will likely witness the most pressure with a 20% downward revision in TP to PKR16, primarily due to higher admin cost. In terms of top picks, we reiterate our preference for UBL and HBL within our coverage universe as ideal proxies for economic re‐rating. 27 May 2015
3
Pakistan
Pakistan Banks
UBL‐ Least affected from the recent MPS changes Gauging impact of recent development: UBL is likely to be the least impacted in the wake of recent changes in interest rate structure owing to strong NFI coupled with geographical diversification. As such, incorporating the aforementioned changes, we have downward revised earnings for the next 5 years by an average of 8%, dragging TP to PKR200/sh (down 7%). Investment Triggers: Given least attrition in valuations in the wake of recent alteration in interest rate structure, UBL still offers an impressive total return of 34% owing to weak price performance of‐late. We continue advocating UBL as one of the preferred plays in BMA Banks due to i) strong offshore business with ~30% asset book parked overseas which is immune from recent changes in monetary rates, ii) continued dominance in branchless banking through UBL Omni, iii) investment book skewed toward long duration bonds (39% of deposits) and iv) de‐risked balance sheet. Key Risk: i) Delay in reform process resulting in economic de‐rating, ii) War‐hit Yemen may pose a potential risk to the tune of PKR9bn asset book and portrays a downside risk to earnings and valuation. Profit & Loss (PKRmn) CY13A CY14A CY15F CY16F CY17F Interest Income 72,846 82,735 82,061 91,539 107,271 Interest Expense 34,910 37,769 30,937 34,254 42,289 Net Interest Income (NII) 37,936 44,967 51,124 57,285 64,982 NII after provision 36,633 44,085 47,837 52,794 59,727 Non Interest Income 18,114 19,296 23,594 24,060 26,463 Non Interest Expenses 26,940 29,983 34,061 37,419 41,121 Profit before tax 27,807 33,398 37,369 39,435 45,069 Profit after tax 18,614 21,930 24,664 26,027 29,745 Balance Sheet (PKRmn) Investments Advances CY14F CY15F CY16F CY16F 497,334 570,609 624,479 692,039 390,813 434,264 498,903 588,142 692,003 1,009,739 1,111,414 1,237,103 1,408,440 1,607,077 Borrowing 40,574 53,065 50,453 58,016 66,676 Deposit 827,848 895,083 1,009,069 1,160,318 1,333,520 Total Liabilities 908,825 985,898 1,105,823 1,271,289 1,460,773 Share Capital 12,242 12,242 12,242 12,242 12,242 Core Equity 88,558 94,589 104,582 112,862 124,227 Total Equity 100,914 125,516 131,280 137,151 146,304 Key Ratios CY13A CY14F CY15F CY16F CY16F EPS (PKR) 15.2 17.9 20.1 21.3 24.3 DPS (PKR) 10.0 11.5 12.8 14.3 15.8 DY 5.7% 6.6% 7.3% 8.1% 9.0% BVS (PKR) 82.4 102.5 107.2 112.0 119.5 Total Assets 27 May 2015
CY13A 423,777 P/B 2.1 1.7 1.6 1.6 1.5 ROE 19.3% 19.4% 19.2% 19.4% 21.0% ROA 2.0% 2.1% 2.1% 2.0% 2.0% Net Interest Margin 4.8% 5.1% 5.1% 5.0% 4.9% Cost to Income 46.5% 45.2% 43.9% 44.3% 43.3% ADR 52.8% 53.6% 54.3% 55.3% 56.3% IDR 51.0% 53.8% 55.5% 53.1% 51.4% CASA 70.6% 73.4% 73.1% 73.1% 73.1% Infection Ratio 12.1% 11.2% 10.4% 9.6% 8.9% Provision Coverage 87.3% 84.9% 85.8% 86.8% 87.9% 4
Pakistan
Pakistan Banks
HBL ‐ Mitigating bottomline pressures Gauging impact of recent development: As with other banks, HBL will also feel the pinch of the recent changes in the interest rate structure, however, the impact will be felt to a lesser extent than peers given diversification in revenue base. Earnings for HBL have been downward revised by 7.5% and 12.5% for CY15F and CY16F, respectively with a revision in TP to PKR215/sh, down 11% from previous estimate. Investment Triggers: Our conviction on strong fundamentals stems from i) commendable geographic diversification through branch network and investments (associates & JVs) wherein we have observed a consistent profit sharing from Diamond Trust Bank Kenya, ii) HBL aggressively expanding product mix to support NFI (30%+ share in total income), iii) lower cost to income ratio (<40%), iv) strong capital base to tap incremental credit demand because of lower prevailing ADR at 38% and v) prudent risk management framework. Despite downward revision in estimates, we currently have an Accumulate call on the scrip with revised TP of PKR215/sh, offering a total return of 18% (upside: 12% + DY: 6%). Key Risk: i) Potential risk emanates from delay in reform process resulting in economic de‐rating, ii) sovereign risk due to presence in different economies CY13A CY14A CY15F CY16F CY17F Interest Income Profit & Loss (PKRmn) 120,605 137,842 128,401 139,620 162,312 Interest Expense 65,207 68,756 60,911 68,130 83,979 Net Interest Income (NII) 55,397 69,087 67,490 71,490 78,333 NII after provision 53,998 67,593 65,337 67,724 74,860 Non Interest Income 18,941 23,512 30,814 34,172 35,328 Non Interest Expenses 36,806 42,590 45,130 49,842 54,587 Profit before tax 36,133 48,515 51,022 52,053 55,600 Profit after tax 23,027 31,820 33,164 33,835 36,140 826,062 924,307 1,049,136 1,168,339 1,301,313 Balance Sheet (PKRmn) Investments Advances Total Assets 563,701 595,295 686,190 806,872 947,782 1,715,271 1,865,397 2,084,326 2,358,812 2,674,319 Deposits 1,401,230 1,524,538 1,709,812 1,947,686 2,218,462 Total Liabilities 1,572,837 1,695,295 1,905,817 2,170,960 2,472,777 Share Capital 13,335 14,669 14,669 14,669 14,669 Core Equity 130,634 147,265 161,151 175,566 191,958 Total Equity 142,434 170,103 178,509 187,852 201,542 Key Ratios 27 May 2015
EPS (PKR) 15.7 21.7 22.6 23.1 24.6 DPS (PKR) 7.3 12.0 12.4 12.7 13.6 DY 3.5% 5.8% 6.0% 6.1% 6.6% BVS (PKR) 97.1 116.0 121.7 128.1 137.4 P/B 2.1 1.8 1.7 1.6 1.5 ROE 16.7% 20.4% 19.0% 18.5% 18.6% ROA 1.4% 1.8% 1.7% 1.5% 1.4% Net Interest Margin 3.9% 4.6% 4.0% 3.7% 3.6% Cost to Income 50.5% 46.7% 46.9% 48.9% 49.5% ADR 45.0% 43.4% 44.1% 45.1% 46.1% IDR 59.1% 59.5% 60.4% 59.2% 57.9% CASA 73.3% 67.1% 71.3% 71.3% 71.3% Infection Ratio 12.7% 12.0% 10.7% 9.4% 8.5% Provision Coverage 83.5% 83.2% 84.8% 86.8% 87.0% 5
Pakistan
Financials: Banks
Pakistan Banks
BMA Capital Management Limited | Pakistan Karachi Office Islamabad Office Unitower, Level 8, Office No. 104, 1st Floor, I.I. Chundrigar Road, Gulistan Khan House Plaza, Karachi ‐ 74000, Fazal‐e‐Haq Road, Blue Area, Pakistan Islamabad, Pakistan UAN: +92 21 111 262 111 Tel: +92 51 280 2354‐5 Fax: +92 21 3243 0748 Fax: +92 51 280 235 [email protected] [email protected] Analyst Certification All research is based under the regulatory oversight of BMA Capital Management Limited, a Corporate Member of the Karachi Stock Exchange (KSE) and regulated by the Securities and Exchange Commission of Pakistan (SECP). Each Analyst of BMA Capital Management Limited whose name appears as the Author of this Investment Research hereby certifies that the recommendation and opinions expressed in the Investment Research accurately reflect the Investment Analyst’s personal, independent and objective views about any and all of the Designated Investments or Relevant Issuers discussed herein that are within such Investment Analyst’s coverage Universe. Disclaimer BMA Capital Management Limited and / or any of its affiliates, which operate outside Pakistan, do and seek to do business with the company (s) covered in this research document. BMA Capital Management Limited also expects to receive or intends to seek compensation for Corporate Finance services from the company covered herein in the next 6 months, excluding acting as a corporate broker, on a retained basis, for the relevant issuer. As such, investors should be aware that BMA Capital Management Limited may have a conflict of interest that could affect the objectivity of this research report. Investors should consider this research report as only a single factor in making their investment decision. This research report is for information purposes only and does not constitute nor is it intended as an offer or solicitation for the purchase or sale of securities or other financial instruments. Neither the information contained in this research report nor any future information made available with the subject matter contained herein will form the basis of any contract Information and opinions contained herein have been complied or arrived at by BMA Capital Management Limited from publicly available information and sources that BMA Capital Management Limited believed to be reliable. Whilst every care has been taken in preparing this research report, no research analyst, director, officer, employee, agent or adviser of any member of BMA Capital Management Limited gives or makes any representation, warranty or undertaking, whether express or implied, and accepts no responsibility or liability as to the reliability, accuracy or completeness of the information set out in this research report. Any responsibility or liability for any information contained herein is expressly disclaimed. All information contained herein is subject to change at any time without notice. No member of BMA Capital Management Limited has an obligation to update, modify or amend this research report or to otherwise notify a reader thereof in the event that any matter stated herein, or any opinion, projection, forecast or estimate set forth herein, changes or subsequently becomes inaccurate, or if research on the subject company is withdrawn. Furthermore, past performance is not indicative of future results. The investments and strategies discussed herein may not be suitable for all investors or any particular class of investor. Investors should make their own investment decisions using their own independent advisors as they believe necessary and based upon their specific financial situations and investment objectives when investing. Investors should consult their independent advisors if they have any doubts as to the applicability to their business or investment objectives of the information and the strategies discussed herein. This research report is being furnished to certain persons as permitted by applicable law, and accordingly may not be reproduced or circulated to any other person without the prior written consent of a member of BMA Capital Management Limited. This research report may not be relied upon by any retail customers or person to whom this research report may not be provided by law. Unauthorized use or disclosure of this research report is strictly prohibited. Members of BMA Capital Management and/or their respective principals, directors, officers and employees may own, have positions or effect transactions in the securities or financial instruments referred herein or in the investments of any issuers discussed herein, may engage in securities transactions in a manner inconsistent with the research contained in this research report and with respect to securities or financial instruments covered by this research report, may sell to or buy from customers on a principal basis and may serve or act as director, placement agent, advisor or lender, or make a market in, or may have been a manager or a co‐manager of the most recent public offering in respect of any investments or issuers of such securities or financial instruments referenced in this research report or may perform any other investment banking or other services for, or solicit investment banking or other business from any company mentioned in this research report. Members of BMA Capital Management Limited may have acted upon or used the information or conclusions contained in this research report, or the research or analysis on which they are based, before publication of this research report. Investing in Pakistan involves a high degree of risk and many persons, physical and legal, may be restricted from dealing in the securities market of Pakistan. Investors should perform their own due diligence before investing. No part of the compensation of the authors of this research report was, is or will be directly or indirectly related to the specific recommendations or views contained in the research report. By accepting this research report, you agree to be bound by the foregoing limitations. 27 May 2015


© Copyright 2026