
Proceedings2013 - rice
CONFERENCE PROCEEDINGS ON nd rice-Africa, 2 International Conference on Rice for Food, Market and Development Held at Nigerian National Merit Award Auditorium, Abuja, Nigeria th 6-8 March 2013 OPENING CEREMONY 1 ADDRESS OF CHAIRMAN OPENING CEREMONY, DR A.A. OCHOGBO, FORMER EXECUTIVE DIRECTOR NCRI, BEDEGI Honourble Minister of Agriculture and Rural Development Honourable Minister of State, Federal Capital Territory State Commissioners of Agriculture and Rural Development Executive Director of National Cereals Research Institute Team Leader, Agricultural Transformation Agenda, FMARD Co-ordinator, National Agricultural Foundation of Nigeria Deputy Dean, Faculty of Agriculture, University of Abuja Prof. Toshiyaki NATATSUKI, Kinki University, Nara, Japan Delegates and Participants (Foreign and Nigerian) Chairmen of Commodity Associations Great Farmers Gentlemen of the Press Distinguished Ladies and Gentlemen Over the decade, rice has occupied a prominent position as a strategic crop for food security and economic development in many nations of the world. The world rice consumption has been estimated at an annual growth-rate of 4 percent the estimated consumption rate higher in Africa. A conservative consumption rate of 4 percent annum implies that Nigeria would require between 6.41 and 7.12 million tonnes of milled rice to meet her consumption need by 2015. It has become evident from the recent global trend in rice industry that there is a growing import demand for the commodity in Africa, and Nigeria ranked the second largest importer of rice in the world after Indonesia. If the present import scenario persists, huge import bill would be expended on rice. The future may even be gloomier, considering the rice prices in the world market which have risen by as much as 40 percent are predicted to rise further. The enormous rice importation has been considered by various governments/regimes as an avoidable drain on the country’s foreign exchange earnings in view of the abundant natural endowments for expanded rice production in Nigeria. Both the past and present Nigerian governments have made deliberate 2 efforts through different policy measures, strategies and plans to encourage the production and marketing of rice in the country. Due to the growing demand for rice food and the increasing challenges to achieve food security, annual rice production needs to increase from the record of 586 million tonnes in 2001 to meet the projected global demand of about 756 million tonnes by 2030. The painful experience of the 2008 food crisis raises the question of the implications of Africa’s dependency on global food markets. The rice crisis led to an increase in the prevalence of food insecurity in urban areas where citizens in countries with high rice consumption levels spend 20 to 25 percent of their income on rice. Undoubtedly, African region is endowed with significant rice- growing potential, especially in Nigeria (2.4m hectares), Guinea (1m hectares) and Mali (0.5m hectares) to play a leading role as efforts are intensified towards sef-reliance in rice production and processing along value chains. Nigeria, for example, is committed to the achievement of national food security and plays a leading role in rice production in West Africa. From 1970s to date, many investment policies have been put in place to drive home the push towards self-reliance in rice production. Prominent among these include the establishment of Rice Research Station at Badeggi, Niger State which later metamorphosed to National Cereals Research Institute (NCRI). Investment in the rice research has so far developed and released 57 different rice varieties. More importantly, NCRI has developed improved rice technologies, which have been disseminated to farmers through the Agricultural Development Programme (ADPs). Other important programmes such as the National Fadama Development Project (NFDP), Special Rice Project (SRP), Green Revolution (GR), River Basin Development Authority (RBDA), National Accelerated Food Production Programme (NAFPP), National Agricultural Research Project 3 (NARP), etc, were variously established to improve the production, processing and marketing of rice for the overall development of the sub-sector. Despite the various rice development programmes embarked upon by several African countries, rice importation to bridge the gap between demand and supply widens every year due to some obvious problems in the rice sub-sector. Some of these problems include: high emphasis on increased rice production without corresponding adequate postharvest management that would produce quality rice that can compete favourably with imported rice in the market, lack of value addition development, inadequate infrastructures such as electricity, modern mills, farm machineries, etc, inadequate capital to procure inputs (seeds, fertilizers, herbicides, insecticides) and the politicization of rice development policy by some African governments. The emerging opportunities in Africa’s rice economy demand that all stakeholders - rice farmers, processors, marketers, researchers and policy makers in Africa’s rice sub-sector are provided with current technical information on the industry, from field to table. The rice sector in Africa requires a robust synergy of public-private partnership to cope with the challenges that relate to the growing demand for the commodity, sustainable production, farmers livelihood, rural development and a change from local multi-purpose activity to an increasingly market-oriented and integrated business. This conference brings together all stakeholders in the rice industry to brainstorm on issues that will promote rice for food, market and economic development. Thus, it intends to achieve among others, the following objectives: 4 (i) to share the lessons learnt from the research and development programmes conducted on rice production, processing and marketing; (ii) to discuss the new ideas and innovative approaches relevant to the delivery of rice value chain; and (iii) to discuss rice service delivery research and development strategies that meet the changing needs of smallholder rice farmers under a range of rice sector development scenarios. It is my sincere hope that this conference will facilitate rapid adoption of options and techniques that will feature in the subsequent sessions and significantly increase local production and processing as well as foster equitable integration of small- scale rice enterprises into marketoriented systems. This will not only reduce rice importation but will also increase foreign exchange savings, create jobs, reduce poverty, increase income and standard of living. Output and impacts The output from the conference will have considerable impact on government policy and R&D as well as private sector initiatives relevant to reduced inequity through enhanced economic opportunities for rice farmers, processors, traders and service providers in Africa. This will also provide an opportunity to assess the ways in which international organisations can effectively participate in and contribute to rice- industrial development in Africa. I welcome you all to Nigeria’s capital city and wish you fruitful deliberation that will create synergy to transform the rice industry in Africa. Thank you and God bless. A. A. Ochigbo, PhD (Reading) 5 6 SPEECH DELIVERED BY DIRECTOR-GENERAL, RAW MATERIALS RESEARCH AND DEVELOPMENT COUNCIL, ENGR (PROF) A. P. ONWUALU, (FAS) Web site: www.rmrdc.gov.ng E-mail: [email protected] Protocol I have the rare honour and privilege to welcome you all to the Rice-Africa, 2nd International Conference on Rice for Food, Market and Development, organized by Leaps Domicilliaries in collaboration with the Raw Materials Research and Development Council (RMRDC), Federal Ministry of Agriculture and Rural Development (FMARD), and the Federal Capital Development Authority (FCDA). Let me place it on record that the first summit on same subject matter was held in RMRDC, March, 2012. The proceedings of that summit have been published and are available to participants and the general public. Also, the Council, recognizing the vital importance of Rice as a major Nigerian staple food and a potential agro-raw material, commissioned a 5-member expert committee to compile data and a publication on Rice under our “Survey Report series on Agro-Raw Materials in Nigeria.” Both these publications are part of our effort in the promotion of major agro-raw materials with both food and industrial potentials. Let me quickly also state that the main objectives of today’s event are to: (i) share lessons learnt from Research & Development programmes conducted on Rice production, processing and marketing in Africa and possibly, Asia; (ii) discuss new ideas and innovative approaches relevant to the delivery of the Rice – value chain; and 7 (iii) provide practical experiences and tools for use in the development of the rice sub-sector under the following: a) Overcoming constraints to foster growth; b) Critical technologies for rice processing; and c) Value addition in the context of structural transformation, etc. Distinguished Ladies and Gentlemen, in supporting this conference, RMRDC recognized and was guided by the fact that: (i) Rice is an important staple crop of Nigeria, capable of providing the populace with the nutritionally required food security minimum of 2,400 calories/person/day. (ii) Nigeria is the largest world importer of rice with current annual importation of about 2.1million tonnes and by 2050 prediction, local consumption wo uld have risen from 5million tonnes presently at 7%/year due to population growth, to 35million tonnes. About $150billion would be required to import the 35million tonnes of rice in 2050 if the trend be allowed to continue. (iii)It is estimated that N1billion is spent every day on importation of rice of doubtful quality. The Honourable Minister of Agriculture recently revealed that Thailand and India were dumping 15-year-old rice stock in Nigeria. (iv) Nigeria has 84million hectares of arable land with less than 40% currently under cultivation, that can support adequate rice production if deployed accordingly. (v) The 6 geo-political zones can be mobilized for adequate local production and processing of rice if so desired. 8 (vi) With the current Agricultural Transformation Agenda (ATA), programme of the present administration, spearheaded by the Honourable Minister of Agriculture, the nation would be self-sufficient in rice production and complete substitution of imported rice by 2015. The Federal Ministry of Agriculture and Rural Development experts/officials would give more details about the Rice Transformation Agenda programme, which would gulp about $1.7billion in the next ten years. The whole gamut of rice value chain would hopefully be effectively addressed by the programme. The Food and Agriculture Organisation (FAO) has lauded Nigeria’s effort to achieve self sufficiency in rice production and projected that with increased rice output in Nigeria and Ghana, World Rice production for 2012 would outpace consumption in 2012/2013. From the point of view of RMRDC, adequate attention must be given to the “Waste Product” or by-product associated with projected production of 5million tonnes of milled rice. The broken pieces of rice arising from milling, the rice husk, which accounts for 20% of rice grain weight and the rice straw have huge industrial values, which must be explored and exploited to make the Nigerian Rice sub-sector more competitive. These “Waste” must be given more consideration than to be used merely as sources of energy through burning. Details of industrial potentials would be presented in the course of this conference. 9 Distinguished Ladies and Gentlemen, it is my candid opinion that at the end of this conference, our stock of knowledge in the challenges and opportunities available in Africa for the production and processing of rice would have been deepened and expanded. Finally I should not end this address without mentioning and acknowledging the continuous effort of local and especially international experts and collaborators involved in moving forward the development of rice production and processing in Africa. I wish you all a very fruitful interaction. Thanks for listening. Engr (Prof) Azikiwe Peter Onwualu (fas) Director-General, RMRDC 10 WELCOME SPEECH DELIVERED BY HONOURAB LE MINISTER OF STATE, FCT, OLOYE OLAJUMOKE AKINJIDE 1. Hon. Minister of Agriculture; 2. Hon. Members of the National Assembly present; 3. Special Advisers; 4. Permanent Secretaries; 5. Director General, Raw Materials Research and Development Council; 6. Executive Director, National Cereal Research Institute; 7. Deputy Dean, Faculty of Agriculture, University of Abuja; 8. Directors of Ministries present; 9. Members of the Rice Business Community; 10. Gentlemen of the Press; 11. Ladies and gentlemen. It is with gratitude to Almighty God that we are gathered here today to perform the opening ceremony of The 2ND International Conference on Rice Food, Market and Development, organized by rice-Africa. I am impressed with the effort of the private sectors, especially the organizer of this event, to partner with government to implement the transformation agenda of Government. I am equally happy that this event being a Pan-African conference is held annually to build rice promoters’ capacity. This, no doubt, underscores the significance of this event to the socio-economic development of our dear Country and Africa in general. You will agree with me that this conference is timely and it is in tandem with the rice value chain programme under the 11 Agricultural Transformation Agenda of the Federal Ministry of Agriculture and Rural Development. As you aware rice is a central part of many cultures and some countries even credit rice cultivation with the development of their civilization. It is the staple food for more than half of the world population. Rice is the world's most consumed cereal after wheat. It is the most rapidly growing source of food in Africa, and is of significant importance to food security in an increasing number of low- income food-deficit countries. Of the 10 metric tonnes of rice imported into Africa, Nigeria accounted for 2 metric tonnes which contributed to the 5 metric tonnes consumed annually in the country. Africa and Asia import over 85 percent of the internationally traded rice volume at about $1000 per tonne. Although 240 million people in West Africa rely on rice as the primary source of food energy and protein in their diet, the majority of this rice is imported, at a cost of USD 1 billion. Self- sufficiency in rice production would improve food security and aid economic development in West Africa. The present government of Nigeria is, therefore, committed and ready to support any programme that is geared towards providing the needed platform for the exchange of existing research information and linking research with policy process for strengthening the rice sector and fostering the equitable integration of small- scale rice enterprises into market-oriented systems. This is why I came here this morning to welcome participants to Abuja, to be engaged in rice value chain discussion that will improve value added activities in the sector; open new networks for partnership on rice processing and avail participants with technologies and equipment sourcing for rice processing. 12 The Federal Capital Territory, Abuja is growing fast to become the commercial ner ve centre in Nigeria. This is so, given the enormous agricultural endowments and other natural resources that abound in the area, as well as an enterprising population. In addition, Abuja is a strategic city that attracts business activities from all parts of the World. It is for these reasons that the city deserves the hosting of international conference of this kind to attract more investors and promote tourism. I am happy to state that rice activities in FCT are increasing tremendously and our administration has embark on several agricultural pilot projects in the Area Councils. For instance, our administration, is already partnering with FMARD to establish and install 2 units of high quality rice process plants in Kwali and Abaji. It is my belief that this will mark the beginning of more robust commercial activities in Abuja essential for the promotion of socio-economic development in the FCT, and indeed Nigeria. Once again, it is my pleasure to heartily welcome you all to Abuja and wish you a wonderful and useful deliberation to share information and create synergies to support the rice sector; to increase farmer/processor income and economic growth of the rice value chain by promoting the African rice in the global marketplace and prioritizing and s timulating interventions to increase competitiveness. Thank you. God bless you. And God bless FCT, the Federal Republic of Nigeria and Africa. 13 KEYNOTE ADDRESS BY HON. MINISTER OF AGRICULTURE AND RUARL DEVELOPMENT, DR. AKINWUMI ADESINA The Honourable Minister of State, FCT, The Permanent Secretary, Federal Ministry of Agriculture and Rural Development, The Executive Director, National Cereal Research Institute The Director General, Raw Materials Research and Development Council The Coordinating Director, rice-Africa, The Directors of Federal Ministry of Agriculture and Rural Development, The Directors of other Ministries and Parastatals here present, The Coordinator, SAWAH RICE PROJECT: NCAM/KINKI UNIVERSITY-JAPAN Deputy Dean, Faculty of Agriculture, University of Abuja, The Representatives of NEXIM, RIFAN and FACAN, The Representatives of IFPRI, UNIDO, BOI, CBN The Representatives of Civil Societies and NGOs, Members of the Rice Business Community; Gentlemen of the Press Distinguished Ladies and Gentlemen I am delighted and greatly honoured to deliver the keynote address at this 2 nd International Conference on Rice for Food, Market and Development; an annual event put together by rice Africa designed to build the capacity of rice stakeholders in Nigeria in particular and Africa region in general. 14 This meeting is timely and laudable, considering the challenges the rice transformation agenda has to contend with in recent time, this conference is complementing our effort in addressing these challenges, grow the rice subsector and achieve the overall objective of self sufficiency in rice production by 2015. This is why I am commending ‘rice-Africa’ the organizers of this international conference for their noble vision and desire to collaborate with us in developing the rice subsector. This is another achievement on the part of the private sectors to partner with government to implement the Agricultural Transformation Agenda. I am happy that this initiative aims at assisting the Africa rice industry in the co-creation of inclusive markets; that generate value addition, employment and income and build on the strength of existing structures, policies and programmes which are to promote and improve rice productivity and market competiveness in Africa. As you are all aware, rice is a strategic crop in Nigeria. Its importance as a strategic staple crop with an average per capita consumption of over 32kg; and a cash crop that can fetch higher prices for the stakeholders in the rice sector cannot be overemphasized. Therefore, Nigeria in her quest for self-sufficiency in food production as a means of achieving poverty reduction and food security in line with Agricultural Transformation Agenda has to support any initiative that is aimed at bringing stakeholders across countries to share information and create synergies to support the rice sector; to increase farmer/processor income; and economic growth of the rice value chain by promoting the African rice in the global marketplace and prioritizing and stimulating interventions to increase competitiveness. 15 This year conference, focusing on the value chain (from field to fork) and the links between firms, supporting service providers and its regulatory environments, is hope to diagnose issues affecting the chain as a whole, mobilize stakeholders through their involvement in diagnosis and problem solving and support more effective relationships with firms that benefit low income groups. This is particularly important for ensuring the inclusion of smallholders and small and medium enterprises (SMEs) in value chains. And with workshops that deal with the specificities of the requirements and needs for rice value chains development in Africa, it is hope that the discussion will capture lessons from different sources, and codifies those into actionable knowledge products that respond to the needs of farmers, processors and marketers and strengthening of rice- industrial linkages that improve opportunities for added value and serve as effective means of achieving economic transformation and sustainable livelihoods. We believe that the output from the conference will have considerable impact on R & D as well as private sector initiatives relevant to reduced inequity through enhanced economic opportunities for rice farmers, processors, traders, and service providers in Africa. May I at this point, gladly inform you that Nigeria has achieved appreciable success in rice production in recent years due to supportive policies and programme activities on rice. The Rice Transformation Agenda (RTA) was inaugurated in 2011 with the goal of self sufficiency in rice production and complete substitution of imported rice by 2015. In pursuant of this goal, some measures were taken to ensure food security. Some of these measures include: 16 Support to small- holder rice farmers through Growth Enhancement Support (GES) scheme in April 2012 in the form of 11,800mt of improved seed and fertilizer to cultivate 236,000ha. This at 3.5mt/ha yield in 2012 rice production season produced 826,000mt. The GES scheme delivers inputs (fertilizers and seeds) to farmers directly by using farmers’ cell phones. We created an electronic platform (e-Wallet) on which we registered farmers and agro dealers who own shops that sell farm inputs all over the country. To date we have registered 4.2 million farmers and about 900 agro dealers. We developed the first ever registered data base of farmers in Nigeria, which we will upgrade every year. For the first time ever, we can base policy decisions on data, not guess work. We now know and can identify our customers, the farmers. Government helps the farmers to buy inputs by providing direct support through their cellphones (e-Wallet). In the first year of the GES scheme, 1.2 million farmers received their subsidized fertilizers and seeds via their cell phones. We expect to have reached 1.5 million farmers by the end of the dry season. Supply of 384mt of FARO 44 to the Rice Millers to deliver to their out-growers in a bid to build a robust synergy between the millers and the farmers, and raise the yield and quantity to be delivered to the mills. Existing 25 private rice mills and the 40 new ones to be established this year will be supported to establish 3,000ha capable of growing 2 crops per annum under irrigation. This will give about 390,000ha which is expected to produce 2,340,000mt of paddy/annum at a projected yield rate of 6.0ton/ha under good cultural practices. 17 Appreciable progress has been recorded since the inception of the adoption of Value Chain approach in the implementation of Rice Transformation Agenda, but not without some challenges. The most outstanding of these challenges is the devastating flood disaster experienced globally at the third quarter of last year, Though the enormity of the disaster caused by the floods in the states where rice and other food crops were destroyed is appreciated, its adverse impact and the attendant effects on food shortages may not be as consequential as being speculated, as enough proactive measures to mitigate against the effects has be put in place, and these include: 1. Flood Disaster Recovery Programme designed to assist farmers affected by the floods to replant their fields. Let me say, that this singular effort to get inputs to farmers directly resulted in the addition of an estimated 8.1 million metric tons of food to the domestic food supply. This addition helped to mitigate the effect of the flood on the nation’s food supply and we were able to avoid a food crisis. 2. Double-up Production designed to increase production in areas not affected by the flood within the flooded States. 3. Dry Season Paddy Production Initiative being implemented in 10 States with high potentials for dry season paddy production to produce enough paddy to feed the newly installed integrated mills. The selected States are collectively cultivating 232,000ha of land which is expected to produce 812,000mt of paddy at a yield of 3.5mt/ha. 4. Support of dry season rice farmers with 185 diesel and 750 gasoline irrigation pump at 50% GES rate. 18 The GES scheme is helping farmers and cooperative groups to access tractor hiring services. Instead of the government procuring tractors for farmers, the government is encouraging the private sector to establish tractor hiring centers. Farmers can hire tractors from these centers and the cost of hiring tractors will be subsidized by the government through the e-Wallet using farmers’ cell-phones. I make bold to say, we will rebuild the broken walls of Nigeria’s agriculture and unlock wealth and opportunities for our farmers. Distinguished guests, ladies and gentlemen this gathering of today, reaffirmed the inner conviction I have that our collective vision of self-sufficiency in rice production in 2015 is in the right direction and indeed achievable, if the overwhelming support the transformation agenda is receiving from the various stakeholders who have keyed in into the programme is anything to go by. This gathering of the “rice family” is therefore timely and has added impetus to this vision, as it will provide the needed platform to realistically diagnose issues affecting the rice value chain as a whole, and proffer holistic and pragmatic solution to them in order to build a strong and virile rice industry. I, therefore, invite the international communities to join us to drive innovations and reforms to fully modernize and transform the rice sub- sector. I wish to reiterate that our hands are still opened and willing to collaborate with individuals, groups and corporate organizations who genuinely wish to partner with us in a bid to develop the rice sector into a virile and profitable industry. It is my hope that with the renewed commitment and vigour in the sub-region and the private sector at the driver’s seat, Africa will witness the development of competitive sustainable 19 and inclusive rice industry and rice business as a pathway to increased economic growth and food security in the continent. Distinguish ladies and gentlemen, thank you for coming, and God bless rice-Africa and God bless Nigeria. 20 PLENARY SESSION 21 IMPROVED RICE VARIETIES AND ADAPTABLE TECHNOLOGIES FOR HIGH EARNING CAPACITY OF FARMERS. Mark N. Ukwungwu, PhD Ag. Executive Director & M. E. Abo, PhD Assistant Director & Head Rice Research Programme National Cereals Research Institute, Badeggi, P.M.B 8, Bida, Niger State, Nigeria E- mail: [email protected], [email protected] 1.0 Introduction Rice has been selected by the United Nations (UN) as a primary crop to enhance global food security. In Africa, rice is a ‘region-wide strategic commodity’ as highlighted in the resolutions of the Abuja Food Summit organized by the African Development Bank in 2006. This makes it a priority crop in the implementation of the New Partnership for Africa’s Development (NEPAD). Just after wheat and corn, rice is the third most important crop contributing to human food supply. It represents 30 percent of the World’s total consumption in terms of the number of calories consumed per person. Although rice ranks fourth behind major staples such as sorghum, maize and cassava in terms of the overall volume of food consumed in Africa, it is the fastest growing source of food consumption in the continent with an estimated 4.6 percent annual growth rate. 22 Nigeria has made significant strides towards increasing its local rice production by encouraging the adoption of new and improved rice varieties mostly through cultivated area expansion and intensification (Ukwungwu et al., 2007).. Several rice development initiatives launched in Nigeria over the last decade are contributing to what is likely to become a leading trend of increasing rice production in Sub Saharan Africa (Ochigbo et al., 2003). National rice consumption currently exceeds 5.0 million metric tons per annum of milled rice or more than 30.0 kg per person per annum. This figure is significantly higher in urban areas exceeding annual per capita consumption of about 47.0 kg per capita. From 1980 to date, Nigeria has become the highest producer of rice in West Africa and third in Africa, after Egypt and Madagascar. The trend has made Nigeria to attain 2.103 and 3.46MMT of milled rice production in 2005 and 2008 respectively (NRDS, 2010). The increased production figure reported has been attributed to expansion in area under rice cultivation, adoption of high yielding, diseases resistant and fertilizer responsive varieties. Today’s statistics shows that Nigeria produces about 2.21 MMT milled rice per annum from about 2.0 million hectare of land, with an average unit land area yield of 1.5 tons per hectare. The national rice demand and supply gap is, therefore, bridged through importation. The estimated cost of which was about N356 billion in 2011. However, Nigeria currently has additional rice production potential of 2.68 million tonnes of paddy. The system of rice production in Nigeria is mainly through traditional methods which have been in existence for many decades. The average rice yield on farmers’ field had been 23 described as generally lower (1.8-2.0 tones/ha) than commonly obtained on experimental plots in lowland ecology (3.5 - 4.5 tones/ha) (Imolehin, 2000). The wide disparity in yield is partly due to incomplete adoption of the total technology package (Ojehomon et al., 2006), or due to stepwise adoption pattern of farmers based on risk consideration and scarcity of funds (Ojehomon et al., 2003). Other constraints often cited for these poor outputs include poor water management, nonuse of improved rice varieties and recommended production and processing practices, poor weed control, lack of inorganic fertilizer application, poor tillage operation, etc. (Adesina et al., 1994; Adesina and Baidu - Forson, 1995). Significant post-harvest losses ranging between 15-40 percent has been reported on rice fields due to the use of rudimentary technologies and poor practices. This constrains has reduced possible income small holder farmers could have made from rice cultivation. In its efforts to enhance food security through improved rice production through the adoption of improved varieties, cultural practices and best bet post- harvest practices, the Federal Government of Nigeria established the National Cereals Research Institute (NCRI) with a national mandate for genetic improvement and conduct of research into rice production, processing and utilization technologies. So far, NCRI using modern breeding technologies in collaboration with its national and international partners has released 62 improved rice va rieties, which has enabled farmers across the Country increase their yields and income. The adoption of improved rice production and processing technologies has led to increase productivity and higher income to farmers. This could, consequently lower the prices of agricultural products and generate greater economy efficiency and over-all growth in the national economy. 24 1.1 Rice Production Systems in Nigeria: The three main rice ecologies in sub-Saharan Africa are the rainfed upland, the rainfed lowland and the irrigated systems. The challenges and constraints in these rice ecologies are enormous (Abo et al., 2003). In addition, inter- linkages exist between the ecologies. This is true for water or nutrient flow from upland to lowland. Another fuzzy transition exists between rainfed and irrigated lowland. From the about 8 m ha of land under rice cultivation in sub-Saharan Africa, about 40 percent is located in the upland ecology, 37 percent in the rainfed lowland ecology and 14 percent in the irrigated ecology. In the upland ecology farmers’ yields usually range between 1 to 1.5 t ha -1 . This is caused by a host of abiotic and biotic stresses, such as low soil fertility, drought, and weed pressure and blast disease (Abo et al., 2003; Ukwungwu et al., 2009). The NERICA (New Rice for Africa) rice varieties such as NERICA 1 (FARO 55), NERICA 2 (FARO 56), NERICA 7 (FARO 57) and NERICA 8 (FARO 58) have made important headway in this ecology because of their better adaptation to the local stresses leading to higher and more stable yield and shorter growth duration. However, drought and soil fertility will limit attainable yields and potential yield gains from improved technology in the upland ecology will remain relatively small. In the rain fed lowland ecology, farmers can expect yields between 2.0 to 3.5 t ha -1 . This is largely due to better soil fertility and when combined with good water management and appropriate and yields can be as high as 6 t ha-1 . NCRI and other partners in rice development programmes in West Africa have developed a range of rice varieties suited for rain fed lowland ecosystem. These popular impoved lowland rice varieties include FARO 44 (Sipi), FARO 52 (WITA 4), FARO 57 (Tox 4008), FARO 60 (NERICA L – 19) and FARO 61 25 (NERICA L – 34). There are opportunities for diversification such as growing vegetables in the dry season. The irrigated systems have the highest yield potential because of better water control and reliability. Attainable yields in these systems can be as high as 8 t ha -1 , and rice double cropping is often feasible in the irrigated systems but its development in Nigeria has been restricted by a lack of adequate machinery to prepare the land and harvest the crop on time. 2.0 Status of Technology Development at NCRI NCRI has so far released 62 improved rice varieties for the diverse growth ecologies which most farmers are using across the Nigeria, which has enabled farmers increase their yields and income as well as assuring the upliftment of the rural populace. Combined with the improved varieties, the Institute also developed low input sustainable production systems for the resource-poor farmers (Abo et al., 2009a,b; Bright et al., 2009). 26 Table 1: Characte ristics of some released rice varieties in Nigeria from 1954 – 2011. Variety Old Variety Name Ecology Year of Release Growth Duration UPLAND 1958 95-120 Potential yield (t/ha) FARO 3 Agbede 16/56 FARO 11 OS-6 SS 1966 110 – 122 FARO 12 SML-140/10 SS 1969 145-155 FARO 29 BG90-2 IS & SS 1984 120 – 130 FARO 35 IT A 212 IS 1986 120 – 135 FARO 36 IT A 222 IS 1986 120-135 FARO 37 IT A 306 IS 1986 120-135 FARO 44 SIPI 692033 IS & SS 1992 110 – 120 FARO 46 IT A 150 Upland 1992 115 – 120 FARO 48 IT A 301 Upland 1992 123 2.0-3.0 FARO 49 IT A 315 Upland 1992 120 2.0-3.0 FARO 51 CISADANE IS & SS 1998 145-150 FARO 52 TOX 3100-44-12-3-3 (WITA 4) IS & SS 2001 125-130 IT A 321 Upland 2002 115 – 120 FARO 55 WAB 450-1-B-P36-HB (NERICA 1) Upland 2003 100-105 FARO 56 WAB 450-11-1-P31-HB(NERICA 1) Upland 2005 100 – 105 FARO 57 TOX 4004-43-1-2-1 IS & SS 2005 120-135 FARO 53 1.5-2.5 1.5-2.5 2.0-3.5 3.0-4.0 5.0-8.0 5.0-8.0 5.0-8.0 4.0-8.0 2.0-3.0 3.0- 8.0 3.0-5.0 2.0-3.0 2.0-3.0 2.0-3.0 6.0-8-0 FARO 58 NERICA 7 Upland 2011 100 – 110 3.0-4.0 FARO 59 NERICA 8 Upland 2011 100 – 110 3.0-4.0 FARO 60 NERICA-L 19 IL 2011 100 – 115 3.0-5.0 FARO 61 NERICA-L 34 IL 2011 100 – 115 4.0-6.0 FARO 62 NCRO 49 SS 2011 120 – 125 3.0-5.0 FARO=Federal Agricultural Research Oryza, IL = Irrigated Lowland, SS = shallow Swamp, IS = Irrigated Swamp 27 Table 2: Technologies Developed at NCRI and being transferred to Farmers and Co-operate Organizations in Nigeria Technology Year Released Incremental Value high yield per ha good cooking qualities stone/sand free free from odour reduced broken appeal to the eyes Development of 1987 – 2006 low input sustainable production systems for the resource poor farmers increased yield per ha realizing high income in small farm sizes 1994 – 2006 development new recipes Rice Milling 2001 – 2006 machines and parboilers Produce and process/mill Stone/sand free free from odour rice enough for reduced broken consumption/ exportation grains appeal to the eyes 62 improved rice Between 1954 varieties and 2011 Improved processing technology Crop utilization rice Between 1994 - 2006 Impact/Adoption Rate of 28 Challenges in Technology Transfer increased farmers income 65% adoption Increase farmers income reduced rice importation/45% adoption increase farmers’ income 45% adoption Farmers’ habit in holding to their old system Extension income generation and selfemployment Extension Importation of rice into the country/ Farmers attitude toward extension and adoption of technologies ADPs not properly funded importation of milled rice into the country liberalized trade Adopted at: Badeggi, AGIP farms in Bayelsa State, (Borma Rice), and Private Companies such as Obasanjo farms Ltd and several states in Nigeria Production of breeder and foundation seeds of rice. The cost of these seeds is affordable. The breeder seeds cost N500/Kg while the Foundation seeds cost N300/Kg. Developed improved processing technology (Agidi et al., 2009) Recommended practices for rice harvesting and post – harvest (Maji et al., 2009). 2.1 Curre nt Improved Rice varieties that have high yield and comme ndable grain quality and market value 2.1.1 Lowland: 1. FARO 44: early maturing (110-120) days, for shallow swamps and irrigated ecology, long narrow grains grained 2. FARO 52: medium maturity (120-135 days) medium deep swamps and irrigated ecology, long narrow grains 3. FARO 57: medium maturity (120-135 days), medium deep swamps and irrigated ecology medium grain size 4. FARO 60: early maturing (100-115) days, for shallow swamps and irrigated ecology, long narrow grains grained 5. FARO 61: early maturing (100-115) days, for shallow swamps and irrigated ecology, long narrow grains 2.1.2 1. 2. 3. 4. 5. 6. Upland: FARO 46; early maturity (115-120 days), long bold grains. FARO 55; early maturity (100-105 days), short medium grain size FARO 56; early maturity (100-105 days), narrow medium grain size FARO 53, 48 and 49; medium maturity (115 – 123 days), medium bold grains FARO 58, Early maturing (100-110 days) narrow medium grain size FARO 59, Early maturity (100-110 days) narrow medium grain size 29 3.0 Opportunities for Improved Rice Production In order to encourage investors and producers in the rice industry the following incentives exist: 1. The country has abundant land area for rice cultivation. About 5million ha could be put under cultivation out of which about 3m ha are utilized. Vast irrigable areas abound in many States. Given that the irrigated ecology is the best ecology for rice production in terms of yield per unit area, government should invest in the expansion and rehabilitation of existing dams in the State, as the potentials of such areas are quite tremendous 2. Favorable weather conditions. Amount of rainfall, temperature and relative humidity favor rice production 3. Soaring food crisis. This should serve as a catalyst for rice farmers to increase domestic food production (Abo, 2009). 4. Favorable Government Policies that encourage rice production. imposition of 10% rice levy of importation of rice. Examples are the Until now 100% tariff in rice importation was imposed to encourage local production and zero tariff rate on importation of agricultural chemicals and machineries. 5. Rice varieties that are adaptable to the various rice environments in the country are available. Such varieties could be sourced from NCRI, National Agricultural Seed Council (NASC), Seed Companies, Agricultural Development Programmes (ADPs), Community Based Seed Producers, etc. Production guides have been packaged by NCRI to ensure that the potentials of the released varieties are realized. 6. Opportunities abound for capacity building through human resource development as many farmers can benefit from formal and informal training on rice production systems. 30 New skills are acquired or developed. NCRI and the various partners in rice research and development are adequately poised to handle such. 7. Post – Harvest technologies are available and guides have been produced by NCRI to assist the end users 8. Presence of private sector agro-business establishments such as USAID-MARKETS, and DFID-PrOpCom to improve rural livelihood by expanding business opportunities in the rice value chain. 9. Have large irrigation schemes in Kano, Zamfara, Anambra, Kwara, Kogi, Adamawa, Niger, Sokoto, Kebbi, Borno, Bauchi, etc. However, rice yields in these schemes are between 2.0 – 3.5 t/ha as compared to the yield potential of 7 – 8 t/ ha. 4.0 New Research directions With recent increase in middle income earners in Nigeria and improving livelihood, most Nigerians are demanding for good quality rice. This push is aggravated by the involvement of many women in economic activities outside their home and requires quick-to-cook foods like rice and noddle. Making locally produced and processed rice competitive with foreign rice is defining research direction during the last few years. Improved intermediate rice processing technology approach has been adopted by the Institute to improve smallholder rice farmers produce rice of good quality that will earn him more money. These production technologies are being developed in line with sustainable environmental approach. The use of rice husk for heat energy generation during rice parboiling is being developed with an improved stove that will minimize heat loss and conserve heat. 31 The recent global warming challenges have also presents us in the sector with several challenges, ranging from change in temperature, rainfall pattern, and incidence of diseases. A recently new disease has been reported in areas where they are not frequently found and cases of flooding and drought in areas not prone to these constraints. Our research is currently working o n developing rice varieties that are tolerant to drought under the Stress Tolerant Rice for Africa and South Asia (STRASA) project. This approaches we believe will be environmentally sustainable and reduce challenges rice farming families are facing in the face of the changing weather, global economy and consumer shift in demand from coarse grain to good quality rice. The rice sector development through Hub approach will also take significant investment in the years to come. Currently, hubs are being deve loped under the Agricultural Transformation Agenda (ATA) of the Federal Government and the Task Force approach of Africa Rice Center (AfricaRice) to create a platform for all rice value-chain actors to work in a complementary way and maximize rice business for improved livelihood. We are also developing technologies for the development of value-added products from broken fractions of milled rice which currently command low premium. Appreciable economic losses are recorded by rice farmers due to poor milled rice quality. While working on developing small, cheap and efficient milling technology, in the short time the high turn out of broken rice must be utilized in the production of products that will generate higher income for smallholder rice farmers. 32 5.0 Conclusion The wide disparity in rice yield often obtained on farmer’s field than what is commonly obtained on experimental plots is essentially due to incomplete adoption of the total technology package, by farmers as well as other constraints such as inadequate use of improved varieties. Improved rice varieties and adaptable technologies therefore remain veritable tools for higher earning capacity of rice farmers in the country. The stakeholders in Rice Value Chain should adapt improved technologies to achieve optimum gains in their enterprises. The Agricultural Transformation Agenda (ATA) among other complimentary programmes and projects are there to improve the competitiveness of rice production, processing and marketing. However, to achieve these noble objectives Government of Nigeria should provide enabling environment for rice related investment, provide functional irrigation facilities through the rehabilitation of the existing schemes in the flood plains of major rivers, provide through private, public partnership rice production, processing and marketing facilities, improve on extension services. Above all, the National Rice Development Strategy (NRDS) document which focuses on post – harvest handling, processing and machinery, land development, irrigation development and water management, seed development and other inputs and mechanization to increase rice production within 10 years should be vigorously implemented. 33 References Abo, M. E. 2009. The global food crisis: causes, palliative measures and solutions. Proceedings of the 43rd Annual Conference of the Agricultural Society of Nigeria (ASN), Abuja. Pp.430 - 434. Abo, M. E. Gana A. S., Maji, A. T., Ojehomon, V.E. T., Ukwungwu, M.N., & Ochigbo, A.A., 2003. The challenges of rice varietal development and production in lowland ecology in Nigeria. Journal of Agriculture & Food Information, 5 (1): 51-66. Abo, M. E., Ukwungwu, M.N., Maji, A.T., Bright, E.O., Fatoba, I.O. & Ochigbo, A.A. 2009a. Recommended practices for rice production in the mangrove ecology in Nigeria. National Cereals Research Institute Badeggi, Nigeria, 15pp. Abo, M. E., Ukwungwu, M.N., Maji, A.T., Bright, E.O., Fatoba, I.O. & Ochigbo, A.A. 2009b. Recommended practices for lowland rice production in Nigeria. National Cereals Research Institute Badeggi, Nigeria, 14pp. Adesina , A. A. Johnson, D. E., & Heinrichs E. A. 1994. Rice pests in the Ivory Coast, West Africa: farmers’ perceptions and management strategies. International Journal of Pest management, 40(4): 293 – 299. Adesina , A. A., & Baidu – Forson,J. 1995. Farmers’ perception and adoption of new agricultural technology: evidence from analysis in Burkina Faso, West Africa. Agricultural Economics, 13(1): 1 – 9. Agidi, G., Ukwungwu, M.N., Abo, M. E.,. Bright, E.O., Usman, J., Fatoba, I.O. & Ochigbo, A.A. 2009. Recommended practices for quality rice processing. National Cereals Research Institute Badeggi, Nigeria, 11pp. Bright, E.O., Ukwungwu, M.N., Abo, M. E., Maji, A.T., Fatoba, I.O. & Ochigbo, A.A. 2009. Recommended practices for upland rice production in Nigeria. National Cereals Research Institute Badeggi, Nigeria, 12pp. Imolehin, E. D. (2000). Meeting the rice production and consumption demand of Nigeria with improved technology, International Rice Commission Newsletter Vo l.49. Maji, A.T., Ukwungwu, M.N., Abo, M. E., Bright, E.O., Fatoba, I.O. & Ochigbo, A.A. 2009. Recommended practices for rice harvesting and post-harvest. National Cereals Research Institute Badeggi, Nigeria, 6pp. NRDS (National Rice Development Strategy) (2010). National Rice Development Strategy Document for Nigeria prepared by the Federal Government of Nigeria and the Japan 34 International Cooperation Agency (JICA) for the Coalition for Africa Rice development (CARD). Ochigbo A. A., Ukwungwu M.N., Imolehin E. D., Abo M. E., Bright E.O., Maji A. T., & Danbaba, N. 2003. Rice Research Activities at the National Cereals Research Institute (NCRI) and Impact on Rice Production in Nigeria. Rice Digest, 1 (1):19 – 22. Ojehomon, V.E.T., Olaniyan, G.O., Ojehomon, O., & Abo, M. E., 2003. Adoption of improved rice varieties in the inland swamps of Niger State, Nigeria. Journal of Scientific and Industrial Studies, 1 (1): 10-15. Ojehomon, V.E.T., Abo, M. E., Ojehomon, O., & Ukwungwu, M.N., 2006. Adoption of recommended management practices in the lowland rice ecology of Niger State, Nigeria. TROPICULTURA, 24 (2): 82-89. Ukwungwu, M.N., Abo, M. E., & Bright, E.O. 2009. Recommended practices for the management of pests and diseases of rice producing in Nigeria. National Cereals Research Institute Badeggi, Nigeria, 24pp. Ukwungwu, M.N., Abo, M. E., Maji A. T., Fatoba I. O., Bright, E.O., & Ochigbo A. A. 2007. The evolution of rice research towards sustainable rice production in Nigeria. International Rice Commission Newsletter, 56:67-78. Umar, S. I., Ndanitsa, M. A. & Olaleye, S. R. (2009). Adoption of improved rice production technologies among youth farmers in Gbako Local Government Area, Niger State, Journal of Agricultural Extension, 13 (1): 1-8 Singh, B. N., Fagade, S., Ukwungwu, M. N., William, C., Jagtap, S. S., Oladimeji, O., Efisue, A., & Okhidievbie, O. 1997. Rice growing environments nd biophysical constraints in different agro – ecological zones of Nigeria. Meteorological Journal, 2 (1): 35 – 44. 35 PUBLIC-PRIVATE PARTNERSHIPS FOR ACCELERATED RICE DEVELOPMENT IN AFRICA. Prof. E.A. Aiyedun Deputy Dean, Faculty of Agriculture Department of Agricultural Economics and Extension University of Abuja, Nigeria Preamble Many types of public private partnerships have been developed to share the costs and risks of activities that are viewed as being beneficial from both a public and private sector viewpoint. In support of rice business and rice industry, partnerships have been developed in research and development, for infrastructure development, and to ensure that the specialized management competencies and technical expertise of private sector firms are directed at benefiting small farmers and processors. While there is increasing knowledge of and experience with publicprivate partnerships, the capacity to develop and implement such partnerships is still relatively underdeveloped. What are the needed range of support for the development and implementation of public-private partnerships, including appraisals and proposal preparation, strengthening of institutional capacity and, when appropriate, partial funding for well-planned initiatives directly supporting development of rice business and rice- industrial sector? 36 1.0 Background Public-Private Partnerships (PPPs) represent one possible solution, but private sector participation is constrained because investment in rural public infrastructure is often costly and high-risk. An important challenge is to know, when and where PPPs are value-adding propositions for infrastructure in market-oriented agro- industry development, and how best to formulate the financial and institutional arrangements for such collaboration. The use of PPPs for the provision of vital infrastructure should be approached from the perspective of State – business relations and wider development objectives, in which the partnership between the public and private sectors influences economic growth and poverty, reduction through investments that promote economic efficiency and returns that reduce uncertainty and minimize the risk of business failures. Beyond the provision of vital infrastructure, PPPs can be applied to agro-processing facilities. Since these are run as strictly commercial business operations, it is unlikely that the raising of capital for investment could be entrusted or transferred to a public body. The public sector is more likely to contribute in the form of land and physical structures through concessions or capital grants. The assumption is that private interests will assume the main commercial obligations and risks, leaving the State with the responsibility to ensure, so far as it is possible, that such projects will have a positive impact in job creation and poverty reduction. 2.0 Launching Public-Private Sector Dialogue In order to create awareness of opportunities and at the same time pin point challenges and preconditions, it is important to launch a public – private sector dialogue, with key stakeholders and actors in agribusiness value chains. These actors include producers, entrepreneurs, actors in trade, marketing, distribution, logistics, and finance and representatives from the public sector such as government ministries, technology institutes and innovation bodies; and donors and other national and international partners. Public – private sector dialogue could be launched at two levels. First, at Agribusiness fora for developing and implementing rice agribusiness value chains, focusing on awareness creation and policy dialogue with key stakeholders and international partners, and secondly at Agribusiness 37 value chain participant councils with key stakeholders at the national and international levels of enhancing horizontal and vertical integration and coordination. 3.0 Some Attractions and Turn-offs experienced by rice operators In order to establish the PPPs for accelerated rice development in Africa, one needs to examine some attractions for operators on rice as: existence of role models in the rice business; possibility of upgrading their skills; profits in rice business; ownership of resources of production; accessibility to financial assistance; markets; irrigation; and processing, and to improved technology. Some turn-offs of rice operators or intending rice operators include: inappropriate agricultural insurance; inaccessibility of credit due to stringent requirements; inadequate physical and social infrastructure in agriculture, uncertainties in prices of inputs and output, inaccessibility to suitable land and technical know-how; and especially for women: cultural practices that inhibit women from hiring men, discriminated or limited access to land, credit, input, extension and information, and some maternal challenges. 4.0 Roles of Public Sector in promoting rice development The needed support of rice operators from government include: mainstreaming rice operators empowerment programme into relevant programmes; provision of incentive/scholarship for rice operator entrepreneurs; provision of physical and social infrastructure; provision of wellequipped and functional rice-based agricultural institutions, research institutes and review of curricula at primary, secondary and tertiary education levels; massive public awareness on opportunities that abound. Civil society and development institutions such as IFAD, UNIDO, UNDP, FAO, IITA, etc, also have roles to play as Development partners. Such roles include: participation in policy formulation between Government, Civil society and other Development Partners and rice operators; advocacy for public-private partnerships; increase in research and training for rice entrepreneurs, technical and business advisory services in rice entrepreneurship; involving civil society in advocacy and lobbying of government on rice agribusiness, supporting networking initiatives among stakeholders. 38 5.0 Concrete Support/Incentives needed by rice entrepre neurs to be attracted to the business. Such assistance are in the areas of assisting the entrepreneurs to organize themselves to group to have access to land, credit, information, machines, seeds, grant for take off, and soft loans, inputs; trainings by non-government organizations (NGOs) and relevant institutions; sensitization and enlightenment campaigns and orientation to opportunities and best practices; recognition and award to best rice entrepreneurs; Non-government organizations (NGOs) to facilitate rice operators (producers, processes, transporters, input marketers, output marketers, etc) to form cooperatives/associations/groups for targeted intervention, with spec ial emphasis on processing and marketing as value chains women find most attractive. Special concern should be built around transportation and information being the value chain women find most repulsive. The need for private handsets/cell phones for accessibility to information by rice operators, service providers and facilitators cannot be over emphasized. 6.0 Way Forward The public sector provision of the enabling environment for the capable private sector to thrive is the answer. Government cannot do it alone. The made-to-be-efficient public sector needs to partner with the willing private sector in creating opportunities for young men and women by making rice business more productive, efficient, remunerative and competitive. Public-private partnerships could develop evidence-based set of policy guidelines that promote women and youth rice-based entrepreneurs in agribusiness development. There is a need to establish a platform to network and share salient information on available opportunities including best practices, technology, research, innovations, commodity prices and access to market. A need to facilitate the formation of communities of best practices among rice entrepreneurs cannot be overemphasized. There is also a need to develop comprehensive policy guidelines for promoting the profitable engagement of rice operators in agribusiness. Finally, there is a need to organize annual Award event to recognize successful rice entrepreneurs and organizations, as role models. An efficient and effective p ublic sector must partner with an efficient and effective private sector to produce the much desired public-private partnerships for rice growth and development in Africa. 39 NATIONAL AND REGIONAL RICE TRADE POLICIES Samuel Negedu, Ph.D National Coordinator, National Agricultural Foundation of Nigeria, Abuja 1.0 Introduction The cultivation of rice is among the most important development in human history because the grain has fed more people in the world over a longer period of time than any other agricultural product. Thus, rice has been usually discussed in relation to its significance to agricultural production and consumption and how these are intertwined with the economy, food system and cultures of various countries. However, due to the threat to rice-based production systems from trade liberation, how rice is traded nationally, regionally and globally has become a topical issue. 2.0 Global Rice Production and Trade There is an international market for rice, but it is often depicted as thin, volatile and risky. Less than 6 percent of rice produced in the world is traded globally, compared with about 18 percent for wheat, 25 percent for soya beans and 13 percent for maize. That means that most countries are self- sufficient in rice and face increased price volatility in times of production shortfalls. The thinness of rice trade stems primarily from the use of protectionist mechanisms to achieve national policy objectives of domestic food security and support for producer prices and incomes in major rice-producing and consuming countries. 40 The international rice market is also stratified by type and quality thus leaving little room for substitution, the four types are Indica, Japonica, aromatic and glutinous. Each has stratified levels of quality. This stratification further adds to the thinness, price vitality and uncertainty since due to numerous rice varieties and standards of quality, there is no generally accepted world market price for rice. At least 114 countries grow rice and more than 50 of such countries have an annual production of 100,000 metric tons or more. Asian farmers produce about 90 percent of the global total, with China and India growing more than half. Indonesia, Bangladesh and Vietnam come next, accounting for 8.4 percent, 6.9 percent and 5.4 percent respectively of the 416 million metric tons produced during the 2006 crop year (FAO, 2007) Outside Asia, Brazil and the US are the notable rice producers. In Africa, Egypt and Nigeria are the leaders while in the Europeans Union (EU), there are five rice producing countries namely Italy, Spain, France, Portugal and Greece. Thailand which ranks fifth among rice producing counties is the world’s top exporter of rice, accounting for 30 percent of total rice exports of 27.9 million metric tons in 2006. Vietnam and India are second and third with 17 percent and 15 percent shares respectively. The US which produces less than 2 percent of the world’s rice, comes fourth while Pakistan comes fifth. 41 The major importers in 2006 are Nigeria, Philippines, Iraq, and Saudi Arabia, importing 20 percent of the 27.9 million metric tons that was traded. Other larger importers include the EU, Iran, Malaysia, Senegal, South Africa, Brazil, China and Cote d’ Ivoire (FAO, 2007). Developing countries are the main players in world rice trade, accounting for 83 percent of exports and 85 percent of imports. This situation is in contrast to the fragmentation of import markets and the wide year to year fluctuations in individual countries’ purchases, resulting from the fact that importers do not rely consistently on the international market for rice supplies, but only as a last resort to fill the gap caused by a production shortfall. 2.1 Rice Trade and Policies in Major Producing and Consuming Nations Because rice has been so highly protected in both industrial and developing nations, trade liberalization under the Uruguay Round Agreement on Agriculture is having a profound impact on the international rice market. The changes in protection have been modest; however, rice remains one of the most protected food commodities in world trade. As a result of the more limited and longer market access reforms required for developing countries under the Uruguay Round, rice policies in developing countries have not changed significantly since the early 1990s. This lack of rice policy reforms has intensified price volatility, placing a heavy burden on poor consumers and on governments to provide food distribution programmes for the poor. 42 2.1.1 China China the largest rice-producing and consuming country accounts for nearly a third of the global rice economy. Rice has been an important component of China’s food grain security objectives and has been managed through procurement support prices to ensure stable supplies. Government rice stocks increases in the late 1990s to about 100 million metric tons, 73 percent of domestic use. In 1999, the government eliminated purchases of low quality early season rice and lowered the procurement prices for its rice purchases. The area planted with rice has declined (USDA PS&D 2003) and rice stocks were reduced by more than 30 percent by the end of 2002 to 67.7 million metric tons. In some coastal provinces, the government has since eliminated its procurement policy entirely, leaving producers to sell their rice in the open market (Wade and Junyang, 2003). The government policy now emphasizes quality over quantity and producers are quickly adopting improved quality varieties. The rice tariff rate quota negotiated by China was initially 2.66 million metric tons in 2002 equally divided between long- grain and medium and short-grian or other rice. Only 10 percent of the long- grain tariff quota and 50 percent of the medium- short grain quota are designated for private farms. The tariff rate quota rose to 3.78 and 5.32 million metric tons in 2003 and 2004 respectively (Sun and Branson 2002; Zhang, Matthews and Branson 2002). Nearly all rice imports are fragment jasmine rice primarily from Thailand. China is a significant exporter of low-quality long- grain rice, with principal markets in Cote d’ivoire, Cuba and Indonesia. Medium- grain rice is exported to Russia, Japan, the Republic of Korea and the Democratic Republic of Korea (Hansen and other, 2002). While the State trading 43 agency handles most rice exports, exports subsidies are not considered necessary for China’s rice export shipments. 3.0 The Nigerian Rice Economy Nigeria is the largest rice producing country in the West Africa region. Rice production rose gradually over the years with an expansion to surpass major rice producing countries such as Cote d’viore and Sierra Leone. The principal factors driving increased rice production in Nigeria is population growth and urbanization. In 2002, Nigeria accounted for nearly 44 percent of the total rice output and 57 percent of the total rice producing area in West Africa. Rice yields are low even by West African standards. Paradoxically, Nigeria is the largest importer of rice in the world. The annual demand for rice in the country is estimated at 5 million tons, while production level is 3 million tons of milled rice resulting in a deficit of 2 million tons. Over the years, the country had resorted to imports to bridge this deficit. The national agricultural policy emphasis self-sufficiency in food production, including rice. Policy review targeted at rice production addresses the pertinent problem of rice production, quality processing, marketing, distribution, domestic and export in a holistic and integrated manner. In line with the policy framework of market liberalization, the Federal government of Nigeria would seek to foster Public-Private-Partnerships (PPPs). 44 An issue of concern to the Nigerian farmers is the effect of rice imports on domestic production. Rice commodity marketing is of two forms in Nigeria namely: paddy rice and processed rice. The processed rice also includes milled rice and rice flour. The two major potential markets are markets for commercial processing and household consumption. Both markets are in the hands of the private sector but adversely affected by imports. Evidence show that the share of imported rice in the urban market is relatively higher than domestic produced rice. Nigerian consumers will, therefore, measure the quality of domestic rice by the current standards and quality in imported rice. Markets for domestic rice are shrinking due to rice imports. Three methods of rice processing can be identified in Nigeria. These are the traditional or handpounding, the small mill and large mill processing. 3.1 Competitiveness of Nigerian Rice. In the international markets, rice is graded by quality usually in the percentage of broken rice, sortexed or non-sortexed long grain or short grain. The better the quality, the higher the price in the international market. So, quality determines price. The cost of processing Nigerian paddy to produce rice of international standard is high and at current exchange rates cannot compete in the international market. 3.2 Effects of Policy inconsistency on Nigerian rice production The decline in domestic rice production cannot be blamed entirely on increasing rice imports. The Nigerian government has actively interfered with the rice economy over the last thirty years. The country’s policy on rice has been inconsistent and has oscillated between import tar iffs and 45 import restrictions including outright ban. For instance, between 1986 and 1994 rice imports were illegal. In 1995, imports were allowed at a 100 percent tariff. In 1996, the tariff was reduced to 50 percent but came full circle to 100 percent in 2002. The policy inconsistency has discouraged local production over the years. 4.0 Rice Imports in West Africa: Trade and Food Policy While trade liberalization is considered as an important stimulus for the expansion o f small holder based production targeting global markets and increasing attention has been given to its potential adverse impact on small holders’ competitiveness on domestic food products markets. With an amount close to one billion US Dollar in recent years, rice imports weigh heavily o n West African countries’ foreign reserves. It is the most important agro- food imports, representing about 20 percent of agricultural imports total value of the sub-region throughout the last thirty years. The prevalence of rice imports is an indication of the persistence of food deficit in the sub-region, thus, its reduction has been a recurrent objective of past and present food policies. Initially triggered by the food crisis of the early seventies, the rapid growth of rice imports responds to an increasing demand induced by a change in consumers’ behavior. This rice diet transition has been supported by income growth and urbanization. Attempts by the various governments to reduce the rice deficit through local production have not resulted in the significant reduction of the deficit. 46 The decision made by the 29th ECOWAS Heads of State Summit in January, 2006 to enforce a CET scale of the ECOWAS by January, 2006 have reopened the debate among policy analysts, decision makers and other stakeholders on the interdependence between trade and the agricultural policy. The review of recent trends of the rice economy in Ghana, Senegal and Nigeria put in perspective with the different degrees of rice market liberalization shows that the enforcement of higher tariff could not be the only incentive for accelerating domestic rice production expansion. The particular position of rice in West African urban diet, the strong segmentation of the rice market on the basis of local and imported rice attributes are major factors that hinder the expected impact of tariff enforcement. Local rice producers and in particular the ones who have a comparative advantage in rice production, would only be able to withdraw any benefit from a tariff increase if they are able to market their products under the same condition as the ones prevailing for imported rice and to compete with imported rice not only in terms of price but in terms of market attributes and success (Lancon and Benz, 2007) Modernization of the local rice value chain in the downstream segment requires long term investments in order to achieve the desired quality. 4.1 Non-Tariff Barrie rs as Impediments to Tariff Imple mentation in the West African Sub-Region Though ECOWAS Heads of State decided to implement the CET in the sub-region from January 2006, the implementation is challenges by a number of non-tariff barriers. These non-tariff barriers include national differences in governmental mandates and informal barriers in member countries such as differences in administrative procedures, market structure, political , social and 47 cultural institutions. Others that have grown to very worrisome levels are the multiple boarder fees, multiple customs procedures, formal and informal checkpoints, and un-receipted charge by law enforcement agents and agencies in the country and at the boarders. Activities of smugglers in the sub-region have had damaging effect on tariff implementation thereby resulting in huge revenue losses. 5.0 Conclusion Global, regional and national rice policies under trade liberalization is expected to encourage local rice production and quality. However, studies have shown that in developing economies, the small holder farmers continue to loose out due to his inability to compete favourably given his operating environment and consumer preferences. The urgent need is to invest in the downstream segment of the rice value chains of developing rice economies so as to improve quality of rice and compete more favourably in the international rice market. , 48 PARARELL SESSION 49 IMPROVEMENT OF RICE PARBOILING TANK IN LAFIA, NASARAWA STATE UNDER RIPMAPP, NIGERIA Engr. Marcus. O. OGUNBIYI1 and Shingo FURUICHI2 1 Assistant Director, Agro Processing & Marketing (APM), Federal Ministry of Agriculture and Rural Development (FMARD), Abuja, Nigeria. 2 JICA expert in Post-harvest Technology, Rice Post harvest Processing and Marketing Pilot Project in Nasarawa and Niger States (RIPMAPP), JICA/FMA&RD, Abuja, Nigeria. Abstract Rice features regularly on the daily menus of almost all Nigerians and its demand has been increasing in recent years. Currently consumption is estimated at over 5 million tonnes annually with a large amount being imported. This is as a result of the poor quality of the locally processed rice. This has greatly affected the competitive status of the local rice in the domestic and international markets and thus hampered the development of the rice industry in Nigeria. This study was carried out by RIPMAPP (Rice Post- harvest Processing and Marketing Pilot Project in Nasarawa and Niger States) to determine the optimum paddy steaming conditions and the effects, in terms of colour and head rice ratio, of introducing a “false bottom” and “lid” in the conventional parboiling equipment used by processors in Lafia, Nasarawa State. Two types of false bottom were used and each was subjected to 2 treatments and a control. The parboiled paddy in each treatment was subjected to similar drying, milling and colour grading conditions. The results showed that steaming tank equipped with a lid and false bottom produced lighter coloured grain than conventional tank method. Providing a false bottom only but without a lid to the tank did not significantly improve the colour. Moreover, tank equipped with a lid and false bottom produced uniformly lighter colour at top layer. On the other hand, conventional tank produced less uniformly darker colour especially at top layer. It is therefore concluded that: (1) Parboiling tank should be equipped with false bottom and lid to improve the quality of parboiled rice. The steaming with false bottom and lid produced parboiled 50 rice whose colour is much lighter than the one produced by conventional tank method. (2) Mesh type false bottom reduces broken rice than perforated sheet type false bottom. If perforated sheet type false bottom is to be used, number of holes should be increased to allow for the passage of greater amount of steam into the steaming chamber. Introduction The potential of the agricultural sector, which still remains the bedrock of the Nigerian economy, is yet to be fully realized. Food production and self-sufficiency are still a problem, despite the availability of a vast area of fertile and cultivable land (over 79 million hectares), most of which is traversed by rivers useful for irrigation (Federal Ministry of Agriculture, 2006). There still exists a large gap between food production and demand, resulting in massive importation of food products, especially rice, which is one of the major staples consumed by the Nigerian populace. Nigeria has a high potential for rice production in terms of land availability, human resources, and good climate, but rice production is not sufficient to meet consumption (Figure 1, Ochigbo and Gbabo, 2004). The country is therefore a major importer of rice, mainly from Thailand, which enjoys a substantial part of the Nigerian market because of the high quality of its parboiled milled rice (Parnsakhorn and Noomhorm, 2008). Because of the increasing contribution of rice to the per capital calorie consumption of Nigerians (this contribution is currently put at 9%; Erhabor and Ojogho, 2011), demand for rice has been increasing much faster than domestic production, and more than in any other African countries, since the mid-1970s (Bamidele et al., 2010). Average yearly per capita consumption has grown substantially at 7.3% a year, from 3 kg in the 1960s to 15.8 kg in 1981–1990, to 22 kg in 2000, and, by 2007, to an estimated 27 kg (NFRA, 2010; Bamidele et al., 2010). Currently, the average per capital consumption of rice in Nigeria is over 32 kg a year. Average annual rice production is about 2.21 million tonnes of milled product, whereas national consumption is estimated at over 5 million tonnes of milled rice leaving a shortfall of over 2.79 million tonnes that is bridged by importation (Wudiri and Fatoba, 1992; Ogundele and Akpokodje, 2004; NFRA, 2010; USAID, 2009). 51 Figure 1: Rice consumption and domestic production in Nigeria Source: USAID, 2009 Data. For Nigeria to be self- sufficient in rice production, particular attention has to be put on the postharvest handling and processing of rice. (Ogunbiyi 2011). This is paramount to the production of clean, edible, high-quality milled rice from paddy rice. Thus, a clear, and deep understanding of the postharvest technology required to produce quality table rice is of crucial importance if rice processors are to meet market-competitive standards of quality. Rice processors employ the use of large parboiling tanks in Lafia, Nasarawa State, (Figure 2 and 3). Figure 2. Soaking of Paddy Figure 3. Steaming of Paddy The tanks have varying capacities ranging from 300-700kg/batch. All activities are done manually and the tanks are used for both steeping and steaming. The products from these tanks were found to be inconsistent in colour, strength, and head rice ratio. This is attributed to improper parboiling process which may result from non-uniform steaming. Thus, as part of the 52 outputs of the Rice Post- harvest Processing and Marketing Pilot Project in Nasarawa and Niger States (RIPMAPP), there is the need to study and improve the parboiling process with a view to recommending adoptive improvements to rice processors in the target areas to improve the quality of the parboiled rice. This will not only bring about increase rice yields and increase thus more income and profits but contribute immensely to the rice sufficiency drive of the Nigeria nation. Table 1: Rice Parboiling Situations in The Target Areas Quantity / Community Lafia Assakio Soaking batchTime, (kg) 300-600 200 (hr) Steaming Temp time, Wate r Heat Drying (ºC) (min) source source method 10-16 60-70 40 -90 10-16 60-70 20 -35 Well, river and ponds Firewood Well, river and ponds Firewood Sun drying Sun drying Source: Ogunbiyi (2011) The objective of this study was therefore to determine the optimum paddy steaming conditions and the effects, in terms of colour and head rice ratio, of introducing a “false bottom” and “lid” in the conventional parboiling equipment used by processors in Lafia, Nasarawa State. Materials and Methods False Bottom Two types of false bottom were designed in collaboration with the Rice Millers and Dealers’ Association, Lafia. The first consists of a perforated sheet (Fig. 4) while the other one was made with a wire mesh on a mild steel rod frame (Fig. 5) Lid A lid made of mild steel sheet was introduced at the top of the parboiling tank. 53 Figure 4: False bottom designed by RIPMAPP Figure 5: False bottom designed by the Association Experimental Design Two treatments: 1) tank with false bottom without lid and 2) tank with false bottom with lid were replicated with the two types of false bottom. The results were compared with a two other treatments 3) tank with lid without false bottom and 4. Tank without lid and false bottom (Table 2). Table 2: Experimental Design Treatments Description Height of false Bottom Control Treatment 1 Treatment 2 Treatment 3 Treatment 4 Treatment 5 Conventional tank of the Association Conventional tank covered with lid Conventional tank with perforated sheet false bottom without lid Conventional tank with wire mesh false bottom without lid Conventional tank with perforated sheet false bottom with lid Conventional tank with wire mesh false bottom with lid Nil Nil 10cm 10cm 10cm 10cm Parboiling Conventional hot water soaking was done overnight prior to steaming for each of the treatments. This was to increase the moisture content of the raw paddy. The moisture content was increased to about 33-36% wet basis which is the optimum condition for steaming. Steaming was 54 thereafter carried out based on the treatments. The false bottoms were inserted into the tank before soaking (Figure 6). Soaking and steaming were carried out accordingly (Figure 6, 7 and 8). Steamed paddy was evenly spread on tarpaulin and sun dried to a moisture content of 1314% wet basis (Figure 9). Moisture content was measured by a moisture meter (Satake, Japan) as shown in Figure 10. Figure 6: Placement of the false bottom Figure 7: Pouring the paddy Figure 7: Steaming process without lid Figure 8: Steaming process with lid About 5 kg of dried parboiled paddy was collected on different layers of each treatment top layer, middle layer, and bottom layer of the steaming tank, to observe if there is significant difference on quality. 55 Figure 9: Drying on tarpaulin Figure 10: Moisture content measurement Test milling Three samples of 200g paddy were collected from each layer of the parboiled rice for test milling. The parboiled paddy samples were de-husked by the Test Husker (Satake, Japan) to obtain brown rice. Milling of the brown rice was carried out by the abrasive type Test Milling machine (Satake Japan). Milling time was two minutes and this was maintained for all the samples. The Test Length Grader (Satake Japan) was operated for two minutes for all the samples after milling to separate head rice and broken rice. The weight of paddy, milled rice, head rice and broken rice were taken to calculate the milling recovery (%), head rice ratio (%), and broken rice ratio (%). Samples were thereafter kept in transparent polythene bags to observe colour and degree of lightness of milled rice. Test husker Test mill Test length grader Figure 11: Test milling equipment Colour grading Colours grading chart, shown in Figure 12, earlier developed by RIPMAPP was used to determine the degree of lightness / discoloration of the milled rice. Six people were selected to 56 observe the grains and score them according to the chart. The average score of each treatment and each layer was calculated to compare discoloration / lightness of sample grains. Figure 12: Colour grading chart Figure 13: Colour grading by observers 57 Results and Discussion The results are as tabulated in Table 3. Table 3: Some Properties of the Rice Samples Treatments Qty (Kg) Control 600 Treatment 1 600 Treatment 2 600 Treatment 3 600 Treatment 4 600 Treatment 5 600 Sample Moisture Location Content (%) Top Middle Bottom Top Middle Bottom Top Middle Bottom Top Middle Bottom Top Middle Bottom Top Middle Bottom 15.0 13.8 14.2 14.0 14.2 14.9 13.9 13.2 13.4 14.1 15.3 13.8 14.0 14.0 14.0 14.2 14.5 15.0 Milling Head Recovery Rice (%) Recovery (%) 72.7 70.3 72.2 68.6 70.6 67.6 72.4 68.9 72.2 69.8 70.3 68.7 71.6 61.0 69.0 61.7 70.7 65.3 71.8 68.3 71.3 69.7 69.9 67.3 71.6 64.0 70.7 63.7 68.6 59.1 71.1 66.9 70.6 67.5 69.5 67.6 Head Rice ratio (%) 97.1 95.2 96.0 95.4 97.1 98.1 85.4 89.6 92.6 95.3 98.3 96.7 89.6 90.2 86.3 94.3 95.8 97.5 Broken Rice ratio (%) 2.9 4.8 4.0 4.6 2.9 1.9 14.6 10.4 7.4 4.7 1.7 3.3 10.4 9.8 13.7 5.7 4.2 2.5 Grain Hardness Table 3 shows that Control and Treatment 1 has a higher milling recovery. This indicated that the grains still have some bran layer that can still be removed. This shows that the gra ins are harder than those of other treatments. The result is in agreement with that of Ogunbiyi (2011). This can be attributed to the fact that the grains were exposed to excess heat due to prolonged steaming. This result agrees with those of many reports that grain hardness increases with increasing temperature and duration of steaming during the parboiling operation (Islam et al., 2001). It further attests to the fact that rice parboiling methods in Lafia need to be improved. Broken Ratio Comparison of the broken ratios between the treatments revealed that Treatment 3 shows lower broken ratio of 2-5% than 7-15% of Treatment 2. Same phenomenon can be seen between Treatment 4 and 5. Treatment 5 shows lower broken ratio of 2-6% than 9-14% of Treatment 4. 58 This may be attributed to different volume of steam that passed through the different types of false bottom. Mesh type false bottom of Treatment 3 and 5 provided more steam passage required for gelatinization into the steaming chamber than perforated type fals e bottom. Grain Colour Table 4 shows the average colour values according to the RIPMAPP developed colour grading chart. According to the Table, grain colour varies from layer to layer and treatment to treatment, the lightest being 1.1 while the darkest was 6.6. The results show that the Treatment 5 and 4 produced the lightest grains, while Treatment 1 produced the darkest grain. Similarly, Top layers of Treatment 5 and 4 produced the lightest colour while the bottom layers of Treatment 1 and Control produced the darkest colour. Although, Miah et al. (2002) attributed the colour of parboiled rice to the rate of cooling of the hot-steamed parboiled paddy rice, since the cooling of the paddy done in each treatment were done under the same conditions, it can t hen be concluded that the amount of heat treatment of the paddy contributed significantly to the lightness or darkness of the grain. The more the exposure to heat the more the colour becomes darker. Table 4: Average score of colour grade Control T1 T2 T3 T4 T5 Top 3.1 4.7 4.1 3.1 1.6 1.1 Middle 3.7 4.3 5.4 2.6 2.3 2.4 Bottom 5.0 6.6 3.1 3.4 3.3 2.6 Average of treatment 4.0 5.2 4.2 3.0 2.4 2.0 Table 5: Standard deviation of average score of colour grade Control T1 T2 T3 T4 T5 Top 1.57 0.95 0.90 0.90 0.53 0.38 Middle 1.11 1.25 1.99 0.98 0.95 0.79 Bottom 1.15 1.13 0.69 1.13 1.25 1.13 59 Analysis of the standard deviation of the colour grading values as shown in Table 5 shows high uniformity in the observers’ assessment of the colour grade for Top layers of both Treatments 4 and 5. On the other hand, low uniformity was seen in observers’ assessment of colour grade for Top layer of Control and Middle layer of Treatment 2. Parboiling tank equipped with a lid and false bottom produced lighter coloured grains than conventional tank without lid or false bottom while there was no significant improvement of colour when parboiling was carried out with false bottom and no lid. Moreover, tank equipped with a lid and false bottom produced uniformly lighter colour at top layer. On the other hand, conventional tank produced less uniformly darker colour especially at top layer. Conclusion Parboiling tank should be equipped with false bottom and lid to improve the quality of parboiled rice. The steaming with false bottom and lid produces parboiled rice whose colour is much lighter than the one produced by conventional tank method. Mesh type false bottom reduces broken ratio of rice than perforated sheet type false bottom. Selection of the type of false bottom should be considered with material availability, cost, and durability. If perforated sheet type false bottom is to be used, number of holes should be increased to allow for the passage of greater amount of steam into the steaming chamber. Colour Grading Chart developed by RIPMAPP can be applied to evaluate the colour of parboiled rice. Acknowledge ment The contributions of Engr. Nadungu Gagare, and Isah Mohammed of the Federal Ministry of Agriculture and Rural Development, Abuja, Nigeria, Mr. Ahmed Tanko and Awal Umar of Nasarawa Agricultural Development Programme (NADP) are well appreciated. Similarly, the support of RIPMAPP/JICA in sponsoring this work and its presentation at the rice-Africa conference is also appreciated. 60 References Bamidele, F.S., Abayomi, O.O., Esther, O.A., 2010. Economic analysis of rice consumption patterns in Nigeria. J. Agric. Sci. Technol. 12, 1–11. Federal Ministry of Agriculture, 2006. International Conference on Agrarian Reform and Rural Development, Porto Alegre, 7–10 March 2006. Retrieved on 27 October 2011 from www.icarrd.org/en/icard_doc_down/national_Nigeria.doc. Islam, M.D., Shimizu, N., Kimura, T., 2001. Quality evaluation of parboiled rice with physical properties. Food Sci. Technol. Res. 7(1), 57–63. Miah, M. A. K., Haque, A., Douglass, A. P., Clarke, B., 2002. Parboiling of rice. Part II: Effect of hot soaking time on the degree of starch gelatinization. Int. J of Food Sci. and Technol. 37, 539−545 NFRA, 2010. National Rice Development Strategy (NRDS): Implementation Document for the NRDS in Nigeria. Federal Ministry of Agriculture and Rural Development, Abuja, Nigeria. Ochigbo, A.A., Gbabo, A., 2004. Appropriate rice machinery and processing technologies: Small scale as option for Nigeria’s self-sufficiency in rice production. In: Abo, M.E., Abdullahi, A.S., Ike E. (Eds.). The Nigeria Rice Memorabilia. Project Synergy Limited, Abuja, Nigeria, pp. 421–433. Ogunbiyi, M. O. 2011. Assessment of Postharvest Handling and Quality Control Practices of Rice in North Central Nigeria: A case study of Lafia, Nasarawa State. Journal of Developments in Sustainable Agriculture 6:143 -163 Ogundele, O.O., Akpokodje, G. 2004. Rice trade and marketing in Nigeria. Prospects for a National Rice Industry Standard. In: Abo, M.E., Abdullahi, A.S., Ike E. (Eds.). The Nigeria Rice Memorabilia. Project Synergy Limited, Abuja, Nigeria, pp. 503–510. Parnsakhorn, S., Noomhorm, A. 2008. Changes in the physicochemical properties of parboiled brown rice during heat treatment. Agric. Eng. Int.: the CIGR. E-journal, manuscript FP 08 009, Vol. X. August, 2008. USAID, 2009. Nigeria Rice Value Chain Analysis. Retrieved on 28 October 2011 from www.microlinks.org/ev_en.php. Wudiri, B.B., Fatoba, I.O., 1992. Cereal in the food economy of Nigeria. In: Lawani, S.M., Babaleye, T. (Eds.). Proceedings of Workshop on Recent Development in Cereals production in Nigeria. Kaduna, Sept. 2-4, IITA, Ibadan, Nigeria, pp.: 13-32 61 CHALLENGES OF SAWAH ECO-TECHNOLOGY DEVELOPMENT AND TRANSFER IN SOUTHERN NIGERIA Agboola A.O1 , Olanre waju, J.S2 , Dada-Joel, O.T3 , Aliyu J1 , Ade miluyi Y.S.3 and T. Wakatsuki4 . 1 New Sawah Project, NCAM, Ilorin, NIGERIA. Department of Agricultural Engineering, Faculty of Technology, Obafemi Awolowo University, Ile-Ife, NIGERIA 3 National Centre for Agricultural Mechanization, (NCAM), P.M.B 1525, Ilorin, NIGERIA. 4 Department of Ecological Engineering, Faculty of Agriculture, Kinki University, Nara, JAPAN e-mail: [email protected], [email protected] [email protected] [email protected] 2 Abstract SAWAH Eco-technology is the mechanized production of rice in lowlands through an improved method of maximum utilization of naturally occurring water in these areas to obtain an improved yield/hectare compared to any other existing method of rice production in Nigeria. The transfer, adoption and scaling- up of innovative technology is an important aspect of research efforts which has to be taken seriously by the government of any country that is desirous of growth and development. The development and transfer of the Sawah Eco-technology faces many challenges amidst opportunities for rapid adoption and dissemination of the technology in Southern Nigeria. This paper will discuss four important skills and technologies for sawah eco-technology transfer as experienced in some representative southern states of Ondo, Delta and Ebonyi States of Nigeria viz: (1) site selection and site specific sawah system design,(2) sk ills for cost effective sawah systems development and management (3) farmers organization for successful on the job training and development and management of sawah system, (4) sawah- based rice faming to realize at least the sustainable paddy yield >4t/ha. 62 1.0 Introduction Among the factors that contribute to growth in agricultural productivity, technology is the most important. Technology often needs to migrate from its place and culture of origin to other places through transfer, adoption and integration. Technology transfer is the process of sharing skills, knowledge, technologies, methods and facilities among governments and other institutions to ensure that scientific and technological developments are accessible to a wide range of users who can then further develop and exploit the technology to better their lots. The Sawah eco-technology which originates from Japan has been researched on, tested and proven to be adaptable to Nigerian climate and Sub-Saharan Africa in general. This ecotechnology is the mechanized production of rice in lowlands through an improved method of maximum utilization of naturally occurring water in these areas to obtain an improved yield/hectare compared to any other existing method of rice production in Nigeria, (Ademiluyi et al, 2011). 2.0 Sawah Eco-technology Development in Southern Nigeria Sawah was introduced to Ondo state in 2008 through the State Agricultural Development Program (ADP) under the auspices of the commissioner of Agriculture in the state and the joint effort of Dr. Ademiluyi Segun, Mr. Agboola Adeniyi, Prof .Oladele and Prof. T. Wakatsuki starting with the demonstration to developed 2 hectares at Ahule in the neighbourhood of the state capital. The Sawah activities in Delta and Ebonyi states are as a result of the collaboration between NCAM-Kinki University and Fadama III project of Nigeria. About 2.5 hectares of land was developed in the introductory stage as one of the selected pilot stations was establish in Omeligboma / Asaba the SouthSouth geo-political zone of Nigeria while about 2.2 hectare of standard demonstration plot was established and developed in Omege, Abakaliki area of Ebonyi state, South-East geo-political zone of Nigeria. 63 3.0 Sawah Eco-technology Transfer and Adoption Methods The following Technology transfer methods have been used extensively in the dissemination of this rice production model: i. Radio or TV programs, videos ii. On-the-job trainings iii. Campaigns to spread simple messages iv. Demonstration plots v. Field days vi. Fact sheets, booklets, leaflets, posters vii. Farmer Field Schools (FFS) However, in determining the rate of adoption of the technology, it was observed that higher adoption of the technology emanated from farmers who: participated in the on-farm trial and demonstration Accessed agricultural knowledge through researchers Participated in on-the-job training programs of Kinki University’s Laboratory of Ecological Engineering headed by Professor Wakatsuki and Nagoya university’s International Centre for Agricultural Education (ICCAE) sponsored by the Ministry of Agriculture, Forestry and Fishery (MAFF) of Japan Are exposed to participants of the OJT and Farmers’ Field Schools. Participated in our field days and other programme. Have access to information through the FFS 64 Fig. 1: Monitoring Sawah Transfer Methods Table 1: Comparing Farmers’ Practice with Sawah on Yield of Rice 65 3.1 Sawah Eco-technology Characte ristics Facilitating Transfer and Adoption The literature and experience have shown that to be more easily adopted, a new technology must have certain characteristics. The following characteristics are possessed by Sawah ecotechnology which facilitates its transfer and adoption: Relative economic advantage is the degree to which the technology is perceived to be better than the idea it supersedes in terms of economic profitability, social prestige, physical convenience, low initial cost, lower perceived risk, decreasing discomfort, psychological satisfaction or saving of time. A cheaper technology will be adopted faster than a more expensive one (Roling, 1990). Because farmers want to make money, we showed them how the sawah technology will benefit them financially. For example, we convinced several rice farmers in Ondo and Delta states to start growing rice using the Sawah model instead of their traditional ways because the average gross margin from an hectare of Sawah and from an hectare of traditional methods in the area was $2,000 and $600 dollars per cropping season, respectively. Availability and cost also influence technology adoption. Compatibility is the degree to which a technology is perceived to be consistent with the farmer's goals and aspirations; sociocultural values, norms and beliefs, and past experiences; needs; and existing farm practices. Technologies compatible with existing farm practices encourage a positive attitude toward change, improve the agent's credibility, and may be adopted faster. The Sawah system is compatible with the existing methods of rice production in the farmers’ area only with slight modification through eco-technological concept, so it was easier for the farmers to adapt and adopt the technology. Trialability is the degree to which a technology may be tried out on a limited scale to determine its efficacy before adopting it on a large scale. This enables the farmer to test suitability and efficiency of the new technology. Technologies that can be tried on a limited scale will be adopted faster due to their lower risk to the adopter (Shields, Rannigar & Goode, 1993). Sawah eco-technology is normally demonstrated on a small scale to the farmers through participatory learning approach, it was easier for the farmers to test the technology and see if it is worth adopting or not. 66 Complexity is the degree to which a technology is perceived to be relatively difficult to understand and use. Technologies that are more complex to understand and use have lower rates of adoption. Sawah eco-technology is not a complex model, it was easier for the farmers to understand the basic concepts involved. Visibility or Observability is the degree to which the results of a technology are visible or observable. The more viable a new practice is and the easier its results are to observe, describe, and communicate to others, the more rapidly it will be adopted. Material innovations and concrete ideas that are easily observable are adopted faster than less concrete ones. Some young farmers started farming rice using the sawah eco-technology concept after seeing their neighbours’ success. Those we talked to were motivated by the success of farmers who had built residential houses or bought new vehicles with income from rice farming using the sawah model. 4.0 Challenges of Eco-technology Transfer Among the challenges being faced by the dissemination of Sawah eco-technology in the states are in the mechanization of the process. It has been brought to our notice that the mechanization of lowland can be fully achieved if about 80% of the activities can be mechanized. Thus, suitable means of adaptation of the power tiller for bund making, canal digging, transplanting, harvesting and transportation can be applied to the dissemination of the project. 67 Table 2: Classification of States by Sawah Activity and Ease of Adoption S/N Geo-political States Cultural practice Sawah status Swamp rice, Semi-active zone South-South Delta broadcasting South-West South-East Lagos, Ekiti, Swamp rice, dibbling Introductory Ondo and broadcasting stage Ebonyi, Enugu Swamp rice, Active transplanting North-West Kebbi, Kaduna Inland valley, Active dibbling North- Kwara, Niger, Inland valley, Semi-active, Central Benue dibbling Introductory North-East Borno Inland valley, Non-active dibbling The following are some of the major constraints experienced during introductory aspects of lowland mechanization for rice production in both Ondo and Delta states: a. Scarcity of trained and experienced operators of single axle tractors. operators depends on expertise level of Power Tiller operator. 68 Success of several b. Poor ecology – power require ment match. It is evident that dead weight of power machinery is directly related to its power delivery capacity. The lowland suitable for Sawah often with low weight bearing capacity has resulted in sinking of heavy single axle tractors in excess of 10hp. c. Inappropriate wheel design: Paddle wheels are better suited for the puddling operation in Sawah lowland basins. Pneumatic tyres or skid wheels are not appropriate and tend to increase the incidence of sinking. d. Limitation in application of Power Tiller to several vital operations of new Sawah development Bund making takes a significant proportion of Power requirement in new sawah development yet, there is challenge in finding appropriate adaption of the single axle tractor for this operation. A team of Sawah researchers led by Ademiluyi (2010) of the National Centre for Agricultural Mechanization, Ilorin is in the fore of effort to develop a bund former implement to be attached to the single axle tractor for this important operation. e. Leveling necessitate heavy, medium or light movement of soil mass as determined by topography and layout design of Sawah basins. Efforts at machine adaptation for effective leveling are still being limited by: i. Fragmentation or small basin sizes: the need to preserve the top layer soil where high gradient necessitate more than moderate soil movement. So far, the only practicable option is manual intervention in temporary removal of top soil and replacement after satisfaction, sub- layers has been moved. ii. Machine sinking following repetitive passes on Sawah basins in the attempt to achieve leveling is a common feature this is more so in basins delicately balanced over soft clayey subsoil by a layer of dissolvable hard pan. To reduce or avoid this, it is important to match the weight of machinery to bearing capacity of the soil, avoid too many post puddling passes maintain adequate basin water level during leveling. 69 iii. Maneuverability:- Since bunds are sources of obstruction to machinery movement in a Sawah basin care must be taken to avoid getting the chassis caught in the heap. Experience has shown that diagonal orientation is preferred in crossing the bunds. Puddling:- Puddling operation can be hampered by presence of stumps and rock particles in the basin which can damage the cultivator. Attempting a puddling operation without adequately flooding the basin to >5cm water depth often result in poor performance of the power tiller and eventual sinking whereas heavy soil often clayey hold down the wheels and cultivator of the power tiller. Transplanting:- Poor alignment of plant rows due to non-strict compliance with the guidance of the planting ropes create difficulty in mechanized weeding when needed. Weeding:- The push-pull rotary weeder is most suitable for control of obnoxious weeds in a flooded sawah basin but this weeder is yet to be popular in our rice growing communities. Presently, hand picking remains the most widely applied option for weed control in a flooded sawah basin. f. Harvesting and Processing:- Non availability of mechanized harvester suitable for the various traditional rice growing terrains has been a constraint to rapid expansion of production with increasing adoption of technologies like Sawah. It has become necessary to mechanize harvesting and processing even at low levels. With the adve nt of small scale harvesters like “RICH” presently undergoing modification to adapt it to realities of the fields and processing plants capable of presenting rice free of stones and other impurities. There is high hope that locally produced rice can be presented to the market competitively enough to sustain and stimulate further cost effective local production. 70 5.0 Conlusion A mix of technology transfer methods and strategies, tailored to the specific situation, is likely to be most effective. Participatory appraisals enable the process of designing the tech transfer strategies to best fit each local situation. To enhance a rapid dissemination and adoption of Sawah Eco-technology, incentives could be provided in form of High Yielding Seed Variety (HYV) at subsidized rate, agricultural inputs, farm equipment, irrigation infrastructure and other machineries. Increased collaboration between Researchers- Extension Workers-Farmers will also enhance: Problems Identification Technology, Institutions, and disseminations needs Participatory programs formulation Assessment and dissemination planning Assessment and dissemination execution Evaluation on technology, institution, and dissemination methods performance Up-scaling. 71 REFERENCES Ade miluyi Y.S. 2010. Application of power tiller in sawah technology for rice production in sub-saharan africa: Nigeria and ghana as case studies. Unpublished PhD Thesis, the Graduate School of Agricultural Science, Kinki university, Nara, Japan Ade miluyi, Y.S., Dada-Joel O.T., Olanre waju, J.S., Onyemize, U.C, Fagbenja, M.A, Agboola A.O. Aliyu J. Azogu, I.I and T. Wakatsuki. (2011): Challenges of Lowland Mechanization through Sawah Eco-Technology in Nigeria. Paper published in the proceedings of the 1st International Workshop on Sawah Eco-technology and Rice Farming (SERIF) in SubSaharan Africa’, 22-24 November, 2011, Kumasi, GHANA. Pgs 112-122 Roling, N. (1990). Extension Science Information System in Agricultural Development. New York, NY: Cambridge University Press. Shields, M. L., Rannigar, G. P., & Goode, F. M. (1993). A longitudinal analysis of factors influencing technology adoption in Swaziland, 1985-1991. Journal of Developing Areas, 27, 469-484. 72 GROWTH TREND OF RICE DEMAND AND SUPPLY IN NIGERIA: AN INVESTMENT OPPORTUNITY FOR YOUTH AND WOMEN EMPOWERMENT † OYINBO O., † G.Z. REKWOT, † G.A. ADEGBOYE AND ‡D. AGBONIKA † Department of Agricultural Economics and Rural Sociology, Ahmadu Bello University, Zaria, Nigeria. ‡ Department of Agricultural Economics and Extension, University of Abuja, Abuja, Nigeria. Email: [email protected] Abstract This study was carried out to determine the instantaneous and compound growth rates of rice demand and supply in Nigeria over the period of 1970 to 2011 and its implication for empowering youths and women. Time series data on the aggregate rice demand and supply obtained from the database of United State Department for Agriculture(USDA) foreign agricultural service were utilized in this study. A growth rate model was employed to analyse the time series data and the result of the analysis showed that the instantaneous and compound growth rates(7.5% and 7.8%) of rice demand were higher than that of rice supply(6.5% and 6.7%) and this indicates that the incidence of demand-supply gap for rice in Nigeria has been an existing trend over the years and the trend would continue if appropriate measures are not taken despite the country’s huge potential for rice production to attain self-sufficiency. The implication of this finding is that the untapped potential of Nigeria for rice production should be exploited for the empowerment of youths in the area of rice production and women in the area of rice processing. This is necessary to reduce the incidence of social vices resulting from the increasing rate of unemployment, offer a sustainable means of livelihood for resource poor women and ultimately for both youths and women to contribute meaningfully in bridging the demand-supply gap for rice in Nigeria. 73 Introduction Rice is a leading staple crop in Nigeria that is cultivated and consumed in all parts of the country (Ayanwale et al., 2011). During the 1960s, Nigeria had the lowest per capita annual consumption of rice in the sub-region at an annual average of 3kg. Since then, Nigerian per capita consumption levels have grown significantly at 7.3% per annum. Consequently, per capita consumption during the 1980s averaged 18kg and then 22kg in 1995–2000 (Ogundele and Okoruwa, 2006). In Nigeria, rice has assumed a strategic position in the food basket of rural and urban households and is cultivated in virtually all of Nigeria’s agro-ecological zones, from the mangrove and swampy ecologies of the River Niger delta in the coastal areas to the dry zones of the Sahel in the north. The demand for rice in N igeria has been increasing at a much faster rate than in any other African country since the mid-1970s (Daramola 2005). Although the paddy harvest rose from under 1 million tonnes in the 1970s to 4.2 million tonnes in 2010, production has not kept pace with demand. There is considerable potential for extending and intensifying rice production in the five rice-growing ecosystems found in Nigeria (plateau, rainfed plains, irrigated plains, lowlands and mangrove), Bamba et al. (2010). The land area that could be cultivated is roughly 79 million hectares. Less than 10% of the 3.4 million hectares that could be irrigated are currently irrigated. Self-sufficiency in rice production has eluded Nigeria for a long time despite over 36 years of efforts by the Government of Nigeria towards its realization (Umeh and Atarboh, 2007). The importation of rice to bridge the demand-supply gap is worth N365 billion (Ayanwale and Amusan, 2012) and this implies a loss of considerable foreign exchange for the country. Several researches on the rice sub-sector of Nigeria have been undertaken over the years but not much have been done on the growth trend of rice with particular emphasis on the instantaneous(yearly) growth rate and compound(aggregate of several years) growth rate of the demand as well as supply of rice in Nigeria. Therefore, this study was designed to provide empirical information on the instantaneous and compound growth rates of rice demand and supply over the period of 1970 to 2011 and draw up relevant inferences. 74 Methodology Data description This study employed time series data on the demand of rice given by rice consumption in metric tonnes and supply of rice given by milled rice production in metric tonnes in Nigeria spanning over the period of 1970 to 2011. The data were elicited from the database of United State Department for Agriculture(USDA) foreign agricultural service. Model Specification A growth rate model adopted from (Gujarati and porter, 2009) and as used by Khalid and Burhan(2006) and Oyinbo and Emmannuel(2012) was utilized for the estimation of growth trend in rice demand supply in Nigeria over the period of 1970 to 2011. The compound interest formula was adopted for developing the model and is expressed as: Where: = Rice demand and supply (metric tonnes) = Initial value of rice demand and supply (metric tonnes) = Compound rate of growth of rice demand and output over time = Time trend (1970 to 2011) Taking the natural logarithm of equation (1), equation (2) was derived as: Where: Equation (2) is rewritten as: Adding disturbance term to equation (3), the explicit form of the model employed was derived as: 75 Where: = Rice demand and supply (metric tonnes) = Time trend (1970 to 2011) = constant term = Coefficient of time variable = Random term After the estimation of equation (1), the compound rate of growth was computed as follows: Where: r = compound rate of growth = estimated coefficient from equation (1) The explicit form of the growth rate model as shown in eq. (4) was estimated using SHAZAM statistical software. RESULTS AND DISCUSSION The result obtained from the estimation of the growth model for rice demand and supply is presented in table 1. The result shows that time trend variable was significant in influencing demand and supply of rice at 1% probability level and the relationship was positive in the rice demand and supply growth models. In the estimated growth rate models, the slope coefficients of 0.075 and 0.065 for rice demand and supply respectively measures relative change in quantity demanded and supplied for a given change in the value of time trend. By multiplying the relative change in quantity of rice demanded and supplied respectively by hundred, we obtained the percentage change or the growth rate in quantity of rice de manded and supplied for an absolute change in time. 76 Table 1: Estimated growth model of rice demand and supply in Nige ria Variable Coefficient S.E t - value -51.374 2.729 -18.83 0.075 0.004 21.17 -44.919 2.900 -15.49 0.065 0.003 25.30 Rice demand Constant ( Time ( ) ) R square 0.95 Rice supply Constant ( Time ( ) ) R square 0.92 NB: *** P < 0.01 Rice demand Growth rate = relative change Growth rate = Growth rate = Rice supply Growth rate = relative change Growth rate = Growth rate = 6.5 The growth rates of 7.5% and 6.5% for rice demand and supply respectively implies that over the period of 1970 to 2011, the demand and supply of rice in Nigeria increased at the rate of 7.5% and 6.5% per annum. However the growth rate worked out are an instantaneous (at a point in time) rate of growth and not the compound (over period of time) rate of growth. Compound growth rates (r) were estimated from the instantaneous rates of growth, in that 7.5% and 6.5% are instantaneous growth rates: 77 r= Rice demand r= Compound rate of growth(r) = 7.8 % Rice supply r= Compound rate of growth(r) = 6.7 % Therefore, the growth trend of rice demand and supply in N igeria per annum within the period under study(instantaneous rates of growth) are 7.5 % and 6.5% respectively and the rate of growth of rice demand and supply in Nigeria over the entire period under study(compound rates of growth) are 7.8 % and 6.7 % respectively. It was observed that the instantaneous and compounded growth rates of rice demand in Nigeria over the study period were higher than that of rice supply. This finding is in line with Ojoehemon et al. (2009), who noted that both rice production and consumption have vastly increased with rice demand outstripping rice production. The 7.5 % per annum growth rate estimated in this study is closely related to the 7% per annum used to make a projection of rice demand of 35 million tonnes in 2050(Ayanwale and Amusan, 2012). The result of this study indicates that the rice demand-supply gap scenario have been an existing trend that would continue if appropriate measures are not taken. Opportunity for youth and wome n empowe rment The higher instantaneous and compounded growth rates of rice demand over rice supply imply that there would be continuous importation of rice to bride the demand-supply gap and this is detrimental to the Nigerian economy. As noted by Bamba et al., (2010), the cost of rice imports represents a significant amount of lost earnings for the country in terms of jobs and income. Therefore, the on-going trend offers an opportunity for youths to be empowered to undertake rice production and for women to be empowered by getting involved in rice processing. This is necessary to reduce the incidence of social vices resulting from the increasing rate of unemployment and offer a sustainable means of livelihood for resource poor women and 78 achieve self-sufficiency in rice production. This calls for capacity building of youths on rice production and women on rice processing. As reported by Gingiyu(2012), about 400 women drawn from 9 states of the North-west have been trained by the federal ministry of agriculture and rural development on modern rice processing techniques during a three-day workshop for women in agriculture. This is a laudable effort that needs to be consolidated and spread to other geopolitical zones of the nation. Conclusion Using time series data on rice demand and supply over the period of 1970 to 2011, this study have been able to establish the instantaneous and compound growth rates of 7.5% and 7.8% respectively for rice demand and 6.5% and 6.7% for rice supply using growth models. The results indicated that the demand-supply gap for rice has been an existing trend irrespective of the country’s potential for rice production. The growth trend of the demand and supply for rice offers a viable option for empowering youths in the area of rice production and women in the area of rice processing. This will stem down the incidence of social vices resulting from high rate of unemployment, offer a sustainable means of livelihood for resource poor women and foster attainment of self- sufficiency in rice production 79 References Ayanwale, A.O.S., Akinyosoye, V.O., Yusuf, S.A. and Oni, A.O.(2011). Rice Supply Response in Nigeria; whither changing Policies and Climate. World Rural Observations, 3(4): 78 – 84. Ayanwale, A.B. and Amusan, C.A.(2012). Gender Analysis of Rice Production Efficienc y in Osun State: Implication for the Agricultural Transformation Agenda. Paper presented at the 13th National Conference of the Nigerian Association of Agricultural Economists, Obafemi Owolowo University, Ile – Ife, Nigeria, September 25th – 27th. Bamba, I., A. Diagne, Manful, J.and Ajayi, A.( 2010). Historic Opportunities for Rice Growers in Nigeria. Grain de sel. No. 51, July – September 2010. Daramola, B. (2005). Government Policies and Competitiveness of Nigerian Rice Economy, Paper presented at the `Workshop on Rice Policy and Food Security in Sub-Saharan Africa’ organized by WARDA, Cotonou, Republic of Benin. Gingiyu, I.M.(2012). Nigeria: FG Trains Women on Modern Rice Processing Techniques. Available at: http://allafrica.com/stories/201212121037.html. Accessed 12th January 2013. Gujarati, D.N. and Porter, C. D. (2009). Basic Econometrics (5th Edition). McGraw-Hill, New York. Khalid, M. and Burhan, A. (2006). An econometric model for forecas ting export of Kinnow from Pakistan. International Journal of Agriculture and Biology, 8(2): 459 – 462. Ogundele O. and Okoruwa V. (2006), Technical Efficiency Differentials in Rice Production Technologies in Nigeria, African Economic Research Consortium. Ojehomon, V.E.T., Adebayo, S.B., Ogundele, O.O., Okoruwa, V.O., Ajayi, O., Diagne, A. and Ogunlana, O. (2009). Rice Data Systems in Nigeria: National Rice Survey. Oyinbo, O. and Emmaduel, Y.D. (2012). Empirical Assessment of Growth Rate of Maize in the Pre – SAP, SAP and Post – SAP Periods in Nigeria, Russian Journal of Agricultural and Socioeconomic Sciences, 5(5): 23 – 27. Umeh, J.C. and Atarboh, E.M. (2007). Efficiency of Rice Farmers in Nigeria: Potentials For Food Security and Poverty Alleviation. 16th International Farm Management Congress, UCC, Cork, Ireland. 15th – 20th July 2007. pp: 613 – 625. United States Department for Agriculture Foreign Agricultural Services(USDA FAS), (2011). Database of production, supply and distribution. Available at: http://www.fas.usda.gov/psdonline/psdQuery.aspx > Accessed 15th December 2011. 80 Economics Analysis of Upland Rice Production Among Rural Rice farmers in Ebonyi State, Nigeria. Okelola, O.E1 ., Balogun, R.B., Olabode, A.D and Ariyo, O.C. Federal College of Agriculture, Ishiagu ,Ebonyi State, Nigeria Federal College of Forestry Mechanisation, Afaka , Kaduna State. . [email protected], 234-8053195197. Abstract The study reveals the economics, Productivity and challenges of upland rice production in some selected local government ( Abakaliki, Afikpo North,Ezza south and Ivo) area of Ebonyi state, Nigeria. A total number of one hundred and fifty (150) farmers were randomly selected from rice growing area in the study area .The data were analysed using multiple regression anaysis. The result of this study shows that the male farmers constitute a higher percentage(60%) than the female farmers (40%). It was also discovered that most of the respondent are marr ied (56.67%), having an household seize ranging from 12-17 persons. The following socio economic variables that influence output using double log as the lead equation were significant at different levels of probability (1%, and 5%) Gender(5%), Marital Status (1%),Educational level (1%) and labour (1%). Introduction Rice (oryza sativa) is one of the most important crops in west Africa sub region and it belongs to the family graminae within the genus. (Bamos and Phillip, 1990). Rice has become the world most important cereal crop in the sense that more than half of the population of the world depends on it as a form of staple food. According to Komolafe et al (1980), the pattern of demand for rice consumption had drastically changed from festival food to daily food and sometimes it is consumed twice a day and this has lead to the importation of about 400,000 metric tons of rice annually. The total annual rice production in west Africa is about 1.5 million metric tons and about 1.9 metric tones is consumed annually. 81 In terms of rice production in Nigeria, Ondo, Ekiti, Ogun, Ebonyi and Edo states are prominent and the rice has been a major staple food in Nigeria, (Osi and Anthonio, 1970) (Nweke, 1990). Apart from maize, rice ranks second in energy content out of the four most common staple foods in Nigeria with energy potentials of 334 calories per 100g (Olagoke 1990). The production level of rice is very low and that causes fluctuation in the price of rice in spite of the effort by the researchers and federal government to develop high yielding varieties that can reach maturity in relative short period. Farmers are growing rice on a small scale and they are having low output as a result of inability to acquire the desired inputs of production and high level of profitability. Rice is one of the most important crops grown in various local Government Area of Ebonyi state (Rosegrant and Svendsen, 1993). Farmers are often faced with high cost of production due to increasing cost of labour, fertilizer and inputs. The need for an improvement in the production of upland rice in the local Government remains paramount issue that calls for a rapt attention . In the global world system new challenges are emerging in the world’s upland rice farming areas, where already some of the world’s poorest farmers try to make a living from fragile soils. Population growth, high demands of urbanization and industry are leading to strong competition for upland terrain . The uplands Rice grown in my local Government have traditionally suffered from drought and infertile soils, weeds and plant diseases. Soils there have been badly eroded and degraded as a result of the slash-and-burn agriculture that for many years followed logging. The aim of this study is to find a lasting solution to problems encountered by the local farmers in the selected local government area which include Abakaliki, Afikpo North, Ezza south and Ivo and also to suggest possible measure on the performance and profitability of upland rice production. Materials and Method The data used for this research were obtained through the use of structure questionnaire administered to both male and female farmers in the study area. A total of 150 questionnaires were used in the course of this project. The 150 questionnaire were sampled across the 4 local 82 government area in the state. Therefore, 40 questionnaire was distributed among selected communities in Abakaliki, Ezza south and Ivo, while 30 questionnaire was distributed among selected rural rice farmers in Afikpo North to make a total of 150 questionnaire. Results and Discussion. Socio Economic Characteristics of the Formers The socio- economic variables in the study include gender, age, marital status, household size, Educational level, farming experience, farm size, source of labour, membership to cooperative society and constants to upland rice farming . Table 1.0: Distribution of Respondents According to Gende r Gende r Frequency Percentage (%) Male 90 60.00 Female 60 40.00 Total 150 100 Source: field survey, 2012. Table 1.0 shows that 60% of upland rice farmers in the four (4) local government area in the state were male while 40% were females. The result also indicates that men were actively involved in rice production in the study area. This may be due to stress involved in rice cultivation. 83 Table 1.1 Distribution of Respondents According to Age in years Age of respondents Frequency Percentage (%) < 20 17 12.00 21-41 52 34.67 42 -62 61 40.67 63 and above 20 13.33 Total 150 100 Source: field survey, 2012. Table 1.1 shows that majority (40.67%) of respondent fell within age ranged 42 -62 years, 8.33% fell within < 20 years; 34.367%; 21 -41 years while 13.3%; 63 years and above. The mean age in the study area is 45 years. The implication is that majority of the farmers are still energetic and therefore very enterprising. Table 1.2 Distribution of Respondents According to Marital Status Martial status Frequency Percentage (%) Married 85 56.67 Single 45 30.00 Divorced 20 13.33 Total 150 100 Source: field survey, 2012. Table 1.2 shows that majority of upland rice farmers in the four (4) local government area selected in the state were married (56.67%), also 30% were single while 13.33% of rice farmers were divorced respectively. 84 Table 1.3 Distribution of Respondents According to Household size Household Size Frequency Percentage (%) <5 30 20.00 6 – 11 40 26.67 12 – 17 65 43.33 18 and above 15 10.00 Total 150 100 Source: field survey, 2012 From the analysis, 40.8% of the respondent had a household size of between 12 – 17,( 43.33%) 6-11, while 6-11( 26.67% ), <5 had (20.0) and 18 years and above had (10.0%) respectively. Family size is a function of the availability of labour force in the house hold. (Nwankwor et al 2010). This finding is line with Awuwu (2009). Table 1.4 Distribution of Respondents According to Farming Experience Farming experience Frequency Percentage (%) < 10 17 11.33 11-21 34 22.67 22-32 64 42.67 33 and above 35 23.33 Total 150 100 Source: field survey, 2012 Table 1.4 indicates that majority (42.67%) of the respondents in the four( 4) local government area selected had farming experience of 22 – 32 yrs, while the least (11.33%) had less than 10 85 years. 22.67% had 11-21, 23.33% had 33 and above years. Farming experience helps the farmers to increase their productivity through practical knowledge acquired in farming over period of time. Studies (Ume and Okoye 2000, Iheke, 2010 and Awuwa 2009) agree with this finding. Table 1.5 Distribution of Respondents According to Farm Size in Hectare Farm size Frequency Percentage (%) < 1 ha 70 46.67 1.1 – 2 ha 45 30.00 2.1 and above 35 23.33 Total 150 100 Source: field survey, 2012. From the above table 46.67.9% of the respondents in the selected local government area cultivate less than 1 ha, 30% cultivate 1.1 – 2ha while 23.33% result indicated that most rice farmers (46.67%) were producing under small scale which can hardly be mechanized for efficient production. This is in consistent with lawani (1991). 86 Table 1.6 Constraints to Upland Rice Production Constraints Frequency Percentage (%) High cost of Pesticides 16 10.67 Poor access to credit 30 20.00 Poor access to improved seed 15 10.00 Pests problems 10 6.67 Disease problems 3 2.00 Rodents 8 5.33 Lack of storage facilities 10 6.67 Inadequate rainfall 18 12 Weaver birds 10 6.67 Fertilizer unavailability 6 4.00 High cost and unavailability of labour 16 10.67 Cattle menace 8 5.33 Total 150 100 Source: field survey, 2012. The majority (20.0%) of the respondents in the four(4) local government selected in the state do encounter the problem of poor access to credit. Credit is important in purchasing improved productio n inputs as well as paying hired labour (Ume et al 2009). This finding agrees with( Nweru, 2004), who reported that because of lack of collateral to procure 10am from financial institution, this important input eludes farmers particularly small scale type. 87 A total of 10.67% of the respondents complained about high and unavailability of labour. The high cost of labour is a result of the urban drift by our able bodied and energetic youth for white collar Jobs. In effect, the few labours left in the rural areas seized the opportunity to change exorbitantly. More also, 10.67% of the respondents complained about high cost and unavailability of pesticides. Pesticides include, herbicides, insecticides and others are used to control insects and weeds. This is in line with Omoruyi et al (1998) who reported that pesticides are often expensive and less effective because of high level of adulteration by the dealers. 10.0% of respondents encountered the problem of poor access to improved seeds. High cost on unavailability of fertilizer(4.0%) was complained by the respondents. Fertilizer is essential for crop growth particularly cereal crops. This important production input is very expensive especially in rural areas where farming takes place (Awuwa, 2009). 6.67% complained about weaver birds. Inadequate rainfall was reported by 12% of the respondents. Water is necessary for rice growth particularly during tilling and grain milking. The menace of Fulani cattle (5.33%) was incurred by upland rice farmers in the study area. Other problems reported by farmers were pest ;6.67, disease,; 2.0% and rodent; 5.33% and poor access to improved storage facilities; 6.67%. 88 Table 1.6: Cost and returns analysis of upland rice production per hectare Item Unity QTY Price/unit cost / value 2100 N 168000 Gross Revenue Yield kg 4000 (80 bags of 50kg) Total revenue: N 16800 Variable cost Rice seeds kg80 42 3360 Fertilizer (a) NPK kg50 3200 16000 kg20 2000 4000 Nursery / preparation md15 600 9000 Slashing the upland md15 700 10500 Tilling md10 800 8000 Transplanting md10 600 6000 Fertilizer application md15 600 9000 Weeding md10 700 7000 Bird scaring md5 600 3000 Harvesting md10 600 6000 Threshing md8 600 4800 Bagging md8 400 3200 (b) Urea LABOUR 89 Opportunity cost of capital (Bank Lending Rate 22% for 6 Months) = TVC + TFC = N 19910 Interest rate (%) Net farm income = TR – TC = N 77500 Gross margin = TR – TVC = 144000 Benefit cost ratio = TR = 1.86:1 TC Analysis of Cost and Returns Cost and Returns of Upland Rice Production Per Hectare The cost elements in rice production are rice seeds for nursery, fertilizer, labour and tools. No attempt was made to lands on which minimal or no rent are paid. The farm tools include: hoes, cutlasses and sickles which were depreciated for six (6) months. Cost of Inputs The average quantity of seeds planted per hectare was 80kg, given a cost of N42.00 per kg, expenditure on seed for planting was N 3360, and about 250kg of fertilizer (NPK) costing N 16,000 was 10kg of urea costing N 6000.00 was applied respectively costing N 22,000. Total cost of physical inputs cost N 23,360.00. Labour cost Total number of 55 Mandays was used to produce one hectare of paddy rice. Harvesting took the greatest Mandays (12md) while nursery preparation was the least (2MD). Wage rate varied with the nature of the farm operation. The total cost of labour was therefore N 36,700 representing 90 61.1% of all cost. Note the women and children wage rate were converted into Mandays using Spencer 1973 method (Nwaru, 2008). Cost and Returns A total of 400kg of paddy rice was harvested per hectare. At N 2,100 per 50kg of rice paddy at prevailing market value this yielded revenue of N 168000.00. Table 1.7: Result of Multiple Regression on Effect of Socio Economics Characteristic on Farmers Output Variables Linear Double log* Semi –log Intercept 705.346(2.732) 3.777(3.570) -1034.40(-1.586) Age - 415(-860) -035(-1.352) -14.408(-908) Gender -43.644(-2.768)*** -0.44(-2.339)** -26.442(-2.270)** Farming experience 0.787(.419) .007(.568) 1.519(.187) Marital status 19.241(1.818)* -053(2.932)*** -25.647(2.686)*** Educational level 310(3.418)* .121(1.32)*** .243(3.412)** Farm size 62.238(-370) -035(-213) -39.783(-384) Production cost -201.370(-410) -045(-223) -41.693(-294) Labour .095(3.219)** -368(2.795)*** 314.159(3.677) R2 .258 .300 .284 R-2 .147 .196 .177 F – ratio 2.333 2.887 2.667 ** t is Significant at 5% level 91 In table 1.7 the socio economic variables considered, Age, gender, farming experience, mantel status, Educational level, farm size, production cost and labour. Based on statistics and econometric analysis such as the number of significant variables and the values of the coefficient of the determination R, Double log was chosen as lead equation. The R2 value was. 300 meaning that 30% of the variability in the dependent variable was explained by the explanatory variable in the model. Age in Years The coefficient of age was negative and not significant. The negative relationship of age could be because, farming activities is tedious, thus requiring lost of mental and physical exercises which is lacking among the aged. This is in line with Eze and Arpa, (2010). Gende r The variable coefficient was positive and significant at 5%.. rice farming requires energetic and able bodied individuals which are often found on move folks. Marital Status Marital status was negative and significant at 1% probability level. Married people have tendencies of having many household members that could serve as source of farming labour to reduce cost of production (Ukoha, 2004) This finding is consistent with Ezedinma, (2003). Level of Education Attained The education level coefficient was positive and significant at 1% probability level. This is in line with Okoye and onyenweaku, (2008) who reported that education helps to improve ones managerial skills and access to information to increase his farm produce. Farm size in ha The coefficient of farm size was negative and not significant. The negative coefficient ie negative sign on the coefficient of arm size could be attributed to impoverished mature of our soils which result in low crop yield particulate the necessary soil amendments to boost soil fertility Bakara S.O. (2008). 92 Labour in Mandays The coefficient of labour was negative and significant at 1% probability level. This is in consonance with Ezedinma (2003) who opined that labour cost constituted more than 45 – 60% of the total cost of production. Conclusion. All the operations in rice production are manually done and are very tedious. This fact coupled with limited resources especially land and capital led to low productivity in the study area. Rice production is a profitable enterprise in four (4) selected Local Government Area, ( Abakaliki, Afikpo North,Ezza south and Ivo) based on the results of the study. References: Awuwa, A.(2009). A world rice statistics.(online edition, 2009). Bakara S.O. (2008). Improve Technolgoies to meet rice production needs of Nigeria. Training manual on rice production and processing 2008 published by N.C.R.I Badeggi Niger State. Bamos S.A. and Philip D.S. (1990): - Rice production and consumption in Nigeria and different type of rice species. A case study of kwara State pp.34-3. Eze, C.I. and Akpa, C.E, (2010); Analysis of technical efficiency of National fadama II facility on Arable crop farmers in Imo State, Nigeria. Nigeria Agricultural Journal pp:109112 Ezedinma, C.I. (2003) challenges opportunities and strategy for cassava sub sector development in Nigeria. Proceeding of international society for tropical root crops (ISTRS) held in Tanzania. Pp.627-640. Hossain, M. and fischer, K.S. (1995). Rice research for food security and sustainable development in Asia. Achievements and future challenges. Geojournal, 35(3): 286298. Iheke, D.R. (2010). Market ascess. Income Diversification and welfare status of rural farm Households in Abia State, Nigeria. The Nigeriam Agricultural Journal 41(2): 13-18. Komolate M.F. (1980); Agricultural science west agric for school and colleges pp. 84. 93 Lawani S (1991); Nigeria to produced Enough rice in 1985. oxford publishers London pp. 369. Nwankwor, F.N; Ifenkwe, G.F; Onummadu, E.N; and Ekwe, K.C., (2010). Determinant of the adoption of improved cassava verities (TMS 419 and NR 8082) among farmers in Abia State. The Nigerian Agricultural Journal pp. 123-125. Nwaru J.C (2008). Comparatice analysis of the mean output of rice and profit by man and women in rice production systems in Abia state of Nigeria. Agricultural Journal 3(2). 147-151, 2008. Nweke F.I. (1990); The role of market factors in small holder cropping system in southern Nigeria II Canadian Journal of Agricultural Extension vol. 28 No. 3pp 67-69. Omoruyi S.A, Akerobo, A.A, orhue, U.X. and Ghime, C.I.A., (1998). Prescribed Agricultural Science for senior secondary schools. Ulama published Ltd Edo State. Osi and Antoni (1970); food and Agricultural July- September vol. 2.pp3. Okoye and onyenweaku (2008). The political economy of Agricultural protection East Africa in international perspective. London, Allen and Unwin RMRDC (2005) survey Report of Raw material research development council, Abuja. Ukoha, J.C., (2004): Rural credit market and resource use in Arable crop production in Imo State. Ph.D thesis Micheal Okpara University of Agriculture Umudike. Ume, J.C and Okoye, M.(2000).Breaking the yield frontier of rice. (geojournal,35(3): 325-328. Ume, J.C., Higawa, S.A, Onyebanyi O.O and Adesola, O.A. (2007). Agricultural policy instability in Nigeria. The rice farmers Ever Adjusting production helding Abuja. 94 INDUSTRIAL APPLICATIONS OF RICE BY–PRODUCTS IN NIGERIA Jolaoso M.A., Onjewu S.S., Oladele T. O and Maduegbunam F.U. Raw Materials Research and Development Council (RMRDC), Abuja Introduction Rice, an annual crop of the Gramineae family, is an ancient grain consumed as healt hy and staple food by more than half of the world population. Rice is consumed by about 5.8 billion people in 176 countries and is the most important food crop for 2.89 billion people in Asia, 40 million people in Africa and 1.3 million people in America (FAO 1996) Throughout history, the ability to produce surplus rice has assisted the development of various communities and failure of rice crop has led to widespread famine, death and political instability in many countries especially in Asia. Recently, the popularity of rice as food has increased in a number of countries in Africa and America where it is not traditionally a major food crop. In addition to its importance as food, rice production and industrial processing is creating economic activities providing employment for millions of rural people. RMRDC (2005) The chemical composition of rice grain varies considerably depending on the genetic Variety of the crop , environmental conditions such as location ,season and fertilizer application as well as post harvest operations such as parboiling, degree of milling and conditions of storage .On the average , milled rice grain contains about 80% carbohydrate , 0.5% ash and 12% water (juliano et al, 1990). Even though the protein content of polished rice is so mewhat lower than that of wheat, maize and sorghum, the quality of the protein is considerably higher .Lysine, the most important limiting essential amino acid constitutes about 4% of the protein of rice, twice the level of that contained in wheat flour or hulled maize. In addition the percentage of threonine and methionine, two other essential amino acids, are considerably higher in rice protein than in the protein of maize, wheat or sorghum. Despite that rice protein does not contain sufficient lysine, threonine 95 or methionine hence for proper protein nutrition, supplementary food as legumes, meat and fish, should be part of the diets of those who consume large quantities of rice. Although rice has low protein, vitamins and minerals its carbohydrates are easily digested and the net protein utilization value is 63 compared to 49 for wheat and 39 for maize. Rice is relatively non-allergic and rare cases of hypersensitivity are recorded and for this reason patients with food allergy symptoms of unknown causes are often placed on an exclusively rice diet until the allergic source is identified. Because of its low sodium content, rice is also commonly prescribed to patients suffering from hypertension (high blood pressure). Rice Production, Importation and Consumption in the World World Production of Rice A study by the United States Department of Agriculture showed that the global rice production for the year 2002/2003 was projected at 381.8 million tonnes (milled basis). This estimate indicated a 4% decrease when compared with the figure of the previous year. India and china were expected to account for the bulk of the production. It has been observed that rice is produced to some extent in almost all the countries of the world. Only about 24 countries do not plant rice. Out of those that produce, about 17 countries are known to harvest over 1 million ha of rice land per annum. The production figures and other data on the commodity for the 17 world major rice producers for the period 2001 – 2004 as shown in table 1 Hecterage of Planted Rice The figures in table 1 show that the 17 countries cultivated a total of 134.59 – 153.53 ha of land during the period 2001 – 2004. India has consistently cultivated the largest area of rice land (44million ha/annum) or about 32% of the total for the 17 countries during the period. The figures in table 1 also indicated that Nigeria cultivated a total of 1.65 – 1.66 million ha in 20012003, indicating about 1.2% of the total for the countries and occupy the 13 th position among the countries in terms of area of land cultivated with rice in 2001 and 2002. However, this position slightly improved table 3 in the following years with the country occupying the 12 th position 96 among the 17 countries although the percentage score of the tota l area cultivated by the countries did not change from its figure 1.2%. Table 1: World major Rice Production Figures and other Data for Area Harvested Milled Production Total Imports Jan-Dec Imports Year 2001-2004 Total Exports Total Dom.consp Country (1000HA) (1000 MT) (1000MT) (1000MT) (1000MT) (1000MT) Bangladesh 10,666 24,310 243 313 0 25,553 Brazil 3,149 7,067 625 554 25 8,300 Burma 6,200 10,440 3 1 1,002 9,900 Cambodia 1,980 2,583 42 42 0 2,625 China 28,812 124,306 304 304 1,963 134,581 India 44,600 93,080 0 0 6,300 87,351 Indonesia 11,600 32,960 3,500 3,500 0 36,382 Japan 1,706 8,242 655 616 45 8,779 Korea Rep 1,083 5,515 117 136 126 5,155 M adagascar 1,200 1,702 100 100 0 1802 Nepal 1,500 2,500 10 3 0 2,510 Nigeria 1,650 2,100 1,906 1,897 0 3,826 Pakistan 2,115 3,882 0 0 1628 2,635 Philippines 4,080 8,450 1,200 1,250 0 9,040 Thailand 10,125 17,499 15 15 7,245 9,450 United States 1,341 6,714 419 420 2,954 3,850 Vietnam 7,471 21,036 40 40 3,245 17,300 TOTAL 139,278 372,386 Source: Survey Report of Ten Selected Agro Raw Materials in Nigeria .Rice RMRDC (2005). In Nigeria, rice is the sixth major crop in cultivable area after Sorghum, Millet, Cowpea, Cassava and Yam. It is the only crop, which is grown nation-wide and in all agro ecological zones from the Sahel to the coastal swamps. It is estimated that 4.6 million ha of land could be put into cultivation in the country, but only about an estimated 1.9 million ha are currently utilized. The current level of production cannot therefore meet the estimated national requirements. Table 2 shows a detailed production, importation and total consumption (production +importation) since Nigeria does not officially export rice. The data will be useful in estimating the total by-products to be generated. 97 Table 2: Production and importation of rice in Nigeria (1000 Tonnes) Year *Production **Importation Consumption 1996 3, 122 350 3, 472 1997 3, 230 731 3,961 1998 3, 486 900 4,386 1999 3, 522 900 4,422 2000 3, 841 900 4,741 Source: * CBN Annual Report and state ment of account year 2000 Table 3: Annual Production Levels of Rice in Nigeria (1000 Tonnes) 1999 2000 2001 2002 2003 3,522.0 3,841.0 3,989.0 4.085.0 4, 364.8 Source: Central Bank of Nigeria Statistical Bulletin Vol. 15 Dec. 2004 2004 4,605.4 Rice By-Products Based on the available data on rice production in Nigeria and from the accounting percentages of the various by-products, table 4 shows the estimation of rice by-products. Table4. Estimation of Rice by Products from Available Production Data (1000 Tonnes) Year Production (paddy) Bran (6.5% of paddy) Husks/hulls (20% of paddy) Straw (10% of paddy) Total by product 1996 3,122 1997 3,230 1998 3,486 1999 3,522 2000 3, 841 203 210 227 229 250 624 646 697 704 768 3, 22 3, 230 3486 3,522 3, 841 1, 149 1,179 1, 242 1, 392 1 412 NB: For values given as range the averages are used The generation of these by products are expected to increase tremendously with the launching of Agriculture Transformation Agenda of the present federal government of Nigeria and the slogan Eat Nigerian Rice’’, (Appendix1, Nigeria Rice Importation from 1960-2012) 98 The zeal of the farmers and the expected supporting policies and political will of the Nigerian Government at various levels is expected to lead to the realization of this noble and laudable goal of not only being self sufficient but also exporter of rice. Table 4 shows a three-year projection of total production and the expected by-products to be generated with the year 2000 as the starting point. Table 4: Projected Production and Expected By Product Generation Based On Graduated 25% Annual Increase of Farmers Production (000MT) Year Project production Expected rice bran Expected rice Husks/hulls Expected Straw Expected total By product starting point(2000) 3,841 2003 2004 2005 4,801 6,001 7,501 250 313 391 489 768 960 1,200 1,500 3,841 4,859 4,801 6,074 6,001 7591 7,501 9489 Rice Straw Rice grain is obtained by threshing the crop to remove the straw from the grain .The first byproduct of the rice is therefore the straw and chaff, which are separated during threshing from the rice grain. With the harvest index of most high- yielding varieties from 0.4 to 0.6, the weight of the straw produced from one hectare of the rice is equivalent to between 80% and 120% (Nyuyen, 2000), traditional rice varieties produce more straw than grains, based on dry matter basis. In many Countries, large quantities of rice straw are either ploughed back into the soil or burnt during land preparation. The burning of rice straw has negative effects on the environment and many countries have restricted the use of the system. Rice straw consists of fiber, carbohydrate, protein and traces of some vitamins. This by-product has been put into use long before now as ruminant feed directly either in situ at the farm or fed as supplement at home. This is why the tractor driven combine harvester machine has a s traw bale attached to it, which tie up the straw into bundles for easy collection and gathered as hay after 99 harvesting. In terms of dry weight, this by product is as large as the grain itself, hence the quantity is enormous. The following uses have been made of rice straw: i. Feed for Ruminants: Ruminants such as cattle, buffalos, sheep and goats are fed with this by-product as hay. The total digestible nutrient content of rice straw for the different species is 39-40% for Cattle, 36-43% for sheep and 39% for goats. The feeding value of straw has been improved with the production of partially digested straw using NaOH, high protein straw and urea-treated straw. ii. Fertilizers: One tone of straw contains about 9kg N, 2kg P and S,25Kg K, 70kg Si,6Kg Ca and 2Kg Mg. Rice straw has been extensively composted and applied to rice crop in china ,Viet nam and other Asian Countries, but its utilization has decreased with the availability of chemical fertilizers and the scarcity of labour . With emphasis on biotechnology, effort should be geared towards using more of the compost fertilizer than chemical fertilizers. iii. Medium for mushroom production: Straw has been used as a medium for growing tropical mushrooms. it used for composting , a process whereby substrate (waste such as straw), lime and water are weighted and mixed together in the right proportion. Waste, lime and water are usually mixed together in the ratio 32:2:66 respectively. iv. Fuel for cooking: Straw can serve as a fuel during cooking so as to minimize the rate at which trees are normally felled for firewood v. Roofing Material: Straw can be used to decorate and roof various sorts of dwelling places due to its nature of disallowing heat from the sun to penetrate and thus making the dwelling place cool. vi. Pulp and Paper: Rice straw is another alternative fiber material for paper production. The characteristics of this material differ according to origin and climatic conditions. However, differences do not require adjustments to the production technique or restrictions regarded the choice of paper product. The average fiber length is 1.5mm; and pulp is consequently weak and 100 needs reinforcement (international Labour Office 2000). When straw is chemically or mechanically cooked and bleached, yields of 30-45% can be obtained. Brightness may reach 720 G.E. straw can be used as major constituent of paper e.g. 60-70% for writing and printing papers. The addition of up to 50% of long fiber support is needs for production of various grades of wrapping papers. vii. Fiber Board: Rice straw could be used for making pressed fiber boards for furniture making. viii. There are also technologies’ available for the production of the following products from straws: ethyl alcohol, butyl alcohol, acetic acid, lactic acid, erythobric acid and xylitol. The application of these technologies depends greatly on costs and benefits. Rice Hulls and Husks The rice grain (rough rice or paddy) consists of an outer protective covering, the hull and the rice caryopsis (brown rice or dehulled or husked rice). The hull consists of lemma, palea, sterile lemmas and rachilla. This tough coat is removed during milling and forms another by-product called rice hulls and husks. Rice hulls and husks account for 20% of the grain weight, (Nguyen 2000). Rice husks and hulls consist mostly of carbohydrate and fiber with trace of some proteins and vitamins. They are found stock piled where rice mills exist. Presently in Nigeria they are not properly harnessed and are commonly burnt. There are even reported incidents of severe burning of children as a result of playing into hot charcoal of burning husks / hulls. This situation portends danger to our children, as it burns slowly un- noticed. Rice husks and hulls could be useful in the following ways: i. As Component in Livestock Feed Formulation: Feeds account for about 70%of the total cost of production in poultry. Therefore any effort that will result in reducing the cost of feed will imply increase in profitability of the venture. rice husks and hulls contain mainly carbohydrate, hence it ser ve to complement or substitute the use of Maize , Cassava or any other source of carbohydrate in the 101 formulation of feed. Since the husk is fibrous, enzymes are usually added to the feed to increase its digestibility. ii. It should however be noted that the presence of minute quantity of oil in the husk limits its quantity used in a given formulation , as too much of rice husk in the feed affects its shelf- life because the presence of oil gives the feed the tendency to become rancid iii. Components of Composite Materials for Ceramics Rice husk has been found useful in the ceramics industry, used as additives to improve the quality of ceramic product. Rice husk is mixed with other materials such as feldspar, to produce glassy aesthetic finishing of the ceramic. iv. Pressed Fiber Board. Like sawdust, rice husk as been found useful in the fiberboard industry to produce high quality boards used for making household furniture. The use of rice husk for manufacture of which our forest reserve is daily being depleted without proportionate planting for replenishing v. Fuel/Energy: Rice husks/hulls can also be used to produce fuel pellets called briquettes by mixing it with binders or produced under high temperature compaction without binders. The briquette produced has typical calorific values of the order of 4000k cal/kg as compared with firewood that has an average figure of 3100k cal/kg (RMRDC 2000). Besides cooking, briquettes are ideal for rural industries such as small-scale foundries, brick kilns and bakeries. Thus briquettes can serve as alternative source of heating in place of firewood; hence it will contribute in reducing desertification problems and its attendant menace. To make these briquettes smokeless, they are carbonized by burning in the absence of air to obtain high quality smokeless briquettes. Biogas is another source of energy obtained by anaerobic decay of organic materials to obtain combustible methane gas, which can be used as cooking gas. Rice husks and hulls 102 can be mixed with organic materials such as anima l dung’s or other crop residues to obtain optimum results in terms of quantity of gas generated in a given period of time. Besides the use of husks /hulls in form of briquettes, the loose form has been used for cooking and drying, using special stoves and dryers respectively.FAO and IRRI have improved and popularized the use of such in several Asian and African Countries vi. Organic Fertilizers Rice husk can be used as component of materials for organic fertilizers. The materials when mixed with rice husk and allowed to decompose produce organic fertilizer, which can be used to increase crop yield. vii. Bedding material/litter: Used as absorbent to keep poultry houses dry while at the same time keeping the chicks warm away from the cold floor. It is also used as bedding for ducks and horses. Eventually the litter could be disposed on the farm, which decomposes to improve the soil fertility for improved crop yields. viii. Seed bed medium: Ash of husks and hulls is used as a bed medium in vegetable production; while charcoal of hulls and husks is used in seedling and truck gardening. Besides the above use, there are technologies available for production of the following products from rice hulls and husks; tiles and moldings; inorganic fiber; cation exchange resin; photo catalyst; sodium silicate/water glass and producer gas. ix. Rice Husk Ash Cement Rice Husk is found to be useful in the production of rice husk ask cement. Rice husk constitutes 20% of paddy rice, it has the highest potential of being used for pozzolana cement making since its ash contains up to 9- -95% pure silica. For every one tone of burnt husk 20%ask is generated. Hitherto, husk was considered as a waste material and has generally been disposed by dumping or burning. In many countries, husk has been successfully converted to pozzolana e.g. India, Columbia, and Thailand. Currently the total world output of cement based on vice husk in estimated around 30, 000 metric tonnes. 103 Alternative cement provide an optima to ordinary Portland cement at much lower cost 50% hence it has potential to making significant contribution to low cost building materials and consequently facilitating affordable shelter. x. Production of advanced Bio-composites Rice is cultivated in virtually all the agro-ecological zone of Nigeria. About 1.8 million hectare of land is under rice cultivation with annual production of paddy rice put at over 1.9 million tonnes. Globally, about 1.0 billion tonnes of rice husks are produced. As an alternative to natural wood, rice husk can be used as reinforce ment in thermoplastic resin to produced advanced Bio composite which has great potential of making significant contribution to low cost of building materials and consequently facilitating affordable shelter. Also, the product is environmental friendly and is in line with the global effort on environmental conservation and contributes significantly towards addressing issue of depletion of natural resources Rice-Bran ice bran consists of germ, pericarp, alerurone cells and seed coat. After the husk has been removed, the rice is polished to produce the shinny white appearance considered so attractive in imported rice. The grains have their outer cover removed by means of a rotating drum covered with leather strips, which gives a final polish to the rice. The broken layer removed by the polisher forms yellow-brown powder called the rice-bran. This accounts for 5-8% of the paddy weight (Nguyen, 2000). According to FAO report, from a rice crop of about 500 million tonnes, the world produces about 35 millions tonnes of bran per year, containing about 6milloin tonnes of protein, also with launching of increased rice production in Nigeria for domestic consumption and export , an estimate of over 250,000 tonnes of bran is expected to be generated. It has been observed that when brown rice is milled into white rice, enzymes in the bran come into contact with the oil in the bran and they immediately begin to degrade the oil to free fatty acids (FFA)and glycerol causing the bran to become unpalatable and oil recovery uneconomical. 104 This phenomenon that limits the utilization of rice – bran has been arrested as scientist have developed a number of machines designed to stop this enzymatic degration and by so doing, stabilize the rice bran in developed countries. a stabilized and par boiled rice-bran consist of 812% moisture, 12-16% protein, 16-20% fat, 8-12% fiber and 7-10% ash, (Saunders 1990). Minerals such as Aluminum, calcium, Chlorine, Iron, Magnesium, Manganese, Phosphorus, Potassium, Silicon, Sodium and Zinc are available in different proportion in rice bran. Vitamins such as vitamin A, Thiamine, Riboflarin, Niaci pyridoxine, pantothenic acid, Biotin, Myonino sitol, choline, folic acid, vitamins B 12 and E are also obtainable in different quantities in rice bran. With the development of a method for stabilizing rice bran and the recent technologies in chemical extraction, the utilization of bran has increased. Rice-bran has the following direct uses. i. Feed As component of feed for livestock such as Sheep, Goat, Cattle , Poultry Pigs etc ii. Mushroom bedding As material for the preparation of a growing medium for different species of mushroom iii. Medium for production of protease and milk clotting enzyme. iv. Medium for screaming saccharomyes species for ethanol production. Other products obtainable from rice bran include rice bran oil, inositol, rice bran flour, high protein isolate flour, vitamins B complex concentrate, bran protein concentrate, tocopherol (vitamin E), Oryzanol, phytin/phytic acid, emulsifier, ferulic acid, lactic acid/calcium lactate, dietary fiber and hydroxyapatite/ceramic Conclusion With the harvest index of most high- yielding varieties from 0.4 to 0.6, the weight of straw produced from one hectare of rice is equivalent to between 80% and 120%. Traditional rice 105 varieties produce more straw than grains, based on dry matter basis. This by-product has been put into use long before now as ruminant feed on it directly either in situ at the farm or fed as supplement at home. in terms of dry weight ,this by-product is large as the grain itself, hence the quantity is enormous. One tone of straw contains about 9 kg N, 2kg P and S, 70Kg Si, 6Kg Ca and 2kg Mg. With emphasis on biotechnology, effort should be geared towards using more of the compost fertilizer than chemical fertilizers. Rice hulls and husks account for 20% of the grain weight consist mostly of carbohydrate and fiber with trace of some proteins and vitamins. Hence it serves to complement or substitute the use of Maize, Cassava or any other source of carbohydrate in the formulation of feed. Since the UK is fibrous, enzymes are usually added to the feed increase its digestibility. Rice husks/hulls can also be used to produce fuel pellets called briquettes by mixing it with binders or produced under high temperature compaction without binders. The briquette produced has typical calorific values of the order of 4000k cal/kg as compared with firewood that has an average figure of 3100k cal/kg. Besides cooking, briquettes are ideal for rural industries such as small scale foundries, brick kilns and bakeries. Thus briquettes can serve as alternative source of heating in place of firewood; hence it will contribute in reducing desertification problems and its attendant menace. To make these briquettes smokeless, they are carbonized by burning in the absence of air to obtain high quality smokeless briquettes. Biogas is another source of energy obtained by anaerobic decay of organic materials to obtain combustible methane gas, which can be used as cooking gas. Besides the use of husks/hulls in form of briquettes, the loose form has been used for cooking and drying, using special stoves and dryers respectively. FAO and IRRI have improved and popularized the use of such stoves in several Asian and African Countries The world produces about 35 million tonnes of bran per year, containing about 6 million of oil and 5 million tonnes of protein. Also with launching of increased rice production in Nigeria for 106 domestic consumption and export, an estimate of over 250,000 tonnes of bran is expected to be generated. With the development of a method for stabilizing rice bran and the recent technologies in chemical extraction, the utilization of rice bran has increased. Appendix 1: Nigeria Rice Importation From 1960 To 2012 Market Year Imports Unit of Measure Growth Rate 1960 1 (1000 MT) NA 1961 1 (1000 MT) 0.00 % 1962 1 (1000 MT) 0.00 % 1963 2 (1000 MT) 100.00 % 1964 1 (1000 MT) -50.00 % 1965 1 (1000 MT) 0.00 % 1966 1 (1000 MT) 0.00 % 1967 1 (1000 MT) 0.00 % 1968 1 (1000 MT) 0.00 % 1969 1 (1000 MT) 0.00 % 1970 1 (1000 MT) 0.00 % 1971 6 (1000 MT) 500.00 % 1972 11 (1000 MT) 83.33 % 1973 2 (1000 MT) -81.82 % 1974 4 (1000 MT) 100.00 % 1975 6 (1000 MT) 50.00 % 1976 94 (1000 MT) 1,466.67 % 1977 446 (1000 MT) 374.47 % 1978 789 (1000 MT) 76.91 % 1979 242 (1000 MT) -69.33 % 1980 394 (1000 MT) 62.81 % 1981 686 (1000 MT) 74.11 % 1982 666 (1000 MT) -2.92 % 1983 903 (1000 MT) 35.59 % 1984 629 (1000 MT) -30.34 % 1985 569 (1000 MT) -9.54 % 1986 462 (1000 MT) -18.80 % 1987 642 (1000 MT) 38.96 % 1988 344 (1000 MT) -46.42 % 107 1989 164 (1000 MT) -52.33 % 1990 224 (1000 MT) 36.59 % 1991 296 (1000 MT) 32.14 % 1992 440 (1000 MT) 48.65 % 1993 382 (1000 MT) -13.18 % 1994 300 (1000 MT) -21.47 % 1995 300 (1000 MT) 0.00 % 1996 350 (1000 MT) 16.67 % 1997 731 (1000 MT) 108.86 % 1998 900 (1000 MT) 23.12 % 1999 950 (1000 MT) 5.56 % 2000 1250 (1000 MT) 31.58 % 2001 1906 (1000 MT) 52.48 % 2002 1897 (1000 MT) -0.47 % 2003 1448 (1000 MT) -23.67 % 2004 1369 (1000 MT) -5.46 % 2005 1650 (1000 MT) 20.53 % 2006 1500 (1000 MT) -9.09 % 2007 1800 (1000 MT) 20.00 % 2008 1750 (1000 MT) -2.78 % 2009 1750 (1000 MT) 0.00 % 2010 2400 (1000 MT) 37.14 % 2011 3200 (1000 MT) 33.33 % 2012 2300 (1000 MT) -28.13 % Source: USA Departme nt of Agriculture 2012 108 References Irvine F.R (1969). West Africa Crop. Nguyen V.N (2000). Food and Agriculture Organization Rice Information. Juliano B.O and P.A Hicks (1990). Utilization of Rice Functional Properties to produce Rice Food with Modern Processing Technologies: international Rice Commission News Letter. Saunders R.M. (1990). Stabilized Rice Bran: A New World food Resources: in international Rice Commission News Letter. Technical Report on Rice Project (2002). Raw Materials Research and Development council. Technical Report on “Design, Construction and Testing of Motorized Briquetting Machine for Wood and Agricultural Wastes” (2000). Raw Material Research and Development Council, Abuja Nigeria. Ukwungu M.N (2000). Rice in Nigeria: My Experiences, Reported in Agronomy in Nigeria Edited by Akoroda, M.O (2000). A Report Compiled by Joint Auspices of International Labour Office and the United Industries Development Organization on Small Scale Paper Making”1985 Central Bank Of Nigeria (CBN). Annual Report and Statement of Account , year 2000 109 A Review of Drivers and Constraints of Sawah Technology Adoption Among Farmers in Nigeria *Alarima C. I.1 , Agboola A. O.2 , Masunaga T.1 and Wakatsuki T.3 1 Faculty of Life and Environmental Sciences, Shimane University, Matsue, Japan. 2 Hirose Project, International Institute of Tropical Agriculture, Ibadan, Nigeria. 3 Faculty of Agriculture, Kinki University, Nara, Japan. *Corresponding Author: Alarima C. I. Soil and Ecological Engineering Laboratory, Faculty of Life and Environmental Sciences, Shimane University, 690-8504, Matsue, Japan. [email protected] Abstract The need to increase local production necessitated the introduction of sawah technology to enhance domestic rice production in Nigeria. Sawah technology was introduced to inland valleys of Nigeria in 2001 but has not been able to achieve the desired target of increasing local rice production to a level of self sufficiency. This study is therefore carried out to review the drivers and constraints to adoption of sawah technology. The study revealed that the trend of sawah technology has increased since the time of its introduction till prese nt with high adoption level among the farmers. The study further revealed that adoption of sawah technology among farmers is driven by the characteristics inherent in sawah technology which include increased yield, weed control ability, disease and pest management attribute, effective water management, fertilizer management efficiency, land preparation and good tillering. The major constraints affecting the adoption of sawah technology in Nigeria are constraints related to land acquisition and tenure, economic constraints, technical and mechanical constraints, information and training constraints and soil fertility. In disseminating sawah technology to other areas where the technology has not been adopted, these motivating factors must be considered. Also effort must be made to address these constraints identified in this study. 110 Introduction To achieve self-sufficiency in rice production in Nigeria, given the limited possibility for expansion of cultivable area and increase in population, there is need for a Green Revolution (GR) (Diao et al. 2008; Otsuka and Kijima 2010). GR enhances crop yield per unit of land by using high- yielding varieties (HYVs), irrigation and agrochemicals such as fertilizers, pesticides and herbicides. One of the most important features of the GR is the use of agrochemicals (fertilizers, pesticides, herbicides). Agrochemicals are used because HYVs were constructed to be responsive to chemical fertilizers and were more susceptible to pest outbreaks. GR provided a synergy between agrochemicals and HYVs to achieve increase in rice production. Wakatsuki (2008) noted that to realize green revolution in Sub-Saharan Africa, it is essential to improve rice- growing environment by promoting lowland sawah system. This is because the sawah system utilizes the inland valleys which are reported to be high in fertility and through appropriate water management, fertility can be sustained and enhanced for rice production (Wakatsuki and Buri 2008). The concept and the term “sawah” refers to man- made improved rice fields with demarcated, leveled, bunded and puddled rice fields with water inlet and water outlet, which, if possible, can be connected to various irrigation facilities, such as irrigation canals, pond, spring, pump, water harvesting, and flooded sawah. The term “sawah” originated from Malayo-Indonesian. The English and French terms, Paddy or Paddi, also originated from Malayo-Indonesian term, Padi, which means rice plant. In order to avoid confusion between upland paddy fields and man-made leveled, bunded and puddle rice fields, i.e., typically irrigated rice growing environment, which is often inappropriately used as lowland paddy fields, the authors propose to use the term “Sawah” in SSA (Wakatsuki et al 1998). The basic elements of sawah system include improved irrigated rice basins, seedbed preparation, transplanting and spacing of seedlings, fertilizer application and most importantly, appropriate water management. Fashola et al. (2006) also reported that the sawah system offers the best option for overcoming the constraints of rice production in Nigeria, namely poor soil fertility, poor water management and poor varieties. 111 In Nigeria, the sawah system was introduced through on- farm adaptive research in the two research sites of Gara and Gadza inland valleys, located in Bida, Nigeria in 1986 (Hirose and Wakatsuki, 2002). On- farm adaptive research and participatory trials on Sawah system research were conducted on the research sites for four years (1986–1990) by Japanese researchers. In partnership with Watershed Initiative in Nigeria (2001), a Non Governmental Organization, Agricultural Development Project, Ministry of Agriculture, Niger State and National Cereals Research Institute (NCRI), the dissemination of the sawah technology took off in 2001 from villages previously identified in a diagnostic survey (Oladele and Wakatsuki, 2010). The goal of sawah rice production is development of sustainable production systems of the whole watershed, which allows intensification and diversification of the lowland production system. Studies have highlighted the potentials of sawah technology for achieving relatively high yields while effectively protecting the soil (Fashola et al. 2006; Oladele and Wakatsuki 2008). The mass adoption and sustained use of sawah technology are also important due to the resulting environmental benefits. Over the last one decade, the adoption of sawah technology has spread across Nigeria cutting across all the geopolitical and agricultural zones. Although the aim of achieving GR has not been attained, however, progress has been made. There is therefore a need to review the drivers and constraints to the adoption of sawah technology in Nigeria. To achieve self sufficiency in rice production through GR, sawah technology should be disseminated to other farmers across all regions in Nigeria where it has not been adopted at present and the implication is that, in disseminating sawah technology, policy makers must bear the major findings of this paper in mind to enhance effective adoption. Therefore this study will focus on the drivers and constraints to the adoption of sawah technology in Nigeria. The paper is divided into five sections. Section one introduces the concept of sawah technology, section two deals with the level and trend of adoption of sawah technology, section three focuses on the drivers of adoption of sawah, section four reviews the constraints to adoption of sawah technology while section five is the conclusion. 112 Level and Trend of Adoption of Sawah Technology in Nige ria The trend of sawah technology adoption in Nigeria was also reported by Oladele and Wakatsuki (2010) as shown in Table 1 below. Over the last one decade, the number of farmers adoption sawah technology has increase from 3 in 2001 to 1000 in 2009. Following this trend, average yield and farm size have also increased from 4.50 tonnes per hectare and 3 hectares in 2001 to 5.20 tonnes per hectare and 200 hectares in 2009 respectively. Alarima et al. (2011a) also reported a high level of adoption amo ng farmers adopting sawah technology. Sawah technology package was reported to have 56.25 % full adoption, 30.55% partial adoption and 13.20% discontinued use of sawah technology. This implies that there is high adoption of sawah technology among the farmer. This may be due to high yield from sawah field, the improvement in the rate of tillering of the rice, efficiency of fertilizer usage and effective weeds control (Fashola et al., 2006). The high level of adoption among the farmers is a direction toward achieving green revolution in Nigeria. There is a high adoption of bunding, canal construction, use of nursery, power tiller use and puddling, use of sand bag, flooding /irrigation, levelling and smoothening respectively. Awareness of sawah technology among the farmers was reported to play an important role in adoption of sawah technology. Awareness is believed to have a great influence on the adoption of agricultural innovation. Adoption process is the mental process an individual passes from first hearing (awareness) about an innovation to final adoption (Rogers, 2003). 113 Table 1: Trend of Sawah technology adoption in Nigeria Year Number of farmers Average yield(t/h) Field size (ha) 2001 3 4.50 3 2002 5 5.00 5 2003 10 5.10 10 2004 30 5.00 30 2005 100 5.20 50 2006 200 5.10 100 2007 350 5.10 110 2008 500 5.00 150 2009 1000 5.20 200 Source: Oladele and Wakatsuki (2010). Drivers of Adoption of Sawah Technology Adoption process is the mental process an individual passes through from first hearing about an innovation to final adoption (Rogers, 2003). A number of factors have been identified as driving the adoption of agricultural technology. According to Alarima et al. (2011a) adoption of sawah technology among farmers is driven by the characteristics inherent in sawah technology which include increased yield, weed control ability, disease and pest management attribute, effective water management, fertilizer management efficiency, land preparation and good tillering as shown in Table 2. The increase in yield of sawah rice made farmers to adopt the technology. Agricultural innovations that are believed to be profitable to the farmers have an increased likelihood of adoption. On the other hand, if a farmer does not feel that an innovation will be of benefit, there may not adoption in such instance (Vanslembrouck et al., 2002). The ease of diseases and pest control associated with sawah technology as reported by this study made farmers to adopt the technology. Effectiveness of weed control of sawah te chnology and effective water management of sawah technology as reflected in this study made the farmers to adopt the innovation. In a well laid out and levelled sawah field, with proper water distribution, the farmer may not need to weed throughout the gro wing season and there will be effective fertilizer distribution and usage. 114 Fertilizer management in sawah made the farmers to adopt the sawah technology. This is made possible through multi- functionality of sawah systems as constructed wetland and geological fertilization theory. The sawah system can be managed as multifunctional constructed wetland. Submerged water can control weeds. Under submerged conditions, because of reduction of ferric iron to ferrous iron, phosphorous availability is increased and both acid as well as alkaline soil pH is neutralized or mitigated. Hence, micronutrients availability is also increased. Sawah system encouraged the growth of various aquatic algae and other aerobic and anaerobic microbes in addition to rice growth, which increase nitrogen fixation in the sawah system through increase of photosynthesis as functional wetlands. The amounts of nitrogen fixation under the submerged sawah systems are not well evaluated, the amounts could be 20-100kg/ha/year in Japan and 20200kg/ha/y in tropics depending on the level of soil fertility and water management (Kyuma 2004; Greenland 1997). Through geological fertilization, the soils formed and nutrients released during rock weathering and soil formation processes in upland are accumulated at least partly in lowland through geological fertilization processes, such as soil erosion and sedimentation as well as surface and ground water movements or colluvial processes. Fu et al. (2009) also reported that higher yield, better water and weed control, have been recognized by participating farmers as the factors motivating the adoption of sawah technology among the Nupe farmers. Table 2: Reasons for the adoption of sawah technology rice production Reasons Percentage High yield 100.00 Ease of disease management 72.50 Ease of pest management 70.00 Fertilizer management 75.00 Weed control 76.20 Water management 87.50 Land preparation 68.80 Good tillering 90.00 Source: Alarima et al. (2011a) 115 Constraints to Sawah Technology Adoption There are several constraints to the adoption of technologies and innovations by farmers. According to Guerin and Guerin (1994), these included the extent to which the farmer finds the new technology to be complex and difficult to comprehend; how readily obser vable the outcomes of an adoption are; its financial cost; the farmer's beliefs and opinions towards the technology; the farmer's level of motivation; the farmer's perception of the relevance of the new technology; and the farmer's attitudes towards risk and change. Three major categories of constraints that affect an innovation were highlighted by Guerin (2002). The first category relates to users and includes factors such as personality, goal and objectives of using the technology, educational level, and degree of motivation. The second emphasises the characteristics of the innovation itself and issues associated with the developers of the innovation. The third area deals with the role of extension agents and the transfer process. Lack of financial capital has been cited by farmers as a major reason for not adopting beneficial technologies (Agricultural Technology Adoption Initiative (ATAI) 2011). The constraints to sawah development in Nigeria as reported by Alarima et al. (2011b) and Hirose and Wakatsuki (2002) are constraints related to land acquisition and tenure, economic constraints, technical and mechanical constraints, information and training constraints and soil fertility. Land acquisition and tenure constrain include poor fertility of the soil, poor road network from their farms to city centre, and topography of the farm that results in high cost of levelling of sawah basins. Infrastructure such as roads and irrigation plays a key role in facilitating technology adoption. Improved transportation is also associated with diffusion of technology, better use of inputs and better prices for farmers. (ATAI 2011). However, accessibility, availability, conflict and land fragmentation also affect the sawah development. Land tenure security determines whether people will invest in and adopt sawah technology and can therefore be regarded as an important ingredient in adoption of sawah technology. Sawah development needs a secured land on which structures such as bund, canals and dykes should be constructed if not permanently but for a reasonable number of years. According to FAO (2001) land tenure and barriers related to land availability are major constraints to agricultural intensification. Hart 116 (1982) described the land tenure situation in Africa as confusing and conflict-ridden. Constraints relating to insecure land tenure have continued to discourage Africans from making needed agricultural investments (CAPRI, 2005). Secure access and secure rights to land is fundamental in the achievement of food security and sustainable rural development. Production and on- farm constraints affecting sawah development include water management and flood. Other on-farm constraints are drought, weeds, pest and diseases. Wakatsuki (2008) reported that an improvement of the natural resource management technology, especially through the improvement of water control in rainfed lowland plays a major role in increasing rice production among farmers. Sawah development is also faced by some economic constraints faced by sawah far mers such as lack of viable financial agencies to support their production, poor capital base for farming and non-availability of loan to support farming. According to FAO (2001) large investment costs may discourage adoption of technology. It was estimated that one hectare of sawah field will require about ₦435000 ($3000) for development. Also power tiller set used for land preparation on sawah field cost between ₦725000- ₦1015000 ($5000-7000) which is a high investment which the farmers cannot afford as revealed by the farmers in the course of this research . Power tiller is a multipurpose hand tractor designed primarily for rotary tilling and other operations on the farm. Getting loans and other financial incentives will definitely improve their scale of production (Ademiluyi et al. 2008). A number of technical and mechanical constraints were also identified to include non availability of power tillers for land preparation activities, lack of skill for land and site selection, and complexity of water management. Farmers faced severe challenges getting power tillers for cultivation and access to fertilizers during the cropping season. Farmers are also confronted with lack of processing facilities hence they rely on locally made drums for threshing of padd y and travel long distances to mill paddy rice. Power tiller is the only power-driven tool that is effectively used for sawah activities currently in Nigeria. It can be used for puddling, levelling, 117 and transportation and can also be used as a power source for stationary machines for threshing and milling (Ademiluyi et al. 2008). In addition, training, information and manpower development pose a threat to sawah technology. Manpower to effectively understand and disseminate sawah technology remains a key factor to be considered in actualizing the target of GR through sawah technology. The major information and training constraints faced by the farmers are lack of access to extension services and lack of technical knowledge of sawah especially water manageme nt. Technology generated, tried and proved useful but did not get to the end users is less beneficial. Both the technology generation system of the innovation, dissemination system (extension agents) and the farmers are needed for the effective utilization of an innovation. The farmer must know that the technology exists; he must know that the technology is beneficial; and he must know how to use it effectively. External sources of information, such as extension workers, may be particularly important for the adoption of new technologies. Therefore, the identification and use of appropriate communication channels is important (Onasanya et al. 2006). Lack of access to information and extension services by farmers would hinder adoption (FAO 2001). A number of studies have identified soil fertility as a major factor to contend with in successful dissemination and adoption of sawah technology. Wakatsuki et al (1998), Issaka et al. (1997), Buri et al. (1999) and (2000), Kawaguchi and Kyuma (1977), Hirose and Wakatsuki (2002) in various studies reported the low fertility status of soils in West Africa both at inland valleys and flood plains compared to others in Tropical Asia and Japan as shown in Table 3. Total carbon and nitrogen content were low both for West Africa. The mean values of available phosphorous and pH suggest that the phosphorous status of West Africa is very critical. Base status such as exchangeable calcium and potassium and effective cation xchange capacity were also very low in comparison with the tropical Asia. In addition, some micronutrients, such as sulfur and zinc are also generally very low and about 60-80% of lowland soils, both inland valleys and flood plains were in deficient level (Buri et al 2000). Comparison of soil fertility data of tropical America also revealed that the fertility of lowland soils in West Africa was the lowest among the three tropics (Hirose and Wakatsuki 2002). 118 The fragile fertility based of African soils may be due to low amounts of organic matter due to low and/or erratic rainfall and related constrained biomass production. The low level of major soil fertility parameters may also be due to leaching, and/or weathering under humid environment which has resulted in the loss of cations. Table 3: Soil fertility parameter of inland valleys (IVS) and flood plain (FLP) of West Africa compared to Tropical Asia and Japan Location pH Total Total Avail. P Exchangeable C(%) N(%) (ppm)** Cations (cmol/kg) Ca K Mg Sand Clay (%) (%) CEC/Clay eCEC IVS† 5.3 1.3 0.11 9 1.9 0.3 0.9 4.2 60 17 25 FLP† 5.4 1.1 0.10 7 5.6 0.5 2.7 10.3 48 29 36 T. Asia* 6.0 1.4 0.13 18 10.4 0.4 5.5 17.8 34 38 47 Japan* 5.4 3.3 0.29 57 9.3 12.9 49 21 61 † 0.4 2.8 Wakatsuki et al (1998), Issaka et al. (1997), Hirose and Wakatsuki (2002), *Kawaguchi and Kyuma (1977), ** Bray 2 cited in Wakatsuki et al. (2011). Conclusion The paper reviewed the drivers and constraints to adoption of sawah technology in Nigeria. Increased yield, weed control ability, disease and pest management attribute, effective water management, fertilizer management efficiency, land preparation and good tillering were identified as the major drivers of adoption of sawah technology. The study also identified land acquisition and tenure, economic, information, communication and training, technical and mechanical constraints and soil fertility as the major constraints to adoption of sawah technology. In disseminating sawah technology to other areas where the technology has not been adopted, these motivating factors must be considered. Also effort must be made to address these constraints identified in this study. 119 References Ademiluyi, Y. S., Oladele, I. O. and Wakatsuki, T. 2008. Socio-economic factors affecting power tiller use among sawah farmers in Bida, Nigeria. Journal of Food, Agriculture and Environment, 6(3 &4): 387-390. Alarima, C. I. Adamu, C. O., Masunaga, T., Wakatsuki, T. 2011a. Constraints to Sawah Rice Production System in Nigeria. Journal of Human Ecology, 36(2): 121-130. Alarima, C. I., Kolawole, A., Sodiya, C. I., Oladele, O. I., Masunaga, T., Wakatsuki, T 2011b. Factors Affecting the Adoption of Sawah Technology System of Rice Production in Nigeria. International Journal of Food, Agriculture and Environment, 9 (3&4); 177-183. Agricultural Technology Adoption Initiative (ATAI) 2011. Constraints on adoption. http://atairesearch.org/our-approach (Retrieved on July 5, 2011). Buri, M. M., Ishida, F., Kubota, D., Masunaga, T., Wakatsuki, T. 1999. Soils of flood plains of West Africa: general fertility status. Soil Sci. Plant Nutr. 45: 37-50. Buri, M. M., Masunaga, T., Wakatsuki, T. 2000. Sulfur and zinc levels as limiting factors to rice production in West Africa lowlands. Geoderma 94: 23-42. Diao, X., Headey, D., Johnson, M. 2008. Toward a green revolution in Africa: What would it achieve, and what would it require? Agricultural Economics, 39: 539–550. Food and Agricultural Organization (FAO), 2001. FAO Rice Conference 2001. Accessed Online at www.fao.org. Fashola, O. O., Oladele, O. I., Aliyu, J. Wakatsuki, T. 2006. Dissemination of sawah rice technology to farmers cultivating inland valleys in Nigeria. Proceedings of the Asian 120 Pac ific E xte ns ion Ne twork, 6 -8th Ma rc h 200 6, Aus tra lia. Http://www.regional.org.au/au/apen/20 06/Refereed/5/3223_fashola.html#topofpage (Retrieved on December 22 2010). Fu, R. H. Y., Maruyama, M., Oladele, I. O., Wakatsuki, T. 2009. Farmer’s adoption and propensity to abandoned adoption of sawah-based rice farming in inland valley of Central Nigeria. Journal of Food, Agriculture and Environment, 7(2): 379-382. Greenland, D. J. 1997. Sustainability of rice farming, CAB Int’l, U.K. and IRRI, Los Banos, 273pp. Guerin, F. 2002. O vercoming the constraints to the adoption of sustainable land management practices in Australia. Technological forecasting and social change, 65: 205–237. Guerin, L. J., Guerin, T. F. 1994. Constraints to the adoption of innovations in agricultural research and environmental management: A review. Australian Journal of Experimental Agriculture, 34 (4): 549 – 571. Hirose, H., Wakatsuki, T. 2002. Restoration of Inalnd Valley Ecosystems in West Africa, Nourin Tokei Kyoukai, Tokyo. 600pp Issaka, R. N., Ishida, F., Kubota, D., Wakatsuki, T. 1997. Geographical distribution of selected soil fertility parameters of inland valleys in West Africa. Geoderma 75: 99-116. Kawaguchi, K., Kyuma, K. 1977. Paddy Soils in Tropical Asia, Their Materials, Nature and Fertility, University Hawaii Press, pp258. Kyuma, K. 2004. Paddy Soil Science, Kyoto University Press, Kyoto, 280pp Oladele, O. I., Wakatsuki, T. 2008. Social factors affecting wetlands utilization for agriculture in Nigeria: A Case Study of Sawah Rice Production. Rice Science, 15 (2): 150–152. Oladele, O. I., Wakatsuki, T. 2010. Sawah rice eco-technology and actualization of green revolution in West Africa: Experience from Ghana and Nigeria. Rice Science, 17(3): 168-172. Onasanya, A. S., Adedoyin, S. F., Onasanya, O. A. 2006. Communication factors affecting the adoption of innovation at the grassroots level in Ogun State, Nigeria. Journal of Central European Agriculture, 7(4): 601-608. 121 Otsuka, K., Kijima, Y. 2010. Technology policies for a green revolution and agricultural transformation in Africa. Journal of African Economies, 19(suppl 2): 60-76. Rogers, E. M. 2003. Diffusion of innovations (5th Ed.). New York: Free Press Vanslembrouck, I., Van Huylenbroeck, G., Verbeke, W. 2002. Determinants of the willingness of Belgian farmers to participate in agri-environmental measures, Journal of Agricultural Economics, 53 (3): 489-511. Wakatsuki, T. 2008. Materialization of african rice green revolution by sawah ecotechnology (in Japanese). In Matsuzono M, Nawata H, Ishida S. (Ed). Huma n development of Africa: Practice and Cultural Anthropology. Akashi Shoten, Tokyo pp 1-27. Wakatsuki, T., Buri, M. M. 2008. General concept of sawah system. In Buri MM.; Issaka, R. N and Wakatsuki T (Ed). The sawah system of rice production. CSIR-Soil Research institute, Kumasi, Ghana. pp 6-27. Wakatsuki, T., Shinmura, Y., Otoo, E., Olaniyan. 1998. Sawah system for integrated watershed management of small inland valleys in West Africa. In FAO ed., Water Report N0.17, Institutional and Technical Options in the Development and Management of Small Scale Irrigation, pp45-60, FAO, Rome 122 HOUSEHOLD CONSUMPTION PREFERENCE FOR IMPORTED AND DOMESTIC RICE IN KADUNA STATE, NIGERIA: A CLARION CALL FOR RICE QUALITY IMPROVEMENT OYINBO O., OMOLEHIN R.A. AND ABDUSALAM Z. Department of Agricultural Economics and Rural Sociology, Ahmadu Bello University, Zaria, Nigeria. Email: [email protected] Abstract This research was undertaken to determine consumption preference between imported rice and locally produced rice by households in Kaduna state and the factors that influenced the households consumption preference between imported rice and locally produced rice. Primary data obtained from a sample of 310 household heads with the aid of structured questionnaire were employed in this study and the data were analysed using descriptive statistics and logit regression analysis. The results of the data analysis indicated that 75% of the sampled households preferred imported rice to local rice and the factors that significantly influenced the households rice consumption preference are quality of rice(p<0.01), ease of preparation(p<0.1), price of rice(p<0.1), frequency of rice consumption(p<0.1) household size(p<0.1) and household income(p<0.05). Sequel to the high significance of rice quality, it is recommended that that huge investment on rice value chain with emphasis on local rice processing should be pursued by government and other stakeholders in the rice subsector to ensure that the quality of locally produced rice is improved to make local rice highly competitive with foreign rice and thereby encourage shift in consumer preference from imported rice to locally produced rice. This will save the nation from continual loss of foreign exchange in the importation of foreign rice to meet local demand and create job opportunities in line with the rice transformation action plan. 123 Introduction Rice is the world’s most important staple food crop consumed by more than half of the world population as represented by over 4.8 billion people in 176 countries with over 2.89 billion people in Asia, over 150.3 million people in America and over 40 million people in Africa (IRRI, 2004). Nigeria currently doubles as the largest rice producing nation in West African subregion and the second largest importer of rice in the world, this anomaly is attributed to the inability of its local production to meet up with its demand which has been soaring at a very fast rate over the years. As noted by (MARKETS, 2009), Nigeria’s fertile land and rich agro-climatic conditions could easily produce rice to feed the entire country and generate surplus. However, Nigeria has continued to depend on importation from countries like China and Thailand to meet the increasing demand for rice by households. A combination of various factors seems to have triggered the structural increase in rice consumption over the years with consumption broadening across all socio-economic classes, including the poor. Rising demand is as a result of increasing population growth and income level (GAIN, 2012). Rice has become a staple food in Nigeria such that every household; both the rich and the poor consumes a great quantity (Godwin, 2012). Over the years, Nigeria has relied upon the importation of rice to meet its growing demand for rice but the increased demand in recent years reflect more of increases in the demand for imported rice brands partly to meet the shortfalls in domestic demand and partly to meet consumers demand in the urban areas. The importation of rice to bridge the demand-supply gap is worth N365 billion (Ayanwale and Amusan, 2012). The cost of these rice imports represents a significant amount of lost earnings for the country in terms of jobs and income (Bamba et al., 2010). The Nigerian rice sector has witnessed some remarkable developments, particularly in the last ten years. Both rice production and consumption in Nigeria have vastly increased during the aforementioned period (Ojoehemon et al., 2009). However, the demand for rice has continued to outstrip production given the shift in consumption preference for rice especially by urban dwellers. The growing consumption preference for rice have led to several research outcomes on rice in Nigeria but it is worth noting that there exists little empirical information on the 124 determinants of rice consumption preference between foreign and local rice at the micro(household) level which constitutes the gap in research that this study was designed to fill. Therefore, this study was carried out to determine consump tion preference between foreign and locally produced rice, the factors influencing households consumption preference for foreign and local rice brands and draw up relevant recommendation for enhancing household consumption preference for local rice. Methodology Description of the study area The study was carried out in Sabon Gari, Kaduna South and Soba local government areas of Kaduna state. Kaduna state lies between latitudes 10 0 211 and 100 331 North of the equator and longitudes 70 451 and 70 751 East of the Greenwich meridian and has 23 local government areas. It occupies a total land mass of about 46, 053 km2 and its population was put at 6, 066, 526 people in 2006(NPC, 2006) and had a projected population of 6, 903, 746 people in 2012 using an annual growth rate of 3.2%. Sampling procedure and sample size A multistage sampling technique was employed to select the households for the study. The first stage involved a random selection of Sabon Gari, Kaduna South and Soba local government areas. The second stage involved the random selection of two districts from each of the selected local government areas. The districts are Muchia and Hanwa in Sabon Gari local government area, Kurmin Mashi and Kakuri in Kaduna South local government area, Yakassai and Ra hama in Soba local government area. The third stage involved the random selection of 5% of the households in the selected districts to give a sample size of 310 pooled from Muchia(48), Hanwa(56), Kurmin Mashi(52), Kakuri(56), Yakassai(54) and Rahama(44). Method of data collection Primary data on household food consumption and expenditure patterns was used in this study. The primary data were elicited using well structured questionnaires from heads of household 125 who consulted with their household members on the households food budgetary planning and purchase. Analytical Technique This study employed descriptive and inferential statistics in the analysis of data. The descriptive statistics involved the use of mean, frequency counts and percentages and the inferential statistics involved the use of logit regression. Model Specification The logit regression model assumes that the probability of households consumption preference for imported rice brand( is expressed as: The probability of households consumption preference for locally produced rice brand( is expressed as: ranges between zero and one and it is non linearly related to . is the stimulus index which ranges from minus infinity to plus infinity and it is expressed as: To obtain the value of , the likelihood of observing the sample will be formed by introducing a dichotomous response variable. The explicit logit model is expressed as: Definition of Variables = dichotomous response variable (1 for households consumption preference for imported rice and for households consumption preference for locally produced rice) = Age of household head (years) = educational level of household head (number of years of schooling) = household size 126 household income(N/month) frequency of rice consumption food expenditure(N/month) non- food expenditure(N/month) price (dummy: 1 if household regards price as a factor for consumption preference between locally produced rice brand and imported rice brand and 0 otherwise) = taste(dummy: 1 if household regards taste as a factor for consumption preference between locally produced rice brand and imported rice brand and 0 otherwise) quality(dummy: 1 if household regards quality as a factor for consumption preference between locally produced rice brand and imported rice brand and 0 otherwise) = ease of preparation(dummy: 1 if household regards ease of preparation as a factor for consumption preference between locally produced rice brand and imported rice brand and 0 otherwise) = coefficients of stimulus variables = constant term = error term Results and Discussion Determination of households consumption preference for foreign and local rice brands From the result in Table 1, majority of the households in Sabon Gari(85%), Kaduna South(83%) and Soba(53%) local governments preferred consuming foreign rice to local rice types with Sabon Gari having the highest households who preferred consuming foreign rice compared to Kaduna South and Soba. From the pooled sample of households, a larger proportion(75%) preferred consuming foreign rice brands to local rice brands. However, there was considerable local rice consumption preference by households(25%) and this in line with (Adeyeye, 2012) who opined that though the market for imported and locally p roduced rice in Nigeria appears segmented, consumption of locally produced rice is as well on the increase as that of imported rice. 127 Table 1: Result of cons umer preference for foreign and local rice brands Rice Brand Frequency Percentage Sabon Gari Foreign Rice 85 82 Local Rice 19 18 Total 104 Kaduna South Foreign Rice 83 77 Local Rice 25 23 Total 108 Soba Foreign Rice 53 54 Local Rice 45 46 Total 98 Pooled Sample Foreign Rice Local Rice Total 232 75 78 25 310 100 Factors influencing households consumption preference for foreign and local rice brands The maximum likelihood estimates of the parameters of the logistic regression of the factors influencing consumer preference for foreign and local rice brands are presented in table 4.14. The log- likelihood statistic of -32.76064, which tests the joint significance of the independent variables included in the model, is significant at the 1% level. The overall percentage households rice consumption preference for foreign and local rice correctly predicted seems good at 83% in comparison to the 100% predictions of a perfect model. 128 Table 2: Logit regression estimates of factors influencing consume r preference for foreign and local rice brands Variable Coefficient Standard Error t-value Exp.(β) Intercept 5.1894 2.3426 2.2152 179.3609 Quality 1.2608† 0.3322 3.795 3.528 Age 0.0033 0.0289 0.1142 1.0033 Education -0.0535 0.0567 -0.9436 0.9471 Household size -0.3178††† 0.1745 -1.8212 0.7277 Household income 0.1655†† 0.0759 2.1805 1.1800 Rice consumption -0.0678††† 0.0373 -1.8177 0.9344 Food expenditure 0.1235 0.2765 0.4467 1.1315 Non-food expenditure -0.0109 0.1166 -0.0935 0.9892 Price -2.3862† 0.9104 -2.6210 0.0920 Taste -0.5092 0.6642 -0.7666 0.6010 Ease of preparation 1.1261††† 0.6534 1.7234 3.0836 log likelihood Correct predictions McFadden Pseudo R-squared -32.76064† 83% 55.2% NB: Single, double and triple daggers (†) indicate statistical significance at 1, 5, and 10% levels respectively Rice quality(cleanliness of grain, whiteness of grain, shape of grain and breakage of grain) was positively related to the households probability for foreign and local rice consumption preference and was significant at 5% probability level. The odd ratio of 3.5282 indicates that a unit increase in the households income will increase the probability of households rice consumption in favour of foreign rice preference by a magnitude of 3.5282. This finding is consistent with Bamidele et al.(2010) who noted that households preferred imported rice to the local rice, because the imported rice is of a higher quality and grade(it has a better taste, it is polished, not broken and is free of stones and other debris). Kassali et al.(2010) also noted that the main reason imported rice is bought is as a result of the good quality as presumed by consumers. Also, Bamba et al. 129 (2010) noted that consumers in large urban centres have a marked preference for high-quality imported rice. The significance of rice quality as a factor that favours foreign rice consumption implies that an improvement of the quality of local rice to attain the high quality desired by households would stimulate local rice consumption preference by households. This will stem down the loss of earnings in the importation of foreign rice to bride the demand-supply and create opportunities for employment. Increasing production of higher quality rice will reduce imports and strengthen food security (Bamba et al., 2010). Household size was found to be negative and significant at 10% probability level with an odd ratio of 0.7277 which implies that a unit increase in the size of the households would decrease the probability of households foreign rice consumption preference by a factor of 0.7277. Household income was positively related to the households probability for foreign and local rice consumption preference and was significant at 5% probability level. The odd ratio of 1.1800 indicates that a unit increase in the households income will increase t he probability of households rice consumption in favour of foreign rice preference by a magnitude of 1.1800. A plausible explanation for this is that as the income of households increases, their purchasing power also tend to increase. The households frequency of rice consumption was found to be negative and significant at 1% probability level with an odd ratio of 0.9344. Price of rice was negative and significant at 1% probability level with an odd ratio of 0.0920 which implies that that a unit increase in the price of rice will decrease the probability of households rice consumption in favour of foreign rice preference by a magnitude of 0.0920. This implies that as the prices of foreign rice increases, households tend to reduce their consumption of foreign rice by resorting to consumption of low priced local rice or other food items as substitute for foreign rice. This finding lends credence to that of Odusina (2008) who found out that the high price of imported rice is discouraging consumption of imported rice. Ease of rice preparation was found to be positive and significant at 10% probability level with an odd ratio of 3.0836. Conclusion Majority of the pooled sampled households(75%) preferred consuming foreign rice brands to local rice brands. The factors that significantly influenced the households consumption 130 preference for foreign and local rice included quality of rice(p<0.01), ease of preparation(p<0.1), price of rice(p<0.01), frequency of rice consumption(p<0.1) household size(p<0.1) and household income(p<0.05). Based on the high significance of rice quality in influencing the households consumption preference for foreign rice, it is recommended that that emphasis should be placed on enhancing quality of local rice to encourage shift in consumer preference from imported to locally produced rice. 131 References Adeyeye, V.A. (2012). Strategies for Enhancing Consumption of Locally Produced Rice in Nigeria. The Nigerian Institute of Social and Economic Research (NISER), Ibadan, Nigeria. Akpokodje, G., Lancon, F. and Erenstein, O.(2003). Nigeria’s Rice Policy and Development: A Review. Final Draft submitted to WARDA, Abidjan, Cote d’ Ivoire. Ayanwale, A.B. and Amusan, C.A.(2012). Gender Analysis of Rice Production Efficiency in Osun State: Implication for the Agricultural Transformation Agenda. Paper presented at the 13th National Conference of the Nigerian Association of Agricultural Economists, Obafemi Owolowo University, Ile – Ife, Nigeria, September 25th – 27th. Bamba, I., Diagne, A., Manful, J. and Ajayi, A. (2010). Historic Opportunities for Rice Growers in Nigeria. Grain de sel. No. 51, July – September 2010. Bamidele, F.S., Abayomi, O.O and Esther, O.A.(2010). Economic Analysis of Rice Consumption Patterns in Nigeria. Journal of Agricultural Science and Technology, 12: 1 – 11. Global Agricultural Information Network, (2012). Nigeria Grain and Feed Annual Report. GAIN Report Number: NI1204. Godwin, U. (2012). Rice farm, milling plant: Sure money spinner. Available at: http://nationalmirroronline.net/new/rice-farm- milling-plant-sure- money-spinner/. Accessed 15th January 2013. International Rice Research Institute, (2004). World Rice Statistics. International Rice Research Institute, Manilla, phillipines. Kassali, R., Kareem, R.O., Oluwasola, O. and Ohaegbulam, O.M.(2010). Analysis of Demand for Rice in Ile Ife, Osun State, Nigeria. Journal of Sustainable Development in Africa, 12(2): 63 – 72. Lançon, F., Erenstein O., Akande, S.O., Titilola, S.O., Akpokodje, G., and Ogundele, O.O. (2003). Imported Rice Retailing and Purchasing in Nigeria: A Survey. West Africa Rice Development Association (WARDA), Abidjan, Cote d’Ivoire. Maximizing Agricultural Revenue and Key Enterprises in Targeted Sites (MARKETS), (2009). Package of Practices For Rice Production. Available online at: http://www.nigeriamarkets.org/files/Rice_POP_English_June_2009%5B1%5D.pdf. Accessed 12th January 2013. 132 Odusina, O.A.(2008). Urban Rice Demand Analysis: A Case Study of Ijebu Ode Township. Middle-East Journal of Scientific Research, 3 (2): 62 – 66. Ojehomon, V.E.T., Adebayo, S.B., Ogundele, O.O., Okoruwa, V.O., Ajayi, O., Diagne, A. and Ogunlana, O. (2009). Rice Data Systems in Nigeria: National Rice Survey. United States Department of Agriculture Foreign Agricultural Services, (2012). United States Department of Agriculture Foreign Agricultural Services Database of Production, Supply and Distribution. Retrieved 15 th December 2011 from http://www.fas.usda.gov/psdonline/psdResult.aspx. 133 POTENTIAL OF INCREASING RICE PRODUCTION IN NIGERIA THROUGH SAWAH ECO-TECHNOLOGY Ade miluyi Y.S1 , Dada-Joel O.T1 , Olanrewaju, J.S2 , Onye mize U.C1 , Agboola O.A1 , Azogu, I.I1 and T. Wakatsuki3 . 1 National Centre for Agricultural Mechanization, (NCAM), P.M.B 1525, Ilorin, NIGERIA. Department of Agricultural Engineering, Faculty of Technology, Obafemi Awolowo University, Ile-Ife, NIGERIA 3 Department of Ecological Engineering, Faculty of Agriculture, Kinki University, Nara, JAPAN e-mail: [email protected], [email protected] [email protected] 2 Abstract The Nigerian food situation is especially vulnerable to the changing global trends, the country being a net importer of major food items. The market demand and prices of rice worldwide are likely going to remain high as other crops, e.g. maize and cassava, are diverted for bio- fuel production. These global changing trends therefore challenge Nigeria to quickly address this vulnerability by refocusing and retuning the entire agricultural system in the country. There is great potential for Nigeria to achieve large-scale production of paddy. Despite the potential for rice production and possible exportation, the potential has not been transformed into actual production. SAWAH Eco-technology refers to the mechanized production of rice in lowlands through an improved method of maximum utilization of naturally occurring water in these areas to obtain an improved yield/hectare compared to any other existing method of rice production in Nigeria. The paper analyses the potentials offered for growth and development in the rice production sector through the Sawah Eco-technology while looking at emerging opportunities in the sector and the challenges faced by Nigeria at increasing domestic rice production. 134 1.0 Introduction Nigeria has the potential to be self-sufficient in rice production, both for food and industrial raw material needs and export. However, this potential has not been met. Self-sufficiency in rice production has eluded Nigeria for a long time despite over 40 years of efforts by the Government of Nigeria towards its realization. Chains of economic activities in the Nigerian rice industry like transplanting, harvesting, parboiling, drying, milling/threshing etc are largely executed by women and children. Government of Nigeria has therefore not relented in her effort to develop the rice enterprise as this will put money and food into the hands of the very vulnerable segment of the Nigerian society. In order to increase food production and alleviate the widespread poverty in Sub-Sahara Africa (SSA), given the limited possibility for expansion of cultivable area and increase in population, there is need for a Green Revolution (GR) (Diao et al. 2008; Otsuka and Kijima 2010). GR enhances crop yield per unit of land by using high- yielding varieties, irrigation and agrochemicals such as fertilizers, pesticides and herbicides. The speed and scale with which it solved the food problem was remarkable and unprecedented, and it contributed to a substantial reduction in poverty and the launching of broader economic growth in many Asian countries. Improved cereal varieties, fertilizers, irrigation, and modern pest control methods lay at the heart of the GR (Otsuka and Kijima 2010). Wakatsuki (2008) noted that to realize green revolution in Sub-Saharan Africa, it is essential to improve rice- growing environment by promoting lowland sawah system. This is because the sawah system utilizes the inland valleys which are reported to be high in fertility and through appropriate water management; fertility can be sustained and enhanced for rice production The important features that have been driving the promotion of rice production and dissemination in Africa according to Azuma (2004), include the fact that rice, which is the most productive grain in a unit of arable land in Africa, can be grown three times a year in most of African countries and is easy to be allocated in crop rotation properly. Rice is environmentally friendly crop and its production is sustainable. Rice is nutritionally rich with gluten and protein, and can contribute to improve malnutrition in Africa. 135 Wakatsuki and Masunaga (2005) reported that the potential of Sawah based rice farming is enormous in West Africa to stimulate the long awaited green revolution. This is predicated on the fact that the agro-ecological conditions of the core region of West Africa are quite similar to those of north-eastern Thailand, where there is one of the rice centres in the country. Ten to twenty million ha of sawah can produce additional food for more than 300 million people in future. The sawah based rice farming can overcome soil fertility problems through the enhancement of the geological fertilization process, conserving water resources, and the high performance multi- functionality of the sawah type wetlands. The term sawah refers to leveled and bunded rice fields with inlet and outlet connecting irrigation and drainage. Sawah Eco-technology refers to the mechanized production of rice in lowlands through an improved method of maximum utilization of naturally occurring water in these areas to obtain an improved yield/hectare compared to any other existing method of rice production in Nigeria. 2.0 Prospects for Increased Rice Production in Nigeria Great opportunities exist to increase rice production and strengthen both household and national food security in Nigeria. First, government is trying to increase local rice production to reduce rice imports. Simultaneously, the donor community has doubled its aid to SSA for reducing poverty and improving food security and nutrition. In such an environment, the vastly underexploited rice sector offers a tremendous opportunity to substantially increase local food production and improve food security and farmers’ income and livelihood. The prospects for rice farming in Nigeria are very high. These prospects include: Ecology: The potential area for rice production in Nigeria is between 4.6 and 4.9 million ha. This area includes five different rice ecologies, (Imolehin, 1991). The inland valley accounts for an estimated 25% of Nigeria’s rice area with yield potential ranging from 2 to 8 tonnes/ha and contributing between 43 and 45 per cent of national rice production while the irrigated rice ecology is the most recently developed rice environment accounting for about 18% of cultivated rice land and contributing 10-12 per cent of the national rice supply, (Singh et al, 1997). These ecologies can be fully developed to meet the national rice demand. 136 Government Policy: The recent ban on importation of rice as a policy of the Agricultural Transformation Agenda is a good step towards achieving increased domestic production of rice and putting more money in the farmers’ pockets. Research and Extension: Appropriate use of improved and ecology-specific seed variety developed by various research centres and extended by network of extension services will go a long way at increasing domestic rice production. Irrigation and eco-technological concepts (Sawah) developed by Japan and being disseminated in Nigeria by the National Centre for Agricultural Mechanization (NCAM) if properly supported by all stakeholders will in no time turn Nigeria into a rice-exporting country. 137 3.0 Sawah Eco-technology and Inland Valley Utilization for Sustainable Rice Production The concept and term sawah refers to manmade improved rice growing environment with demarcated, bunded, puddled and leveled rice field with water inlets and outlets using power tiller for weed and water control in the inland valley which can be springs or pumps (Wakatsuki et al., 2005). The Sawah system of rice production which ensures proper management of the rice environment leading to efficient and higher rice grains production with higher returns is a better option to current systems. It is one of the most efficient systems that will ensure adequate production to meet the ever increasing demand and save the country from the use of scarce foreign exchange resources for its importation (Buri et al., 2007). The project is embarking on the process of mass adoption for the whole country with its attendant challenges of procurement of power tillers used in land preparation. Three key learning: (1) Sawah system enhances soil and water management which is important for sustainable rice production; (2) The Sawah package increases rice yield significantly; (3) The dissemination of the Sawah technology through a participatory learning approach enhances rapid adoption among rice farmer. 138 The yield of rice in inland valleys is generally much higher than on the uplands (IITA, 1980; 1988). There is enough residual soil moisture or shallow groundwater table for crops other than rice in dry season (Raunet, 1984). The average yields of the world’s rice- growing areas are 4.9, 2.3, 1.5 and 1.2 t/ha for irrigated, rainfed lowland, flood prone and upland respectively while the average yield of West Africa’s rice-growing area are 5.0, 2.1, 1.3 and 1.0 for irrigated, rainfed lowland, flood prone and upland respectively (Anon, 1993). The cost of irrigation equipment is, however, prohibiting for resource-poor farmers to acquire for rice production in Nigeria. Therefore, the rainfed lowland rice in the available inland valley that gives relatively higher yield of rice as compared to the upland can be taken advantage of, at no extra cost. Out of the total land area of 1,642,000 ha devoted rice cultivation in Nigeria, 1, 5, 16, 30 and 48% is grown to mangrove swamp, deep water rice, irrigated lowland, rainfed upland and rainfed lowland respectively. In West Africa, however, of the total land area of 4,011,000 ha devoted to cultivation of rice, 4, 9, 12, 44 and 31% is planted to mangrove swamp, deep water, irrigated lowland, rainfed upland and rainfed lowland respectively (Lançon and Erenstein, 2002). Therefore, to increase the production of rice, vegetable and other upland crops, intensified use of the inland valleys is inevitable. 4.0 Meeting the Challenges of Sustainable Rice Cultivation by Sawah Eco-technology Nigeria has the potential to be self-sufficient in rice production, both for food and industrial raw material needs and export. However, a number of constraints have been identified as limiting to rice production efforts by farmers. These include problems with research, soil fertility management, pests and disease management, unavailability of simple and cheap farm implements and machineries, irrigation facilities and extension services. Addressing at least most of these problems is a good first step towards attaining the target of rice self-sufficiency. The production of locally preferred rice at a competitive price is the biggest challenge to Nigerian farmers. The second challenge lies in identifying, branding, and promoting high quality locally adapted rice varieties and eco-technology in national, regional, and international markets. Although 139 increasing crop yields is very important, a major problem faced by all SSA rice producers is to reduce postharvest losses, which presently account for 15–50% of the market value of production. We believe that to address these challenges, it is critical to improve the weak rice R&D capacity in Nigeria. Even these limited human and financial resources tend to be spent on irrigated rice schemes. The third challenge, the most critical one, is the absence of a coherent and comprehensive policy, plan, and program to tackle the many constraints and deficiencies of the national rice sector in African countries. It must be emphasized here that the development of high‐yielding rice varieties and profitable production technologies (such as sawah) is a prerequisite to trigger changes in supporting policies, such as investments in irrigation, initiation of credit programs, revamping of national rice R&D systems, and deve lopment of rural infrastructure and market systems for local rice. Active extension services are keys in passing developed technologies on to rice farmers who are the end users. In these regard, new agricultural technologies, such as the sawah eco-technology developed by Japan along with other management practices should be disseminated effectively and rapidly by extension systems so that they can be adopted by farmers. The use of improved technologies remains a major strategy for increasing agricultural productivity and promotes food and livelihood security. Innovations may include scientific and technical knowledge, ideas, services, systems, inventions, and products. 140 5.0 Conclusion In achieving modest strides in rice production, research and extension in Nigeria, excellent collaboration work has to be done by both national and international organizations. Cooperative collaborative work with these institutes will be the bedrock for improved technologies developed for the attainment of increased rice production in Nigeria. Sustenance of this trend will ensure the country’s success in its bid to meet the rice production demands in this dispensation. Increased collaboration between Researchers- Extension Workers-Farmers will also enhance: Problems Identification, Technology, Institutions, and disseminations needs, Participatory programs formulation, Assessment and dissemination planning, Assessment and dissemination 141 execution, Evaluation on technology, institution, and dissemination methods performance, Upscaling. 142 References Anon (1993). Rice Almanac. International Rice Research Institute, Los Banos. Laguna. Philippines; 142pp. Azuma, H. (2004). Promotion of rice production and dissemination in Africa. Proceedings of JICA Seminar on Promotion of Rice Productio n and Dissemination in Africa February, 2004 AICAD, Nairobi, Kenya, Agricultural Development Cooperation Department, Japan International Cooperation Agency, pp. 35-66. Buri, M.M.; Issaka, R.N. and Wakatsuki, T. (2007): The sawah technology of rice production for lowlands: An effective tool for poverty alleviation in Southern Ghana. Paper presented at the 4th International conference of the Africa soil science society organized at the Ghana Institute of Management and Public Administration (GIMPA), Accra, Ghana from 7th-13th January, 2007. Diao X, Headey D, Johnson M (2008). Towards a Green Revolution in Africa: What would it achieve, and what would it require? Agricultural Economics, 39: 539–550. Imolehin, E.D. (1991). Rice improvement and production in Nigeria. Paper presented at WARDA Upland Breeding Task-Force Workshop, Bouake, Cote d’Ivoire, 4 Oct. 1991. Inte rnational Institute of Tropical Agriculture (IITA). (1980). Consolidated report of UNDP/FAO/IITA Sierra Leone rice project. International Institute of Tropical Agriculture, Ibadan, Nigeria. pp 18-20 IITA, (1988). International Institute of Tropical Agriculture’s strategy plan 1989-2000. IITA, Ibadan, Nigeria. pp 85-86 Lançon, F and Erenstein, O. (2002). Potential and prospects for rice production in West Africa. Paper presented at the Sub-Regional Workshop on harmonization policies and Co-ordination programmes on rice in ECOWAS Sub-Region Accra, Ghana 25-28 February, 2002 Otsuka K, Kijima Y (2010). Technology policies for a green revolution and agricultural transformation in Africa. Journal of African Economies, 19(suppl 2): 60-76. Raunet, M. (1984). Les potentialiles agicoles des bas-fonds en region inter tropicales: l’ example de la cultire du ble de contre-saison a Madagasca. Agronomic Tropicale. 39:121-135. Singh, B.N., Fagade, S., Ukwungwu, M.N., William, C., Jagtap, S.S., Oladime ji, O., Effisue, A and Okhidievbie, O. (1997). Rice growing environments and biophysical constraints in different agroecological zones of Nigeria. Met. J., 2(1): 35-44 Wakatsuki T (2008). Materialization of African rice green revolution by sawah eco-technology (in Japanese). In: M Matsuzono , H Nawata , S Ishida (Eds.): Human Development of Africa: Practice and Cultural Anthropology. Tokyo: Akashi Shoten, pp. 1-27. 143 Wakatsuki, T. and Masunaga, T. (2005). Ecological engineering for sustainable food production and the restoration of degraded watersheds in tropics of low pH soils: Focus on West Africa. Soil Sci. Plant Nutr. 51(5):629-636. Wakatsuki, T.; Buri M.M.and Fashola, O.O. (2005) Ecological engineering for sustainable rice production and the restoration of degraded watersheds in West Africa. In: Proceedings of rice research conference, IRRI, pp 336–366 144 UTILIZATION OF AGROCHEMICALS BY RICE FARMERS IN GWAGWALADA AREA COUNCIL, ABUJA Idu R.I., Sule A. U. & Agbonika D. Department of Agricultural Economics & Extension, University of Abuja, Abuja Abstract The study sought to examine the utilization of Agrochemicals by rice fa rmers in Gwagwalada area Council, Abuja. Interview schedule was used to collect the data. Purposeful and random sampling was adopted to select four (4) communities out of ten (10) communities in Gwagwalada Area Council. Forty (40) respondents were randomly selected from each of these four communities. The total sample size would be 160 respondents. Simple percentages were used to analyze the data. The result of the analysis show that fertilizer and herbicide more frequently used by farmers. Government should continue to subsidize fertilizer to the farmers to increase rice production in the area. Introduction Rice is one of the staple crop in Nigeria and the fourth major cereal after maize, sorghum and millet (Babafada, 2003). It is grown virtually in all the agro-ecologies of Nigeria with over 4.0 million hectares of land suitable for rice cultivation, but only about 2.0 million hectares is currently cultivated (Abubakar, 2003). It’s production in the country rose from 2.4 million metric tonnes in 1994 to 3.9 million metric tonnes in 2005 (CBN 2006). In spite of the increase in production of about 1.8 percent, the demand for rice surpasses supply (Adeoye 2003; Ojehomon et al., 2004) consequently. The country has been importing to bridge the supply demand gap considering its vast agricultural land and suitable for ecology. Nigeria is endowed to produce enough rice to satisfy domestic demand and has the potential to export to other countries (Babafada, 2003). However domestic rice production has not increased sufficiently to meet the increase demand despite the various policy measure put in place to facilitate production. Thus, the inability of the 145 Nigeria rice sector to match the domestic demand have rise a number of important question both in policy circle and among researcher (Okuruwa et. al., 2009). Given the important of agrochemical in enhancing productivity, the Nigeria government over the year has embarked on several policies to encourage the use of agrochemical by local farmers. Agrochemicals are used during rice cultivation include insecticide, herbicide and fungicides. After harvesting and during storage, most cereals are doused again with several chemicals to protect them from pest and diseases. Farmers are becoming increasingly aware about agrochemicals use. Agrochemicals such as herbicides, insecticide, fungicide, and fertilizer reduce crop losses both before and after harvest, and increase crop yields. However, literatures have not shown considerable how farmers in the study area are using agrichemicals to inc rease rice production. In this study attention is given to measuring the specific input use such as fertilizer, pesticides, herbicides and rodenticides, which constitute a major part of rice production in the study area. Therefore this study seeks to answer the following questions: Are rice farmers aware of the use of fertilizer, pesticide, insecticides, herbicide on their farm yield? Are farmers adopting agrochemicals in their rice production? What are the benefits in the use of agrochemicals? The broad objective of the study is to evaluate the use of agrochemicals in rice production in Gwagwalada area council of the FCT Abuja. The specific object s are to: 1. examine the socio-economic characteristics of framers in the study area; 2. Identify the commonly used agrochemicals in rice production in the area; and 3. asses the utilization of agrochemicals by the rice farmers Methodology The study was conduct in Gwagwalada Area Council of the Federal Capital Territory (FCT), Abuja. Gwagwalada is located at Latitudes 856’59” North of the Equator and Longitudes 75’59 East of the prime meridian on the map of the world. It shares boundaries with Kwali, Kuje and Municipal area councils. The high humidity in the area gives a heat trap effect which makes Gwagwalada uncomfortably hot. It has an area of 1,043km2 and a population of 157,177 people (NPC, 2006). Gwagwalada is characterized by two main seasons: rainy (April to November) and dry (December to March ) seasons, with a temperature of 30-37 0 c, which will drop to about 27o c 146 during raining season with annual rainfall ranging from 1,100mm to 1.600mm, which permit agricultural activities such as cultivation of rice and other arable crops. Purposefully and random sampling was used in this study. Farming community that are involved in rice production within the Gwagwalada Area Council were purposefully selected. These communities includes, Kutunku, Quarters, Central, Gwako, Ikwa, Dagiri, Zuba, Tunganmaje, Dobi and Paiko-Kore. Four communities out of these ten were selected, these include PaikoKore, Tunganmage, Dagiri, and Kutunku. Forty respondents were randomly selected from each of these four communities. The total sample size was 160 respondents. Data were collected through the use of interview schedule on farm size, labour, seeds, fertilizer, pesticides, herbicides, insecticides, farming experience, educational level, and output of paddy rice. Simple percentages were used for the analysis. Result and Discussion Socio-Economic characteristics of the farme rs The result in Table 1 reveals that most (31.8%) of respondents in the study area were adult male farmers. Only very few of the farmers in the study area were young. Majority (80%) of the respondents were married; only few (20%) were single. The reason of this is not farfetc hed as family labour is a predominant source of labour in Nigeria Agriculture and other developing countries of the world. Majority (40.7%) of the respondents acquired only had secondary education and 21.5% had primary education. Education is quite important in community for social learning. This is in line with Armstrong et al. (1976). Most farmers had farming experience between 1-5 years, followed by those with 20 years above. Just few of them had farmings of 5 – 20 years. Agwu (2004) noted that long period of farming experience could increase farmers level of acceptance of new ideas as a means of overcoming their production. Majority (51.8%) of labour used in the study area were Family and Hired; while some of the respondents depended solely on family labour (17.8%) and community labour (15.6%). 147 Types of Agrochemical used by the farme rs The data in Table 2 reveals the different type of insecticides used to control insect pest in the rice production. About 12.0% of the respondent used Karate as insecticide to control insect; while 10.4% used DDVP; 9.6% and 5.2% of the respondents used Cyperforce and Sarosate respectively. However, majority (63.0%) of the respondents do not used insecticide. Also, Table 3 shows that herbicide was another type of chemica l used. It is used to control weed (unwanted plant). Several types of herbicide were used such as Orizo plus, Gramazole, Glorpara, Daracot, Actrozine, Cyrosate and Springohl. Majority (28.9%) of the farmer used Gramazole type of herbicide to control weed, 20.7% used Orizo plus, 15.6% used Daracot, 3.0% used Actrozine, 2.2% used Gloropara and 0.7% of the respondent used either Cyrosate or Springohl. On the other hand 28.1% of the respondents do not use any herbicide. Data in Table 4 shows that Inorganic fertilizer was another type of chemical used to enhance growth in rice production. About 76% of the respondents used chemical fertilizer (inorganic fertilizer) to boost growth, while 10.4% used organic fertilizer. Data in Table 5 shows the two (2) types of pesticide used by farmers in the study area: Symbol and Delthrin. About 22% of the respondents used Symbol to control pest; while 14.1% used Delthrin to control pest. On the other hand, 63.7% do not use any pesticide. 148 Table 1: Distribution of Farme rs According to Their Socio-Economic Characteristics Variable Age 1-20 21-30 31-40 41-50 >51 Fre quency Pe rcentage 10 37 36 43 9 7.4 27.4 26.7 31.8 6.7 Sex Male Female 112 23 83 17 Marital Status Married Single 108 27 80 20 Education Tertiary Secondary Primary Non formal 24 55 29 27 17.8 40.7 21.5 20 45 25 15 19 31 33.3 18,5 11.1 14.1 23 20 24 21 70 14.8 17.8 15.6 51.8 Farm Experience (years) 1-5 6-10 11-15 16-20 >20 Type of Labour Hired Family Community Hired/Family 149 Table 2: Type of Insecticides Used by Farme rs Types of Insecticide used Frequency DDVP 14 Cyperforce 13 Karate 16 Sarosate 7 Not used 85 Percentage 10.4 9.6 11.9 5.2 63.0 Table 3: Types of Herbicides Used by Farme rs Types of Herbicide used Frequency Percentage Orizo plus 28 20.7 Gramazole 39 28.9 Gloropara 3 2.2 Daracot 21 15.6 Actrozine 4 3.0 Cyrosate 1 0.7 Springohl 1 0.7 Not used 38 28.1 Table 4: Type of Fertilizer Used by Farme rs Types of fertilize r used Frequency Percentage Organic 14 10.4 Chemical 103 76.3 Not used 18 13.3 150 Table 5: Type of Pesticides Used by Farmers Types of pesticide used Frequency Percentage Symbol 30 22.2 Delthrin 19 14.1 Not used 86 63.7 4.3 Awareness and Adoption of Agrochemical by farme rs in the study area Table 6 shows the awareness of agrochemicals by farmers. Majority (98.5%) of the respondents are aware of the used of agrochemicals in rice production and 74.1% of the respondents adopt the use of agrochemicals in rice production, while 25.9% do not adopt the use of agrochemicals. Majority of the respondents were male farmers as revealed in Table 1. Okpukpa (2006) noted that male have more asset than female farmers in the rural areas and it has a strong correlation with adoption of technologies. Table 6: Awareness and Adoption Agrochemical by farmers Variable Frequency Percentage Aware of Agrochemicals 133 98.5 Not aware of Agrocemicals 2 1.5 Adopter of Agrochemicals 100 74.1 Non-adopters of Agrochemicals 35 25.9 Conclusion The study shows that majority of the farmers used herbicide as one of the chemical for weed control. Other chemicals used were pesticide and chemical inorganic fertilizer. Most farmers were aware of the used of Agrochemical and 74.1% of the farmer adopted the use of Agrochemical in rice production. However, most rice farmers do not know more about the use of other agrochemical especially insecticide and pesticide. Therefore there is need for agricultural agents to educate the farmer on the use of insecticide and pesticide to increase rice production. 151 References Abubakar K. (2003). Comparative studies of Agronomic Practices for upland andwetland Rice. B. Agric C. Project Unpublished. Department of Agro nomy, Ahmadu Bello University, Zaria. Adeoye, G.O (2003). Rice Revolution in practice, lessons from other countries. Paper presented at a seminer on subterinable rice production in Nigeria organized by Central Bank of Nigeria held at Hamdala Hotel, Kaduna State January 14-15;2-11. Agwu, A.F. (2004). Factors influence Aoption of improved Rice production Technology in Nigeria. Journal of International Agricultural and Extension Education 11 (1): 81-88. Armstrong. F. (1976). On a frame work for utilizing the community for social learning in Grade 4-6 social Education; Journal of National curriculum for economics Babafada M. (2003). Integrated Rice production and export in Nigeria. Paper presented at seminar on sustainable Rice production in Nigeria. Organized by Central Bank of Nigeria held at Hamdala Hotel, Kaduna state Nigeria. January 14-15: 1-4. CBN (2006): Annual report and statement of account, Central Bank of Nigeria (CBN) publication. Abuja, Nigeria. Ojehomon V.E.T, Momoh S., Ogunremi L.T., Tiamiya S.A., Wayas J.W., & O.O. Ogundele (2004). Rice Policy Economic Issues the Nigeria Rice Memorabilia copy Right project Synergy 76-90. Okoruwa V.O., Akindeinde A.O., & K.K. Salimonu (2009). Relative economic efficiency of farm in rice production. A profit function approach in North Central Nigeria. Technical and subtropic Agro-ecosystem 10:279-286. 152 GROWTH TREND OF RICE DEMAND AND SUPPLY IN NIGERIA: AN INVESTMENT OPPORTUNITY FOR YOUTH AND WOMEN EMPOWERMENT † OYINBO O, † G.Z. REKWOT, † G.A. ADEGBOYE AND ‡D. AGBONIKA † Department of Agricultural Economics and Rural Sociology, Ahmadu Bello University, Zaria, Nigeria. ‡ Department of Agricultural Economics and Extension, University of Abuja, Abuja, Nigeria. Email: [email protected] Abstract This study was carried out to determine the instantaneous and compound growth rates of rice demand and supply in Nigeria over the period of 1970 to 2011 and its implication for empowering youths and women. Time series data on the aggregate rice demand and supply obtained from the database of United State Department for Agriculture(USDA) foreign agricultural service were utilized in this study. A growth rate model was employed to analyse the time series data and the result of the analysis showed that the instantaneous and compound growth rates(7.5% and 7.8%) of rice demand were higher than that of rice supply(6.5% and 6.7%) and this indicates that the incidence of demand-supply gap for rice in Nigeria has been an existing trend over the years and the trend would continue if appropriate measures are not taken despite the country’s huge potential for rice production to attain self-sufficiency. The implication of this finding is that the untapped potential of Nigeria for rice production should be exploited for the empowerment of youths in the area of rice production and women in the area of rice processing. This is necessary to reduce the incidence of social vices resulting from the increasing rate of unemployment, offer a sustainable means of livelihood for resource poor women and ultimately for both youths and women to contribute meaningfully in bridging the demand-supply gap for rice in Nigeria. 153 Introduction Rice is a leading staple crop in Nigeria that is cultivated and consumed in all parts of the country (Ayanwale et al., 2011). During the 1960s, Nigeria had the lowest per capita annual consumption of rice in the sub-region at an annual average of 3kg. Since then, Nigerian per capita consumption levels have grown significantly at 7.3% per annum. Consequently, per capita consumption during the 1980s averaged 18kg and then 22kg in 1995–2000 (Ogundele and Okoruwa, 2006). In Nigeria, rice has assumed a strategic position in the food basket of rural and urban households and is cultivated in virtually all of Nigeria’s agro-ecological zones, from the mangrove and swampy ecologies of the River Niger delta in the coastal a reas to the dry zones of the Sahel in the north. The demand for rice in Nigeria has been increasing at a much faster rate than in any other African country since the mid-1970s (Daramola 2005). Although the paddy harvest rose from under 1 million tonnes in the 1970s to 4.2 million tonnes in 2010, production has not kept pace with demand. There is considerable potential for extending and intensifying rice production in the five rice-growing ecosystems found in Nigeria (plateau, rainfed plains, irrigated plains, lowlands and mangrove), Bamba et al. (2010). The land area that could be cultivated is roughly 79 million hectares. Less than 10% of the 3.4 million hectares that could be irrigated are currently irrigated. Self-sufficiency in rice production has eluded Nigeria for a long time despite over 36 years of efforts by the Government of Nigeria towards its realization (Umeh and Atarboh, 2007). The importation of rice to bridge the demand-supply gap is worth N365 billion (Ayanwale and Amusan, 2012) and this implies a loss of considerable foreign exchange for the country. Several researches on the rice sub-sector of Nigeria have been undertaken over the years but not much have been done on the growth trend of rice with particular emphasis on the instantaneous(yearly) growth rate and compound(aggregate of several years) growth rate of the demand as well as supply of rice in Nigeria. Therefore, this study was designed to provide empirical information on the instantaneous and compound growth rates of rice demand and supply over the period of 1970 to 2011 and draw up relevant inferences. 154 Methodology Data description This study employed time series data on the demand of rice given by rice consumption in metric tonnes and supply of rice given by milled rice production in metric tonnes in Nigeria spanning over the period of 1970 to 2011. The data were elicited from the database of United State Department for Agriculture(USDA) foreign agricultural service. Model Specification A growth rate model adopted from (Gujarati and porter, 2009) and as used by Khalid and Burhan(2006) and Oyinbo and Emmannuel(2012) was utilized for the estimation of growth trend in rice demand supply in Nigeria over the period of 1970 to 2011. The compound interest formula was adopted for develop ing the model and is expressed as: Where: = Rice demand and supply (metric tonnes) = Initial value of rice demand and supply (metric tonnes) = Compound rate of growth of rice demand and output over time = Time trend (1970 to 2011) Taking the natural logarithm of equation (1), equation (2) was derived as: Where: Equation (2) is rewritten as: Adding disturbance term to equation (3), the explicit form of the model employed was derived as: Where: 155 = Rice demand and supply (metric tonnes) = Time trend (1970 to 2011) = constant term = Coefficient of time variable = Random term After the estimation of equation (1), the compound rate of growth was computed as follows: Where: r = compound rate of growth = estimated coefficient from equation (1) The explicit form of the growth rate model as shown in eq. (4) was estimated using SHAZAM statistical software. Results and Discussion The result obtained from the estimation of the growth model for rice demand and supply is presented in table 1. The result shows that time trend variable was significant in influencing demand and supply of rice at 1% probability level and the relationship was positive in the rice demand and supply growth models. In the estimated growth rate models, the slope coefficients of 0.075 and 0.065 for rice demand and supply respectively measures relative change in quantity demanded and supplied for a given change in the value of time trend. By multiplying the relative change in quantity of rice demanded and supplied respectively by hundred, we obtained the percentage change or the growth rate in quantity of rice demanded and supplied for an absolute change in time. 156 Table 1: Estimated growth model of rice demand and supply in Nige ria Variable Coefficient S.E t - value -51.374 2.729 -18.83 0.075 0.004 21.17 -44.919 2.900 -15.49 0.065 0.003 25.30 Rice demand Constant ( Time ( ) ) R square 0.95 Rice supply Constant ( Time ( ) ) R square 0.92 NB: *** P < 0.01 Rice demand Growth rate = relative change Growth rate = Growth rate = Rice supply Growth rate = relative change Growth rate = Growth rate = 6.5 The growth rates of 7.5% and 6.5% for rice demand and supply respectively implies that over the period of 1970 to 2011, the demand and supply of rice in Nigeria increased at the rate of 7.5% and 6.5% per annum. However the growth rate worked out are an instantaneous (at a point in time) rate of growth and not the compound (over period of time) rate of growth. Compound growth rates (r) were estimated from the instantaneous rates of growth, in that 7.5% and 6.5% are instantaneous growth rates: 157 r= Rice demand r= Compound rate of growth(r) = 7.8 % Rice supply r= Compound rate of growth(r) = 6.7 % Therefore, the growth trend of rice demand and supply in Nigeria per annum within the period under study(instantaneous rates of growth) are 7.5 % and 6.5% respectively and the rate of growth of rice demand and supply in Nigeria over the entire period under stud y(compound rates of growth) are 7.8 % and 6.7 % respectively. It was observed that the instantaneous and compounded growth rates of rice demand in Nigeria over the study period were higher than that of rice supply. This finding is in line with Ojoehemon et al. (2009), who noted that both rice production and consumption have vastly increased with rice demand outstripping rice production. The 7.5 % per annum growth rate estimated in this study is closely related to the 7% per annum used to make a projection of rice demand of 35 million tonnes in 2050(Ayanwale and Amusan, 2012). The result of this study indicates that the rice demand-supply gap scenario have been an existing trend that would continue if appropriate measures are not taken. Opportunity for youth and wome n empowe rment The higher instantaneous and compounded growth rates of rice demand over rice supply imply that there would be continuous importation of rice to bride the demand-supply gap and this is detrimental to the Nigerian economy. As noted by Bamba et al., (2010), the cost of rice imports represents a significant amount of lost earnings for the country in terms of jobs and income. Therefore, the on-going trend offers an opportunity for youths to be empowered to undertake rice production and for women to be empowered by getting involved in rice processing. This is necessary to reduce the incidence of social vices resulting from the increasing rate of unemployment and offer a sustainable means of livelihood for resource poor women and achieve self-sufficiency in rice production. This calls for capacity building of youths on rice production and women on rice processing. As reported by Gingiyu (2012), about 400 women drawn from 9 158 states of the North-west have been trained by the federal ministry o f agriculture and rural development on modern rice processing techniques during a three-day workshop for women in agriculture. This is a laudable effort that needs to be consolidated and spread to other geopolitical zones of the nation. Conclusion Using time series data on rice demand and supply over the period of 1970 to 2011, this study have been able to establish the instantaneous and compound growth rates of 7.5 percent and 7.8 percent respectively for rice demand and 6.5 percent and 6.7 percent for rice supply using growth models. The results indicated that the demand-supply gap for rice has been an existing trend irrespective of the country’s potential for rice production. The growth trend of the demand and supply for rice offers a viable option for empowering youths in the area of rice production and women in the area of rice processing. This will stem down the incidence of social vices resulting from high rate of unemployment, offer a sustainable means of livelihood for resource poor women and foster attainment of self-sufficiency in rice production. 159 References Ayanwale, A.O.S., Akinyosoye, V.O., Yusuf, S.A. and Oni, A.O.(2011). Rice Supply Response in Nigeria; whither changing Policies and Climate. World Rural Observations, 3(4): 78 – 84. Ayanwale, A.B. and Amusan, C.A.(2012). Gender Analysis of Rice Production Efficiency in Osun State: Implication for the Agricultural Transformation Agenda. Paper presented at the 13th National Conference of the Nigerian Association of Agricultural Economists, Obafemi Owolowo University, Ile – Ife, Nigeria, September 25th – 27th. Bamba, I., A. Diagne, Manful, J.and Ajayi, A.( 2010). Historic Opportunities for Rice Growers in Nigeria. Grain de sel. No. 51, July – September 2010. Daramola, B. (2005). Government Policies and Competitiveness of Nigerian Rice Economy, Paper presented at the `Workshop on Rice Policy and Food Security in Sub-Saharan Africa’ organized by WARDA, Cotonou, Republic of Benin. Gingiyu, I.M.(2012). Nigeria: FG Trains Women on Modern Rice Processing Techniques. Available at: http://allafrica.com/stories/201212121037.html. Accessed 12th January 2013. Gujarati, D.N. and Porter, C. D. (2009). Basic Econometrics (5th Edition). McGraw-Hill, New York. Khalid, M. and Burhan, A. (2006). An econometric model for forecasting export of Kinnow from Pakistan. International Journal of Agriculture and Biology, 8(2): 459 – 462. Ogundele O. and Okoruwa V. (2006), Technical Efficiency Differentials in Rice Production Technologies in Nigeria, African Economic Research Consortium. Ojehomon, V.E.T., Adebayo, S.B., Ogundele, O.O., Okoruwa, V.O., Ajayi, O., Diagne, A. and Ogunlana, O. (2009). Rice Data Systems in Nigeria: National Rice Survey. Oyinbo, O. and Emmaduel, Y.D. (2012). Empirical Assessment of Growth Rate of Maize in the Pre – SAP, SAP and Post – SAP Periods in Nigeria, Russian Journal of Agricultural and Socioeconomic Sciences, 5(5): 23 – 27. Umeh, J.C. and Atarboh, E.M. (2007). Efficiency of Rice Farmers in Nigeria: Potentials For Food Security and Poverty Alleviation. 16th International Farm Management Congress, UCC, Cork, Ireland. 15th – 20th July 2007. pp: 613 – 625. United States Department for Agriculture Foreign Agricultural Services(USDA FAS), (2011). Database of production, supply and distribution. Available at: http://www.fas.usda.gov/psdonline/psdQuery.aspx > Accessed 15th December 2011. 160 THE POSITION OF SAWAH RICE TECHNOLOGY IN MEETING THE RICE PRODUCTION NEED OF AFRICA Joshua A., S.Y Ademuluyi & Engr N. Agboola National Centre for Agricultural Mechanization, (NCAM), P.M.B 1525, Ilorin, Nigeria. Prof Toshiyuki Wakatsuki Faculty of Agriculture, Kinki University, Japan Abstract No doubt Africa has a high potential for growing rice because of the suitable available inland valley lowland that have accrued for growing this very important tropical crop. On this criteria, Africa’s policy makers relied by making their intention known in pronouncing their interest to double rice production by 2015–2017. This decision to enhance achievement in rice production transformation is commendable and welcome idea, as it aims to make this commodity reach a capacity production target of 28 million tones by the stipulated period. Nevertheless while we have fine tuned policies, made land stride progress in producing hybrid yield varieties coupled with others like improved chemical fertilizers, loans and other sources of funds to boost rise in production, yet if the most important practice to prevent soil movement and regulate water management is neglected, the dream may be an illusion, as far as rice green revolution is concerned. It is therefore paramount that sustainable agricultural productivity can be real only through application of both varietal improvements by biotechnology and also improvement of the rice ecological environment through eco-technology. Looking at this missing link is reason why SSA has not been able to have its realization of green revolution since 1960. Hopefully the SAWAH ecotechnology can be seen as key to rice farmers success in Africa. Since this position of adequate land preparation has long be left unpracticed, there is need to inculcate the SAWAH rice farming technology to enhance the rice yield intensification programme that is presently on motion in Africa .SAWAH thus can bring about reality in sub Sahara Africa’s rice programme. Introduction Africa with a birth rate known to be of course the highest compared to other continents of the world is posing a great alarm that needed us to have a plan action. From the on going information it is sure that Africa is becoming a fast growing region in the world as far as human 161 population emergence is concerned. Despite this speedy Endeavour, it faces crisis of food shortage hence bringing food insecurity. And unless some urgent steps are taking on time, there may be catastrophy as far as dietary need requirement matters are concerned. Presently, the continent has a population of 500 million people. It is also good to know and note also that projections have been made and that the population may reach a height of two Billion by year 2050, as the rate of increase is put at 5% per year. As we look through the information by WARDA in their 2007 report we find that the figures on yield under scores the consumption rate. In 2006 the yield was 14.2 million tonnes. Of course there was an increase by 3.23% per annum from 1961 – 2005. The increase in yield was as a result of land extensification and not based on land intensification. This is not encouraging more so that yields on hectarages are from 1.5T/ha – 2.4T/ha. On consumption it is a fact that rice intake per capital has jumped from 2.9kg to 24.1kg and has escalated to 45kg. On the whole, as we view the demand and the supply margins, we see that the consumption still is greater than the production. This direct indication can be seen in Africa’s importation to meet its 39% - 42% feed needs from the international market. Africa indeed is endowed with about 20 million Ha of lowla nd that can adequately be put into management for rice. The SSA apart from having this chunks of land suitable for rice cropping is also blessed with moisture all within its region that can be harnessed for the irrigation of the crop. The Nile valley is available, there are the coasts of the north and west Africa, the Niger river in the eastern highlands, and in south Africa. As we look at the rice crop we know that rice first pre-requisite to ensure cultivation is source of water. SSA therefore stand a good chance in this direction to double rice cultivation. Accrued Benefits From the Production The need to grow rice in Africa at an increased production rate are for many reasons. Rice for food is well noted and this is strong reason for growing rice as Africa must be ready to feed its tumultuous population now and in future. The bane of any development and economic vibrance 162 is Agriculture. Africa is still poverty stricken, and with this synergy exercise it is believed that it will transform the income of African farmers. Reduction of importation to enhance for increased foreign reserves is needed. With this programme we believe that importation can be reduced to barest minimum. Sawah’s Position in Rice Production As already highlighted one thing is still lacking in rice cultivation in SSA. This is the neglection of ecotechnology practice to conserve water and soil round rice fields for yield edification. The major and important position of Sawah rice farming in Africa’s move for rice is the bringing into practice the land preparation technology. There is need to mention some vitals about Sawah. On Sawah technology requirement in SSA, there exist suitable physical parameters that are in good consonance for SAWAH establishment. Sawah Ectechnology was invented by professor Toshiyuki wakatsuki from Kinki University/Shimane University Japan. This is about a land preparation strategy most suitable for rice and made solely for adaptability on the African soil. It has an efficiency and efficacy to give yield of 4tons – 10tons per hectare. The term Sawah is an Asian word originating from Malayo _ Indonesia. The English word for rice paddi or paddy is also from Malayo _ indonesia. This means rice plant hence Sawah stand for rice plant grain or rice fields. Sawah therefore is an ecological engineering technology land design appropriate for good rice management. This term refers to leveled rice fields surrounded by bounds with inlet and outlet connected to the drainage and irrigation canals. This man made land preparations can easily be practiced by our farmers. Sawah Site Selection Require ments Suitable hydromophic lowlands and inland valley basins are good sites for SAWAH rice farming. It is always important to make sure that water is available to serve for irrigation or supplementation when rain go off. In the dry season SAWAH can still go on as we now see with farmers in Birnin kebbi state or Bida in Niger State. Here water ensurity is done by digging tube wells for irrigation. Hence criteria for site selection can be as follows:- 163 1. lowlands/inland valleys with considerable volume of water that stay for 4 – 6 months continuously. 2. flat or semi flat lands with topography to be less than 2%. The best topography gradient for use is 0.1%. 3. Available land coverage must be ensured and to be 10 hectares and above. 4. Area must be well pre-surveyed to make sure it is not prawn to flooding. Flood must not exceed 50cm depth. Flash floods normally will disappear after 3 – 5 days and will regress with no damage on rice. Sawah ecotechnology system practice (methodology) Sawah technology is of a complete package requiring rapt execution attention from choice of site through to harvesting and bagging of rice. No single practice in the package must be joked with or left un-utilized, as far as the production package is concerned. As for materials for usage, we will need a small machine like the power tiller which is two stroke engine of 13 horse power. This is used for ploughing, harrowing, puddling and leveling of rice field d uring the land preparation stage, Other materials needed are:- leveler planks, ropes, twine ropes for transplanting, shovels, spades, headpans etc. The following are strictly adhered to which stand for the complete package. 1. Site selection:-select flat lands as already enumerated, Terracing is used for steppy sites using simple survey instruments e.g the `A` frame. However for impact point go for flat or gentle slope sites first. 2. Marking out of SAWAH basins:-basins to be of 20 -30m measurement to allow for free movement of power tiller in the basins. Bound of 50cm x 50cm to be constructed round the basins for good water management and soil movement checks. Basins can be a square, rectangular or round in shapes. 3. Nursery preparation:- Raised beds of 10 -15cm are made Raise clean seeds of faro 52(WITA 4), and faro44 seeds. Seeds must be improved. Raise seedlings need to be carefully managed for transplanting at 15 – 25 days. 164 4. Land preparation: land must be ploughed, harrowed, puddled, leveled properly to make basins convenient for good root penetration and rice growth also to allow for even water depth flow over the basins. 5. Transplanting:- Transplant healthy, succulent seedlings using three seedlings per hole. Avoid dipping the stem too much into the soil. Follow the correct spacing. Spacing is 20cm x 20cm using two seedlings and 25cm x 25cm using three seedlings. Ensure plant population. Transplanting ropes are used to enhance proper space transplanting. 6. Water management:- Water management is very important and need to be ensured at minimal depth after transplanting- 2mm and gradually increased to 10cm after tillering. 7. Fertilizer application:- At 10 – 12 days after transplanting, first dosage is giving using four bags 0f NPK. At the time when plants are about to boot the second split dose is applied using two bag of urea. 8. Weeding:- Indeed if your operations are carefully followed before this stage you may not encounter weed emergence at all, or only very few will emerge that will need very little labour. Once water is properly managed weeds may not emerge. 9. Harvesting:- Harvesting is at time of 80% of yellow change in rice straw. After harvesting we call for tarpaulins for use on floors to prevent sand, stones and other foreign bodies in the rice paddy grains. The above show the methodology in the SAWAH rice farming System. By these practices, it is possible to have quality SAWAH rice fields that are capable to increase or double yields. Multi functions of Sawah rice fields With these practice soils cannot be washed from top to down levels. Nutrients are enclosed for plant use. And instead of talking of nutrient deficie ncy, we will now be talking of nutrient surplus. The multi functionality of SAWAH rice farming can be summed up in the followings:1. Increase or double yield of rice. 2. Prevent eroding of soil and fertilizer. 165 3. Increase Nitrogen fixation through growth of algae development. Azolla plant are gotten and fix Nitrogen that can provide a quantity of 20 – 2000T/ha/year (kyuma 2003, Hirose and Wakatsuki 2002.) 4. Phosphorus increase is mobilized through the reduction of ferric irons to ferrous irons. 5. Weeds are drastically reduced or controlled. Through this ecological engineering process, lowlands become basis for long term intensive, and Sustain ability in rice farming. Result of Sawah Rice Farming Indeed the first result expected is that of yield. yield have been closely watched and compiled not only in the scientific statistical Analysis, but also from the farmers field practical results. The yield under farmers practice had come from 4Tons/ha to 7.2Tons/ha. The highest gotten yield so far is coming from a rice field in Jega – Birnin Kebbi State in Nigeria. As we broach into statistics of areas where Sawah farming had gotten to in Africa and Nigeria, we have the followings to mention. In Nigeria Sawah was started in 1986 in a little village of Gadza in Niger State close to Bida by Prof Wakatsuki of Kinki University/Shimane University Japan. As we follow closely Sawah Now has gotten to villages in Gadza environment, Kwara State, Birnin Kebbi State,Imo State, Kaduna State (UNDP millennium village) Ondo State, Ogun State, Lagos State. In small or large functions it reached these parts. Nigeria, Ghana, Benin Republic and Togo had been reached with knowledge and practice o f Sawah rice technology. It has been observed that Sawah farmers and organizations have gone into purchasing their own power tillers for use. This is also a good progress result. Farmers form of living is improving. The number of farmers actively involved in Sawah system of rice production in Bida by 2001 was only three, but by 2005 about 83 were participating. Today we have soaring numbers in the areas that are involved in this very technology. 166 Conclusion:-The use of Sawah system no doubt is answer to rice yield yearnings in SSA. A system that ensures proper water usage and prevents soil movement is best system for rice production. The governments need to provide assistance to farmers to enable them adopt this rice production system. By providing credit assistance to farmers this small 2 stroke machine can easily be bought and applied to enhance farmers productivity. HOUSEHOLD POVERTY-RICE CONSUMPTION NEXUS IN KADUNA STATE, NIGERIA: A GUIDE TO POLICY 167 OYINBO O., G.Z. REKWOT, D. AGBONIKA AND G.A. ADEGYOYE Department of Agricultural Economics and Rural Sociology, Ahmadu Bello University, Zaria, Nigeria. Email: [email protected] Abstract This study was carried out to determine the influence of poverty on consumption of rice by households in Kaduna state. Primary data on household food consumption and expenditure patterns obtained from a sample of 310 households using structured questionnaire were utilized in the study. The data were analysed using FGT weighted poverty indices and multiple regression analysis. The key findings of the study were that 47% of the households were poor and the poverty status of the sampled households was statistically significant and inversely related to their consumption of rice. This implied that an increase in poverty would reduce the tendency of rice consumption by the households as a result of the reduction in their purchasing power. Based on the key findings of the study, it was recommended as a matter of policy that programmes and projects aimed at alleviating poverty should be well coordinated and strengthened to focus directly on core poor households so as to enhance their purchasing power and also, the on-going rice transformation plan should be implemented to the latter so as to increase the domestic supply of rice which would reduce the price of rice. This is strongly advocated as the reduction in the price of rice would enable households to be able to increase their consumption of rice. Introduction 168 People who do not have sufficient food intake to lead active and healthy lives are among the poorest in the world (FAO, 2012). Poverty is a global menace that threatens the standard of living of the people across various countries of the world and it is an endemic phenomenon that is on the increase in Nigeria (Olorunsanya et al., 2011). Poverty in Nigeria is pervasive although the country is rich in human and material resources that should translate into better living standards (Omonona, 2009). Despite the various efforts of government to reduce the incidence of poverty through different poverty alleviation programmes and strategies and the quest to be one of the 20 largest economies by the year 2020, Nigeria continues to be one of the poorest countries in the world (Adepoju, 2012). Its incidence rose from 27.2% in 1980 to 42.7% in 1992 and 69% in 2010(NBS, 2012b). In a developing country like Nigeria, the consumption pattern is skewed towards food i.e. food accounts for a higher proportion of the total expenditure, while in developed countries the opposite is the case (NBS, 2012a). A rising share of food expenditure reflects the hardship that poor families face when trying to maintain food consumption when either food prices rise or incomes fall, by sacrificing other household spending, whether for consumption or investment (FAO, 2012). Rice constituted 11.17% of food expenditure and 7.33% of total household expenditure as reported by (NBS, 2012a) based on the Harmonized Nigeria Living Standard Survey (HNLSS) 2009/2010 with food expenditure constituting 65.63% of the total household expenditure while at the national level, rice constituted 8.91% of food expenditure and 5.76% of total household expenditure with food expenditure constituting 64.68% of the total household expenditure. Nigeria is the second largest importer in the world and it is consumer preference for higher quality product and limited domestic processing capacity that creates demand for imports (MARKETS, 2009b). Given the crucial role of rice in the food security of urban and rural households alike, development of rice growing has long been considered a priority in Nigeria (Bamba et al., 2010). Rice has changed from being a luxury to a necessity whose consumption will continue to increase with per capita GDP growth, thus implying that its importance in the Nigerian diet as a major food item for food security will increase as economic growth continues (Ojogho and Alufohai, 2010). 169 During the last two decades, rice has moved from a ceremonial to a staple food in many Nigerian homes (MARKETS, 2009a). The consumption of rice is on the increase among urban and rural households. Poverty is rising in Nigeria with almost 100 million people living on less than one dollar a day despite strong growth of the economy (Brock, 2012). It is worth noting that empirical information on several issues related to rice consumption and poverty exists but there exists a dearth of empirical information on the influence of household poverty on consumption of rice by the households and this is the research gap which necessitated this study. In view of the foregoing, the study was carried out to determine the poverty profile of households in Kaduna state and the influence of their poverty status on their consumption of rice and draw up relevant policy implications based on the findings of the study. Methodology Description of the study area The study was carried out in Sabon Gari, Kaduna South and Soba local government areas of Kaduna state. Kaduna state lies between latitudes 10 0 211 and 100 331 North of the equator and longitudes 70 451 and 70 751 East of the Greenwich meridian and has 23 local government areas. It occupies a total land mass of about 46, 053 km2 and its population was put at 6, 066, 526 people in 2006(NPC, 2006) and had a projected population of 6, 903, 746 people in 2012 using an annual growth rate of 3.2%. Sampling procedure and sample size A multistage sampling technique was employed to select the households for the study. The first stage involved a random selection of Sabon Gari, Kaduna South a nd Soba local government areas. The second stage involved the random selection of two districts from each of the selected local government areas. The districts are Muchia and Hanwa in Sabon Gari local government area, Kurmin Mashi and Kakuri in Kaduna South local government area, Yakassai and Rahama in Soba local government area. The third stage involved the random selection of 5% of the households in the selected districts to give a sample size of 310 pooled from Muchia(48), Hanwa(56), Kurmin Mashi(52), Kakuri(56), Yakassai(54) and Rahama(44). 170 Method of data collection Primary data on household food consumption and expenditure patterns was used in this study. The primary data were elicited using well structured questionnaires from heads of household who consulted with their household members on the households food budgetary planning and purchase. Analytical technique This study made use of Foster-Greer-Thorbecke (FGT) weighted poverty index and multiple regression in the analysis of data. The Foster-Greer-Thorbecke (FGT) weighted poverty index was used to determine the poverty status of the households and the multiple regression was used to ascertain the influence of the poverty status of the households on their rice consumption. Foster-Greer-Thorbecke's (FGT) Class of Weighted Poverty Indices The Foster, Greer and Thorbecke (FGT) measures of poverty are widely used because they are consistent and additively decomposable (Foster et al., 1984). The General Foster, Greer and Thorbecke (FGT) poverty index (Pαi) is expressed as: When: The poverty headcount index is the share of the population whose income or consumption is below the poverty line; that is, the share of the population that cannot afford to buy a basic basket of goods. The poverty gap index provides information regarding how far households are from the poverty line. This measure captures the mean aggregate income or consumption shortfall relative to the poverty line across the whole population. 171 The squared poverty gap index takes into account not only the distance separating the poor from the poverty line (the poverty gap), but also the inequality among the poor; that is, a higher weight is placed on those households further away from the poverty line. This measure takes account of the incidence of poverty, the depth of poverty, and the inequality among the poor Where: n = number of households in a group q = the number of poor households z = poverty line(2/3 Mean Per Capita Household Expenditure (MPCHHE) of the households) = the per capita expenditure (PCE) of the ith household α = degree of poverty aversion(0, 1 and 2) Multiple Regression Analysis To determine the empirical relationship between rice consumption(Y) and the poverty status of households(X), the model is specified as: To avoid misspecification of the model, other variables that could influence demand as indicated by economic theory are included in the model. The explicit form of the model was given as: Where: = Quantity of rice consumed (kg/month) = Poverty headcount (Dummy: 1= poor, 0= non poor) = Price of rice (N) = Household income (N/Month) = Price of beans (N) = Price of maize (N) 172 = Price of gari (N) = Price of yam (N) = Constant term = Error term = Estimated coefficients of the independent variables. Results and Discussion The relative poverty line was estimated to be N 14, 352.15 and was expected to meet the monthly minimum basic requirements (food and non- food) of an adult in the study area. Households whose per capita expenditure was below the poverty line are considered to be poor and those whose per capita expenditure was above the poverty line are taken to be non-poor. From the foregoing, 47% of the households were poor with 53% of the households being non-poor. This finding does not corroborate with the 2009/2010 Harmonized Nigeria Living Standard Survey(HNLSS) that indicated 73% poor and 27% non-poor households in Kaduna state(NBS, 2012b). The poverty depth and severity of the households were estimated to be 35% and 18% respectively. Table 1: Poverty profile of households in the study area Item Household expenditure(N) Per capita household expenditure(PCE) (N) Mean per capita household expenditure(MPCHHE) (N) Poverty line(N) Poverty headcount Poverty depth Poverty severity Poor (%) Non-poor (%) 31, 910, 550.00 1, 916, 011.38 21, 528.22 14, 352.15 0.47 0.35 0.18 47 53 Empirical relationship of household poverty and rice consumption 173 The result of the multiple regression analysis showing the influence of some factors on rice consumption by households in the study area with emphasis on the influence of poverty on rice consumption by the households is presented in Table 2. The adjusted R Square of 0.51 implies that 51 per cent in the variability of rice consumption of households in the study area is explained by the combined effect of the explanatory variables used in the study. The goodness of fit of the model was deduced from the log likelihood of -419.121 and this indicates that the model gave a good fit for the analysis. Table 2: Ordinary Least Square Regression Estimates Variable Coefficient Intercept Poverty Price of rice Price of beans Price of maize Prize of gari Prize of yam Household income 45.132 -15.490 -0.158 -0.034 -0.102 0.074 0.191 0.162E-04 Standard error t ratio 11.047 6.549 0.089 0.046 0.545 0.059 0.065 0.197E-04 4.086 -2.365 -1.775 -0.729 -1.868 1.270 2.947 0.821 2 Adjusted R-Square ( R ) 0.51 Log likelihood -419.121 NB: ***p<0.01 **P<0.05 *P<0.10 The coefficient of poverty (-15.490) had the expected negative relationship with rice consumption by the households and was statistically significant at 5% probability level. This implies that 1% increase in the poverty status of households will reduce their propensity to consume rice by 15.5% ceteris paribus. A plausible explanation for this is that an increase in poverty tends to reduce the purchasing power of the households which implies that their accessibility to food is adversely affected thereby making the households to be food insecure. This is in line with (NPC, 2001), who posited that poverty is the basic reason for a lack of access to food. The price of rice (-0.158) was found to be inversely related to rice consumption and statistically significant at 10% probability indicating that rice is price inelastic. This finding is in line with 174 the demand-price inverse relationship established by consumer demand theory and it implies that 1% increase in price of rice will less than proportionately reduces rice consumption of the households by 0.6%. Price of maize was statistically significant (p<0.01) and inversely relatedly to rice consumption indicating a negative cross-price elasticity. This implies that rice and beans were substitutes. The price of yam was highly statistically significant(p<0.01) and positively related to rice consumption indicating a positive cross price elasticity of rice with respect to yam. This implies that rice and yam were complementary food items in the study area. Household income had the expected positive relationship with rice consumption but was found to be insignificant. Policy Implications Based on the established negative influence of poverty on rice consumption in the study, the following policy implications are put forward: 1. Existing programmes and projects aimed at poverty alleviation should be well coordinated and strengthened to focus directly on poor households so as to reduce their poverty status which will invariably enhance their purchasing power and economic accessibility to food. 2. The on-going rice transformation plan should be implemented to the latter so as to increase the domestic supply of rice which would reduce the price of rice. This is strongly advocated as the reduction in the price of rice would enable households to be able to increase their consumption of rice. Conclusion The study found out that 44% of the households per capita expenditure was below an estimated relative poverty line of N 14, 352.15 per month which implies that 47% of the households were poor while 53% of the households were non poor. The depth of poverty was found to be 35% while the poverty severity was found to be 18%. The poverty status of the households was found to be statistically significant (p<0.05) in influencing rice consumption by the sampled households and the relationship was inverse. This implied that an increase in the poverty status of the households would decrease the propensity to consume rice by the households and this is attributable to the negative influence of poverty on purchasing power of households. 175 References Adepoju, A.O.(2012). Poverty Transitions in Rural South West Nigeria. Global Journal of Science Frontier Research, 12(1): 19 – 29. Bamba, I., A. Diagne, Manful, J.and Ajayi, A.( 2010). Historic Opportunities for Rice Growers in Nigeria. Grain de sel. No. 51, July – September 2010. Brock, J.(2012). Nigerian Poverty Rising Despite Economic Growth. Available online at: http://www.reuters.com/article/2012/02/13/us-nigeria-povertyidUSTRE81C0KR20120213. Accessed 12th January 2013. Chauvin, D., Mulangu, N.F. and Porto, G. (2012). Food Production and Consumption Trends in Sub-Saharan Africa: Prospects for the Transformation of the Agricultural Sector. Working Paper 2012-011. United Nations Development Programme, Regional Bureau for Africa, New York. Food and Agriculture Organization(FAO), (2012). The State of Food Insecurity in the World 2012. Economic growth is necessary but not sufficient to accelerate reduction of hunger and malnutrition. Rome, FAO. pp 1 – 61. Foster, J., Greer, J. and Thorbecke, E. (1984). A Class of Decompo sable Poverty Measures. Econometrica, 52:761-765. Maximizing Agricultural Revenue and Key Enterprises in Targeted Sites (MARKETS), (2009b). Package of Practices For Rice Production. Available online at: http://www.nigeriamarkets.org/files/Rice_POP_English_June_2009%5B1%5D.pdf. Accessed 12th January 2013. Maximizing Agricultural Revenue and Key Enterprises in Targeted Sites (MARKETS), (2009b). Why Does Nigeria Import Rice? Commercial Processing and Food Security. Nigeria’s Harvest MARKETS AGBIZ Update. July 17, 2009. Available online at: http://www.nigeriamarkets.org/files/Nigeria%27s_Harvest_Vol_1_Rice.pdf. Accessed 12th January 2013. National Bureau of Statistics, (2012a). Consumption Pattern in Nigeria 2009/10. National Bureau of Statistics, (2012b). Nigeria poverty profile. National Planning Commission, (2001). National Policy on Food and Nutrition in Nigeria. pp 1 – 32. 176 Ojogho, O. and Alufohai, G.O. (2010). Impact of Price and Total Expenditure on Food Demand in South-Western Nigeria. African Journal of food, Agriculture, Nutrition and Development, 10(11): 4350 – 4363. Olorunsanya, E. O., Falola, A. and Ogundeji, F.S. (2011). Comparative analysis of poverty status of rural and urban households in Kwara state, Nigeria. International Journal of Agricultural Economics and Rural Development, 4 (2): 44 – 52. Omonona, B. (2009).Quantitative Analysis of Rural Poverty in Nigeria. Nigeria Strategy Support Program. Brief No.17. 177


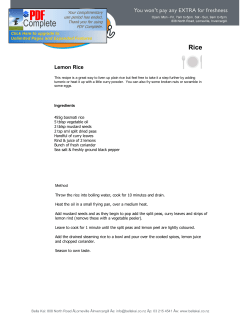


© Copyright 2026