
Take Five Sports Bar & Grill — Sample Plan
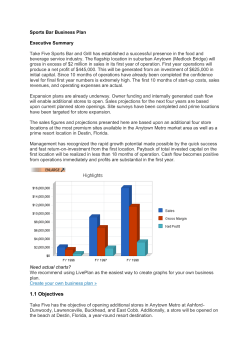
Sa
m
pl
e
Take Five Sports Bar & Grill — Sample Plan
This sample business plan was created using Business
Plan Pro® - business planning software published by Palo
Alto Software.
This plan may be edited using Business Plan Pro and is one
of 400+ sample plans available from within the software.
Pr
o
To learn more about Business Plan Pro and other planning
products for small and medium sized businesses, visit us
at www.paloalto.com.
Bu
sin
es
sP
la
n
This is a sample business plan and the names, locations and numbers may have been
changed, and substantial portions of the original plan text may have been omitted to
preserve confidentiality and proprietary information.
You are welcome to use this plan as a starting point to create your own, but you do not have
permission to reproduce, publish, distribute or even copy this plan as it exists here.
Requests for reprints, academic use, and other dissemination of this sample plan should be
emailed to the marketing department of Palo Alto Software at [email protected]. For
product information visit our Website: www.paloalto.com or call: 1-800-229-7526.
Trinity Capital
Business plan strategic development by Timothy J. Dineen—consultant
Norcross, Georgia Ph: 770-935-0480 Fax: 770-935-1075 Email: [email protected]
Copyright © Palo Alto Software, Inc., 1995-2002. All rights reserved.
Sa
m
pl
e
Confidentiality Agreement
The undersigned reader acknowledges that the information provided by
_________________________ in this business plan is confidential; therefore, reader agrees
not to disclose it without the express written permission of _________________________.
It is acknowledged by reader that information to be furnished in this business plan is in all
respects confidential in nature, other than information which is in the public domain through
other means and that any disclosure or use of same by reader, may cause serious harm or
damage to _________________________.
Upon request, this document is to be immediately returned to
_________________________.
___________________
Name (typed or printed)
___________________
Date
Pr
o
___________________
Signature
Bu
sin
es
sP
la
n
This is a business plan. It does not imply an offering of securities.
Table of Contents
Executive Summary . . . . . . . . . . . . . . . . . . . . . . . . . . . . . . . . . . . . . . . . . . . . . . . .
1.1
Objectives . . . . . . . . . . . . . . . . . . . . . . . . . . . . . . . . . . . . . . . . . . . . . . . . . . .
1.2
Mission . . . . . . . . . . . . . . . . . . . . . . . . . . . . . . . . . . . . . . . . . . . . . . . . . . . . .
1.3
Keys to Success . . . . . . . . . . . . . . . . . . . . . . . . . . . . . . . . . . . . . . . . . . . . . . .
1
2
2
2
2.0
Company Summary . . . . . . . . . . . . . . . . . . . . . . . . . . . . . . . . . . . . . . . . . . . . . . . .
2.1
Company Ownership . . . . . . . . . . . . . . . . . . . . . . . . . . . . . . . . . . . . . . . . . . .
2.2
Company History . . . . . . . . . . . . . . . . . . . . . . . . . . . . . . . . . . . . . . . . . . . . . .
2.3
Company Locations and Facilities . . . . . . . . . . . . . . . . . . . . . . . . . . . . . . . . . . .
3
3
3
5
3.0
Market Analysis Summary . . . . . . . . . . . . . . . . . . . . . . . . . . . . . . . . . . . . . . . . . . . 6
3.1
Market Segmentation . . . . . . . . . . . . . . . . . . . . . . . . . . . . . . . . . . . . . . . . . . . 6
4.0
Strategy and Implementation Summary . . . . . . . . . . . . . . . . . . . . . . . . . . . . . . . .
4.1
Marketing Strategy . . . . . . . . . . . . . . . . . . . . . . . . . . . . . . . . . . . . . . . . . . . .
4.1.1 Pricing Strategy . . . . . . . . . . . . . . . . . . . . . . . . . . . . . . . . . . . . . . . . .
4.1.2 Promotion Strategy . . . . . . . . . . . . . . . . . . . . . . . . . . . . . . . . . . . . . . .
4.1.3 Marketing Programs . . . . . . . . . . . . . . . . . . . . . . . . . . . . . . . . . . . . . .
4.2
Sales Strategy . . . . . . . . . . . . . . . . . . . . . . . . . . . . . . . . . . . . . . . . . . . . . . . .
4.2.1 Sales Forecast . . . . . . . . . . . . . . . . . . . . . . . . . . . . . . . . . . . . . . . . . .
4.3
Milestones . . . . . . . . . . . . . . . . . . . . . . . . . . . . . . . . . . . . . . . . . . . . . . . . . . .
7
7
7
7
8
8
8
9
5.0
Management Summary . . . . . . . . . . . . . . . . . . . . . . . . . . . . . . . . . . . . . . . . . . . . . .
5.1
Organizational Structure . . . . . . . . . . . . . . . . . . . . . . . . . . . . . . . . . . . . . . . . .
5.2
Management Team . . . . . . . . . . . . . . . . . . . . . . . . . . . . . . . . . . . . . . . . . . . .
5.3
Management Team Gaps . . . . . . . . . . . . . . . . . . . . . . . . . . . . . . . . . . . . . . . .
5.4
Personnel Plan . . . . . . . . . . . . . . . . . . . . . . . . . . . . . . . . . . . . . . . . . . . . . . . .
9
10
10
11
11
Financial Plan . . . . . . . . . . . . . . . . . . . . . . . . . . . . . . . . . . . . . . . . . . . . . . . . . . . . .
6.1
Important Assumptions . . . . . . . . . . . . . . . . . . . . . . . . . . . . . . . . . . . . . . . . .
6.2
Key Financial Indicators . . . . . . . . . . . . . . . . . . . . . . . . . . . . . . . . . . . . . . . . .
6.3
Break-even Analysis . . . . . . . . . . . . . . . . . . . . . . . . . . . . . . . . . . . . . . . . . . . .
6.4
Projected Profit and Loss . . . . . . . . . . . . . . . . . . . . . . . . . . . . . . . . . . . . . . . .
6.5
Projected Cash Flow . . . . . . . . . . . . . . . . . . . . . . . . . . . . . . . . . . . . . . . . . . . .
6.6
Projected Balance Sheet . . . . . . . . . . . . . . . . . . . . . . . . . . . . . . . . . . . . . . . . .
6.7
Business Ratios . . . . . . . . . . . . . . . . . . . . . . . . . . . . . . . . . . . . . . . . . . . . . . .
12
12
13
14
15
16
18
18
Bu
sin
es
sP
la
n
Pr
o
Sa
m
pl
e
1.0
6.0
Take Five Sports Bar & Grill — Sample Plan
Sa
m
pl
e
1.0 Executive Summary
Take Five Sports Bar and Grill has established a successful presence in the food and beverage
service industry. The flagship location in suburban Anytown (Medlock Bridge) will gross in
excess of $2 million in sales in its first year of operation, ending July 1996. First year
operations will produce a net profit of $445,000. This will be generated from an investment of
$625,000 in initial capital. Since 10 months of operations have already been completed the
confidence level for final first year numbers is extremely high. The first 10 months of start-up
costs, sales revenues, and operating expenses are actual.
Expansion plans are already underway. Owner funding and internally generated cash flow will
enable additional stores to open. Sales projections for the next four years are based upon
current planned store openings. Site surveys have been completed and prime locations have
been targeted for store expansion.
Pr
o
The sales figures and projections presented here are based upon an additional four store
locations at the most premium sites available in the Anytown Metro market area as well as a
prime resort location in Destin, Florida.
This plan will result in sales revenues growing to $25 million by FY2000 and generating net
income in excess of $5.6 million.
Bu
sin
es
sP
la
n
Management has recognized the rapid growth potential made possible by the quick success
and fast return-on-investment from the first location. Payback of total invested capital on the
first location will be realized in less than 18 months of operation. Cash flow becomes positive
from operations immediately and profits are substantial in the first year.
Highlights
$18,000,000
$16,000,000
$14,000,000
$12,000,000
Sales
$10,000,000
Gross Margin
$8,000,000
Net Profit
$6,000,000
$4,000,000
$2,000,000
$0
1996
1997
1998
Copyright © Palo Alto Software, Inc. 2002 All rights reserved. www.paloalto.com Not for reproduction, publication, or distribution.
Pg 1
Take Five Sports Bar & Grill — Sample Plan
Sa
m
pl
e
1.1 Objectives
Take Five has the objective of opening additional stores in Anytown Metro at AshfordDunwoody, Lawrenceville, Buckhead, and East Cobb. Additionally, a store will be opened on
the beach at Destin, Florida, a year-round resort destination.
The management of Take Five has demonstrated its concept, execution, marketability, and
controls, and feels confident of its ability to successfully replicate the quick ramp-up of the
Medlock Bridge location to additional venues.
The following objectives have been established:
Pr
o
• Have all five stores operational by 1998 with a sequential time-line of openings.
• Maintain tight control of costs and operations by hiring quality management at each
location and utilizing automated computer control.
• Keep food cost under 32% of revenue.
• Keep beverage cost under 21% of revenue.
• Select only locations that meet all the parameters of success.
• Grow each location to the $3 to $5 million annual sales level.
1.2 Mission
Bu
sin
es
sP
la
n
Take Five Sports Bar & Grill strives to be the premier sports theme restaurant in the
Southeast Region. Our goal is to be a step ahead of the competition. We want our customers
to have more fun during their leisure time. We provide more televisions with more sporting
events than anywhere else in the region. We provide state-of-the-art table-top audio control
at each table so the customer can listen to the selected program of his or her choice without
interference from background noise. We combine menu selection, atmosphere, ambiance,
and service to create a sense of "place" in order to reach our goal of over-all value in a
dining/entertainment experience.
1.3 Keys to Success
The keys to success in achieving our goals are:
•
•
•
•
Product quality. Not only great food but great service.
Managing finances to enable new locations to open at targeted intervals.
Controlling costs at all times without exception.
Instituting management controls to insure replicability of operations over multiple
locations. This applies equally to product control and to financial control.
Copyright © Palo Alto Software, Inc. 2002 All rights reserved. www.paloalto.com Not for reproduction, publication, or distribution.
Pg 2
Take Five Sports Bar & Grill — Sample Plan
Sa
m
pl
e
2.0 Company Summary
The key elements of Take Five's restaurant store concept are as follows:
• Sports based themes--The company will focus on themes that have mass appeal.
• Distinctive design features--All stores will be characterized by spectacular visual
design and layout. Each store will display a collection of authentic sports memorabilia.
Bu
sin
es
sP
la
n
Pr
o
• High profile locations--The company selects its store locations based on key
demographic indicators, including traffic counts, average income, number of
households, hotels, and offices within a certain radius.
• Celebrity events--The company stores will be distinguished by the promotional
activities of sports celebrities and by media coverage of appearances and special
events.
• Retail merchandising--Each store will include an integrated retail store offering
premium quality merchandise displaying the company's logo design. In addition sports
memorabilia will be sold.
• Quality food--Each Take Five store will serve freshly prepared, high quality, popular
cuisine that is targeted to appeal to a variety of tastes and budgets with an emphasis
on reasonably and moderately priced signature items of particular appeal to a local
market.
• Quality service--In order to maintain its unique image the Company provides attentive
and friendly service with a high ratio of service personnel to customers and also
invests in the training and supervision of its employees.
2.1 Company Ownership
Take Five Sports Bar and Grill is a privately held Georgia company. Joseph A. Smith is the
principal owner. It is Mr. Smith's intention to offer limited outside ownership in Take Five on
an equity, debt, or combination basis in order to facilitate a more rapid expansion of the Take
Five concept.
Mr. Smith holds an MBA in Finance from Anytown University. He has held executive level
positions in finance with General Electric and Holiday Inn Worldwide. He is previously
experienced in the restaurant industry, having opened Smith's Italian Restaurant in 1993,
which still operates successfully under his ownership.
2.2 Company History
Take Five Sports Bar & Grill was founded in 1995 by Joseph Smith to capitalize on the ever
growing market demand for high end technology enhanced sports theme restaurants. Take
Five has promoted its brand through the operation of its existing location at Medlock Bridge
Road and State Bridge Road in Anytown, Georgia. The flagship location provides a unique
dining and entertainment experience in a high-energy environment. Customer acceptance
has been proven. Regular and repeat customers cross many age demographics and families
are frequent diners.
Take Five has promoted heavily with tie-ins to Anytown professional teams and celebrities.
Take Five Sports Bar and Grill is the radio home for the live Monday Night XYZ Anytown
Falcons coaches show featuring June Jones and Jeff George. This show is broadcast during
the hour preceding the telecast of "Monday Night Football". In addition, Take Five hosts the
Copyright © Palo Alto Software, Inc. 2002 All rights reserved. www.paloalto.com Not for reproduction, publication, or distribution.
Pg 3
Take Five Sports Bar & Grill — Sample Plan
Sa
m
pl
e
Anytown Hawks sports talk show on ABC 750 AM featuring guard Steve Smith and the radio
voice of the Hawks, Steve Holman. The Anytown Braves celebrated their World Series
championship party at Take Five the night they won the Series.
The following table and chart illustrates the rapid sales success of the first Take Five location.
The period covered is the initial opening from August through December 1995.
Table: Past Performance
Past Performance
1993
$0
$0
$0
$0
$0
$0
$0
$0
$0
Bu
sin
es
sP
la
n
Balance Sheet
Current Assets
Cash
Accounts Receivable
Inventory
Other Current Assets
Total Current Assets
Long-term Assets
Capital Assets
Accumulated Depreciation
Total Long-term Assets
Total Assets
1993
$0
$0
0.00%
$0
0
0.00
1994
$0
$0
0.00%
$0
0
0.00
1995
$634,900
$394,000
62.06%
$301,000
0
20.00
1994
$0
$0
$0
$0
$0
1995
$67,136
$0
$15,197
$17,310
$99,643
$0
$0
$0
$0
$475,495
$29,713
$445,782
$545,425
Pr
o
Sales
Gross Margin
Gross Margin %
Operating Expenses
Collection Period (days)
Inventory Turnover
Capital and Liabilities
Accounts Payable
Current Borrowing
Other Current Liabilities
Subtotal Current Liabilities
1993
$0
$0
$0
$0
1994
$0
$0
$0
$0
1995
$20,040
$0
$40,826
$60,866
Long-term Liabilities
Total Liabilities
Paid-in Capital
Retained Earnings
Earnings
Total Capital
Total Capital and Liabilities
$0
$0
$0
$0
$0
$0
$0
$0
$0
$0
$0
$0
$0
$0
$0
$60,866
$625,000
($218,401)
$77,960
$484,559
$545,425
1993
0
$0
0.00
1994
0
$0
0.00
1995
0
$0
0.00
Other Inputs
Payment Days
Sales on Credit
Receivables Turnover
Copyright © Palo Alto Software, Inc. 2002 All rights reserved. www.paloalto.com Not for reproduction, publication, or distribution.
Pg 4
Take Five Sports Bar & Grill — Sample Plan
Sa
m
pl
e
Past Performance
$700,000
$600,000
$500,000
Sales
$400,000
Gross
$300,000
Net
$200,000
$0
1993
1994
1995
Bu
sin
es
sP
la
n
2.3 Company Locations and Facilities
Pr
o
$100,000
The company units will range in size from 6000 to 9000 square feet and will seat from 225 to
400 persons. Each Take Five Sports Bar & Grill will feature authentic sports memorabilia such
as Michael Jordan's game jersey to Jimmy Connor's signed tennis racquet. Each store will be
equipped with state-of-the-art audio and video systems to enable the customer to enjoy the
game of their choice. Every restaurant will be built to existing specifications, clean looking,
open, and pleasing to the customer.
Unit locations are as follows:
• Medlock Bridge--This unit is located at one of the busiest intersections in North Fulton
County. It is surrounded by four major country clubs, upper middle class
neighborhoods, office complexes, and shopping. It encompasses 6,000 sq. ft. of space
and has been open since August 1995.
• Ashford-Dunwoody--This unit will open in late summer 1996. Size will be 7,200 sq.ft.
The location is one and one-half miles north of Perimeter Mall. Within a three mile
radius there is 20 million square feet of professional office space. Also, an abundance
of upscale apartment complexes adjoins the unit. Major chain hotels are located
nearby. Perimeter Mall is one of the regional upscale shopping destinations.
• Lawrenceville (New Market)--This site will occupy 6,500 square feet and is scheduled
to open in the Spring of 1997. It will be built as a free standing building on a 2+ acre
parcel at the intersection of Rt. 120 and Rt. 316. Adjacent to the property is an 18
screen movie theater opened by AMC in March 1996. This is the largest theater AMC
has built in the Anytown area. New Market Mall has as master anchors Target, Home
Depot, and Marshalls among others. The demographics are very favorable with no
competition from other sports bar restaurants.
• Peachtree and Piedmont (Buckhead)--This unit will be in the heart of Buckhead which
is Anytown's most comprehensive business and entertainment center. In addition to
retail space being constructed at this sight the unit will be adjacent to a 200+ room
America's Suite Hotel. Buckhead is one of the nation's largest and fastest-growing
mixed use urban areas. It includes a dynamic combination of concentrated offices,
Copyright © Palo Alto Software, Inc. 2002 All rights reserved. www.paloalto.com Not for reproduction, publication, or distribution.
Pg 5
Take Five Sports Bar & Grill — Sample Plan
retail, hotel, shopping, restaurant/entertainment, and residential development.
Sa
m
pl
e
Take Five Sports Bar & Grill also maintains a corporate business office at 1234 Main Street,
Anytown, Ga. 30092.
3.0 Market Analysis Summary
Market segmentation is shown in the next section.
3.1 Market Segmentation
Market segmentation data is presented in the chart and table below.
Pr
o
Market Analysis (Pie)
Medlock Bridge
Ashford-Dunwoody
Bu
sin
es
sP
la
n
Lawrenceville
Buckhead
Table: Market Analysis
Market Analysis
Potential Customers
Medlock Bridge
Ashford-Dunwoody
Lawrenceville
Buckhead
Total
Growth
10%
6%
8%
5%
6.39%
1995
20,000
40,000
30,000
80,000
170,000
1996
22,000
42,400
32,400
84,000
180,800
1997
24,200
44,944
34,992
88,200
192,336
1998
26,620
47,641
37,791
92,610
204,662
1999
29,282
50,499
40,814
97,241
217,836
CAGR
10.00%
6.00%
8.00%
5.00%
6.39%
Copyright © Palo Alto Software, Inc. 2002 All rights reserved. www.paloalto.com Not for reproduction, publication, or distribution.
Pg 6
Take Five Sports Bar & Grill — Sample Plan
Sa
m
pl
e
4.0 Strategy and Implementation Summary
Our strategy is based on serving our niche markets well. The sports enthusiast, the business
entertainer and traveler, the local night crowd, as well as families dining out all can enjoy the
Take Five experience.
What begins as a customized version of a standard product, tailored to the needs of a local
clientele, can become a niche product that will fill similar needs in similar markets across the
Southeast.
4.1 Marketing Strategy
Pr
o
We are building our infrastructure so that we can replicate the product, the experience, and
the environment across broader geographic lines. Concentration will be on maintaining
quality and establishing a strong identity in each local market. The identity becomes the
source of "critical mass" upon which expansion efforts are based. Not only does it add
marketing muscle but it also becomes the framework for further expansion using both
company owned and franchised store locations. Franchises will first be marketed in late 1997
or early 1998.
Bu
sin
es
sP
la
n
A combination of local media and event marketing will be utilized at each location. Radio is
most effective, followed by local print media. As soon as a concentration of stores is
established in a market, then broader media will be employed.
The strategy of live broadcasting and pro sports tie-ins has been most effective in generating
free publicity for the flagship location which has been more effective than any advertising
that could have been purchased.
4.1.1 Pricing Strategy
All menu items are moderately priced. An average customer ticket is between $10 and $20
including food and drink. Tickets are considerably larger for game day visitors. Our average
customer spends more than the industry average for moderately priced establishments. We
tend to believe that this is due to our creating an atmosphere that encourages longer stays
and more spending but still allows adequate table turns due to extended hours of appeal.
4.1.2 Promotion Strategy
We promote sports, sports, and more sports. The universal appeal of sports and sports
marketing has never been higher. A high growth area such as Anytown has an annual influx
of new residents from many other parts of the country. This trend is true in the Sunbelt in
general.
Many new residents and many existing ones are fans of teams in other markets. Take Five is
a place for all. Each patron can watch his or her game of interest. The enabling technology is
the benchmark for Take Five.
Advertising budgets and sports event promotion is an on-going process of management
geared to promote the brand name and keep Take Five at the forefront of sports theme
establishments in each local marketing area.
Copyright © Palo Alto Software, Inc. 2002 All rights reserved. www.paloalto.com Not for reproduction, publication, or distribution.
Pg 7
Take Five Sports Bar & Grill — Sample Plan
Sa
m
pl
e
In addition, funds are budgeted to launch franchise sales activity and lead generation. These
funds amount to 20% of projected franchise sales.
4.1.3 Marketing Programs
Take Five will create an "identity" oriented marketing strategy with executions particularly in
local media. Radio spots, print ads, and in-store promotions are designed for transplantation
to other markets. A portion of the ad and promo budget is set aside to develop these
programs.
4.2 Sales Strategy
Pr
o
The sales strategy is to build and open new locations on schedule in order to increase
revenue. Each individual location will continue to build its local customer base over the first
three years of operation. The goal is $3 to $5 million in annual sales per unit. A unit will be
considered mature once it has passed the $3.5 million mark in annual sales.
The following sections illustrate the combined sales forecast:
4.2.1 Sales Forecast
Bu
sin
es
sP
la
n
The following chart and table shows the rapid sales ramp-up for our first location in only its
first twelve months of operation.
The two million dollar sales volume represents somewhat less than 50% of the revenue
potential of the location.
All sales forecasts and projections have this first year as their basis for each new store.
Sales Monthly
$300,000
$250,000
$200,000
Food
Drinks
$150,000
Retail
Franchise Fees
$100,000
Other
$50,000
$0
Aug Sep Oct Nov Dec Jan Feb Mar Apr May Jun
Jul
Copyright © Palo Alto Software, Inc. 2002 All rights reserved. www.paloalto.com Not for reproduction, publication, or distribution.
Pg 8
Take Five Sports Bar & Grill — Sample Plan
Sales Forecast
Sales
Food
Drinks
Retail
Franchise Fees
Other
Total Sales
1996
$1,026,242
$998,276
$18,126
$0
$0
$2,042,644
Direct Cost of Sales
Food
Drinks
Retail
Franchise Fees
Other
Subtotal Direct Cost of Sales
1996
$349,013
$219,561
$9,064
$0
$0
$577,638
1997
$4,411,500
$4,238,500
$48,000
$500,000
$0
$9,198,000
1998
$7,497,000
$7,203,000
$84,000
$1,300,000
$0
$16,084,000
1997
$1,449,910
$932,470
$24,000
$125,000
$0
$2,531,380
1998
$2,548,980
$1,584,660
$42,000
$260,000
$0
$4,435,640
Pr
o
4.3 Milestones
Sa
m
pl
e
Table: Sales Forecast
The following table lists important milestones, with projected dates, management, and
budget responsibility. The milestone schedule indicates our emphasis on planning for
implementation.
Table: Milestones
Start Date
8/1/95
8/1/96
12/1/96
2/28/97
7/1/97
2/1/98
8/1/95
1/1/98
1/1/98
1/1/98
End Date
8/1/95
8/1/96
2/1/97
6/1/97
3/1/98
6/1/98
9/1/96
1/1/98
1/1/98
1/1/98
Bu
sin
es
sP
la
n
Milestones
Milestone
Open Medlock Bridge
Open Ashford-Dunwoody
Open Lawrenceville
Open Buckhead
Open Destin, Fla.
Open East Cobb
Private Placement
Sample
Sample
Other
Totals
Budget
$625,000
$700,000
$1,000,000
$700,000
$1,500,000
$600,000
$82,500
$0
$0
$0
$5,207,500
Manager
JDP
JDP
JDP
JDP
JDP
JDP
LC
ABC
ABC
ABC
Department
Exec
Exec
Exec
Exec
Exec
Exec
Finance
Department
Department
Department
5.0 Management Summary
At the present time Joseph Smith runs all operations for Take Five Sports Bar & Grill.
Other key personnel are the management at each location. Candidates have already been
identified for the first additional Anytown area location.
There is not expected to be any shortage of qualified and available staff and management
from local labor pools in each market area.
Copyright © Palo Alto Software, Inc. 2002 All rights reserved. www.paloalto.com Not for reproduction, publication, or distribution.
Pg 9
Take Five Sports Bar & Grill — Sample Plan
Sa
m
pl
e
5.1 Organizational Structure
Future organizational structure will include a director of store operations when store locations
exceed five and/or the Florida store opens. This will provide a supervisory level between the
executive level and the store management level.
A full time accountant has already been added. Also, a sales/marketing director has been
added to oversee the expansion effort both to support the growth of existing business and to
execute the franchise expansion strategy. Their salaries are included in the projections.
Operations of individual stores will be the responsibility of the general manager.
5.2 Management Team
Personal Data:
Pr
o
Joseph Smith
Bu
sin
es
sP
la
n
Born 11/19/53 Philadelphia, Pa.
Married 17 years--two children ages 10 & 13
Excellent Health
U.S. Air Force--1971 to 1975, Vietnam veteran, Communication Surveillance, Top Security
Clearance
Education:
LaSalle University, MBA Finance, BS, Finance
Professional Experience:
RCA/GE--1978-1988:
Finance, Strategic Planning, Corporate Development
Scientific Anytown--1988-1990:
VP Finance, Electronic Systems Group
Holiday Inn Worldwide--1990-1993:
Strategic Planning and Corporate Development, reporting to the CFO
Resigned in 1993 to open and operate Smith's Italian Restaurant
Copyright © Palo Alto Software, Inc. 2002 All rights reserved. www.paloalto.com Not for reproduction, publication, or distribution. Pg 10
Take Five Sports Bar & Grill — Sample Plan
Sa
m
pl
e
5.3 Management Team Gaps
Specific opportunities exist in the store operations supervisory area (not needed initially) and
in franchise sales development (not needed initially).
It is expected that these people can be recruited when needed in the Anytown market.
Anytown is now home to more than 40 franchise company headquarters.
Store managers are readily available when needed. Food service managers are plentiful.
5.4 Personnel Plan
Table: Personnel
Personnel Plan
1997
$2,800,000
$0
67
$2,800,000
Pr
o
1996
$484,800
$0
12
$484,800
1998
$4,850,000
$0
115
$4,850,000
Bu
sin
es
sP
la
n
Total Payroll
Other
Total People
Total Payroll
Copyright © Palo Alto Software, Inc. 2002 All rights reserved. www.paloalto.com Not for reproduction, publication, or distribution. Pg 11
Take Five Sports Bar & Grill — Sample Plan
Sa
m
pl
e
6.0 Financial Plan
The over-all financial plan for growth allows for use of the significant cash flow generated by
operations.
Equity/debt infusion of $1.5 to $2 million allows for more rapid expansion of store starts than
could be accomplished from cash flow alone. Outside investment capital also allows a buffer
of excess cash so that the expansion plan can be revised on short notice. Every opportunity
will be seized to accelerate expansion past the critical dates in this plan if cash flow from new
stores exceeds projections.
It is management's intent to build equity in the brand name and in its franchise. Other
models exists in the recent past of successful IPO's on similar concepts.
Pr
o
6.1 Important Assumptions
Bu
sin
es
sP
la
n
The financial plan depends on important assumptions, most of which are shown in the
following table. The key underlying assumptions are:
• We assume a slow-growth economy, without major recession.
• We assume access to equity capital and financing sufficient to maintain our financial
plan as shown in the tables.
• We assume the continued popularity of sports in America and the growing demand for
sports theme venues.
Table: General Assumptions
General Assumptions
Plan Month
Current Interest Rate
Long-term Interest Rate
Tax Rate
Other
Calculated Totals
Payroll Expense
New Accounts Payable
Inventory Purchase
1996
1
8.50%
0.00%
33.00%
0.00%
1997
2
8.50%
0.00%
33.00%
0.00%
1998
3
8.50%
0.00%
33.00%
0.00%
$484,800
$260,235
$579,765
$2,800,000
$3,436,506
$2,589,974
$4,850,000
$5,577,460
$4,492,750
Copyright © Palo Alto Software, Inc. 2002 All rights reserved. www.paloalto.com Not for reproduction, publication, or distribution. Pg 12
Take Five Sports Bar & Grill — Sample Plan
Sa
m
pl
e
6.2 Key Financial Indicators
The most important indicator in our case is inventory turnover. In the restaurant business
turnover exceeds 50, with product being purchased and sold often within the week.
Food costs must be kept below 32%.
Beverage costs must be kept below 21%.
Above all, controls must be instituted and maintained over multiple store locations.
Take Five now uses state-of-the-art restaurant management control and inventory systems.
All systems are computer based that allow for accurate off-premises control of all aspects of
food and beverage service business. The systems used are point-of-sale from HSI and
inventory and recipe management from VIP. Both systems are PC based and have become
industry standards.
Pr
o
Management's background in corporate finance indicates understanding of the importance of
these control systems.
Benchmarks
Bu
sin
es
sP
la
n
30.0
25.0
20.0
15.0
1993
10.0
1994
5.0
1995
0.0
1996
1997
1998
Copyright © Palo Alto Software, Inc. 2002 All rights reserved. www.paloalto.com Not for reproduction, publication, or distribution. Pg 13
Take Five Sports Bar & Grill — Sample Plan
Sa
m
pl
e
6.3 Break-even Analysis
The break even analysis is based upon fixed costs at the Medlock Bridge location. This
location exceeded required volume to break even in only its second month of operation.
At $15 per average ticket the break even volume at Medlock Bridge is attained less than one
full seating per day. The industry average is between 3 and 4 turns of seating capacity.
Break-even Analysis
$100,000
$50,000
($50,000)
($100,000)
$0
$40,000
Pr
o
$0
$80,000
$120,000
$160,000
$200,000
Bu
sin
es
sP
la
n
Monthly break-even point
Break-even point = where line intersects with 0
Table: Break-even Analysis
Break-even Analysis:
Monthly Units Break-even
Monthly Revenue Break-even
91,892
$91,892
Assumptions:
Average Per-Unit Revenue
Average Per-Unit Variable Cost
Estimated Monthly Fixed Cost
$1.00
$0.26
$68,000
Copyright © Palo Alto Software, Inc. 2002 All rights reserved. www.paloalto.com Not for reproduction, publication, or distribution. Pg 14
Take Five Sports Bar & Grill — Sample Plan
Sa
m
pl
e
6.4 Projected Profit and Loss
We project rapid expansion of sales and profits. Net profits remain above 16% of sales even
in the most aggressive expansion period.
Table: Profit and Loss
Pro Forma Profit and Loss
1996
$2,042,644
$577,638
$0
$0
-----------$577,638
$1,465,006
71.72%
Total Cost of Sales
Gross Margin
Gross Margin %
Expenses:
Payroll
Sales and Marketing and Other Expenses
Depreciation
Leased Equipment
Utilities
Insurance
Rent
Payroll Taxes
Other
Bu
sin
es
sP
la
n
Total Operating Expenses
Profit Before Interest and Taxes
Interest Expense
Taxes Incurred
Net Profit
Net Profit/Sales
Include Negative Taxes
$484,800
$69,500
$69,996
$0
$28,800
$36,000
$52,800
$58,176
$0
-----------$800,072
$664,934
$0
$219,428
$445,506
21.81%
Pr
o
Sales
Direct Cost of Sales
Production Payroll
Other
TRUE
1997
$9,198,000
$2,531,380
$0
$0
-----------$2,531,380
$6,666,620
72.48%
1998
$16,084,000
$4,435,640
$0
$0
-----------$4,435,640
$11,648,360
72.42%
$2,800,000
$4,850,000
$512,000
$860,000
$280,000
$320,000
$0
$0
$150,000
$180,000
$96,000
$125,000
$197,000
$460,000
$336,000
$582,000
$0
$0
----------------------$4,371,000
$7,377,000
$2,295,620
$4,271,360
$0
$0
$757,555
$1,409,549
$1,538,065
$2,861,811
16.72%
17.79%
TRUE
TRUE
Copyright © Palo Alto Software, Inc. 2002 All rights reserved. www.paloalto.com Not for reproduction, publication, or distribution. Pg 15
Take Five Sports Bar & Grill — Sample Plan
Sa
m
pl
e
6.5 Projected Cash Flow
We expect to manage cash flow with an additional investment totaling $1.5 to $2 million. All
additional requirements can be met from internally generated funds. With investment coming
in during late 1996 and mid 1997 there is no point at which future cash flow appears to be in
danger.
Cash
$600,000
$500,000
$400,000
$300,000
$100,000
$0
($100,000)
Pr
o
$200,000
Net Cash Flow
Jul
Bu
sin
es
sP
la
n
Aug Sep Oct Nov Dec Jan Feb Mar Apr May Jun
Cash Balance
Copyright © Palo Alto Software, Inc. 2002 All rights reserved. www.paloalto.com Not for reproduction, publication, or distribution. Pg 16
Take Five Sports Bar & Grill — Sample Plan
1996
1997
1998
$2,042,644
$0
$2,042,644
$9,198,000
$0
$9,198,000
$16,084,000
$0
$16,084,000
$0
$0
$0
$0
$0
$0
$0
$625,000
$2,667,644
$0
$0
$0
$0
$0
$0
$0
$960,000
$10,158,000
$0
$0
$0
$0
$0
$0
$0
$1,250,000
$17,334,000
1996
1997
1998
Pr
o
Sa
m
pl
e
Table: Cash Flow
Pro Forma Cash Flow
$1,269,034
$274,950
$1,543,984
$4,002,023
$3,425,038
$7,427,061
$7,381,839
$5,563,278
$12,945,117
$0
$0
$0
$0
$0
$0
$600,000
$0
$2,143,984
$0
$0
$0
$0
$0
$0
$700,000
$0
$8,127,061
$0
$0
$0
$0
$0
$0
$1,700,000
$0
$14,645,117
$523,660
$590,796
$2,030,939
$2,621,735
$2,688,883
$5,310,617
Cash Received
Cash from Operations:
Cash Sales
Cash from Receivables
Subtotal Cash from Operations
Additional Cash Received
Non Operating (Other) Income
Sales Tax, VAT, HST/GST Received
New Current Borrowing
New Other Liabilities (interest-free)
New Long-term Liabilities
Sales of Other Current Assets
Sales of Long-term Assets
New Investment Received
Subtotal Cash Received
Expenditures
Expenditures from Operations:
Cash Spending
Payment of Accounts Payable
Subtotal Spent on Operations
Bu
sin
es
sP
la
n
Additional Cash Spent
Non Operating (Other) Expense
Sales Tax, VAT, HST/GST Paid Out
Principal Repayment of Current Borrowing
Other Liabilities Principal Repayment
Long-term Liabilities Principal Repayment
Purchase Other Current Assets
Purchase Long-term Assets
Dividends
Subtotal Cash Spent
Net Cash Flow
Cash Balance
Copyright © Palo Alto Software, Inc. 2002 All rights reserved. www.paloalto.com Not for reproduction, publication, or distribution. Pg 17
Take Five Sports Bar & Grill — Sample Plan
Sa
m
pl
e
6.6 Projected Balance Sheet
As shown in the balance sheet in the table, we expect a healthy growth in net worth, from
approximately $1 million at present to more than $8 million by the end of the third year of
operations.
Table: Balance Sheet
Pro Forma Balance Sheet
Liabilities and Capital
1996
$590,796
$17,324
$17,310
$625,430
1997
$2,621,735
$75,918
$17,310
$2,714,963
1998
$5,310,617
$133,029
$17,310
$5,460,956
$1,075,495
$99,709
$975,786
$1,601,216
$1,775,495
$379,709
$1,395,786
$4,110,749
$3,475,495
$699,709
$2,775,786
$8,236,742
Pr
o
Assets
Current Assets
Cash
Inventory
Other Current Assets
Total Current Assets
Long-term Assets
Long-term Assets
Accumulated Depreciation
Total Long-term Assets
Total Assets
1996
$5,325
$0
$40,826
$46,151
1997
$16,793
$0
$40,826
$57,619
1998
$30,975
$0
$40,826
$71,801
Long-term Liabilities
Total Liabilities
$0
$46,151
$0
$57,619
$0
$71,801
$2,210,000
$305,065
$1,538,065
$4,053,130
$4,110,749
$4,053,130
$3,460,000
$1,843,130
$2,861,811
$8,164,941
$8,236,742
$8,164,941
Bu
sin
es
sP
la
n
Accounts Payable
Current Borrowing
Other Current Liabilities
Subtotal Current Liabilities
Paid-in Capital
Retained Earnings
Earnings
Total Capital
Total Liabilities and Capital
Net Worth
$1,250,000
($140,441)
$445,506
$1,555,065
$1,601,216
$1,555,065
6.7 Business Ratios
These business ratios are future estimates based upon current assumptions. Industry Ratios
are based on Standard Industry Classification code, 5813.
Copyright © Palo Alto Software, Inc. 2002 All rights reserved. www.paloalto.com Not for reproduction, publication, or distribution. Pg 18
Take Five Sports Bar & Grill — Sample Plan
Sa
m
pl
e
Table: Ratios
Ratio Analysis
1996
221.73%
1997
350.30%
1998
74.86%
Industry Profile
1.90%
Percent of Total Assets
Accounts Receivable
Inventory
Other Current Assets
Total Current Assets
Long-term Assets
Total Assets
0.00%
1.08%
1.08%
39.06%
60.94%
100.00%
0.00%
1.85%
0.42%
66.05%
33.95%
100.00%
0.00%
1.62%
0.21%
66.30%
33.70%
100.00%
4.60%
3.10%
44.60%
52.30%
47.70%
100.00%
Current Liabilities
Long-term Liabilities
Total Liabilities
Net Worth
2.55%
0.00%
0.00%
100.00%
0.99%
0.00%
0.00%
100.00%
0.50%
0.00%
0.00%
100.00%
28.20%
23.10%
51.30%
48.70%
Percent of Sales
Sales
Gross Margin
Selling, General & Administrative Expenses
Advertising Expenses
Profit Before Interest and Taxes
100.00%
71.72%
49.91%
1.64%
32.55%
100.00%
72.48%
55.76%
4.98%
24.96%
100.00%
72.42%
54.63%
4.97%
26.56%
100.00%
42.30%
23.40%
2.40%
2.80%
13.55
13.18
2.88%
42.76%
41.53%
47.12
45.80
1.40%
56.64%
55.84%
76.06
74.20
0.87%
52.31%
51.86%
1.14
0.74
51.30%
5.20%
10.60%
1995
$170,220
1996
$137,284
1997
$139,861
Industry
$32,619
69.64%
1996
21.81%
28.65%
1997
16.72%
37.95%
1998
17.79%
35.05%
0.00
0
52.00
48.87
9
1.28
0.00
0
54.30
204.64
14
2.24
0.00
0
42.46
180.07
19
1.95
n.a
n.a
n.a
n.a
0.03
1.00
0.01
1.00
0.01
1.00
n.a
n.a
$579,279
0.00
$2,657,344
0.00
$5,389,155
0.00
n.a
n.a
0.78
3%
13.18
1.31
0.00
0.45
1%
45.80
2.27
0.00
0.51
1%
74.20
1.97
0.00
n.a
n.a
n.a
n.a
n.a
Bu
sin
es
sP
la
n
Main Ratios
Current
Quick
Total Debt to Total Assets
Pre-tax Return on Net Worth
Pre-tax Return on Assets
Pr
o
Sales Growth
Business Vitality Profile
Sales per Employee
Survival Rate
Additional Ratios
Net Profit Margin
Return on Equity
Activity Ratios
Accounts Receivable Turnover
Collection Days
Inventory Turnover
Accounts Payable Turnover
Payment Days
Total Asset Turnover
Debt Ratios
Debt to Net Worth
Current Liab. to Liab.
Liquidity Ratios
Net Working Capital
Interest Coverage
Additional Ratios
Assets to Sales
Current Debt/Total Assets
Acid Test
Sales/Net Worth
Dividend Payout
n.a
n.a
n.a
Copyright © Palo Alto Software, Inc. 2002 All rights reserved. www.paloalto.com Not for reproduction, publication, or distribution. Pg 19
e
pl
Appendix Table: Sales Forecast
Sep
$64,260
$61,740
$1,000
$0
$0
$127,000
Oct
$67,473
$64,827
$1,200
$0
$0
$133,500
Nov
$77,112
$74,088
$1,200
$0
$0
$152,400
Dec
$80,325
$77,175
$1,500
$0
$0
$159,000
Direct Cost of Sales
Food
Drinks
Retail
Franchise Fees
Other
Subtotal Direct Cost of Sales
Aug
$10,924
$6,791
$0
$0
$0
$17,715
Sep
$21,848
$13,523
$500
$0
$0
$35,871
Oct
$23,033
$14,262
$600
$0
$0
$37,895
Nov
$26,218
$16,299
$600
$0
$0
$43,117
Dec
$27,310
$16,979
$750
$0
$0
$45,039
Jan
$53,633
$52,749
$720
$0
$0
$107,102
Feb
$80,450
$79,124
$1,556
$0
$0
$161,130
Mar
$89,388
$87,915
$1,729
$0
$0
$179,032
Apr
$107,266
$105,498
$2,074
$0
$0
$214,838
May
$116,205
$114,290
$2,247
$0
$0
$232,742
Jun
$125,000
$120,000
$2,400
$0
$0
$247,400
Jul
$133,000
$130,000
$2,500
$0
$0
$265,500
Feb
$27,353
$17,407
$778
$0
$0
$45,538
Mar
$30,392
$19,341
$865
$0
$0
$50,598
Apr
$36,470
$23,210
$1,037
$0
$0
$60,717
May
$39,510
$25,144
$1,124
$0
$0
$65,778
Jun
$42,500
$26,400
$1,200
$0
$0
$70,100
Jul
$45,220
$28,600
$1,250
$0
$0
$75,070
Sa
Aug
$32,130
$30,870
$0
$0
$0
$63,000
Jan
$18,235
$11,605
$360
$0
$0
$30,200
us
in
es
sP
la
n
Pr
o
Sales Forecast
Sales
Food
Drinks
Retail
Franchise Fees
Other
Total Sales
m
Appendix Take Five Sports Bar & Grill — Sample Plan
Copyright © Palo Alto Software, Inc. 2002 All rights reserved. www.paloalto.com Not for reproduction, publication, or distribution.
Pg 1
e
pl
Appendix Table: Personnel
Personnel Plan
Sep
$40,400
$0
12
$40,400
Oct
$40,400
$0
12
$40,400
Nov
$40,400
$0
12
$40,400
Dec
$40,400
$0
12
$40,400
Jan
$40,400
$0
12
$40,400
Feb
$40,400
$0
12
$40,400
Sa
Aug
$40,400
$0
12
$40,400
Mar
$40,400
$0
12
$40,400
Apr
$40,400
$0
12
$40,400
May
$40,400
$0
12
$40,400
Jun
$40,400
$0
12
$40,400
Jul
$40,400
$0
12
$40,400
us
in
es
sP
la
n
Pr
o
Total Payroll
Other
Total People
Total Payroll
m
Appendix Take Five Sports Bar & Grill — Sample Plan
Copyright © Palo Alto Software, Inc. 2002 All rights reserved. www.paloalto.com Not for reproduction, publication, or distribution.
Pg 2
e
pl
Appendix Take Five Sports Bar & Grill — Sample Plan
m
Appendix Table: General Assumptions
General Assumptions
Sep
2
8.50%
0.00%
33.00%
0.00%
Oct
3
8.50%
0.00%
33.00%
0.00%
Nov
4
8.50%
0.00%
33.00%
0.00%
Dec
5
8.50%
0.00%
33.00%
0.00%
Jan
6
8.50%
0.00%
33.00%
0.00%
Feb
7
8.50%
0.00%
33.00%
0.00%
Mar
8
8.50%
0.00%
33.00%
0.00%
Apr
9
8.50%
0.00%
33.00%
0.00%
May
10
8.50%
0.00%
33.00%
0.00%
Jun
11
8.50%
0.00%
33.00%
0.00%
Jul
12
8.50%
0.00%
33.00%
0.00%
$40,400
($431,562)
$6,606
$40,400
$57,820
$40,061
$40,400
$57,842
$38,362
$40,400
$59,870
$44,322
$40,400
$60,612
$45,483
$40,400
$54,358
$26,776
$40,400
$61,371
$49,078
$40,400
$62,824
$51,766
$40,400
$66,776
$63,052
$40,400
$68,470
$66,946
$40,400
$69,982
$71,097
$40,400
$71,873
$76,217
Sa
Aug
1
8.50%
0.00%
33.00%
0.00%
us
in
es
sP
la
n
Pr
o
Plan Month
Current Interest Rate
Long-term Interest Rate
Tax Rate
Other
Calculated Totals
Payroll Expense
New Accounts Payable
Inventory Purchase
Copyright © Palo Alto Software, Inc. 2002 All rights reserved. www.paloalto.com Not for reproduction, publication, or distribution.
Pg 3
e
pl
Appendix Table: Profit and Loss
Pro Forma Profit and Loss
Dec
$159,000
$45,039
$0
$0
-----------$45,039
$113,961
71.67%
Jan
$107,102
$30,200
$0
$0
-----------$30,200
$76,902
71.80%
$40,400
$7,000
$5,833
$0
$2,400
$3,000
$4,400
$4,848
$0
-----------$67,881
($22,596)
$0
($7,457)
($15,139)
-24.03%
$40,400
$4,500
$5,833
$0
$2,400
$3,000
$4,400
$4,848
$0
-----------$65,381
$25,748
$0
$8,497
$17,251
13.58%
$40,400
$5,000
$5,833
$0
$2,400
$3,000
$4,400
$4,848
$0
-----------$65,881
$29,724
$0
$9,809
$19,915
14.92%
$40,400
$4,500
$5,833
$0
$2,400
$3,000
$4,400
$4,848
$0
-----------$65,381
$43,902
$0
$14,488
$29,414
19.30%
$40,400
$6,000
$5,833
$0
$2,400
$3,000
$4,400
$4,848
$0
-----------$66,881
$47,080
$0
$15,536
$31,544
19.84%
$40,400
$5,500
$5,833
$0
$2,400
$3,000
$4,400
$4,848
$0
-----------$66,381
$10,521
$0
$3,472
$7,049
6.58%
Feb
$161,130
$45,538
$0
$0
-----------$45,538
$115,592
71.74%
Mar
$179,032
$50,598
$0
$0
-----------$50,598
$128,434
71.74%
Apr
$214,838
$60,717
$0
$0
-----------$60,717
$154,121
71.74%
May
$232,742
$65,778
$0
$0
-----------$65,778
$166,964
71.74%
Jun
$247,400
$70,100
$0
$0
-----------$70,100
$177,300
71.67%
Jul
$265,500
$75,070
$0
$0
-----------$75,070
$190,430
71.73%
$40,400
$5,500
$5,833
$0
$2,400
$3,000
$4,400
$4,848
$0
-----------$66,381
$49,211
$0
$16,240
$32,971
20.46%
$40,400
$6,000
$5,833
$0
$2,400
$3,000
$4,400
$4,848
$0
-----------$66,881
$61,553
$0
$20,312
$41,241
23.04%
$40,400
$6,000
$5,833
$0
$2,400
$3,000
$4,400
$4,848
$0
-----------$66,881
$87,240
$0
$28,789
$58,451
27.21%
$40,400
$6,500
$5,833
$0
$2,400
$3,000
$4,400
$4,848
$0
-----------$67,381
$99,583
$0
$32,862
$66,721
28.67%
$40,400
$6,500
$5,833
$0
$2,400
$3,000
$4,400
$4,848
$0
-----------$67,381
$109,919
$0
$36,273
$73,646
29.77%
$40,400
$6,500
$5,833
$0
$2,400
$3,000
$4,400
$4,848
$0
-----------$67,381
$123,049
$0
$40,606
$82,443
31.05%
Sa
Nov
$152,400
$43,117
$0
$0
-----------$43,117
$109,283
71.71%
us
in
es
sP
la
Total Operating Expenses
Profit Before Interest and Taxes
Interest Expense
Taxes Incurred
Net Profit
Net Profit/Sales
Include Negative Taxes
Oct
$133,500
$37,895
$0
$0
-----------$37,895
$95,605
71.61%
o
12%
Sep
$127,000
$35,871
$0
$0
-----------$35,871
$91,129
71.76%
Pr
Total Cost of Sales
Gross Margin
Gross Margin %
Expenses:
Payroll
Sales and Marketing and Other Expenses
Depreciation
Leased Equipment
Utilities
Insurance
Rent
Payroll Taxes
Other
Aug
$63,000
$17,715
$0
$0
-----------$17,715
$45,285
71.88%
n
Sales
Direct Cost of Sales
Production Payroll
Other
m
Appendix Take Five Sports Bar & Grill — Sample Plan
Copyright © Palo Alto Software, Inc. 2002 All rights reserved. www.paloalto.com Not for reproduction, publication, or distribution.
Pg 4
e
pl
Appendix Take Five Sports Bar & Grill — Sample Plan
Expenditures
Expenditures from Operations:
Cash Spending
Payment of Accounts Payable
Subtotal Spent on Operations
Jan
Feb
Mar
Apr
May
Jun
Jul
$63,000
$0
$63,000
$127,000
$0
$127,000
$133,500
$0
$133,500
$152,400
$0
$152,400
$159,000
$0
$159,000
$107,102
$0
$107,102
$161,130
$0
$161,130
$179,032
$0
$179,032
$214,838
$0
$214,838
$232,742
$0
$232,742
$247,400
$0
$247,400
$265,500
$0
$265,500
$0
$0
$0
$0
$0
$0
$0
$625,000
$688,000
$0
$0
$0
$0
$0
$0
$0
$0
$127,000
$0
$0
$0
$0
$0
$0
$0
$0
$133,500
$0
$0
$0
$0
$0
$0
$0
$0
$152,400
$0
$0
$0
$0
$0
$0
$0
$0
$159,000
$0
$0
$0
$0
$0
$0
$0
$0
$107,102
$0
$0
$0
$0
$0
$0
$0
$0
$161,130
$0
$0
$0
$0
$0
$0
$0
$0
$179,032
$0
$0
$0
$0
$0
$0
$0
$0
$214,838
$0
$0
$0
$0
$0
$0
$0
$0
$232,742
$0
$0
$0
$0
$0
$0
$0
$0
$247,400
$0
$0
$0
$0
$0
$0
$0
$0
$265,500
Aug
Sep
Oct
$492,760
($436,160)
$56,599
$50,286
$79,943
$130,229
$50,377
$57,838
$108,214
$0
$0
$0
$0
$0
$0
$600,000
$0
$656,599
$0
$0
$0
$0
$0
$0
$0
$0
$130,229
$0
$0
$0
$0
$0
$0
$0
$0
$108,214
$31,401
$98,537
Nov
Dec
Jan
Feb
Mar
Apr
May
Jun
Jul
$58,488
$59,464
$117,952
$61,455
$60,463
$121,919
$36,438
$55,608
$92,046
$64,494
$59,969
$124,462
$70,303
$62,533
$132,836
$86,113
$65,986
$152,099
$92,887
$68,131
$161,018
$98,937
$69,680
$168,616
$106,498
$71,495
$177,993
$0
$0
$0
$0
$0
$0
$0
$0
$117,952
$0
$0
$0
$0
$0
$0
$0
$0
$121,919
$0
$0
$0
$0
$0
$0
$0
$0
$92,046
$0
$0
$0
$0
$0
$0
$0
$0
$124,462
$0
$0
$0
$0
$0
$0
$0
$0
$132,836
$0
$0
$0
$0
$0
$0
$0
$0
$152,099
$0
$0
$0
$0
$0
$0
$0
$0
$161,018
$0
$0
$0
$0
$0
$0
$0
$0
$168,616
$0
$0
$0
$0
$0
$0
$0
$0
$177,993
($3,229)
$95,307
$25,286
$120,593
$34,448
$155,041
$37,081
$192,122
$15,056
$207,178
$36,668
$243,845
$46,196
$290,041
$62,739
$352,781
$71,724
$424,505
$78,784
$503,289
$87,507
$590,796
us
in
es
Net Cash Flow
Cash Balance
Sa
Dec
sP
Additional Cash Spent
Non Operating (Other) Expense
Sales Tax, VAT, HST/GST Paid Out
Principal Repayment of Current Borrowing
Other Liabilities Principal Repayment
Long-term Liabilities Principal Repayment
Purchase Other Current Assets
Purchase Long-term Assets
Dividends
Subtotal Cash Spent
Nov
o
0.00%
Oct
Pr
Additional Cash Received
Non Operating (Other) Income
Sales Tax, VAT, HST/GST Received
New Current Borrowing
New Other Liabilities (interest-free)
New Long-term Liabilities
Sales of Other Current Assets
Sales of Long-term Assets
New Investment Received
Subtotal Cash Received
Sep
n
Cash Received
Cash from Operations:
Cash Sales
Cash from Receivables
Subtotal Cash from Operations
Aug
la
Pro Forma Cash Flow
m
Appendix Table: Cash Flow
Copyright © Palo Alto Software, Inc. 2002 All rights reserved. www.paloalto.com Not for reproduction, publication, or distribution.
Pg 5
e
pl
Appendix Table: Balance Sheet
Pro Forma Balance Sheet
Aug
$98,537
$4,088
$17,310
$119,935
Sep
$95,307
$8,278
$17,310
$120,895
Oct
$120,593
$8,745
$17,310
$146,648
Nov
$155,041
$9,950
$17,310
$182,301
Dec
$192,122
$10,394
$17,310
$219,826
$475,495
$29,713
$445,782
$545,425
$1,075,495
$35,546
$1,039,949
$1,159,884
$1,075,495
$41,379
$1,034,116
$1,155,011
$1,075,495
$47,212
$1,028,283
$1,174,931
$1,075,495
$53,045
$1,022,450
$1,204,751
$1,075,495
$58,878
$1,016,617
$1,236,443
Accounts Payable
Current Borrowing
Other Current Liabilities
Subtotal Current Liabilities
$20,040
$0
$40,826
$60,866
Aug
$24,638
$0
$40,826
$65,464
Sep
$2,514
$0
$40,826
$43,340
Oct
$2,519
$0
$40,826
$43,345
Nov
$2,924
$0
$40,826
$43,750
Long-term Liabilities
Total Liabilities
$0
$60,866
$0
$65,464
$0
$43,340
$0
$43,345
$625,000
($218,401)
$77,960
$484,559
$545,425
$484,559
$1,250,000
($140,441)
($15,139)
$1,094,420
$1,159,884
$1,094,420
$1,250,000
($140,441)
$2,112
$1,111,671
$1,155,011
$1,111,671
$1,250,000
($140,441)
$22,027
$1,131,586
$1,174,931
$1,131,586
Liabilities and Capital
Feb
$243,845
$10,509
$17,310
$271,664
Mar
$290,041
$11,676
$17,310
$319,028
Apr
$352,781
$14,012
$17,310
$384,102
May
$424,505
$15,180
$17,310
$456,995
Jun
$503,289
$16,177
$17,310
$536,776
Jul
$590,796
$17,324
$17,310
$625,430
$1,075,495
$64,711
$1,010,784
$1,242,241
$1,075,495
$70,544
$1,004,951
$1,276,615
$1,075,495
$76,377
$999,118
$1,318,146
$1,075,495
$82,210
$993,285
$1,377,387
$1,075,495
$88,043
$987,452
$1,444,447
$1,075,495
$93,876
$981,619
$1,518,395
$1,075,495
$99,709
$975,786
$1,601,216
Jan
$1,822
$0
$40,826
$42,648
Feb
$3,225
$0
$40,826
$44,051
Mar
$3,515
$0
$40,826
$44,341
Apr
$4,306
$0
$40,826
$45,132
May
$4,644
$0
$40,826
$45,470
Jun
$4,947
$0
$40,826
$45,773
Jul
$5,325
$0
$40,826
$46,151
$0
$43,750
$0
$43,899
$0
$42,648
$0
$44,051
$0
$44,341
$0
$45,132
$0
$45,470
$0
$45,773
$0
$46,151
$1,250,000
($140,441)
$51,441
$1,161,000
$1,204,751
$1,161,000
$1,250,000
($140,441)
$82,985
$1,192,544
$1,236,443
$1,192,544
$1,250,000
($140,441)
$90,034
$1,199,593
$1,242,241
$1,199,593
$1,250,000
($140,441)
$123,005
$1,232,564
$1,276,615
$1,232,564
$1,250,000
($140,441)
$164,246
$1,273,805
$1,318,146
$1,273,805
$1,250,000
($140,441)
$222,697
$1,332,256
$1,377,387
$1,332,256
$1,250,000
($140,441)
$289,417
$1,398,976
$1,444,447
$1,398,976
$1,250,000
($140,441)
$363,063
$1,472,622
$1,518,395
$1,472,622
$1,250,000
($140,441)
$445,506
$1,555,065
$1,601,216
$1,555,065
n
Pr
Dec
$3,073
$0
$40,826
$43,899
us
in
es
sP
la
Paid-in Capital
Retained Earnings
Earnings
Total Capital
Total Liabilities and Capital
Net Worth
Jan
$207,178
$6,969
$17,310
$231,457
o
Starting Balances
$67,136
$15,197
$17,310
$99,643
Sa
Assets
Current Assets
Cash
Inventory
Other Current Assets
Total Current Assets
Long-term Assets
Long-term Assets
Accumulated Depreciation
Total Long-term Assets
Total Assets
m
Appendix Take Five Sports Bar & Grill — Sample Plan
Copyright © Palo Alto Software, Inc. 2002 All rights reserved. www.paloalto.com Not for reproduction, publication, or distribution.
Pg 6


© Copyright 2026