
Development Business Plan JDA 009 Fashion District Development
Development Business Plan
JDA 009
Fashion District Development
CONTENTS
Section A........................................................................................................................... 3
Development Description .............................................................................................. 3
Section B......................................................................................................................... 12
Current Situation.......................................................................................................... 12
Pre-conditions for Implementation............................................................................... 37
Risks............................................................................................................................ 37
Section C......................................................................................................................... 42
Project Structure.......................................................................................................... 42
Institutional Arrangements for Development ............................................................... 42
Transitional Mechanisms............................................................................................. 45
Post Development Institutional Arrangements ............................................................ 50
Section D......................................................................................................................... 54
Work Plan Breakdown ................................................................................................. 54
Financials .................................................................................................................... 58
Page 2 of 65
D:\20040708_Development Business Plan Rev 2_SPM.doc
Section A
1. Development Description
1.1
Location
The physical location of the Fashion District Development is to the east of the
Johannesburg central business district falling within the boundaries of Jeppe St
(northern edge), Von Weilligh St (western edge), Market St (southern edge) and
End St. (eastern edge)
Figure 1: The Physical location of the Fashion District
The Fashion District does not include the Sanlam Building (ervin 5120 and 5121).
As such the district is comprised of 26 full city blocks as well as the ervin
comprising the eastern edge of End Street.
Page 3 of 65
D:\20040708_Development Business Plan Rev 2_SPM.doc
X
1
9
2
10
3
11
4
20
19
18
17
16
15
8
23
22
21
26
25
24
12
5
13
6
14
7
Figure 2: City Blocks comprising the Fashion District
1.2 Locational Rationale
A number of considerations underpin the choice of the development’s boundaries,
these include:
Consideration of surrounding (planed and operational) CIDs, and optimal CID size.
Alignment to the SAPS sector: the Development district aligns with the southern,
eastern and western SAPS sector boundaries, but does not include the northern half
of the SAPS sector which extends to the residential area North of the district up to
Noord St.
The defined district includes much of the area that the traditional garment industry
occupied from its inception in the 1930s. This is reflected in that much of the
buildings in the area are industrial stock that was developed specifically to house the
garment industry although current usage does not on the whole reflect the original
intentions of building design.
Studies of current business usage in the area have identified a fashion cluster of
significant size within the area comprising of a mix of design, manufacturing, sales
and supply components.
Page 4 of 65
D:\20040708_Development Business Plan Rev 2_SPM.doc
End Street provides a physical boarder to the East of the District that limits
movement and therefore articulation with the Greater Ellis Park area and further East
to Jeppestown. Beyond Jeppe St to the north, the characteristics shift to that of
primarily residential use. The area beyond Market to the south does not have any
significant fashion related activity and use shifts to unrelated light industrial
commercial activity.
1.3 Broader Relationships and Articulations with Surrounding Areas
As much as the Fashion District Development has a focus within the physical
boundaries defined and justified above, it is important to acknowledge that the
economic relationships of fashion cluster are not static.
The FD certainly has a concentration of suppliers (fabric, machinery, retail display
equipment, haberdashery, specialist finishing services, and transportation providers)
as well as designers, manufactures and sales outlets. Nevertheless, there are
smaller concentrations of fashion activity in surrounding areas, of importance are the
design and manufacturing points around the Carlton Center, and Ghandi Square, the
supply outlets and manufactures in the Fordsburg area and the residentially-based
operators in Hillbrow, Berea and Yoeville. On a broader level the FD has economic
links to the fashion industry in Rosebank, Durban, Cape Town as well as with
international supply locations.
2
The intention is not to exclude the areas that fall outside the Development
boundaries, but rather to acknowledge and foster the competitive relationships,
supply links and other articulations they have with the FD, to the benefit of the subsector as a whole.
3 Goal
4
The goal of the Fashion District Development is to build a sustainable, viable,
fashionable and functional Fashion District as a hub of economic growth and jobs in
the emerging fashion cluster.
5 The Development Vision
6
The Development understands fashion as a broad concept. Although, clothing
design, production and sales form the core of the Fashion District, defining its
predominant use and character, there are a range of associated aspects of fashion
that can add to a wider mix of compatible uses and social support amenities building
an exciting, vibey and a productive area. In this regard, fashion relating to a broader
set of lifestyle choices can also find a home and support in the Fashion District,
ranging from DJ bars and restaurants to furniture, furnishings and décor. Central to
this vision has been the notion of promoting the “Urban Edge of African Fashion”,
capturing the spirit and vision of a fashion-orientated, trend-setting and outwardlooking district.
7
In meeting these challenges the Fashion District must evolve from its present status
of a relatively undifferentiated, unaffiliated and unassisted cluster of low level
operators to a dynamic fashion cluster with strong niche products, developed market
linkages.
Page 5 of 65
D:\20040708_Development Business Plan Rev 2_SPM.doc
8
A successful future will depend on significant added value being incorporated into
the value chain dependent on creative design and quality production. The district
needs to develop as a focal point, recognized by all relevant role-players and
stakeholders in the sector, both locally and beyond, as the place where one chooses
to do business. In doing so the district needs to focus on becoming synonymous
with a centre of excellence.
9 Strategy
10 To achieve the Development Goal in an integrated and sustained manner, the
development pursues the following 2 strategies:
11 To create a Fashion District that is safe, secure, attractive, functional and well
managed.
12 To maximise economic and social opportunities within the emerging fashion cluster
by addressing market failures.
13 Each development strategy will be delivered by a single or set of discrete projects.
The table below summaries these and the operating plan in the later section provides
further detail:
14 ELEMENT
16 STRATEGY 1
18
20
22
24
26
Project 1
Project 2
Project 3
Project 4
STRATEGY 2
28 Project 5
30 Project 6
15 DETAIL
17 To create a Fashion District that is safe, secure,
attractive, functional and well-managed.
19 Sustainability Fashion District Institution
21 Property
23 Urban Upgrade
25 Urban Management
27 To maximise economic and social opportunities within
the emerging fashion cluster by addressing market
failures
29 Economic
31 Marketing
32 Outcomes and Key Indicators
33 The intended outcomes for the Fashion District Development are detailed below. The
associated performance indicators are detailed in the table below.
34 A projected R50 million in direct and Indirect private sector investment
35 Business growth tracked along different points in the value chain.
36 An urban environment that affords the retainment of existing private sector
investment and is attractive to new investment.
37 Increased economic activities related to the Fashion Industry. Get emerging and
established Designers into the District.
38 Intensive management of the district coupled with by-law enforcement, elimination of
Page 6 of 65
D:\20040708_Development Business Plan Rev 2_SPM.doc
illegal and unsuitable use of properties, elimination of criminal activities, improved
service delivery and maintenance of the public environment.
39 Increased employment opportunities.
40 DPM businesses aggregated into large units (Fashion Houses) to enable scale
effects.
41 Consumer guide to the Fashion District published including only specialised SOB.
42 The Fashion District Institution will be set up and operational and will promote the
Fashion District as the strategic location for the Johannesburg fashion industry.
Page 7 of 65
D:\20040708_Development Business Plan Rev 2_SPM.doc
43 Key Performance Indicators
44 Key Indicators
45 Measure
46 Target
47 Current Progress
49 Key Economic Indicators
51 Vibrant, economically
viable urban location
attracting investment
and generating
sustainable employment
58 Property market
67 Business activity in
impact areas
52 The Fashion District
would rapidly develop
into a unique space
combining retail,
design and
production of fashion
items attracting
consumers from
many different
backgrounds
53 Sophistication and
extent of demand
59 This is measured by
these factors:
60 Vacancy rates
61 Rental levels
62 Property sales
63 Increase in
improvements to
property
64 Reduction and
stability of vacancy
rates
68 Survey businesses
established/retained.
Average value of
business assets
69 The goal is to see
this progressively
increase.
54 Reliable and higher
production
50
56 FD is relatively
undifferentiated,
unaffiliated and
unassisted cluster of low
level operators
55 Efficiency of
operations
72 Indicators Relating To Perception
48 Sco
re
65 Only 23% of buildings in
the district are considered
to be in good condition,
with 76% falling into fair or
bad categories. Only 1%
are considered to be in
excellent condition.
70 Occupancy levels are low
except for ground floor
space, landlord are not
interested in leasing upper
floor due to low-level
rentals and sufficient
holding income from
ground floor retail
57
66
71
73 Confidence in the
District
74 Every year the JDA
interviews businesses
to establish their
confidence around a
number of issues.
75 JDA’s goal is to
steadily increase
overall confidence,
and to achieve a
20% improvement by
2007.
76 Business confidence is
low due to high crime
levels and on-going
environmental and social
decay.
78 Key Indicators
79 Measure
80 Target
81 Current Progress
83 Increasing investment
84 This is measured by
new businesses
moving into the area,
coupled with
maintenance and
reuse of properties
85 The goal is to
steadily increase
investment from
quality, credible and
legitimate investors
86 The district has a high
concentration of informal
residential stock, that is to
say illegal conversion and
slum land-lording of
buildings.
Page 9 of 65
D:\20040708_Development Business Plan Rev 2_SPM.doc
77
82 Sco
re
87
88 Alignment to City of Johannesburg Policiesi ii iii iv v vi vii viii ix
89 The Fashion District Development has strong links to a number of important COJ
policy documents and processes. In June 1999 the GJMC Executive Committee
approved the Spatial and Economic Framework for the Johannesburg Inner City.
The Spatial and Economic Framework argued that the downturn in the formal
manufacturing economy must be set against the rise of a new manufacturing
economy in the inner city composed of small scale, black-owned, production
activities, where clothing manufacturing is a central activity. Moreover, the Spatial
and Economic Framework identified that although the formal sector was in decline,
the informal sector had gained ground, with clothing becoming one of the major
growth points in the economy of the inner city. For this reason the Spatial and
Economic Strategy indicated that the city should support the growth and
development of this sector.
90 Subsequently, in September 2000 the Transformation Lekgotla Committee approved
the City Centre Framework. Some of the intentions of the City Centre Framework,
amongst others, were to:
91 Create compact activity precincts
92 Establish precincts with their own predominant use and character
93 Provide urban management to within the City Centre
94 Provide social and cultural amenities, public space
95 Address historic, vacant and derelict building issues
96 The City Centre Framework identified the Fashion District as one such precinct
requiring a focused strategy addressing the issues listed above.
97 Activity Centres and Proposed City Centre Precincts
98
99 The Joburg 2030 Strategy sets out the vision and focus for action that will help the
city attain a world class city status in terms of its business environment, performance
in key economic sectors, delivering a skilled and directed labour force, improving
spatial connectivity and city functionality with the ultimate aim of improving the quality
of life of citizens equivalent to that of first world capital cities.
100
The Fashion District adds value to the strategic direction of 2030 in a number of
its key areas these include:
101
Skills development
102
Crime prevention
103
Spatial planning
104
Sectoral Development, particularly the design component of creative industries
105
SMEs and linkages
106
Likewise the project will contribute to the City of Johannesburg Vision of an
African World Class City by developing and promoting the Fashion District as “The
Urban Edge of African Fashion”.
107
Regarding city planning the Fashion District Development will add area-based
detail to the planning hierarchy that stems from the Integrated Development Plan and
the Spatial Development Framework. In this regard the Development will generate
an urban design framework for the precinct meeting requirements of the Regional
Page 11 of 65
D:\20040708_Development Business Plan Rev 2_SPM.doc
Spatial Development Framework as well as contributing to many of the core
objectives of the Local Integrated Development Plan.
108
The Inner City Regeneration Strategy and its Business Plan set the goal of
achieving raised and sustained private investment leading to a steady rise in
property values. The objectives aimed at achieving this goal, include:
109
Address sinkholes
110
Undertake intensive urban management
111
Maintain and upgrade infrastructure
112
Promotes ripple pond investment
113
Support economic sectors
114
The Fashion District Development cuts across these strategies at the precinct
level and as such has direct relevance to the Regeneration Strategy.
115
The Fashion District Development poises a challenging opportunity for the JDA, it
holds true to many of the organisational objectives, namely:
116
To create jobs.
117
To simulate development and housing opportunities in the city
118
To increase the rates base
119
To boost Johannesburg’s image as a place to live, invest and visit
120
To respond to and realise the aspirations of the whole population of
Johannesburg and to improve the quality of life and economic opportunities provided
to them.
121
The outcomes of the Inner City Fashion District Project will contribute
substantially to the attainment of the above objectives. But more than this it tackles
issues of urban regeneration, social and economic development in the context of a
marginal set of frame conditions. In this respect some of the core values of the
organisation (creativity, innovation and responsiveness) will be put to test in ensuring
that the process-driven economic rationale is translated into meaningful
improvements to the quality of social, cultural and economic life in the district.
Section B
Current Situation
Background/History
This Development is a major inner city regeneration projects that can contribute to the
outcome for the inner city, viz., the economic, social and cultural centre of the African
World Class City, by promoting both the growth and sustainability of SME’s through a redimensioning of fashion businesses to focus and shift emphasis towards design and
value added manufacturing components of the industry.
This Fashion District Business Plan follows an assessment of the JDA’s role in the
Fashion District and acknowledged the significant work that preceded the set-up of the
JDA and the subsequent transfer of the Development to its management. The
assessment identified as its central findings:
Page 12 of 65
D:\20040708_Development Business Plan Rev 2_SPM.doc
The need for JDA to be less involved in direct implementation and to play a more
supportive/enabling role, pushing delivery to the most appropriate level or institutions. In
doings so, emulating a best practice approach to Fashion District management. As such
acknowledging:
a) The need to prioritise the formation of a Fashion District Institution;
b) The need to place greater emphasis on industry (and related partner) led action;
c) The need for JDA to mobilise key partners including council departments and
agencies in related areas such as property development, housing, bad buildings,
markets;
d) The need for JDA to systematically structure its management response around a
redefined project.
Following from this, a number of recommendations were made which hinged on two
core proposals:
1) The urgent creation of an industry related Institution with a broad set of
responsibilities that go beyond a narrow urban management mandate.
2) That once created, the Fashion District Institution would takeover the ongoing
delivery of the services defined in the JDA business plan.
The business plan herewith is a continuation of this logic and thus a link backward to the
history and origins of the Development outside of the JDA.
Page 13 of 65
D:\20040708_Development Business Plan Rev 2_SPM.doc
Economic: Macro & Microx xi xii xiii xiv xv
The Fashion District Development carries a strong emphasis on the promotion of
economic development anchored on the economic activity of the organic and emerging
fashion based cluster that exists in the western section of the Inner City. Without
undermining the urban and social development components of the Development and
their links back into economic growth, this section of the business plan outlines some of
the economic rationale that underpins the development approach. As such the section
not only outlines the macro and micro economic environment but also attempts to justify
the development approach taken.
The Economics of South African Clothing Industry
The South African clothing industry has been in significant decline for more than a
decade. This decline has occurred in all the three of the major clothing production
centres of Cape Town, Durban and Johannesburg. The formal industry in Johannesburg
currently employs in the region of 6,000 people, at its peak during the 80s more than
30,000 people found work within the industry. In fact, the current employment levels are
not far off the levels recorded in the mid 1930 when the industry was still establishing
itself.
There are a number of interrelated factors contributing to the decline of the industry.
Prior to the mid 90’s South Africa’s pariah status saw it excluded from the global
economy. Economic sanctions restricted the opportunities to export and with it the
opportunities to realign production and management techniques to keep up to date with
changes in international competition and rising productivity levels. On the other hand,
the South African government adopted a highly protective tariff structure that limited the
penetration of imported clothing at the very time where the productive centres of Asia
and in particularly the Far East were aggressively reshaping the traditional supply
patterns within the world clothing markets. The ripples of change within world clothing
production and the restructuring of its markets to form the foundation of a new globally
functioning clothing commodity chain did not make their way to the protected shores of
the South Africa clothing industry which remain inwardly focused.
Adding a second degree of complexity to the competitive mix in the local clothing
industry was the impact that a concentrated, oligopolistic retail sector had on sub-sector
as a whole. South Africa had and still has one of the most concentrated clothing retail
sectors in the world with the majority of clothing retail sales being captured by a very
limited number of players such as the Edcon, Pepstores and the Foschini Groups. As
such, supply options for gaining access into the local market by manufacturers have
been and remain restricted. Exclusive supply agreements are not uncommon between
retail houses and major manufactures and in some cases retailers have opted for
backward integration taking on board their own manufacturing arms. The impact of this
has been the development of a highly controlled “buyer-driven” industry where
manufactures have had little say in pricing, quality specification, range design or fabric
selection the control of inventory or timing of deliveries.
With the advent of democracy and the inevitable integration with the global economy, the
South African industry had to simultaneously adjust to the arrival of (legally and illegally)
imported goods as well as a rapid reduction of protective tariffs. For the inflexibility and
Page 14 of 65
D:\20040708_Development Business Plan Rev 2_SPM.doc
uncompetitive local industry the impact was massive, triggering the rapid downsizing of
the industry.
The above synopsis presents only a brief review of the challenges faced by the formal
clothing industry. Lying behind these broad macro events, is a more detailed set of
economic relationships and conditions have helped or hampered the industry. It is
beyond the scope of this business plan to articulate all of these dynamics in any reliable
detail, instead following paragraphs sketch a few of the more pertinent issues.
Relative Rand strength or weakness has differing impact on particular operators within
the industry depending on the degree to which they are export orientated or focused on
serving the local market as well as to the degree to which they are dependant on local
supply of inputs such as fabric or trim or whether they are net importers. The table
below more summarises the impact of Rand strength or weakness. For the most
common form of South African clothing manufacture, that which is focused primarily on
the local market using local inputs, a strong Rand is a detrimental factor driving
increased competitive clothing imports. Likewise a week Rand is generally beneficial for
the local industry.
Local
Manufacturer
Local
Manufacturer
Local
Manufacturer
Local
Manufacturer
Market Focus
Local Market
Rand Strength
Strong Rand
Impact
Negative
Hedge Factor
Imported inputs
Local Market
Weak Rand
Positive
Local inputs
Export Market
Strong Rand
Positive
Local inputs
Export Market
Weak Rand
Negative
Imported inputs
In recent months the Rand has shown remarkable resilience, maintaining high value
after a period of dramatic gains of a very weak position at the end of 2001, beginning of
2002. This increased strength of the Rand reflects primarily Dollar weakness and gains
against the more directly competitive currencies of the major clothing production centres
are not as dramatic.
Page 15 of 65
D:\20040708_Development Business Plan Rev 2_SPM.doc
18 .1
11.9
11.3
4
M
ar
-0
2
3
M
ar
-0
M
ar
-0
M
ar
-0
1
9
US$1 = ZAR
M
ar
-0
0
8
M
ar
-9
M
ar
-9
5
10 .4
7 .4
M
ar
-9
7
5 .9
5 .5
6 .7
M
ar
-9
6
M
ar
-9
9 .8
8 .8
4
20.0
18.0
16.0
14.0
12.0
10.0
8.0
6.0
4.0
2.0
0.0
M
ar
-9
Rand
Rand Exchange Rates
GBP1 = ZAR
Additionally, Rand volatility, a defining characteristic of the currency in recent times is
generally a detrimental factor which limits forward planning, investment and as a result
growth. Reinvestment by clothing firms into new equipment is not only hampered by
exchange uncertainties but is restrained more generally as a result of the overall
uncertainty facing the industry as well as declining profits to reinvest and a cautious
banking sector that is risk adverse to investment in the clothing industry (one of the
success factor identified for the growth of clothing industry in Mauritius was the
willingness of local banks to fund expansion). The age of shop floor equipment is rising,
which suggests that limited investment into new technologies which have the potential to
enhance productivity, quality and in turn competitiveness.
As much as there is an established trend towards dropping world commodity prices there
is a growing trend of dropping of prices for certain categories of manufactured goods as
well. The integration of China into the world economy and its capacity for mass
production of manufactured good has been in part used to explain this trend. The
clothing sector is one of the sectors experiencing falling prices internationally. Not only
suffering from declining real prices, the industry has had to contend with a decline in
local demand for clothing. (See DTI table x below)
Reducing Unit Value of
Clothing Produced in SA (at
2000 constant prices)
Year
Value
1993
100
1994
96.6
1995
94.3
1996
94.2
Page 16 of 65
D:\20040708_Development Business Plan Rev 2_SPM.doc
1997
1998
1999
2000
Table x
92.9
88.9
87.4
84.6
In the more recent years the South African industry found some stability in certain niche
markets. The export sector has shown some limited growth, in particular within the US
market. Sales to the EU have declined as a whole but the UK remains relatively strong
market (see table x below). Nevertheless, export growth has typically occurred in
foreign-owned part of the sector, with the domestically-owned part of the sector
struggling to shrug of historically dependencies to come to grips with changes in the
domestic market discussed above. On the positive side, South Africa partial status (that
of Developing Country along with Mauritius rather than of Less Developed Country the
status ascribed to the rest of Africa) with respect to AGOA and the continued existence
of the DCCS have helped sustain the export market and on the negative side has been
Central Europe’s preference for supply from regionally located suppliers (Eastern
Europe, Turkey, etc).
Year
EU
1988
1990
1992
1994
1996
1998
2000
2001
Table x
66.6
58.4
44.4
47.9
46.2
40.0
26.3
19.9
Regional Breakdown of SA’s Clothing Exports (%)
UK as % of
US
AFRICA
Other
EU
Regions
43.0
8.4
14.7
10.4
45.4
9.3
16.1
16.1
46.8
5.4
14.6
35.5
46.6
37.6
9.9
4.5
66.7
31.0
15.6
7.2
81.8
41.3
10.9
7.8
80.9
57.1
9.5
7.0
80.6
64.9
8.0
7.2
Page 17 of 65
D:\20040708_Development Business Plan Rev 2_SPM.doc
Falling production (see graph below) and falling prices gained for produced good clearly
place substantial pressure on the local industry and for many the pressure was to great
to bear. Between 1990 and 2001 the number of formal business operating in the country
halved to around 650 in number (see table x below). For those firms who have managed
to survive, they have typically increase in size (employment) and shown some limited
increases in multifactor productivity levels. Labour productivity on the other hand,
particularly in the centralised production areas, has not changed significantly (see graph
below).
Clothing Production Indices (IDT)
Graph x
Year
1990
1995
1996
1997
1998
1999
2000
2001
Table x
Nationally
No. Firms
Av.
Employees
per Firm
1248
115.7
1064
125.9
1098
136.5
980
142.5
894
144.7
770
179.6
722
189.4
654
202.7
Page 18 of 65
D:\20040708_Development Business Plan Rev 2_SPM.doc
Gauteng
No. Firms
% of Total
347
268
261
239
226
201
179
171
27.8
25.2
23.8
24.4
25.3
26.1
24.8
26.1
Labour Productivity Indices (IDT)
Labour costs are kept high by bargaining Council Agreements in the central areas of
Cape Town, Durban and Johannesburg (R1320 pm - R1890pm - 2001). Decentralised
areas such as Newcastle (R386pm - R733pm - 2001), Isithebe and Ladysmith maintain
lower wage regimes as well as lower general labour standards. Nevertheless labour
standards and to a degree labour costs are higher than those of regional neighbours
such as Lesotho (Maseru R600 pm –2001), Swaziland, Mozambique, Botswana and
Namibia (see table x below).
South Africa
China
India
Swaziland
Lesotho
Mauritius
Pieces per
Operator Day
15
20
16
15
18
18
Monthly Salary (US$)
248
150
72.5
105.4
87
108
Unit Cost of
Assembly (US$)
0.75
0.34
0.21
0.32
0.22
0.27
Some factories have managed to carve out higher value added niche markets requiring
greater specialisation and production skilling. However for the majority of players, they
have opted for or have been forced to take the “low road” of low specification and mass
volume production. Increased access to the US markets has been typical in this area,
following the supply lines through international sourcing agents, which see products
eventually retailing through outlets such as supermarkets, low end retail chains and mail
order catalogues. On the upside, serving the US market has placed greater demands
on high run production and adherence to high standards of quality assurance.
Page 19 of 65
D:\20040708_Development Business Plan Rev 2_SPM.doc
In summary, the SA industry has been through a cathartic period and remains in a weak
state. Although there is an active core of producers who have managed to sustain lowend markets the prospects for significant growth will be limited in the medium term
without structural changes, new investment in productive capacity and greater support to
the industry from government. In this regard, there is a strong argument that for
government to fulfil its stated intention to create jobs through economic growth it needs
to more readily acknowledge the contribution the clothing sector makes to manufacturing
sector jobs currently (even after the downsizing of the industry) as well as to the potential
that the clothing sector has to create jobs:
“While every serious economic study show that it is cheaper to create manufacturing
jobs in the clothing sector than in any other, this has not been reflected in government
priorities”xvi
In directing policy at supporting the formal industry the following are important issues for
consideration by government and the industry itself:
•
•
•
•
•
•
Improving export responsiveness particularly among domestically owned
businesses.
Addressing the main structural constraints retarding export performance.
Improving the sectors knowledge of export market.
Improving quality assurance measures and other market disciplines that can
promote sales.
Improving productivity and overhead structures.
Addressing issues of local fabric supply in terms of the supply line, backwards
integration, design and quality (meeting AGOA requirements).
Regarding the role of city authorities, in the context of their increasing engagement in
issues of local economic development, there are a number of important ingredients that
have assisted the growth of successful fashion districts in different cities around the
world. Clearly, the interaction of supply and demand factors at the macro level is of
paramount importance albeit that they lie, on the whole, outside of the scope or influence
of most city initiatives. These factors include foreign exchange ratios, tariffs and
incentives and labour costs.
However, cities that have actively promoted clustered fashion activities, providing
support programmes and ensuring a broadly enabling environment have managed to
improve value along the chain. In this regard, city action may not determine the broad
band of potential economic output but can determine the relative placing within that
band. Furthermore, city level support leads to improved sustainability and can provide
the trigger or catalyst, which combined with macro improvements, can result in rapid and
accelerated growth.
The Economics of the Fashion District
In the heyday of the South African clothing industry, Johannesburg was a more
significant centre than either Durban or Cape Town. Rees Mann, whose family have
been engaged in the Johannesburg clothing industry for three generations, talks of the
vibrancy, bustle and endless activity that defined the early industry and the Fashion
Page 20 of 65
D:\20040708_Development Business Plan Rev 2_SPM.doc
District in particular. In its current form, the formal industry is scarce in the Fashion
District with only a few significant players located there. Nevertheless, the District still
maintains a unique character albeit within an environment that is less than satisfactory.
As the formal industry collapsed, a number of retrenched workers set-up their own
informal business choosing to locate within the district for a mixture of historical, supply
and market reasons. In conjunction with this, after 1994, an inflow of foreign nationals
with clothing and tailoring skills and South African new-entrants also congregated in and
around the district. The emergence of this new cluster of clothing based activity now
comprises a significant portion of the business activity in the area.
Clothing related businesses make up 75 percent of businesses in the area. Of these
most are engaged in sales only activities, both retailers and wholesales, supplying the
low cost mass market. Much of this clothing is imported from the Far East or else source
from the decentralised areas of production within South Africa. The secondary area of
clothing activity in the area relates to clothing manufacturing and design, which consist of
very small businesses, employing on average 5 people.
The links between small clothing businesses and remaining large-scale manufacturers in
the area are very limited and in many cases absent. Rapid growth of the clothing
industry in the Far East has been attributed in part to the supportive role SMEs played
(mainly in CMT activity) to the formal industry. However, the impact of globalisation of
the clothing commodity chain and the restructuring of international trade relations and
agreements has been to weaken these linkages to the point that clothing SMEs are no
longer an important factor in production. In Johannesburg, in the current environment
there are limited synergies that exist between the formal industry and the informal one
that could trigger stronger linkages in the future. As such, for the Fashion District with its
focus on smaller players, it would be unwise to expect the formal industry to be the driver
of growth in the area. Instead, a more realistic strategy is one that focuses on the
development of a vibrant small clothing business culture that positions itself effectively in
higher value-added, design-rich, niche markets, that require value chain specialisation
and production that focused on smaller quality runs and backed by aggressively
promoting the cluster along side a parallel process that drives the development of market
opportunities.
The JDA commissioned The Monitor Group to undertake a strategic review of the
fashion cluster in order to better understand the dynamics of the area, the nature of the
economic relationships and to identify market failures and suggest possible courses of
action to remedy them. The following paragraphs draws extensively on Monitor’s work
and their full report is included in Annexure B.
The District comprises of around 800 businesses and an addition 300 street traders. Of
the 800 businesses 69% are clothing/fashion businesses, another 14% are fashion
related and the remaining 17% are non-fashion businesses.
Page 21 of 65
D:\20040708_Development Business Plan Rev 2_SPM.doc
Focus of Businesses
NonFashion
17%
Fashion
Other
14%
Fashion
Clothing
69%
Of the combined fashion and fashion reacted businesses, 71% are sales only
businesses (SOB) and typically active in the sale of low cost garments (imported or of
decentralised-area origin) to the bottom end consumer market. The remaining 29% fit
the typology of design or production focuses businesses or mixture of the two (DPM),
3%, 15% and 11% respectively, as detailed below.
Confidential
Fashion in Fashion District
Overview
Fashion Businesses
Other
14%
Type
Other
17%
Clothing
69%
Activity
Design
3%
Production
15%
Clothing, Male
24%
DPM
29%
Clothing, Mix
25%
Occasion
Mixed
30%
Casual
37%
Mixed
11%
SOB
Clothing, Female
30%
Special
23%
Sale
71%
Work
10%
Clothing, Child
3%
Source: Monitor Survey
JDA-FSH-Workshop Summary, 19 April 2004 v3-IS
Strategic Review of Fashion Cluster
11
Copyright © 2004 Monitor Company Group, L.P. — Confidential — XXX
The fashion-orientated businesses are concentrated in the western side of the Fashion
District. See below
Page 22 of 65
D:\20040708_Development Business Plan Rev 2_SPM.doc
Confidential
BACKUP
Distribution of Fashion Businesses — Clothing and Other
21
X
15
8
2
1
11
10
9
4
3
20
19
18
17
16
26
25
24
23
22
12
5
14
13
7
6
Contribute to 80% of total
fashion businesses
Have some fashion
businesses
Each block don’t
contribute >1% to total
fashion businesses
Source: Monitor Survey
Strategic Review of Fashion Cluster
12
JDA-FSH-Workshop Summary, 19 April 2004 v3-IS
Copyright © 2004 Monitor Company Group, L.P. — Confidential — XXX
DMPs show a high degree of functional integration, as such there is little specialisation
with very few businesses focusing on single areas of expertise such as design, specialist
finishes or offering of marketing services to producers.
Confidential
DPM
Who Does What?
% of Businesses Stating that Actor Performs Function
Actors
My Customers
8
Don’t Know
5
69
5
30
56
6
7
Design
60
6
Manufacture
67
5
0
Marketing / Sales
1
37
3
1
Delivering to
Customers
Pick-up from
Suppliers
Functions
Source: Monitor Survey
JDA-FSH-Workshop Summary, 19 April 2004 v3-IS
52
5
9
Minimum actors required to
perform at least 80% of function
27
12
7
Myself / my
business
Someone Else
26
21
My Suppliers
Strategic Review of Fashion Cluster
15
Page 23 of 65
D:\20040708_Development Business Plan Rev 2_SPM.doc
Copyright © 2004 Monitor Company Group, L.P. — Confidential — XXX
Total direct employment relating fashion businesses is around 3,900 people, with
approximately 1,100 finding employment with DPM businesses (28%). The Average
DMP business employs around 5 people including the owner/s
Confidential
DPM / SOB
Employment
Number of People Economically Active in Fashion
Businesses in the Fashion District, 2004
5,000
Part Time
4,500
4,000
Full Time
Owners
3,846
357
3,500
3,000
2,770
258
2,500
2,825
2,000
1,500
2,049
1,075
1,000
99
500
776
0
200
DPM
464
664
SOB
Total
Source: Monitor Survey
JDA-FSH-Workshop Summary, 19 April 2004 v3-IS
Strategic Review of Fashion Cluster
19
Copyright © 2004 Monitor Company Group, L.P. — Confidential — XXX
For DMP businesses 55% are male and 45% female, with 81% being owned by
Previously Disadvantage People (primarily black and Asian) and 80% have local owners
and 20% foreign owners. 26% of DPM businesses are registered Closed Corporation
(CC) or are Private Limited companies (PTY LTD), the remaining 74% are sole
proprietorship, or are unregistered.
DPMs receive the majority of their supplies from within Johannesburg 67%, with 18% of
all supplies coming from within the fashion District itself. Suppliers outside of the
Gauteng were not common.
In terms of customers, DPMs reach in general higher LSM groups than SOBs, 58 % of
their customers falling in LSM categories 5, 6 and 7.
Page 24 of 65
D:\20040708_Development Business Plan Rev 2_SPM.doc
Confidential
DPM / SOB
Type of Customer
Incidence of LSM Groups
35%
31%
30%
24%
25%
20%
20%
18%
17%
15%
10%
13%
11%
10%
5%
5%
6%
SOB
DPM
17%
12%
6%
6%
4%
2%
0%
1
2
3
4
5
6
7
8
LSM Groups
Source: Monitor Survey
JDA-FSH-Workshop Summary, 19 April 2004 v3-IS
Strategic Review of Fashion Cluster
28
Copyright © 2004 Monitor Company Group, L.P. — Confidential — XXX
For all DMPs in the district, total sales turnover is estimated at R120, 000,000 per year.
60% of turnover goes towards the costs of goods sold, leaving an operating profit of 40%
or around R48, 000,000. In terms of salaries and income, for a typical employee earns
around R2500 pm month and for an employer around R4, 000. About 5% of operating
profits are re-invested into the businesses.
Business sales are highly seasonal, peaking from September to December and dipping
during January, March, June July and August. During dips sales turnover is
approximately 25% of the value during peak periods.
Page 25 of 65
D:\20040708_Development Business Plan Rev 2_SPM.doc
Confidential
DPM, Business Economics
Estimated Profit & Loss Accounts, data backup
Week
Month
individual
person
average
business
total Fashion
District
# businesses
200
# of people
turnover [Rand]
cost of goods sold
[%]
purchasing spend
[Rand]
operating profit
[rand]
staff comp. [Rand]
owner premium
[Rand]
2,500
60%
1,500
1,000
625
375
owner comp.
[Rand]
funds available for
investment [Rand]
turnover [Rand]
1,000
12,500
2,500,000
60%
cost of goods sold
[%]
1,000,000
3,125
625,000
staff comp. [Rand]
375,000
owner premium
[Rand]
250,000
owner comp.
[Rand]
funds available for
investment [Rand]
125,000
4
21
4,167
2,500
turnover [Rand]
5,000
625
600
12,500
600
2,500,000
average
business
total Fashion
District
200
# of people
operating profit
[rand]
1,875
individual
person
# businesses
1,500,000
7,500
375
600
per month
purchasing spend
[Rand]
1,250
# of products
average price per
product [Rand]
5
60%
unit of analysis
unit of analysis
unit of analysis
per week
Year
# of products
average price per
product [Rand]
turnover [Rand]
5
1,000
10,000
50,000
10,000,000
60%
60%
60%
6,000
4,000
2,500
1,500
200
# of people
turnover [Rand]
cost of goods sold
[%]
120,000
60%
5
1,000
600,000
120,000,000
60%
60%
72,000
360,000
72,000,000
20,000
4,000,000
operating profit
[rand]
48,000
240,000
48,000,000
12,500
2,500,000
staff comp. [Rand]
150,000
30,000,000
1,500,000
owner premium
[Rand]
90,000
18,000,000
1,000,000
owner comp.
[Rand]
7,500
2,500
500,000
17
83
16,667
31
total Fashion
District
# businesses
600
50,000
600
10,000,000
30,000
18,000
60,000
funds available for
investment [Rand]
# of products,
year
18,000
yearly turnover
[Rand]
12,000,000
30,000
6,000,000
1,000
200,000
600
600
600
120,000
600,000
120,000,000
200
average price per
product [Rand]
Note: Business performance heavily depends on seasonality. Above numbers reflect average performance per unit
of analysis irrespective of season.
Source: Monitor Survey
JDA-FSH-Workshop Summary, 19 April 2004 v3-IS
average
business
6,000,000
30,000
1,500
10,000
individual
person
purchasing spend
[Rand]
5,000
600
per year
Strategic Review of Fashion Cluster
Copyright © 2004 Monitor Company Group, L.P. — Confidential — XXX
One of the factors determining the level of operating profit was the degree to which the
DMPs were geared towards “factory type” production and the generation of higher
quantity runs as opposed to a more “classic” DPM that is geared to servicing individual
client. The distinctions between “classic” DPM and “factory type” bears out not only in
profitability but also in relation to other important indicators such as bulk purchase
orientated, age of equipment, number of staff, degree of formalisation and age of
businesses. It is considered that “classic” and “factory” type DPMs, form part of the
growth cycle of DMP with the latter being the mature form in terms of the business
growth cycle. See graph below.
Confidential
DPM
Business Economics, Characteristics of High [Low] Profitability
Low Profitability
(average of 20%)
High Profitability
(average of 54%)
Bulk selling
No Bulk
100% Bulk
Customers
Individuals
Businesses
Products Sold
Traditional
Casual /
Retail
Number of staff
Few
Many
# of Sewing Machines
Owned
Few
Many
Focus of Activity
Mixed
Design
Average length of staff
employed
Shorter
Longer
Average duration of having
been in business
Shorter
Longer
Hypothesis
Form of business
variables
tested but no
significant
differences
found
33
Bulk buying
“Classic DPM”
“Factory DPM”
?
Sharing machines
Breakdown of machines
• Classic DPMs develop into Factory
DPMs over time as they seek
higher profitability
• The Fashion District is poised to
develop a higher ration of Factory
DPMs over time
Strategic Review of Fashion Cluster
JDA-FSH-Workshop Summary, 19 April 2004 v3-IS
36
Copyright © 2004 Monitor Company Group, L.P. — Confidential — XXX
Nevertheless, for the majority of DMP business they are characterised at early stages in
their growth cycles. To make the shift from their current level of operation to more stable
and profitable level of operation a number of changes in key operating characteristic
may be required and are summarised in the table below:
Demand conditions
Products
Manufacturing and
distribution
Competition and Margins
DPMs Currently
Buyers unaware of products
Buyers must be convinced to
use product
Poor Quality
Many product variations
Short Production runs
Few companies
Relatively high margins
Page 27 of 65
D:\20040708_Development Business Plan Rev 2_SPM.doc
DMP Growth Potential
Widening buyer group
Consumer accepts variable
quality
Quality improvements
Technical differentiation
Shift towards higher
production runs
Entry of competitors
Highest profits
In order to make this transition it has been argued that the following three core strategies
should be promoted:
1. aggregation of capacity
2. utilization of scale effects
3. value chain differentiation.
Confidential
DPM Strategy
Supply
chain
Operations
set-up
Consumer
experience
Future?
Drive
aggregation
“Everyone buys separately”
Integrated Businesses
Integrated Businesses
Current
Different value steps
Different value steps
“Collaborative purchasing”
High costs, little choice
Reduced purchasing price
High transaction costs
Higher ability to find variety and quality
“Everyone does everything”
Low levels of learning
Low asset utilization
Aggregate
businesses into
large units to
enable scale
effects
“Unreliable, difficult to find”
“Emerging specialization”
Learning through focus
Higher value assets
“Come to town to find and buy”
Low awareness
Reliable service offering
Low levels of trust
Consistent brand positioning
Strategic Review of Fashion Cluster
JDA-FSH-Workshop Summary, 19 April 2004 v3-IS
43
Copyright © 2004 Monitor Company Group, L.P. — Confidential — XXX
Monitors study also provides important insight into the Sales only Businesses and
reinforced their relationship to the functioning of the cluster as a whole. Although strong
links and over laps where common between SOBs and DPMs they had some
commonality in theirs of their respective customers bases. Monitor identified that for
most SOBs they were in a mature point in their business lifecycles indicated by their age
and market and product focus. As such, product specialisation was seen as an area that
could promote growth within this group of companies.
In summary, the formal industry has shrunk and growth prospects remain limited. The
informal or small-scale industry in Johannesburg has shown some stability and growth.
The smaller operators in the fashion district have limited connections to the formal
industry and in some respects are less hindered in their growth potential by macro
events and concerns. This being said however, the constraints facing smaller operators
are sizable. In order to drive growth they will need to address the factors identified that
limit their current operations. In this respect the City and its partners can provide support
in driving specialisation and seeking value adding components, improving market access
and market opportunities and building group capacities in areas of purchasing, design
and production.
Page 28 of 65
D:\20040708_Development Business Plan Rev 2_SPM.doc
Social
Social development issues are not well mapped out in the district, with the exception of a
social capital study of garment producers that was undertaken in the District by BCG
Bees. This study indicated that networking and linkages are evident to a degree among
garment operators, however, these are limited in extent and further assistance will be
needed if social capital is to be built. Although some South African and immigrant
clothing producers work together, xenophobia is an issue in the district. Average
incomes of DMP workers, as detailed earlier, although fluctuating seasonally, are
reasonable and often exceed the wage agreement set for the formal industry.
Nevertheless, income levels of the most micro-entrepreneurs are marginal. For this
group in particular there is a need address the social exclusion and poverty related
issues.
As regards district residents, their situation is not well documented. Anecdotally
however, it is possible to draw a number of conclusions.
•
Given that formal residential stock (mainly in the northern section of the district) is
on the whole in poor to very poor condition, this would suggest that its occupants
are most likely low-income earners or unemployed.
•
The district has a high concentration of informal residential stock, that is to say
illegal conversion and slum land-lording of buildings. These buildings typically
poise health and safety risks. SAPS officials have report high incidents of
reported assault and other violent crime relating to these structures.
•
Given the lack of schools, public facilities, social services, public space,
recreational facilities, it can be assumed that residents suffer high levels of social
exclusion. The only social amenity that appears to be in high supply is liquor
stores and taverns. The SAPS have identified this as one of the biggest
problems within the police sector.
•
The Fashion District is home to a large immigrant population, particularly of
Mozambican origin. For many of these immigrants they are likely to be illegal
aliens. Given this fact, many are likely to experience high levels of social and
economic marginalisation. For example, business forum members have
complained to the SAPS that police from the neighbouring Jeppe station (not
their area of direct jurisdiction) were randomly arresting “illegal aliens” and
extorting bribe money for their release – although in many instance the arrests
were made of legal aliens or SA citizens.
•
Street children and vagrancy has been identified as a problem in the area, for
which no nearby facilities or services exist.
•
General crime levels in the area are high, including mugging, assault (including
domestic violence), theft of motor vehicles (including hijacking), theft out of motor
vehicles, business and residential burglary, armed robbery, drugs and
prostitution.
Page 29 of 65
D:\20040708_Development Business Plan Rev 2_SPM.doc
In concretising this component of the development it will be necessary for a more
comprehensive social audit be carried out by Region 8 social services feeding this
information back into the development cycle.
Environmentalxvii, xviii
The precinct displays characteristics common to many inner city areas facing decline
and degradation. These include:
•
•
•
•
•
•
•
•
•
•
unregulated informal traders causing congestion and contributing to crime and
grime issues, as well as undercutting ‘formal ’entrepreneurs in terms of business
and competition for space in the public realm;
formal retailers contesting pavement space;
crime perceptions and realities which discourage investment and visitors in the
area;
parking and loading problems;
general grime issues exacerbated by lack of maintenance of the public
environment, decaying infrastructure, lack of maintained and adequate street
furniture and public amenities;
illegal conversions and slum lording;
deterioration of buildings and no conservation or heritage considerations in place;
little or no green space or planting;
lack of a cohesive space, flow and movement pattern, and
buildings that are not conducive to the functional needs of practitioners in that
they are inward looking. This results in no display space opportunities and
buildings that need to be reconfigured in many instances, to be ‘turned inside
out’, so as to offer to a more meaningful public interface.
District Layout and Uses
There is a change of predominant use when moving South to North thought the district.
The southern most third of the district is characterised by retail and wholesale activities,
the central third by light industrial and commercial uses, and the most northerly third has
an increasing low-end residential component within the mix.
Page 30 of 65
D:\20040708_Development Business Plan Rev 2_SPM.doc
Actual Land Use in FD
Educational
Industrial
Cinema
Combined Primary & Secondary Land Use
Night Club
47%
Offices
53%
Primary Land Use
Secondary Land Use
Parking Structure
0%
33%
0%
25%
1%
1%
2%
1%
13%
11%
3%
0%
8%
2%
0%
0%
2%
1%
0%
11% 0%7%
11%
1%
1%
1%
11%
5%
6%
9%
0%
1%
0%
0%
0%
0%
8%
1%
2%
Parking Surface
Religious
15%
Residential Dwelling
Residential Hotel
Restaurant
7%
Retail
Vacant Land
Warehousing
Medical
The district has a natural centre around Market, Kerk, Goud, and Delvers streets. It is
also in this area and the western side of the district as a whole where better quality
building stock is located. Fashion activities predominate more often in the western
portion of the district (see economic section earlier) and in particular around Pritchard
Street.
The District is influenced by the ABSA campus to the South, The Precinct to the East,
the barrier of End Street to the West and the residential buffer zone to the north.
RESIDENTIAL
BAND
COMMERCIAL/ LIGHT
INDUSTRIAL
BAND
WHOLESALE/
RETAIL
BAND
NATURAL
DISTRICT CENTRE
Page 31 of 65
D:\20040708_Development Business Plan Rev 2_SPM.doc
There are a number of buildings with architectural significance in the district (see
(heritage graph below). Gallo house and the Synagogue amongst others have the
potential to become landmarks for the district.
Building Stockxix
Only 23% of buildings in the district are considered to be in good condition, with 76%
falling into fair or bad categories. Only 1% were considered to be in excellent condition.
Condition of FD Buildings
0%
9%
1%
23%
67%
Excellent
Good
Fair
Bad
Demolished
The lack of investment that precipitates the poor condition of building can be explained
by a number of factors:
•
•
•
•
•
•
•
•
•
•
•
•
Absence of any major property owners in the district
High concentration of absentee landlords and slum landlords
Building stock is old (50% of building have potential heritage status because of their
age)
Occupancy levels are low except for ground floor space, landlord are not interested
in leasing upper floor due to low-level rentals and sufficient holding income from
ground floor retail.
Buildings were designed for outdated manufacturing models
The COJ owns no stock in the area
Decline of the clothing industry that historically supported the property base
The relative distance from the central CBD core
Access limited by safety and legibility issues
Investment in new buildings has been closely linked with the growth and decline in
the clothing industry, as such since the 80s there has been little new building stock
developed
“Sink Hole” factors, where the concentrated presence of bad buildings limits
investment in area
Owners are not considering selling their buildings since market values are low and
revenue streams for ground floor retail provide a return that mitigates against sale.
Page 32 of 65
D:\20040708_Development Business Plan Rev 2_SPM.doc
Number of New
Buildings
Date of FD Buildings
Occupany and Vacany in the FD
10
15%
5
0
1896 1905 1924 1943 1962 1981 2000
57%
Year Built
28%
Vacant/Mothballed Buildings
Vacant Except Ground Floor
Poly. (Series1)
Hetitage Buildings in the FD
Occupied Buildings
FD Properties Advertising Space to Let
19%
50%
50%
81%
Hertiage
Advertising Space to Let
Non-Heritage
FD buildings Advertised for Sale
Not Advertising Space to Let
FD Municipal Im provem ent Values
R 15, 440, 000
R 16,000,000
R 14,000,000
3%
R 12,000,000
R 10,000,000
R 8,000,000
R 6,000,000
R 4,000,000
R 2,000,000
Highest
Not Advertised for Sale
FD Municipal Land Values
R 1,500,000
R 1,600,000
R 1,400,000
R 1,200,000
R 1,000,000
R 800,000
R 600,000
R 400,000
R 16,000
R 149,595
R 200,000
RHighest Municipal
Land Value
R 654, 973
R-
97%
Advertised for Sale
R 16, 000
Lowest Municipal
Land Value
Average Municipal
Land Value
Page 33 of 65
D:\20040708_Development Business Plan Rev 2_SPM.doc
Lowest Municipal Aver age
Municipal
Improvement
Municipal
Impr ovement
Value
Improvement
Value
Value
Parking
74% of buildings do not have parking bay provision. Furthermore, the COJ removed onstreet parking meters form the area. Vehicle related theft is also high in the district
A number of disused parking garages exist north of Kerk Street. It may however prove
problematic to incorporate these garages into the fashion core in the short term. These
garages are also not located in perceived “safe” areas. The possibility of purchasing
parking levels in other, better located, buildings seems to provide a more practical
solution. The following sites have been identified for investigation:
a.
b.
c.
d.
e.
Jeppe parking garage (Erven 1037/8 Kerk street)
Truval house (erf 4544 President street)
Indent House (erf 4646 President street)
Eplow House (erf 4789 President street)
New parking garage at fashion square.
FD Buildings with Parking Bays
26%
74%
Parking Bays
No Parking Bays
Urban Management Issues
Safety and security problems in the district (see earlier social section) are perceived as
major issues in the district. Although SAPS effort in recent times have brought about
some stability in reported crime levels (as opposed to preceding periods of increase)
many resident and users do not feel this is enough. Efforts to establish higher visibility
and closer community ties through a sector policing initiative may assist the problem,
albeit that resident have also flagged police corruption as a inhibitor to improved safety.
Lighting in the area is generally considered sufficient, however should the area develop
extended trading hours or create 24-hour use public amenities this may need to be
reviewed.
Cleaning and cleansing is considered by most residents to be problematic. The area
often appears dirty and unclean. The problem is exacerbated by the large number of
street traders and formal traders who utilise the pavement space.
Page 34 of 65
D:\20040708_Development Business Plan Rev 2_SPM.doc
Maintenance is an obvious problem in the district both within the public and private
space. The area characterised by broken and unkempt paving and curbing. Road
makings are in poor condition. Moreover private buildings are often in a bad state of
repair, requiring painting and other maintenance work.
Informal trade in the area is unmanaged and on the whole unsightly. Some provision of
trading structures has been made along Market Street. A busy Mozambican market
exists along Kerk Street as well as some interesting individual trading scattered around
the district. Retailers add to sidewalk congestion by displaying their goods illegally on
the pavements as well. In general however, street trading and retailers’ use of
pavements for the display of good add to the area’s vibrancy, but requires some thinning
down and proper management and facility provision, if it is not to remain a problem in the
area.
Public Space and Greening
There is a total absence of public open space in the district. Furthermore, there is very
little greening in the district, with no significant treed avenue.
Transport and Access
The area has good East, West and North, South access, and has reasonably close
access to the N2 and highway system. Nevertheless, routes are not well-identified
lacking signage and legibility clues, and for some users require travel through parts of
the inner city that are not considered safe (including Hillbrow). Highway access is
complicated and involves routing around the confusing road system below the flyover.
The public transport system is fairly well accessed in terms of Northerly, Easterly and
Westerly directions.
Clearly, the built environment has a number of very real problems and without diluting
the seriousness of these it is also important to acknowledge that the area has a certain
vitality and dynamic that generates excitement and is conducive to the development of a
unique experience and precinct. If the current physical and environmental shortcomings
and problems are dealt with in a flexible and sensitive manner they will support the
emergence of a secure, attractive and functional district. The reconfiguration of space
and uses within and around buildings needs to be undertaken to ensure that visitors and
practitioners alike are exposed to operators, their goods and services, in the most
accommodating and pleasant manner possible.
Stakeholder and Competitor Analysis
The JDA has no direct competitor agencies vis-à-vis the development it wishes to
undertake in the Fashion District. However, the complex nature of the development
which cuts across economic and physical development strands will bring it into contact
with a range of agencies operating in the district that will partial impact on JDA activities.
By and large, most of these agencies are already engaged in the development as
partners. There will still be a need to deepen these relationships in certain key areas.
Page 35 of 65
D:\20040708_Development Business Plan Rev 2_SPM.doc
Agency/Organisation
•
•
•
•
•
•
City of
Johannesburg:
EDU
Region 8
Johannesburg
Property Company
Metropolitan Trading
Company
Metropolitan Police
Department
Role in Fashion
District
• Project
Partners
Activity
•
•
•
•
•
•
•
•
•
•
Department of Trade
and Industry (TISA,
Ntsika)
•
•
Project
Partner
Funder
•
•
•
•
•
Central
Johannesburg
Partnership
•
Project
Partner
•
•
•
•
•
•
•
•
•
•
•
•
Service Providers;
Sew Africa
Wits Tech
BCG Bees
Department of
Labour
Clothing SETA
Raiz Style
Rosebank Design
District.
Etc
SAPS
•
Service
Providers
•
•
•
•
Project
Partner
Page 36 of 65
D:\20040708_Development Business Plan Rev 2_SPM.doc
•
•
Provision of municipal
services
Development finance –
parking meters, business
support, property
development
Project management –
property development
By law enforcement, onstreet parking management
Street trading regulation and
infrastructure provision
Periodic market support
Better buildings activity
Advisory role in Fashion
District Institution
Provision of district parking
meters
Provision of finance for
business support and market
development programme
Macro-level policy,
incentives
Strategic support
Advisory role in Fashion
District Institution
Establishment of Fashion
District Institution (including
CID portfolio)
Membership role in Fashion
District Institution
Provision of design,
production and business
training
Provision of market
development services and
incubator services
Membership role in Fashion
District Institution
Law enforcement
Sectoral Policing
Agency/Organisation
•
•
•
Funders:
Commark Trust
Others to be
identified
•
Transvaal clothing
and Textile
Bargaining Council
South African
Clothing and Textile
Union
Transvaal
Manufacturers
Association
Association of
Clothing Producers
Fashion District
Businesses
•
•
•
•
Role in Fashion
District
• Funder
• Strategic
Support
•
Interest
Groups
Activity
•
•
•
•
•
•
•
Investors
Beneficiaries
•
•
•
•
Fashion District
Property Owners
•
•
Investors
Beneficiaries
•
•
•
Funding of cluster support
activities
Strategic support
Advisory role in Fashion
District Institution
Provision of advice and
strategic support
Membership role in Fashion
District Institution
Business investment
Membership role in Fashion
District Institution
Recipients of support and
services
Property investment
Membership role in Fashion
District Institution
Recipients of support and
services
Pre-conditions for Implementation
There are no critical pre-conditions which need to be fulfilled before Development
Implementation can proceed
Risks
The following table shows the risks and mitigation measures for the development.
Page 37 of 65
D:\20040708_Development Business Plan Rev 2_SPM.doc
Risks
Consequences
Steps To Be Taken To Minimise
Risk
Risk Indicators
(Early Warnings)
Likelihood Of Risk
Happening
Financial Risks
Non-delivery of the
JPC in relation to the
property
development function
Non-provision of
parking meters would
impact moderately on
the financial viability
of the planned
parkade.
Failure of the
development to activate
private sector interest
and investment.
Delivers important
mechanisms for income
generation for the
Fashion District
Institution and have a
direct link with overall
sustainability of the
Development.
•
Finalise and secure financial
commitment from JPC
Budget approval and
Cash flows
Medium
Affect the sustainability of
the Fashion District
Institution
•
Finalise and secure financial
commitments from JMPD
Failure to secure capital
Budget from the
Council
Low
•
Failure to leverage
capital funding from the
private sector.
•
Feasibility of each project
must be clearly proven to
potential investors
Lack of involvement
from the private sector.
Medium
•
Development regarded
as a failure, which can
result in withdrawal or
reduction of capital
funding by the Council
•
Marketing strategy must
advise the development of the
target market that can bring in
the needed investment.
Page 38 of 65
D:\20040708_Development Business Plan Rev 2_SPM.doc
Risks
Consequences
Steps To Be Taken To Minimise
Risk
Risk Indicators
(Early Warnings)
Likelihood Of Risk
Happening
Financial Risks
Ability to create a
sustainable Fashion
District Institution that
has limited
dependence on
donor funding
•
Have a direct link with
overall sustainability
of the Development.
•
•
•
•
•
Page 39 of 65
D:\20040708_Development Business Plan Rev 2_SPM.doc
All the property
management stream to
come on board and
leases from JPC to the
Institution to be signed
at the forecasted
levels.
The advertising
revenue to meet 75%
percent of the amount
anticipated in the CJP
Feasibility Study.
CID cost recovery to be
at a level of at least
30% of actual costs.
property management
cost and income levels
(occupancy levels and
rental levels) to be
within forecasted
predictions
Institutional costs to be
maintained at
reasonable levels.
Dependence on
donor funding
High
Risks
Consequences
Steps To Be Taken To Minimise
Risk
Risk Indicators
(Early Warnings)
Likelihood Of Risk
Happening
Financial Risks
Delays or failure to
establish revenue
streams from
advertising are
considered to be of
highest order.
Such delays would both
raise the development
cost substantially as well
as jeopardise the
sustainability of the
institution.
The property
development and
urban upgrade
projects hinge on the
availability of
property for sale at
rates pegged at the
current municipal
land and
improvement values.
Should there be no
willing sellers or prices
required are significantly
above realistic market
expectations or
properties are not
available in terms of the
areas identified in the
Property Plan, the impact
could be serious.
Page 40 of 65
D:\20040708_Development Business Plan Rev 2_SPM.doc
As such establishing this
revenue stream is a critical
milestone for the development.
The policy mechanism
for this has been
developed and
approved by the COJ,
but as yet has not
been used in practice
High
Communicate the
development vision & goals to
target market.
Prices of property and
sales
High
Risks
Consequences
Steps To Be Taken To Minimise
Risk
Risk Indicators
(Early Warnings)
Likelihood Of Risk
Happening
Medium
Law Enforcement Risks
Resistance to
enforcement of the bylaws by property
owners who are
benefiting from the
status quo.
Continuing illegal use of
properties with properties
not utilised at their highest
and best use.
Securing support for the by-law
enforcement interventions.
Failure of the area to
attract quality
investment and
therefore further social
and economic
deterioration in the area
Failure of Law
Enforcement Agencies
to address crime and
other illegal activities
Continuous lawlessness
and illegal activities.
Increase in crime levels to
undermine the initiatives of
a safe environment.
•
Securing support and
commitments from the Inner
City Task Force, SAPS and
JMPD to provide resources
necessary to ensure
successful law enforcement
•
Some members of
SAPS and JMPD
operating in the
area lacking
credibility in the
community.
•
Ensuring an integrated and
co-ordinated approach to law
enforcement by SAPS, JMPD
and Inner City Task Force.
•
Difficulty in getting
the SAPS and
JMPD to commit
resources and
support the
development.
Page 41 of 65
D:\20040708_Development Business Plan Rev 2_SPM.doc
High
Section C
Development Structure
The Development structure is shown in the diagram below.
The Johannesburg Development Agency is the implementing agent. It takes overall
responsibility for the implementation of the development in accordance with the business
plan; including financial management, reporting against targets, deadlines and key
performance indicators; programme management and coordination; and liaison with key
stakeholder groups.
The Development Manager is appointed by the JDA and is responsible for ensuring
effective delivery of the development, its projects and components. Key tasks include:
•
•
•
•
•
•
•
•
•
•
•
•
Overall development management, including planning and programming and
change management within the programme and approving change management
within sub-projects.
Appointing of Project and Sub Project Managers and assembling the Sub Project
Teams in consultation with Project Managers.
Managing the work of Project Managers
Defining, together with the sub project teams, the responsibilities, work scope,
deliverables and targets for each sub project.
Management of interdependencies between projects.
Ensuring implementation within budget and on time for projects and sub-projects
and at agreed quality.
Monitoring and managing project and sub project progress.
Project financial management and monitoring and reviewing of sub project
budgeting and expenditure.
Monitoring and managing risk and opportunities at the development level and
which fall outside of the control of Project Managers.
Managing the resolutions of development issues and project issues that are
outside of the control of the Project Managers.
Communicating with all stakeholders.
Delivering the development objectives and deliverables on time and within
budget at agreed quality.
Institutional Arrangements for Development
The Fashion District Development has a set of evolving institutional arrangements that
are linked to the set-up and sustainability of a Fashion District Institution. The end state
of the Development assumes a functional and sustainable institution that takes over the
delivery and management of remaining core projects/objectives of the Development.
At the outset the Development (managed by the JDA) is comprised of six Projects
(managed by JDA appointed Project Managers). One of the Projects is an Institutional
Page 42 of 65
D:\20040708_Development Business Plan Rev 2_SPM.doc
Set-Up Project through which the institution is set-up and at its end point derives
“independence” from the Development and continues to pursue its organisational
objectives which are evolved from the original core Development Objectives. The
remaining of the five Projects comprise components that will, by the completion of the
institutional set-up period, migrate from the control of the appointed Project Manager to
the Institution. Coordination between the Projects is managed by a JDA Development
Manager and will include the convening of a Project Management Team.
The following diagram depicts the Institutional arrangements for the development:
Page 43 of 65
D:\20040708_Development Business Plan Rev 2_SPM.doc
Development Structure
DEVELOPMENT 009
Fashion District Development
JDA
PROJECT MANAGERS FORUM
PROJECT P1
Marketing
TBA
PROJECT P2
FD Institution Set-Up
CJP
PROJECT P3
Property Development
JPC
PROJECT P4
Urban Upgrade
JDA
PROJECT P5
Cluster Support
CJP
PROJECT P6
Urban Managment
CJP
SUB PROJECT SP1
Place Marketing
SUB PROJECT SP4
FDI Business Plan
SUB PROJECT SP10
Property Investment
SUB PROJECT SP17
Urban Design Frame.
SUB PROJECT SP21
Interim Bus Support
SUB PROJECT SP25
CID Services
SUB PROJECT SP2
Marketing Support
SUB PROJECT SP5
Legal Establishment
SUB PROJECT SP11
Business Recruitment
SUB PROJECT SP18
Fashion Sqaure
SUB PROJECT SP22
Market Development
SUB PROJECT SP26
FD House Man
SUB PROJECT SP3
Migration
SUB PROJECT SP6
MIS
SUB PROJECT SP12
Fashion House DI
SUB PROJECT SP19
Access and Traffic
SUB PROJECT SP23
Business Development
SUB PROJECT SP27
Parking Man
SUB PROJECT SP7
Staff Recruitment
SUB PROJECT SP13
Live Work Space
SUB PROJECT SP20
Pub.Envir. Upgrade
SUB PROJECT SP24
Migration
SUB PROJECT SP28
FD Sqaure Man
SUB PROJECT SP8
Interim FDI Man.
SUB PROJECT SP14
Parking Meters
SUB PROJECT SP29
Live Work Space
SUB PROJECT SP9
Migration
SUB PROJECT SP15
Parking Facility
SUB PROJECT SP30
Migration
SUB PROJECT SP16
Migration
Page 44 of 65
D:\20040708_Development Business Plan Rev 2_SPM.doc
Transitional Mechanisms
Sets of financial triggers and minimum capacity requirements, that will determine the
exact timing of the transfer of delivery from the JDA to the Institution, have been
developed. The latter, relate to the legal, managerial and operational capacity of the
Fashion District Institution, the former relate to its ability to sustain itself financially
(defined as its ability to generate sufficient income to manage its operations and deliver
a satisfactory level of services). Whereas, meeting the targets of individual ‘financial
triggers’ would allow the migration of certain functions from JDA appointed Project
Managers to the Fashion District Institution, the "minimum capacity requirement’ are all
pre-requisites that need to be met before any function can migrate to the institution. As
such, achieving the ‘minimum capacity requirements’ means that a functional institution
has been develop, but only when a critical mass of ‘financial triggers’ have been met will
the institution be both functional and sustainable.
Minimum Capacity Requirement:
1. Legal Establishment of Institution and adherence to all relevant statutory
requirements
2. Completion of a detailed Institutional Business Plan (conforming to the format
provided in Annexure X)
3. Development of a comprehensive management information system including
policies, procedures and systems.
4. The engagement of suitably skilled and experienced staff according to the
Organogram detailed on page X
Financial Triggers:
• Revenue Steam Establishment and Growth Triggers
1. Outdoor Advertising Revenue Stream Established
2. Outdoor Advertising Revenue Stream Plateau Reached
3. Fashion House Revenue Stream Established
4. Fashion House Revenue Stream Plateau Reached
5. Fashion Square Revenue Stream Established
6. Fashion Square Stream Plateau Reached
7. Fashion Parkade Revenue Stream Established
8. Fashion Parkade Revenue Stream Plateau Reached
9. Fashion Live Work Space Revenue Stream Established
10. Fashion Live Work Space Stream Plateau Reached
11. Urban Management Revenue Streams Established
12. Donor Revenue Streams Established
13. Event Management Revenue Streams Established
• Critical Revenue Levels Triggers
14. Revenue Streams exceed R10,000 pm
15. Revenue Streams exceed R145,550 pm
16. Revenue Streams exceed R195150 pm
17. Revenue Streams exceed R282,150 pm
18. Revenue Streams exceed R412150 pm
Page 45 of 65
D:\20040708_Development Business Plan Rev 2_SPM.doc
The critical revenue levels equate to the anticipated timing of the handover of core
functions and the costs associated with the delivery of that function at an acceptable
level of service provision. Trigger 18 is the threshold amount required to ensure a fully
sustainable institution at acceptable service delivery levels. The following table crossreferences the Critical Revenue Levels Triggers with anticipated functional migration:
Critical Revenue Levels Trigger
Revenue Streams exceed R10,000 pm
Associated Functional Migration
Marketing function can migrate
Revenue Streams exceed R145,550 pm
Urban management function can migrate
Revenue Streams exceed R195150 pm
Cluster support function can migrate
Revenue Streams exceed R282,150 pm
Property development & management
functions can migrate
Management and administrative functions
can be sustained
Revenue Streams exceed R412150 pm
The Gantt Chart below shows programming for the migration of functions to the Fashion
District Institution and the relationships to Development and Project processes and
capacity requirements and finical triggers.
In summary therefore the following arrangements govern the transition from a JDA
managed development to the point that a sustainable and functional institution is able to
independently deliver Development objectives:
• The institution is set up at the beginning of the development
• The institution becomes function early in the development with its legal
establishment and the appointment of staff and the development of work plans
and systems.
• Until the Institution is sustainable it will be considered to be in an Interim Stage
• During the Interim Stage the JDA (development) will carry the costs of the
Institution (staffing, operational and admin), on a decreasing basis, with
decreases linked to increases of revenue generate by the institution.
• Revenue flows (property management income, advertising, CID levies, donor
funding) established by the Development will accrue to the account of the
Institution on condition that its founding constitution, articles, governance
mechanisms and business plan align with the Fashion District Development
Objectives and requirements.
• Interim Stage funding of the Institution by the JDA will be made indirectly through
the CJP and linked to the issue of Project Management contracts with the CJP
(Fashion District Institutional Set Up Project, Urban Management Project and
Cluster Support Project).
• In turn the CJP will be obliged to contract or fund the Institution to assist in
delivery of Projects in full or part.
• The JDA will contract other Project Managers to manage the remaining
Development Projects.
• As prescribe revenue targets are achieved by the Institution, the JDA will cancel
related Project Management contracts and transfer ongoing going delivery
responsibility to the Institution paid for of its own budget.
Page 46 of 65
D:\20040708_Development Business Plan Rev 2_SPM.doc
The first Gantt Chart below presents a schematic representation for the transition of
functions from Project Manager to the Institution and the articulation of this with
contractual arrangements and income levels generated.
The second Gantt Chart shows actual transition timing as planned moving from the
Interim Stage (JDA managed) to the end state of a fully functional and sustainable
institution carrying forward the Development Objectives.
Page 47 of 65
D:\20040708_Development Business Plan Rev 2_SPM.doc
Transition of functions Programme Insert Here
Page 48 of 65
D:\20040708_Development Business Plan Rev 2_SPM.doc
Institutional Handover Programme Insert Here
Page 49 of 65
D:\20040708_Development Business Plan Rev 2_SPM.doc
Post Development Institutional Arrangements
The Fashion District Institution once set-up, functionally capacitated, financially
sustainable and fully operational will mark the exit point for the JDA from the
development.
At this point the Institution will take the form and structure discussed in the previous
section and depicted in the first two diagrams shown below.
Investment Mechanisms
Once independent from the JDA, the Institution may choose to make strategic
investment in areas such as property development that would be beneficial to the
District, or may wish to consider developing investment mechanisms to support private
investment in the District and the mitigation of private investment risk.
The third diagram in the following series depicts institutional investment arrangement
and mechanisms that might support these activities. In this regard, the principle has
been to limit direct risk within the Institution, as such the preferred mechanism would be
for the Institution to invest (in terms of surpluses as opposed to debt financed
investment) through separate investment vehicles (most likely profit making companies).
Page 50 of 65
D:\20040708_Development Business Plan Rev 2_SPM.doc
Post - Development Structure
The Fashion District Institution
PROGRAMME 1
Maketing and Cluster Support
PROGRAMME 2
Urban Managment
SUB PROGRAMME 1
Place Marketing
SUB PROGRAMME 7
CID Services
SUB PROGRAMME 2
Marketing Support
SUB PROGRAMME 8
FD House Man
SUB PROGRAMME 3
Business Recruitment
SUB PROGRAMME 9
Parking Man
SUB PROGRAMME 4
Property Investment
SUB PROGRAMME 10
FD Sqaure Man
SUB PROGRAMME 5
Market Development
SUB PROGRAMME 11
Live Work Space Man
SUB PROGRAMME 6
Business Development
Page 51 of 65
D:\20040708_Development Business Plan Rev 2_SPM.doc
PROGRAMME 3
Strategic Property Investment
Fashion District Institutional Structure
Members
Board of Directors
Advisory Committee
The Fashion District Institution
CEO
SUPPORT SERIVCES
Corportate Secretary
Accounitng, Administration
Programme P1
Marketing Cluster Support Manager
Programme 2
Urban Managment Manager
Fashion Cluster
Page 52 of 65
D:\20040708_Development Business Plan Rev 2_SPM.doc
Fashion District Institutional Investment
Mechanisms
Fashion District Institution
Private Company A, B, C
Sect 21 Company
Pty Ltd
Service Provision
Investment
Investment Company 1, 2, 3
Pty Ltd
Activities
Property Management
Services
Property Development
Fashion Cluster
Page 53 of 65
D:\20040708_Development Business Plan Rev 2_SPM.doc
Section D
Section A set out the goal, strategies and objectives for the development and briefly
detailed the projects that would be implemented to achieve them. Section B details the
history of the development and some of the rationale and feasibility work that underpins
the development approach and structure. The current section provides greater project
detail in the form of a Work Plan Break Down and set of Financials.
Work Plan Breakdown
The following tables define the scope definition for the various development elements
(development, projects, sub-projects, and components). In doing so it defines
milestones for each element and provides a budget reference to assist identify the costs
associated with delivery of each particular component. Additionally, the tables detail the
project manager for each element and the relevant implementation team and as such
the flow of accountability. Finally the tables indicate the type of JDA contract that would
apply in the case of each element.
Page 54 of 65
D:\20040708_Development Business Plan Rev 2_SPM.doc
Insert WPB tables here
Page 55 of 65
D:\20040708_Development Business Plan Rev 2_SPM.doc
The following work programme sets out the timing and relationships between the various
development elements. It is based on reasonable estimates of time, sets the overall
timeframe for the development and is the basis of detailed costing presented in the final
section.
Page 56 of 65
D:\20040708_Development Business Plan Rev 2_SPM.doc
Insert Development programme here
Page 57 of 65
D:\20040708_Development Business Plan Rev 2_SPM.doc
Financials
Budget and Cash Flow
The following section details estimates for Development related expenses and income
streams. Presentation is made in the form of a detailed cash flow projection and
budgets, that indicates:
• costs per project element, including some activity level costing.
• that indicates overall sources of funding
• that indicate the contribution planned revenue stream make to the budget
• that indicates off-budget investment by property owners as a key investment
return
• that provides detailed budget notes explaining assumptions and the basis for
calculation for each major expense and income element
In addition a summarised budget indicates which funding line and revenue sources are
expected to fund each particular set of expenses.
Budget Summary
YEAR 1
EXPENDITURE
11,440,500
P1
FD Institutional Set Up
P2
Property
1,074,000
5,691,000
P3
Urban Upgrade
2,495,000
P4
Urban Management
911,500
P5
Economic
939,000
P6
Marketing
330,000
YEAR 2
EXPENDITURE
10,085,550
P1
FD Institutional Set Up
1,345,650
P2
Property
3,666,000
P3
Urban Upgrade
2,410,000
P4
Urban Management
P5
Economic
1,550,600
P6
Marketing
190,000
TOTAL DEVELOPMENT COST
Page 58 of 65
D:\20040708_Development Business Plan Rev 2_SPM.doc
923,300
21,526,050.00
Funding and Investment Opportunities
At the time of drafting the business plan the following table details the status funding.
Funder
Amount
Budgeted
R2,000,000
Year 1
R3,000,000
Year 2
Amount
Required
R2,765,200
Year 1
R3,771,180
Year 2
JDA
R2,000,000
Year 3
R0
Year 3
JPC
R3,250,000
Year 1
R3,971,000
Year1
JPC
R0
Year 2
R230,000
Year 1
R1,966,000
Year 2
R450,000
Year 1
R210,000
Year 2
R720,000
Year 1
R720,000
Year 1
R0
Year 2
R0
Year 1
R0
Year 1
Funders
R650,000
Year 2
R0
Year 2
Private Investor
R2,300,000
R0
Year 1
JDA
JDA
EDU
EDU
City of
Johannesburg
Funders
Page 59 of 65
D:\20040708_Development Business Plan Rev 2_SPM.doc
Comments
Funding is confirmed but is short
of required amount by R765,200
Funding is budgeted but not
confirmed and is R771,180 short
of required amount
Funding is budgeted but not
confirmed and is R2, 000,000
more than required. As such
JDA is within the overall
anticipated budget but the timing
of draw down is not currently
optimal.
Funding is confirmed but is
nominally R721, 000 short,
however some of the expenses
allocated to the JHC (namely
better building are budgeted for
and would not form part of the
R3, 250,000 detailed.
Funding has not been budgeted
at this stage.
Funding is confirmed and has
been transferred to the JDA, but
is short of the required amount.
Some of the short fall can be
made up if EDU directs its
funded business service
providers to target the
businesses in the district.
Funding has not been budgeted
at this stage.
Funding has not been budgeted
at this stage.
Commark and DTI (Ntsika) are
to be requested to fund these
costs
Commark and DTI (Ntsika) are
to be requested to fund these
costs
If there is no private sector
investment the related expense
line will fall away and the budget
will re-balance. As such this line
item reflects the intended
R1,700,000
Year 2
R0
Year 2
investment geared from private
property developments.
Investment may follow a slower
time line but will also not effect
the overall balancing of the
budget.
As above.
The final table identifies how the budget is allocated to different funders and income
streams.
Page 60 of 65
D:\20040708_Development Business Plan Rev 2_SPM.doc
ACRONYMS
FD
FDI
SAPS
JDA
CID
CJP
DM
PM
EDU
CoJ
DTI
CMT
DCCS
GJMC
SOB
DMP
Fashion District
Fashion District Institution
South African Police Service
Johannesburg Development Agency
City Improvement District
Central Johannesburg Partnership
Development Manager (JDA)
Project Manager
Economic Development Unit
City of Johannesburg
Department of Trade and Industry
Cut Make Trim
Duty Credit Certificate Scheme
Greater Johannesburg Metropolitan Council
Sales Only Businesses
Design, Manufacturing or Mixed Businesses
Page 61 of 65
D:\20040708_Development Business Plan Rev 2_SPM.doc
Annexure A
Business Plan Outline
Fashion District Institution
Page 62 of 65
D:\20040708_Development Business Plan Rev 2_SPM.doc
Name
Registration
Constitutional Matters, Articles, Memorandum Association
• Distribution of income and assets
• Powers of organisation
• Structures and mechanism for governance
• Meeting rules, convening, conducting, minute taking, quorums, decisions taking
• Financial controls
• Financial year
• Constitutional changes
• Procedures for wine-up or dissolution, transfer of assets on dissolution
• Procedures for appointment and termination of members and office bearers
• Liability
• Investment provisions, guideline for the use of funds, acquiring and controlling
assets
Membership/ Shareholders/ Representation
Board of Directors
Background History
Market Analysis
Competitor Analysis
Comparative and Competitive Advantages
Vision/ Mission/ Values
Goal
Strategy
Objectives
Core competencies
Target Group/Beneficiaries
Critical Success Factors
Work Plan/ Operational Plan
• Projects
• Outputs
• Targets/ Prioritisation
• Target Group/Beneficiaries
• Critical Success Factors
• Indicators
• Baseline Data
• Risks
• Risk Amelioration
Financial Plan
• Financial Modelling
• Fundraising Strategy
• Investment Mechanisms
• 3 –5 Year Capital Budget
• 3 –5 Year Operational Budget
• Cash Flow Forecast
Page 63 of 65
D:\20040708_Development Business Plan Rev 2_SPM.doc
Management Information System (Systems Policies and Procedures)
• Operational Procedures & Systems (manual)
Organisational Structure
Staffing and technical capacity
HR Policies
• Recruitment & Selection Policy
• Condition of Employment
o Leave
• Employment Equity Policy
• Remuneration Policy
• Training & Development Policy
• Labour Relations Policy
o Staff conduct
o Disputes, Grievances, Discipline
o Sexual Harassment Policy
• Termination of Employment Policy
o Exit interview
Reporting and Accountability
Project Management System
• Financial Procedures & Systems (manual)
GAAP
Procurement Policy
• ICT System
Page 64 of 65
D:\20040708_Development Business Plan Rev 2_SPM.doc
i
Economic Development Framework of Greater Johannesburg (1999), CoJ
Inner City Spatial Framework (1999), CoJ
iii
City Centre Framework (2000), CoJ
iv
Spatial Development Framework 2003/4
v
Joburg 2030 Strategy, 2002, CoJ
vi
Integrated Development Plan, CoJ
vii
Regional Spatial Development Framework, 2002, CoJ
viii
Johannesburg Inner City Regeneration Strategy Business Plan,(2004) CoJ
ix
Johannesburg Development Agency Operations Manual, 2002
x
Institutions and Industrial Development: A Case Study of Garments and Textiles in South Africa,
D McCormick, 1999
xi
Promoting the Competitiveness of Textiles and Clothing Manufacturing in South Africa, L
Salinger, H Bhorat, D Flaherty, M Keswell, USAID, 1999
xii
DTI, Industrial Sectors Policy Support Project, Final Report Clothing Sector, University of Natal,
2002
xiii
Strategic Review of the Fashion Cluster, Cluster Report, Monitor Group, 2004
xiv
Report on Inner City Clothing Manufacturers in Johannesburg, C Rogerson, 2002
xv
South Africa and the Global Commodity Chain for Clothing: Export Performance and
Constraints, P Gibbon, Centre for Development Research, Denmark, 2002
xvi
South Africa and the Global Commodity Chain for Clothing: Export Performance and
Constraints, P Gibbon, Centre for Development Research, Denmark, 2002
xvii
Perceptions Survey Results and Goals and Vision; Fashion District 2000, CJP
xviii
Fashion District Johannesburg CBD, Preliminary Property Plan, JPC, 2004
xix
Fashion District Property Audit, JPC, 2004
ii
Page 65 of 65
D:\20040708_Development Business Plan Rev 2_SPM.doc


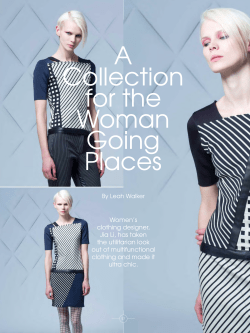


© Copyright 2026