
BP Portimão Film Studio Business Plan
Portimão Film Studio
Business Plan
03
PG.
PG.
1.
Framework...............................................................................................................................................................................................................................9
2.
Project development matrix for a film studio in Portimão – model and business plan........................................................................... 10
2.1.
Analysis of Portimão’s competitiveness vis-à-vis Europe and Rest of World................................................................................................. 10
2.2.
Rationale of the project and its position against the underlying market...................................................................................................... 12
2.3.
Opportunities and distinctive characteristics of a film studio in Portimão................................................................................................... 12
2.3.1.
Creation of business units............................................................................................................................................................................................... 13
2.3.2.
Tourism, Leisure and Entertainment............................................................................................................................................................................ 13
2.3.3.
Support infrastructures.................................................................................................................................................................................................... 13
2.3.4.
Trade in Goods and Services.......................................................................................................................................................................................... 13
2.3.5.
Analysis and proposals for corrections to national and regional dysfunction in the face of the competitive positioning of the sector.14
2.3.6.
Vectors of strategic development................................................................................................................................................................................ 14
3.
Portimão film studio.......................................................................................................................................................................................................... 15
3.1.
Business Plan........................................................................................................................................................................................................................ 15
3.2.
Legal Model.......................................................................................................................................................................................................................... 15
3.3.
Analysis by company......................................................................................................................................................................................................... 18
3.3.1.
Picture Portugal Portimão SGPS, SA............................................................................................................................................................................ 18
3.3.1.1.
Ownership and Administrative Structure.................................................................................................................................................................. 18
3.3.1.2
Social Scope.......................................................................................................................................................................................................................... 18
3.3.1.3.
Basis......................................................................................................................................................................................................................................... 19
3.3.1.4.
The new idea and its positioning in the market...................................................................................................................................................... 20
3.3.1.5.
The role of the Holding in the business model........................................................................................................................................................ 20
3.3.1.6.
Financial Projections.......................................................................................................................................................................................................... 20
3.3.1.6.1.
Income.................................................................................................................................................................................................................................... 21
Portimão Film Studio
Portimão Film Studio
Business Plan
TABLE
OF CONTENTS
Business Plan
02
PG.
PG.
3.3.1.6.2.
Costs........................................................................................................................................................................................................................................ 21
3.3.2.8.1.
Income.................................................................................................................................................................................................................................... 48
3.3.1.6.3.
Financial Projections.......................................................................................................................................................................................................... 30
3.3.2.8.2.
Costs........................................................................................................................................................................................................................................ 50
3.3.1.6.4.
Breakout of Projected Results........................................................................................................................................................................................ 31
3.3.2.8.3.
Financial Projections.......................................................................................................................................................................................................... 53
3.3.1.6.5.
Indicators............................................................................................................................................................................................................................... 32
3.3.2.8.4.
Breakout of Projected Results........................................................................................................................................................................................ 56
3.3.1.6.6.
Viability................................................................................................................................................................................................................................... 36
3.3.2.8.5.
Indicators............................................................................................................................................................................................................................... 57
3.3.1.6.7.
Management and control of the business................................................................................................................................................................ 38
3.3.2.8.6.
Viability................................................................................................................................................................................................................................... 60
3.3.1.6.8.
Necessary Investment....................................................................................................................................................................................................... 38
3.3.2.8.7.
Management and control of the business................................................................................................................................................................ 62
3.3.1.6.9.
Necessary financing and economic value................................................................................................................................................................. 39
3.3.2.8.8.
Necessary Investment Necessário................................................................................................................................................................................ 62
3.3.1.6.10. Statement of Working Capital........................................................................................................................................................................................ 40
3.3.2.8.9.
Necessary financing and economic value................................................................................................................................................................. 63
3.3.1.6.11. Statement of Cash Flows.................................................................................................................................................................................................. 41
3.3.2.8.10. Statement of Working Capital........................................................................................................................................................................................ 65
3.3.1.6.12. Sensitivity Analysis............................................................................................................................................................................................................. 44
3.3.2.8.11. Statement of Cash Flows.................................................................................................................................................................................................. 65
3.3.1.6.13. Closing Remarks.................................................................................................................................................................................................................. 45
3.3.2.8.12. Sensitivity Analysis............................................................................................................................................................................................................. 66
3.3.2.
Picture Portugal Media Park, SA.................................................................................................................................................................................... 46
3.3.2.8.13. Closing Remarks.................................................................................................................................................................................................................. 67
3.3.2.1.
Ownership and Administrative Structure.................................................................................................................................................................. 46
3.3.3.
Picture Portugal Production Services, SA.................................................................................................................................................................. 68
3.3.2.2.
Social Scope.......................................................................................................................................................................................................................... 46
3.3.3.1.
Ownership and Administrative Structure.................................................................................................................................................................. 68
3.3.2.3.
Basis......................................................................................................................................................................................................................................... 46
3.3.3.2.
Social Scope.......................................................................................................................................................................................................................... 68
3.3.2.4.
The underlying market..................................................................................................................................................................................................... 46
3.3.3.3.
Basis......................................................................................................................................................................................................................................... 69
3.3.2.5.
Business Cycle...................................................................................................................................................................................................................... 47
3.3.3.4.
The underlying Market..................................................................................................................................................................................................... 69
3.3.2.6.
Product................................................................................................................................................................................................................................... 47
3.3.3.5.
Business Cycle...................................................................................................................................................................................................................... 69
3.3.2.7.
Business Strategy................................................................................................................................................................................................................ 47
3.3.3.6.
Pruducts / Services............................................................................................................................................................................................................. 69
3.3.2.8.
Financial Projections.......................................................................................................................................................................................................... 47
3.3.3.7.
Business Strategy................................................................................................................................................................................................................ 69
Portimão Film Studio
Portimão Film Studio
Business Plan
05
Business Plan
04
PG.
PG.
3.3.3.8.
Financial Projections.......................................................................................................................................................................................................... 69
3.3.4.8.1.
Income.................................................................................................................................................................................................................................... 89
3.3.3.8.1.
Income.................................................................................................................................................................................................................................... 70
3.3.4.8.2.
Costs........................................................................................................................................................................................................................................ 90
3.3.3.8.2.
Costs........................................................................................................................................................................................................................................ 71
3.3.4.8.3.
Financial Projections.......................................................................................................................................................................................................... 97
3.3.3.8.3.
Financial Projections.......................................................................................................................................................................................................... 74
3.3.4.8.4.
Breakout of Projected Results........................................................................................................................................................................................ 98
3.3.3.8.4.
Breakout of the Projected Results................................................................................................................................................................................ 75
3.3.4.8.5.
Indicators............................................................................................................................................................................................................................... 99
3.3.3.8.5.
Indicators............................................................................................................................................................................................................................... 76
3.3.4.8.6.
Viability.................................................................................................................................................................................................................................102
3.3.3.8.6.
Viability................................................................................................................................................................................................................................... 78
3.3.4.8.7.
Management and control of the business..............................................................................................................................................................104
3.3.3.8.7.
Management and control of the business................................................................................................................................................................ 80
3.3.4.8.8.
Necessary Investment.....................................................................................................................................................................................................105
3.3.3.8.8.
Investimento necessário.................................................................................................................................................................................................. 80
3.3.4.8.9.
Necessary financing and economic value...............................................................................................................................................................105
3.3.3.8.9.
Necessary financing and economic value................................................................................................................................................................. 81
3.3.4.8.10. Statement of Working Capital......................................................................................................................................................................................107
3.3.3.8.10. Statement of Working Capital........................................................................................................................................................................................ 82
3.3.4.8.11. Statement of Cash Flows................................................................................................................................................................................................108
3.3.3.8.11. Statement of Cash Flows.................................................................................................................................................................................................. 83
3.3.4.8.12. Sensitivity Analysis...........................................................................................................................................................................................................109
3.3.3.8.12. Sensitivity Analysis............................................................................................................................................................................................................. 84
3.3.4.8.13. Closing Remarks................................................................................................................................................................................................................110
3.3.3.8.13. Closing Remarks.................................................................................................................................................................................................................. 85
4.
Action plan for the attraction of investment and potential clients................................................................................................................112
3.3.4.
Picture Portugal Media Fund, SA.................................................................................................................................................................................. 86
5.
Contingency plan and risk evaluation......................................................................................................................................................................113
3.3.4.1.
Ownership and Administrative Structure.................................................................................................................................................................. 86
6.
Conclusions and recommendations..........................................................................................................................................................................114
3.3.4.2.
Social Scope.......................................................................................................................................................................................................................... 86
7.
Preliminary Architectural Study..................................................................................................................................................................................114
3.3.4.3.
Basis......................................................................................................................................................................................................................................... 86
3.3.4.4.
The underlying market..................................................................................................................................................................................................... 87
3.3.4.5.
Business Cycle...................................................................................................................................................................................................................... 87
3.3.4.6.
Product................................................................................................................................................................................................................................... 87
3.3.4.7.
Business Strategy................................................................................................................................................................................................................ 88
3.3.4.8.
Financial Projections.......................................................................................................................................................................................................... 89
Portimão Film Studio
Portimão Film Studio
Business Plan
07
Business Plan
06
Framework
Business Plan
PG.
1.
09
PG.
Business Plan
08
This plan began with a survey of the global film industry
and with the decision to build a film studio in Portimão.
This Business Plan, coupled with the previous architectural
study, will serve as a clear and structured business route
for investors and executives over a period of 7 years.
This Business Plan serves to set the foundation for the
creation of a film studio in Portimão and to reach the
proposed objectives, namely:
Outline the model and business plan for the development
of film cluster in Portugal with its center in Portimão.
- Define from a previous and functional studio an
architectural project
- Project the financial investment and feasibility study
- Define the financial strategy of the project
- Define strategy for garnering investments and potential
clients
Throughout the process, each of the countries, work
spaces, and offers within the sector (studios) were visited
and used to guide adjustments to concepts and optimize
solutions.
Portimão Film Studio
Portimão Film Studio
Presently, Portugal finds itself challenged to alter its
development model. This proposed enterprise answers
that challenge. It creates a cluster of companies whose
activity is highly exportable (100%); it creates hundreds
of jobs, directly and indirectly; helps right the balance
of payments; promotes the country internationally; and
stimulates the economy, which finds itself weathering a
crisis.
Project development
matrix for a film studio
in Portimão – model
and business plan
PG.
• The region has proven itself a place of reference in the
organization and hosting of events;
• Ease of interaction and strong language fluency - being
a tourist region, and even in its cultural makeup, it is
recognized that the Portuguese communicate easily with
other peoples and cultures, especially in English;
• Diversity of scenery and conditions for film locations;
2.1.
Analysis of Portimão’s competitiveness
vis-à-vis Europe and Rest of World
The following is a SWOT analysis of Portugal in general,
and the Algarve and Portimão in particular, so as to
understand the prospects and limits of this region to grow
and compete internationally in this sector’s global supply
chain.
With this analysis we will seek to answer any questions as
to what is Portugal’s present competitiveness in the film
sector in European and International contexts, and to draw
attention to the types of existing opportunities to attract
clients, and within what markets, so as to direct efforts in
promoting the country.
Strengths
This perspective on this item centered itself on an analysis
of internal factors, including resources endogenous to
Portugal and which distinguish it from competitors in the
market:
• Portugal’s branding in the world as hospitable, safe, with
good food, natural resources, diversified geography, and a
rich historic and cultural heritage reinforce it’s appeal;
• Heritage, cultural and historic traditions of the region;
Portimão Film Studio
011
• Scenic natural heritage providing spaces for leisure and
locations for productions requiring beach, sea, rivers,
mountains and forest scenery;
• Stable social and economic situation, stable politically,
community framework, security;
• Conditions conducive to carefree enjoyment of nature
and the public space;
• Skill labor at competitive prices.
Weaknesses
Principal weaknesses to note:
• Insufficient skilled technical labor in the movie business
to service a large number of simultaneous productions;
• Increased labor mobility and salary levels in other
markets encourage the exit of some competencies;
• Positioning to attract high-end business tourism lacking;
• Financial system’s development somewhat below ideal in
terms of adequate and specific financing for the needs of
the sector;
• No financial incentives policy to attract investment in the
sector;
Opportunities
Nationally and internationally, more concretely in terms
of the global economy, the film and audiovisual industries
represent a window of opportunity for investing along
its value chain. Let us explore, then, the principal
opportunities found:
• The flow of tourists generated by the business presents
an opportunity to the firms in the service areas of tourism,
leisure and entertainment;
• Environment of entertainment and leisure – as with any
industry, the opportunity to join leisure and entertainment
with work weighs on the selection of a destination.
Therefore it is essential to provide nearby the necessary
amenities – lodging and leisure to those that visit us –
parks, casinos, marinas, etc.;
• Access to capital and the fiscal environment – this
picture would not be complete without a financial
incentives structure and access to sources of financing for
productions – banks, venture investment capital, or other;
• Being that this is a leading edge sector in terms of
the technologies it employs in production and postproduction, above all dependent on the digital economy,
and considering that Portugal has the relevant scientific,
academic and entrepreneurial competencies, there is a
clear opportunity for players in this industry to take full
advantage, whether it be with regard to qualified human
resources or scientific/technical know-how across various
areas;
• Portugal is not positioned as a center of excellence at the
international level in the production contents for film;
• Cooperation between the scientific and entrepreneurial
sectors, facilitating the transfer of knowledge and the
introduction of new practices and innovations in the film
and audiovisual industries, principally in terms of media;
• Reduced scale of the national firms in the film and
audiovisual sector, and lacking in management expertise,
primarily with regard to establishing relationships and
habits of cooperation and networking;
• Economic and political environment favorable to the
creation of new businesses, training of human resources,
and job creation from development and settling of said
new businesses;;
• Added difficulties in cooperation (public-public, publicprivate, private-private) due to lack of actors and lack of a
culture of cooperation;
• Regional policy framework for social and economic
development;
• Internationally, the film and audiovisual sectors continue
to enjoy sustained growth – they are among the sectors
that suffer least from the situations of crisis and global
recession;
• Significant upgrading of vocational and technical
education, which has enabled greater and more qualified
supply in the labor-intensive service personnel market,
with competencies that help them progress in business
and compete with peers on an international level.
Business Plan
Business Plan
PG.
2.
Threats
The principle threats found:
• Appreciation of the Euro versus the USD could dissuade
American producers;
• Competition from other European countries with more
favorable fiscal incentive policies, and with banking
systems more developed when it comes to setting up the
financial operations specific to the sector, due to the lack
of previous experiences;
• Lack of competitiveness in terms of the production of
goods and transactional services, in comparison with other
countries, especially eastern European;
• Increased taxes on businesses as a way to reduce the
national budget deficit;
• Lack of strategic vision on the part of politicians as to the
advantages of creating fiscal incentive favorable to the
attraction of foreign investment in the sector.
• Creation of new clusters to attract foreign investment in
emerging business areas;
• Good access nationally and internationally, with proximity
to international airports (Faro, Lisbon, Madrid, London);
• Creation of fiscal policy favorable to hosting productions
in-country;
Portimão Film Studio
010
PG.
PG.
Business Plan
013
Business Plan
012
2.3.
Rationale of the project and its position
against the underlying market
Opportunities and distinctive
characteristics of a film studio in
Portimão
The target market of the project is cinema with global
projection, productions which would not seem “foreign”
to the major American movie studios. The studio’s direct
clients would be the Majors and their subsidiaries as
outlined in the table below.
Opportunities
Distinguishing Characteristics
The greatest opportunity presented by a film studio
in Portimão is to offer a safe and economical harbor in
Europe to the American Majors, close to the United States
and with an ensemble of extremely attractive attributes.
Holding
Divison
Subsidiary
Time Warner
Warner Bros. Entertainment
Group, HBO
Warner Bros. Pictures
New Line Cinema, HBO Films, Castle Rock
Entertainment, T urner Entertainment,
W arner Bros. A nimation
Viacom
Paramount Moon Picture
Group
Sony Pictures
Fox Filmed Entertainment
Paramount Pictures
Nickelodeon Movies, MTV Films
Paramount Vantage
Columbia Pictures
20th Century Fox
Sony Pictures Animaon
Sony Pictures Classics
Fox SearchLight
NBC Universal
universal Studios
Universal Animaon Studios
Focus Features
Walt Disney Moon Pictures
Group
W alt Disney Pictures/T ouchstone
Pictures
Pixar A nimation Studios, W alt Disney
A nimation Studios, Disneynature
Miramax Films
Sony
News
Corporaon
General
Electric/
Vivendi
The Walt
Disney
Company
Others Mainstream Subsidiarys
20th Century Fox A nimation, Fox Faith,
New Regency
From an analysis of the above table we see that the firms
listed above hold, directly or indirectly, 80% of the US and
Canadian markets, and about 70% of the global market, in
terms of revenue.
Portimão Film Studio
2.3.1. Creation of business units
ArtHouse / Indie Subsidiaries
EUA + CAN % Market
The principle characteristic distinguishing it from other
studios is the possibility of the studio itself investing
in the production of the films. Furthermore, this
investment will immediately generate revenue for the
other businesses in the group. Another characteristic
is the existence of experience and work dynamics
on a global scale, as is the case with the Africa race,
Portimão Ocean race, Autódromo Internacional do
Algarve (Algarve International Speedway), etc.
The fact that it intends to position itself as an
international reference in the executive production of
films, based on providing outsourcing services to meet
below the line production needs, is a distinguishing
factor in relation to international supply.
In the main building, we conceive to create a ensemble of
businesses, developing an incubator of creative industries
of the Algarve. These business units will be primarily
directed toward providing the necessary cinematographic
production services and advertisement, but will also create
a dynamic audiovisual market.
2.3.2. Tourism, Leisure and Entertainment
The existing tourist industry will adapt and optimize itself
to this new investment, creating the necessary conditions
to accommodate its particular, specialized and nonseasonal needs. The existing hospitality firms will need to
undergo a significant qualitative evolution. (For example:
Brad Pitt does not presently have in Portimão a hotel
meeting his likely requirements. If he were to stay 20km
away, he would have to ferry back and forth by helicopter)
2008
2007
2004
18,4
14,7
17,7
16,4
13,2
15,5
12,9
6,8
16,8
12,7
11,9
11,7
12,4
12,2
10,8
The city of Portimão and the government should
undertake the necessary series of investments to
accommodate this new sector of activity and its respective
needs, as well as developing the necessary flexibility to
eliminate barriers to filming (for example: filming the
bridge 25 de Abril)
10,5
15,3
16,5
2.3.4. Trade in Goods and Services
The global crisis and serious security concerns led to the
inception of this project and now draw the attention of the
Majors.
This is an “interested party” positioning throughout all
stages of cinematographic production.
2.3.3. Support infrastructures
A film involves at least 200 people during a period of
6 months. Their demand will promote new business
adapted to the new reality in the areas around the studio,
in the city, and in the studios.
Novelty factor.
Business model.
The functional characteristics of the studio place it among
the best and most complete in the world in terms of its
infrastructures.
Portimão Film Studio
2.2.
014
015
PG.
PG.
Creation of a business angel’s fund for cinematographic
co-productions with the Holding.
Creation of an association for the promotion of film in
Portimão between the private and public agents, with
equal contribution to an associative private-public fund.
2.3.6. Vectors of strategic development
After exhaustive diagnostic work of the various contexts as
well as international analysis, the result is a development
matrix that lays clear that, though seemingly obvious - and
presenting a challenge to a future management team –
the establishment of the project Picture Portugal. The
strategic vectors are the following.
Geostrategic positioning – Portugal enjoys a position in
the world which makes it attractive in the scope of global
logistics to Portuguese-speaking countries, particularly
Brazil, enjoying a climate not found in eastern European
countries nor England; its Atlantic front (sometimes
forgotten after ascension to the European Union); and
Lisbon being the European capital closest to the United
States, being about as far from New York as Los Angeles.
To all this, and being that to the movie industry access
to exterior locations is fundamental in the film location
selection process, Portugal concentrates an area about
the size of New Jersey the geography of 40 US states. The
Algarve and Portimão provide the necessary logistics for
this sort of an operation.
Portimão Film Studio
Context Costs – Despite the financial costs of a production
in Portugal, similar to other countries and at times
negative, from the point of view of Human Resources,
technical needs, lodging, meals, transportation costs,
insurance, marketing, etc., we are today extremely
competitive, able to reduce American budgets by 50% or
those of Eastern European countries by 20%.
Business Model – For this point, we contemplated
what could be the true competitive advantage and
distinguishing factor. The businesses to be created could
Human Resources and technicians – Portugal has excellent
human resources and in the necessary quantity to start
this operation, as well as the necessary equipment for
production. What it doesn’t have is a Media Park, with
the necessary technical conditions, where one could a
host high-quality production of film, video clips, and
video games. Portimão and the Algarve would house
the main section of the Media Park’s equipment, with
complementary sections in Lisbon and Porto. Portimão’s
Media Park will have 5 sound stages, a small backlot, a
water tank, offices for 50 businesses, and a small cinema
for projections and television programs, a restaurant, two
stores, workshops and a props and lighting warehouse.
The Media Park will be located near downtown and the
pavilion Arena de Portimão. A large backlot should be
built in Mexilhoreira with lots of empty space for various
constructions (Pyramids of Egypt, Torre Eiffel, Times
Square, Shinjuko Cross road, etc).
3.
Portimão film studio
Business Plan
It is urgent to promote the signing of a protocol with the
United States for cinematographic production and the
creation of a system of tax incentives and tax rebates. It is
urgent to reduce context costs.
completely close the film business cycle. The fund should
invest and place itself as a local facilitator to optimize the
incentives and supports, receiving in return part or the
totality of the property of the films to produce. A producer
with that such investments would assure itself of sufficient
activity to go to market, and Media Park would then have
its clients secured. If a fund in the amount of 30 million
Euros is created, that means there would be sufficient work
to sustain the business until at least 2016. No other film
studio in the world, save for the major American studios,
has in place this business model. This activity is highly
exportable and helps right the balance of payments, as
well as promoting venture capital in Portugal.
3.1.
3.2.
Business Plan
Legal Model
The first premise to keep in mind is that this is a capitalintensive business with high margins without operating
costs and high revenue in time.
We intend to establish the initial boundaries and
concepts which allow for the definition of the statues and
shareholder agreements should this be the business model
adopted, and should this be the entrepreneurial structure
adopted.
Creating a film studio alone and and attempting to place
it in the global market would produce an empty studio. It
is necessary to have a model that would give it dynamism,
recognition, and international positioning.
We propose the creation of a holding with 35.000.000€ in
capital.
The holding would create three companies.
A fund that would finance and hold the rights to up
to 100% of the produced films. Each film would be a
company owned by the fund. This fund would help attract
American productions to Portugal, in conjunction with
the favorable endogenous factors of the country, human
resources and the film studio.
A condominium manager and a production company will
also be created. These two companies will have, with the
productions financed by the fund alone, their viability
guaranteed for each one can work exclusively for the
various films to be produced and have high profitability, as
shown by the financial projections.
The holding will have land free of onus on which to
build the studios, land that will serve as collateral for
a construction company or another to build upon and
contract out the architectural project to be developed by
the holding, for an annual rent of 20 years.
Assumptions and Legal Constraints - Applicable Law
1. The participation of public entities in Portugal Picture
Project raises, first, the need to adapt the model to
the specific circumstances of the Law on companies
participating in the project, in particular, the need for
full respect of the Legal Regime of the Local Business
Sector (Lei n.º 53-F/2006, de 29 de Dezembro), well as
the territorial restrictions limited to the Municipality of
Portimão, by local authorities such as the Portimão Turis,
EM “and the City of Portimão.
2. The legal regime of the local business sector clearly
defines the criteria markers of what is meant by municipal
companies, namely, all companies incorporated in the light
of commercial law where the municipalities can exercise
directly or indirectly a dominant influence or by force the
possession of most of the capital or the right to appoint or
remove a majority of the members of the administration
or auditor - as stated in the provisions of a) and b) of
paragraph 1 of Article 3 of the Legal Sector Business
Location (RJSEL ).
Portimão Film Studio
Business Plan
2.3.5. Analysis and proposals for corrections
to national and regional dysfunction in the face
of the competitive positioning of the sector
PG.
PG.
Business Plan
017
Business Plan
016
Portimão Turis is a Municipal Company designed
to promote the development of tourism in the city
(paragraph 1 of Article 4 of its Statute).
To that end it is incumbent upon Portimão Turis the
city tourism promotion management as well as the
organization of events connected with it - according to b)
and d) paragraph 2 of Article 4 of the cited Statute.
Scope and Objectives of the Project Picture Portugal
1. It will be incumbent upon the project Picture Portugal
the enhancement of the Algarve, specifically the City
and County of Lagos, as a global destination for film
production, advertising, video games, video clips and
centers of audiovisual and multimedia production.
2. To the end of carrying out the Project, a holding
company shall be created with a distribution of capital
among some private individuals and Portimão Turis,
EM, thus constituting a legal entity governed by private
limited company, namely a holding company (SGPS) with,
specifically:
a) A society for the construction and operation of a Media
Park (film studios);
Portimão Film Studio
b) A Media Fund for investment and ease of access
to capital for producers, of co-production and film
distribution, and;
c) A Media Prodution Services, with the aim of optimizing
the management of technical and human resources for
the full production of the projects to be developed in
Portimão;
3. In addition to the center of Portimão - “city of cinema”
– the Holding may develop partnership agreements
with other commercial centers of activity, particularly in
Lisbon and Porto, which are designed to meet the interest
of those seeking these services and work, where a view
to meeting the essential scope of its objects, namely promoting the Algarve, specifically the City and County
of Portimão as a global destination for film production,
advertising, video games, video clips and centers of
audiovisual and multimedia production. An association
to promote film between the Holding and the city of
Portimão may be created in which the city assumes parity
of contributions with the Holding.
4. The Holding Picture Portugal, and ALL its subsidiaries
have a social objective which, among others, is the
operation of an activity of general interest and the
promotion of local and regional development.
Thus, the holding company to be created will not dedicate
itself, exclusively, to the development activities of a
primarily commercial nature or intent, but will contribute
solidly and effectively in the promotion of Portimão as a
destination for film production.
Strategic Council and Special Rights
Despite these special rights not being a part of the legal
concept of dominant influence in accordance with Article 3
of RJSEL, because they may give, in fact, indirect dominant
influence in the city over the company in which it has
a stake, there is a risk of it being considered as such for
integration of the Holding Picture Portugal in the local
business community, which does not seem to be the
most practical or flexible solution given the constraints
of public policy raised by the Law., including the possible
submission to the Procurement Code.
The Picture Portugal Project, though it in no way intends
to see its activities restricted, in no way seeks to use this
project to hide its real intentions on the promotion and
dissemination of the County of Portimão, being that said
authority gathers the unique and indispensible conditions
for the creation of the –city of film—so it leads the
ambition to create in Portugal the optimal conditions for
the production of major films – be it from the economic
point of view, be it from the cultural point of view.
In this sense, and because the existence of any
Shareholders Agreement that would provide special rights
to Portimão Turis, EM Holding on, would, in our opinion,
constitute business in circumvention of the Law, it is
proposed to the Holding the constitution by statutory of
a Strategic Council for taking major decisions of corporate
life, with veto rights for all holders of 10% of shares.
Finally, in the Statutes of the Holding Picture Portugal,
there will be provided the creation of a Strategic Council
which will have specific duties such as the power to
confirm (and/or ratification) for each of the holders of 10%
of shares on the decisions of the Administration Council in situations to discuss and specify the Portimão Turis, EM,
and the failure to confirm will impede the administration in
the pursuit of its plans, such as failure to comply with the
requirement of the promotion of Portimão in the exercise
of their respective activities to implement.
5. It is thus logical and legitimate that Portimão Turis be a
shareholder in the Picture Portugal Project.
To this end, and lest there be a different and better
understanding, the conditions exist for entry into the
Holding by Portimão Turis, EM, whether through the social
scope of the Holding Company, - in which the objective
of any of these companies would have to fall, necessarily,
within the objective of Portimão Turis - which aims to
develop an activity of public interest in carrying out the
promotion of the development of the County of Portimão,
the Holding positions itself within the mandate of the local
majority owner of Portimão Turis, EM - the City of Portimão.
Portimão Film Studio
Assumptions and Legal Constraints – Statutory Specifics of
Portimão Turis, EM
PG.
PG.
Business Plan
019
Business Plan
018
3.3.
Analysis by company
3.3.1. Picture Portugal Portimão SGPS, SA
Social Designation: Picture Portugal Portimão, SGPS, SA
(Holding)
Legal Form: Society of Social Equity Management, Limited
Company
Headquarters: Parque de Feiras e Exposições (Fair and
Exposition Park) – Caldeira do Moinho
8500 Portimão - Portugal
Classification of Economic Activity: 59110 – Production of
films, videos and television programs;
59120 – Technical activities of post-production of films,
videos and television programs;
59130 – Distribution of films, videos, and television
programs
Portimão Film Studio
Joint-stock: 35.000.000€
3.3.1.1. Ownership and Administrative Structure
3.3.1.3. Basis
- 7 year business plan.
Shareholders: 20% City of Portimão. 20% for 10 small
shareholders with 2%. 60% for large shareholders with
shares between 2 and 20%, with 4 shareholders with 10%
each and one with 20% being sought.
- Private investors will hold at least 51%.
Administration: Chairman of the Board, Vice-President and
3 members.
- The City of Portimão will cede property next to Arena
de Portimão for the construction of film studios free from
onus and charges.
3.3.1.2 . Social Scope
- It is assumed that there is to be an investment in feature
films in co-production with the US, at cruising speed, for 4
per year with a global budget of up to 10 million Euros and
one with a budget of up to 50 million Euros
Picture Portimao Portugal, SGPS, SA will cover 3 major
areas of business in film production: The production
itself, the business management and leasing of space
for executive productions and a third area where it will
participate in investment projects of feature films and
documentaries. The social scope is the production and
distribution of films intended to be screened in cinemas
or to be broadcast on television, in film, videocassette or
DVD.
- Companies to be created will be 100% owned by the
Holding.
- It is assumed that 10 documentaries will be produced per
year, 8 new and two restorations.
- It is assumed aid to production will be to 3 feature films
annually, of US origin and without direct.
- Being that the focus of the project is executive
production, the totality below the line will be considered
global revenue and exclusive to the producer in any
production.
- Studios to open on 1st of July.
- First productions in 2010.
- Participation in international festivals.
- Opening of an office in Los Angeles.
- Fiscal incentives and tax rebates in 2011.
- Fund with joint-stock of 25 million Euros.
- The organization of a film festival in 2011 by the City of
Portimão and with the participation of all the actors of
hitherto produced films and with contracts for future.
- The City of Portimão will invest a minimum of 250.000€/
Year for a period of 7 years to promote the city in relation
to films and develop logistical support via an associative
fund of an association to be created between the Holding
and the City of Portimão, preferably with private-public
contribution parity.
- Each new film project will give origin to a new
autonomous company owned by the fund.
- The film studios will not be open to the general public.
- A financing operation will be promoted in which an
entity will build on land belonging to the Holding and with
it’s Mortgager. The architectural project and necessary
equipment totaling 25 million Euros. Of this operation 5
million will be invested in 010 and 20 million in 2011
Portimão Film Studio
Next, we will look at each company’s individual business
plan, describing its market, investments, costs, income,
and financial projections.
PG.
PG.
Business Plan
021
Business Plan
020
3.3.1.4. The new idea and its positioning in the
market
The holding replicates the model of the Major American
Studios, aiming to close the loop in film production
from idea to completion of the content ready to be
distributed and displayed anywhere in the world, while not
intervening strategically in the latter two points, but by
associating itself with those who dominate –the Majors.
3.3.1.5. The role of the Holding in the business model
The holding represents the heart of the whole project,
having two crucially important functions apart from
managing the shares.
3.3.1.6. Financial Projections
The financial analysis that follows is a 7-year projection,
beginning with the present year.
The tables are in current prices, with an estimated annual
inflation rate of around 2% for 2010 and 2011 and 3% in
other years.
3.3.1.6.1. Income
In the case of the holding, it is not expected that there
be a consolidation of accounts by the equity method.
Revenues presented are solely the personnel costs charged
by the subsidiary companies. The costs charged to the
fund were 80% of the total; costs related to the property
management company were 3% and for the producer 7%.
The holding accounts for 10%.
It was further assumed that in 2014 the conditions will
exist for what should be a year of full business operation.
In other words, that will be thee year the company
functions at capacity and is able to meet its pre-defined
objectives, both as to billing and market position.
In the supplies and services, the line item with most
meaning is Rents and Leases relative to the contract with
the construction company responsible for the construction
of the studios, which will be in effect for a period of 20
years beginning from the second semester of 2011. At the
end of the period it will become an asset of the Holding.
There is a provision for some expenditure under line
items Special works and Other Supplies and Services for
maintenance and support to the subsidiaries.
We would also mention the costs associated with
representation and communications management, which
directors of the holding company must submit.
Fist, the construction of the movie studio.
Second, a structure of human resources shared by all the
companies in which the hierarchical organization will
manage business.
In this study it is proposed not to apply the equity method
to consolidation of accounts in the entire structure of the
shared assets and liabilities, its consolidation not being
made in the holding company nor its subsidiaries taxed.
With this method we can see a more transparent costs
directly related to the holding.
3.3.1.6.2. Costs
The costs of this activity are initially only estimated
in Supplies and External Services, staff costs and
depreciation.
Project Services
SERVICES
2010
2011
2012
2013
2014
2015
2016
Designation
Value
Value
Value
Value
Value
Value
Value
1 – Cost Allocation Structure - Media Fund
565.092,92
576.394,78
587.922,67
605.560,35
623.727,16
642.438,98
661.712,15
2 – Cost Allocation Structure - Media Park
25.302,67
25.808,72
26.324,90
27.114,64
27.928,08
28.765,92
29.628,90
168.684,45
172.058,14
175.499,31
180.764,28
186.187,21
191.772,83
197.526,01
759.080,04
774.261,64
789.746,88
813.439,28
837.842,46
862.977,73
888.867,07
3 – Cost Allocation Structure - Production Service
Total
Portimão Film Studio
Portimão Film Studio
Finally consolidating financial results in this company and
from this the shareholders will receive remuneration.
Business Plan
Business Plan
Portimão Film Studio
Portimão Film Studio
022
023
PG.
PG.
024
025
Shareholders
PG.
ESF Line Items
2010
2011
Next we present a Human Resources chart as well as
organizational chart of the various companies.
2012
2013
2014
2015
2016
Office Materials
10.000,00
10.200,00
10.404,00
10.716,12
11.037,60
11.368,73
Gift Items
10.000,00
10.200,00
10.404,00
10.716,12
11.037,60
11.368,73
11.709,79
0,00
875.000,00
1.750.000,00
1.750.000,00
1.750.000,00
1.750.000,00
1.750.000,00
91.000,00
92.820,00
94.676,40
97.516,69
100.442,19
103.455,46
106.559,12
Rents and Rentals
Representation Expenses
Communication
Specialized Work
Other Goods and Services
Total
Board
The advertising line item refers to the hosting and admin
costs associated with the site as will as merchandising.
11.709,79
56.000,00
57.120,00
58.262,40
60.010,27
61.810,58
63.664,90
65.574,84
150.000,00
153.000,00
156.060,00
160.741,80
165.564,05
170.530,98
175.646,90
120.000,00
122.400,00
124.848,00
128.593,44
132.451,24
136.424,78
140.517,52
437.000,00
1.320.740,00
2.204.654,80
2.218.294,44
2.232.343,28
2.246.813,58
2.261.717,98
Finance
Department, Legal
& RH
Chairman
Vice-President
Member 1
Member 2
Member 3
Secretary
Strategic Council
Directorate
Procurement,
Logistics & IT
7 Advisors
Director
Clerk
General Manager
Advisor
Secretary to the General
Manager
Director
Clerk
IT Technician
MEDIA PARK
PRODUTION
FUND
Directorate
Directorate
Directorate
Manager
Clerk
Maintenance Technician 1
Maintenance Technician 2
Manager
Clerk
Technician
Director
Clerk
Admnistrativo
Portimão Film Studio
The insurance coverage includes furniture.
Business Plan
Business Plan
HOLDING
Specialized work is a set of solutions in the area of
management and accounting such as: secretarial service
and office administration, accounting and taxation,
controller / coaching, hosting and legal support.
Portimão Film Studio
PG.
Portimão Film Studio
Business Plan
026
PG.
028
029
PG.
PG.
The table below reflects the cost of company staff for the
period under review.
SOCIAL CONTRIBUTIONS FOR PERSONNEL
Monthly Compensation (WITHOUT SOCIAL CONTRIBUTIONS)
Categories
CATEGORIES
Average Monthly Compensations
2010
2011
2012
2013
2014
2015
2016
Board
Chairman
6.000,00
6.120,00
6.242,40
6.429,67
6.622,56
6.821,24
7.025,88
Vice-President
4.000,00
4.080,00
4.161,60
4.286,45
4.415,04
4.547,49
4.683,92
Member 1
3.500,00
3.570,00
3.641,40
3.750,64
3.863,16
3.979,06
4.098,43
Member 2
3.500,00
3.570,00
3.641,40
3.750,64
3.863,16
3.979,06
4.098,43
Member 3
3.500,00
3.570,00
3.641,40
3.750,64
3.863,16
3.979,06
4.098,43
Secretary
2.000,00
2.040,00
2.080,80
2.143,22
2.207,52
2.273,75
2.341,96
0,00
Strategic Council
1.458,33
1.487,50
1.517,25
1.562,76
1.609,65
1.657,94
1.707,67
0,00
Directorate
General Manager
4.000,00
4.080,00
4.161,60
4.286,45
4.415,04
4.547,49
4.683,92
Advisor
2.000,00
2.040,00
2.080,80
2.143,22
2.207,52
2.273,75
2.341,96
Secretary to the General Manager
2.000,00
2.040,00
2.080,80
2.143,22
2.207,52
2.273,75
2.341,96
Finance Department, Legal & HR
2012
2013
2014
2015
2016
29.190,00
29.773,80
30.369,28
31.280,35
32.218,76
33.185,33
34.180,89
Vice-President
19.460,00
19.849,20
20.246,18
20.853,57
21.479,18
22.123,55
22.787,26
Member 1
17.027,50
17.368,05
17.715,41
18.246,87
18.794,28
19.358,11
19.938,85
Member 2
17.027,50
17.368,05
17.715,41
18.246,87
18.794,28
19.358,11
19.938,85
Member 3
17.027,50
17.368,05
17.715,41
18.246,87
18.794,28
19.358,11
19.938,85
9.730,00
9.924,60
10.123,09
10.426,78
10.739,59
11.061,78
11.393,63
49.663,43
50.656,70
51.669,83
53.219,93
54.816,52
56.461,02
58.154,85
Secretary
Strategic Council
"7 Advisors”
Directorate
19.460,00
19.849,20
20.246,18
20.853,57
21.479,18
22.123,55
22.787,26
Advisor
9.730,00
9.924,60
10.123,09
10.426,78
10.739,59
11.061,78
11.393,63
Secretary to the General Manager
9.730,00
9.924,60
10.123,09
10.426,78
10.739,59
11.061,78
11.393,63
Finance Department, Legal & HR
19.460,00
19.849,20
20.246,18
20.853,57
21.479,18
22.123,55
22.787,26
Total Social
217.505,93
221.856,05
226.293,17
233.081,96
240.074,42
247.276,65
254.694,95
Compensation + Social Contribution
843.422,27
860.290,71
877.496,53
903.821,42
930.936,07
958.864,15
987.630,07
Director –Finance, Legal & HR
0,00
2011
Chairman
General Manager
0,00
"7 Advisors”
2010
Board
Business Plan
Business Plan
Monthly Values:
0,00
Director –Finance, Legal & HR
4.000,00
4.080,00
4.161,60
4.286,45
4.415,04
4.547,49
4.683,92
Clerk – Finance, Legal & HR
2.000,00
2.040,00
2.080,80
2.143,22
2.207,52
2.273,75
2.341,96
Procurement, Logistics & IT
0,00
4.000,00
4.080,00
4.161,60
4.286,45
4.415,04
4.547,49
4.683,92
Clerk – Puprchasing & Logistics
Director- Purchasing & Logistics
2.000,00
2.040,00
2.080,80
2.143,22
2.207,52
2.273,75
2.341,96
IT Technician
2.000,00
2.040,00
2.080,80
2.143,22
2.207,52
2.273,75
2.341,96
The company will have a board composed of 5 directors,
a Strategic Council and a Directorate comprising 2
departments, one containing the areas Finance, Legal, and
Human Resources, and the other department containing
the areas Purchasing, Logistics, and IT. The creation of
further job positions is not expected for the first years of
activity.
Management and administration positions will deduct at a
rate of 21.25% while the remaining employees at a rate of
23.75%.
Yearly Values:
PERSONNEL ANNUAL COSTS (Compensations without Social Contributions)
Categories
2010
2011
2012
2013
2014
2015
2016
Board
Chairman
84.000,00
85.680,00
87.393,60
90.015,41
92.715,87
95.497,35
98.362,27
Vice-President
56.000,00
57.120,00
58.262,40
60.010,27
61.810,58
63.664,90
65.574,84
Member 1
49.000,00
49.980,00
50.979,60
52.508,99
54.084,26
55.706,79
57.377,99
Member 2
49.000,00
49.980,00
50.979,60
52.508,99
54.084,26
55.706,79
57.377,99
Member 3
49.000,00
49.980,00
50.979,60
52.508,99
54.084,26
55.706,79
57.377,99
Secretary
28.000,00
28.560,00
29.131,20
30.005,14
30.905,29
31.832,45
32.787,42
142.916,34
145.774,67
148.690,16
153.150,86
157.745,39
162.477,75
167.352,09
General Manager
56.000,00
57.120,00
58.262,40
60.010,27
61.810,58
63.664,90
65.574,84
Advisor
28.000,00
28.560,00
29.131,20
30.005,14
30.905,29
31.832,45
32.787,42
Secretary to the General Manager
28.000,00
28.560,00
29.131,20
30.005,14
30.905,29
31.832,45
32.787,42
Strategic Council
"7 Advisors”
Finance Department, Legal & HR
Director –Finance, Legal & HR
Total de Remunerações
56.000,00
57.120,00
58.262,40
60.010,27
61.810,58
63.664,90
65.574,84
625.916,34
638.434,67
651.203,36
670.739,46
690.861,64
711.587,49
732.935,12
Portimão Film Studio
Portimão Film Studio
Directorate
030
031
PG.
PG.
3.3.1.6.4. Breakout of Projected Results
In terms of Capital, after the first 2 years of strong
investment in the project, Capital will increase from the 3rd
year on, result of the net income obtained.
With regard to liabilities, we will only see the normal
operating costs without taking on debt. With the model
of rent payments to the builder of the Film Studio, only
20 years will the Studio become part of the assets of the
company.
Financial Projections
ASSSETS
Gross Fixed
Intangible
Depreciation of Intangible
Tangible
Depreciation of Tangible
Financial Investments
Breakout of Projected Results
2010
2012
2013
2014
2015
2016
INCOME
2010
2011
2012
2013
2014
2015
2016
32.920.000,00
32.940.000,00
32.960.000,00
32.980.000,00
33.000.000,00
33.020.000,00
1.340.000,00
1.350.000,00
1.360.000,00
1.370.000,00
1.380.000,00
1.390.000,00
1.400.000,00
Sales
0,00
0,00
0,00
0,00
0,00
0,00
0,00
446.666,67
896.666,67
1.350.000,00
1.360.000,00
1.370.000,00
1.380.000,00
1.390.000,00
Products
0,00
0,00
0,00
0,00
0,00
0,00
0,00
5.260.000,00
5.270.000,00
5.280.000,00
5.290.000,00
5.300.000,00
5.310.000,00
5.320.000,00
Goods
0,00
0,00
0,00
0,00
0,00
0,00
0,00
65.000,00
67.500,00
70.000,00
72.500,00
10.000,00
10.000,00
10.000,00
Domestic Market
0,00
0,00
0,00
0,00
0,00
0,00
0,00
9.800.000,00
26.300.000,00
26.300.000,00
26.300.000,00
26.300.000,00
26.300.000,00
26.300.000,00
Foreign Market
0,00
0,00
0,00
0,00
0,00
0,00
0,00
0,00
0,00
0,00
0,00
0,00
0,00
0,00
759.080,04
774.261,64
789.746,88
813.439,28
837.842,46
862.977,73
888.867,07
Assets Under Construction
0,00
0,00
0,00
0,00
0,00
0,00
0,00
511.666,67
1.029.166,67
1.552.500,00
1.635.000,00
1.655.000,00
1.675.000,00
1.695.000,00
Receivables – Medium and Long-term
Services
Domestic Market
0,00
0,00
0,00
0,00
0,00
0,00
0,00
759.080,04
774.261,64
789.746,88
813.439,28
837.842,46
862.977,73
888.867,07
Change in Production
0,00
0,00
0,00
0,00
0,00
0,00
0,00
Work performed for Company
0,00
0,00
0,00
0,00
0,00
0,00
0,00
Foreign Market
0,00
0,00
0,00
0,00
0,00
0,00
0,00
18.096.266,38
253.524,76
755.139,93
2.671.275,92
19.341.917,80
37.204.615,98
55.332.772,61
0,00
0,00
0,00
0,00
0,00
0,00
0,00
Other Operating Income ( including reversals)
0,00
0,00
0,00
0,00
0,00
0,00
0,00
Raw Materials, Subsid. Consumption
0,00
0,00
0,00
0,00
0,00
0,00
0,00
Income and Financial Gains. Operation- Exchange Var.
0,00
0,00
0,00
0,00
0,00
0,00
0,00
Finished goods and ongoing work
0,00
0,00
0,00
0,00
0,00
0,00
0,00
Income and Financial Gains. Operation PP Discounts
0,00
0,00
0,00
0,00
0,00
0,00
0,00
Goods
0,00
0,00
0,00
0,00
0,00
0,00
0,00
Operating Income
759.080,04
774.261,64
789.746,88
813.439,28
837.842,46
862.977,73
888.867,07
20.507.245,40
Rolling Stock
Stocks
Other
0,00
0,00
0,00
0,00
0,00
0,00
0,00
Other Income and Financial Gains
0,00
0,00
2.756.242,65
20.927.666,69
20.221.979,09
20.504.819,97
Adjustments Stocks
0,00
0,00
0,00
0,00
0,00
0,00
0,00
Income and Extraordinary Gains
0,00
0,00
0,00
0,00
0,00
0,00
0,00
62.390,14
63.637,94
64.910,70
66.858,02
68.863,76
70.929,68
73.057,57
759.080,04
774.261,64
3.545.989,53
21.741.105,97
21.059.821,55
21.367.797,70
21.396.112,46
Receivables – Short-term
Clients
TOTAL INCOME
CUSTOS
2010
2011
2012
2013
2014
2015
2016
62.390,14
63.637,94
64.910,70
66.858,02
68.863,76
70.929,68
73.057,57
State and other public entities
0,00
0,00
0,00
0,00
0,00
0,00
0,00
Cost of Goods Sold and Raw Materials Consumed
0,00
0,00
0,00
0,00
0,00
0,00
0,00
Other
0,00
0,00
0,00
0,00
0,00
0,00
0,00
Goods
0,00
0,00
0,00
0,00
0,00
0,00
0,00
Adjustments for doubtful debts
0,00
0,00
0,00
0,00
0,00
0,00
0,00
Raw Materials, Subsid. & Consumer
0,00
0,00
0,00
0,00
0,00
0,00
0,00
0,00
0,00
0,00
0,00
0,00
0,00
0,00
Supplies and Services
437.000,00
1.320.740,00
2.204.654,80
2.218.294,44
2.232.343,28
2.246.813,58
2.261.717,98
18.033.876,24
189.886,81
690.229,23
2.604.417,90
19.273.054,04
37.133.686,31
55.259.715,05
0,00
0,00
0,00
0,00
0,00
0,00
0,00
33.984.599,72
32.144.358,09
32.142.639,93
33.996.275,92
50.666.917,80
68.529.615,98
86.657.772,62
Securities
Deposits and Cash
Accruals and deferrals
TOTAL ASSETS
EQUITY
Joint-Stock
2010
2011
2012
2013
2014
2015
35.000.000,00
35.000.000,00
35.000.000,00
35.000.000,00
35.000.000,00
35.000.000,00
Stock
0,00
0,00
0,00
0,00
0,00
0,00
0,00
Supplemental payments
0,00
0,00
0,00
0,00
0,00
0,00
0,00
Reserves/Earnings
LIABILITIES
Commons
Payables – Medium and Long-term
-5.539,47
5.028,41
5.131,65
5.289,60
5.452,28
5.619,85
5.792,45
Direct
-2.769,73
2.514,21
2.565,82
2.644,80
2.726,14
2.809,93
2.896,22
Indirect
-2.769,73
2.514,21
2.565,82
2.644,80
2.726,14
2.809,93
2.896,22
843.422,27
860.290,71
877.496,53
903.821,42
930.936,07
958.864,15
987.630,07
Compensation
625.916,34
638.434,67
651.203,36
670.739,46
690.861,64
711.587,49
732.935,12
SocialContributions
217.505,93
221.856,05
226.293,17
233.081,96
240.074,42
247.276,65
254.694,95
0,00
0,00
0,00
0,00
0,00
0,00
0,00
511.666,67
517.500,00
523.333,33
82.500,00
20.000,00
20.000,00
20.000,00
Other
Depreciation and Adjustments
0,00
-1.037.469,43
-2.976.766,91
-3.051.393,69
15.469.806,82
33.330.896,75
51.457.396,87
Supplies
0,00
0,00
0,00
0,00
0,00
0,00
0,00
-1.037.469,43
-1.939.297,48
-74.626,78
18.521.200,51
17.861.089,92
18.126.500,12
18.110.971,96
Other Operating Costs
0,00
0,00
0,00
0,00
0,00
0,00
0,00
0,00
0,00
0,00
16.669.080,46
17.861.089,92
18.126.500,12
18.110.971,96
Financial Costs and Losses. Operating – Exchange Var
0,00
0,00
0,00
0,00
0,00
0,00
0,00
33.962.530,57
32.023.233,09
31.948.606,31
33.800.726,37
50.469.806,82
68.330.896,75
86.457.396,87
Costs and Financial Losses, Operating – PP Discounts
0,00
0,00
0,00
0,00
0,00
0,00
0,00
Anticipated Dividends
TOTAL EQUITY
Taxes
Personnel Costs
2016
35.000.000,00
Net Income
2010
2011
0,00
2012
0,00
2013
2014
2015
2016
Operational Costs
0,00
0,00
0,00
0,00
0,00
Results before Financial Overhead. & Extraord.
1.786.549,47
2.703.559,12
3.610.616,31
3.209.905,46
3.188.731,63
3.231.297,58
3.275.140,50
-1.027.469,43
-1.929.297,48
-2.820.869,43
-2.396.466,18
-2.350.889,17
-2.368.319,84
-2.386.273,44
0,00
0,00
0,00
0,00
0,00
0,00
0,00
Other Costs and Financial Losses
10.000,00
10.000,00
10.000,00
10.000,00
10.000,00
10.000,00
10.000,00
Loans
0,00
0,00
0,00
0,00
0,00
0,00
0,00
Interests
10.000,00
10.000,00
10.000,00
10.000,00
10.000,00
10.000,00
10.000,00
Reimbursable grants
0,00
0,00
0,00
0,00
0,00
0,00
0,00
Other
0,00
0,00
0,00
0,00
0,00
0,00
0,00
Supplies
0,00
0,00
0,00
0,00
0,00
0,00
0,00
Extraordinary Costs
0,00
0,00
0,00
0,00
0,00
0,00
0,00
Suppliers of fixed assets
0,00
0,00
0,00
0,00
0,00
0,00
0,00
TOTAL COST
1.796.549,47
2.713.559,12
3.620.616,31
3.219.905,46
3.198.731,63
3.241.297,58
3.285.140,50
-1.037.469,43
-1.939.297,48
-74.626,78
18.521.200,51
17.861.089,92
18.126.500,12
18.110.971,96
0,00
0,00
0,00
0,00
0,00
0,00
0,00
-1.037.469,43
-1.939.297,48
-74.626,78
18.521.200,51
17.861.089,92
18.126.500,12
18.110.971,96
Other
Portimão Film Studio
2011
16.400.000,00
Financial Investment Adjustments
Accumulated Depreciation and Adjustments
Recall that the method used in this study was the nonconsolidation of subsidiaries into the holding company.
In this context the income of the company is only the
imputation of the cost of the holding’s structure unto its
subsidiaries.
In terms of profits, it bears mentioning that negative
net revenue is foreseen for the first 2 years, marginal
positive net revenue is expected in the third year, with the
expected positive profits operating at full capacity from
the 4th year onward.
Payables – Short-term
Loans
Suppliers
0,00
0,00
0,00
0,00
0,00
0,00
0,00
22.069,14
121.125,00
194.033,62
195.549,56
197.110,98
198.719,24
200.375,75
0,00
0,00
0,00
0,00
0,00
0,00
0,00
35.917,81
108.553,97
181.204,50
182.325,57
183.480,27
184.669,61
185.894,63
-13.848,67
12.571,03
12.829,11
13.223,99
13.630,71
14.049,63
14.481,12
0,00
0,00
0,00
0,00
0,00
0,00
0,00
Accruals and deferrals
0,00
0,00
0,00
0,00
0,00
0,00
0,00
Subsidies
0,00
0,00
0,00
0,00
0,00
0,00
0,00
22.069,14
121.125,00
194.033,62
195.549,56
197.110,98
198.719,24
200.375,75
33.984.599,72
32.144.358,09
32.142.639,93
33.996.275,92
50.666.917,80
68.529.615,98
86.657.772,62
State and other public entities
Other
TOTAL LIABILITES
TOTAL EQUITY+ LIABILITIES
Profit Before Tax
Revenue Tax
NET
Portimão Film Studio
Business Plan
The projection is that Property has increases in investment
in the first 2.
Business Plan
3.3.1.6.3. Financial Projections
PG.
PG.
Business Plan
033
Business Plan
032
3.3.1.6.5. Indicators
Next, we move to an analysis of the most significant
indictors in order to conclude this survey of study’s results.
The critical point is an indicator that calculates for a
given level of fixed costs, and for a certain proportion of
variable costs, which the amount of sales and services it is
necessary to achieve at least cover all costs.
Fixed costs are restricted to depreciation of fixed assets
and personnel costs, while the variables are restricted to
the ESF cost and taxes.
The company reaches a maximum coverage of 94% in 4
years, functioning at yearly full capacity.
With the method described above the company does not
present a positive operating result because the return on
investment comes in the line item of distribution of profits
of subsidiaries. The ability to self-finance reflects good
performance from 2013 onward.
Regarding the indicators of general profitability, we see
a positive development. Most indicators reach their peak
in the 4th year as a result of the company reaching full
capacity.
The financial profitability is the ability of the company to
generate profit from its own capital.
This is mainly due to the stabilization of the sales and
production of its subsidiaries.
Variable Costs
Critical Point
Margino f Coverage (Income – Critical Point)
Margin of Coverage (in %)
2010
2011
1.355.088,93
2012
2013
2014
2015
2016
1.377.790,71
1.400.829,86
986.321,42
950.936,07
978.864,15
1.007.630,07
2.277.510,43
441.460,53
1.335.768,41
2.219.786,45
2.233.584,04
2.247.795,56
2.262.433,43
3.238.532,08
-1.899.835,51
3.745.525,91
1.099.253,85
1.064.560,72
1.094.780,02
1.127.664,37
-2.479.452,04
2.674.097,16
-199.536,38
20.641.852,12
19.995.260,83
20.273.017,68
20.268.448,09
-326,6%
345,4%
-5,6%
94,9%
94,9%
94,9%
94,7%
General Profitabiliity
Profitability of the Investment
2010
2011
2012
2013
2014
2015
2016
Operating Profit/Investment
-3,1%
-5,9%
-8,6%
-7,3%
-7,1%
-7,2%
-7,3%
Capacity to Self-Finance/Investment
-1,6%
-4,3%
1,4%
56,6%
54,4%
55,2%
55,1%
2011
2012
2013
2014
2015
2016
-3,1%
-6,1%
-0,2%
54,8%
35,4%
26,5%
20,9%
Profitability of Activity
-69,3%
-183,6%
56,8%
2287,0%
2134,2%
2102,8%
2039,8%
2037,5%
Profitability of Production
-136,7%
-250,5%
-9,4%
2276,9%
2131,8%
2100,5%
Economic Efficiency
-135,4%
-249,2%
-357,2%
-294,6%
-280,6%
-274,4%
-268,5%
Profitability of Sales
-136,7%
-250,5%
-9,4%
2276,9%
2131,8%
2100,5%
2037,5%
Net Profit/Net Assets
-3,1%
-6,0%
-0,2%
54,5%
35,3%
26,5%
20,9%
759.080,04
774.261,64
789.746,88
813.439,28
837.842,46
862.977,73
888.867,07
Gross Sales/Nº employees
36.146,67
36.869,60
37.606,99
38.735,20
39.897,26
41.094,18
42.327,00
(Sales + Services)/Nº Employees
36.146,67
36.869,60
37.606,99
38.735,20
39.897,26
41.094,18
42.327,00
0,0%
0,0%
0,0%
0,0%
0,0%
0,0%
0,0%
15.337,14
-26.022,78
63.873,08
929.657,69
896.546,58
910.523,05
911.161,64
Gross Sales
Personnel Overhead/(Sales+Services)
VAB/Nº Workers
VAB/Personnel Costs
VAB
Portimão Film Studio
2010
Financial Profitability
38,2%
-63,5%
152,9%
2160,0%
2022,4%
1994,1%
1937,4%
322.080,04
-546.478,36
1.341.334,73
19.522.811,53
18.827.478,27
19.120.984,12
19.134.394,48
Portimão Film Studio
Critical Point
Fixed Costs
Gross Margin Trading (GMT) is calculated as the difference
between the sum of our Services Rendered and
Subcontracted Services (essential to the business). With
the method of non-consolidated equity this indicator is
not relevant.
PG.
PG.
Business Plan
035
Business Plan
034
2010
2011
2012
2013
2014
2015
2016
Liquidity and Net Cash
2011
2012
2013
2014
2015
2016
0,4%
0,6%
0,6%
0,4%
0,3%
0,2%
General Liquidity
81998,1%
209,3%
389,2%
1366,0%
9812,7%
18722,2%
27614,5%
MLP Debt
0,0%
0,0%
0,0%
0,0%
0,0%
0,0%
0,0%
Reduced Liquidity
81998,1%
209,3%
389,2%
1366,0%
9812,7%
18722,2%
27614,5%
99,9%
99,6%
99,4%
99,4%
99,6%
99,7%
99,8%
Net Cash/Operational Income
2375,8%
24,5%
87,4%
320,2%
2300,3%
4303,0%
6216,9%
Solvency
153891,5%
26438,2%
16465,5%
17285,0%
25604,8%
34385,6%
43147,6%
(NFM-FM)/Operational Income
-2375,8%
-24,5%
-87,4%
-320,2%
-2300,3%
-4303,0%
-6216,9%
Debt Capacity
Net Cash/NFM
44725,8%
-330,3%
-534,6%
-2023,8%
-15028,0%
-29058,5%
-43402,8%
1,3%
1,3%
1,3%
1,2%
1,2%
1,2%
1,1%
18.033.876,24
189.886,81
690.229,23
2.604.417,90
19.273.054,04
37.133.686,31
55.259.715,05
Financial Autonomy
153891,5%
26438,2%
16465,5%
17285,0%
25604,8%
34385,6%
43147,6%
Fixed Coverage
213,8%
100,4%
101,8%
107,9%
161,1%
218,1%
276,0%
Working Capital
18.074.197,24
132.399,76
561.106,31
2.475.726,36
19.144.806,82
37.005.896,74
55.132.396,87
Permanent Capital
33.962.530,57
32.023.233,09
31.948.606,31
33.800.726,37
50.469.806,82
68.330.896,75
86.457.396,87
The level of debt and risk in the holding is ideal in that it
invests only and is self financing.
With regard to financial autonomy, this company also
presents an ideal condition for the reasons above.
Solvency analyzes the relationship between the equity
and debt capital of a company. The management of
this financial indicator is important not to put at risk the
continuity of the company in the medium-to-long term.
The figures in the table above indicate full economic and
financial stability.
We would also cite the fact that the fixed capital number
indicates a sound financial structure; in fact, expanding.
Portimão Film Studio
2010
0,1%
Financial Overhead/Operational Income
Net Cash
With regard to liquidity and net cash, the company exhibits
significant improvements from the 5th and 6th years
onwards.
A comparison of overall liquidity with the decrease
evidences the weight of the remaining assets. Values do
not vary as a company is only providing services.
The general liquidity gives us information about the
coverage of current assets by current liabilities, a means to
prime financing the company. Whenever possible it should
be > 1. We found that the firm in question reaches values
well above 100% from the 4th year on, not requiring,
therefore, use of permanent capital to finance the portion
not covered by current assets.
Portimão Film Studio
Debt & Risk
Debt
PG.
PG.
Business Plan
037
Business Plan
036
In this table we can see 3 scenarios with a standard
discount rate of 8%, a lower 4% rate, and a high discount
rate of 16%. We see good resiliency of Net Present Value,
demonstrating the importance of sustained commercial
dynamism in the overall project.
In the map above we can see clear returns from the 4th
year onward. Featuring a capacity of stable self-financing
even considering the disbursement of dividends to
shareholders.
In the Holding, the Internal Rate of Return (with residual)
with a value of 29.4%, despite being slightly lower than
that of the subsidiary companies, shows it to be a great
investment.
NPV, IRR AND PAYBACK PERIOD
Scenario I – Normal Update Rate
We consider, therefore, the viability of this project to be
guaranteed for the period analyzed, with good prospects
for continued development.
2. Depreciation and Supplies
2010
2011
2012
2013
-1.939.297,48
-74.626,78
2014
18.521.200,51
2015
17.861.089,92
2016
18.126.500,12
2016
8,0%
8,0%
CAF Updated
-525.802,76
-1.316.479,15
384.693,55
14.768.217,27
13.143.134,89
12.350.203,07
11.425.587,84
Updated Net Cash Flows
-16.966.123,76
-16.522.212,43
428.962,98
14.751.998,18
13.128.107,71
12.336.279,93
11.412.687,39
Updated and Accumulated Net Cash Flows
-16.966.123,76
-33.488.336,19
-33.059.373,21
-18.307.375,04
-5.179.267,33
7.157.012,60
18.569.700,00
16.440.321,00
15.205.733,28
-44.269,43
16.219,09
15.027,19
13.923,13
12.900,44
0,00
0,00
0,00
0,00
0,00
0,00
19.659.831,51
-16.966.123,76
-16.522.212,43
428.962,98
14.751.998,18
13.128.107,71
12.336.279,93
31.072.518,91
Updated Final Year Residual Value
Updated Net Cash Flow + Residual Value
Established Values
Net present value (NPV) without residual value
NPV with Residual Value
Internal Return Rate (IRR) Without Residual Value
IRR with Residual Value
Updated Payback
Year term.
18.569.700,00
3 anos
4 anos
-33.059.373,21
5 anos
-18.307.375,04
38.229.531,51
-
-
21,2%
-
-
6 anos
-5.179.267,33
-
7 anos
7.157.012,60
-
2,0%
8 anos
18.569.700,00
-
14,3%
0,00
-
21,2%
21,2%
29,4%
6 Years
2010
2011
2012
2013
2014
2015
2016
4,0%
4,0%
4,0%
4,0%
4,0%
4,0%
4,0%
-525.802,76
-1.367.112,96
414.854,43
16.538.622,01
15.284.830,60
14.915.100,34
14.329.170,51
Meios Libertos Líquidos actualizados
-16.966.123,76
-17.157.682,14
462.594,69
16.520.458,59
15.267.354,71
14.898.285,65
14.312.991,68
Meios Libertos Líquidos actualizados e acumulados
-16.966.123,76
-34.123.805,90
-33.661.211,21
-17.140.752,62
-1.873.397,91
13.024.887,73
27.337.879,41
16.440.321,00
15.790.569,18
-47.740,26
18.163,42
17.475,89
16.814,70
16.178,83
0,00
0,00
0,00
0,00
0,00
0,00
24.655.981,11
-16.966.123,76
-17.157.682,14
462.594,69
16.520.458,59
15.267.354,71
14.898.285,65
38.968.972,79
Valor Residual actualizado
511.666,67
517.500,00
523.333,33
82.500,00
20.000,00
20.000,00
20.000,00
-525.802,76
-1.421.797,48
448.706,56
18.603.700,51
17.881.089,92
18.146.500,12
18.130.971,96
5.260.000,00
10.000,00
10.000,00
10.000,00
10.000,00
10.000,00
10.000,00
0,00
0,00
0,00
0,00
0,00
0,00
5.015.000,00
1.340.000,00
10.000,00
10.000,00
10.000,00
10.000,00
10.000,00
10.000,00
0,00
0,00
0,00
0,00
0,00
0,00
10.000,00
40.321,00
-97.808,05
-71.635,86
431,38
444,32
457,65
471,38
0,00
0,00
0,00
0,00
0,00
0,00
-127.318,18
Update Rate
16,0%
16,0%
16,0%
16,0%
16,0%
16,0%
16,0%
9.800.000,00
16.500.000,00
0,00
0,00
0,00
0,00
0,00
CAF Updated
-525.802,76
-1.225.687,48
333.462,07
11.918.603,49
9.875.566,78
8.639.784,89
7.441.717,01
11. Residual Value of Fin. Invest + Works in Progress
0,00
0,00
0,00
0,00
0,00
0,00
26.300.000,00
Updated Net Cash Flows
-16.966.123,76
-15.382.749,51
371.835,92
11.905.513,97
9.864.275,57
8.630.044,74
7.433.314,69
12. Divestment (Total Assets)
0,00
0,00
0,00
0,00
0,00
0,00
0,00
Updated and Accumulated Net Cash Flows
-16.966.123,76
-32.348.873,26
-31.977.037,34
-20.071.523,38
-10.207.247,81
-1.577.203,07
5.856.111,62
16.440.321,00
16.422.191,95
-51.635,86
20.431,38
20.444,32
20.457,65
20.471,38
16.440.321,00
14.157.062,02
-38.373,86
13.089,52
11.291,22
9.740,15
8.402,32
0,00
0,00
0,00
0,00
0,00
0,00
31.197.681,82
Updated Residual Value
0,00
0,00
0,00
0,00
0,00
0,00
12.804.846,87
15. Net Cash Flows without Residual Value
-16.966.123,76
-17.843.989,43
500.342,42
18.583.269,13
17.860.645,60
18.126.042,47
18.110.500,58
Updated Net Cash Flow + Residual Value
-16.966.123,76
-15.382.749,51
371.835,92
11.905.513,97
9.864.275,57
8.630.044,74
20.238.161,56
16. Net Cash Flows with Residual Value
-16.966.123,76
-17.843.989,43
500.342,42
18.583.269,13
17.860.645,60
18.126.042,47
49.308.182,40
6 anos
7 anos
3. Capacity to Self-Finance (CAF)
4. Fixed Asset Investment
5. Residual Value of Invest. in Fixed Capital Assets
6. Investment in Intangible Fixed Assets
7. Residual Value of Invest. In Intangible Fixed Assets
8. Investment in Working Capital Fund
9. Residual Value of Invest. in Working Capital Fund
10. Financial Investment + Works in Progress
13. Net Investments (annual total)
14. Residual value (totals)
Meios Libertos Líquidos actualizados + Valor Residual
Valores apurados
Valor Actualizado Líquido (VAL) sem Valor Residual
VAL com Valor Residual
Prazo de Recuperação (Payback) actualizado
Hipótese III - Taxa Actualização Alta
Updated Investment
Established Values
Net present value (NPV) without residual value
NPV with residual Value
Portimão Film Studio
2015
8,0%
Investimento actualizado
18.110.971,96
2014
8,0%
CAF actualizada
-1.037.469,43
2013
8,0%
Scenario II – Low Updated Rate
CASH-FLOW
2012
8,0%
Taxa de Actualização
1. Profit After Tax
2011
8,0%
Updated Investment
The recovery term of 6 years presented by the Holding is
very attractive.
2010
Update Rate
Updated Payback
Year term.
27.337.879,41
3 anos
4 anos
-33.661.211,21
5 anos
-17.140.752,62
6 anos
-1.873.397,91
7 anos
13.024.887,73
8 anos
27.337.879,41
0,00
51.993.860,52
6 Years
2010
2011
Year term.
5.856.111,62
2012
3 anos
-31.977.037,34
2013
4 anos
-20.071.523,38
2014
5 anos
-10.207.247,81
2015
-1.577.203,07
2016
5.856.111,62
8 anos
0,00
18.660.958,49
7 years
Portimão Film Studio
3.3.1.6.6. Viability
PG.
PG.
Business Plan
039
Business Plan
038
3.3.1.6.7. Management and control of the business
Management and operational control requirements
are mandatory for good business performance. Thus, a
modern management system is intended, which is able
to keep up with changing needs. This business plan is
sufficiently detailed to easily and quickly create an actions
plan and budget that could be meticulously implemented.
3.3.1.6.8. Necessary Investment
To start this project and given the initial projection of
the business, it’s been determined necessary to have the
investment itemized in the table below:
FINANCING
Investments
Property and Resources, inf, buildings, const.
Equipments, tools and utens.
A holding should seek to form partnerships with one or
more entities to gain access to installations in Lisbon and
Porto to enhance the project.
Financial information
The accounts of the company will be managed by an
external entity and organized by cost centers. Being a
diversified and complex activity, it is necessary to evaluate
the profitability of each “pack”, or service, individually and
make regular assessments of the business.
Along with accounting balance sheets, progress reports
will be provided (also by an external company) that will
help understand the company’s situation and will support
the management of the business.
Totals
2010
2011
2012
2013
2014
2015
2016
Equity
Total Investment
Partnership Management
3.3.1.6.9. Necessary financing and economic value
Cargo and Transportation Material
Other tangible investments
Values
%
32.892.681,82
Joint-Stock
5.000.000,00
94,0%
70.000,00
1,3%
250.000,00
4,7%
0,00
0,0%
Total investment in tangible fixed assets
5.320.000,00
100,0%
Total investment in intangible fixed assets
1.400.000,00
100,0%
-127.318,18
-0,4%
26.300.000,00
80,0%
Investment in Working Capital Fund
Financial Investment
35.000.000,00
35.000.000,00
0,00
0,00
0,00
0,00
0,00
0,00
0,00
0,00
0,00
0,00
0,00
0,00
0,00
71.263.368,83
-525.802,76
-1.421.797,48
448.706,56
18.603.700,51
17.881.089,92
18.146.500,12
18.130.971,96
106.263.368,83
34.474.197,24
-1.421.797,48
448.706,56
18.603.700,51
17.881.089,92
18.146.500,12
18.130.971,96
MLP Loans(+Bonds)
0,00
0,00
0,00
0,00
0,00
0,00
0,00
0,00
Shareholders/ Supplemental Loans
0,00
0,00
0,00
0,00
0,00
0,00
0,00
0,00
Asset Suppliers
0,00
0,00
0,00
0,00
0,00
0,00
0,00
0,00
Leasing
0,00
0,00
0,00
0,00
0,00
0,00
0,00
0,00
Other
0,00
0,00
0,00
0,00
0,00
0,00
0,00
0,00
0,00
0,00
0,00
0,00
0,00
0,00
0,00
0,00
Supplemental Benefits and other
-
Since the company will be restricted to the business of
producing and directing feature films and documentaries,
the investment essential for the proper development of
activity will focus on the cost of feature films.
Self-financing
Total Equity + Self-Financing
0,00
Debt Capital
Total Debt Capital
The financing of this business will be based on equity.
Generated self-financing will be used only for the
disbursement of dividends.
With the image and placing the company in the market
in mind, the investment will also include the Imagem
Corporativa (Corporate Image) and the creation of a Web
site.
With the above investments, the basic needs necessary for
the development of activity for the analyzed period are
satisfied.
Portimão Film Studio
Portimão Film Studio
The Auditing, to be carried out by another company,
will allow for regular assessments of management, and
execution of business plans and annual budgets.
040
041
PG.
PG.
3.3.1.6.11. Statement of Cash Flows
Business Plan
Business Plan
In the Statement of Cash Flows we note the investment
necessary in the first 2 years. Maintaining a dynamic
commercial law and ensuring strict control of
management, we can expect a huge return on investment
from the 4th year onward, as highlighted by this table.
We can check the activities of investment receipts from
subsidiaries.
Statement of Cash Flows (Direct Method)
OPERATIONAL ACTIVITIES
3.3.1.6.10. Statement of Working Capital
In the Statement of Working Capital we note some care
with respect to the payment cycles to suppliers in the 2nd
year. From the 3rd year on we have stabilization.
2010
2011
2012
2013
2014
2015
2016
Receipts from Clients
696.689,90
773.013,84
788.474,12
811.491,96
835.836,72
860.911,82
886.739,18
Payments to Suppliers
401.082,19
1.248.103,84
2.132.004,27
2.217.173,38
2.231.188,58
2.245.624,24
2.260.492,96
Payments to Personnel
843.422,27
860.290,71
877.496,53
903.821,42
930.936,07
958.864,15
987.630,07
Flow generated by operations
Payment/Receipt of IRC
0,00
0,00
0,00
0,00
0,00
0,00
0,00
-8.309,20
21.391,28
-4.873,56
-4.894,72
-5.045,56
-5.200,93
-5.360,96
Receipts extraordinary items
0,00
0,00
0,00
0,00
0,00
0,00
0,00
Payments extraordinary items
0,00
0,00
0,00
0,00
0,00
0,00
0,00
-556.123,76
-1.313.989,43
-2.225.900,24
-2.314.397,56
-2.331.333,49
-2.348.777,49
-2.366.744,82
Other Payments and Receipts Oper. activ
Flows generated before extr. items
Flow Operational Activities
INVESTIMENT ACTIVITIES
2010
2011
2012
2013
2014
2015
2016
Receipts from:
ACCOUNTS
2010
Clients (associated to Sales)
2012
2013
2014
2015
2016
0,00
0,00
0,00
0,00
0,00
0,00
0,00
Tangible Fixed Assets
0,00
0,00
0,00
0,00
0,00
0,00
0,00
Intangible Fixed Assets
0,00
0,00
0,00
0,00
0,00
0,00
0,00
Investment Subsidies
0,00
0,00
0,00
0,00
0,00
0,00
0,00
Similar Interest and Income
0,00
0,00
0,00
0,00
0,00
0,00
0,00
Dividendos
0,00
0,00
2.756.242,65
20.927.666,69
20.221.979,09
20.504.819,97
20.507.245,40
0,00
0,00
0,00
0,00
0,00
0,00
0,00
62.390,14
63.637,94
64.910,70
66.858,02
68.863,76
70.929,68
73.057,57
0,00
0,00
0,00
0,00
0,00
0,00
0,00
62.390,14
63.637,94
64.910,70
66.858,02
68.863,76
70.929,68
73.057,57
0,00
0,00
0,00
0,00
0,00
0,00
0,00
Clients without Provisions
62.390,14
63.637,94
64.910,70
66.858,02
68.863,76
70.929,68
73.057,57
Financial Investments
9.800.000,00
16.500.000,00
0,00
0,00
0,00
0,00
0,00
Clients after Provisions
62.390,14
63.637,94
64.910,70
66.858,02
68.863,76
70.929,68
73.057,57
Tangible Fixed Assets
5.260.000,00
10.000,00
10.000,00
10.000,00
10.000,00
10.000,00
10.000,00
1.340.000,00
10.000,00
10.000,00
10.000,00
10.000,00
10.000,00
10.000,00
0,00
0,00
0,00
0,00
0,00
0,00
0,00
-16.400.000,00
-16.520.000,00
2.736.242,65
20.907.666,69
20.201.979,09
20.484.819,97
20.487.245,40
Clients (associated to Services)
Clients C/C and others
Clients L/R
Provisions for Contested Charges
Other
Payments from:
Advances to Suppliers
0,00
0,00
0,00
0,00
0,00
0,00
0,00
Intangible Fixed Assets
Stock Raw Materials and Subsid.
0,00
0,00
0,00
0,00
0,00
0,00
0,00
Assets in Progress
Stock of Goods finished and intermediate
0,00
0,00
0,00
0,00
0,00
0,00
0,00
Other
Stock of Goods
0,00
0,00
0,00
0,00
0,00
0,00
0,00
Other, Prod. Course and adjustment
0,00
0,00
0,00
0,00
0,00
0,00
0,00
Provisions for depreciation of Stock
0,00
0,00
0,00
0,00
0,00
0,00
0,00
Stocks
0,00
0,00
0,00
0,00
0,00
0,00
0,00
Loans
Debts owed by State and other Public Entities
0,00
0,00
0,00
0,00
0,00
0,00
0,00
Capital Increase, Income Supplementals
Other Debts from 3rd Party Operations
0,00
0,00
0,00
0,00
0,00
0,00
0,00
62.390,14
63.637,94
64.910,70
66.858,02
68.863,76
70.929,68
73.057,57
Suppliers of Raw Materials and Subs.
0,00
0,00
0,00
0,00
0,00
0,00
Suppliers of Goods
0,00
0,00
0,00
0,00
0,00
Suppliers Outsourcing
0,00
0,00
0,00
0,00
Suppliers - Other
35.917,81
108.553,97
181.204,50
Suppliers C/C and other
35.917,81
108.553,97
181.204,50
0,00
0,00
35.917,81
0,00
-13.848,67
Total Needs
Fornecedores L/R
Suppliers
Advances to Clients
Debts to State and Other Public Entities
Other Debts from 3rd Party Operations
Total Resources
Needs in Working Capital
Needs in Working Capital before the project
Portimão Film Studio
2011
Financial Investments
Annual Investment in Working Capital Fund
2011
2012
2013
2014
2015
2016
Receipts from:
0,00
0,00
0,00
0,00
0,00
0,00
0,00
0,00
0,00
0,00
0,00
0,00
0,00
Subsidies and Donations
0,00
0,00
0,00
0,00
0,00
0,00
0,00
Loss Coverage
0,00
0,00
0,00
0,00
0,00
0,00
0,00
0,00
Cobertura de Prejuízos
0,00
0,00
0,00
0,00
0,00
0,00
0,00
0,00
0,00
Other
0,00
0,00
0,00
0,00
0,00
0,00
0,00
0,00
0,00
0,00
182.325,57
183.480,27
184.669,61
185.894,63
Loans
0,00
0,00
0,00
0,00
0,00
0,00
0,00
182.325,57
183.480,27
184.669,61
185.894,63
Depreciation Cont. Lease Fin. & equiv.
0,00
0,00
0,00
0,00
0,00
0,00
0,00
0,00
0,00
0,00
0,00
0,00
10.000,00
10.000,00
10.000,00
10.000,00
10.000,00
10.000,00
10.000,00
108.553,97
181.204,50
182.325,57
183.480,27
184.669,61
185.894,63
Dividends
0,00
0,00
0,00
16.669.080,46
1.192.009,46
265.410,20
-15.528,16
0,00
0,00
0,00
0,00
0,00
0,00
Capital Reductions & Supplemental Payments
0,00
0,00
0,00
0,00
0,00
0,00
0,00
12.571,03
12.829,11
13.223,99
13.630,71
14.049,63
14.481,12
Acquisition Stock (shares)
0,00
0,00
0,00
0,00
0,00
0,00
0,00
Reimbursable Subsidies
0,00
0,00
0,00
0,00
0,00
0,00
0,00
Other Debt MLP
0,00
0,00
0,00
0,00
0,00
0,00
0,00
34.990.000,00
-10.000,00
-10.000,00
-16.679.080,46
-1.202.009,46
-275.410,20
5.528,16
18.033.876,24
-17.843.989,43
500.342,42
1.914.188,67
16.668.636,14
17.860.632,27
18.126.028,74
0,00
18.033.876,24
189.886,81
690.229,23
2.604.417,90
19.273.054,04
37.133.686,31
18.033.876,24
189.886,81
690.229,23
2.604.417,90
19.273.054,04
37.133.686,31
55.259.715,05
0,00
0,00
0,00
0,00
0,00
0,00
0,00
121.125,00
194.033,62
195.549,56
197.110,98
198.719,24
200.375,75
40.321,00
-57.487,06
-129.122,92
-128.691,54
-128.247,21
-127.789,56
-127.318,18
0,00
2010
35.000.000,00
22.069,14
40.321,00
Flow Investment Activities
FINANCING ACTIVITIES
-97.808,05
-
-
-71.635,86
431,38
444,32
457,65
Payments from:
Interest & Similar Costs
Flow Financing Activities
Cash and cash equivalents variation
471,38
Exchange Rate Effect
Working Capital Fund in Terminal year
-127.318,18
-
-
-
-
-
-
Cash and cash equivalents at beginning of period
Working Capital Fund post-project – pre-project
-127.318,18
-
-
-
-
-
-
Cash and cash equivalents at end of period
Portimão Film Studio
Statement of Working Capital
Business Plan
Business Plan
Portimão Film Studio
Portimão Film Studio
042
043
PG.
PG.
PG.
PG.
Business Plan
045
Business Plan
044
3.3.1.6.12. Sensitivity Analysis
Performing a Sensitivity Analysis to loss of 20% in sales,
it can be concluded that the project remains perfectly
sustainable, showing that the in the holding costs are
overwhelmingly fixed. The sustainability will derive from
the disbursement of dividends from subsidiaries.
3.3.1.6.13. Closing Remarks
The Holding presents an overall scenario showing that the
project is feasible.
Further, considering that the projects of the subsidiaries,
as further ahead we will see, show even more positive
projections, we note that all the usual indicators in
economic feasibility studies lead us to the conclusion that
this project should be accepted.
Sensitivity to Variation in Sales and Services
Updated Rates
Key Project Indicators
-20%
8,00%
Effects in the Variation of Sales/ Serv.
(Indicators)
Financial Profitability
Critical point
Simulation
20,9%
20,9%
Minimum
1.102.282,53
94,7%
94,8%
20,0%
IRR without Residual Value
21,2%
21,8%
10,0%
55.259.715,05
56.353.533,61
27614,5%
28160,4%
Net Cash/ Oper. Income
Net Cash (Available-short-term loans)
ADDEND
Totals before and after simulation
6216,9%
7924,9%
55.259.715,05
56.353.533,61
2010
2011
Financial Profitability
10,0%
1.127.664,37
General Liquidity (Stock/Debts short-term)
20,95%
TIR
29,39%
---
---
-46,45%
VAL
38.229.532
51.993.861
18.660.958
CAF/Investment
216,65%
PR
6 years
6 years
7 anos
Asset Coverage
Capital structure
2012
2013
2014
2015
2016
759.080,04
774.261,64
789.746,88
813.439,28
837.842,46
862.977,73
888.867,07
Sales and Services after simulation
607.264,03
619.409,31
631.797,50
650.751,43
670.273,97
690.382,19
711.093,65
1.007.630,07
1.355.088,93
1.377.790,71
1.400.829,86
986.321,42
950.936,07
978.864,15
Variable costs before simulation
441.460,53
1.335.768,41
2.219.786,45
2.233.584,04
2.247.795,56
2.262.433,43
2.277.510,43
Variable costs after simulation
353.168,43
1.068.614,73
1.775.829,16
1.786.867,23
1.798.236,45
1.809.946,74
1.822.008,34
-1.037.469,43
-1.939.297,48
-74.626,78
18.521.200,51
17.861.089,92
18.126.500,12
18.110.971,96
Net Profit before simulation
16,00%
Profitability of Invested Capit
Financial Autonomy
Sales and Services before simulation
Fixed Costs before and after simulation
Portimão Film Studio
Reference
Margin of coverage (%)
Cash and Cash equivalent
4,00%
Full Operation/term.
Net profit after simulation
-1.085.112,35
-1.855.071,47
139.879,16
18.734.222,22
18.072.582,89
18.336.418,48
18.319.268,47
Cash before simulation
18.033.876,24
189.886,81
690.229,23
2.604.417,90
19.273.054,04
37.133.686,31
55.259.715,05
99,77%
276,00%
43147,64%
Debt M-L/CAF
0,00%
Debt M-L/Equity
0,00%
Financial Expenses/Operation Incomes
1,13%
Financial Debts /Equity
0,00%
Investment
0%
21%
4%
1%
Investments Summary (in Euros)
74%
Cash after simulation
17.986.233,32
226.469,90
941.318,25
3.068.528,64
19.948.657,74
38.019.208,36
56.353.533,61
Facilities
Equity before simulation
33.962.530,57
32.023.233,09
31.948.606,31
33.800.726,37
50.469.806,82
68.330.896,75
86.457.396,87
Basic Equipments
Equity after simulation
33.914.887,65
32.059.816,18
32.199.695,34
34.264.837,10
51.145.410,53
69.216.418,80
87.551.215,43
Net Cash Flow before simulation
-16.966.123,76
-17.843.989,43
500.342,42
18.583.269,13
17.860.645,60
18.126.042,47
18.110.500,58
Load Material and Transport
Net Cash Flow after simulation
-17.013.766,68
-17.759.763,41
714.848,35
18.796.290,84
18.072.138,56
18.335.960,83
18.318.797,08
Total Income before simulation
759.080,04
774.261,64
3.545.989,53
21.741.105,97
21.059.821,55
21.367.797,70
21.396.112,46
Total income after simulation
607.264,03
619.409,31
3.388.040,15
21.578.418,12
20.892.253,06
21.195.202,15
21.218.339,05
Facilities
Basic Equipments
Critical Point before simulation
3.238.532,08
-1.899.835,51
3.745.525,91
1.099.253,85
1.064.560,72
1.094.780,02
1.127.664,37
Load Material and Transport
Intangible fixed assets
Critical Point after simulation
3.238.532,08
-1.899.835,51
2.943.825,48
1.075.370,81
1.040.493,33
1.070.257,94
1.102.282,53
Other Investment
Intangible fixed assets
Other Investment
5.000.000
70.000
250.000
1.400.000
0
Portimão Film Studio
Variation of Sales and Services (+/-)
PG.
PG.
Business Plan
047
Business Plan
046
3.3.2. Picture Portugal Media Park, SA
3.3.2.3. Basis
3.3.2.5. Business Cycle
Social Designation: Picture Portugal Media Park, SA
(Property Management)
- Management and maintenance of the spaces owned
by the Holding, of the Media Park Portimão complex and
others.
Legal Form: Limited Company
- Inauguration of studios on the 1st of July 2011.
The framework of this project within the business cycle
is all-important for the normal operation of the studios.
It is for the company to guarantee the normal operation
of the studios, its dynamic as a “city of cinema” and the
maintenance of different equipments.
Headquarters: Parque de Feiras e Exposições (Fair and
Exposition Park) – Caldeira do Moinho
- First productions in 2010.
Classification of Economic Activity: 68322 – property
management
- Financial incentives and tax rebates in 2011.
- Organization of a flm festival in 2011
- The Film Studios will not be open to the genenral public.
Joint-stock: 1.300.000€
3.3.2.4. The underlying market
3.3.2.1. Ownership and Administrative Structure
Shareholders: 1
Name: Picture Portugal Portimão, SGPS, SA
Portimão Film Studio
3.3.2.6. Product
The company will have five different sound stages for rent
and 2 shops, a restaurant, 50 offices, 1 cinema, workshops,
a warehouse for props and lighting equipment, 3 areas
of post-production and a water tank. The rental periods
for the workshops, watertank, film and sound Stages are
in cycles of one day, a week or a month; the remaining
equipment is rented in monthly periods
Sales Strategy
3.3.2.7. Business Strategy
3.3.2.8. Financial Projections
To complement the dynamic of the Fund, it will be
necessary to directly contact the companies already
established in the market, mainly in Lisbon and Porto, and
offer them preferential terms to settle in the Media Park
and also develop their business in Portimão.
The Clients / Target Market
The first and primary client of the company is Picture
Portugal Media Fund, SA.
% Capital: 100%
Additionally, the Majors will be clients, with 3 productions
per year to be won by Picture Portugal Media Fund, SA.
Administration: Chairman of the Board, Vice-President and
3 members.
For the purposes of this business plan, additional
productions were not considered.
3.3.2.2. Social Scope
We add to these clients the companies providing services
and rental equipment that will be installed in the main
building of studios, mostly national firms and related to
production.
Picture Portugal Media Park, SA will concentrate its activity
in Property Management, rental spaces, in managing the
studios and TV, film laboratories, sub-letting of shared
services, car rental and event organization.
As to the creation of the supports for media dissemination,
promotion and information, these are inherent in the
promotion plan, bringing visibility to it. Thus, we envisage
the creation of flyers, a website that will promote the
widespread dissemination of content and institutional
advertising in industry magazines.
Communication is a key factor for success and permanence
of business strategy in the market. So we sought to define
the best way to disseminate the image and concept, as
well as reach the identified segments.
In fact, vibrant business comes first the dynamics of the
fund and then by national and local dynamics in attracting
small businesses to support the productions, and could
range from subtitling, dubbing, makeup, hair, lighting,
props, carpentry, stunt doubles, etc ...
The financial analysis that follows is a 7-year projection,
beginning with the present year.
The tables are in current prices, with an estimated annual
inflation rate of around 2% for 2010 and 2011 and 3% in
other years.
It was further assumed that in 2014 the conditions will
exist for what should be a year of full business operation.
In other words, that will be thee year the company
functions at capacity and is able to meet its pre-defined
objectives, both as to billing and market position.
Portimão Film Studio
8500-726 Portimão – Portugal
Media Business
PG.
PG.
Business Plan
049
Business Plan
048
Films to produce, by type per year
2010
3.3.2.8.1. Income
Income results from rental of offices and infrastructure for
the production of feature films and documentaries.
In order to ensure rapid occupancy, it is planned to enact a
discount on rent of 60% in 2011, 40% in 2012, 20% in 2013
and 10% in 2014
Occupancy of the buildings in weeks
Film Type 1
Film Type 2
Film Type
tipo 3
Documentaries
2013
2014
2015
2016
Turnover
Type 1
1
1
1
1
1
1
1
Type 2
1
2
2
2
2
2
2
6.280.000 €
Type 3
0
1
2
2
2
2
2
18.840.000 €
Documentaries New
1
2
3
7
7
7
7
490.000 €
Documentaries Restoration
4
8
7
3
3
3
3
255.000 €
Foreign Productions
0
2
3
3
3
3
3
Total
7
16
18
18
18
18
18
Foreign Productions
10
10
20
5
20
Studio 2
0
0
0
0
0
Studio 3
0
0
0
0
0
Studio 4
0
0
10
0
0
Studio 5
0
0
10
0
10
Watertank
0
0
1
0
1
Production Offices
2012
3.140.000 €
113
Revenues per year, by type of film
Studio 1
Exterior Lot
2011
2
2
4
1
4
16
16
32
8
32
Type 1
Type 2
Type 3
Documentaries News
Documentaries Restoraon
Foreign Producons
Restaurant
Store 1
Store 2
Incubator
Total
0%
2010
0
0
0
0
0
0
0
0
0
0
40%
2011
43200
86400
138640
43200
172800
277280
12.000 €
6.000 €
6.000 €
9.000 €
60%
2012
64800
129600
415920
97200
226800
623880
24.000 €
12.000 €
12.000 €
36.000 €
80%
2013
86400
172800
554560
302400
129600
831840
24.000 €
12.000 €
12.000 €
72.000 €
90%
2014
97200
194400
623880
340200
145800
935820
24.000 €
12.000 €
12.000 €
144.000 €
2015
108000
216000
693200
378000
162000
1039800
24.000 €
12.000 €
12.000 €
216.000 €
2016
108000
216000
693200
378000
162000
1039800
24.000 €
12.000 €
12.000 €
270.000 €
0
794520
1642200
2197600
2529300
2861000
2915000
Price list for the renting of spaces
2012
2013
2014
2015/2016
week
day
Month
Studio 1
60%
40%
20%
10%
10.800
2.500
35.000 €
Studio 2
60%
40%
20%
10%
10.800
2500
35.000 €
SERVICES
2010
2011
2012
2013
2014
2015
2016
Designation
Value
Value
Value
Value
Value
Value
Value
Studio 3
60%
40%
20%
10%
10.800
2500
35.000 €
Studio 4
60%
40%
20%
10%
10.800
2500
35.000 €
Studio 5
60%
40%
20%
10%
16.000
4.000
Watertank
60%
40%
20%
10%
10.800
Exterior Loft
60%
40%
20%
10%
2 free
2 free
1 free
1 free
20 hour free
20 hour free
10 hour free
10 hour free
Production Offices
Portimão Film Studio
2011
Screening room
1 - Space Rental Film Type
1
0,00
43.200,00
64.800,00
86.400,00
97.200,00
108.000,00
108.000,00
2 - Space Rental Film Type
2
0,00
86.400,00
129.600,00
172.800,00
194.400,00
216.000,00
216.000,00
50.000 €
3 - Space Rental Film Type
3
0,00
138.640,00
415.920,00
554.560,00
623.880,00
693.200,00
693.200,00
2500
35.000 €
4 - Space Rental Documentaries New
0,00
43.200,00
97.200,00
302.400,00
340.200,00
378.000,00
378.000,00
5 - Space Rental Documentaries Restoration
0,00
172.800,00
226.800,00
129.600,00
145.800,00
162.000,00
162.000,00
5.000
1.2500
16.000 €
6 – Film Rents earned projects
0,00
277.280,00
623.880,00
831.840,00
935.820,00
1.039.800,00
1.039.800,00
500
100
1.600 €
7 - Restaurant Rents
0,00
12.000,00
24.000,00
24.000,00
24.000,00
24.000,00
24.000,00
8 - Store Rents 1
0,00
6.000,00
12.000,00
12.000,00
12.000,00
12.000,00
12.000,00
9 – Store Rents 2
0,00
6.000,00
12.000,00
12.000,00
12.000,00
12.000,00
12.000,00
10 – Incubator Rents
0,00
9.000,00
36.000,00
72.000,00
144.000,00
216.000,00
270.000,00
0,00
794.520,00
1.642.200,00
2.197.600,00
2.529.300,00
2.861.000,00
2.915.000,00
200 €/ hour
Restaurant
6€
12€
12€
12€
12€
12€
2.000 €
Store 1
6€
12€
12€
12€
12€
12€
1.000 €
Store 2
Incubator (16 offices)
Project Services Render
6€
12€
12€
12€
12€
12€
1.000 €
12 €
48 €
98 €
144 €
192 €
192 €
750 €
Total
Portimão Film Studio
2010
PG.
PG.
Business Plan
051
Business Plan
050
We also stress the value of representation expenses,
specialized work, communications and costs to be charged
to the holding structure.
In supplies and services, the line item with the most
meaning is that of the subcontracts, being that all of the
business’s activity relies on outsourcing.
ESF LINE ITEMS
2010
The insurance coverage includes furniture.
2011
2012
2013
2014
2015
The line item advertising refers to the hosting and annual
maintenance of the site as well as merchandising.
“Other” includes the subscription of industry magazines,
and various other supplies.
The table below reflects the cost of company staff for the
period under review.
2016
Outsourcing
0,00
79.452,00
164.220,00
219.760,00
252.930,00
286.100,00
291.500,00
Electricity
0,00
60.000,00
61.800,00
63.654,00
65.563,62
67.530,53
69.556,44
25.302,67
25.808,72
26.324,90
27.114,64
27.928,08
28.765,93
29.628,90
Water
0,00
40.000,00
41.200,00
42.436,00
43.709,08
45.020,35
46.370,96
Non-durable tools and utensils
0,00
2.000,00
2.060,00
2.121,80
2.185,45
2.251,02
2.318,55
Books and technical documentation
0,00
2.000,00
2.060,00
2.121,80
2.185,45
2.251,02
2.318,55
Office Materials
10.000,00
10.300,00
10.609,00
10.927,27
11.255,09
11.592,74
11.940,52
Gift Items
10.000,00
10.300,00
10.609,00
10.927,27
11.255,09
11.592,74
11.940,52
Rents and Rentals
12.000,00
6.000,00
0,00
0,00
0,00
0,00
0,00
Representation Expenses
60.000,00
61.800,00
63.654,00
65.563,62
67.530,53
69.556,44
71.643,14
Communication
24.000,00
24.720,00
25.461,60
26.225,45
27.012,21
27.822,58
28.657,26
Insurance
10.000,00
20.000,00
20.600,00
21.218,00
21.854,54
22.510,18
23.185,48
0,00
0,00
200.000,00
206.000,00
212.180,00
218.545,40
225.101,76
Directorate
20.000,00
20.600,00
21.218,00
21.854,54
22.510,18
23.185,48
23.881,05
5.000,00
40.000,00
41.200,00
42.436,00
43.709,08
45.020,35
46.370,96
Manager
3.500,00
3.570,00
3.641,40
3.750,64
3.863,16
3.979,06
4.098,43
0,00
250.000,00
257.500,00
265.225,00
273.181,75
281.377,20
289.818,52
Secretary
1.500,00
1.530,00
1.560,60
1.607,42
1.655,64
1.705,31
1.756,47
Specialized works
50.000,00
51.500,00
53.045,00
54.636,35
56.275,44
57.963,70
59.702,61
Maintenance Technician
1.500,00
1.530,00
1.560,60
1.607,42
1.655,64
1.705,31
1.756,47
Other supplies and services
50.000,00
51.500,00
53.045,00
54.636,35
56.275,44
57.963,70
59.702,61
Maintenance Technician
1.500,00
1.530,00
1.560,60
1.607,42
1.655,64
1.705,31
1.756,47
276.302,67
755.980,72
1.054.606,50
1.136.858,09
1.197.541,04
1.259.049,37
1.293.637,85
Outsourcing Holding
Maintenance and repair
Advertising and promotion
Janitorial, Hygiene and comfort
Surveillance and security
Total
Portimão Film Studio
Specialized works are a set of solutions in the area of
management and accounting such as: secretarial service
and office administration, accounting and taxation,
controller / coaching, hosting and legal support.
Monthly Values:
MONTHLY COMPENSATION (WITHOUT SOCIAL CONTRIBUTIONS)
Categories
Average monthly compensation
2010
2011
2012
2013
2014
2015
2016
Portimão Film Studio
3.3.3.8.2. Costs
The costs of this activity are initially only estimated
in Supplies and External Services, staff costs and
depreciation.
052
053
PG.
PG.
Depreciation of Tangible
Yearly Values:
2010
2013
2014
2015
2016
Accumulated Depreciation and Adjustments
1.205.000,00
85.000,00
95.000,00
105.000,00
115.000,00
125.000,00
135.000,00
145.000,00
28.333,33
60.000,00
95.000,00
105.000,00
115.000,00
125.000,00
135.000,00
10.000,00
515.000,00
750.000,00
1.030.000,00
1.040.000,00
1.050.000,00
1.060.000,00
2.500,00
108.500,00
158.000,00
217.000,00
217.000,00
194.500,00
103.500,00
0,00
0,00
0,00
0,00
0,00
0,00
0,00
0,00
0,00
0,00
0,00
0,00
0,00
0,00
0,00
0,00
0,00
0,00
0,00
0,00
0,00
30.833,33
171.000,00
364.000,00
591.000,00
818.000,00
1.022.500,00
1.136.000,00
0,00
0,00
0,00
0,00
0,00
0,00
0,00
192.114,29
401.230,54
386.512,66
1.419.140,58
2.369.950,31
3.392.469,06
0,00
0,00
0,00
0,00
0,00
0,00
0,00
0,00
0,00
0,00
0,00
0,00
0,00
0,00
Finished goods and ongoing work
0,00
0,00
0,00
0,00
0,00
0,00
0,00
Goods
0,00
0,00
0,00
0,00
0,00
0,00
0,00
Other
0,00
0,00
0,00
0,00
0,00
0,00
0,00
Adjustments Stocks
0,00
0,00
0,00
0,00
0,00
0,00
0,00
49.000,00
49.980,00
50.979,60
52.508,99
54.084,26
55.706,79
57.377,99
Secretary
21.000,00
21.420,00
21.848,40
22.503,85
23.178,97
23.874,34
24.590,57
Maintenance Technician
21.000,00
21.420,00
21.848,40
22.503,85
23.178,97
23.874,34
24.590,57
Raw Materials, Subsid Consumption
Maintenance Technician
21.000,00
21.420,00
21.848,40
22.503,85
23.178,97
23.874,34
24.590,57
0,00
0,00
0,00
0,00
0,00
0,00
0,00
112.000,00
114.240,00
116.524,80
120.020,54
123.621,16
127.329,80
131.149,69
CATEGORIES
Stocks
Receivables – Short-term
SOCIAL CONTRIBUTIONS FOR PERSONNEL
2010
2011
2012
2013
2014
2015
2016
Directorate
0,00
65.303,01
134.975,34
180.624,66
233.343,20
406.363,87
464.371,74
Clients
0,00
65.303,01
134.975,34
180.624,66
207.887,67
235.150,68
239.589,04
State and other public entities
0,00
0,00
0,00
0,00
25.455,53
171.213,18
224.782,70
Other
0,00
0,00
0,00
0,00
0,00
0,00
0,00
Adjustments for doubtful debts
0,00
0,00
0,00
0,00
0,00
0,00
0,00
Manager
17.027,50
17.368,05
17.715,41
18.246,87
18.794,28
19.358,11
19.938,85
Secretary
7.297,50
7.443,45
7.592,32
7.820,09
8.054,69
8.296,33
8.545,22
Maintenance Technician
7.297,50
7.443,45
7.592,32
7.820,09
8.054,69
8.296,33
8.545,22
Deposits and Cash
Maintenance Technician
7.297,50
7.443,45
7.592,32
7.820,09
8.054,69
8.296,33
8.545,22
Accruals and deferrals
Securities
TOTAL ASSETS
Total Social Contribution
38.920,00
39.698,40
40.492,37
41.707,14
42.958,35
44.247,10
45.574,52
Compensation + Social Contribution
150.920,00
153.938,40
157.017,17
161.727,68
166.579,51
171.576,90
176.724,21
EQUITY
Joint-Stock
0,00
0,00
0,00
0,00
0,00
0,00
0,00
89.587,14
126.811,27
266.255,20
205.888,00
1.185.797,37
1.963.586,45
2.928.097,32
0,00
0,00
0,00
0,00
0,00
0,00
0,00
153.753,81
631.114,29
892.230,54
940.512,66
1.766.140,58
2.532.450,32
3.461.469,06
2010
2012
2013
2014
2015
2016
1.300.000,00
1.300.000,00
1.300.000,00
1.300.000,00
1.300.000,00
1.300.000,00
Stock (Company Shares)
0,00
0,00
0,00
0,00
0,00
0,00
0,00
Supplemental Payments
0,00
0,00
0,00
0,00
0,00
0,00
0,00
Reserves/Earnings
0,00
-467.456,00
-734.355,58
-514.999,11
101.822,13
786.674,87
1.685.805,67
-467.456,00
-266.899,58
219.356,47
616.821,25
684.852,74
899.130,80
977.835,96
0,00
0,00
0,00
616.821,25
684.852,74
899.130,80
977.835,96
132.544,00
565.644,42
785.000,89
785.000,89
1.401.822,13
2.086.674,87
2.985.805,67
Net Income
TOTAL EQUITY
LIABILITIES
!
2011
600.000,00
Anticipated Dividends
Accruals and deferrals
2016
1.185.000,00
89.587,14
Rolling Stock
Manager
Total Compensation
2015
1.165.000,00
Receivables – Medium and Long-Term
Directorate
2014
1.145.000,00
Assets Under Construction
2012
2013
855.000,00
Financial Investments Adjustments
2011
2012
610.000,00
Financial Investments
PERSONNEL ANNUAL COSTS (Compensations without Social Contributions)
2011
95.000,00
2010
2011
2012
2013
2014
2015
2016
Commons
0,00
0,00
0,00
0,00
0,00
0,00
0,00
Payable – Medium and Long-Term
0,00
0,00
0,00
0,00
0,00
0,00
0,00
Loans
0,00
0,00
0,00
0,00
0,00
0,00
0,00
Reimbursable grants
0,00
0,00
0,00
0,00
0,00
0,00
0,00
Supplies
0,00
0,00
0,00
0,00
0,00
0,00
0,00
Suppliers of fixed assets
0,00
0,00
0,00
0,00
0,00
0,00
0,00
Other
0,00
0,00
0,00
0,00
0,00
0,00
0,00
21.209,81
65.469,87
107.229,65
155.511,77
364.318,44
445.775,44
475.663,39
Payable – Short-term
Loans
0,00
0,00
0,00
0,00
0,00
0,00
0,00
Suppliers
22.709,81
62.135,40
86.679,99
93.440,39
98.428,03
103.483,51
106.326,40
State and other public entities
-1.500,00
3.334,47
20.549,67
62.071,38
265.890,41
342.291,93
369.336,99
0,00
0,00
0,00
0,00
0,00
0,00
0,00
Acréscimos e Diferimentos
0,00
0,00
0,00
0,00
0,00
0,00
0,00
Subsidies repayable
0,00
0,00
0,00
0,00
0,00
0,00
0,00
Others
TOTAL LIABILITIES
TOTAL EQUITY + LIABILITIES
21.209,81
65.469,87
107.229,65
155.511,77
364.318,44
445.775,44
475.663,39
153.753,81
631.114,29
892.230,54
940.512,66
1.766.140,58
2.532.450,32
3.461.469,06
Portimão Film Studio
Intangible
Tangible
2010
Business Plan
Business Plan
ASSETS
Gross Fixed
Depreciation of Intangible
CATEGORIES
The equity will also increase for the same reason the
liabilities increase – the Increase in Net Income.
Financial Projections
The company will have a Directorate composed of a
General Manager, a secretary and two maintenance
technicians.
Portimão Film Studio
In relation to liability, it continues increasing in the later
years of the project simply by virtue of the after-tax net
income being ever more consistent.
3.3.2.8.3. Financial Projections
The projection is that Property is increasing throughout
the period under review, mainly due to the purchase of
passenger and cargo vehicles.
Business Plan
Business Plan
Portimão Film Studio
Portimão Film Studio
054
055
PG.
PG.
057
PG.
PG.
3.3.2.8.5. Indicators
3.3.2.8.4. Breakout of Projected Results
In terms of net results, it bears mentioning that negative
net results are foreseen for the first 2 years, marginal
positive net revenue is expected in the third year, with the
expected positive results operating at full capacity from
the 4th year onward.
Business Plan
Business Plan
056
Next, we move to an analysis of the most significant
indictors in order to conclude this survey of the study’s
results.
BREAKOUT OF PROJECTED RESULTS
2010
2012
2013
2014
2015
Critical Point
2016
2010
2011
2012
2013
2014
2015
2016
0,00
0,00
0,00
0,00
0,00
0,00
Fixed Costs
106.293,33
217.135,87
271.508,58
307.863,84
310.289,76
290.288,45
201.862,10
Products
0,00
0,00
0,00
0,00
0,00
0,00
0,00
Variable Costs
361.162,67
844.283,71
1.151.334,95
1.238.974,20
1.305.873,26
1.371.870,48
1.409.356,62
Goods
0,00
0,00
0,00
0,00
0,00
0,00
0,00
Critical Point
0,00
-3.466.758,98
908.338,04
705.761,91
641.489,89
557.718,62
390.815,01
Domestic Market
0,00
0,00
0,00
0,00
0,00
0,00
0,00
Margin of Coverage (Income- Critical Point)
0,00
4.261.278,98
733.861,96
1.491.838,09
1.887.810,11
2.303.281,38
2.524.184,99
Foreign Market
0,00
0,00
0,00
0,00
0,00
0,00
0,00
Margin of Coverage (in %)
0,0%
536,3%
44,7%
67,9%
74,6%
80,5%
86,6%
0,00
794.520,00
1.642.200,00
2.197.600,00
2.529.300,00
2.861.000,00
2.915.000,00
Services
Domestic Market
0,00
0,00
0,00
0,00
0,00
0,00
0,00
Foreign Market
0,00
794.520,00
1.642.200,00
2.197.600,00
2.529.300,00
2.861.000,00
2.915.000,00
Change in Production
0,00
0,00
0,00
0,00
0,00
0,00
0,00
Work performed for Company
0,00
0,00
0,00
0,00
0,00
0,00
0,00
Other Operating Income (including reversals)
0,00
0,00
0,00
0,00
0,00
0,00
0,00
Income and Financial Gains Operation – Exchange Var.
0,00
0,00
0,00
0,00
0,00
0,00
0,00
Income and Financial Gains Operation – PP Discounts
0,00
0,00
0,00
0,00
0,00
0,00
0,00
Operating Income
0,00
794.520,00
1.642.200,00
2.197.600,00
2.529.300,00
2.861.000,00
2.915.000,00
Other Income and Financial Gains
0,00
0,00
0,00
0,00
0,00
0,00
0,00
Income and Extraordinary Gains
0,00
0,00
0,00
0,00
0,00
0,00
0,00
TOTAL INCOME
0,00
794.520,00
1.642.200,00
2.197.600,00
2.529.300,00
2.861.000,00
2.915.000,00
COSTS
2010
2011
2012
2013
2014
2015
2016
Cost of Goods Sold and Raw Materials Consumed
0,00
0,00
0,00
0,00
0,00
0,00
0,00
Goods
0,00
0,00
0,00
0,00
0,00
0,00
0,00
Raw materials, Subsid. & Consumer
Supplies and Services
Taxes
0,00
0,00
0,00
0,00
0,00
0,00
0,00
276.302,67
755.980,72
1.054.606,50
1.136.858,09
1.197.541,04
1.259.049,37
1.293.637,85
-600,00
1.333,79
8.219,87
11.252,27
15.042,47
17.032,67
17.356,67
Direct
-300,00
666,89
4.109,93
5.626,13
7.521,23
8.516,33
8.678,33
Indirect
-300,00
666,89
4.109,93
5.626,13
7.521,23
8.516,33
8.678,33
150.920,00
153.938,40
157.017,17
161.727,68
166.579,51
171.576,90
176.724,21
112.000,00
114.240,00
116.524,80
120.020,54
123.621,16
127.329,80
131.149,69
38.920,00
39.698,40
40.492,37
41.707,14
42.958,35
44.247,10
45.574,52
0,00
0,00
0,00
0,00
0,00
0,00
0,00
30.833,33
140.166,67
193.000,00
227.000,00
227.000,00
204.500,00
113.500,00
Supplies
0,00
0,00
0,00
0,00
0,00
0,00
0,00
Other Operation Costs
0,00
0,00
0,00
0,00
0,00
0,00
0,00
Income and Financial Gains Operation – Exchange Var.
0,00
0,00
0,00
0,00
0,00
0,00
0,00
Custos e Perdas Financ. Exploração - Descontos PP
0,00
0,00
0,00
0,00
0,00
0,00
0,00
457.456,00
1.051.419,58
1.412.843,53
1.536.838,04
1.606.163,02
1.652.158,93
1.601.218,72
Personnel Costs
Compensation
Social Contributions
Other
Depreciation and Adjustments
Operational Costs
Results before Financial Overhead and Extraord..
-457.456,00
-256.899,58
229.356,47
660.761,96
923.136,98
1.208.841,07
1.313.781,28
Other Costs and Financial Losses
10.000,00
10.000,00
10.000,00
10.000,00
10.000,00
10.000,00
10.000,00
Interests
10.000,00
10.000,00
10.000,00
10.000,00
10.000,00
10.000,00
10.000,00
Other
0,00
0,00
0,00
0,00
0,00
0,00
0,00
Extraordinary Costs
0,00
0,00
0,00
0,00
0,00
0,00
0,00
467.456,00
1.061.419,58
1.422.843,53
1.546.838,04
1.616.163,02
1.662.158,93
1.611.218,72
-467.456,00
-266.899,58
219.356,47
650.761,96
913.136,98
1.198.841,07
1.303.781,28
0,00
0,00
0,00
33.940,71
228.284,25
299.710,27
325.945,32
-467.456,00
-266.899,58
219.356,47
616.821,25
684.852,74
899.130,80
977.835,96
TOTAL COST
Profit Before Tax
Portimão Film Studio
2011
0,00
Impostos sobre Rendimento do Exercício
NET
Profitability of the Investment
2010
2011
2012
2013
2014
2015
2016
Operating Profit/Investment
-38,3%
-21,5%
19,2%
55,4%
77,3%
101,3%
110,1%
Capacity to Self-Finance/Investment
-36,6%
-10,6%
34,5%
70,7%
76,4%
92,5%
91,4%
The critical point is an indicator that calculates for a
given level of fixed costs, and for a certain proportion of
variable costs, which the amount of sales and services it is
necessary to achieve at least cover all costs.
The fixed costs are restricted to the depreciation of
property. Personnel costs are presented as 50% of fixed
costs and 50% of variable costs, while the variables are
cost with ESF and taxes.
The company achieves a margin of coverage gradually
reaching the value of 86.6% at the end of 7 years, this
margin being at full capacity.
Although for the first 2 years of investment the company
produces negative results, we can see that the return
on investment there is clearly positive from the 4th year
onward.
Portimão Film Studio
ASSETS
Sailes
PG.
PG.
Business Plan
059
Business Plan
058
2010
2011
2012
2014
2015
Debt & Risk
2016
-47,2%
27,9%
78,6%
48,9%
43,1%
32,7%
Profitability of Activity
0,0%
-16,0%
25,1%
38,4%
36,1%
38,6%
37,4%
Profitability of Production
0,0%
-33,6%
13,4%
28,1%
27,1%
31,4%
33,5%
Economic Efficiency
0,0%
-32,3%
14,0%
30,1%
36,5%
42,3%
45,1%
Profitability of Sales
0,0%
-33,6%
13,4%
28,1%
27,1%
31,4%
33,5%
Net Profit/Net Assets
-304,0%
-42,3%
24,6%
65,6%
38,8%
35,5%
28,2%
Gross Sales
0,00
794.520,00
1.642.200,00
2.197.600,00
2.529.300,00
2.861.000,00
2.915.000,00
Gross Sales/Nº employees
0,00
198.630,00
410.550,00
549.400,00
632.325,00
715.250,00
728.750,00
(Sales + Services)/Nº Employees
0,00
198.630,00
410.550,00
549.400,00
632.325,00
715.250,00
728.750,00
Personnel Overhead/(Sales+Services)
VAB/Nº Workers
VAB/Personnel Costs
VAB
0,0%
0,0%
0,0%
0,0%
0,0%
0,0%
0,0%
-69.075,67
9.634,82
146.898,38
265.185,48
332.939,74
400.487,66
405.340,54
-183,1%
25,0%
374,2%
655,9%
799,5%
933,7%
917,5%
-276.302,67
38.539,28
587.593,50
1.060.741,91
1.331.758,96
1.601.950,63
1.621.362,15
Regarding the indicators of general profitability, we see
a positive development. Most indicators reach their peak
in the 4th year as a result of the company reaching full
capacity.
The financial profitability is the ability of the company to
generate profit from its own capital.
This is mainly due to the stabilization of the sales and
production of its subsidiaries.
Portimão Film Studio
2013
-352,7%
Gross Margin Trading (GMT) is calculated as the difference
between the sum of our Services Rendered and
Subcontracted Services (essential to the business). With
the method of non-consolidated equity this indicator is not
relevant.
2010
2011
2012
2013
2014
2015
2016
13,8%
10,4%
12,0%
16,5%
20,6%
17,6%
0,0%
0,0%
0,0%
0,0%
0,0%
0,0%
0,0%
86,2%
89,6%
88,0%
83,5%
79,4%
82,4%
86,3%
Solvency
624,9%
864,0%
732,1%
504,8%
384,8%
468,1%
627,7%
Debt Capacity
624,9%
864,0%
732,1%
504,8%
384,8%
468,1%
627,7%
Fixed Coverage
206,6%
128,8%
159,9%
141,7%
404,0%
1284,1%
4327,3%
68.377,33
126.644,42
294.000,89
231.000,89
1.054.822,13
1.924.174,87
2.916.805,67
132.544,00
565.644,42
785.000,89
785.000,89
1.401.822,13
2.086.674,87
2.985.805,67
Debt
MLP Debt
Financial Autonomy
Working Capital
Permanent Capital
The level of debt and risk of the property management
company is perfectly controlled throughout the period
under review.
The company’s indebtedness in the medium and long
corresponds to the acquisition of supplies during the
phase of investment. In this company the value is null
throughout the project.
With regard to financial autonomy, it presents a ratio
very close to 90%, which shows a great capacity for selffinancing through equity.
13,7%
Solvency analyzes the relationship between the equity
and debt capital of a company. The management of
this financial indicator is important not to put at risk the
continuity of the company in the medium-to-long term.
The figures in the table above indicate full economic and
financial stability.
We can also cite the fact that the value of fixed capital
indicates a sound financial structure with a tendency to be
higher over the years.
We would also cite the fact that the fixed capital number
indicates a sound financial structure; in fact, expanding.
Portimão Film Studio
General Profitabiliity
Financial Profitability
060
061
PG.
PG.
2011
2012
2013
2014
2015
General Liquidity
422,4%
293,4%
374,2%
248,5%
389,5%
531,6%
713,2%
Reduced Liquidity
422,4%
293,4%
374,2%
248,5%
389,5%
531,6%
713,2%
Net Cash/Operational Income
0,0%
16,0%
16,2%
9,4%
46,9%
68,6%
100,4%
(NFM-FM)/Operational Income
0,0%
-16,0%
-16,2%
-9,4%
-46,9%
-68,6%
-100,4%
-422,4%
-76000,9%
959,6%
819,8%
-905,4%
-4982,3%
-25931,5%
Net Cash/NFM
Financial Overhead/Operational Income
Net Cash
2010
2011
-467.456,00
-266.899,58
219.356,47
616.821,25
684.852,74
899.130,80
30.833,33
140.166,67
193.000,00
227.000,00
227.000,00
204.500,00
113.500,00
-436.622,67
-126.732,91
412.356,47
843.821,25
911.852,74
1.103.630,80
1.091.335,96
10.000,00
505.000,00
235.000,00
280.000,00
10.000,00
10.000,00
10.000,00
0,00
0,00
0,00
0,00
0,00
0,00
59.000,00
85.000,00
10.000,00
10.000,00
10.000,00
10.000,00
10.000,00
10.000,00
0,00
0,00
0,00
0,00
0,00
0,00
10.000,00
-21.209,81
21.042,95
27.912,54
-2.632,80
-156.088,13
91.563,66
28.119,93
9. Residual Value of Invest. in Working Capital Fund
0,00
0,00
0,00
0,00
0,00
0,00
-11.291,64
10. Financial Investment + Works in Progress
0,00
0,00
0,00
0,00
0,00
0,00
0,00
11. Residual Value of Fin. Invest + Works in Progress
0,00
0,00
0,00
0,00
0,00
0,00
0,00
12. Divestment (Total Assets)
0,00
0,00
0,00
0,00
0,00
0,00
0,00
73.790,19
536.042,95
272.912,54
287.367,20
-136.088,13
111.563,66
48.119,93
1. Profit After Tax
2016
0,0%
1,3%
0,6%
0,5%
0,4%
0,3%
0,3%
89.587,14
126.811,27
266.255,20
205.888,00
1.185.797,37
1.963.586,45
2.928.097,32
2. Depreciation and Supplies
3. Capacity to Self-Finance (CAF)
4. Fixed Asset Investment
5. Residual Value of Invest. in Fixed Capital Assets
6. Investment in Intangible Fixed Assets
7. Residual Value of Invest. In Intangible Fixed Assets
8. Investment in Working Capital Fund
13. Net Investments (annual total)
14. Residual value (totals)
With regard to liquidity and net cash, this company
exhibits very favorable ratios.
The general liquidity gives us information about the
coverage of current assets by current liabilities, a means
to prime financing the company. Whenever possible it
should be > 1. We found that the firm in question reaches
values well above 100% for the period under review, not
requiring, therefore, use of permanent capital to finance
the portion not covered by current liabilities.
A comparison of overall liquidity with the decrease reveals
the weight of the remaining assets. Values do not vary as
the company is only providing services.
3.3.2.8.6. Viability
This table shows increased performance over the years,
making it foreseeable that this is to be a constant cash-flow
generating company.
According to forecast calculations, this project has a
very positive Net Present Value, as shown in the table
above. That is, invested capital is recovered along with an
attractive return.
The term of updated recovery of the investment is 5 years,
which means that in that time, the developer will recoup
the actual value of the investment costs through income
generated by their activity and begin to generate surplus.
It also has an internal rate of return much higher than rates
of return those obtainable in the financial markets.
The project has an IRR of 35.7%, which is a rather good
indicator and confirms the return on investment, wherefore
the project should be carried forward.
We consider, therefore, the viability of this project to be
guaranteed for the period analyzed, with good prospects
for continued development.
2013
2014
2015
2016
977.835,96
0,00
0,00
0,00
0,00
0,00
0,00
57.708,36
15. Net Cash Flows without Residual Value
-510.412,86
-662.775,86
139.443,92
556.454,05
1.047.940,86
992.067,14
1.043.216,03
16. Net Cash Flows with Residual Value
-510.412,86
-662.775,86
139.443,92
556.454,05
1.047.940,86
992.067,14
1.100.924,39
2010
2011
2012
2013
NPV, IRR AND PAYBACK PERIOD
Scenario I – Normal Update Rate
2014
2015
2016
Update Rate
8,0%
8,0%
8,0%
8,0%
8,0%
8,0%
8,0%
CAF Updated
-436.622,67
-117.345,29
353.529,21
669.852,51
670.238,98
751.112,58
687.726,77
Updated Net Cash Flows
-510.412,86
-613.681,36
119.550,69
441.731,16
770.267,82
675.184,22
657.403,06
Updated and Accumulated Net Cash Flows
-510.412,86
-1.124.094,22
-1.004.543,53
-562.812,36
207.455,45
882.639,68
1.540.042,73
73.790,19
496.336,07
233.978,52
228.121,35
-100.028,84
75.928,36
30.323,72
0,00
0,00
0,00
0,00
0,00
0,00
36.366,05
-510.412,86
-613.681,36
119.550,69
441.731,16
770.267,82
675.184,22
693.769,11
Updated Investment
Updated Final Year Residual Value
Updated Net Cash Flow + Residual Value
Established Values
Net present value (NPV) without residual value
NPV with Residual Value
Internal Return Rate (IRR) Without Residual Value
IRR with Residual Value
Updated Payback
Ano term.
1.540.042,73
3 anos
4 anos
-1.004.543,53
1.576.408,79
-
35,4%
-
5 anos
-562.812,36
-
6 anos
207.455,45
-
-20,9%
7 anos
882.639,68
-
14,4%
8 anos
1.540.042,73
-
28,1%
0,00
-
35,4%
35,4%
35,7%
5 Years
Scenario II – Low Updated Rate
2010
Taxa de Actualização
2011
2012
2013
2014
2015
2016
4,0%
4,0%
4,0%
4,0%
4,0%
4,0%
4,0%
CAF actualizada
-436.622,67
-121.858,57
381.246,73
750.154,02
779.455,54
907.104,07
862.498,66
Meios Libertos Líquidos actualizados
-510.412,86
-637.284,48
128.923,75
494.685,62
895.784,24
815.406,87
824.468,78
Meios Libertos Líquidos actualizados e acumulados
-510.412,86
-1.147.697,35
-1.018.773,60
-524.087,98
371.696,26
1.187.103,14
2.011.571,92
73.790,19
515.425,92
252.322,99
255.468,39
-116.328,70
91.697,20
38.029,88
0,00
0,00
0,00
0,00
0,00
0,00
45.607,75
-510.412,86
-637.284,48
128.923,75
494.685,62
895.784,24
815.406,87
870.076,53
Investimento actualizado
Valor Residual actualizado
Meios Libertos Líquidos actualizados + Valor Residual
Valores apurados
Valor Actualizado Líquido (VAL) sem Valor Residual
VAL com Valor Residual
Prazo de Recuperação (Payback) actualizado
Hipótese III - Taxa Actualização Alta
Year term.
2.011.571,92
3 anos
4 anos
-1.018.773,60
5 anos
-524.087,98
371.696,26
6 anos
7 anos
1.187.103,14
2.011.571,92
8 anos
0,00
2.057.179,67
5 Years
2010
2011
2012
2013
2014
2015
2016
Update Rate
16,0%
16,0%
16,0%
16,0%
16,0%
16,0%
16,0%
CAF Updated
-436.622,67
-109.252,51
306.448,03
540.600,56
503.608,15
525.452,99
447.930,39
Updated Net Cash Flows
-510.412,86
-571.358,50
103.629,55
356.496,56
578.768,41
472.336,08
428.179,94
Updated and Accumulated Net Cash Flows
-510.412,86
-1.081.771,36
-978.141,81
-621.645,26
-42.876,85
429.459,23
857.639,17
73.790,19
462.105,99
202.818,48
184.104,00
-75.160,26
53.116,91
19.750,45
0,00
0,00
0,00
0,00
0,00
0,00
23.685,95
-510.412,86
-571.358,50
103.629,55
356.496,56
578.768,41
472.336,08
451.865,89
Updated Investment
Portimão Film Studio
2012
Updated Residual Value
Updated Net Cash Flow + Residual Value
Established Values
Net present value (NPV) without residual value
NPV with residual Value
Updated Payback
Year term.
857.639,17
881.325,11
6 Years
3 anos
-978.141,81
4 anos
-621.645,26
5 anos
-42.876,85
6 anos
429.459,23
7 anos
857.639,17
8 anos
0,00
Portimão Film Studio
Business Plan
2010
Business Plan
CASH-FLOW
Liquidity and Net Cash
PG.
PG.
Business Plan
063
Business Plan
062
3.3.2.8.8. Necessary Investment Necessário
To start this project and given the initial projection of
the business, it’s been determined necessary to have the
explicit investment in the table below:
Investment
Partnership Management
It is necessary to create exchanges with elements of the
national and international systems of higher education, as
well as international business associations, so as to create a
conditions that attracts potential customers to the various
post production and administrative areas in the building.
Total Investment
Property and Resources, inf, buildings, const.
Equipments, tools and utens.
Cargo and Transportation Material
Other tangible investments
Total investment in tangible fixed assets
The accounts of the company will be managed by an
external entity and organized by cost centers. Being a
diversified and complex activity, it is necessary to evaluate
the profitability of each “pack”, or service, individually and
make regular assessments of the business.
Portimão Film Studio
Along with accounting balance sheets, progress reports
will be provided (also by an external company) that will
help understand the company’s situation and will support
the management of the business.
FINANCING
1.193.708,36
0,00
70.000,00
990.000,00
0,00
1.060.000,00
Totals
2010
The allocation of 600.000,00€ to joint-stock in the company
for the 1st year and 700.000,00€ in the 2nd year.
2011
2012
2013
2014
2015
2016
Equity
Joint-Stock
1.300.000,00
600.000,00
700.000,00
0,00
0,00
0,00
0,00
0,00
0,00
0,00
0,00
0,00
0,00
0,00
0,00
3.799.641,63
-436.622,67
-126.732,91
412.356,47
843.821,25
911.852,74
1.103.630,80
1.091.335,96
5.099.641,63
163.377,33
573.267,09
412.356,47
843.821,25
911.852,74
1.103.630,80
1.091.335,96
MLP Loans(+Bonds)
0,00
0,00
0,00
0,00
0,00
0,00
0,00
0,00
Shareholders/ Supplemental Loans
0,00
0,00
0,00
0,00
0,00
0,00
0,00
0,00
Asset Suppliers
0,00
0,00
0,00
0,00
0,00
0,00
0,00
0,00
Supplemental Benefits and other
Self-financing
Total Equity + Self-Financing
0,00
Debt Capital
Total investment in intangible fixed assets
145.000,00
Leasing
0,00
0,00
0,00
0,00
0,00
0,00
0,00
0,00
Investment in Working Capital Fund
-11.291,64
Other
0,00
0,00
0,00
0,00
0,00
0,00
0,00
0,00
0,00
0,00
0,00
0,00
0,00
0,00
0,00
0,00
Financial Investment
Financial information
Values
3.3.2.8.9. Necessary financing and economic value
O fiThe financing of this business will be based on equity
for the first two years and then through its own capacity to
self-finance.
0,00
Total Debt Capital
The investment crucial to the proper development of
activity will focus on passenger and cargo transport
vehicles; this will represent approximately 90% of the total
investment.
With the image and placing the company in the market
in mind, the investment will also include the Imagem
Corporativa (Corporate Image) and the creation of a Web
site.
With the above investments, the basic needs necessary for
the development of activity for the analyzed period are
satisfied.
Portimão Film Studio
3.3.2.8.7. Management and control of the business
Management and operational control requirements are
mandatory for good business performance. Thus, a modern
management system is intended, which is able to keep
up with changing needs. This business plan is sufficiently
detailed to easily and quickly create an actions plan and
budget that could be meticulously implemented.
065
PG.
PG.
3.3.2.8.11. Statement of Cash Flows
In the Statement of Cash Flows we found that this
company has a high capacity for self-management,
requiring an initial residual investment in relation to values
presented by the group. The lack of investments and the
reporting of consistent values in operational activities
account for the discussed conclusion.
3.3.2.8.10. Statement of Working Capital
In the Statement of Working Capital we note virtually no
risk. We’d only recommend more attention be paid in
the 1st year.
Business Plan
Business Plan
064
Statement of Cash Flows (Direct Method)
Statement of Working Capital
2010
ACCOUNTS
2011
2012
2013
2014
2015
OPERATIONAL ACTIVITIES
2016
2010
Receipts from Clients
Clients (associated to Sales)
0,00
0,00
0,00
0,00
0,00
0,00
0,00
Clients (associated to Services)
0,00
65.303,01
134.975,34
180.624,66
207.887,67
235.150,68
239.589,04
Clients C/C and others
0,00
0,00
0,00
0,00
0,00
0,00
0,00
Clients L/R
0,00
65.303,01
134.975,34
180.624,66
207.887,67
235.150,68
239.589,04
Provisions for Contested Charges
0,00
0,00
0,00
0,00
0,00
0,00
0,00
Clients without Provisions
0,00
65.303,01
134.975,34
180.624,66
207.887,67
235.150,68
239.589,04
Other Payments and Receipts Oper. activ
Clients after Provisions
0,00
65.303,01
134.975,34
180.624,66
207.887,67
235.150,68
239.589,04
Flows generated before extr. items
2011
2012
2013
2014
2015
2016
0,00
729.216,99
1.572.527,67
2.151.950,68
2.502.036,99
2.833.736,99
2.910.561,64
Payments to Suppliers
253.592,86
716.555,13
1.030.061,91
1.130.097,69
1.192.553,40
1.253.993,89
1.290.794,96
Payments to Personnel
150.920,00
153.938,40
157.017,17
161.727,68
166.579,51
171.576,90
176.724,21
Flow generated by operations
Payment/Receipt of IRC
0,00
0,00
0,00
0,00
59.396,24
374.041,90
353.279,78
-900,00
3.500,68
8.995,33
-3.671,27
-5.566,97
-12.057,17
-16.546,67
0,00
Advances to Suppliers
0,00
0,00
0,00
0,00
0,00
0,00
0,00
Receipts extraordinary items
0,00
0,00
0,00
0,00
0,00
0,00
Stock Raw Materials and Subsid.
0,00
0,00
0,00
0,00
0,00
0,00
0,00
Payments extraordinary items
0,00
0,00
0,00
0,00
0,00
0,00
0,00
Stock of Goods finished and intermediate
0,00
0,00
0,00
0,00
0,00
0,00
0,00
-405.412,86
-137.775,86
394.443,92
856.454,05
1.077.940,86
1.022.067,14
1.073.216,03
Stock of Goods
0,00
0,00
0,00
0,00
0,00
0,00
0,00
2010
2011
Other, Prod. Course and adjustment
0,00
0,00
0,00
0,00
0,00
0,00
0,00
Provisions for depreciation of Stock
0,00
0,00
0,00
0,00
0,00
0,00
0,00
Financial Investments
0,00
0,00
0,00
0,00
0,00
0,00
0,00
Stocks
0,00
0,00
0,00
0,00
0,00
0,00
0,00
Tangible Fixed Assets
Debts owed by State and other Public Entities
0,00
0,00
0,00
0,00
0,00
0,00
0,00
0,00
0,00
0,00
0,00
25.455,53
171.213,18
224.782,70
Intangible Fixed Assets
Other Debts from 3rd Party Operations
0,00
0,00
0,00
0,00
0,00
0,00
0,00
0,00
0,00
0,00
0,00
0,00
0,00
0,00
Investment Subsidies
0,00
0,00
0,00
0,00
0,00
0,00
0,00
Similar Interest and Income
0,00
0,00
0,00
0,00
0,00
0,00
0,00
0,00
0,00
0,00
0,00
0,00
0,00
0,00
Total Needs
Flow Operational Activities
INVESTIMENT ACTIVITIES
0,00
65.303,01
134.975,34
180.624,66
233.343,20
406.363,87
464.371,74
Suppliers of Raw Materials and Subs.
0,00
0,00
0,00
0,00
0,00
0,00
0,00
Suppliers of Goods
Dividendos
0,00
0,00
0,00
0,00
0,00
0,00
0,00
Other
Suppliers Outsourcing
2012
2013
2014
2015
2016
Receipts from:
0,00
6.530,30
13.497,53
18.062,47
20.788,77
23.515,07
23.958,90
Suppliers - Other
22.709,81
55.605,10
73.182,45
75.377,93
77.639,26
79.968,44
82.367,49
Suppliers C/C and other
Financial Investments
0,00
0,00
0,00
0,00
0,00
0,00
0,00
22.709,81
62.135,40
86.679,99
93.440,39
98.428,03
103.483,51
106.326,40
Tangible Fixed Assets
10.000,00
505.000,00
235.000,00
280.000,00
10.000,00
10.000,00
10.000,00
Intangible Fixed Assets
85.000,00
10.000,00
10.000,00
10.000,00
10.000,00
10.000,00
10.000,00
0,00
0,00
0,00
0,00
0,00
0,00
0,00
Fornecedores L/R
Suppliers
Advances to Clients
Debts to State and Other Public Entities
Other Debts from 3rd Party Operations
Total Resources
Needs in Working Capital
Needs in Working Capital before the project
Annual Investment in Working Capital Fund
Working Capital Fund in Terminal year
Working Capital Fund post-project – pre-project
0,00
0,00
0,00
0,00
0,00
0,00
0,00
22.709,81
62.135,40
86.679,99
93.440,39
98.428,03
103.483,51
106.326,40
0,00
0,00
0,00
0,00
0,00
0,00
0,00
-1.500,00
3.334,47
20.549,67
62.071,38
265.890,41
342.291,93
369.336,99
0,00
0,00
0,00
0,00
0,00
0,00
0,00
21.209,81
65.469,87
107.229,65
155.511,77
364.318,44
445.775,44
475.663,39
-21.209,81
-166,85
27.745,69
25.112,89
-130.975,24
-39.411,57
-11.291,64
-
-
-
21.042,95
27.912,54
-2.632,80
0,00
-21.209,81
-156.088,13
-
-
91.563,66
28.119,93
-11.291,64
-
-
-
-
-
-
-11.291,64
-
-
-
-
-
-
Payments from:
Assets in Progress
Other
Flow Investment Activities
FINANCING ACTIVITIES
-95.000,00
2010
-515.000,00
-245.000,00
-290.000,00
2011
2012
2013
-20.000,00
2014
-20.000,00
2015
-20.000,00
2016
Receipts from:
Loans
0,00
0,00
0,00
0,00
0,00
0,00
0,00
600.000,00
700.000,00
0,00
0,00
0,00
0,00
0,00
Subsidies and Donations
0,00
0,00
0,00
0,00
0,00
0,00
0,00
Loss Coverage
0,00
0,00
0,00
0,00
0,00
0,00
0,00
Cobertura de Prejuízos
0,00
0,00
0,00
0,00
0,00
0,00
0,00
Other
0,00
0,00
0,00
0,00
0,00
0,00
0,00
Loans
0,00
0,00
0,00
0,00
0,00
0,00
0,00
Depreciation Cont. Lease Fin. & equiv.
0,00
0,00
0,00
0,00
0,00
0,00
0,00
10.000,00
10.000,00
10.000,00
10.000,00
10.000,00
10.000,00
10.000,00
Dividends
0,00
0,00
0,00
616.821,25
68.031,49
214.278,06
78.705,16
Capital Reductions & Supplemental Payments
0,00
0,00
0,00
0,00
0,00
0,00
0,00
Acquisition Stock (shares)
0,00
0,00
0,00
0,00
0,00
0,00
0,00
Reimbursable Subsidies
0,00
0,00
0,00
0,00
0,00
0,00
0,00
Other Debt MLP
0,00
0,00
0,00
0,00
0,00
0,00
0,00
590.000,00
690.000,00
-10.000,00
-626.821,25
-78.031,49
-224.278,06
-88.705,16
89.587,14
37.224,14
139.443,92
-60.367,20
979.909,37
777.789,07
964.510,87
0,00
89.587,14
126.811,27
266.255,20
205.888,00
1.185.797,37
1.963.586,45
89.587,14
126.811,27
266.255,20
205.888,00
1.185.797,37
1.963.586,45
2.928.097,32
Capital Increase, Income Supplementals
Portimão Film Studio
Interest & Similar Costs
Flow Financing Activities
Cash and cash equivalents variation
Exchange Rate Effect
Cash and cash equivalents at beginning of period
Cash and cash equivalents at end of period
Portimão Film Studio
Payments from:
PG.
PG.
Business Plan
067
Business Plan
066
3.3.2.8.12. Sensitivity Analysis
Performing a Sensitivity Analysis with a decrease of
20% in services rendered, it can be concluded that the
project remains very stable. Noteworthy is that the Note
that the Supply and External Services and Excise will be
variable costs. Staff costs are half fixed and half variable.
Depreciation of fixed assets will be 100% fixed costs.
3.3.2.8.13. Closing Remarks
The Property Management company brings together a
scenario that demonstrates that the project is feasible.
With reduced fixed and variable costs and with the rents
management activity we’re presented with a low risk
scenario, as confirmed by the above figures, such as the
Internal Rate of Return of 35.72%, the net added value to
rise 1.5 million and with a recovery period of investment
of 5 years. The term of recovery period of invested capital
is not shorter simply due to the amortizations.
Sensitivity to Variation in Sales and Services
-20%
Effects in the Variation of Sales/ Serv.
(Indicators)
Financial Profitability
Critical point
Simulation
32,7%
34,2%
390.815,01
390.815,01
Updated Rates
Key Project Indicators
Minimum
8,00%
10,0%
4,00%
16,00%
Margin of coverage (%)
86,6%
0,0%
20,0%
Financial Profitability
32,75%
TIR
35,72%
---
---
IRR without Residual Value
35,4%
28,0%
10,0%
Profitability of Invested Capital
303,38%
VAL
1.576.409
2.057.180
881.325
CAF/Investment
318,31%
PR
5 anos
5 anos
6 anos
Cash and Cash equivalent
2.928.097,32
2.139.582,70
General Liquidity (Stock/Debts short-term)
713,2%
547,4%
Net Cash/ Oper. Income
100,4%
91,7%
2.928.097,32
2.139.582,70
Net Cash (Available-short-term loans)
ADDEND
Totals before and after simulation
2010
2011
Financial Autonomy
2012
2013
2014
2015
2016
Sales and Services before simulation
0,00
794.520,00
1.642.200,00
2.197.600,00
2.529.300,00
2.861.000,00
2.915.000,00
Sales and Services after simulation
0,00
635.616,00
1.313.760,00
1.758.080,00
2.023.440,00
2.288.800,00
2.332.000,00
Fixed Costs before and after simulation
106.293,33
217.135,87
271.508,58
307.863,84
310.289,76
290.288,45
201.862,10
Variable costs before simulation
361.162,67
844.283,71
1.151.334,95
1.238.974,20
1.305.873,26
1.371.870,48
Variable costs after simulation
4327,25%
Capital structure
627,71%
0,00%
Debt M-L/Equity
0,00%
1.409.356,62
Financial Expenses/Operation Incomes
0,34%
Financial Debts /Equity
288.930,14
675.426,97
921.067,96
991.179,36
1.044.698,61
1.097.496,39
1.127.485,29
-467.456,00
-266.899,58
219.356,47
616.821,25
684.852,74
899.130,80
977.835,96
Net profit after simulation
-413.281,60
-259.435,02
145.726,71
473.027,38
501.338,73
675.761,37
751.989,45
89.587,14
126.811,27
266.255,20
205.888,00
1.185.797,37
1.963.586,45
2.928.097,32
Cash after simulation
143.761,54
188.450,23
254.264,40
50.103,33
846.498,69
1.400.918,34
2.139.582,70
Equity before simulation
132.544,00
565.644,42
785.000,89
785.000,89
1.401.822,13
2.086.674,87
2.985.805,67
186.718,40
627.283,38
773.010,09
629.216,22
1.062.523,45
1.524.006,76
2.197.291,06
Facilities
-510.412,86
-662.775,86
139.443,92
556.454,05
1.047.940,86
992.067,14
1.043.216,03
Basic Equipments
Net Cash Flow after simulation
-456.238,46
-655.311,31
65.814,17
412.660,18
864.426,85
768.697,71
817.369,52
Total Income before simulation
0,00
794.520,00
1.642.200,00
2.197.600,00
2.529.300,00
2.861.000,00
2.915.000,00
Total income after simulation
0,00
635.616,00
1.313.760,00
1.758.080,00
2.023.440,00
2.288.800,00
2.332.000,00
Critical Point before simulation
0,00
-3.466.758,98
908.338,04
705.761,91
641.489,89
557.718,62
390.815,01
Critical Point after simulation
0,00
-3.466.758,98
908.338,04
705.761,91
641.489,89
557.718,62
390.815,01
Investment
0%
12%
0,00%
Investments Summary (in Euros)
Net Cash Flow before simulation
Equity after simulation
86,26%
Asset Coverage
Debt M-L/CAF
Net Profit before simulation
Cash before simulation
Portimão Film Studio
Reference
6%
82%
0
70.000
Load Material and Transport
990.000
Intangible fixed assets
145.000
Other Investment
0%
0
Facilities
Basic Equipments
Load Material and Transport
Intangible fixed assets
Other Investment
Portimão Film Studio
Variation of Sales and Services (+/-)
069
PG.
PG.
3.3.3.3. Basis
3.3.3.4. The underlying Market
Social Designation: Picture Portugal Production Services,
SA (Producer)
- It is assumed that there is to be an investment in feature
films in co-production with the US, at cruising speed, for 4
per year with a global budget of up to 10 million Euros and
one with a budget of up to 50 million Euros
The Clients / Target Market
Legal Form: Limited Company
Headquarters: Parque de Feiras e Exposições (Fair and
Exposition Park) – Caldeira do Moinho
8500-726 Portimão - Portugal
Classification of Economic Activity: 59110 – Production of
films, videos and television programs;
59120 – Technical activities of post-production of
films, videos and television programs;
- It is assumed aid to production will be to 3 feature films
annually, of US origin and without direct investment.
- Being that the focus of the project is executive
production, the totality below the line will be considered
global revenue and exclusive to the producer in any
production.
Additionally, the Majors will be clients, with 3 productions
per year to be won by Picture Portugal Media Fund, SA.
. The entire “below the line” cost of film production in
Portugal will be executed and billed by the company in a
single invoice producing a direct gross margin of 3%.
3.3.3.5. Business Cycle
- First productions in 2010.
The framework of this project within the business cycle
is all-important for the normal operation of the studios.
It is for the company to guarantee the normal operation
of the studios, its dynamic as a “city of cinema” and the
maintenance of different equipments.
- Participation in international festivals.
3.3.3.6. Products / Services
Shareholders: 1
- Opening of an office in Los Angeles.
Name: Picture Portugal Portimão, SGPS, SA
- Fiscal incentives and tax rebates in 2011.
% Capital: 100%
- The organization of a film festival in 2011 sponsored by
the City of Portimão.
100% of all services, products, and human resources
provided by the company will be outsourced; these are
of variable cost. Outsourcing will have a margin of 5% for
productions financed by the Fund and 3% for productions
of the Majors. These minimum margins must be strictly
observed to carry out this business plan.
- The film studios will not be open to the general public.
3.3.3.7. Business Strategy
Joint-stock: 1.000.000€
3.3.3.1. Ownership and Administrative Structure
Administration: Chairman of the Board, Vice-President and
3 members.
3.3.3.2. Social Scope
Picture Production Services Portugal, SA will base its
activity on Audiovisual Production, production of short
and feature films, video game production, production of
video clips, production of advertisements
Portimão Film Studio
- It is assumed that 10 documentaries will be produced per
year, 8 new and 2 restorations.
The first and primary client of the company is Picture
Portugal Media Fund, SA. The entire “below the line” cost
of film production of will be executed and billed by the
company producing a direct gross margin of 5%.
- Studios to open on 1st of July.
Communication is a key factor for success and permanence
of business strategy in the market. So we sought to define
the best way to disseminate the image and concept, as
well as reach the identified segments.
The decision will be made to for a diversified approach,
guaranteeing the complete success of the strategy.
Media Business
As to the creation of the supports for media dissemination,
promotion and information, these are inherent in the
promotion plan, bringing visibility to it. Thus, we envisage
the creation of flyers, a website that will promote the
widespread dissemination of content and institutional
advertising in industry magazines.
Business Plan
3.3.3. Picture Portugal Production Services, SA
Sales Strategy
Offer
Since all sales originate directly or indirectly from the Fund,
the sales strategy is centered on the procurement and
excellent management of the same. The manager of this
company should be extremely demanding, and a shrewd
and highly negotiator so that it can meet the clients’ needs
and comply with the ratios presented in gross margin.
3.3.3.8. Financial Projections
The financial analysis that follows is a 5-year projection,
beginning with the present year.
The tables are in current prices, with an estimated annual
inflation rate of around 2% for the two first years and 3% in
the following years.
It was further assumed that in 2012 the conditions will
exist for what should be a year of full business operation.
In other words, that will be thee year the company
functions at capacity and is able to meet its pre-defined
objectives, both as to billing and market position.
Portimão Film Studio
Business Plan
068
PG.
PG.
Business Plan
071
Business Plan
070
3.3.3.8.1. Income
The sales come exclusively from the Media Fund Picture
Portugal, SA and 3 productions from the Majors, won by
the Fund. For the first, a minimum margin of 5% of overall
invoicing is foreseen, and for the second 3%.
The overall volume of the first is the total below-the-line
of all the films to produce € 770,000 per film production
of type 1, 2 times for type 2 and 6 times for the type 3 and
105,000 € for each documentary, and for the second a
value of 5,000,000 € per production was considered with 3
annual productions at full capacity
Total
Outsourcing
The company will outsource all customer needs: services,
rental of equipment, human resources, etc ... Outsourcing
accounts for 95% of revenues on films originating from the
Fund and 97% of revenues from the Majors.
In supplies and services, the line item with the most
meaning is that of the subcontracts, being that all of the
business’s activity relies on outsourcing.
We also stress the value of representation expenses,
specialized work, communications and costs to be charged
to the holding structure.
Films to produce, by type per year
Type 1
Type 2
Type 3
Documentaries News
Documentaries Restoraon
Foreign Producons
Restaurant
Store 1
Store 2
Incubator
3.3.3.8.2. Costs
The costs of this activity are initially only estimated
in Supplies and External Services, staff costs and
depreciation.
0%
2010
0
0
0
0
0
0
0
0
0
0
40%
2011
43200
86400
138640
43200
172800
277280
12.000 €
6.000 €
6.000 €
9.000 €
60%
2012
64800
129600
415920
97200
226800
623880
24.000 €
12.000 €
12.000 €
36.000 €
80%
2013
86400
172800
554560
302400
129600
831840
24.000 €
12.000 €
12.000 €
72.000 €
90%
2014
97200
194400
623880
340200
145800
935820
24.000 €
12.000 €
12.000 €
144.000 €
2015
108000
216000
693200
378000
162000
1039800
24.000 €
12.000 €
12.000 €
216.000 €
2016
108000
216000
693200
378000
162000
1039800
24.000 €
12.000 €
12.000 €
270.000 €
0
794520
1642200
2197600
2529300
2861000
2915000
Specialized works are a set of solutions in the area of
management and accounting such as: secretarial service
and office administration, accounting and taxation,
controller / coaching, hosting and legal support.
The insurance coverage includes furniture.
The line item advertising refers to the hosting and annual
maintenance of the site as well as merchandising.
“Other” includes the subscription of industry magazines,
and various other supplies.
Project Services Render
2010
2011
2012
2013
2014
2015
2016
Valor
Valor
Valor
Valor
Valor
Valor
Valor
1 - Films Type 1
769.907,00
769.907,00
769.907,00
769.907,00
769.907,00
769.907,00
769.907,00
2 - Films Type 2
1.539.814,00
3.079.628,00
3.079.628,00
3.079.628,00
3.079.628,00
3.079.628,00
3.079.628,00
3 - Films Type 3
0,00
4.619.442,00
9.238.884,00
9.238.884,00
9.238.884,00
9.238.884,00
9.238.884,00
665.000,00
4 - Documentaries - New
95.000,00
190.000,00
285.000,00
665.000,00
665.000,00
665.000,00
380.000,00
760.000,00
665.000,00
285.000,00
285.000,00
285.000,00
285.000,00
6 - Films – Earned Projects
0,00
10.000.000,00
15.000.000,00
15.000.000,00
15.000.000,00
15.000.000,00
15.000.000,00
7-
0,00
0,00
0,00
0,00
0,00
0,00
0,00
8-
0,00
0,00
0,00
0,00
0,00
0,00
9-
0,00
0,00
0,00
0,00
0,00
10 -
0,00
0,00
0,00
0,00
2.784.721,00
19.418.977,00
29.038.419,00
29.038.419,00
5 - Documentaries Restoration
Portimão Film Studio
ESF LINE ITEMS
Total
2010
Outsourcing
Outsourcing Holding
Books and technical documentation
Office Materials
Gift Items
2011
2012
2013
2014
2015
2016
2.645.484,95
18.648.028,15
27.886.498,05
27.886.498,05
27.886.498,05
27.886.498,05
27.886.498,05
168.684,45
172.058,14
175.499,30
180.764,28
186.187,21
191.772,83
197.526,01
2.000,00
2.040,00
2.080,80
2.143,22
2.207,52
2.273,75
2.341,96
10.000,00
10.200,00
10.404,00
10.716,12
11.037,60
11.368,73
11.709,79
10.000,00
10.200,00
10.404,00
10.716,12
11.037,60
11.368,73
11.709,79
120.000,00
122.400,00
124.848,00
128.593,44
132.451,24
136.424,78
140.517,52
Representation Expenses
60.000,00
61.200,00
62.424,00
64.296,72
66.225,62
68.212,39
70.258,76
Communication
24.000,00
24.480,00
24.969,60
25.718,69
26.490,25
27.284,96
28.103,50
0,00
Advertising and promotion
20.000,00
20.400,00
20.808,00
21.432,24
22.075,21
22.737,46
23.419,59
0,00
0,00
Specialized works
50.000,00
51.000,00
52.020,00
53.580,60
55.188,02
56.843,66
58.548,97
0,00
0,00
0,00
Other supplies and services
50.000,00
51.000,00
52.020,00
53.580,60
55.188,02
56.843,66
58.548,97
29.038.419,00
29.038.419,00
29.038.419,00
3.160.169,40
19.173.006,29
28.421.975,75
28.438.040,08
28.454.586,34
28.471.628,99
28.489.182,92
Rents and rentals
Total
Portimão Film Studio
SERVICES
Designation
PG.
PG.
Business Plan
073
Business Plan
072
The table below reflects the cost of company staff for the
period under review.
The production company will have a Directorate
comprising a General Manager, a secretary and a
technician.
Monthly Values:
Valores Anuais:
MONTHLY COMPENSATION (WITHOUT SOCIAL CONTRIBUTIONS)
Categories
ANNUAL COSTS (Compensations without Social Contributions)
CATEGORIES
Average monthly compensation
2010
Directorate
2011
2012
2013
2014
2015
2016
0,00
0,00
0,00
0,00
0,00
0,00
Manager
3.500,00
3.570,00
3.641,40
3.750,64
3.863,16
3.979,06
4.098,43
Secretary
1.500,00
1.530,00
1.560,60
1.607,42
1.655,64
1.705,31
1.756,47
Technician
2.000,00
2.040,00
2.080,80
2.143,22
2.207,52
2.273,75
2.341,96
2010
2011
2012
2013
2014
2015
2016
Directorate
0,00
0,00
0,00
0,00
0,00
0,00
0,00
Manager
49.000,00
49.980,00
50.979,60
52.508,99
54.084,26
55.706,79
57.377,99
Secretary
21.000,00
21.420,00
21.848,40
22.503,85
23.178,97
23.874,34
24.590,57
Technician
28.000,00
28.560,00
29.131,20
30.005,14
30.905,29
31.832,45
32.787,42
98.000,00
99.960,00
101.959,20
105.017,98
108.168,52
111.413,57
114.755,98
Total Compensation
SOCIAL CONTRIBUTIONS FOR PERSONNEL
2011
2012
2013
2014
2015
2016
0,00
0,00
0,00
0,00
0,00
0,00
0,00
Manager
17.027,50
17.368,05
17.715,41
18.246,87
18.794,28
19.358,11
19.938,85
Secretary
7.297,50
7.443,45
7.592,32
7.820,09
8.054,69
8.296,33
8.545,22
Technician
9.730,00
9.924,60
10.123,09
10.426,78
10.739,59
11.061,78
11.393,63
Total Social Contribution
Compensation + Social Contribution
Portimão Film Studio
2010
34.055,00
34.736,10
35.430,82
36.493,75
37.588,56
38.716,22
39.877,70
132.055,00
134.696,10
137.390,02
141.511,72
145.757,07
150.129,79
154.633,68
Portimão Film Studio
CATEGORIES
Directorate
075
PG.
PG.
In relation to liability, it only increases beginning in the
3rd year on due to liabilities to the State in the short term
by virtue of the positive after-tax net income from the
preceding years.
Despite the narrow margins, it is important to note that
costs generally vary, according to the invoicing.
The equity will also increase for the same reason the
liabilities increase – the Increase in Net Income.
BREAKOUT OF PROJECTED RESULTS
Financial Projections
ASSETS
Gross Fixed
2010
2011
2012
2013
2014
2015
ASSETS
2016
135.000,00
155.000,00
175.000,00
195.000,00
235.000,00
255.000,00
275.000,00
85.000,00
95.000,00
105.000,00
115.000,00
145.000,00
155.000,00
165.000,00
28.333,33
60.000,00
95.000,00
105.000,00
121.666,67
138.333,33
155.000,00
50.000,00
60.000,00
70.000,00
80.000,00
90.000,00
100.000,00
110.000,00
12.500,00
15.000,00
17.500,00
20.000,00
10.000,00
10.000,00
10.000,00
0,00
0,00
0,00
0,00
0,00
0,00
0,00
0,00
0,00
0,00
0,00
0,00
0,00
0,00
0,00
0,00
0,00
0,00
0,00
0,00
0,00
40.833,33
87.500,00
140.000,00
170.000,00
196.666,67
223.333,33
250.000,00
0,00
0,00
0,00
0,00
0,00
0,00
0,00
307.328,91
2.012.082,66
2.811.121,46
3.309.331,52
3.651.079,67
3.949.590,35
4.231.520,91
0,00
0,00
0,00
0,00
0,00
0,00
0,00
Raw Materials, Subsid Consumption
0,00
0,00
0,00
0,00
0,00
0,00
0,00
Finished goods and ongoing work
0,00
0,00
0,00
0,00
0,00
0,00
0,00
Goods
0,00
0,00
0,00
0,00
0,00
0,00
0,00
Other
0,00
0,00
0,00
0,00
0,00
0,00
0,00
Adjustments Stocks
0,00
0,00
0,00
0,00
0,00
0,00
0,00
228.881,18
1.596.080,30
2.386.719,37
2.386.719,37
2.445.131,33
2.460.593,64
2.456.553,26
228.881,18
1.596.080,30
2.386.719,37
2.386.719,37
2.386.719,37
2.386.719,37
2.386.719,37
State and other public entities
0,00
0,00
0,00
0,00
58.411,96
73.874,27
69.833,89
Other
0,00
0,00
0,00
0,00
0,00
0,00
0,00
Adjustments for doubtful debts
0,00
0,00
0,00
0,00
0,00
0,00
0,00
Intangible
Depreciation of Intangible
Tangible
Depreciation of Tangible
Financial Investments
Financial Investments Adjustments
Assets Under Construction
Accumulated Depreciation and Adjustments
Receivables – Medium and Long-Term
Rolling Stock
Stocks
Receivables – Short-term
Clients
Securities
Deposits and Cash
0,00
0,00
0,00
0,00
0,00
0,00
0,00
78.447,73
416.002,36
424.402,09
922.612,15
1.205.948,34
1.488.996,71
1.774.967,65
0,00
0,00
0,00
0,00
0,00
0,00
0,00
401.495,58
2.079.582,66
2.846.121,46
3.334.331,52
3.689.413,01
3.981.257,01
4.256.520,91
Accruals and deferrals
TOTAL ASSETS
EQUITY
Joint-Stock
2010
2011
2012
2013
2014
2015
2016
2010
2011
2012
2013
2014
2015
2016
Sailes
0,00
0,00
0,00
0,00
0,00
0,00
0,00
Products
0,00
0,00
0,00
0,00
0,00
0,00
0,00
Goods
0,00
0,00
0,00
0,00
0,00
0,00
0,00
Domestic Market
0,00
0,00
0,00
0,00
0,00
0,00
0,00
Foreign Market
0,00
0,00
0,00
0,00
0,00
0,00
0,00
2.784.721,00
19.418.977,00
29.038.419,00
29.038.419,00
29.038.419,00
29.038.419,00
29.038.419,00
Services
0,00
0,00
0,00
0,00
0,00
0,00
0,00
2.784.721,00
19.418.977,00
29.038.419,00
29.038.419,00
29.038.419,00
29.038.419,00
29.038.419,00
Change in Production
0,00
0,00
0,00
0,00
0,00
0,00
0,00
Work performed for Company
0,00
0,00
0,00
0,00
0,00
0,00
0,00
Other Operating Income (including reversals)
0,00
0,00
0,00
0,00
0,00
0,00
0,00
Income and Financial Gains Operation – Exchange Var.
0,00
0,00
0,00
0,00
0,00
0,00
0,00
Income and Financial Gains Operation – PP Discounts
0,00
0,00
0,00
0,00
0,00
0,00
0,00
2.784.721,00
19.418.977,00
29.038.419,00
29.038.419,00
29.038.419,00
29.038.419,00
29.038.419,00
Other Income and Financial Gains
0,00
0,00
0,00
0,00
0,00
0,00
0,00
Income and Extraordinary Gains
0,00
0,00
0,00
0,00
0,00
0,00
0,00
2.784.721,00
19.418.977,00
29.038.419,00
29.038.419,00
29.038.419,00
29.038.419,00
29.038.419,00
Domestic Market
Foreign Market
Operating Income
TOTAL INCOME
COSTS
2010
2011
2012
2013
2014
2015
2016
Cost of Goods Sold and Raw Materials Consumed
0,00
0,00
0,00
0,00
0,00
0,00
0,00
Goods
0,00
0,00
0,00
0,00
0,00
0,00
0,00
Raw materials, Subsid. & Consumer
0,00
0,00
0,00
0,00
0,00
0,00
0,00
2.991.484,95
19.004.408,15
28.253.569,45
28.264.581,59
28.275.924,10
28.287.606,88
28.299.640,14
Supplies and Services
0,00
0,00
0,00
0,00
0,00
0,00
0,00
Direct
0,00
0,00
0,00
0,00
0,00
0,00
0,00
Indirect
0,00
0,00
0,00
0,00
0,00
0,00
0,00
188.650,00
192.423,00
196.271,46
202.159,60
208.224,39
214.471,12
220.905,26
140.000,00
142.800,00
145.656,00
150.025,68
154.526,45
159.162,24
163.937,11
48.650,00
49.623,00
50.615,46
52.133,92
53.697,94
55.308,88
56.968,15
0,00
0,00
0,00
0,00
0,00
0,00
0,00
40.833,33
46.666,67
52.500,00
30.000,00
26.666,67
26.666,67
26.666,67
Taxes
Personnel Costs
Compensation
Social Contributions
Other
700.000,00
1.000.000,00
1.000.000,00
1.000.000,00
1.000.000,00
1.000.000,00
1.000.000,00
Stock (Company Shares)
0,00
0,00
0,00
0,00
0,00
0,00
0,00
Depreciation and Adjustments
Supplemental Payments
0,00
0,00
0,00
0,00
0,00
0,00
0,00
Supplies
0,00
0,00
0,00
0,00
0,00
0,00
0,00
Reserves/Earnings
0,00
-558.398,31
-508.796,69
-99.789,60
233.648,84
529.145,92
808.481,48
Other Operation Costs
0,00
0,00
0,00
0,00
0,00
0,00
0,00
-558.398,31
49.601,62
409.007,09
333.438,44
295.497,08
279.335,56
262.792,19
Income and Financial Gains Operation – Exchange Var.
0,00
0,00
0,00
0,00
0,00
0,00
0,00
0,00
0,00
409.007,09
333.438,44
295.497,08
279.335,56
262.792,19
Custos e Perdas Financ. Exploração - Descontos PP
0,00
0,00
0,00
0,00
0,00
0,00
0,00
141.601,69
491.203,31
491.203,31
900.210,40
1.233.648,84
1.529.145,92
1.808.481,48
3.220.968,28
19.243.497,82
28.502.340,91
28.496.741,20
28.510.815,16
28.528.744,67
28.547.212,07
Net Income
Anticipated Dividends
TOTAL EQUITY
LIABILITIES
Portimão Film Studio
3.3.5.8.4. Breakout of the Projected Results
In terms of net results, it bears mentioning that negative
net revenue is foreseen only in the first year, reaching full
operation in the 3rd year.
Business Plan
3.3.3.8.3. Financial Projections
The projection is that Property is increasing throughout
the period under review, mainly due to the purchase of
passenger and cargo vehicles.
Operational Costs
-436.247,28
175.479,18
536.078,09
541.677,80
527.603,84
509.674,33
491.206,93
Commons
0,00
0,00
0,00
0,00
0,00
0,00
0,00
Other Costs and Financial Losses
10.000,00
10.000,00
10.000,00
10.000,00
10.000,00
10.000,00
10.000,00
Payable – Medium and Long-Term
0,00
0,00
0,00
0,00
0,00
0,00
0,00
Interests
10.000,00
10.000,00
10.000,00
10.000,00
10.000,00
10.000,00
10.000,00
Loans
0,00
0,00
0,00
0,00
0,00
0,00
0,00
Other
0,00
0,00
0,00
0,00
0,00
0,00
0,00
Reimbursable grants
0,00
0,00
0,00
0,00
0,00
0,00
0,00
Extraordinary Costs
0,00
0,00
0,00
0,00
0,00
0,00
0,00
Supplies
0,00
0,00
0,00
0,00
0,00
0,00
0,00
TOTAL COST
3.230.968,28
19.253.497,82
28.512.340,91
28.506.741,20
28.520.815,16
28.538.744,67
28.557.212,07
Suppliers of fixed assets
0,00
0,00
0,00
0,00
0,00
0,00
0,00
Profit Before Tax
-446.247,28
165.479,18
526.078,09
531.677,80
517.603,84
499.674,33
481.206,93
Other
0,00
0,00
0,00
0,00
0,00
0,00
0,00
Impostos sobre Rendimento do Exercício
0,00
0,00
61.327,25
132.919,45
129.400,96
124.918,58
120.301,73
259.893,88
1.588.379,34
2.354.918,15
2.434.121,12
2.455.764,17
2.452.111,09
2.448.039,43
-446.247,28
165.479,18
464.750,84
398.758,35
388.202,88
374.755,75
360.905,20
0,00
0,00
0,00
0,00
0,00
0,00
0,00
259.739,95
1.575.863,53
2.336.052,80
2.337.373,16
2.338.733,12
2.340.133,89
2.341.576,68
153,93
12.515,81
18.865,35
96.747,96
117.031,04
111.977,20
106.462,75
0,00
0,00
0,00
0,00
0,00
0,00
0,00
Acréscimos e Diferimentos
0,00
0,00
0,00
0,00
0,00
0,00
0,00
Subsidies repayable
0,00
0,00
0,00
0,00
0,00
0,00
0,00
TOTAL LIABILITIES
259.893,88
1.588.379,34
2.354.918,15
2.434.121,12
2.455.764,17
2.452.111,09
2.448.039,43
TOTAL EQUITY + LIABILITIES
401.495,58
2.079.582,66
2.846.121,46
3.334.331,52
3.689.413,01
3.981.257,01
4.256.520,91
Payable – Short-term
Loans
Suppliers
State and other public entities
Others
2010
2011
2012
2013
2014
2015
Results before Financial Overhead and Extraord..
2016
NET
Portimão Film Studio
Business Plan
074
PG.
PG.
Business Plan
077
Business Plan
076
Regarding the indicators of general profitability, we see a
stable, positive development. Most indicators reach their
peak in the 3rd ear as a result of the company reaching full
capacity.
The fixed costs are restricted to the depreciation of
property; personnel and ESF being variable costs.
This is mainly due to the stabilization of number of
productions against the company’s fixed costs. In
other cases we might conclude that profitability is low,
presenting a risk in the business; this company presents no
such risk exists due to not outsourcing without guarantee
of payment.
The company’s margin of coverage will vary in a year of
full operation between 1.4% and 1.3%, as it outsources the
services for which it is solicited by another company of the
Holding, the Fund.
Due to only a small investment being necessary, this
company demonstrates a very attractive return from the
3rd year onward, as it begins to operate at full capacity.
Critical Point
Fixed Costs
Variable Costs
Critical point
Margin of Coverage (Income – Critical Point)
Margin of Coverage (%)
2010
2011
Gross Margin Trading (GMT) is calculated as the difference
between the sum of our Services Rendered and
Subcontracted Services (essential to the business). This
margin registers very positive development.
2012
2013
2014
2015
The levels of debt and risk in the production company are
controlled throughout the period reviewed due to only
short-term debts to suppliers.
Medium and long-term indebtedness is zero.
With regard to financial autonomy, it presents a ratio
very close to 45%, which shows a great capacity for
independent self-financing through equity.
Solvency indicates great economic and financial stability
from the 3rd year on.
Debt & Risk
2016
3.333.057,73
19.354.369,06
28.611.865,77
28.609.551,81
28.627.010,08
28.648.425,45
28.670.483,27
10.061,57
15.006,33
17.546,14
17.546,14
17.412,81
17.546,14
17.546,14
3.345.144,19
19.369.337,02
28.629.164,63
28.626.849,26
28.644.186,49
28.665.746,40
28.687.817,56
-560.423,19
49.639,98
409.254,37
411.569,74
394.232,51
372.672,60
350.601,44
-20,1%
0,3%
1,4%
1,4%
1,4%
1,3%
1,2%
Debt
2011
2012
2013
2014
2015
-193,4%
21,0%
147,8%
148,6%
142,5%
134,9%
127,1%
Capacity to Self-Finance/Investment
-182,6%
34,0%
162,8%
128,2%
113,6%
107,9%
102,1%
2010
2011
2012
2013
2014
2015
With regard to general liquidity, we note that the company
reaches values well above 100% for the period under
review, not requiring, therefore, use of permanent capital
to finance the portion not covered by current assets.
The reduced liquidity does not vary with general liquidity
being that the Production Company is a firm that provides
only services.
2012
2013
2014
2015
2016
76,4%
82,7%
73,0%
66,6%
61,6%
0,0%
0,0%
0,0%
0,0%
0,0%
0,0%
0,0%
Financial Autonomy
35,3%
23,6%
17,3%
27,0%
33,4%
38,4%
42,5%
Solvency
54,5%
30,9%
20,9%
37,0%
50,2%
62,4%
73,9%
Debt Capacity
54,5%
30,9%
20,9%
37,0%
50,2%
62,4%
73,9%
150,4%
727,7%
1403,4%
3600,8%
3218,2%
4828,9%
7233,9%
MLP Debt
Working Capital
2016
Operating Profit/Investment
General Profitability
Portimão Film Studio
2010
2011
With regard to liquidity and net cash, this company
exhibits very favorable ratios.
64,7%
Fixed Coverage
Profitability of the Investment
2010
We can also cite the fact that the value of fixed capital
indicates a sound financial structure.
Permanent Capital
Liquidity and Net Cash
2016
57,5%
47.435,03
423.703,31
456.203,31
875.210,40
1.195.315,51
1.497.479,25
1.783.481,48
141.601,69
491.203,31
491.203,31
900.210,40
1.233.648,84
1.529.145,92
1.808.481,48
2010
2011
2012
2013
2014
2015
2016
Financial Profitability
-394,3%
10,1%
83,3%
37,0%
24,0%
18,3%
14,5%
General Liquidity
118,3%
126,7%
119,4%
136,0%
148,7%
161,1%
172,9%
Profitability of Activity
-18,6%
0,5%
1,6%
1,3%
1,1%
1,1%
1,0%
Reduced Liquidity
118,3%
126,7%
119,4%
136,0%
148,7%
161,1%
172,9%
Profitability of Production
-20,1%
0,3%
1,4%
1,1%
1,0%
1,0%
0,9%
Net Cash/Operational Income
2,8%
2,1%
1,5%
3,2%
4,2%
5,1%
6,1%
Economic Efficiency
-19,7%
0,3%
1,4%
1,5%
1,4%
1,3%
1,2%
(NFM-FM)/Operational Income
-2,8%
-2,1%
-1,5%
-3,2%
-4,2%
-5,1%
-6,1%
Profitability of Sales
-20,1%
0,3%
1,4%
1,1%
1,0%
1,0%
0,9%
Net Cash/NFM
-253,0%
5402,0%
1334,5%
-1946,4%
-11341,7%
17553,6%
20848,0%
Net Profit/Net Assets
-139,1%
2,4%
14,4%
10,0%
8,0%
7,0%
6,2%
Financial Overhead/Operational Income
0,4%
0,1%
0,0%
0,0%
0,0%
0,0%
0,0%
2.784.721,00
19.418.977,00
29.038.419,00
29.038.419,00
29.038.419,00
29.038.419,00
29.038.419,00
78.447,73
416.002,36
424.402,09
922.612,15
1.205.948,34
1.488.996,71
1.774.967,65
Gross Sales/Nº employees
928.240,33
6.472.992,33
9.679.473,00
9.679.473,00
9.679.473,00
9.679.473,00
9.679.473,00
(Sales + Services)/Nº employees
928.240,33
6.472.992,33
9.679.473,00
9.679.473,00
9.679.473,00
9.679.473,00
9.679.473,00
0,0%
0,0%
0,0%
0,0%
0,0%
0,0%
0,0%
-125.149,47
81.990,24
205.481,08
200.126,31
194.610,89
188.930,00
183.078,69
Gross Sales
Personnel Overhead/(Sales+ Services)
VAB/Nº workers
VAB/Personnel Costs
VAB
-284,3%
182,6%
448,7%
424,3%
400,6%
377,5%
355,2%
-375.448,40
245.970,71
616.443,25
600.378,92
583.832,66
566.790,01
549.236,08
Net Cash
Portimão Film Studio
3.3.3.8.5. Indicators
Next, we move to an analysis of the most significant
indicators in order to conclude this survey of the study’s
results.
PG.
PG.
Business Plan
079
Business Plan
078
According to forecast calculations, this project has a
very positive Net Present Value, as shown in the table
above. That is, invested capital is recovered along with an
attractive return.
In this table we note 3 scenarios with a standard discount
rate of 8%, a lower 4% rate, and a high discount rate of
16%, and we note a good resiliency of the Net Present
Value.
The term of updated recovery of the investment is 5 years,
which means that in that time, the developer will recoup
the actual value of the investment costs through income
generated by their activity and begin to generate surplus.
In the Production company, the 34.3% Internal Rate of
Return (with residual) highlights an excellent opportunity.
It also has an internal rate of return much higher than rates
of return those obtainable in the financial markets.
This company’s projected 4-year term for investment
recovery is most satisfactory.
We consider, therefore, the viability of this project to be
guaranteed for the period analyzed, with good prospects
for continued development.
NPV, IRR AND PAYBACK PERIOD
Scenario I – Normal Update Rate
2010
8,0%
8,0%
CAF Updated
-517.564,97
89.137,30
395.667,94
288.509,15
236.799,97
208.259,97
182.408,18
Updated Net Cash Flows
-621.552,27
34.772,80
357.859,07
335.506,38
180.372,53
181.638,70
169.785,07
Updated and Accumulated Net Cash Flows
-621.552,27
-586.779,47
-228.920,39
106.585,98
286.958,51
468.597,21
638.382,29
103.987,29
54.364,50
37.808,87
-46.997,23
56.427,44
26.621,27
12.623,11
0,00
0,00
0,00
0,00
0,00
0,00
21.119,40
-621.552,27
34.772,80
357.859,07
335.506,38
180.372,53
181.638,70
190.904,47
Updated Investment
Updated Final Year Residual Value
Established Values
Net present value (NPV) without residual value
NPV with Residual Value
Internal Return Rate (IRR) Without Residual Value
Ano term.
638.382,29
659.501,69
33,9%
2. Depreciation and Supplies
3. Capacity to Self-Finance (CAF)
4. Fixed Asset Investment
5. Residual Value of Invest. in Fixed Capital Assets
6. Investment in Intangible Fixed Assets
7. Residual Value of Invest. In Intangible Fixed Assets
8. Investment in Working Capital Fund
2014
2015
279.335,56
262.792,19
40.833,33
46.666,67
52.500,00
30.000,00
26.666,67
26.666,67
26.666,67
-517.564,97
96.268,29
461.507,09
363.438,44
322.163,75
306.002,23
289.458,86
50.000,00
10.000,00
10.000,00
10.000,00
10.000,00
10.000,00
10.000,00
30,3%
0,00
-
33,9%
33,9%
2010
2011
2012
2013
2014
2015
2016
4,0%
4,0%
CAF actualizada
-517.564,97
92.565,66
426.689,24
323.095,45
275.386,92
251.511,53
228.763,54
Meios Libertos Líquidos actualizados
-621.552,27
36.110,21
385.916,07
375.726,68
209.764,53
219.361,53
212.932,53
Meios Libertos Líquidos actualizados e acumulados
-621.552,27
-585.442,05
-199.525,98
176.200,69
385.965,23
605.326,76
818.259,28
103.987,29
56.455,45
40.773,17
-52.631,22
65.622,39
32.150,00
15.831,02
0,00
0,00
0,00
0,00
0,00
0,00
26.486,47
-621.552,27
36.110,21
385.916,07
375.726,68
209.764,53
219.361,53
239.419,00
Valor Actualizado Líquido (VAL) sem Valor Residual
VAL com Valor Residual
Prazo de Recuperação (Payback) actualizado
Hipótese III - Taxa Actualização Alta
Year term.
818.259,28
3 anos
4 anos
-199.525,98
5 anos
176.200,69
6 anos
385.965,23
7 anos
605.326,76
8 anos
818.259,28
0,00
844.745,75
4 Years
2010
2011
2012
2013
2014
2015
2016
0,00
0,00
0,00
0,00
0,00
0,00
15.000,00
85.000,00
10.000,00
10.000,00
10.000,00
30.000,00
10.000,00
10.000,00
Update Rate
16,0%
16,0%
16,0%
16,0%
16,0%
16,0%
16,0%
0,00
0,00
0,00
0,00
0,00
0,00
10.000,00
CAF Updated
-517.564,97
82.989,90
342.974,95
232.839,63
177.928,17
145.691,64
118.806,15
Updated Net Cash Flows
-621.552,27
32.374,67
310.201,27
270.768,46
135.529,38
127.068,30
110.584,46
Updated and Accumulated Net Cash Flows
-621.552,27
-589.177,59
-278.976,33
-8.207,86
127.321,52
254.389,82
364.974,28
103.987,29
50.615,23
32.773,68
-37.928,84
42.398,79
18.623,34
8.221,69
0,00
0,00
0,00
0,00
0,00
0,00
13.755,49
38.713,66
24.100,26
-79.202,97
36.768,91
19.115,39
31,29
0,00
0,00
0,00
0,00
0,00
0,00
8.513,83
10. Financial Investment + Works in Progress
0,00
0,00
0,00
0,00
0,00
0,00
0,00
Updated Investment
11. Residual Value of Fin. Invest + Works in Progress
0,00
0,00
0,00
0,00
0,00
0,00
0,00
Updated Residual Value
Updated Net Cash Flow + Residual Value
14. Residual value (totals)
24,4%
-
4,0%
-31.012,71
13. Net Investments (annual total)
15,4%
-
8 anos
638.382,29
4,0%
Valores apurados
295.497,08
-15,0%
-
7 anos
468.597,21
4,0%
2016
333.438,44
-
6 anos
286.958,51
4,0%
9. Residual Value of Invest. in Working Capital Fund
12. Divestment (Total Assets)
Portimão Film Studio
2013
-
5 anos
106.585,98
4,0%
Meios Libertos Líquidos actualizados + Valor Residual
409.007,09
4 anos
-228.920,39
34,3%
Valor Residual actualizado
2012
3 anos
4 Years
Investimento actualizado
49.601,62
2016
8,0%
Scenario II – Low Updated Rate
2011
2015
8,0%
Updated Net Cash Flow + Residual Value
-558.398,31
2014
8,0%
Taxa de Actualização
2010
2013
8,0%
Updated Payback
CASH-FLOW
2012
8,0%
IRR with Residual Value
1. Profit After Tax
2011
Update Rate
0,00
0,00
0,00
0,00
0,00
0,00
0,00
103.987,29
58.713,66
44.100,26
-59.202,97
76.768,91
39.115,39
20.031,29
Established Values
0,00
0,00
0,00
0,00
0,00
0,00
33.513,83
15. Net Cash Flows without Residual Value
-621.552,27
37.554,62
417.406,82
422.641,41
245.394,84
266.886,84
269.427,57
NPV with residual Value
16. Net Cash Flows with Residual Value
-621.552,27
37.554,62
417.406,82
422.641,41
245.394,84
266.886,84
302.941,41
Updated Payback
Net present value (NPV) without residual value
-621.552,27
Ano term.
364.974,28
378.729,77
5 Years
32.374,67
3 anos
-278.976,33
310.201,27
4 anos
-8.207,86
270.768,46
5 anos
127.321,52
135.529,38
6 anos
254.389,82
127.068,30
7 anos
364.974,28
124.339,95
8 anos
0,00
Portimão Film Studio
3.3.3.8.6. Viability
In the statement of cash flow we find that the company will
have a quite safe structure. This statement does not reveal
reasons for concern.
PG.
PG.
Business Plan
081
Business Plan
080
3.3.3.8.7. Management and control of the business
Management and operational control requirements
are mandatory for good business performance. Thus, a
modern management system is intended, which is able
to keep up with changing needs. This business plan is
sufficiently detailed to easily and quickly create an actions
plan and budget that could be meticulously implemented.
3.3.3.8.8. Necessary Investment Necessário
To start this project and given the initial projection of
the business, it’s been determined necessary to have the
investment itemized in the table below:
3.3.3.8.9. Necessary financing and economic value
The Holding will finance this business wholly for the first
two years in the value of 700.000,00€ in the first year and
300.000,00€ in the second.
Onwards from the 3rd year the business will be able to selffinance.
Investment Totals
Values
Partnership Management
Total Investment
It is necessary to develop relations with businesses that
provide services, equipment rentals, hotels, restaurants,
rent-a-car, national and international film technicians. This
is the most sensitive area of business and should be strictly
managed benefiting from economies of scale from which
an individual production cannot.
Equipments, tools and utens.
70.000,00
Cargo and Transportation material
40.000,00
Joint-Stock
0,00
Self-financing
Property and Resources, inf., buildings, const.
Other tangible investments
283.513,83
0,00
Total investment in tangible fixed assets
110.000,00
Total investment in intangible fixed assets
165.000,00
Investments in Working Capital Fund
Financial Investment
8.513,83
0,00
FINANCING
The accounts of the company will be managed by an
external entity and organized by cost centers. Being a
diversified and complex activity, it is necessary to evaluate
the profitability of each “pack”, or service, individually and
make regular assessments of the business.
2011
2012
2013
2014
2015
2016
1.000.000,00
700.000,00
300.000,00
0,00
0,00
0,00
0,00
0,00
0,00
0,00
0,00
0,00
0,00
0,00
0,00
1.321.273,68
-517.564,97
96.268,29
461.507,09
363.438,44
322.163,75
306.002,23
289.458,86
2.321.273,68
182.435,03
396.268,29
461.507,09
363.438,44
322.163,75
306.002,23
289.458,86
MLP Loans(+Bonds)
0,00
0,00
0,00
0,00
0,00
0,00
0,00
0,00
Shareholders/ Supplemental Loans
0,00
0,00
0,00
0,00
0,00
0,00
0,00
0,00
Asset Suppliers
0,00
0,00
0,00
0,00
0,00
0,00
0,00
0,00
Leasing
0,00
0,00
0,00
0,00
0,00
0,00
0,00
0,00
Other
0,00
0,00
0,00
0,00
0,00
0,00
0,00
0,00
0,00
0,00
0,00
0,00
0,00
0,00
0,00
0,00
Supplemental Benefits and other
Total Equity + Self-Financing
0,00
Debt Capital
Total Debt Capital
Financial information
2010
Totals
Equity
The investment essential for the proper development of
activity will focus solely on transportation equipment.
With the above investments, the basic needs necessary for
the development of activity for the analyzed period are
satisfied.
Along with accounting balance sheets, progress reports
will be provided (also by an external company) that will
help understand the company’s situation and will support
the management of the business.
Portimão Film Studio
Portimão Film Studio
The Auditing, to be carried out by another company,
will allow for regular assessments of management, and
execution of business plans and annual budgets.
083
PG.
PG.
3.3.3.8.11. Statement of Cash Flows
In the Statement of Cash Flows we found that despite
low net margins, the project is viable since payments to
suppliers only occur while productions are underway,
guaranteeing good operational performance.
3.3.3.8.10. Statement of Working Capital
In the Statement of Working Capital we note no risk
whatsoever.
Attention should be paid to the 1st and 4th (2013) years,
with regard to the Working Capital Fund.
Statement of Cash Flows (Direct Method)
Statement of Working Capital
OPERATIONAL ACTIVITIES
2010
ACCOUNTS
Business Plan
Business Plan
082
2011
2012
2013
2014
2015
2016
2010
2011
2012
2013
2014
2015
2016
Receipts from Clients
2.555.839,82
18.051.777,88
28.247.779,93
29.038.419,00
29.038.419,00
29.038.419,00
29.038.419,00
0,00
0,00
0,00
0,00
0,00
0,00
0,00
Payments to Suppliers
2.900.429,45
17.856.882,71
27.661.786,48
28.436.719,73
28.453.226,38
28.470.228,23
28.487.740,13
228.881,18
1.596.080,30
2.386.719,37
2.386.719,37
2.386.719,37
2.386.719,37
2.386.719,37
Payments to Personnel
132.055,00
134.696,10
137.390,02
141.511,72
145.757,07
150.129,79
154.633,68
0,00
0,00
0,00
0,00
0,00
0,00
0,00
228.881,18
1.596.080,30
2.386.719,37
2.386.719,37
2.386.719,37
2.386.719,37
2.386.719,37
0,00
0,00
0,00
0,00
0,00
0,00
0,00
Clients without Provisions
228.881,18
1.596.080,30
2.386.719,37
2.386.719,37
2.386.719,37
2.386.719,37
2.386.719,37
Flows generated before extr. items
Clients after Provisions
Clients (associated to Sales)
Clients (associated to Services)
Clients C/C and others
Clients L/R
Provisions for Contested Charges
Flow generated by operations
Payment/Receipt of IRC
0,00
0,00
0,00
0,00
136.294,57
113.961,34
89.071,47
92,36
7.355,55
-1.196,60
-7.546,14
-7.746,14
-7.212,81
-7.546,14
Receipts extraordinary items
0,00
0,00
0,00
0,00
0,00
0,00
0,00
Payments extraordinary items
0,00
0,00
0,00
0,00
0,00
0,00
0,00
-476.552,27
67.554,62
447.406,82
452.641,41
295.394,84
296.886,84
299.427,57
Other Payments and Receipts Oper. activ
228.881,18
1.596.080,30
2.386.719,37
2.386.719,37
2.386.719,37
2.386.719,37
2.386.719,37
Advances to Suppliers
0,00
0,00
0,00
0,00
0,00
0,00
0,00
Stock Raw Materials and Subsid.
0,00
0,00
0,00
0,00
0,00
0,00
0,00
Stock of Goods finished and intermediate
0,00
0,00
0,00
0,00
0,00
0,00
0,00
Stock of Goods
0,00
0,00
0,00
0,00
0,00
0,00
0,00
Other, Prod. Course and adjustment
0,00
0,00
0,00
0,00
0,00
0,00
0,00
Financial Investments
0,00
0,00
0,00
0,00
0,00
0,00
0,00
0,00
0,00
0,00
0,00
0,00
0,00
0,00
Provisions for depreciation of Stock
Tangible Fixed Assets
Stocks
0,00
0,00
0,00
0,00
0,00
0,00
0,00
0,00
0,00
0,00
0,00
0,00
0,00
0,00
Intangible Fixed Assets
Debts owed by State and other Public Entities
0,00
0,00
0,00
0,00
58.411,96
73.874,27
69.833,89
0,00
0,00
0,00
0,00
0,00
0,00
0,00
Investment Subsidies
Other Debts from 3rd Party Operations
0,00
0,00
0,00
0,00
0,00
0,00
0,00
0,00
0,00
0,00
0,00
0,00
0,00
0,00
Similar Interest and Income
228.881,18
1.596.080,30
2.386.719,37
2.386.719,37
2.445.131,33
2.460.593,64
2.456.553,26
0,00
0,00
0,00
0,00
0,00
0,00
0,00
Dividendos
0,00
0,00
0,00
0,00
0,00
0,00
0,00
0,00
0,00
0,00
0,00
0,00
0,00
0,00
Total Needs
Suppliers of Raw Materials and Subs.
Suppliers of Goods
Suppliers Outsourcing
Suppliers - Other
Suppliers C/C and other
Fornecedores L/R
Suppliers
Advances to Clients
Debts to State and Other Public Entities
Other Debts from 3rd Party Operations
Total Resources
Needs in Working Capital
Needs in Working Capital before the project
Annual Investment in Working Capital Fund
Working Capital Fund in Terminal year
Working Capital Fund post-project – pre-project
Flow Operational Activities
INVESTIMENT ACTIVITIES
2010
2011
2012
2013
2014
2015
2016
Receipts from:
Other
0,00
0,00
0,00
0,00
0,00
0,00
0,00
217.437,12
1.532.714,64
2.292.040,94
2.292.040,94
2.292.040,94
2.292.040,94
2.292.040,94
Financial Investments
0,00
0,00
0,00
0,00
0,00
0,00
0,00
42.302,83
43.148,89
44.011,87
45.332,22
46.692,19
48.092,95
49.535,74
Tangible Fixed Assets
50.000,00
10.000,00
10.000,00
10.000,00
10.000,00
10.000,00
10.000,00
259.739,95
1.575.863,53
2.336.052,80
2.337.373,16
2.338.733,12
2.340.133,89
2.341.576,68
Intangible Fixed Assets
85.000,00
10.000,00
10.000,00
10.000,00
30.000,00
10.000,00
10.000,00
0,00
0,00
0,00
0,00
0,00
0,00
0,00
0,00
0,00
0,00
0,00
0,00
0,00
0,00
259.739,95
1.575.863,53
2.336.052,80
2.337.373,16
2.338.733,12
2.340.133,89
2.341.576,68
0,00
0,00
0,00
0,00
0,00
0,00
0,00
153,93
12.515,81
18.865,35
96.747,96
117.031,04
111.977,20
106.462,75
0,00
0,00
0,00
0,00
0,00
0,00
0,00
259.893,88
1.588.379,34
2.354.918,15
2.434.121,12
2.455.764,17
2.452.111,09
2.448.039,43
-31.012,71
7.700,96
31.801,22
-47.401,75
-10.632,84
8.482,55
8.513,83
-
-
38.713,66
24.100,26
8.513,83
-
-
8.513,83
-
-
0,00
-31.012,71
-
-
-
36.768,91
19.115,39
-
-
-
-
-
-
-
-
-79.202,97
31,29
Payments from:
Assets in Progress
Other
Flow Investment Activities
FINANCING ACTIVITIES
-135.000,00
2010
-20.000,00
2011
-20.000,00
2012
-20.000,00
2013
-40.000,00
2014
-20.000,00
2015
-20.000,00
2016
Receipts from:
Loans
0,00
0,00
0,00
0,00
0,00
0,00
0,00
700.000,00
300.000,00
0,00
0,00
0,00
0,00
0,00
Subsidies and Donations
0,00
0,00
0,00
0,00
0,00
0,00
0,00
Loss Coverage
0,00
0,00
0,00
0,00
0,00
0,00
0,00
Cobertura de Prejuízos
0,00
0,00
0,00
0,00
0,00
0,00
0,00
Other
0,00
0,00
0,00
0,00
0,00
0,00
0,00
Loans
0,00
0,00
0,00
0,00
0,00
0,00
0,00
Depreciation Cont. Lease Fin. & equiv.
0,00
0,00
0,00
0,00
0,00
0,00
0,00
10.000,00
10.000,00
10.000,00
10.000,00
10.000,00
10.000,00
10.000,00
Dividends
0,00
0,00
409.007,09
-75.568,65
-37.941,36
-16.161,52
-16.543,37
Capital Reductions & Supplemental Payments
0,00
0,00
0,00
0,00
0,00
0,00
0,00
Acquisition Stock (shares)
0,00
0,00
0,00
0,00
0,00
0,00
0,00
Reimbursable Subsidies
0,00
0,00
0,00
0,00
0,00
0,00
0,00
Other Debt MLP
0,00
0,00
0,00
0,00
0,00
0,00
0,00
690.000,00
290.000,00
-419.007,09
65.568,65
27.941,36
6.161,52
6.543,37
78.447,73
337.554,62
8.399,74
498.210,06
283.336,20
283.048,36
285.970,94
0,00
78.447,73
416.002,36
424.402,09
922.612,15
1.205.948,34
1.488.996,71
78.447,73
416.002,36
424.402,09
922.612,15
1.205.948,34
1.488.996,71
1.774.967,65
Capital Increase, Income Supplementals
Portimão Film Studio
Interest & Similar Costs
Flow Financing Activities
Cash and cash equivalents variation
Exchange Rate Effect
Cash and cash equivalents at beginning of period
Cash and cash equivalents at end of period
Portimão Film Studio
Payments from:
PG.
PG.
Business Plan
085
Business Plan
084
3.3.3.8.12. Sensitivity Analysis
Performing a Sensitivity Analysis with a decrease of
1% in sales, we can conclude that the project remains
executable. This percentage cannot be higher or the
Producer will not generate surplus by year-end.
3.3.3.8.13. Closing Remarks
A more favorable pay-back, just as the IRR and NPV, vis-àvis the forecast. Forecast investment recovery is 4 years.
ESF’s, staff costs, and depreciation of property are fixed
costs. Taxes are variable costs.
Promotor Company:
PICTURE PORTUGAL
Project Name
Production Service V2
Investment Period:
2010 - 2016
(7 years)
Sensitivity to Variation in Sales and Services
Effects in the Variation of Sales/ Serv.
(Indicators)
Financial Profitability
Critical point
Reference
IRR without Residual Value
Cash and Cash equivalent
General Liquidity (Stock/Debts short-term)
14,5%
8,1%
28.687.817,56
ADDEND
Totals before and after simulation
Minimum
14,53%
TIR
34,33%
---
---
Profitability of Invested Capital
528,50%
VAL
659.502
844.746
378.730
CAF/Investment
466,03%
PR
4 anos
4 anos
5 anos
0,2%
20,0%
-10,4%
10,0%
1.774.967,65
520.344,19
172,9%
121,6%
6,1%
1,8%
1.774.967,65
520.344,19
2011
Financial Autonomy
Asset Coverage
Capital structure
2012
2013
2014
2015
2016
42,49%
7233,93%
73,87%
Debt M-L/CAF
0,00%
Debt M-L/Equity
0,00%
2.784.721,00
19.418.977,00
29.038.419,00
29.038.419,00
29.038.419,00
29.038.419,00
29.038.419,00
Sales and Services after simulation
2.756.873,79
19.224.787,23
28.748.034,81
28.748.034,81
28.748.034,81
28.748.034,81
28.748.034,81
Financial Expenses/Operation Incomes
0,03%
Fixed Costs before and after simulation
3.333.057,73
19.354.369,06
28.611.865,77
28.609.551,81
28.627.010,08
28.648.425,45
28.670.483,27
Financial Debts /Equity
0,00%
10.061,57
15.006,33
17.546,14
17.546,14
17.412,81
17.546,14
17.546,14
9.960,96
14.856,26
17.370,68
17.370,68
17.238,68
17.370,68
17.370,68
Variable costs after simulation
Net Profit before simulation
-558.398,31
49.601,62
409.007,09
333.438,44
295.497,08
279.335,56
262.792,19
Net profit after simulation
-579.208,25
-95.928,16
191.350,54
115.781,90
77.839,54
61.679,01
45.135,65
Cash before simulation
78.447,73
416.002,36
424.402,09
922.612,15
1.205.948,34
1.488.996,71
1.774.967,65
Cash after simulation
57.637,79
249.662,63
40.405,82
320.959,33
386.637,98
452.029,80
520.344,19
Equity before simulation
141.601,69
491.203,31
491.203,31
900.210,40
1.233.648,84
1.529.145,92
1.808.481,48
Equity after simulation
16,00%
Financial Profitability
1,2%
2010
4,00%
10,0%
Sales and Services before simulation
Variable costs before simulation
Portimão Film Studio
8,00%
33,9%
Net Cash/ Oper. Income
Net Cash (Available-short-term loans)
Full Operation/term.
Simulation
28.687.817,56
Margin of coverage (%)
Updated Rates
Key Project Indicators
-1%
Basic Equipments
0%
0%
25%
60%
Investments Summary (in Euros)
Facilities
Investment
15%
0
70.000
120.791,75
324.863,59
107.207,04
298.557,58
414.338,47
492.179,01
553.858,02
Net Cash Flow before simulation
-621.552,27
37.554,62
417.406,82
422.641,41
245.394,84
266.886,84
269.427,57
Net Cash Flow after simulation
-642.362,21
-107.975,16
199.750,28
204.984,86
27.737,29
49.230,30
51.771,03
Total Income before simulation
2.784.721,00
19.418.977,00
29.038.419,00
29.038.419,00
29.038.419,00
29.038.419,00
29.038.419,00
Total income after simulation
2.756.873,79
19.224.787,23
28.748.034,81
28.748.034,81
28.748.034,81
28.748.034,81
28.748.034,81
Facilities
Basic Equipments
Critical Point before simulation
3.345.144,19
19.369.337,02
28.629.164,63
28.626.849,26
28.644.186,49
28.665.746,40
28.687.817,56
Critical Point after simulation
3.345.144,19
19.369.337,02
28.629.164,63
28.626.849,26
28.644.186,49
28.665.746,40
28.687.817,56
Load Material and Transport
Intangible fixed assets
Load Material and Transport
Intangible fixed assets
Other Investment
40.000
165.000
0
Other Investment
Portimão Film Studio
Variation of Sales and Services (+/-)
PG.
PG.
Business Plan
087
Business Plan
086
Social Designation: Picture Portugal Media Fund, SGPS, SA
(Fund)
Legal Form: Holding
Headquarters: Parque de Feiras e Exposições (Fair and
Exposition Park) – Caldeira do Moinho
8500-726 Portimão - Portugal
Classification of Economic Activity: 59110 – Production of
films, videos and television programs;
59120 – Technical activities of post-production of
films, videos and television programs;
59130 – Distribution of films, videos and television
programs.
Joint-stock: 25.000.000€
3.3.4.2. Social Scope
3.3.4.4. The underlying market
Picture Portugal Media Fund, SA will base its activity on
investment in the production of short and feature length
films, as well as documentaries, adding value in the sale
and distribution of these productions, as well as video
clips, video games, and advertisements.
The Clients / Target Market
3.3.4.3. Basis
- The Fund will participate in projects, which are to be
quantified and projected to 7 years, to 2016, after which it
is not possible to forecast due to the significant changes in
the sector.
- It is assumed that there is to be an investment in feature
films in co-production with the US, at cruising speed, for 4
per year with a global budget of up to 10 million Euros and
one with a budget of up to 50 million Euros
- It is assumed that 10 documentaries will be produced
annually, 8 new and 2 restorations.
- Inauguration of the studios on the 1st of July 2011.
- First productions in 2010.
3.3.4.1. Ownership and Administrative Structure
Shareholders: 1
Name: Picture Portugal Holding, SGPS, SA
% Capital: 100%
Portimão Film Studio
Administration: Chairman of the Board, Vice-President and
3 members.
- Participation in international festivals.
- Fiscal incentives and tax rebates in 2011.
- Fund with joint-stock of 25 million Euros.
- Each new film project will give origin to a new
autonomous company owned by the fund.
The clients are the Majors and their subsidiaries. Below is
a listing.
Holding
Divison
Time Warner
Warner Bros. Entertainment
Group, HBO
Warner Bros. Pictures
New Line Cinema, HBO Films, Castle Rock
Entertainment, T urner Entertainment,
W arner Bros. A nimation
Viacom
Paramount Moon Picture
Group
Sony Pictures
Fox Filmed Entertainment
Paramount Pictures
Nickelodeon Movies, MTV Films
Paramount Vantage
Columbia Pictures
20th Century Fox
Sony Pictures Animaon
Sony Pictures Classics
Fox SearchLight
NBC Universal
universal Studios
Universal Animaon Studios
Focus Features
Walt Disney Moon Pictures
Group
W alt Disney Pictures/T ouchstone
Pictures
Pixar A nimation Studios, W alt Disney
A nimation Studios, Disneynature
Miramax Films
Sony
News
Corporaon
General
Electric/
Vivendi
The Walt
Disney
Company
Subsidiary
Others Mainstream Subsidiaries
20th Century Fox A nimation, Fox Faith,
New Regency
ArtHouse / Indie Subsidiaries
EUA + CAN % Market
2008
2007
2004
18,4
14,7
17,7
16,4
13,2
15,5
12,9
6,8
16,8
12,7
11,9
11,7
12,4
12,2
10,8
10,5
15,3
16,5
3.3.4.5. Business Cycle
3.3.4.6. Product
This company will be the most important of the whole
group to generate business. To be effective it must begin
production and investment in productions as early as
2010, for about 30% of revenue is generated in the year
of production and the remaining 70% in the following
year and the remaining 10% in the third year (CORRECT
FIGURE). Moreover, it must establish itself in Los Angeles
and present the best proposals for film production
opportunities within the existing budgetary constraints. As
early as 2010, it ought to buy rights to screenplays, books,
films, documentaries and other productions to ensure
continuity in future years. This is an ongoing activity.
The fund will create a company for production. It will
produce 5 content types:
Films type 1 – Budget of 1.563.294€
Films type 2 – Budget of 3.126.000€
Films type 3 – Budget of 9.379.764€
New Documentaries – 150.000€
Restoration of documentaries and films – 150.000€
The above figures are detailed on the basis of a type 1
movie and a documentary in point 3.3.4.8.2. A type 2 film
is twice the value of type 1 and a type 3 film six times the
value of a type 1 film.
Portimão Film Studio
3.3.4. Picture Portugal Media Fund, SA
089
PG.
PG.
Communication is a key factor for success and permanence
of business strategy in the market. So we sought to define
the best way to disseminate the image and concept, as
well as reach the identified segments.
Sales Strategy
The development of a film is a complex process, but at
its base it has 3 factors of extreme importance, a great
script, a good director and a good team of players of
international renown. As a general matter of course, only
those who can provide for these three factors unites the
necessary conditions for contemplating the production of
a film. You must be an “insider” in the Hollywood market
in order to form this base. Additionally, as customers
are the Majors, it is necessary to establish professional
relationships with these businesses to generate mutual
business opportunities.
Target Clients
In order to work the market of the Majors and subsidiaries,
a Los Angeles office is indispensible and the Sales Director
must move back and forth between Portimão and Los
Angeles in order to present the Board of Directors with
the best options in terms of investment, be it is to develop
new films from scratch or the purchase of the rights to
scripts, books, films, documentaries, music, etc..
Sales Channels
The sale of content is the handled by the majors and their
distribution subsidiaries, being that they may also be
partners of the film producing entities, responsible for the
distribution and subsequent display of content in theaters.
Networking
Portimão Film Studio
Absolutely essential to the success of the project is
presence in Hollywood so as to develop the ability to
network in the heart of the business. The establishment of
offices and a full operation in Los Angeles is crucial to the
success of the project.
3.3.4.8. Financial Projections
3.3.4.8.1. Income
2,000 films of various types were analyzed (attached), in
terms of income, budget, and sales. This study was used
to produce the averages used in this analysis. These films
were not the biggest box-office successes, but in fact the
worst performing films by type of all time.
The financial analysis that follows is a 7-year projection,
beginning with the present year.
The tables are in current prices, with an estimated annual
inflation rate of around 2% for 2010 and 2011 and 3% in
other years.
Business Plan
3.3.4.7. Business Strategy
Each production will have 10% of its income in the year
of production, 70% the following year, and 20% in the 3rd
year.
Number of films to produce by type and year
2010
2011
2012
2013
2014
2015
2016
Turnover
Type 1
1
1
1
1
1
1
1
Type 2
1
2
2
2
2
2
2
3.140.000 €
6.280.000 €
Type 3
0
1
2
2
2
2
2
18.840.000 €
Documentaries New
1
2
3
7
7
7
7
490.000 €
Documentaries Restoration
4
8
7
3
3
3
3
255.000 €
Foreign Productions
0
2
3
3
3
3
3
Total
7
16
18
18
18
18
18
113
SERVICES
2010
2011
2012
2013
2014
2015
2016
Designation
Value
Value
Value
Value
Value
Value
Value
1 - Film Type 1 2010
314.000,00
2.198.000,00
628.000,00
0,00
0,00
0,00
0,00
2 - Film Type 1 2011
0,00
314.000,00
2.198.000,00
628.000,00
0,00
0,00
0,00
3 - Film Type 1 2012
0,00
0,00
314.000,00
2.198.000,00
628.000,00
0,00
0,00
4 - Film Type 1 2013
0,00
0,00
0,00
314.000,00
2.198.000,00
628.000,00
0,00
5 - Film Type 1 2014
0,00
0,00
0,00
0,00
314.000,00
2.198.000,00
628.000,00
6 - Film Type 1 2015
0,00
0,00
0,00
0,00
0,00
314.000,00
2.198.000,00
7 - Film Type 1 2016
0,00
0,00
0,00
0,00
0,00
0,00
314.000,00
8 - Film Type 2 2010
628.000,00
4.396.000,00
1.256.000,00
0,00
0,00
0,00
0,00
9 - Film Type 2 2011
0,00
1.256.000,00
8.792.000,00
2.512.000,00
0,00
0,00
0,00
10 - Film Type 2 2012
0,00
0,00
1.256.000,00
8.792.000,00
2.512.000,00
0,00
0,00
11 - Film Type 2 2013
0,00
0,00
0,00
1.256.000,00
8.792.000,00
2.512.000,00
0,00
12 - Film Type 2 2014
0,00
0,00
0,00
0,00
1.256.000,00
8.792.000,00
2.512.000,00
13 - Film Type 2 2015
0,00
0,00
0,00
0,00
0,00
1.256.000,00
8.792.000,00
14 - Film Type 2 2016
0,00
0,00
0,00
0,00
0,00
0,00
1.256.000,00
15 - Film Type 3 2010
0,00
0,00
0,00
0,00
0,00
0,00
0,00
16 - Film Type 3 2011
0,00
1.884.000,00
13.188.000,00
3.768.000,00
0,00
0,00
0,00
17 - Film Type 3 2012
0,00
0,00
3.768.000,00
26.376.000,00
7.536.000,00
0,00
0,00
18 - Film Type 3 2013
0,00
0,00
0,00
3.768.000,00
26.376.000,00
7.536.000,00
0,00
19 - Film Type 3 2014
0,00
0,00
0,00
0,00
3.768.000,00
26.376.000,00
7.536.000,00
20 - Film Type 3 2015
0,00
0,00
0,00
0,00
0,00
3.768.000,00
26.376.000,00
21 - Film Type 3 2016
0,00
0,00
0,00
0,00
0,00
0,00
3.768.000,00
22 - Documentaries & Restoration
2010
151.000,00
1.057.000,00
302.000,00
0,00
0,00
0,00
0,00
23 - Documentaries & Restoration
2011
0,00
302.000,00
2.114.000,00
604.000,00
0,00
0,00
0,00
24 - Documentaries & Restoration
2012
0,00
0,00
325.500,00
2.278.500,00
651.000,00
0,00
0,00
25 - Documentaries & Restoration
2013
0,00
0,00
0,00
419.500,00
2.936.500,00
839.000,00
0,00
26 - Documentaries & Restoration
2014
0,00
0,00
0,00
0,00
419.500,00
2.936.500,00
839.000,00
27 - Documentaries & Restoration
2015
0,00
0,00
0,00
0,00
0,00
419.500,00
2.936.000,00
28 - Documentaries & Restoration
2016
0,00
0,00
0,00
0,00
0,00
0,00
419.500,00
1.093.000,00
11.407.000,00
34.141.500,00
52.914.000,00
57.387.000,00
57.575.000,00
57.574.500,00
Total
Portimão Film Studio
Business Plan
088
PG.
PG.
Business Plan
091
Business Plan
090
3.3.4.8.2. Costs
The costs of this activity are initially only estimated
in Supplies and External Services, staff costs and
depreciation.
We also stress the value of representation expenses,
specialized work, communications and costs to be charged
to the holding structure.
As to the outsourcing contractracts, the values below refer
to the total costs of films and documentaries to produce,
as detailed below:
In supplies and services, the line item with the most
meaning is that of the subcontracts, being that all of the
business’s activity relies on outsourcing.
Cost of a film production
2010
Outsourcing
Outsourcing Holding
Books and technical documentation
Office Materials
Gift Items
Rents and rentals
Representation Expenses
Communication
2011
2012
2013
2014
2015
2016
Producer
1
96,2000 €
28.075.998,00
28.075.998,00
28.075.998,00
28.075.998,00
28.075.998,00
104-00
Writers/script Fee
1
31,100 €
565.092,92
576.394,78
587.922,67
605.560,35
623.727,16
642.438,98
661.712,15
105-00
Director
1
100.00 €
384.544 €
2.000,00
2.040,00
2.080,80
2.143,22
2.207,52
2.273,75
2.341,96
106-00
Cast/ Stunts
1
10.000,00
10.200,00
10.404,00
10.716,12
11.037,60
11.368,73
11.709,79
107-00
Cast OT/Mileage
2
10.000 €
10.000,00
10.200,00
10.404,00
10.716,12
11.037,60
11.368,73
11.709,79
108-11-00
ATL TRAVEL & LIVING
3
29.425 €
80.000,00
81.600,00
83.232,00
85.728,96
88.300,83
90.949,85
93.678,35
120.000,00
122.400,00
124.848,00
128.593,44
132.451,24
136.424,78
140.517,52
56.000,00
57.120,00
58.262,40
60.010,27
61.810,58
63.664,90
65.574,84
5.000,00
5.100,00
5.202,00
5.358,06
5.518,80
5.684,37
5.854,90
1.000.000,00
1.000.000,00
1.000.000,00
1.000.000,00
1.000.000,00
1.000.000,00
Specialized works
1.150.000,00
1.173.000,00
1.196.460,00
1.232.353,80
1.269.324,41
1.307.404,15
1.346.626,27
200.000,00
204.000,00
208.080,00
214.322,40
220.752,07
227.374,63
234.195,87
8.637.974,92
21.938.288,78
31.362.893,87
31.431.500,75
31.502.165,83
31.574.950,87
31.649.919,45
TOTAL ABOVE-THELINE
651.270 €
111-00
Extras
4
2.150 €
112-00
Prduction
4
81.569 €
114-00
Art Department/Construction
5
81.369 €
116-00
Grip / Operations
6
41.790 €
118-00
Camera
6
47.560 €
119-00
Sound
7
10.264 €
120-00
Electrical / Set Lighting
7
42.336 €
123-00
Set Dressing
8
34..560 €
125-00
Wardrobe
8
29.616 €
127-00
Makeup & Hair
9
18.498 €
14.140 €
131-00
Props / Special FX
9
135-00
Picture Veichules & Animals
10
2.000 €
140-00
Prdduction Film
10
18.349 €
147-00
Transportation
10
76.750 €
148-00
Btl Travel & Living
11
50.445 €
150-00
Location & Office Expense
12
Total Production
58.853 €
610.257 €
361-00
Picture Editorial /Post Sound Package
13
51.000 €
365-00
Music
13
10.000 €
366-00
Publicity
13
20.000 €
367-00
Post Film & Lab & Titles
13
40.000 €
370-00
Insurance
13
Total Post Prodution
470-00
Portimão Film Studio
Total
18.696.234,00
1.000.000,00
Total
Page
103-00
5.439.882,00
Advertising and promotion
Other supplies and services
Category
Acct No
Miscellaneous Charges
Total Other
28.000 €
149.000 €
14
10.650 €
10.650 €
Contingency : 10 %
142.118 €
Total Above-the-line
651.270 €
Total Below-the-line
769.907 €
Total Above and Bellow-the-line
1.421.176 €
Grand Total
1.563.294 €
Portimão Film Studio
ESF LINE ITEMS
PG.
PG.
Specialized works are a set of solutions in the area of
management and accounting such as: secretarial service
and office administration, accounting and taxation,
controller / coaching, hosting and legal support.
The insurance coverage includes furniture.
Cost of a documentary production
“Other” includes the subscription of industry magazines,
and various other supplies.
The table below reflects the cost of company staff for the
period under review.
Business Plan
093
Business Plan
092
The line item advertising refers to the hosting and annual
maintenance of the site as well as merchandising.
In Thousands € Documentários e restauros
Costs Bellow the line
CGI + story board + Original sound track + eding + recriaons
Salaries
Lodging+catering
Equipments, cameras, tapes, tripods, lights…
Wharehouses, props, office expenses
Actors + extras
Producon Team
Total Below the line
Costs Above the Line
Scripts, story, rights
Cast
Director + Execuves Producers
Produtor
Total Above the line
Conngency + Markeng + Insurance + Legal + Finance
Total Conngency and extras
TOTAL
25
21
2
3
8
5
31
95
Monthly Values:
MONTHLY COMPENSATION (WITHOUT SOCIAL CONTRIBUTIONS)
6
12
15
10
43
11
11
150
Categories
Average monthly compensation
2010
2011
2012
2013
2014
2015
2016
Directorate
Manager
3.500,00
3.570,00
3.641,40
3.750,64
3.863,16
3.979,06
4.098,43
Secretary
1.500,00
1.530,00
1.560,60
1.607,42
1.655,64
1.705,31
1.756,47
Clerk
2.000,00
2.040,00
2.080,80
2.143,22
2.207,52
2.273,75
2.341,96
Global cost of production
2011
2012
1.563.000 €
2013
1.563.000 €
2014
1.563.000 €
2015
1.563.000 €
2016
1.563.000 €
1.563.000 €
Type 2
3.126.000 €
6.252.000 €
6.252.000 €
6.252.000 €
6.252.000 €
6.252.000 €
6.252.000 €
Type 3
0
9.378.000 €
18.756.000 €
18.756.000 €
18.756.000 €
18.756.000 €
18.756.000 €
1.563.000 €
1.050.000 €
Documentaries New
150.000 €
300.000 €
450.000 €
1.050.000 €
1.050.000 €
1.050.000 €
Documentaries Restoration
600.000 €
1.200.000 €
1.050.000 €
450.000 €
450.000 €
450.000 €
450.000 €
5.439.000 €
18.693.000 €
28.071.000 €
28.071.000 €
28.071.000 €
28.071.000 €
28.071.000 €
Total
Portimão Film Studio
2010
Type 1
Portimão Film Studio
Film Type / Year
Business Plan
Business Plan
Portimão Film Studio
Portimão Film Studio
094
095
PG.
PG.
096
097
PG.
PG.
Onward from the 4th year we note a more significant
increase in Liabilities due to the payment of taxes on net
income obtained.
The equity will also increase for the same reason the
liabilities increase – the Increase in Net Income.
Business Plan
Business Plan
3.3.4.8.3. Financial Projections
The projection is that Property is increasing throughout
the period under review, as we are faced with the
amortization of Licenses and Royalties. With regard to
Liabilities, we note operational increase generating shortterm debt to suppliers.
Financial Projections
ASSETS
Gross Fixed
PERSONNEL ANNUAL COSTS (Compensations without Social Contributions)
CATEGORIES
2010
2011
Intangible
2012
2013
2014
2015
2016
Depreciation of Intangible
Tangible
Directorate
Manager
49.000,00
49.980,00
50.979,60
52.508,99
54.084,26
55.706,79
57.377,99
Secretary
21.000,00
21.420,00
21.848,40
22.503,85
23.178,97
23.874,34
24.590,57
Clerk
28.000,00
28.560,00
29.131,20
30.005,14
30.905,29
31.832,45
32.787,42
98.000,00
99.960,00
101.959,20
105.017,98
108.168,52
111.413,57
114.755,98
Total Compensation
2010
2011
2012
2013
2014
2015
2016
Directorate
2013
2014
2015
2016
1.459.000,00
1.744.000,00
2.029.000,00
2.314.000,00
2.599.000,00
589.000,00
1.114.000,00
1.389.000,00
1.664.000,00
1.939.000,00
2.214.000,00
2.489.000,00
196.333,33
567.666,67
1.030.666,67
1.389.000,00
1.664.000,00
1.939.000,00
2.214.000,00
50.000,00
60.000,00
70.000,00
80.000,00
90.000,00
100.000,00
110.000,00
12.500,00
15.000,00
17.500,00
20.000,00
10.000,00
10.000,00
10.000,00
0,00
0,00
0,00
0,00
0,00
0,00
0,00
0,00
0,00
0,00
0,00
0,00
0,00
0,00
0,00
0,00
0,00
0,00
0,00
0,00
0,00
208.833,33
595.166,67
1.075.666,67
1.454.000,00
1.739.000,00
2.024.000,00
2.309.000,00
Assets Under Construction
0,00
0,00
0,00
0,00
0,00
0,00
0,00
823.241,80
7.114.435,76
7.932.398,11
11.543.987,18
36.753.830,60
56.012.311,31
75.306.399,49
Receivables – Medium and Long-Term
0,00
0,00
0,00
0,00
0,00
0,00
0,00
Raw Materials, Subsid Consumption
0,00
0,00
0,00
0,00
0,00
0,00
0,00
Finished goods and ongoing work
0,00
0,00
0,00
0,00
0,00
0,00
0,00
Stocks
Manager
17.027,50
17.368,05
17.715,41
18.246,87
18.794,28
19.358,11
19.938,85
Goods
0,00
0,00
0,00
0,00
0,00
0,00
0,00
Secretary
7.297,50
7.443,45
7.592,32
7.820,09
8.054,69
8.296,33
8.545,22
Other
0,00
0,00
0,00
0,00
0,00
0,00
0,00
Clerk
9.730,00
9.924,60
10.123,09
10.426,78
10.739,59
11.061,78
11.393,63
Adjustments Stocks
0,00
0,00
0,00
0,00
0,00
0,00
0,00
89.835,62
937.561,64
2.806.150,68
4.349.095,89
5.596.435,27
9.538.388,73
9.559.130,56
Receivables – Short-term
Total Social Contributions
Compensation + Social Contribution
34.055,00
34.736,10
35.430,82
36.493,75
37.588,56
38.716,22
39.877,70
132.055,00
134.696,10
137.390,02
141.511,72
145.757,07
150.129,79
154.633,68
89.835,62
937.561,64
2.806.150,68
4.349.095,89
4.716.739,73
4.732.191,78
4.732.150,68
State and other public entities
0,00
0,00
0,00
0,00
879.695,55
4.806.196,95
4.826.979,87
Other
0,00
0,00
0,00
0,00
0,00
0,00
0,00
Adjustments for doubtful debts
0,00
0,00
0,00
0,00
0,00
0,00
0,00
0,00
0,00
0,00
0,00
0,00
0,00
0,00
733.406,18
6.176.874,12
5.126.247,42
7.194.891,29
31.157.395,33
46.473.922,58
65.747.268,93
Clients
Securities
Deposits and Cash
0,00
0,00
0,00
0,00
0,00
0,00
0,00
1.253.408,47
7.693.269,10
8.315.731,44
11.833.987,19
37.043.830,60
56.302.311,31
75.596.399,49
Accruals and deferrals
The company will have a Directorate composed of a
General Manager, a secretary e and a clerk.
TOTAL ASSETS
EQUITY
2010
2011
2012
2013
2014
2015
2016
8.500.000,00
25.000.000,00
25.000.000,00
25.000.000,00
25.000.000,00
25.000.000,00
25.000.000,00
Stock (Company Shares)
0,00
0,00
0,00
0,00
0,00
0,00
0,00
Supplemental Payments
0,00
0,00
0,00
0,00
0,00
0,00
0,00
Reserves/Earnings
0,00
-7.855.397,37
-18.789.607,36
-16.449.917,93
3.518.782,19
22.743.570,00
42.051.489,50
-7.855.397,37
-10.934.209,99
2.339.689,43
19.968.700,12
19.224.787,81
19.307.919,50
19.247.940,14
0,00
0,00
2.339.689,43
19.968.700,12
19.224.787,81
19.307.919,50
19.247.940,14
644.602,63
6.210.392,64
6.210.392,64
8.550.082,07
28.518.782,19
47.743.570,00
67.051.489,50
Joint-Stock
Net Income
Anticipated Dividends
TOTAL EQUITY
LIABILITIES
2010
2011
2012
2013
2014
2015
2016
Commons
0,00
0,00
0,00
0,00
0,00
0,00
0,00
Payable – Medium and Long-Term
0,00
0,00
0,00
0,00
0,00
0,00
0,00
Loans
0,00
0,00
0,00
0,00
0,00
0,00
0,00
Reimbursable grants
0,00
0,00
0,00
0,00
0,00
0,00
0,00
Supplies
0,00
0,00
0,00
0,00
0,00
0,00
0,00
Suppliers of fixed assets
0,00
0,00
0,00
0,00
0,00
0,00
0,00
Other
0,00
0,00
0,00
0,00
0,00
0,00
0,00
608.805,84
1.482.876,46
2.105.338,80
3.283.905,12
8.525.048,41
8.558.741,31
8.544.909,99
Payable – Short-term
0,00
0,00
0,00
0,00
0,00
0,00
0,00
709.970,54
1.803.147,02
2.577.772,10
2.583.411,02
2.589.219,11
2.595.201,44
2.601.363,24
-101.164,70
-320.270,57
-472.433,30
700.494,10
5.935.829,30
5.963.539,87
5.943.546,75
0,00
0,00
0,00
0,00
0,00
0,00
0,00
Acréscimos e Diferimentos
0,00
0,00
0,00
0,00
0,00
0,00
0,00
Subsidies repayable
0,00
0,00
0,00
0,00
0,00
0,00
0,00
608.805,84
1.482.876,46
2.105.338,80
3.283.905,12
8.525.048,41
8.558.741,31
8.544.909,99
1.253.408,47
7.693.269,10
8.315.731,44
11.833.987,19
37.043.830,60
56.302.311,31
75.596.399,49
Loans
Portimão Film Studio
2012
1.174.000,00
Financial Investments Adjustments
Accumulated Depreciation and Adjustments
2011
639.000,00
Financial Investments
Rolling Stock
SOCIAL CONTRIBUTIONS FOR PERSONNEL
CATEGORIES
Depreciation of Tangible
2010
Suppliers
State and other public entities
Others
TOTAL LIABILITIES
TOTAL EQUITY + LIABILITIES
Portimão Film Studio
Yearly Values:
PG.
PG.
2010
2012
2013
2014
2015
2016
0,00
0,00
0,00
0,00
0,00
0,00
0,00
Products
0,00
0,00
0,00
0,00
0,00
0,00
0,00
Goods
0,00
0,00
0,00
0,00
0,00
0,00
0,00
Domestic Market
0,00
0,00
0,00
0,00
0,00
0,00
0,00
Foreign Market
0,00
0,00
0,00
0,00
0,00
0,00
0,00
1.093.000,00
11.407.000,00
34.141.500,00
52.914.000,00
57.387.000,00
57.575.000,00
57.574.500,00
Domestic Market
0,00
0,00
0,00
0,00
0,00
0,00
0,00
1.093.000,00
11.407.000,00
34.141.500,00
52.914.000,00
57.387.000,00
57.575.000,00
57.574.500,00
Change in Production
0,00
0,00
0,00
0,00
0,00
0,00
0,00
Work performed for Company
0,00
0,00
0,00
0,00
0,00
0,00
0,00
Other Operating Income (including reversals)
0,00
0,00
0,00
0,00
0,00
0,00
0,00
Income and Financial Gains Operation – Exchange Var.
0,00
0,00
0,00
0,00
0,00
0,00
0,00
Income and Financial Gains Operation – PP Discounts
0,00
0,00
0,00
0,00
0,00
0,00
0,00
1.093.000,00
11.407.000,00
34.141.500,00
52.914.000,00
57.387.000,00
57.575.000,00
57.574.500,00
Other Income and Financial Gains
0,00
0,00
0,00
0,00
0,00
0,00
0,00
Income and Extraordinary Gains
0,00
0,00
0,00
0,00
0,00
0,00
0,00
1.093.000,00
11.407.000,00
34.141.500,00
52.914.000,00
57.387.000,00
57.575.000,00
57.574.500,00
Foreign Market
Operating Income
TOTAL INCOME
COSTS
2010
2011
2012
2013
2014
2015
2016
Cost of Goods Sold and Raw Materials Consumed
0,00
0,00
0,00
0,00
0,00
0,00
0,00
Goods
0,00
0,00
0,00
0,00
0,00
0,00
0,00
Raw materials, Subsid. & Consumer
0,00
0,00
0,00
0,00
0,00
0,00
0,00
8.637.974,92
21.938.288,78
31.362.893,87
31.431.500,75
31.502.165,83
31.574.950,87
31.649.919,45
Supplies and Services
Taxes
The financial profitability is the ability of the company
to generate profit from its own capital. In this line item
we reflect the stabilization of the number of films and
documentaries in the 4th year, with relation to fixed costs.
Despite results in the year of investment being negative,
we note that return on investment is clearly positive
onwards from the 4th year.
Critical point
Fixed Costs
2010
2011
8.978.863,25
Variable Costs
Critical Point
Margin of Coverage (Income- Critical point)
Margin of Coverage (%)
This is mainly due to the stabilization of the sales and
production of its subsidiaries.
Gross Margin Trading (GMT) is calculated as the difference
between the sum of Services Rendered and Subcontracted
Services (essential to the business).This margin exhibits a
favorable growth trend.
2012
22.459.318,21
2013
31.980.783,89
2014
31.951.345,80
2015
31.932.922,90
2016
32.010.080,65
32.089.553,13
-30.465,88
-118.108,23
-178.973,32
-178.973,32
-178.973,32
-178.973,32
-178.973,32
8.735.376,58
22.229.157,23
31.814.011,51
31.843.639,68
31.833.643,05
31.910.884,87
31.990.110,22
-7.642.376,58
-10.822.157,23
2.327.488,49
21.070.360,32
25.553.356,95
25.664.115,13
25.584.389,78
-699,2%
-94,9%
6,8%
39,8%
44,5%
44,6%
44,4%
-40.465,88
-128.108,23
-188.973,32
-188.973,32
-188.973,32
-188.973,32
-188.973,32
Direct
-20.232,94
-64.054,11
-94.486,66
-94.486,66
-94.486,66
-94.486,66
-94.486,66
Indirect
-20.232,94
-64.054,11
-94.486,66
-94.486,66
-94.486,66
-94.486,66
-94.486,66
132.055,00
134.696,10
137.390,02
141.511,72
145.757,07
150.129,79
154.633,68
Operating Profit/Investment
-217,1%
-302,3%
65,0%
585,4%
709,7%
712,8%
710,6%
Compensation
98.000,00
99.960,00
101.959,20
105.017,98
108.168,52
111.413,57
114.755,98
Capacity to Self-finance/Investment
-211,6%
-291,9%
78,1%
563,1%
540,0%
542,3%
540,6%
Social Contributions
34.055,00
34.736,10
35.430,82
36.493,75
37.588,56
38.716,22
39.877,70
0,00
0,00
0,00
0,00
0,00
0,00
0,00
208.833,33
386.333,33
480.500,00
378.333,33
285.000,00
285.000,00
285.000,00
Supplies
0,00
0,00
0,00
0,00
0,00
0,00
0,00
Other Operation Costs
0,00
0,00
0,00
0,00
0,00
0,00
0,00
Income and Financial Gains Operation – Exchange Var.
0,00
0,00
0,00
0,00
0,00
0,00
0,00
Custos e Perdas Financ. Exploração - Descontos PP
0,00
0,00
0,00
0,00
0,00
0,00
0,00
8.938.397,37
22.331.209,99
31.791.810,57
31.762.372,48
31.743.949,58
31.821.107,33
31.900.579,81
-7.845.397,37
-10.924.209,99
2.349.689,43
21.151.627,52
25.643.050,42
25.753.892,67
25.673.920,19
Other Costs and Financial Losses
10.000,00
10.000,00
10.000,00
10.000,00
10.000,00
10.000,00
10.000,00
Interests
Personnel Costs
Other
Depreciation and Adjustments
Operational Costs
Results before Financial Overhead and Extraord..
Profitability of the Investment
General Profitability
2010
2011
2010
2012
2011
2013
2012
2014
2013
2015
2014
2016
2015
2016
Financial Profitability
-1218,6%
-176,1%
37,7%
233,5%
67,4%
40,4%
28,7%
Profitability of activity
-699,6%
-92,5%
8,3%
38,5%
34,0%
34,0%
33,9%
Profitability of production
-718,7%
-95,9%
6,9%
37,7%
33,5%
33,5%
33,4%
Economic Efficiency
-717,8%
-95,8%
6,9%
40,0%
44,7%
44,7%
44,6%
Profitablity of sales
-718,7%
-95,9%
6,9%
37,7%
33,5%
33,5%
33,4%
Net Profit/Net Assets
-626,7%
-142,1%
28,1%
168,7%
51,9%
34,3%
25,5%
10.000,00
10.000,00
10.000,00
10.000,00
10.000,00
10.000,00
10.000,00
1.093.000,00
11.407.000,00
34.141.500,00
52.914.000,00
57.387.000,00
57.575.000,00
57.574.500,00
Other
0,00
0,00
0,00
0,00
0,00
0,00
0,00
Gross sales
364.333,33
3.802.333,33
11.380.500,00
17.638.000,00
19.129.000,00
19.191.666,67
19.191.500,00
Extraordinary Costs
0,00
0,00
0,00
0,00
0,00
0,00
0,00
Gross sales/Nº employees
364.333,33
3.802.333,33
11.380.500,00
17.638.000,00
19.129.000,00
19.191.666,67
19.191.500,00
8.948.397,37
22.341.209,99
31.801.810,57
31.772.372,48
31.753.949,58
31.831.107,33
31.910.579,81
(Sales + Services)/Nº employees
0,0%
0,0%
0,0%
0,0%
0,0%
0,0%
0,0%
-7.855.397,37
-10.934.209,99
2.339.689,43
21.141.627,52
25.633.050,42
25.743.892,67
25.663.920,19
Personnel overhead/(Sales+Services)
-2.514.991,64
-3.510.429,59
926.202,04
7.160.833,08
8.628.278,06
8.666.683,04
8.641.526,85
TOTAL COST
Portimão Film Studio
2011
Sailes
Services
The fixed costs are attributable to the depreciation of
property, costs with ESFs and personnel. Variable costs are
attributable to taxes.
The company maintains a progressive margin of coverage,
reaching 44% in 5th year.
BREAKOUT OF PROJECTED RESULTS
ASSETS
Regarding the indicators of general profitability we can see
positive development. Most indicators reach their peak in
the 4th year as a result of the company reaching capacity
of activity.
Profit Before Tax
Impostos sobre Rendimento do Exercício
NET
0,00
0,00
0,00
1.172.927,40
6.408.262,60
6.435.973,17
6.415.980,05
-7.855.397,37
-10.934.209,99
2.339.689,43
19.968.700,12
19.224.787,81
19.307.919,50
19.247.940,14
Margem Bruta Comercial
VAB/Personnel Costs
VAB
-5713,5%
-7818,6%
2022,4%
15180,7%
17758,9%
17318,4%
16765,2%
-7.544.974,92
-10.531.288,78
2.778.606,13
21.482.499,25
25.884.834,17
26.000.049,13
25.924.580,55
Portimão Film Studio
3.3.4.8.4. Breakout of Projected Results
In terms of net results, it bears mentioning that negative
results are foreseen for the first 2 years. Onwards from the
4th year we note results similar to a full capacity year.
3.3.4.8.5 Indicators
Next, we move to an analysis of the most significant
indictors in order to conclude this survey of the study’s
results.
Business Plan
099
Business Plan
098
PG.
PG.
Business Plan
0101
Business Plan
0100
The company’s indebtedness in the medium and longterm corresponds to the acquisition of supplies during
the phase of investment. In this company the value is null
throughout the project.
With regard to financial autonomy, it presents a ratio very
close to 90%; a very favorable indicator in the viability
analysis.
Debt & Risk
Debt
MLP Debt
2011
With regard to liquidity and net cash, this company
exhibits very favorable ratios, especially onwards from the
2nd year.
A comparison of overall liquidity with the decrease reveals
the weight of the remaining assets. Values do not vary as
the company is only providing services.
General Liquidity reaches values well above 100% for
the period under review (beginning in the 2nd year), not
requiring, therefore, use of permanent capital to finance
the portion not covered by current liabilities.
We would also cite the fact that the fixed capital number
indicates a sound financial structure.
2012
2013
2014
2015
2016
48,6%
19,3%
25,3%
27,7%
23,0%
15,2%
11,3%
0,0%
0,0%
0,0%
0,0%
0,0%
0,0%
0,0%
51,4%
80,7%
74,7%
72,3%
77,0%
84,8%
88,7%
Solvency
105,9%
418,8%
295,0%
260,4%
334,5%
557,8%
784,7%
Debt Capacity
105,9%
418,8%
295,0%
260,4%
334,5%
557,8%
784,7%
Fixed Coverage
149,8%
1072,9%
1620,1%
2948,3%
9834,1%
16463,3%
23121,2%
Working Capital
214.435,96
5.631.559,31
5.827.059,31
8.260.082,07
28.228.782,19
47.453.570,00
66.761.489,50
Permanent Capital
644.602,63
6.210.392,64
6.210.392,64
8.550.082,07
28.518.782,19
47.743.570,00
67.051.489,50
Financial Autonomy
Portimão Film Studio
2010
Solvency analyzes the relationship between the equity
and debt capital of a company. The management of
this financial indicator is important not to put at risk the
continuity of the company in the medium-to-long term.
The figures in the table above indicate economic and
financial stability (as in accordance with the forecast
numbers) from the beginning due to being subsidized by
the Holding.
Liquidity and Net Cash
2010
2011
2012
2013
2014
2015
2016
General Liquidity
135,2%
479,8%
376,8%
351,5%
431,1%
654,4%
881,3%
Reduced Liquidity
135,2%
479,8%
376,8%
351,5%
431,1%
654,4%
881,3%
Net Cash/Operational Income
67,1%
54,1%
15,0%
13,6%
54,3%
80,7%
114,2%
(NFM-FM)/Operational Income
-67,1%
-54,1%
-15,0%
-13,6%
-54,3%
-80,7%
-114,2%
-141,3%
-1132,7%
731,5%
675,5%
-1063,9%
4743,9%
6482,5%
0,9%
0,1%
0,0%
0,0%
0,0%
0,0%
0,0%
733.406,18
6.176.874,12
5.126.247,42
7.194.891,29
31.157.395,33
46.473.922,58
65.747.268,93
Net Cash/NFM
Financial Overhead/Operational Income
Net Cash
Portimão Film Studio
The level of debt and risk of the Fund is perfectly
controlled throughout the period under review.
PG.
PG.
Business Plan
0103
Business Plan
0102
According to forecast calculations, this project has a
very positive Net Present Value, as shown in the table
above. That is, invested capital is recovered along with an
attractive return.
Given the demonstrated cash-lfow, the forecast is quite
promising.
The term of updated recovery of the investment is 5 years,
which means that in that time, the developer will recoup
the actual value of the investment costs through income
generated by their activity and begin to generate surplus.
In this table we can see 3 scenarios with a standard
discount rate of 8%, a lower 4% rate, and a high discount
rate of 16%.
Scenario I – Normal Update Rate
1. Profit After Tax
2. Depreciation and Supplies
3. Capacity to Self-Finance (CAF)
4. Fixed Asset Investment
5. Residual Value of Invest. in Fixed Capital Assets
6. Investment in Intangible Fixed Assets
7. Residual Value of Invest. In Intangible Fixed Assets
8. Investment in Working Capital Fund
2013
2014
2015
8,0%
CAF Updated
-7.646.564,04
-9.766.552,46
2.417.857,88
16.152.131,17
14.340.276,46
13.334.611,79
12.309.065,60
Updated Net Cash Flows
-7.766.593,82
-10.237.529,69
1.105.163,52
15.636.633,27
17.066.358,06
10.480.749,11
12.107.680,31
Updated and Accumulated Net Cash Flows
-7.766.593,82
-18.004.123,51
-16.898.959,99
-1.262.326,72
15.804.031,34
26.284.780,45
38.392.460,76
120.029,78
470.977,23
1.312.694,36
515.497,90
-2.726.081,59
2.853.862,68
201.385,29
0,00
0,00
0,00
0,00
0,00
0,00
821.880,19
-7.766.593,82
-10.237.529,69
1.105.163,52
15.636.633,27
17.066.358,06
10.480.749,11
12.929.560,50
Updated Investment
Updated Final Year Residual Value
Updated Net Cash Flow + Residual Value
Established Values
IRR with Residual Value
Updated Payback
Year term.
38.392.460,76
-10.934.209,99
2.339.689,43
19.968.700,12
19.224.787,81
19.307.919,50
19.247.940,14
208.833,33
386.333,33
480.500,00
378.333,33
285.000,00
285.000,00
285.000,00
-7.646.564,04
-10.547.876,65
2.820.189,43
20.347.033,45
19.509.787,81
19.592.919,50
19.532.940,14
50.000,00
10.000,00
10.000,00
10.000,00
10.000,00
10.000,00
10.000,00
39.214.340,95
-
4 anos
48,7%
-
5 anos
-1.262.326,72
-
6 anos
15.804.031,34
-
4,7%
7 anos
26.284.780,45
-
34,3%
8 anos
38.392.460,76
-
43,0%
0,00
-
48,7%
48,7%
49,1%
Scenario II – Low Updated Rate
2010
Taxa de Actualização
2011
2012
2013
2014
2015
2016
4,0%
4,0%
4,0%
4,0%
4,0%
4,0%
4,0%
CAF actualizada
-7.646.564,04
-10.142.189,09
2.607.423,66
18.088.438,65
16.677.048,39
16.103.951,64
15.437.166,32
Meios Libertos Líquidos actualizados
-7.766.593,82
-10.631.280,83
1.191.810,96
17.511.143,18
19.847.349,52
12.657.397,11
15.184.603,02
Meios Libertos Líquidos actualizados e acumulados
-7.766.593,82
-18.397.874,65
-17.206.063,69
305.079,49
20.152.429,01
32.809.826,12
47.994.429,15
120.029,78
489.091,74
1.415.612,70
577.295,47
-3.170.301,13
3.446.554,53
252.563,30
0,00
0,00
0,00
0,00
0,00
0,00
1.030.744,46
-7.766.593,82
-10.631.280,83
1.191.810,96
17.511.143,18
19.847.349,52
12.657.397,11
16.215.347,49
Valor Actualizado Líquido (VAL) sem Valor Residual
VAL com Valor Residual
Prazo de Recuperação (Payback) actualizado
Hipótese III - Taxa Actualização Alta
Year term.
47.994.429,15
3 anos
4 anos
-17.206.063,69
5 anos
305.079,49
6 anos
20.152.429,01
7 anos
32.809.826,12
8 anos
47.994.429,15
0,00
49.025.173,61
4 Years
2010
2011
2012
2013
2014
2015
2016
0,00
0,00
0,00
0,00
0,00
0,00
15.000,00
589.000,00
525.000,00
275.000,00
275.000,00
275.000,00
275.000,00
275.000,00
Update Rate
16,0%
16,0%
16,0%
16,0%
16,0%
16,0%
16,0%
0,00
0,00
0,00
0,00
0,00
0,00
275.000,00
CAF Updated
-7.646.564,04
-9.092.997,11
2.095.860,16
13.035.483,12
10.775.082,13
9.328.443,98
8.017.143,99
Updated Net Cash Flows
-7.766.593,82
-9.531.493,16
957.983,60
12.619.453,55
12.823.421,52
7.331.978,05
7.885.977,67
Updated and Accumulated Net Cash Flows
-7.766.593,82
-17.298.086,98
-16.340.103,38
-3.720.649,83
9.102.771,69
16.434.749,74
24.320.727,41
120.029,78
438.496,05
1.137.876,56
416.029,57
-2.048.339,39
1.996.465,93
131.166,32
0,00
0,00
0,00
0,00
0,00
0,00
535.307,23
-7.766.593,82
-9.531.493,16
957.983,60
12.619.453,55
12.823.421,52
7.331.978,05
8.421.284,90
7 anos
8 anos
-518.970,22
-26.344,59
1.246.126,70
364.378,89
-3.993.803,91
3.908.260,57
34.573,14
0,00
0,00
0,00
0,00
0,00
0,00
1.014.220,57
10. Financial Investment + Works in Progress
0,00
0,00
0,00
0,00
0,00
0,00
0,00
Updated Investment
11. Residual Value of Fin. Invest + Works in Progress
0,00
0,00
0,00
0,00
0,00
0,00
0,00
Updated Residual Value
12. Divestment (Total Assets)
0,00
0,00
0,00
0,00
0,00
0,00
0,00
Updated Net Cash Flow + Residual Value
120.029,78
508.655,41
1.531.126,70
649.378,89
-3.708.803,91
4.193.260,57
319.573,14
0,00
0,00
0,00
0,00
0,00
0,00
1.304.220,57
15. Net Cash Flows without Residual Value
-7.766.593,82
-11.056.532,07
1.289.062,73
19.697.654,57
23.218.591,73
15.399.658,93
19.213.366,99
NPV with residual Value
16. Net Cash Flows with Residual Value
-7.766.593,82
-11.056.532,07
1.289.062,73
19.697.654,57
23.218.591,73
15.399.658,93
20.517.587,57
Updated Payback
14. Residual value (totals)
3 anos
-16.898.959,99
5 Years
Valores apurados
-7.855.397,37
2016
8,0%
Internal Return Rate (IRR) Without Residual Value
2016
2015
8,0%
9. Residual Value of Invest. in Working Capital Fund
13. Net Investments (annual total)
Portimão Film Studio
2012
2014
8,0%
Meios Libertos Líquidos actualizados + Valor Residual
2011
2013
8,0%
Valor Residual actualizado
2010
2012
8,0%
Investimento actualizado
CASH-FLOW
2011
8,0%
NPV with Residual Value
We consider, therefore, the viability of this project to be
guaranteed for the period analyzed, with good prospects
for continued development.
2010
Update Rate
Net present value (NPV) without residual value
It is, therefore, be guaranteed the viability of this project
for the period presented, and has good prospects for
development.
For this company, the Internal Rate of Return (with
residual) with a value of 49.1% reveals this to be a very
attractive business, providing rates of return well above
those on capital in the financial market.
NPV, IRR AND PAYBACK PERIOD
Established Values
Net present value (NPV) without residual value
Year term.
24.320.727,41
3 anos
-16.340.103,38
4 anos
-3.720.649,83
5 anos
9.102.771,69
6 anos
16.434.749,74
24.320.727,41
0,00
24.856.034,64
5 Years
Portimão Film Studio
3.3.4.8.6. Viability
The Cash-Flow table shows return beginning in the 4th
year which demonstrates the capacity of the whole
project.
PG.
PG.
Business Plan
0105
Business Plan
0104
Partnership Management
Portimão Film Studio
This case is of a higher complexity. Looking at the list
of companies in the structure of the Majors, we note
that forming a partnership with a subsidiary may not be
the same as with the Holding. Moreover it is likely that
exclusivity or partnerships with a Major could preclude
working with the others. Based on the business model of
this project, a co-production with 3 different Majors, and
production of 5 films with the other Majors, should be
made annually. This would be the ideal scenario, however
its management is very sensitive.
Financial information
The accounts of the company will be managed by an
external entity and organized by cost centers. Being a
diversified and complex activity, it is necessary to evaluate
the profitability of each “pack”, or service, individually and
make regular assessments of the business.
Along with accounting balance sheets, progress reports
will be provided (also by an external company) that will
help understand the company’s situation and will support
the management of the business.
The Auditing, to be carried out by another company,
will allow for regular assessments of management, and
execution of business plans and annual budgets
3.3.4.8.8. Necessary Investment
To start this project and given the initial projection of
the business, it’s been determined necessary to have the
investment itemized in this table.
Investment essential for the proper development of
activity will focus on Licenses and Royalties.
Investments
Total Investment
Property and Resources, inf, buildings, const.
3.613.220,57
0,00
Equipments, tools and utens.
70.000,00
Cargo and Transportation Material
40.000,00
Other tangible investments
Total investment in tangible fixed assets
Total investment in intangible fixed assets
With the image and placing the company in the market
in mind, the investment will also include the Imagem
Corporativa (Corporate Image) and the creation of a Web
site.
Values
Investment in Working Capital Fund
Financial Investment
0,00
110.000,00
2.489.000,00
1.014.220,57
0,00
With the above investments, the basic needs necessary for
the development of activity for the analyzed period are
satisfied.
The audit in this specific case becomes very important
because it will have a monitoring role on investments in
the companies of each production.
Portimão Film Studio
3.3.4.8.7. Management and control of the business
Management and operational control requirements
are mandatory for good business performance. Thus, a
modern management system is intended, which is able
to keep up with changing needs. This business plan is
sufficiently detailed to easily and quickly create an actions
plan and budget that could be meticulously implemented.
PG.
PG.
Business Plan
0107
Business Plan
0106
3.3.4.8.9. Necessary financing and economic value
Financing of this business will be drawn from capital of the
Holding.
3.3.7.8.10. Statement of Working Capital
In the Statement of Working Capital we can conclude that
the needs of the Working Capital Fund will be small vis-àvis the value of turnover. Some attention should be paid in
the first year to the supplier payment plan.
Naturally, this business is expected to be self-financed
from the 3rd year onward.
Statement of Working Capital
2010
Totals
2011
2012
2013
2014
2015
2016
Clients (associated to Sales)
Equity
Clients (associated to Services)
Joint-Stock
25.000.000,00
8.500.000,00
16.500.000,00
0,00
0,00
0,00
0,00
0,00
0,00
0,00
0,00
0,00
0,00
0,00
0,00
0,00
63.608.429,64
-7.646.564,04
-10.547.876,65
2.820.189,43
20.347.033,45
19.509.787,81
19.592.919,50
19.532.940,14
88.608.429,64
853.435,96
5.952.123,35
2.820.189,43
20.347.033,45
19.509.787,81
19.592.919,50
19.532.940,14
MLP Loans(+Bonds)
0,00
0,00
0,00
0,00
0,00
0,00
0,00
0,00
Shareholders/ Supplemental Loans
0,00
0,00
0,00
0,00
0,00
0,00
0,00
0,00
Asset Suppliers
0,00
0,00
0,00
0,00
0,00
0,00
0,00
0,00
0,00
0,00
0,00
0,00
0,00
0,00
0,00
0,00
0,00
0,00
0,00
0,00
0,00
0,00
0,00
0,00
0,00
0,00
0,00
0,00
0,00
0,00
0,00
0,00
Supplemental Benefits and other
Self-financing
Total Equity + Self-Financing
Debt Capital
Leasing
Other
Total Debt Capital
Clients C/C and others
Clients L/R
2012
2013
2014
2015
2016
0,00
0,00
0,00
0,00
0,00
0,00
89.835,62
937.561,64
2.806.150,68
4.349.095,89
4.716.739,73
4.732.191,78
4.732.150,68
0,00
0,00
0,00
0,00
0,00
0,00
0,00
89.835,62
937.561,64
2.806.150,68
4.349.095,89
4.716.739,73
4.732.191,78
4.732.150,68
0,00
0,00
0,00
0,00
0,00
0,00
0,00
Clients without Provisions
89.835,62
937.561,64
2.806.150,68
4.349.095,89
4.716.739,73
4.732.191,78
4.732.150,68
Clients after Provisions
Provisions for Contested Charges
89.835,62
937.561,64
2.806.150,68
4.349.095,89
4.716.739,73
4.732.191,78
4.732.150,68
Advances to Suppliers
0,00
0,00
0,00
0,00
0,00
0,00
0,00
Stock Raw Materials and Subsid.
0,00
0,00
0,00
0,00
0,00
0,00
0,00
Stock of Goods finished and intermediate
0,00
0,00
0,00
0,00
0,00
0,00
0,00
Stock of Goods
0,00
0,00
0,00
0,00
0,00
0,00
0,00
Other, Prod. Course and adjustment
0,00
0,00
0,00
0,00
0,00
0,00
0,00
Provisions for depreciation of Stock
0,00
0,00
0,00
0,00
0,00
0,00
0,00
Stocks
0,00
0,00
0,00
0,00
0,00
0,00
0,00
Debts owed by State and other Public Entities
0,00
0,00
0,00
0,00
879.695,55
4.806.196,95
4.826.979,87
0,00
0,00
0,00
0,00
0,00
0,00
0,00
89.835,62
937.561,64
2.806.150,68
4.349.095,89
5.596.435,27
9.538.388,73
9.559.130,56
Suppliers of Raw Materials and Subs.
0,00
0,00
0,00
0,00
0,00
0,00
0,00
Suppliers of Goods
0,00
0,00
0,00
0,00
0,00
0,00
0,00
Suppliers Outsourcing
447.113,59
1.536.676,77
2.307.616,27
2.307.616,27
2.307.616,27
2.307.616,27
2.307.616,27
Suppliers - Other
262.856,95
266.470,26
270.155,82
275.794,75
281.602,84
287.585,17
293.746,97
Suppliers C/C and other
709.970,54
1.803.147,02
2.577.772,10
2.583.411,02
2.589.219,11
2.595.201,44
2.601.363,24
Other Debts from 3rd Party Operations
Total Needs
Fornecedores L/R
Suppliers
Advances to Clients
Debts to State and Other Public Entities
Other Debts from 3rd Party Operations
Total Resources
Needs in Working Capital
Needs in Working Capital before the project
Portimão Film Studio
2011
0,00
Annual Investment in Working Capital Fund
0,00
0,00
0,00
0,00
0,00
0,00
0,00
709.970,54
1.803.147,02
2.577.772,10
2.583.411,02
2.589.219,11
2.595.201,44
2.601.363,24
0,00
0,00
0,00
0,00
0,00
0,00
0,00
-101.164,70
-320.270,57
-472.433,30
700.494,10
5.935.829,30
5.963.539,87
5.943.546,75
0,00
0,00
0,00
0,00
0,00
0,00
0,00
608.805,84
1.482.876,46
2.105.338,80
3.283.905,12
8.525.048,41
8.558.741,31
8.544.909,99
-518.970,22
-545.314,81
700.811,89
1.065.190,77
-2.928.613,14
979.647,43
1.014.220,57
0,00
-518.970,22
-26.344,59
1.246.126,70
364.378,89
-3.993.803,91
3.908.260,57
34.573,14
Working Capital Fund in Terminal year
1.014.220,57
-
-
-
-
-
-
Working Capital Fund post-project – pre-project
1.014.220,57
-
-
-
-
-
-
Portimão Film Studio
2010
ACCOUNTS
FINANCING
PG.
PG.
3.3.4.8.11. Statement of Cash Flows
In the Statement of Cash Flows we find that the investment
values necessary to finance the first 2 years, the 2nd year
the most important in the entire project. This funding will
be borne by the Holding. We found that in the 3rd year the
company already demonstrates the ability to self-sustain;
this is a marginal year. From the 4th year onwards the
company enters full operation achieving optimum annual
performance.
Statement of Cash Flows (Direct Method)
OPERATIONAL ACTIVITIES
2010
2011
2012
2013
2014
2015
1.003.164,38
10.559.273,97
32.272.910,96
51.371.054,79
57.019.356,16
57.559.547,95
57.574.541,10
Payments to Suppliers
7.928.004,38
20.845.112,30
30.588.268,79
31.425.861,82
31.496.357,74
31.568.968,54
31.643.757,65
Payments to Personnel
132.055,00
134.696,10
137.390,02
141.511,72
145.757,07
150.129,79
154.633,68
0,00
0,00
0,00
0,00
2.052.622,94
10.334.764,01
6.456.756,09
-60.698,82
-90.997,64
36.810,59
188.973,32
188.973,32
188.973,32
188.973,32
Receipts extraordinary items
0,00
0,00
0,00
0,00
0,00
0,00
0,00
Payments extraordinary items
0,00
0,00
0,00
0,00
0,00
0,00
0,00
-7.117.593,82
-10.511.532,07
1.584.062,73
19.992.654,57
23.513.591,73
15.694.658,93
19.508.366,99
Flow generated by operations
Other Payments and Receipts Oper. activ
Flows generated before extr. items
Flow Operational Activities
INVESTIMENT ACTIVITIES
2010
2011
2012
2013
2014
2015
2016
Receipts from:
Financial Investments
0,00
0,00
0,00
0,00
0,00
0,00
0,00
Tangible Fixed Assets
0,00
0,00
0,00
0,00
0,00
0,00
0,00
Intangible Fixed Assets
0,00
0,00
0,00
0,00
0,00
0,00
0,00
Investment Subsidies
0,00
0,00
0,00
0,00
0,00
0,00
0,00
Similar Interest and Income
0,00
0,00
0,00
0,00
0,00
0,00
0,00
Dividendos
0,00
0,00
0,00
0,00
0,00
0,00
0,00
Other
Payments from:
0,00
Financial Investments
Tangible Fixed Assets
Intangible Fixed Assets
0,00
0,00
0,00
0,00
0,00
0,00
50.000,00
10.000,00
10.000,00
10.000,00
10.000,00
10.000,00
10.000,00
589.000,00
525.000,00
275.000,00
275.000,00
275.000,00
275.000,00
275.000,00
0,00
0,00
0,00
0,00
0,00
0,00
0,00
Assets in Progress
Other
Flow Investment Activities
FINANCING ACTIVITIES
3.3.4.8.12. Sensitivity Analysis
Performing a Sensitivity Analysis with a 20% decrease of
income, we can conclude that the project remains stable,
even while having the ESFs, personnel and property
depreciation as fixed costs.
Sensitivity to Variation in Sales and Services
2016
Receipts from Clients
Payment/Receipt of IRC
Business Plan
0109
Business Plan
0108
-639.000,00
-535.000,00
-285.000,00
-285.000,00
-285.000,00
-285.000,00
-285.000,00
2010
2011
2012
2013
2014
2015
2016
Receipts from:
Variation of Sales and Services (+/-)
-20%
Effects in the Variation of Sales/ Serv.
(Indicators)
Financial Profitability
Reference
Ano cruzeiro/terminal
Simulation
Minimum
28,7%
40,6%
31.990.110,22
31.990.110,22
Margin of coverage (%)
44,4%
30,5%
20,0%
IRR without Residual Value
48,7%
18,0%
10,0%
65.747.268,93
24.776.952,82
General Liquidity (Stock/Debts short-term)
881,3%
401,8%
Net Cash/ Oper. Income
114,2%
53,8%
65.747.268,93
24.776.952,82
Critical point
Cash and Cash equivalent
Net Cash (Available-short-term loans)
ADDEND
Totals before and after simulation
Sales and Services before simulation
2010
2011
10,0%
2012
2013
2014
2015
2016
1.093.000,00
11.407.000,00
34.141.500,00
52.914.000,00
57.387.000,00
57.575.000,00
57.574.500,00
874.400,00
9.125.600,00
27.313.200,00
42.331.200,00
45.909.600,00
46.060.000,00
46.059.600,00
8.978.863,25
22.459.318,21
31.980.783,89
31.951.345,80
31.932.922,90
32.010.080,65
32.089.553,13
Variable costs before simulation
-30.465,88
-118.108,23
-178.973,32
-178.973,32
-178.973,32
-178.973,32
-178.973,32
Variable costs after simulation
-24.372,70
-94.486,58
-143.178,66
-143.178,66
-143.178,66
-143.178,66
-143.178,66
Net Profit before simulation
-7.855.397,37
-10.934.209,99
2.339.689,43
19.968.700,12
19.224.787,81
19.307.919,50
19.247.940,14
Net profit after simulation
Sales and Services after simulation
Fixed Costs before and after simulation
-8.023.917,26
-12.662.976,22
-2.808.381,57
12.004.754,12
10.589.891,82
10.644.823,50
10.584.919,14
Cash before simulation
733.406,18
6.176.874,12
5.126.247,42
7.194.891,29
31.157.395,33
46.473.922,58
65.747.268,93
Cash after simulation
564.886,30
4.279.588,00
-1.919.109,69
-7.814.411,82
7.513.196,22
14.166.627,47
24.776.952,82
Equity before simulation
644.602,63
6.210.392,64
6.210.392,64
8.550.082,07
28.518.782,19
47.743.570,00
67.051.489,50
Equity after simulation
476.082,74
4.313.106,52
-834.964,47
-6.459.221,04
4.874.583,08
15.436.274,90
26.081.173,40
Net Cash Flow before simulation
-7.766.593,82
-11.056.532,07
1.289.062,73
19.697.654,57
23.218.591,73
15.399.658,93
19.213.366,99
Net Cash Flow after simulation
-7.935.113,70
-12.785.298,30
-3.859.008,27
11.733.708,57
14.583.695,73
6.736.562,93
10.550.346,00
1.093.000,00
11.407.000,00
34.141.500,00
52.914.000,00
57.387.000,00
57.575.000,00
57.574.500,00
874.400,00
9.125.600,00
27.313.200,00
42.331.200,00
45.909.600,00
46.060.000,00
46.059.600,00
0,00
0,00
0,00
0,00
0,00
0,00
0,00
Total Income before simulation
8.500.000,00
16.500.000,00
0,00
0,00
0,00
0,00
0,00
Total income after simulation
Subsidies and Donations
0,00
0,00
0,00
0,00
0,00
0,00
0,00
Critical Point before simulation
0,00
0,00
0,00
0,00
0,00
0,00
22.229.157,23
31.814.011,51
31.843.639,68
31.833.643,05
31.910.884,87
31.990.110,22
Loss Coverage
0,00
8.735.376,58
Critical Point after simulation
Cobertura de Prejuízos
0,00
0,00
0,00
0,00
0,00
0,00
0,00
8.735.376,58
22.229.157,23
31.814.011,51
31.843.639,68
31.833.643,05
31.910.884,87
31.990.110,22
Other
0,00
0,00
0,00
0,00
0,00
0,00
0,00
Loans
0,00
0,00
0,00
0,00
0,00
0,00
0,00
Depreciation Cont. Lease Fin. & equiv.
0,00
0,00
0,00
0,00
0,00
0,00
0,00
10.000,00
10.000,00
10.000,00
10.000,00
10.000,00
10.000,00
10.000,00
Loans
Capital Increase, Income Supplementals
Portimão Film Studio
Interest & Similar Costs
Dividends
0,00
0,00
2.339.689,43
17.629.010,69
-743.912,31
83.131,69
-59.979,36
Capital Reductions & Supplemental Payments
0,00
0,00
0,00
0,00
0,00
0,00
0,00
Acquisition Stock (shares)
0,00
0,00
0,00
0,00
0,00
0,00
0,00
Reimbursable Subsidies
0,00
0,00
0,00
0,00
0,00
0,00
0,00
Other Debt MLP
0,00
0,00
0,00
0,00
0,00
0,00
0,00
8.490.000,00
16.490.000,00
-2.349.689,43
-17.639.010,69
733.912,31
-93.131,69
49.979,36
733.406,18
5.443.467,93
-1.050.626,70
2.068.643,87
23.962.504,03
15.316.527,25
19.273.346,36
0,00
733.406,18
6.176.874,12
5.126.247,42
7.194.891,29
31.157.395,33
46.473.922,58
733.406,18
6.176.874,12
5.126.247,42
7.194.891,29
31.157.395,33
46.473.922,58
65.747.268,93
Flow Financing Activities
Cash and cash equivalents variation
Exchange Rate Effect
Cash and cash equivalents at beginning of period
Cash and cash equivalents at end of period
Portimão Film Studio
Payments from:
PG.
PG.
Business Plan
0111
Business Plan
0110
3.3.4.8.13. Closing Remarks
The term of recovery, like the IRR and NPV, is favorable
compared to the forecast. In this scenario, the investment
will be recovered in 5 years, with basis on a profitability of
49.1%, and creating a surplus of around 39 million Euros.
Updated Rates
Key Project Indicators
8,00%
4,00%
16,00%
28,71%
TIR
49,09%
---
---
Profitability of Invested Capital
2263,98%
VAL
39.214.341
49.025.174
24.856.035
CAF/Investment
1760,44%
PR
5 years
4 years
5 anos
Financial Profitability
Financial Autonomy
Asset Coverage
Capital structure
88,70%
23121,20%
784,70%
Debt M-L/CAF
0,00%
Debt M-L/Equity
0,00%
Financial Expenses/Operation Incomes
0,02%
Financial Debts /Equity
0,00%
Investment
0%
0%3%
1%
Investments Summary (in Euros)
Facilities
Basic Equipments
Load Material and Transport
Intangible fixed assets
Other Investment
96%
0
70.000
40.000
2.489.000
0
Facilities
Basic Equipments
Load Material and Transport
Intangible fixed assets
Portimão Film Studio
Portimão Film Studio
Other Investment
Action plan for the
attraction of investment
and potential clients
Contingency plan
and risk evaluation
0113
PG.
Business Plan
5.
Business Plan
PG.
4.
The strategy that is proposed to capture local investors
who would, along with the municipality, control more than
50% of the project in an initial phase. These shareholders
will buy shares in blocks of 700,000 € which will give them
2% of the joint-stock, the city of Portimão will buy-in
partially with a property free of liens and charges, which
will be appraised and complemented with a liquid buyin altogether totaling approximately 20%. 20% must be
reserved and made available to local, small shareholders,
20% to the municipality and 60% to large shareholders
with vested interests in Portimão. Shareholders with
holdings exceeding 10% earn a seat on the Strategic
Council.
Portimão Film Studio
In addition to this strategy, the major national and
international companies will be approached. We give as
example: Google, Ydreams, Portugal Telecom, Microsoft,
CNN, etc ...
Lastly, but of critical importance, both the contact with
the Majors and the delivery of the proposal to become a
shareholder in up to 20% is essential to the project and
could maximize the investment of the Portuguese state
in the project, reducing the equity of private investors or
improving IRR and payback.
This process should occur in the first quarter of 2010 and
have as the deadline for the expression of interest the
signing of the deed of constitution in April, raising 50% of
the capital by this date and the remaining 50% within 6
months.
The designation of the various boards of directors
should take place in April, the process of selection and
recruitment will begin in April as well as the search for
facilities, with the beginning of activity and the opening of
offices in Los Angeles in May 2010. Studio launch should
take place at Cannes in May 2010 to earn productions for
2011.
The sensitivity analysis forecasts an overall decrease of
20% in sales and a € 0 reduction in fixed and variable
costs. The model does not forecast a real blockbuster in
terms of revenue. The model does not forecast that film
after film be a disaster at the box office or in sales. But if
it happens, it bears mentioning that life of content is 75
years in the United States, during which it is protected
by copyright. We will increase the period for repayment
of the investment. We give as example an investment in
a hotel, which will generate income for the long term,
and after whatever period continues to be a saleable
asset, and it had various operational costs. A film has an
initial investment like the hotel can make profit in the first
months or have a longer period of operation (without
operating costs or maintenance) and can still be sold.
At the end of 2011, with films and documentaries already
produced, the business model can be adjusted allowing
the entry of a partner in co-production for each content,
thereby reducing the investment, while maintaining the
assumptions of the model and the operations of the other
companies. That is, for every production where we would,
in accordance with the business model, provide 100% of
the investment, we could take on a partner who would
acquire 40% of the company and invest in the production
(one of the majors), which may help to accelerate the
business model or minimize the risk or manage the
availabilities account of the business if this is a problem.
In addition to these points, the sales values are based on
average earnings for the 2000 worst films ever, divided
into 15 types, in only United States box office, considering
revenue for only three years, and not foreseeing revenue
from other films beside those detailed, allowing for 40% of
free time in the studios.
For all these reasons we think the scenario is conservative,
even taking into account the global downturn.
Portimão Film Studio
0112
0115
Conclusions and
recommendations
PG.
Business Plan
PG.
6.
Business Plan
0114
After an analysis of the international film market, the
participation of national and international experts, the
examination of more than 20 movie studios worldwide,
we concluded it reasonable and feasible to develop a film
studio in Portimão and promote the creation of a cluster of
cinema in Portugal with its center in Portimão.
Strategic vectors and a business model were defined and
validated in collaboration with a team of national and
international consultants.
On this basis , we developed a preliminary and functional
architectural study of the whole film studio in Portimão,
based on pre-defined assumptions and validated in
collaboration with a team of national and international
consultants.
From these result the following steps:
1-Creation of a holding company with joint-stock of €
35,000,000 and land upon which to build film studios in
Portimão.
2-Construction of a movie studio with a total cost of €
25,000,000 with interest in a partnership with Project
finance and partners to be selected.
3-Creation of a fund to invest in the production of 35 films
in 7 years and 70 documentaries.
4-Creation of a management company Media Park which is
assured 40% occupancy rate of available space for lease, by
the films in which the Fund invests.
5-Creation of a production company that will have as its
only clients the films in which the fund invests and 3 major
productions from the US Major Studios.
Although might seem reasonable to assert that the
business plan submitted is too good, it is in fact extremely
cautious, having within it assumptions aligned to negative
scenarios—the first being the cycle of revenue from
content being limited to 3 years when it is in fact protected
by copyright for 53 years (example: each time we watch
“Home Alone” on TV around Christmas, the channel paid
for the right to air the film that day).
Finally, the “time to market” of the project is essential. The
Majors aware of the need to explore alternatives to their
current business model, going “further” to finance and
develop their business. Security concerns have ruled out
territories interested in this same positioning but who do
not offer the same guarantees of stability as Portugal in
Europe.
6-Rents to be collected were estimated at 50% of current
prices in Pinewood (London) and in Los Angeles.
7-Film budgets and revenues are based on an analysis of
the 2000 worst movies ever in 15 different types of films
and on average.
8-Full payment of the investment in the film studio in 2014;
should shareholders choose, they may liquidate the full
debt in 2016 or maintain the semiannual payment for 20
years.
10-In a sensitivity analysis with a 20% reduction in sales
while maintaining all the fixed and variable costs, the
period for the recovery of the investment increases to 2015
and the disbursement of dividends begins only in 2014.
Portimão Film Studio
Portimão Film Studio
9-Disbursement of dividends to shareholders in the value
of € 17,500,000 per year beginning in 2013.
Estudo Prévio de Arquitectura
Picture Portugal
PG.
PG.
7.
Preliminary
Architectural Study
Preliminary Architectural Study
0117
Business Plan
0116
DESCRITIVE MEMORY
BUDGET ESTIMATION AND SHEDULE
ACCESSIBILITIES
DRAWN PIECES
A1. Implementation Scheme
A2. Administrative service and post production scheme
A3. Scope of Administrative service and post production
A5. Studio 1
A6. Studios and support
A7. Scope of studios
A8. Perspectives
Portimão Film Studio
Portimão Film Studio
A4. Workshops and storage
0118
DESCRIPTIVE
MEMORY
Preliminary Architectural Study
LOCATION
PROGRAM
CONCEPT – General Space Organization
This descriptive memory refers to a previous study of a
construction project for a movie studio in Portimão.
Project Picture Portugal consists of the creation of an
infrastructure for the production and post-production of
films, television and large- scale national and international
commercials.
The arrangement of the different areas that make up the
Studio within the land plot comes from the program´s
functional demands and the location morphology.
The plot of land is urban in nature, in an irregular
rectangular shape, and is part of the urban landscape of
the village.
It faces north-south, on its longitudinal axis, with a 410
meter façade facing the street and about 125 meters deep,
totaling an area of about 50.690 square meters.
PROPOSAL ADEQUACY
The presented solution is in compliance with the current
urban management tools for the location in question. It
is equally appropriate for the intended use and existing
infrastructures and networks. Therefore, it is in accordance
with the Municipal Zoning Regulation of Portimão,
General Regulation on the Urban Buildings, the Fire Safety
Regulation (Law Decree 220/2008 of November 12 and
bylaw 1532/2008 of December 29) and the Accessibility
Regulations (Law Decree 163/200 of August 8), as it
concerns to all aspects of both public and private spaces.
Portimão Film Studio
PG.
The function program was based on the analysis made
by the project team and the national and international
consulting team´s know-how.
The complex is made up of a 5 studio production area,
outdoor filming area, indoor and outdoor aquatic filming
area, workshops and storage areas, post-production area,
projection room for films and film previews, enterprise
incubator, and a large range of support services.
Some conclusions were drawn after gathering information,
which helped us define the functional flow chart:
• The convenience of proximity among various studios;
• Concentration of various workshop services;
• Concentration of post-production services, management,
companies and restaurants.
These parameters associated with the extensive shape
of the land plot, led us to the layout here presented.
We chose to create a row of studios connected by the
production support structures, attached at the far east
area of the land plot. The workshops and warehouses are
placed in between these structures to promote the most
direct channel of distribution. The entrance was placed
close to the access roundabout, and the Think Tank, with
all its services and communication channels makes the
connection between the complex and the city. Lastly, the
back lot for outdoor filming, as the name indicates, will
be located on the back side of the plot, the extreme north
side, also being the most protected.
Portimão Film Studio
Preliminary Architectural Study
PG.
0119
0120
MEMÓRIA
DESCRITIVA
PG.
Preliminary Architectural Study
Preliminary Architectural Study
PG.
0121
BUILDINGS
Post-Production and administrative area
This department includes the specific areas for postproduction, which are sound editing, ARF/Foley recording,
narration, translation and captioning, music recording,
special effects, digital services, image laboratory and
projection room.
The production area is made up of sound-proofed and
acclimatized filming studios with a total area of 11 600
square meters. Each studio has its own production support
area, and each has a rough area of 2931 square meters.
The studio floor will be made of wood, over a base floor of
mechanically leveled concrete. The whole area will allow
for automatic drainage through drain holes built in for that
purpose.
Warehouses and workshops will have a covered area of
3000 square meters, for assembling scenery, with specific
areas for carpentry, metalwork, special effects, electricity
and lighting, finishes and painting.
The studios are generally characterized by ample pavilions,
were sceneries are assembled for the audiovisual contents.
For this reason, metal, tubular, web like structure is to be
built to support lighting and sceneries. There will also be
a metal, suspended and parametric, midway walkway for
maintenance and structure and scenery set up.
Every studio will have an indoor tank over the pavement
for diverse purposes. These tanks should be free standing
and equipped with a drainage system that allows the use
of water. The tank dimensions and depths will vary and are
seen in the blueprints.
This center consists of a group of pavilions banded
together to form a large black block. The workshop areas
per se, where the sceneries will be built, will be an open
space, where carpentry, metalwork and special effects
areas will be interconnected. The specific warehouses
for electricity and lighting, props, and wardrobe will be
separately closed in.
In order to extend the use of the soundstages, there will
be communication doors (elephant doors) between the
adjacent sceneries to allow the scenery to double in size.
These doors will be totally soundproofed and will be as
high as the studio. In studio 5, there will be a cyclorama in
three walls for commercials (advertisements) production,
music videos and photography. There will be two types of
access: one for cargo/materials and another for persons.
The cargo access will be through large running doors,
which will also be soundproof. The walking access will be
through done directly from the outside, through and antechamber or through the production support area.
The studio and support buildings will be built with a
prefabricated and concrete system. This system will be
built with prefabricated girders, pillars, stop corners, and
beams. The front walls will be covered with lining façade
panels in pigmented or painted concrete.
Portimão Film Studio
Production Support Area
The roof will consist of metal roof-trusses, covered by a
sandwich panel, with, no less than a 12 centimeter thick
layer, of rock wool in the middle. The sound proofing
assures NC25 (noise criteria) as used in recording studios,
with 2 decibels of tolerance, and it will be done by
positioning rock wool hard panels on the inside of the
front walls, with the required thickness. The finish of the
inside walls will be made of technical fabric for vertical
parameters.
The technical installations will contemplate data networks,
wiring, acclimatization, safety and exhaustion, as defined
according to the each expert project.
The production support buildings will be connected
directly to the soundstages, and will have different
compartments for each production, such as dressing
rooms, offices, boardrooms, wardrobe, bathrooms, props,
make and hair, and also dimmer rooms for sound editing.
The construction system will be the same as the studios –
prefabricated in concrete. Inside, the dividing walls and
false ceilings will be made of sheet rock (plaster) with
sound proofing made of hard panels of rock wool, and in
layers on the roof. The intermediate flagstone will also be
prefabricated and alveolar for a faster execution. Te Sound
proof of the buildings should be NC <30 (noise criteria),
with 2 decibel tolerance.
The outdoor filming area Back lot) will have a total area
of 12 638 square meters, for scenery set up , and will also
have a 75X50 meter, 1.2 meter deep tank, with a 40X20
meter, 4 meter deep central well. The central well can be
raise to the level of the tank.
As scenery, studio 1 will have an 80 meter wide by 17
meter high blue screen.
Roughly in the middle of this block, there will be locker
rooms and bathrooms for staff, with direct access from the
outside or through the workshops. Over these facilities,
on the first floor, with access through the workshops,
there will be 6 technical offices for design and scenery
construction support.
The construction will be made with a prefabricated
and concrete system. This system will be built with
prefabricated girders, pillars, stop corners, and beams.
The exterior walls will be covered with lining façade
panels in pigmented or painted concrete, to be defined
at a later date. The roof will be made up of metal rooftrusses, covered by a sandwich panel, with, no less than a
12 centimeter thick layer, of rock wool in the middle. The
interior of the front walls will be covered by rock wool hard
panels to reduce noise emissions to the outside.
This entire floor space will be made of mechanically
leveled concrete, with a self leveling effect. The whole
area should be drained through a system of storm drains
for that purpose. The interior walls will be made of
brickwork, as long as the technical offices and including
the embrasures are assured soundproofing of NC50 (noise
criteria), with 2 decibel tolerance.
In the administrative area, there will be shops and related
companies, film shop, restaurant/bar, management and
other offices. There will also be a projection room for
previews only.
The defined concept for the area creates two large service
areas. One opens to the general public and the other
possesses a more private character and closed to the
public.
This way, the building is separated into two areas, which
united form a great “Think Tank”, made up of a productive
area and a social and executive area. In the productive
area, one can find all post-production technical services
and companies related to this business area, while the
social and executive area will have the restaurants, offices
and management.
The plan, for the building, divides itself into two main
areas:
Portimão Film Studio
Production Area
0122
0123
BUDGET
ESTIMATION
AND
SCHEDULE
On the North side, in the shape of an “I”, there will be
a transparent body, where a zone for restaurants and
shops was created on the ground floor. On the first and
second floor, various offices were designed, to serve postProduction and VIP offices for post-production and/or
production. The last floor of the transparent body will be
taken by management.
- On the South side, in the shape of a “U”, there will be an
enclosed post-production laboratory on the ground and
first floor. The second and third floor will be occupied by
companies related to the business.
- On the inside patio, there will be a bar and esplanade, as
support to the installation.
Construction wise, two curtain lining systems will be used,
one in glass and the other in corten steel. The corten
steel lining will be supported by a concrete structure and
massive flagstone with brick walls and a thermal isolation
on the outside with a ventilated façade finish.
The glass lining will have the same structure and concrete
flagstones, which, at a later date, will be framed by a
curtain system.
The sun protection will be assured in two distinct ways.
The corten building will have projecting gates of the same
material, while the south façade of the glass structure
will have a mesh awning to cover the connecting space
between the two structures.
Film studios
Workshops and warehouse
Studios
PG.
Preliminary Architectural Study
Preliminary Architectural Study
PG.
area
Cost/m2
Amount
3470
300
1.041.000 €
11600
750
8.700.000 €
Studio support areas
2931
500
1.465.500 €
Administration
8250
1200
9.900.000 €
Water studio
3750
250
937.500 €
17847
35
Outdoor decorations
624.645 €
22.668.645 €
Total project wages cat III
0.065
22668645
The forecast for the project execution and construction of
the Movie studios in Portimão is 20 months.
This forecast was based on a previous study in course,
meaning that it was only considered the execution of the
Project basis, Project execution and construction.
1.473.462 €
40% Discount on base price
884.077 €
Amount for the different phases of
the project execution and technical
assistance
574.650 €
furniture and equipment
710.000 €
other equipment
700.000 €
Total cost
Schedule
a. Entity licensing and project approval
eight months
b. Open competition and building award two months
c. Building Completion
ten months
24.653.295 €
ACCESSIBILITIES
Budget Estimation
The presented values were calculated based on current
available information and takes into account all vague
stance about the phase of the execution of the work. There
should be taken into account a safety margin of 20%, in
relation to the estimated amount, which will make the
total cost vary between 19 722 636€ and 29 583 954€
This Project is in accordance with Law Decree 163/2006,
dated August 8, seeking to safeguard the use by persons
with limited mobility, and the general comfort of all users.
In all the rest, all the current regulations will be respected,
such as the Municipal Zoning Plano of Portimão, Law
Decree 163/2006 about accessibilities, the RGEU and
building fire safety regulations – Law Decree 220/2008 and
by-law 1532/2008.
The solidity imposed onto the building seeks to
symbolize productive capacity and fulfillment, while the
immaterialism alludes to creativity and genius.
Portimão Film Studio
Portimão Film Studio
This building, square in design and with a rigid geometry,
seeks to be a landmark in the landscape, an element that
encompasses itself with mass and lightness, closure and
transparency.
0124
Implementation Scheme
0125
Preliminary Architectural Study
PG.
Preliminary Architectural Study
PG.
1- Entrada
2- Estacionamento
3- Edifício administração,
pós-produção e serviços
4-Estúdio 1
5-Estúdio 2
6-Estúdio 3
7-Estúdio 4
8-Estúdio 5
9-Apoio estúdios
10-Oficinas
11-Tanque exterior
Portimão Film Studio
Portimão Film Studio
12-Terreno livre
0126
0127
Preliminary Architectural Study
Portimão Film Studio
PG.
Preliminary Architectural Study
A3. Scope of Administrative service and post production
Portimão Film Studio
PG.
A2. Administrative service and post production scheme
0128
0129
Preliminary Architectural Study
Portimão Film Studio
PG.
Preliminary Architectural Study
A2. Administrative service and post production scheme
Portimão Film Studio
PG.
A2. Administrative service and post production scheme
Preliminary Architectural Study
Preliminary Architectural Study
Portimão Film Studio
Portimão Film Studio
0130
PG.
A1. Implementation Scheme
A6. Studios and support
0131
PG.
Preliminary Architectural Study
Preliminary Architectural Study
Portimão Film Studio
Portimão Film Studio
0132
PG.
A5. Studio 1
A6. EStudios and support
0133
PG.
Preliminary Architectural Study
Preliminary Architectural Study
Portimão Film Studio
Portimão Film Studio
0134
PG.
A4.
Workshops and storage
A4.
Workshops and storage
0135
PG.
Preliminary Architectural Study
Preliminary Architectural Study
Portimão Film Studio
Portimão Film Studio
0136
PG.
A8. Perspectives
A8. Perspectives
0137
PG.
Preliminary Architectural Study
Preliminary Architectural Study
Portimão Film Studio
Portimão Film Studio
0138
0139
PG.
PG.
Portimão Turis
Parque de Feiras e Exposições
Caldeira do Moinho
8500-726 Portimão - Portugal
phone: 00.351.282410440
fax: 00.351.282410445
Mail: [email protected]
WEB: www.pictureportugal.com


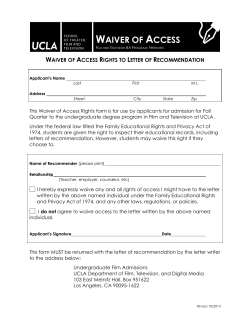

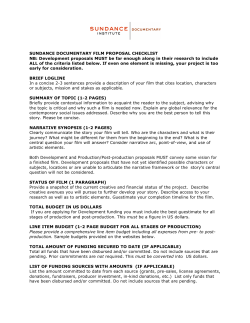


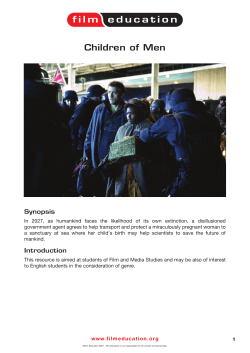


© Copyright 2026