
Document 168964
New Castle Airport
Business Plan Study
Draft Technical Report
Prepared for:
Delaware River & Bay Authority
Delaware Department of Transportation,
Office of Aeronautics
Prepared by:
R.A. Wiedemann &
Associates, Inc.
P.O. Box 621 ! Georgetown, KY 40324
(502) 535-6570 ! FAX (502) 535-5314
in association with:
Delta Airport
Consultants, Inc.
Virginia, North Carolina, Pennsylvania,
Texas, Arkansas
New Castle Airport
Draft Business Plan
December, 2005
TECHNICAL REPORT
New Castle Airport Business Plan
1.
INTRODUCTION
HE PURPOSE OF THIS BUSINESS PLAN for New Castle Airport is to recommend potential means
for the Delaware River & Bay Authority (DRBA) to improve the Airport’s financial
performance, economic development, and operation. The plan examines potential
development and optimal operations that may provide increased benefits to Wilmington, New Castle
County, and aviation users. Our understanding of the current situation involves a number of
components, including the potential attraction of a scheduled air carrier, the Airport’s competitive
setting, the desire to keep and attract corporate aviation, the potential increased use of the facility
by smaller general aviation users, and a number of other issues discussed below.
T
1.1
Vision & Key Issues
New Castle Airport features three runways: Runway 9-27 is 7,181 feet by 150 feet; Runway
1-19 is 7,012 feet by 200 feet; and runway 14-32 is 4,603 feet by 150 feet. The Airport has a
massive infrastructure that supports several Fixed Base Operator (FBOs), numerous business jet
users, and the 166th Airlift Wing, Delaware Air National Guard unit. The business plan presents an
overall strategic direction and plan for the Airport, given its existing setting and market niche. A
number of preliminary issues have been identified that are addressed including:
!
Examination of Potential Airline Service: Conventional airline service at New
Castle Airport has been difficult to sustain in the past, due to the nearby location of
Philadelphia International. However, the large population base and catchment area
for the Airport may be enough to meet the needs of a point-to-point, low-fare carrier.
This business plan will examine preliminary feasibility of airline service at New
Castle Airport. Given the limited resources available to this effort and the desire to
adequately address the feasibility of the airline service component, a large portion
of the overall business plan will be given to this analysis.
!
Attraction of Additional Corporate Aviation: New Castle Airport has been the focus
of corporate aviation for several decades and will continue to be so in the future.
Previous management teams have focused on this market niche to the exclusion of
some others. The business plan will examine current marketing practices and overall
future potential. While corporate aviation is the primary market for New Castle
Airport, there is a desire to examine a more balanced approach to the total regional
market.
!
Small General Aviation (GA) Users: For many years, this market has been ignored
by New Castle Airport in favor of larger, corporate aviation. The business plan will
R.A. Wiedemann & Associates, Inc., in association with
Delta Airport Consultants, Inc.
1
New Castle Airport
Draft Business Plan
December, 2005
examine the market feasibility of including small GA users in the overall business
mix.
!
Expanded FBO Services: There are three primary FBOs at New Castle Airport.
While these companies do a good job servicing their clientele, there is a perception
that some services that would attract more aviation activity at the Airport are
missing. The business plan will examine these services and compare them to
regional competitors.
!
Air Cargo Service: Some have suggested that New Castle Airport could increase
activity by actively courting air cargo companies. The business plan will examine
this issue with the desire of preliminarily either confirming or denying the feasibility
of such service.
!
Air National Guard: New Castle Airport is home to the Delaware Air National
Guard, 166th Airlift Wing. The six C-130s located at this facility were targeted by
the recent Base Realignment and Closure (BRAC) committee for reductions. The
final BRAC recommendation dropped changes to the current mission, and thus no
future changes to the military facility are foreseen.
!
Financial Performance: One overall goal of the business plan is to improve
financial performance. While not always possible, the development of strategic
marketing and management plans for the facility can lead to improvements in
operating practices and market effectiveness. The results can be an improved bottom
line.
!
Economic Development: New Castle Airport plays a key role in supplementing
economic development in Delaware. The business plan will examine the role of the
Airport in supplementing and interacting with business and industry within its
market area. In addition, products from the plan can be used to help marketing and
recruiting efforts of local and statewide economic development agencies.
!
Community Relations: The economic benefits associated with the Airport must be
effectively communicated with the local residents. In particular, the value of the
Airport in serving the entire region may not be appreciated by the general public and
their associated political representatives. Communication of these benefits helps to
justify future Airport plans and the allocation of resources to the Airport. In
addition, various outreach programs can be used to generate goodwill among
residents of the area.
Airport benefits are usually stated in terms of jobs, income, and output. In addition to the quantified
economic benefits, a discussion of the intangible benefits associated with the Airport must be
included.
R.A. Wiedemann & Associates, Inc., in association with
Delta Airport Consultants, Inc.
2
New Castle Airport
Draft Business Plan
1.2
December, 2005
Desired End Products
The end products that are produced as a result of this analysis will include the following:
!
!
!
!
!
!
1.3
An updated, and well-defined mission statement for the Airport.
An identification and evaluation of needs, opportunities, and challenges facing the
Airport, with an emphasis on development of potential airline service.
A five year projection of revenues and expenses at the Airport for the baseline case
and alternative scenarios.
Strategic planning recommendations for the Airport.
Graphic materials including color photos, and/or brochures, depending upon the
individual Airport needs.
An economic impact evaluation of the Airport, identifying jobs, income, and total
output associated with the facility.
Report Outline
In order to address the issues described above and to produce the desired end products, this
report will include the following sections:
!
!
!
!
!
!
!
!
!
!
Section 1 - Introduction
Section 2 - Background and Management Structure
Section 3 - Existing Airport Characteristics
Section 4 - Baseline Financial Outlook
Section 5 - Business Plan Alternatives
Section 6 - Airline Passenger Service Scenario
Section 7 - Recommended Plan
Section 8 - Summary of Business Plan Recommendations
Section 9 - Economic Impact Assessment
Appendix A - Top 50 O&D
R.A. Wiedemann & Associates, Inc., in association with
Delta Airport Consultants, Inc.
3
New Castle Airport
Draft Business Plan
2.
December, 2005
BACKGROUND AND MANAGEMENT STRUCTURE
of the Airport helps to
identify the history and context of the Airport’s existing situation. A clearly defined,
current, and realistic mission for the Airport provides the oversight framework to achieve
opportunities as they arise. This analysis is geared toward the future and toward positioning the
Airport to take best advantage of its assets and strengths. As such, this section is organized to
include the following:
NDERSTANDING THE BACKGROUND AND MANAGEMENT STRUCTURE
U
!
!
!
2.1
Historical Mission of the Airport
Historical Performance Meeting the Mission
Airport Management Structure
Historical Mission of the Airport
New Castle Airport’s role is that of a general aviation service facility, providing general
aviation services for regional air transportation. The Airport is certified as an FAR Part 139 facility,
capable of accommodating scheduled airline service. New Castle Airport’s overall mission has been
specifically geared to large general aviation business jet aircraft. In the past, the Airport has served
scheduled air carriers, and that role will be re-examined as a part of this Business Plan. Although
there is no overall written mission statement for New Castle Airport, the following statement can
be used for the Airport:
!
The New Castle Airport strives to provide safe, excellent airport facilities and
services to its based aircraft owners and the flying public, while operating
compatibly with its neighbors and providing a base for economic development.
Program goals supporting this mission would include:
Program Goals
!
Continue to operate the Airport safely, efficiently, and conveniently.
!
Explore the feasibility of restarting scheduled airline service to the Airport.
!
Strive to reduce expenditures and increase revenues at the Airport, without
sacrificing needed services.
!
Encourage private sector investment in the utilization of the Airport’s facilities.
!
Pursue funding for and implementation of capital improvement projects to improve
safety and usability of the Airport.
!
Supplement economic development goals of the region as opportunities arise at the
Airport.
!
Encourage compatible public use of Airport facilities or property, where possible and
appropriate.
!
Respond to noise and other complaints quickly and courteously.
R.A. Wiedemann & Associates, Inc., in association with
Delta Airport Consultants, Inc.
4
New Castle Airport
Draft Business Plan
2.2
December, 2005
Historical Performance Meeting the Mission
Discussions with Airport management indicate that the New Castle Airport (ILG) has met
and is meeting most of the mission statements and performance goals described above. This would
include the following goals:
!
!
!
!
!
!
!
Continue to operate the Airport safely, efficiently, and conveniently.
Encourage private sector investment in the utilization of the Airport’s facilities.
Strive to reduce expenditures and increase revenues at the Airport, without
sacrificing needed services.
Pursue funding for and implementation of capital improvement projects to improve
safety and usability of the Airport.
Encourage compatible public use of Airport facilities or property, where possible and
appropriate.
Supplement economic development goals of the region as opportunities arise at the
Airport.
Respond to noise and other complaints quickly and courteously.
The new Airport Director has undertaken efforts to examine the feasibility of achieving the
remaining program goal: restarting airline service at ILG. This business plan will help examine the
feasibility of such service. The re-start of airline service would increase Airport revenues from
PFCs, parking, fuel sales, and concessions.
2.3
Airport Management Structure
The DRBA operates New Castle Airport under a long-term agreement with New Castle
County. Control of the Airport shifted from the County to DRBA in July of 1995. Since that time,
DRBA has invested in capital improvements and other upgrades to make the Airport into a
significant competitor for corporate aviation in the region. DRBA owns and operates the Delaware
Memorial Bridge and Cape May - Lewes Ferry. ILG is one of 5 airport facilities operated by DRBA
under their Airports Division. The organizational chart for the Airports Division is presented in
Figure 1.
R.A. Wiedemann & Associates, Inc., in association with
Delta Airport Consultants, Inc.
5
New Castle Airport
Draft Business Plan
December, 2005
Figure 1 - Organizational Chart - DRBA Airports Division
R.A. Wiedemann & Associates, Inc., in association with
Delta Airport Consultants, Inc.
6
New Castle Airport
Draft Business Plan
3.
December, 2005
AIRPORT CHARACTERISTICS
HE NEW CASTLE AIRPORT WAS BUILT AS a military training facility prior to World War II.
It
continued in this capacity throughout the war years with gradual joint/civilian use beginning
in the early 1950s. Eventually the Airport was declared surplus to the needs of the
Department of Defense and control was relinquished to New Castle County. With this change, the
Airport was renamed the Greater Wilmington Airport and re-classified as a civil facility even though
two military units continue to be based at the airport. The Airport’s location is depicted in Figure
2.
T
Under County control, the Airport was expanded with construction of a terminal building
and auto parking, airfield improvements, hangar developments, and numerous other general aviation
support facilities. Commercial airline service was available for many years, while the general
aviation facilities grew to include one of the largest fixed base operators on the east coast. The
Airport remains today as the only public airport in Delaware with an air traffic control tower and
instrument landing system (ILS). In 1986, the Airport was renamed the Greater Wilmington/New
Castle County Airport to better reflect the true service area of the facility.
In July of 1995, the Delaware River and Bay Authority (DRBA), owner and operator of the
Delaware Memorial Bridge and the Cape May-Lewes Ferry, assumed management of the airport and
set out to make the Airport a world-class facility. The DRBA upgraded the Airport with state-ofthe-art technology, a new air traffic control tower, additional corporate business hangars, and
customized services. The name of the Airport was changed in late 2004 to New Castle Airport.
3.1
Existing Facilities
Airport Runway System
The airfield facilities at New Castle consist of three active runways, twelve taxiways and
several aircraft parking ramps (see Figure 2). The airport has three intersecting runways. Runway
1-19 is one of the airport’s primary runways and is 7,012 feet in length and is 150 feet in width.
Runway 9-27 is also a primary runway and is 7,181 feet in length and 150 feet in width. Runway
14-32 is most often used by general aviation aircraft and is 4,603 feet in length and 150 feet in
width. Table 1 summarizes pertinent runway information.
R.A. Wiedemann & Associates, Inc., in association with
Delta Airport Consultants, Inc.
7
New Castle Airport
Draft Business Plan
December, 2005
Table 1 - ILG Runway Data
Item
Runway
1-19
9-27
14-32
Transport
Transport
General Utility
D-III
D-III
B-II
7,012’ x 150’
7,181’ x 150’
4,603’ x 150’
0.20%
0.11%
0.00%
Asphalt/Grooved
Asphalt/Grooved
Asphalt
Single=90,000lbs
Dual=140,000 lbs
Dual Tandem=250,000 lbs
Single=90,000lbs
Dual=140,000 lbs
Dual Tandem=250,000 lbs
Single=90,000lbs
Dual=140,000 lbs
Dual Tandem=250,000 lbs
Pavement Condition
Good
Fair
Good
Runway Lighting
HIRL
HIRL
MIRL
Runway Marking
Precision
Precision
Visual
Visual Aids
VASI (19)
REIL (19)
SALSR (1)*
PAPI/VASI
VASI (32)
Instrument
Approaches
CAT I ILS (1)
VOR/GPS (1)
VOR/GPS (19)
NDB (1)
CAT I MLS (9)
VOR/GPS (9)
VOR/GPS (27)
NONE
650’ x 500’ (1)**
80’ x 500’ (19)**
1,000’ x 500’ (9)
850’ x 500’ (27)
300’ x 150’
1,000’ x 2,500’ x 1,750’ (1)
500’ x 1,700’ x 1,010’ (19)
1,000’ x 2,500’ x 1,750’ (9)
500’ x 1,700’ x 1,010’ (27)
500’ x 1,000’ x 700’
Runway Category
Design Aircraft
Runway Dimensions
Effective Gradient
Pavement Type
Pavement Strength
Runway Safety Area
Runway Protection
Zone
Source: New Castle Airport Master Plan Update, 2005.
*A MALSR is currently under design by FAA and proposed for construction in Fall 2005.
**Runway 1-19 RSA Safety Area Analysis completed. FAA approved RSA at 650’x500’ for Runway 1. Runway 19 RSA Improvements are currently
under design to provide 1,000’ x 500’ and is proposed to be constructed Fall 2005.
Cat I ILS - An Instrument Landing System (ILS) approach that will allow landings with a cloud ceiling down to 200 feet and one-half mile
visibility
Cat I MLS -A Microwave Landing System (MLS) approach that allow landings with a cloud ceiling down to 330 feet and three-quarters mile
visibility
GPS - Global Positioning System
HIRL - High intensity runway lights
MIRL - Medium intensity runway lights
PAPI – Precision Approach Path Indicator
NDB - Non-Directional Beacon
REIL - Runway end identifier lights
SALSR - Simplified Short Approach Lighting System with Runway Alignment Indicator Lights
VOR - Very High Frequency Omnidirectional Range Stations
VASI - Visual approach slope indicators
R.A. Wiedemann & Associates, Inc., in association with
Delta Airport Consultants, Inc.
10
New Castle Airport
Draft Business Plan
December, 2005
Terminal Building
The existing terminal building was constructed and completed in 1955, and is approximately
27,200 square feet. The main level consists of airline and rental car counters, the baggage claim area,
restrooms, a waiting area, and DRBA administration and operations space. The upper and basement
level includes office space and building utilities. The terminal area is located on DuPont Highway
(U.S. 13), three miles south of the Interstate 95 and 295 interchange. The airport has a signed,
dedicated entrance road from DuPont Highway which leads to an internal circulation road with 150
feet of terminal curb frontage and a parking lot for 253 vehicles. Presently a number of spaces are
leased for rental car parking. In addition, spaces are designated for DRBA employee parking.
General Aviation Facilities
General aviation and corporate aviation facilities are located in the Terminal Area, the
southeast quadrant of the airport, the northwest quadrant, and southwest quadrant of the airport. The
Airport has three full service FBOs: AeroTaxi, AvCenter-Wilmington, and Dassault Falcon Jet.
Combined, these providers offer 72 T-Hangars and 30 aircraft tie down spaces and allow the DRBA
to offer one of the largest and most complete general aviation service airports on the east coast. A
description of the tenants and facilities are described below.
!
!
!
!
!
!
!
!
!
Flight Safety Facilities: Flight Safety provides flight training to pilots from around
the world and is located on the east side of the airport adjacent to the Terminal
Building. Flight Safety operates out of a 40,000 square foot building.
Corporate Aircraft Hangars: There are four corporate aircraft hangars located south
of Terminal Building that are used by private tenants, most of which are small
corporate flight departments. Each hangar is approximately 22,000 square feet
(15,000 s.f. for aircraft and 7,000 s.f. for office space).
Dassault Falcon Jet: Dassault Falcon Jet is an FBO operating five large hangars
and an office complex. Dassault provides major maintenance repairs for Falcon Jet
aircraft and serves as a service facility for transient aircraft operators.
Dupont: Dupont’s corporate flight department operates out of a hangar located north
of Dassault’s facility.
Corporate Midfield Complex: Adjacent to and across Taxiway A from Dassault’s
facility is the Midfield Complex. This complex has six aircraft hangars, with
additional space to accommodate six more hangars. Each hangar is approximately
22,000 square feet (15,000 s.f. for aircraft and 7,000 s.f. for office space).
Boeing Aircraft Company: The Boeing Aircraft Company has a complex of
buildings that is comprised of an office building and two 30,000 square foot hangars.
Campbell’s Soup Flight Department: The Campbell’s Soup corporate flight
department operates from a 15,000 square foot hangar.
Red Eagle Aviation: Red Eagle Aviation operates out of a 15,000 square foot
hangar facility.
Elcorta: Elcorta operates from a 20,000 square foot building, providing aircraft
maintenance services to the corporate industry.
R.A. Wiedemann & Associates, Inc., in association with
Delta Airport Consultants, Inc.
11
New Castle Airport
Draft Business Plan
!
!
!
!
December, 2005
Avports: Avports has a small storage hangar in this quadrant that is used for the
storage of cargo and airplane supplies.
General Aviation T-Hangars: The general aviation T-hangar area consists of six
buildings. There are 72 T-Hangars that house a variety of single and multi-engine
aircraft.
MBNA/Hertz/Penske: Both MBNA and Hertz/Penske operate from three hangars
located in the Midfield area between Taxiways F and G.
Aero Taxi/Avports: Aero Taxi and Avports are FBOs. Both tenants provide major
flight line and fueling services for general aviation aircraft on the airport, pilot
training, and also serve as the primary drop-off point for passengers that use the
airport. Also located in this area are 30 aircraft tie-down positions.
Other Landside Support Facilities
Landside support facilities include fuel storage and dispensing equipment, airport
maintenance, airport rescue and firefighting (ARFF), non – aviation users, and utilities.
!
!
!
Fuel Storage and Dispensing Equipment: The airport offers 100LL and Jet A fuel.
Fuel is distributed to aircraft by trucks. The above ground fuel storage tanks are
located throughout the airport. Additionally, the Delaware Air National Guard
(DEANG) has five above ground storage tanks with a capacity of 50,000 gallons.
Airport Maintenance: The DRBA maintenance department is located within the
DEANG base complex. The maintenance facility is comprised of several buildings
that house airport equipment, offices, and crew room.
Airport Rescue and Firefighting (ARFF): The purpose of an ARFF facility is to
save lives by maximizing emergency response and intervention during an airport
crisis. The ARFF crew conducts fire fighting rescue operations and fire prevention
services. The DEANG currently has an 11,700 square-foot ARFF facility with four
bays.
Military Facilities
New Castle Airport is home to the DEANG. The base is located along Basin Road on the
northeast side of the airport. The complex is comprised of approximately 30 buildings, including
aircraft hangars, support offices and storage facilities. The DEANG is a military base that employs
250 personnel on a weekly basis, but increases to 1,000 during drill weekends or active duty
assignments. The primary mission of the DEANG is to operate C-130 aircraft and to transport cargo
and personnel in support of military operations around the world.
The Delaware Army National Guard operates a facility west of Boeing’s ramp. The Army
Guard is an active flight wing that operates the UH-60 Black Hawk helicopter. Their operation is
similar to the Delaware Air National Guard and has 25 active personnel, which can increase to 200
during drill weekends. The hangar and office complex is secured with perimeter fencing with
limited points of access from the landside to airside.
R.A. Wiedemann & Associates, Inc., in association with
Delta Airport Consultants, Inc.
12
New Castle Airport
Draft Business Plan
December, 2005
Non – Aviation Users
Non-aviation users are also an important element of the airport’s landside facilities. Nonaviation businesses at the airport include car rental companies, limousine/shuttle companies, and
caterers. Other services include U.S. Customs, U.S. Immigration and U.S. Department of
Agriculture (APHIS).
Land Use
New Castle Airport is located in a highly developed urban area and is comprised of 1,053
acres zoned Industrial District, Special Uses. The surrounding area is comprised of the following
districts: commercial regional, commercial neighborhood, business park, neighborhood transition,
and cropland. Figure 4 presents a graphic illustration of the near-Airport land use at ILG.
3.2
Future Facilities
Airport Capital Improvement Plan (ACIP)
The principal source of Federal funding for airport development is the FAA's Airport
Improvement Program (AIP). This program was initially established by the Airport and Airway
Improvement Act of 1982 and periodically reauthorized since that date. In January 2004, FAA
Reauthorization Legislation was signed into law as the ‘Vision 100 – Century of Aviation
Reauthorization Act’. The New Castle Airport is currently classified as a general aviation airport
and receives approximately $150,000 each year through the AIP fund. Given current statutory
provisions of the FAA Authorization Act, AIP will provide 95 percent funding for all eligible project
costs at GA airports through federal fiscal year 2007; thereafter this level of participation will be
reduced to 90 percent. AIP discretionary funds are also made available to the airport for high
priority capacity, safety, and security projects
AIP eligible projects include the planning, design, and construction of projects associated
with public use facilities and equipment of the Airport. The 2004 AIP reauthorization bill, however,
contains a significant change from previous bills in that certain revenue producing aviation facilities
may be eligible for AIP funding. Typical AIP eligible projects have historically included Airport
master plans and Airport layout plans; land acquisition and site preparation; airfield pavements, e.g.
runways, taxiways, and transient aprons; lighting and navigational aids; safety, security, and snow
removal equipment; selected passenger terminal facilities; and obstruction identification and
removal. The new legislation makes projects such as aircraft hangars, aviation fuel facilities, and
automobile parking facilities eligible for AIP funding under certain conditions. Highest funding
priority according to FAA’s rating procedure, is generally given those projects that are safety related
such as obstruction removal, runway safety area improvements and facility improvements to meet
current FAA Airport Design Standards. Table 2 presents the 5-year ACIP for New Castle Airport.
R.A. Wiedemann & Associates, Inc., in association with
Delta Airport Consultants, Inc.
13
New Castle Airport
Draft Business Plan
December, 2005
Table 2 - Airport Capital Improvement Program: New Castle Airport
Year/Project
FAA
State
Local
Total
$5,100,000
$134,211
$134,210
$5,368,421
Snow Removal Equipment (Rollover Plow)
$175,000
$4,605
$4,605
$184,210
Security Fencing & Access Controls Phase I
Design
$150,000
$3,947
$3,947
$157,894
Obstruction Removal
$300,000
$7,895
$7,895
$315,790
Rehabilitate Taxiway Signage & Lighting
$1,900,000
$50,000
$50,000
$2,000,000
Rehabilitate Taxiways Phase I (Per PMS)
$1,425,000
$37,500
$37,500
$1,500,000
Security Fencing & Access Controls Phase II
Construct
$850,000
$22,368
$22,368
$894,736
Vacuum Truck
$150,000
$3,947
$3,947
$157,895
Design & Construct Taxiway H
$2,250,000
$59,211
$59,210
$2,368,421
Rehabilitate Taxiways Phase II (Per PMS)
$1,425,000
$37,500
$37,500
$1,500,000
Snow Removal Equipment (Oshkosh Blower)
$570,000
$15,000
$15,000
$600,000
Construct SRE Building
$300,000
$7,895
$7,895
$315,790
$2,000,000
$52,632
$52,632
$2,105,264
$150,000
$3,947
$3,947
$157,894
$350,000
$9,211
$9,211
$368,421
$17,095,000
$449,868
$449,868
$17,994,736
2006
Rehabilitate Runway 9-27 (Design & Construct)
2007
2008
2009
Terminal Improvements
Snow Removal Equipment (6-wheel Dump)
2010
Construct ARFF Access Road to RW 14-32
Totals
As shown, the ACIP lists projects involving runway and taxiway rehabilitation, security
fencing, terminal improvements, SRE building construction and equipment acquisition. The total
planned airport capital investment over the five year period (FY 2006-2010) is approximately $18.0
million. Federal grants will make up $17,095,000 of this amount, and State grants will contribute
approximately $450,000. The DRBA will be responsible for the remaining $450,000.
State Grant Programs
The State of Delaware has made monies available for airport development projects through
legislative appropriations. This money has been used in the past to match the local share for FAAfunded projects - typically two and one-half percent of the total project. This practice is standard
in most states and would be encouraged at New Castle Airport. Therefore, it was assumed that the
policy of granting State matching funds to federal grants will continue throughout the planning
period for New Castle Airport. A two and one-half percent matching percentage on eligible projects
R.A. Wiedemann & Associates, Inc., in association with
Delta Airport Consultants, Inc.
15
New Castle Airport
Draft Business Plan
December, 2005
was used to predict State funding contributions.
Local/Private Funding
Local funding of publicly-owned general aviation airports is usually accomplished through
a public sponsor’s general fund. This expenditure may be offset by airport generated revenues.
Public bodies may also issue general obligation (GO) or revenue bonds. These bonds are usually
reserved for large capital projects.
A revenue bond is backed by a promise to pay the principal and interest represented by the
bond with revenues generated by the project it funds. Since the issuance of revenue bonds does not
affect the general borrowing power of the issuing party, it represents an attractive funding
mechanism to a local political jurisdiction. Independent underwriters must evaluate revenue bonds,
and the proposed bonds must demonstrate a reasonable expectation of repayment. Since some
airport facilities generate more indirect benefits to the community than direct revenues, they may
not always meet this test.
Private investors are also a potential source of funds for revenue producing development.
Tenants and/or investors may finance the construction of facilities from which they derive income.
While the direct revenues to the airport are usually limited to the lease charges for the land
underlying the facilities, the local sponsor does not need to obtain its own funding for these
improvements. Additionally, the increased activity resulting from the airport improvements often
increase the number of based aircraft, which in turn generate additional revenue associated with fuel
sales and other aviation services.
Development Plan
The Development Plan for New Castle Airport is illustrated in Figure 5. Of note, there is
currently a master plan update under development which will make recommended facility changes
in addition to those recommended in this business plan. Even with these changes, the primary
interest to this business plan is the reservation of space for a new airline terminal building. That
space is depicted on Figure 5. It should be noted that the location of this area may change,
depending upon a host of other factors that must be considered prior to its development. Although
airline service may not materialize within the 5 year horizon of this study, it is considered good
planning practice to have a site reserved for the future potential airline terminal.
R.A. Wiedemann & Associates, Inc., in association with
Delta Airport Consultants, Inc.
16
New Castle Airport
Draft Business Plan
3.4
December, 2005
Market Analysis
Airport Market Area
Figure 6 illustrates the Airport service area including other nearby public-use airports. For
New Castle Airport, the service area is roughly based on a 30-minute driving distance for smaller
general aviation aircraft and a 60 minute driving distance for larger corporate and business jet
aircraft. Within this area are located a total of ten (10) public-use airports and numerous private,
restricted-use airfields. The public-use airports located within New Castle's service area are:
Philadelpia International, Northeast Philadelphia, Chester County (PA), Brandywine (PA), New
Garden (PA), Spitfire (NJ), Summit (DE), Delaware Airpark (DE), and Cecil County (MD).
Facilities
Table 3 provides a comparison of airport facilities at public-use airports within the service
area of the New Castle Airport. Philadelphia's large commercial service airport is located roughly
30 miles north of New Castle Airport. This airport has multiple runways with the longest runway
length over 10,000 feet. The facility is fully equipped with precision instrument approach
procedures to multiple runway ends. Another significant competitor in the greater Philadephia area
is Northeast Philadelphia Airport. That airport has a 7,000 foot runway and a 5,000 foot runway,
along with precision instrument approaches. Of the remaining airports, only one has a runway with
more than 5,000 feet (Chester County). Thus, New Castle Airport must compete against these other
three airports for corporate aviation and business jet activity in the greater Philadelphia market.
Among the non-commercial general aviation airports, New Castle has the longest and widest runway
in the service area (7,181 feet by 150 feet). Philadelphia International, Northeast Philadelphia,
Chester County, and New Castle have the only precision instrument approaches in the service area.
Based Aircraft
There are a reported total of 1,118 aircraft based at the public-use airports within New Castle
Airport’s defined service area. The majority of these (70%) are single engine aircraft. Of the 118
jet aircraft in the service area, 66 are located at New Castle, and this airport also bases roughly 17
percent of the area's multi engine aircraft (24). Five airports in the service area have based jets:
Philadelphia International, Northeast Philadelphia, New Castle, Chester County, and Brandywine.
With a total of 282 aircraft on the field including 66 based jets, New Castle Airport is well utilized
by corporate aviation. Almost all of the airports in the service area have waiting lists for aircraft
hangars.
Aviation Services
Table 4 presents the availability of various aviation services at each of the area airports.
Listed services at New Castle Airport include all major airframe and powerplant repairs, flight
R.A. Wiedemann & Associates, Inc., in association with
Delta Airport Consultants, Inc.
18
New Castle Airport
Draft Business Plan
December, 2005
Figure 6 - Airport Service Area
TO BE PROVIDED
R.A. Wiedemann & Associates, Inc., in association with
Delta Airport Consultants, Inc.
19
New Castle Airport
Draft Business Plan
December, 2005
instruction, charter service, avionics installation and repair service, aircraft sales, and aircraft rentals.
New Castle Airport also features air ambulance service and some specialized air cargo service. As
such, New Castle Airport compares favorably to all of the other area general aviation airports in
terms of aviation services provided.
Hangars and Tie-downs
Monthly tie-down spaces are available at all of the service area airports contacted. Prices
range from $50 and $100 at smaller airports with limited facilities to $900 per month at Philadelphia
International (Table 5). Aircraft storage space in conventional hangars is currently available at New
Castle Airport and at three of the service area airports. The cost of conventional hangar space at
New Castle Airport is in the upper-range of the competing airports in the service area. Four airports
in the service area have T-hangars on the field; however, availibility is limited as there are waiting
listes for all T-hangars in the service area. Prices on T-hangars range from $170 to $700 per month.
Monthly T-hangar rates at New Castle are priced at $225-$700 per month - a wide range which
depends on the size of the aircraft and amenities of the hangar. Monthly rates at some airports
depend on age and condition of the T-hangars and can vary widely between airports, and even on
the same airport.
Fuel Prices
Aviation Fuel (100LL Avgas) is available at ten of the service area airports. The highest per
gallon prices (as of December, 2005) are found at Northeast Philadelphia ($5.05) and Philadelphia
International ($4.88). The price per gallon at New Castle ($4.09) is the third lowest price of the
other general aviation airports in the service area. The lowest price was found at Cecil County, at
$3.75 per gallon. All gas prices change with frequency, however. Jet fuel is available five airports
in the service area. The lowest price ($3.59) is found at New Castle Airport. The highest price was
again at Philadelphia International ($5.28). Most of the general aviation airports did not charge noncommercial landing fees. However, at New Castle Airport, a landing fee is charged of $0.90 per
1,000 pounds for all aircraft weighing over 7,500 pounds.
R.A. Wiedemann & Associates, Inc., in association with
Delta Airport Consultants, Inc.
20
Table 3. Facility Comparison
Airport
Airport Ownership Acres
Code
Number of Based Aircraft
Runway
Jet Multi- Single Heli- Other Total
Navaids
First
LxW
Second
LxW
Highest
Tower
Brandywine
N99
Private
44
1
8
96
4
0
109
3,347' X 50'
N/A
GPS/VOR
No
Cecil CO.
58M
Private
22
0
3
41
0
3
47
3,000' X 70'
N/A
GPS/VOR
No
Chester CO. Carlson
40N
Public
250
20
24
90
2
0
136
5,400' X 100'
N/A
GPS/ILS
No
Delaware Airpark
33N
Public
65
0
2
43
1
0
46
3,582' X 60'
N/A
GPS/VOR
No
New Garden
N57
Private
134
0
6
118
3
13
140
3,695' X 50'
N/A
VOR
No
New Castle
ILG
Public
1,250
66
24
167
16
9
282
7,181' X 150'
7,012' X 200'
ILS/GPS
Yes
Northeast Philadelphia
PNE
Public
1,240
13
58
132
10
0
213
7,000' X 150'
5,000' X 150'
ILS/GPS
Yes
Philadelphia Int
PHL
Public
2,302
18
7
5
2
0
32
10,506' X 200'
9,500' X 150'
ILS/GPS
Yes
Spitfire
7N7
Private
48
0
1
33
3
0
37
2,419' X 50'
N/A
GPS
No
Summit
EVY
Private
209
0
6
63
7
0
76
4,487' X 65'
3,000' X 200' T
VOR/GPS
No
139
788
48
33
1,118
TOTAL 118
Source: Airport Master Record as Published December 2005 (www.airnav.com).
Runways:
Paved unless: T = turf,
*Other: Ultralite, Glider, or Military
21
Table 4. Service Comparison
Airport
Airframe
Repairs
Powerplant
Repairs
Flight
Instruction
Charter
Service
Avionics
Aircraft
Sales
Aircraft
Rentals
Other
Brandywine
Minor
Major
Yes
Yes
No
No
Yes
Cecil CO.
Major
Major
Yes
No
No
No
Yes
Northeast Philadelphia
Major
Major
Yes
Yes
Yes
Yes
Yes
Air Ambulance, Cargo
Chester CO.
Major
Major
Yes
Yes
No
Yes
Yes
Air Freight
Delaware Airpark
Major
Major
Yes
No
No
No
Yes
Crop Dusting
Harford CO.
Major
Major
Yes
No
No
No
Yes
Glider, Glider Towing
New Castle
Major
Major
Yes
Yes
Yes
Yes
Yes
Air Ambulance, Cargo
New Garden
Major
Major
Yes
No
No
Yes
Yes
Aerial Surveying, Glider
Spitfire
Major
Major
Yes
No
No
No
Yes
Aerial Surveying
Philadelphia Int.
Major
Major
No
Yes
Yes
No
Yes
Air Freight, Cargo, Bottled
Oxygen, Bulk Oxygen
Summit
Major
Major
No
No
Source: Airport Master Record as Published December 2005 (www.airnav.com).
Yes
No
No
Airframe modification
Air Ambulance
22
Table 5: Rates and Charges Comparison
Airport
Tie-Down
Conventional Hangars
T-Hangars
Fuel
Landing Fee
$/month
Available
$/month
Available
$/ month
Available
100 ll
Jet A
110 P +50
fuel
Yes
N/A
N/A
for purchase
only
No
4.30
4.30
Yes
60-100
Yes
No
280
No
3.75
N/A
No
90 P
Yes
650-1,000
Yes
350
No
3.99
3.90
No
Delaware Airpark
40T 60P
Yes
180
No
N/A
N/A
4.14
N/A
No
NE Philadelphia
150-440
Yes
N/A
Yes
400
No
5.05
5.04
Yes
New Castle
40T 50P
Yes
1,200-2,000
Yes
225-700
No
4.09
3.59
Yes
New Garden
55T 80P
Yes
255
Yes
170
No
4.49
N/A
Yes
Philadelphia
900-1500
Yes
2,100-2,550
Yes
N/A
N/A
4.88
5.28
Yes
Spitfire
N/A
Yes
N/A
N/A
N/A
N/A
N/A
N/A
No
Summit
45T 80P
Yes
N/A
No
225
No
4.25
4.25
No
Brandywine
Cecil CO
Chester CO
200-1,250
Source: RA Wiedemann & Associates Inc. Telephone Survey
Source: Airport Master Record as Published December 2005 (www.airnav.com).
N/A
Not Available
T = Turf
P = Paved
23
New Castle Airport
Draft Business Plan
4.
December, 2005
BASELINE FINANCIAL OUTLOOK
HIS SECTION IDENTIFIES HISTORICAL REVENUES AND expenses attributable to New Castle
Airport and projects those revenues and expenses to the year 2011. This projection only
considers a baseline scenario with no revenue enhancement projects included. In other words,
what are the financial implications of continuing the Airport's operation as it is today? In a later
section, alternative projections of financial performance will be developed based upon suggested
improvements and marketing pro-formas. To properly frame these financial statements, this section
is organized to present the following:
T
!
!
4.1
Historical Revenues and Expenses
Baseline Forecast of Revenues and Expenses
Historical Revenues and Expenses
DRBA took over the operation and control of
New Castle Airport on July 1, 1995. Since that time, the
Airport has been the focus of economic development
activities, significant capital improvement investments,
and corporate aviation expansion. For this analysis,
historical revenues and expenses were examined for a
four year period (2001-2004). Table 6 presents a
summary of the historical operating revenues for the
Airport from fiscal 2001 forward while Figure 7 shows
total revenues and expenses for the period. It should be
noted that capital expenditures are not included in the
listing of operating revenues and expenses.
Figure 7 - Historical Revenues & Expenses
As shown in Table 6, operating income from the
Airport has not grown since 2002. This total does not
include the annual debt service for capital development. Those contributions are not considered
revenues from operations by this analysis. Rather, this analysis is geared to identify the actual
revenue producing ability of the Airport, along with its actual operating costs. The table shows that
lease revenues - primarily from on-airport businesses and corporate aviation clients - provide
roughly four-fifths of the revenues for the Airport. Fuel fee income is second with almost 14
percent, with landing fees making up the third significant fraction of revenues (4 percent).
Table 6 - Historical Operating Revenues
ITEM
Lease Revenues
2001
2002
2003
2004
Average
$2,780,717
$2,942,883
$2,901,598
$2,858,242
80.7%
R.A. Wiedemann & Associates, Inc., in association with
Delta Airport Consultants, Inc.
24
New Castle Airport
Draft Business Plan
December, 2005
Table 6 - Historical Operating Revenues
ITEM
2001
2002
2003
2004
Average
Landing Fee Revenues
$138,606
$138,465
$187,531
$143,226
4.3%
Fuel Fee Income
$466,377
$517,917
$516,770
$455,804
13.7%
Cafeteria/Vending Sales
$19,080
$47,295
$31,364
$1,703
0.7%
Misc. Income
($108)
$5,839
$9,530
$67,277
0.6%
$5,484
($5,728)
$154
0%
$3,657,883
$3,641,064
$3,526,406
100.0%
Interest Income
TOTALS
$3,404,673
Table 7 shows the operating expenses for New Castle Airport. These expense categories
represent aggregated totals of many accounting sub-categories. Capital expenditures are not
included as part of the operating expenses, by definition. These items will be evaluated separately
and added to the operating expenses later to show total Airport cost to the Sponsor. The primary
operating expense category at New Castle Airport is Labor, representing 73 percent of operating
costs. The next closest operating cost is Utilities expense with 13 percent.
Table 7 - Historical Operating Expenses
ITEM
2001
2002
2003
2004
Average
Labor
$1,307,794
$1,329,848
$1,755,793
$1,572,262
73.3%
Equipment & Supplies
$179,834
$150,579
$208,768
$176,585
8.8%
Maintenance & Repair
$57,648
$75,323
$97,482
$133,168
4.5%
Utilities
$216,114
$317,983
$279,401
$223,407
12.8%
Miscellaneous
$11,953
$9,823
$10,855
$16,807
0.6%
$1,773,343
$1,883,557
$2,352,299
$2,122,230
100.0%
TOTALS
4.2
Baseline Forecast of Revenues & Expenses
This baseline forecast presents a status quo look at revenues and expenses, influenced
primarily by historical activity. It does not consider all of the potential changes in the Wilmington
area economy or at the Airport that might change the historical trend. However, it is important to
see the forecast results of what could be called a minimal change alternative, where only the
programs that are currently underway and mandatory contractual changes are shown. The FAA’s
Terminal Area Forecasts were used for the projection of based aircraft and operations at the Airport,
showing modest growth through the year 2020.
R.A. Wiedemann & Associates, Inc., in association with
Delta Airport Consultants, Inc.
25
New Castle Airport
Draft Business Plan
December, 2005
Baseline Operating Revenue Projection
The Baseline Operating Revenue Projection was tied to the growth of based aircraft and
operations along with lease escalations. In this regard, the FAA’s Terminal Area Forecast (TAF)
was used to project based aircraft and operations through the year 2011. That projection showed
an eight percent growth in based aircraft and less than one percent growth in operations. All lease
agreements have an inflation index built into the contract. For this analysis, inflation was assumed
at four percent per year. Thus, lease agreement revenues were optimistically assumed to grow at
the rate of inflation plus the growth in based aircraft. Landing fees and fuel sales were tied to
operations while the other smaller categories were assumed to grow at the rate of inflation. Table
8 presents the forecast of baseline revenues for ILG. As shown, operating revenues under the status
quo are projected to grow from $3.8 million in 2006 to $4.7 million in 2011 - a 4.2 percent annual
rate of growth.
Table 8 - Baseline Forecast of Operating Revenues
2006
2007
2008
2009
2010
2011
$3,144,386
$3,316,201
$3,488,015
$3,659,830
$3,831,645
$4,003,459
Landing Fee Revenues
$143,515
$143,730
$143,945
$144,160
$144,375
$144,590
Fuel Fee Income
$456,488
$457,172
$457,855
$458,539
$459,223
$459,906
Cafeteria/Vending Sales
$1,841
$1,915
$1,992
$2,071
$2,154
$2,240
Misc. Income
$72,767
$75,678
$78,705
$81,853
$85,127
$88,532
$167
$173
$180
$188
$195
$203
$3,819,164
$3,994,869
$4,170,693
$4,346,641
$4,522,719
$4,698,931
Lease Revenues
Interest Income
TOTALS
Baseline Operating Expense Projection
Expenses are somewhat different from revenues in that they can more easily increase as a
result of price inflation. For example, the cost of labor, the cost of utilities including fuel, and the
cost of materials and supplies are subject to price inflation that is beyond the control of the local
airport. For this reason, the baseline expense forecast included a 4.0 percent inflation factor for
spending over the five year projection period. For labor spending, a lower, 3.0 percent inflation
factor was used, since employee turnover and part-time staff usage can insulate this category from
full price inflationary effects.
Operating expenses do not include capital expenditures, depreciation expense, or grants from
governmental agencies. Rather, operating expenses are those costs associated with the day-to-day
operation of the Airport. By comparing operational revenues and expenses, a true gauge for the
need of supplemental income or grants can be developed. Table 9 presents the baseline forecast of
operational expenses through the year 2011.
R.A. Wiedemann & Associates, Inc., in association with
Delta Airport Consultants, Inc.
26
New Castle Airport
Draft Business Plan
December, 2005
Table 9 - Baseline Forecast of Operating Expenses
2006
2007
2008
2009
2010
2011
$1,668,013
$1,718,053
$1,769,595
$1,822,683
$1,877,363
$1,933,684
Equipment & Supplies
$190,995
$198,635
$206,580
$214,843
$223,437
$232,374
Maintenance & Repair
$144,035
$149,796
$155,788
$162,020
$168,500
$175,240
Utilities
$241,637
$251,302
$261,354
$271,809
$282,681
$293,988
Miscellaneous
$18,179
$18,906
$19,662
$20,449
$21,267
$22,117
$2,262,858
$2,336,693
$2,412,980
$2,491,803
$2,573,248
$2,657,405
Labor
TOTALS
When the baseline operational costs are compared with the baseline forecasts of operational
revenues, the net operating costs for the Airport can be predicted as follows:
!
!
!
!
!
!
2006
2007
2008
2009
2010
2011
Operating
Expenses
$2,262,900
$2,336,700
$2,413,000
$2,491,800
$2,573,200
$2,657,400
Operating
Revenues
$3,819,200
$3,994,900
$4,170,700
$4,346,600
$4,522,700
$4,698,900
Net Operating Revenues
$1,556,300
$1,658,200
$1,757,700
$1,854,800
$1,949,500
$2,041,500
As shown, net operating revenues are projected grow from $1.56 million in 2006 to $2.04 million
by the end of the forecast period. The results of the baseline forecast also indicate that net operating
revenues should be available to fund significant portions of the local share of capital development
projects at the Airport.
R.A. Wiedemann & Associates, Inc., in association with
Delta Airport Consultants, Inc.
27
New Castle Airport
Draft Business Plan
5.
December, 2005
BUSINESS PLAN ALTERNATIVES
explore a variety of methods
designed to increase net revenues. These revenues could be used to pay for portions of the
local share of capital development projects and to help reduce the dependence upon DRBA
subsidies. In order to present these alternatives, this section is organized to include the following:
S
EVERAL BUSINESS PLAN ALTERNATIVES WERE DEVELOPED TO
!
!
!
!
5.1
Area-wide factors supporting growth and development of the Airport
Obstacles to Airport performance and goal attainment
Revenue enhancement
Cost efficiency options
Area-wide Factors Supporting Growth and Development of the Airport
There are a number of factors that now support the potential growth and development of the
New Castle Airport. These factors are directly related to the future growth and development of the
community that the Airport supports.
Potential Community Growth
Continued economic development and growth in New Castle County is essential to the
growth and development of the New Castle Airport. A recent assessment of the market in
Wilmington indicated the following:
!
1
“In 2004, the Delaware market experienced a surprisingly successful year of leasing activity.
Transactions totaling more than 1 million square feet were recorded and substantial new construction
projects are on the horizon. Discussions surrounding new speculative office buildings are the direct
result of the need for high-end space in downtown Wilmington. Much like the rest of the Greater
Philadelphia area, the Wilmington economy has been slow to recover, yet an increase in city-dwelling
residents and the signing of six major tenants have given new life to the downtown marketplace.
Wilmington, DE also continues to be successful due to its business friendly tax structure. Chemical
and financial services companies have been, and will continue to be crucial to the real estate recovery
in Wilmington. AAA Mid-Atlantic, Invista and ING Direct are just a handful of major companies that
signed leases in Wilmington in 2004; of those tenants, AAA Mid-Atlantic announced their new
corporate headquarters will rise on the Wilmington Riverfront, the center of new commercial and
residential development. In 2005 the City of Wilmington will be a critical component to the economic
reawakening in the state of Delaware. Currently, local investor and developer Buccini-Pollin Group
has proposed Gateway Plaza, a new 14-story office tower in downtown Wilmington. The Riverfront
will continue to win awards for 'most popular' location for new corporate headquarters and residential
development. The Commonwealth Group is also proposing a Class A office facility at Marrows Road,
with the development of Renaissance Center just across from the County Courthouse.”1
Source: www.cbre.com (CB Richard Ellis).
R.A. Wiedemann & Associates, Inc., in association with
Delta Airport Consultants, Inc.
28
New Castle Airport
Draft Business Plan
December, 2005
Delaware Tax Structure
Delaware has reduced its personal income taxes at all income levels. The State has never had
a general sales tax or an inventory tax. There are no State real property taxes, and the local real
property taxes are very low. The total State and local tax burden in Delaware is competitive with
most other states. Key tax features making Delaware attractive to new business include:
!
!
!
!
!
!
!
!
!
A Constitutional requirement that any increase in existing State taxes, or new State
taxes, is adopted by a super-majority (3/5) vote in the State Legislature.
No State or local general sales tax.
An improved structure for unemployment insurance taxation that includes
accelerated experience ratings for new employers.
Tax credits on bank franchise, corporate income and reduction of gross receipts taxes
for new and expanded businesses.
Additional tax credits on corporate income and reduction of gross receipt taxes for
new and expanding businesses locating in 30 targeted census tracts.
Property tax relief for new construction and improvements of existing property.
The adherence of the State tax structure to the federal definition of corporate net
income so that companies may take full advantage of any federal tax law change,
such as more rapid depreciation of newly purchased assets.
Two approved foreign trade zones which allow the deferment of import taxes. One
of these is located at the Port of Wilmington.
Public Utility Tax rebates of 50 percent on increased consumption for qualifying
industries, and a reduced rate for manufacturers and agricultural processors.
Airport Amenities
New Castle Airport is the largest, best equipped general aviation airports in Delaware. In
addition to New Castle’s 7,181-foot runway, the Airport enjoys Air Traffic Control Tower (ATCT)
operation, a full Instrument Landing System, and a full-time Airport Rescue & Fire Fighting force.
The Airport holds a Federal Aviation Regulations (FAR) Part 139 Operating Certificate and has
space for the development of hangars and other on-airport aviation clients. All of these amenities
permit the Airport itself to function as a magnet of aviation business and industry. In addition, the
potential for airline activity at the Airport exists. If needed, the existing terminal could be used for
airline service or new facilities could be developed on the Airport.
5.2
Obstacles to Airport Performance and Goal Attainment
In addition to the positive trends, there are a number of factors that present challenges to the
attainment of stated goals and objectives for the financial performance of the Airport. These
obstacles include the following:
R.A. Wiedemann & Associates, Inc., in association with
Delta Airport Consultants, Inc.
29
New Castle Airport
Draft Business Plan
5.3
December, 2005
!
Increased Vacancy in Corporate Hangars: Currently, two corporate hangars are
vacant, with additional space available in a third hangar. Either a slow market has
prevented growth at ILG or competitive forces have moved corporate aircraft clients
to other airports. In either case, marketing will be necessary to offset the vacancy
rate in corporate clients.
!
Citizen Support: One of the greatest assets of the Airport is the support that it
receives from the community. Philadelphia International flight patterns have been
challenged by Delaware citizens over noise concerns. Thus, any significant changes
in the flight patterns or noise exposure in and around the New Castle Airport may
also meet with resistance. Citizen opposition to Airport growth or activity could
limit its ability to attract airline service or air cargo service.
Revenue Enhancement
There are only two ways to increase net revenues for the New Castle Airport: increase
revenues or cut costs. In this section, revenue enhancement strategies will be discussed. Elements
of these strategies include the following:
!
Attraction of an Airline: One method to increase revenues and supplement local
commerce is to attract a low fare airline to ILG. As explained in Section 6, a low
fare carrier with significant drawing power is likely the only viable air service option
for ILG, due to its close proximity to PHL. The feasibility of such a plan is
established later in this analysis.
New Terminal Services: The attraction of an airline brings concession
revenue to an airport in the form of terminal rentals for businesses
(newstands, food service, etc.). In addition, revenues from taxis, pay
parking, additional rental car space, airline operational space, and
government (TSA) rental space all contribute to the bottom line.
!
Airport Branding: Branding is the process of developing a unique selling identity
for a product or service. In this regard, the Airport may be in need of changing the
previous branded stereotype as a large corporate aviation facility only. Sometimes
an airport sponsor can examine this option through the SWOT (strengths,
weaknesses, opportunities, and threats) self-evaluation process, along with other
political and economic development initiatives. Branding initiatives must consider
the future role of the Airport, including the potential attraction of airline service,
small general aviation, and large corporate aviation.
The Airport can work this process through possible name change, marketing, and
infrastructure investment. But the process will have to be cooperative between the
potential commercial users of the Airport and the DRBA. For example, the decision
R.A. Wiedemann & Associates, Inc., in association with
Delta Airport Consultants, Inc.
30
New Castle Airport
Draft Business Plan
December, 2005
to attract an airline would require additional infrastructure and services investment.
Much this investment would be recouped through charges to the airline and FAA
grants. On the other hand, changing the name of the Airport to attract a greater
service area can be accomplished with a modest marketing budget. Brand
recognition from airline passenger users and corporate and other general aviation
users means increased airport activity - all contributing to the Airport’s bottom line.
!
Attraction of More Corporate Aviation: To continue its role as the premier corporate
aviation hub in northern Delaware and southeastern Pennsylvania, New Castle
Airport must attract more business and corporate aviation. Strategies for
accomplishing this will be detailed in the Recommended Plan. Two methods stand
out: 1) Hire a marketing person with ties to the corporate aviation industry 2)
Undertake an in-house effort to market corporate aviation. This approach has been
used in the past, to varying degrees of success.
For one corporate jet at New Castle Airport, the numbers could add up to 5 personnel
and between 1,000 and 1,500 gallons of jet fuel per week. This doesn’t include
leased hangar space or use of other airport services. DRBA revenue margins from
the fuel could be estimated at the current rate of $0.09 per gallon for tenants. When
the employment benefits and the hangar lease aspects of the operation are included,
there is a significant potential revenue impact of attracting corporate aircraft to New
Castle Airport.
-
!
2
Hangar Revenue Options: DRBA has increased revenues at ILG through the
development of aircraft hangars. Currently, there are several vacancies in the
large corporate hangars that will provide additional revenue when filled.
Lease revenues make up roughly 80 percent of all airport revenues and as
such are the single most important clientele on the Airport. For the present,
increasing the occupancy rate for existing hangars should be the primary
objective. In the future, more hangar development can be undertaken once
current vacancies are filled. Simply by filling the vacant hangars, an
estimated $150,000 additional annual revenues could be generated.
Attraction of More Small GA Users: The feasibility of attracting more single and
twin engine propellor aircraft will be examined in the Recommended Plan. On the
positive side, they represent a revenue base with needs for fuel, maintenance, and
hangar storage space. Typical annual spending for these items at Delaware airports
averages $9,000 for single and twin engine propellor aircraft.2 ILG would likely
have a higher than average pricing structure for these types of general aviation users.
On the negative side, this user group typically requires more time and attention per
Source: Year 2000 Delaware survey data, updated by Consumer Price Index (CPI) to year 2005.
R.A. Wiedemann & Associates, Inc., in association with
Delta Airport Consultants, Inc.
31
New Castle Airport
Draft Business Plan
December, 2005
earned unit of revenue due to their low fuel usage and realitvely small hangar space
needs. Also, increased operations from this user group may increase noise exposure
or sensitivities with surrounding neighbors.
!
Additional/Specialty FBOs: Specialty FBOs include paint shops, avionics
repair/installation, airframe modification, helicopter charter, engine overhaul
(specific types), etc. Economic activity from specialty FBOs includes the attraction
of aircraft to the Airport, the employment of local residents, and the purchase of
supplies and materials both locally and from outside the area. While specialty FBOs
look for niche market opportunities, they generally don’t compete directly with the
full service FBOs. The focus of such an FBO could include:
Large aircraft maintenance/overhaul
Aircraft paint/refurbishment shop
Maintenance for smaller general aviation aircraft market
!
Rates and Charges: One method to increase revenues is to re-examine rates and
charges at the Airport relative to competing airports. Factors to consider include the
expiration dates of the current lease agreements, the market’s ability to support any
price increases, and any special circumstances surrounding a tenant’s use of the
Airport.
Miliary Mission: At one time, it was believed that the Air National Guard
flying mission would be moved from ILG. If so, it may have changed the
rates and charges policy for the Army facility located at the Airport.
However, the flying mission was restored in the final version of the BRAC
and thus, any changes in rates and charges for the military are unlikely.
!
Federal and State Grants: Another area that can help balance the books in terms of
overall spending at the Airport involves the efficient use of Federal and State grants.
Key to State participation is early coordination with DelDOT for any desired
matching funds for federal grants.
!
Air Cargo Operation: Some have suggested that New Castle Airport could increase
activity by actively courting air cargo companies. This idea gained some credibility
when the Air National Guard ramp looked as though it may be available for other use
as a result of the preliminary BRAC recommendations. However, since there will
likely be no change in the mission of the ANG, the space needed for air cargo
operations is limited. One other negative issue regarding air cargo involves night
time operations. Noise sensitive areas around the Airport may be impacted by
overnight cargo operations, if they were to locate at ILG. Thus, the tradeoff between
air cargo operation revenues and local citizen support would have to be considered
prior to seeking an air cargo carrier.
R.A. Wiedemann & Associates, Inc., in association with
Delta Airport Consultants, Inc.
32
New Castle Airport
Draft Business Plan
5.4
December, 2005
Cost-Efficiency Options
As mentioned previously, there are only two ways to increase net revenues for the New
Castle Airport: increase revenues or cut costs. The most costly segments of Airport expenses
include the following:
!
Labor: The highest expense category for New Castle Airport is labor, representing
approximately 73 percent of total expenditures. Discussions with Airport
Management indicate that there are no significant cuts that could be made with
regard to labor, particularly with such a large infrastructure. In addition, there may
be a requirement to add personnel to accommodate potential airline service
requirements. Thus, no further cost cutting measures are feasible for personnel
expenses.
!
Utilities, Supplies, Maintenance, & Other Expenses: These expenses are all
reasonable for an Airport the size and complexity of New Castle. No changes
recommended.
The conclusions indicated that there were no impacts to the current or forecast level of
expenses resulting from cost-cutting or efficiency-improving measures. There is simply no "fluff"
in the current budget. If net revenues are to be increased, higher revenues will be needed.
R.A. Wiedemann & Associates, Inc., in association with
Delta Airport Consultants, Inc.
33
New Castle Airport
Draft Business Plan
6.
December, 2005
AIRLINE PASSENGER SERVICE SCENARIO
ECAUSE POTENTIAL AIRLINE SERVICE FEASIBILITY IS SUCH a significant factor in this business
B
plan, an entire section was devoted to its discussion. This section presents an overview of
the feasibility determination process and is meant as a means of making informed policy
decisions concerning the pursuit of airline service at New Castle Airport.
Airlines are operated today similar to many business ventures; the end goal is to return a
profit to the shareholders who own the airline. Because the airlines are private, for profit companies,
they do not provide air transportation simply as a service, but must make money with their capital
equipment, in this case, airplanes. Airlines are generally free to enter and exit airports at will in the
deregulated airline environment. Decisions are made about entering new markets and moving
equipment to different routes based on several factors. Through discussions with airline personnel,
including airline route planners, the most important factors considered are the availability of aircraft
equipment and the rate of return that could be expected on that equipment when flying a selected
route. Airlines look for several key components when analyzing a community for potential service;
these components include:
!
!
!
Population
Business and industrial activity
Historical air travel statistics
The anticipated growth in these factors is also considered. Internal airline forecasts of a
community’s potential make or break the possibility of air service. Each community can influence
these airline predictions to a degree, but the right combination of these factors must exist in order
for a community to be considered in the airline planning process.
6.1
Potential Airline Demand
In order to make informed decisions concerning air service actions, it is important to know
the size and direction of airline passenger leakage from the local area to other competing airports.
In this regard, leakage may flow to three or more airports in the region - Philadelphia International,
BWI, and Allentown. However, without question, the greatest number of passengers from the metro
Wilmington Delaware area are using Philadelphia International (PHL). Low fares from Southwest
Airlines are featured at PHL and BWI. Table 10 presents a brief history of airline passenger
enplanements at all four airports.
Table 10 - Historical Airline Enplanements*
Year
ILG
PHL
BWI
ABE
Total
1995
452
8,849,175
6,595,515
466,075
15,911,217
R.A. Wiedemann & Associates, Inc., in association with
Delta Airport Consultants, Inc.
34
New Castle Airport
Draft Business Plan
December, 2005
Table 10 - Historical Airline Enplanements*
Year
ILG
PHL
BWI
ABE
Total
1996
460
9,039,527
6,535,884
465,873
16,041,744
1997
393
10,433,050
7,052,860
458,879
17,945,182
1998
841
11,470,165
7,069,682
474,477
19,015,165
1999
39,817
11,711,583
8,315,582
463,461
20,530,443
2000
13,006
12,131,345
9,445,906
490,111
22,080,368
2001
0
12,232,358
10,315,599
499,754
23,047,711
2002
0
11,664,158
9,449,181
387,123
21,500,462
2003
0
11,740,483
9,385,356
437,147
21,562,986
2004
0
13,376,442
* Source: FAA Terminal Area Forecasts, 2005
9,810,650
449,529
23,636,621
As shown, the Shuttle America Airline service at New Castle Airport in 1999 and part of 2000
provided the first significant enplanement levels at ILG in a number of years. At both PHL and
BWI, there was significant growth over the last 10 years, while ABE remained somewhat static. For
the region, total enplanements at the airports grew from 15.9 million to 23.6 million - an average
growth rate of 4.5 percent per year. During the same period, population in the three impacted MSAs
grew from 9.05 million to 9.68 million or at an average growth rate of 0.6 percent per year. Thus,
airline enplanements outgrew local population bases by roughly 3.9 percent per year.
Airline Passenger Leakage Measurement
There are a number of methods of measuring airline passenger leakage from one market to
another. The most direct method would be a survey or census of airline passengers at each of the
markets with questions concerning their place of origin. Other direct methods include license plate
surveys in airport parking lots and airline ticket lifts from travel agencies. The primary goal of these
studies is to estimate the number of passengers driving past one airport to go to another.
Because of the limited resources of this study effort, an estimating technique was used that
did not involve direct surveys or ticket lifts. In this regard, the method used in this analysis involved
an estimation of the total potential passenger trip generation from New Castle County along with
an estimate of the actual passenger capture potential in the ILG market area. If the total number of
potential passengers is known or estimated, it can be compared to the potential capture of
enplanements and some estimate of “leaked” demand can be generated.
A comparative methodology developed for air service studies was employed in this study.
R.A. Wiedemann & Associates, Inc., in association with
Delta Airport Consultants, Inc.
35
New Castle Airport
Draft Business Plan
December, 2005
A comparative analysis examines historical performance of other airline airports that are similar in
size and economic profile to ILG. Obviously, there are numerous factors that contribute to the
success of an airline operation and no two communities are exactly alike. But there is value in
looking at the common measures of airline demand, including the number of enplanements-percapita that occur in different communities and the impact of larger nearby airline airports on
demand.
For this study, a model was used that estimates total potential air travel demand from smallto-medium sized cities located near major alternate airports. Because we know that large airports
(or airports with low fares) attract a certain percentage of passengers from smaller airports, one way
of estimating the effects of this phenomenon is to chart the information from many different airports
concerning their number of enplanements, their local population base, and their distance to the
nearest larger airline airport. A final level of comparison dealt with the types of airline service
available and how that, in itself, either limits or enables local enplanement growth. Recent statistical
information from 91 communities throughout the U.S. was gathered in developing the model.
Information input to the model included: enplanements, county population, distance to the nearest
large hub air terminal, and type of airline service available (turbo prop, jet, etc.).
The type of airline service available turns out to be a significant factor in measuring the
actual ability of an airport to capture local airline passengers. In this regard, airports with large jet
service enplaned more per capita than did airports with regional jet service only. Similarly, airports
with regional jet service enplaned more per capita than airports with turbo-prop service only. For
these reasons, three estimates of local demand were generated: one for the total service area and two
for the probable immediate demand that could be captured with 1) good local service using large jet
aircraft service and, 2) for regional jet aircraft (50-seat or less) only.
!
!
!
New Castle County total passenger potential:
Large jet aircraft market capture potential:
Regional jet aircraft market capture potential:
Annual Enplanements
790,600
290,900
87,300
These numbers are based on the average performance of other cities across the United States.
Actual performance at ILG could be either higher or lower than these averages. Currently, there is
a 100 percent leakage of all passenger trips generated from New Castle County, Delaware. That
translates into almost 800,000 passenger enplanements per year. While it would not be possible to
capture all of these passengers at New Castle Airport due to the presence of PHL and BWI, the
model predicts that 37 percent of these could be retained if large jet service were available. The
model also predicts that if regional jet service were offered at ILG, only 11 percent of the market
could be captured.
R.A. Wiedemann & Associates, Inc., in association with
Delta Airport Consultants, Inc.
36
New Castle Airport
Draft Business Plan
6.2
December, 2005
ILG Airline Service Scenario
The location of Wilmington roughly 30 miles from PHL creates unique competitive issues
for any carrier attempting to start service at ILG. Gravity transportation models predict that the
closer a community is to a large hub airport, the greater the use of that hub. Conversely, this means
that alternate airports have less of chance of capturing air travelers that are in close “orbit” to a large
hub. In 2004, PHL ranked 15th in the nation in total enplanements. The airport is home to many
airlines including a large US Airways connecting hub operation and low fare service from Southwest
Airlines. The implications for ILG are clear:
!
!
!
!
!
There can be no hub-and-spoke operations from ILG because the critical mass of
feeder traffic needed to support such an operation is already at PHL.
None of the legacy carriers (Delta, US Airways, United, American, Northwest,
Continental, etc.) can operate without a hub-and-spoke operation.
Only a self-contained airline operation with low fares has a chance of succeeding in
such a market - e.g. Southwest Airlines at Houston-Hobby Airport, Burbank, CA, or
JetBlue at Long Beach, CA.
Southwest Airlines and Airtran Airways are already in BWI and PHL and thus are
not candidates for service to ILG.
The prime carrier to fit the possible market scenario is JetBlue, which does not have
a presence in PHL or BWI.
Given the above factors, the most likely carrier to approach for service at ILG is JetBlue. Their
service capabilities, prices, market penetration needs, etc., are the best fit for ILG. This does not
mean that other low fare carriers should not be approached, however, it does mean that the direction
of this business plan will consider first the possibility that JetBlue Airways is the primary candidate
for ILG service.
JetBlue Airways
JetBlue Airways first flight was in February 2000 with the inauguration of service between
New York City's John F. Kennedy International Airport and Fort Lauderdale, FL. The airline now
serves 32 cities around the U.S. and the Caribbean with a fleet of 77 Airbus A320 aircraft. Every
JetBlue aircraft is outfitted with all-leather seats, each equipped with the satellite system offering
up to 36 channels of programming. JetBlue innovation included the following:
!
!
!
!
!
!
First and only U.S. start-up airline to launch with more than $100 million in capital
First and only airline to offer 24-channels of live satellite television free at every seat
First and only airline to broadcast the Olympic Games live at every seat
First U.S. airline to introduce "paperless cockpit" flight technology
Only U.S. airline to be 100 percent ticketless
First U.S. airline to install bullet-proof cockpit doors across its fleet
R.A. Wiedemann & Associates, Inc., in association with
Delta Airport Consultants, Inc.
37
New Castle Airport
Draft Business Plan
!
December, 2005
First and only airline to install security cameras in passenger cabin for customer and
crew safety
JetBlue was profitable within their first year of operation. They explain their formula for
success as follows:3
!
!
!
!
Start with a lot of money: JetBlue had the best-capitalized airline start-up in history.
As such, they were able to invest in the best product available including new planes,
leather seats, free satellite TV, and fast check-in technology.
Fly new planes: The fleet of new Airbus A320s comes with a host of advantages.
New aircraft are more reliable, so they spend less time on the ground where they
don't make money. They're more efficient, so they use less fuel than other carriers.
JetBlue currently has the youngest airline fleet in the industry.
Hire the best people: JetBlue screens employees rigorously, trains them well and
gives them the best tools. Their employees are motivated and service-oriented. Their
challenge is to change the industry for the better.
Focus on service: By offering customers an outstanding product, most of them
come back regularly and tell others about JetBlue.
JetBlue Service Structure
JetBlue serves 30 cities in the United States and Carribean using 33 airports:
!
!
!
!
!
!
!
!
!
!
!
!
!
!
!
!
!
!
!
!
Aguadilla, Puerto Rico
Boston, MA
Buffalo, NY
Burbank, CA
Burlington, VT
Denver, CO
Fort Lauderdale, FL
Fort Myers, FL
Las Vegas, NV
Long Beach, CA (near Los Angeles)
Nassau, Bahamas
New Orleans, LA
New York City, NY (JFK)
New York City, NY (LaGuardia)
Newark, NJ (service starts October 5, 2005)
Oakland, CA (near San Francisco)
Ontario, CA (near Los Angeles)
Orlando, FL
Phoenix, AZ
Ponce, Puerto Rico
3
Source: www.jetblue.com
R.A. Wiedemann & Associates, Inc., in association with
Delta Airport Consultants, Inc.
!
!
!
!
!
!
!
!
!
!
!
!
!
Portland, OR
Rochester, NY
Sacramento, CA
Santiago, Dominican Republic
Salt Lake City, UT
San Diego, CA
San Jose, CA
San Juan, Puerto Rico
Seattle, WA
Syracuse, NY
Tampa, FL
West Palm Beach, FL
Washington, DC (Dulles)
38
New Castle Airport
Draft Business Plan
December, 2005
JetBlue has grown significantly in its 5-year history. Table 11 shows the number of
passenger enplanements carried in previous years. Year 2005 is estimated from the first 5-months
data available at the time of this writing (9/9/05).
Table 11 - JetBlue Airways Growth
*
Year
Enplaned Passengers
Annual Growth %
2000
1,128,146
NA
2001
3,056,371
271.0%
2002
5,672,638
185.6%
2003
8,949,744
157.8%
2004
11,731,733
131.1%
2005
14,000,000*
119.3%
Estimated from Jan-May 2005 actual data.
Looking at the cities served, JetBlue’s philosophy of growth is to serve large metropolitan
areas with dense origin and destination traffic markets. One of the largest U.S. markets not currently
served by JetBlue is the Philadelphia metro area. ILG could provide a foothold into that market
without the type of costs associated with PHL or BWI.
JetBlue has orders with Airbus for as many as 233 A-320 aircraft and has placed an order
with Embraer for a fleet of up to 200 Embraer 190 aircraft. Both aircraft types have single-class
configurations. The A-320 seats 156 while the EMB 190 seats 100. Implications for the EMB 190
are that JetBlue will be able to serve smaller communities with “right-sized” aircraft.
ILG Market for JetBlue
The market for JetBlue services in the Philadelphia metro area as served through ILG are
described by the local air transportation patterns at PHL, BWI, and ABE. In this regard, Appendix
A presents a listing of the top 50 Origin and Destination passengers from these markets. From that
database, a summary of demand from the PHL/BWI/ABE region in 2004 to each of JetBlue’s
domestic markets is shown in Table 12.
Table 12 - ILG Market Potential for JetBlue Cities of Interest
MARKET
Boston, MA
Buffalo, NY
Burlington, VT
Denver, CO
Fort Lauderdale, FL
Fort Myers, FL
Las Vegas, NV
Origin & Destination Passengers
1,183,570
253,020
25,860
590,100
1,468,340
185,500
1,071,220
R.A. Wiedemann & Associates, Inc., in association with
Delta Airport Consultants, Inc.
39
New Castle Airport
Draft Business Plan
December, 2005
Table 12 - ILG Market Potential for JetBlue Cities of Interest
MARKET
Los Angeles, CA
New Orleans, LA
New York City, NY
Orlando, FL
Phoenix, AZ
Portland, OR
Rochester, NY
Sacramento, CA
Salt Lake City, UT
San Diego, CA
San Francisco, CA
Seattle, WA
Syracuse, NY
Origin & Destination Passengers
1,449,590
454,620
270,740
1,868,510
754,840
195,220
132,900
154,190
272,080
570,260
978,530
215,010
45,870
Tampa, FL
West Palm Beach, FL
Washington, DC
TOTALS
1,004,010
317,340
N/A
13,461,320
As shown, Florida markets are made up of mostly high-density traffic from the PHL/BWI/ABE
region. These markets include:
O&D Pax
!
Orlando
1,868,500
!
Southeast Florida
1,468,300
!
Tampa
1,004,000
!
West Palm Beach
317,300
!
Fort Myers
185,500
Total Florida
4,853,500
Any combination of flights from ILG to one or two of the top Florida destinations could yield the
required number of passengers to breakeven, assuming good market share penetration. Other
markets that JetBlue might consider would include:
!
!
!
!
Boston
Las Vegas
Los Angeles
San Francisco
O&D Pax
1,183,600
1,071,200
1,449,600
978,500
Los Angeles and San Francisco may be difficult to serve from ILG with A-320 equipment due to
runway length requirements on those long city-pair stage lengths. With 7,181 feet of runway length
R.A. Wiedemann & Associates, Inc., in association with
Delta Airport Consultants, Inc.
40
New Castle Airport
Draft Business Plan
December, 2005
at ILG, an A-320 aircraft will need a minimum of 7,218 for a full load at 59 degrees Fahrenheit at
sea level. Hotter days will require more runway length. However, the EMB 190 requires 6,913 feet
of runway under the same conditions and has a stage length of 2,300 nautical miles - enough to make
the trip - according to manufacturer's specifications.
Minimum Traffic Levels for JetBlue at ILG
In order to operate profitably from ILG, JetBlue will require assurance that minimum traffic
levels and revenue needs are met. In this regard, average load factors for JetBlue for 2003, 2004,
and the first five months of 2005 are as follows:
!
!
!
2003
2004
2005 (Jan-May)
Av. Load Factor
84.2%
82.8%
84.6%
Assuming the need for an 84 percent load factor at ILG, the following passenger levels would be
needed for a given level of service with A-320 aircraft:
Table 13 - Enplanements Needed To Support JetBlue A-320 Service at ILG
Flights/Day
Daily Enplanements
Monthly Enplanements
Annual Enplanements
2
262
7,862
95,700
3
393
11,794
143,500
4
524
15,725
191,300
5
655
19,656
239,100
6
786
23,587
287,000
7
917
27,518
334,800
8
1,048
31,450
382,600
Given the estimated capture of 291,000 annual enplanements at ILG, the most that the Airport could
support would be 6 flights per day.
As mentioned, JetBlue has ordered 200 EMB-190 aircraft, with seating capacity of 100.
With these smaller aircraft, smaller numbers of passengers are needed to support a station such as
ILG. Table 14 presents a listing of enplanements needed to support service with the EMB-190.
Table 14 - Enplanements Needed To Support JetBlue EMB-190 Service at ILG
Flights/Day
Daily Enplanements
Monthly Enplanements
Annual Enplanements
2
168
5,040
61,300
3
252
7,560
92,000
4
336
10,080
122,600
R.A. Wiedemann & Associates, Inc., in association with
Delta Airport Consultants, Inc.
41
New Castle Airport
Draft Business Plan
December, 2005
Table 14 - Enplanements Needed To Support JetBlue EMB-190 Service at ILG
Flights/Day
Daily Enplanements
Monthly Enplanements
Annual Enplanements
5
420
12,600
153,300
6
504
15,120
184,000
7
588
17,640
214,600
8
672
20,160
245,300
9
756
22,680
275,900
As shown, JetBlue will have significantly greater flexibility with the smaller aircraft at ILG. For
example, 5 flights per day to Orlando and 4 flights per day to Fort Lauderdale from ILG with the
EMB-190 would serve roughly 275,000 enplanements (550,000 total origin and destination
passengers).
6.3
Potential Airline Revenues and Expenses
A revenue and expense pro forma was developed to evaluate whether or not the initiation
of air service to ILG is worth pursuing. On the revenue side, Passenger Facility Charges, rental car
fees, and other concession revenue must be considered. On the expense side, a new passenger
terminal building, auto parking lot, and airline equipment and facilities must be considered. There
were a number of assumptions made in developing the revenue projections:
Assumptions
!
It was assumed that the first year of airline service would be 2007.
!
For the first two years, it was assumed that the existing terminal building would be
retrofitted and used while a new terminal building was being constructed.
!
It was assumed that a new terminal building would become available for use in 2009.
Potential Airline Revenues
For this analysis, airline revenues were assumed to accrue from six separate areas:
!
!
!
!
!
Passenger Facility Charges: It was assumed that $4.50 per passenger would be
levied to pay for capital development of the terminal building and other airlinerelated improvements.
Auto Parking Fees: These revenues would be generated through pay-parking at the
Airport. Expanded and new facilities would be required.
Terminal Concession Fees: These revenues represent the total rental value of the
terminal building including airline, restaurant, and all other rental space.
Rental Car Fees: These revenues would be generated through rental car concessions
at the Airport including parking and commissions.
Landing Fees: These revenues would be charged to the airline and were estimated
at $2.50 per 1,000 pounds landed weight.
R.A. Wiedemann & Associates, Inc., in association with
Delta Airport Consultants, Inc.
42
New Castle Airport
Draft Business Plan
!
December, 2005
Fuel Flowage Fees: These revenues would be from the sale of jet fuel to the airline.
It was assumed that a rate of $0.09 per gallon would be charged.
Table 15 presents a summary of the potential airline revenues that could be conservatively expected
from the initiation of airline service at ILG.
Table 15 - Potential Airline Revenues
ITEM
2007
2008
2009
2010
2011
Passenger Traffic
122,600
184,000
245,300
275,900
275,900
PFCs
$551,700
$828,000
$1,103,850
$1,241,550
$1,241,550
200
350
400
500
500
$438,000
$766,500
$876,000
$1,095,000
$1,095,000
14,100
22,600
28,200
33,900
33,900
$141,000
$226,000
$423,000
$508,500
$508,500
163
245
327
368
368
$237,980
$358,187
$477,517
$537,085
$537,085
4
6
8
9
9
$346,020
$519,030
$692,040
$778,545
$778,545
Jet Fuel Sales Gallons
2,190,000
3,285,000
4,380,000
4,927,500
4,927,500
Jet Fuel Flowage Fee
$197,100
$295,650
$394,200
$443,500
$443,500
Total Operational Revenues
$1,473,800
$2,226,900
$3,966,600
$4,604,200
$4,604,200
Primary Airport Entitlement Funds
$1,000,000
$1,000,000
$1,027,780
$1,107,340
$1,367,340
TOTAL - ALL SOURCES
$2,473,800
$3,226,900
$4,994,380
$5,711,540
$5,971,540
Auto Parking Fees
Spaces filled
Average $6/day
Concessions
Terminal Space
Average $10-$15/sf
Rental Car
Spaces
Rental Car Fees
Landing Fees
Flights/day
Landing Fees @ $2.50/1000
Fuel Flowage Fees
Potential Costs of Airline Service
There are a number of costs associated with the initiation of airline service at ILG. The most
significant costs are those needed to adapt the Airport to airline passenger use. That process would
require the expansion of auto parking, retrofitting of the terminal building with at least one jetway,
Transportation Security Administration (TSA) security, and ultimately, a new terminal and parking
area. The same assumptions used in the revenue projections were incorporated into the cost
R.A. Wiedemann & Associates, Inc., in association with
Delta Airport Consultants, Inc.
43
New Castle Airport
Draft Business Plan
December, 2005
projections - first service in 2007 with new terminal building by 2009. In addition, it was assumed
that a new airline terminal apron would be constructed and that the new terminal building would be
capable of accommodating up to three airline gates by the year 2010. It was assumed that the
existing parking lot would be expanded in front of the Fight Safety Building for the near term
accommodation of demand. For the longer term, a new parking area would be constructed at the
new terminal building site. Table 16 presents a summary of these costs.
Table 16 - Potential Costs of Airline Service
ITEM
2007
2008
2009
2010
2011
1
2
2
3
3
14,100
22,600
22,600
33,900
33,900
21,000
21,000
Terminal Building
Gates
Size (sq. ft.)
Cost
$500,000
$8,500,000
Apron Area
Size (sq. yd.)
10,000
14,000
Cost
21,000
$2,000,000
Public Parking (spaces)
Public
270
460
560
690
690
Employees
60
90
110
140
140
Rental Cars
170
250
330
370
370
Total
500
800
1,000
1,200
1,200
Cost
$400,000
$0
$0
$2,400,000
Access Improvements
(Entrance Roads, etc.)
Cost
TOTAL Costs
$1,000,000
$900,000
$0
$13,900,000
As shown, the construction costs for the 2009-2011 period were “loaded” into the 2009 period with
the idea that it is more economical to build the entire terminal at one time than to break it up into
two segments. The total cost to develop the airline capability at ILG is $14.8 million by the year
2011. To pay for these facilities, the Airport can use surplus revenues, Passenger Facility Charges,
and primary airport entitlement funds that are distributed on the basis of passenger enplanements.
Comparison of Funding Needs to Revenues
While there are likely to be additional maintenance and utility costs to DRBA with the
development of airline service and a new terminal, most of those costs can be passed along to the
airline. For purposes of this analysis, they were not included in the comparison of revenues and
funding needs. As shown below, the comparison of costs and revenues indicates that year 2009
construction of the proposed terminal building would have to be financed through some type of debt
instruments.
R.A. Wiedemann & Associates, Inc., in association with
Delta Airport Consultants, Inc.
44
New Castle Airport
Draft Business Plan
December, 2005
Revenues and expenses that can be derived from potential airline service are shown as
follows:
!
!
!
!
!
Airline Capital
Expenses
$ 900,000
$
0
$13,900,000
$
0
$
0
2007
2008
2009
2010
2011
Airline Related
Revenues
$2,473,800
$3,226,900
$4,994,400
$5,711,500
$5,971,500
Surplus Revs
$1,573,800
$3,226,900
($8,905,600)
$5,771,500
$5,971,500
If surplus airline-related revenues and funding were dedicated to pay off the terminal construction,
it is likely that such debt could be paid by the year 2011. In reality, debt service timeframes are
likely to be longer (up to 10 years), depending upon the type of debt instrument used.
6.4
Overall Revenues & Expenses of the Business Plan
Impact on Revenues
Quantifying the levels of additional potential revenue that would result from implementing
all the strategies discussed in this plan is highly subjective. The only reasonable method is one
where the assumptions for each strategy are stated, along with the resulting impact. Then, if the
assumptions are not met, deviations from the predicted revenues can be expected. It is believed that
changes in revenues to DRBA would come primarily from the initiation of airline service along with
increased airport development and aviation activity.
Changes in Aviation Activity
The first and most important step in determining the impacts of these strategies is to predict
the change in aviation demand that would occur if each strategy were implemented. Table 17
presents a listing of the potential demand changes along with the assumptions used in estimating
demand changes.
Table 17 - Potential Demand Changes by Year 2011
Demand Change
Assumption
Current Activity
Corporate Aviation
Derived from marketing corporate
aviation interests, and attracting
corporate aviation to fill large hangars.
Airport Branding
Additional passenger enplanements
via marketing
Hangar Development
Attraction of smaller GA aircraft
R.A. Wiedemann & Associates, Inc., in association with
Delta Airport Consultants, Inc.
Operations
Based
Aircraft
Scheduled
Enplanements
118,216
319
0
2.0%
6
NA
0
3.0%
20
30,600
45
New Castle Airport
Draft Business Plan
December, 2005
Table 17 - Potential Demand Changes by Year 2011
Demand Change
Assumption
Operations
Based
Aircraft
Scheduled
Enplanements
245,300
Airline Activity
Attract low fare carrier to ILG
5.0%
0
Terminal Concessions
Airline related businesses - newstands,
food service, pay parking, etc.
0.0%
0
Additional/Specialty FBOs
New FBO or new services offered by
specialty FBOs.
0.0%
0
10.0%
26
130,038
345
Additional Potential Growth
Total Potential Activity
275,900
Potential Revenues
Table 18 presents a listing of how all these potential demand increases could impact the
revenue picture for New Castle Airport, if the assumptions for each scenario are met.
Table 18 - Potential Increases Resulting from All Revenue Enhancement Strategies
2006
2007
2008
2009
2010
2011
$3,144,386
$3,464,409
$3,784,432
$4,104,454
$4,424,477
$4,744,500
Landing Fee Revenues
$143,515
$489,750
$662,975
$836,200
$922,920
$923,100
Fuel Fee Income
$456,488
$654,272
$753,505
$852,739
$902,698
$946,850
Airline PFC
$0
$551,700
$828,000
$1,103,850
$1,241,550
$1,241,550
Airline Pay Parking
$0
$0
$876,000
$1,095,000
$1,095,000
$1,095,000
New Hangars
$0
$84,000
$84,000
$84,000
$92,400
$92,400
Miscellaneous
$74,800
$78,020
$81,240
$84,460
$87,680
$90,900
$3,819,189
$5,322,150
$7,070,152
$8,160,703
$8,766,725
$9,134,300
Lease Revenues
TOTAL REVENUE
As shown, revenues would grow dramatically with the onset of airline service. This includes
revenues from landing fees, terminal concessions, pay parking, PFCs, and additional rental car
activity. Other revenue growth could be derived from additional corporate based aircraft, the
attraction of another specialty FBO, and the development of T-hangars for smaller general aviation
aircraft. If all of the revenue enhancement components worked as predicted, income from operations
would increase from $3,819,200 in 2006 to $9,125,900 by the year 2011 - an average annual growth
of 19 percent.
Impact on Expenses
If airline service is successfully brought to ILG, more labor, equipment and supplies,
maintenance and repair, and investment in infrastructure will be needed. For purposes of this
analysis, it was assumed that DRBA staff would be added to accommodate the longer operational
R.A. Wiedemann & Associates, Inc., in association with
Delta Airport Consultants, Inc.
46
New Castle Airport
Draft Business Plan
December, 2005
hours of airline service, along with the expanded functions needed to deal with airline service (pay
parking, security, etc.). A total of $250,000 was added to the budget to account for between 6 and
8 new employees. Similarly, budgets for equipment and supplies and maintenance and repair were
increased by 10 percent to account for the larger infrastructure and greater use. If the Sponsor must
invest in facilities to increase revenues, the cost of that investment must be counted against the
revenue generation. In the case of New Castle Airport, debt service interest expense for the
retrofitting of the existing terminal, construction of a new terminal, and development of 20 Thangars was included in the expanded expense estimation (see Table 19). Also shown is a budget
amount for marketing, since that work does not happen until funds are dedicated to its
implementation. It is estimated that under the impact on expenses of all revenue enhancement
actions, expenses would grow from roughly $2.47 million in 2006 to $3.73 million in 2007. From
then through 2011, expenses would gradually decrease due to lower interest expense payments.
Table 19 - Impact on Expenses of Revenue Enhancement Actions
ITEM
2006
2007
2008
2009
2010
2011
Labor
$1,768,013
$1,971,053
$2,030,185
$2,091,090
$2,153,823
$2,218,438
Equipment & Supplies
$190,995
$218,498
$227,238
$236,327
$245,781
$255,612
Maintenance & Repair
$144,035
$164,776
$171,367
$178,222
$185,350
$192,764
Utilities
$241,637
$251,302
$261,354
$271,809
$282,681
$293,988
Miscellaneous
$18,179
$18,906
$19,662
$20,449
$21,267
$22,117
Marketing
$50,000
$50,000
$50,000
$50,000
$50,000
$50,000
Debt Service Interest
$54,200
$1,055,100
$955,300
$766,800
$578,100
$375,600
$2,467,059
$3,729,635
$3,715,106
$3,614,697
$3,517,002
$3,408,519
TOTALS
Comparison of Expenses & Revenues
When the enhanced operating revenue forecast is compared to the associated operating
expenses, the new net operating revenues for the Airport can be predicted:
!
!
!
!
!
!
2006
2007
2008
2009
2010
2011
Operating
Expenses
$2,467,100
$3,729,600
$3,715,100
$3,614,700
$3,517,000
$3,408,500
Operating
Revenues
$3,819,200
$5,322,200
$7,070,200
$8,160,700
$8,766,700
$9,134,300
Net Operating Revenues
$1,352,100
$1,592,600
$3,355,100
$4,546,000
$5,249,700
$5,725,800
Comparison of the enhanced forecasts of revenues and expenses show the Airport moving from
$1.35 million to a steadily increasing revenue surplus. Key to this improving financial performance
is the development of scheduled airline service at the Airport, the attraction of more corporate
aviation, and diversification of Airport clientele
R.A. Wiedemann & Associates, Inc., in association with
Delta Airport Consultants, Inc.
47
New Castle Airport
Draft Business Plan
December, 2005
If the annual local capital expenditures and debt service are included with the operating
expenses, and the primary airport entitlement funding is added to the enhanced operating revenue
projection, the following projection of total net revenues can be made:
!
!
!
!
!
!
2006
2007
2008
2009
2010
2011
Capital Costs
& Expenses
$3,228,200
$4,170,300
$6,551,300
$6,292,000
$6,376,500
$6,411,000
Entitlement +
Op. Revenues
$3,819,200
$6,322,200
$8,070,000
$9,188,500
$9,874,000
$10,501,600
Net Revenues
$ 591,000
$2,151,800
$1,518,700
$2,896,500
$3,497,500
$4,090,600
As shown, the Airport will still show positive net revenues even when the local share capital
development costs and the principal debt retirement payments are included in the expenses.
R.A. Wiedemann & Associates, Inc., in association with
Delta Airport Consultants, Inc.
48
New Castle Airport
Draft Business Plan
7.
December, 2005
RECOMMENDED PLAN
HE RECOMMENDED BUSINESS PLAN FOR NEW CASTLE Airport focuses on the initiation of low
fare airline service combined with branding concepts for the Airport. The plan covers two
primary strategic areas: management/administrative actions and revenue enhancement
strategies and actions. Cost efficiency actions were not identified in this report. Baseline revenue
and expense projections presented earlier in this report showed an operating revenue surplus
scenario. This did not include the local share of capital development projects. If there is a desire
to increase net revenues, the following range of options are available in each of the strategic areas
described below.
T
7.1
Recommended Management/Administrative Actions
The existing Management structure provides excellent support for the safe operation of the
Airport. However, it is not likely that this small staff is equipped to perform significant marketing
and planning functions. Such undertakings generally require a larger staff. If Management desires
to market the Airport and its potential airline service effectively, consideration should be given to
expanding the resources used for that purpose. Generally speaking, marketing doesn't happen until
resources are allocated. Therefore, it is recommended that:
If airline service occurs, additional money should be budgeted for marketing
activities related to the new service.
This budget should be jointly developed with the assistance of the airline, since they are key
stakeholders in the revenue development process.
Currently, the administrative system, including the accounting function works well. After
examining the methods and systems of accounts at the Airport it is recommended that:
No changes in the system of accounts are recommended at this time.
7.2
Revenue Enhancement Recommendations
The revenue enhancement recommendations did not focus on one strategic option to the
exclusion of all others. Instead, a number of different revenue enhancement strategies are
recommended for the New Castle Airport. These include the following:
R.A. Wiedemann & Associates, Inc., in association with
Delta Airport Consultants, Inc.
49
New Castle Airport
Draft Business Plan
December, 2005
Airline Service
The most significant revenue enhancement initiative to offered by this business plan is the
development of low fare scheduled airline service at ILG. This service would not only be a benefit
to local economic development, it would also benefit many Delaware citizens that currently have
to leave the State to use airline service. Thus, the first recommendation is as follows:
DRBA should seek to attract a low fare airline to ILG.
As described in Section 6, ILG is in a good position to attract a low fare carrier to the
Airport. Of the carriers considered, it is believed that only JetBlue has the name recognition and
financial power to successfully initiate low fare service in Wilmington. If successful, the new airline
service would attract more than 275,000 enplanements and provide substantial economic benefits
in the form of support activities for car rentals, terminal concessions, pay parking, and fuel sales.
Airline service at ILG will not occur on its own. It will require careful planning, preparation,
a marketing budget, and the right approach to JetBlue. DRBA will only have one chance to sell ILG
to the carrier and the most should be made of that opportunity. The marketing program needed to
convey the necessary information to JetBlue should include, but not be limited to the following:
!
!
!
Feasibility Study proving the economic viability of the service.
Presentation that incorporates video, data, and graphics.
Sufficient budget to convey to JetBlue the importance of their move to Wilmington.
In this regard, JetBlue management may not have ever seen ILG or the Wilmington area. Video and
PowerPoint can be combined to provide the JetBlue management with an in-depth look at the
Airport, its facilities, management, and the community at large. Interviews with local business
leaders, Wilmington’s mayor, and Delaware’s Congressional representatives will all be important
to capture on video for presentation to JetBlue. DRBA must use this opportunity to put the best face
on the Airport and the community’s desire to attract the carrier. Therefore, it is recommended that:
A high-end presentation should be developed for use in attracting JetBlue to
ILG, including feasibility study, video, and PowerPoint.
The whole project needs to be “choreographed” to ensure highest impact with the carrier.
If DRBA is successful in attracting a low fare carrier, immediate development steps would
be needed to prepare the Airport to accommodate that service. Therefore, it is recommended that:
R.A. Wiedemann & Associates, Inc., in association with
Delta Airport Consultants, Inc.
50
New Castle Airport
Draft Business Plan
December, 2005
Terminal and other airline-related facilities should be prepared or developed
to accommodate new airline service.
In this regard, the steps envisioned include the following:
!
!
!
Retrofit existing terminal building to accommodate start-up airline service.
Expand parking area at the existing terminal to support airline service
If airline service looks to be long-term, begin construction of a new terminal
building and parking area.
In addition to these items, other developments are needed to prepare the Airport for airline service
including new access roadways, new taxiway connectors, airline apron, etc.
Branding
Branding is the process of developing a unique selling identity for a product or service. If
the Airport successfully attracts airline service, it must expand its image to incorporate this
significant change. New Castle Airport must transform itself from a general aviation image into an
airline service airport with a multi-state service area. The first step in this process is a name change
for the Airport, properly identifying its regional significance. Thus, if the Airport attains airline
service, it is recommended that:
New Castle Airport should be renamed to convey its regional significance
and new airline market reach.
Generally, a name change provides the opportunity to introduce new services, a new look, and a
revitalized marketing campaign. Names such as "Northern Delaware Regional" or "Delaware Valley
Regional" could be considered. Discussions should be held with JetBlue to determine market targets
and how to cooperatively work toward attracting these to the Airport.
Attraction of Corporate Aviation
Most airport sponsors have learned that corporate aviation helps “pay the bills” by providing
a disproportionately higher source of airport revenue than recreational general aviation. Several
factors have combined to make New Castle Airport the logical location for corporate aviation
expansion. First, the Airport’s two 7,000+ foot runways are the longest at any public-use airport in
Delaware. Second, the Airport is located within the greater Philadelphia area. Corporate aviation
interests using North Philadelphia or Philadelphia International could be well served at New Castle
Airport. Given these conditions, it is recommended that:
R.A. Wiedemann & Associates, Inc., in association with
Delta Airport Consultants, Inc.
51
New Castle Airport
Draft Business Plan
December, 2005
Corporate aviation clients should be marketed directly by the DRBA or
through the use of an industry “insider.”
Sometimes it is easier to “hire” contacts than to develop them independently. In this regard, DRBA
may desire to hire someone with ties to corporate aviation manufacturers or fractional jet operators.
Although previous in-house marketing efforts have used direct mail to fractional jet operators or
corporate aircraft owners in the region, sometimes there is value in person-to-person relationships.
If in-house marketing is desired, steps in this process (many of which are already being undertaken
by DRBA) include the following:
!
!
!
!
!
Send marketing representative to industry functions such as NBAA conferences and
to aircraft manufacturers’ sites to gain valuable person-to-person contacts.
By learning in advance what companies are buying aircraft, DRBA is in a
better position to offer those companies in the region hangar space for their
new corporate aircraft.
Identify corporate/business aircraft owners within a 100-mile radius of the New
Castle Airport.
Create or use professional, glossy promotional material with a targeted cover letter
to these aircraft owners. A DVD showing the Airport and its attributes could be used
as well.
Create or use a website that shows the Airport, corporate hangar locations, terms,
inducements, etc. Streaming video from the website could be used to broadcast the
Airport video. The website address should be included on all promotional materials
and DRBA letterhead.
Ensure that a follow-up mechanism that can handle call-backs, referrals, and
questions about the corporate aviation program is used for all inquiries.
A key goal is to fill all vacant corporate hangars on the field with revenue-producing tenants.
Attraction of Smaller GA Users
Although DRBA has focused on larger corporate aviation clients for New Castle Airport in
the past, the loss of several significant corporate tenants can materially impact the bottom line.
Thus, there may be a desire to diversify the revenue base to include more small general aviation
aircraft tenants. One method of attracting such tenants is to construct T-hangars. For this plan, it
was assumed that 20 new aircraft were attracted to T-hangars developed by DRBA. In addition to
hangar rents, these GA users purchase fuel and maintenance services from FBOs on the Airport.
A typical pro forma for a 20-unit T-hangar project at ILG could include the following:
!
!
Annual revenues of $84,000 ($350 per month per unit).
Development costs of $700,000
R.A. Wiedemann & Associates, Inc., in association with
Delta Airport Consultants, Inc.
52
New Castle Airport
Draft Business Plan
!
December, 2005
Financing for 15 years at 7 percent interest = $75,500 in payments per year.
Interest rates below seven percent would increase net revenues by lowering debt service payments.
Therefore, it is recommended that:
DRBA should examine the possibility of developing additional T-hangars to
attract smaller GA users and help diversify its revenue base.
Several creative methods have been employed by airport sponsors to develop hangar
facilities using both public and private investment. For public investment, Federal grants or lowinterest bond issues are preferred sources of funds. If DRBA is to develop the T-hangars
recommended by this business plan, it is recommended that:
DRBA should seek additional FAA grant money to develop hangars.
Grants from Airport entitlement funding provide a maximum $150,000 per year which can only fund
a portion of the hangar needs. Unfortunately, there is no guarantee that grants will be available
when needed for hangar development. Therefore, the debt financing method must be retained as a
second option for DRBA.
If DRBA desires to encourage private investment in hangars at the Airport, there are several
options. First is the straight land lease, where land is leased to a private investor (at a very nominal
rate), who develops a hangar facility on that land. Usually, 20 years or longer are permitted with
such a lease to allow the investor to recoup the useful life out of the hangar investment. Many such
leases have reversion clauses that transfer ownership of the hangar to the Airport Sponsor after the
term of the lease. The Sponsor then has the ability to charge market prices and use the money from
the hangars to support Airport operations.
Another method of encouraging private hangar development is to seek aircraft hangar
condominium developers that would be willing to lease land on the Airport for such development.
Generally, these leases are very long (up to 40 years), and aircraft hangars are can be bought and
sold by their owners similar to residential condominium ownership. The cost of these hangars often
ends up much higher than rental units, since there are monthly “maintenance” fees in addition to
mortgage payments and property taxes. Often, a market study must be completed by the developer
to determine whether or not sufficient demand exists in the area to support these higher priced
facilities. At high-demand airports where condominium hangars have been developed, the financial
return to the Airport sponsor has been good, sometimes netting up to $10,000 per acre in annual
fees. With the current cost and price structure at New Castle Airport, condominium developments
with this type of yield may be possible.
R.A. Wiedemann & Associates, Inc., in association with
Delta Airport Consultants, Inc.
53
New Castle Airport
Draft Business Plan
December, 2005
A third creative method of encouraging private investment in aircraft hangars provides for
immediate ownership of hangars by the public sponsor, thereby eliminating property taxes for the
private user. A long-term flat lease (20 years or more) permits the developer to get full value of the
investment back prior to reversion to airport sponsor use. Since the airport sponsor owns the hangar,
at the end of the lease, it can operate the facility and charge market rents and receive a steady stream
of revenue from that time forward. By foregoing any tax revenue from the hangars for over 20
years, DRBA provides investment incentives to the private investor. In the long term, revenue
streams from the hangars will revert to the Authority, strengthening its financial performance and
long-term viability. Thus, it is recommended that:
If private investment is desired, hangar construction should be encouraged
through tax and lease agreement incentives.
Additional/Specialty FBOs
Additional FBOs or Specialty Fixed Base Operators (FBOs) such as paint shops, avionics
repair/installation, airframe modification, helicopter charter, engine overhaul (specific types), etc.
attract clients from an entire multi-state region. Already, Dassault Falcon Jet, Flight Safety
International, and other aviation-related businesses use New Castle Airport. These companies
employ significant numbers of trained workers and provide incomes to local families. Thus, for the
longer term, it is recommended that:
Marketing efforts should be directed toward the attraction of additional
specialty FBOs for the Airport.
It was assumed that at least one new aviation business could be attracted to the Airport within the
next five years. The focus of such an FBO could include:
!
!
!
Large aircraft maintenance/overhaul
Aircraft paint/refurbishment shop
Maintenance for smaller general aviation aircraft market that will be attracted to the
proposed T-hangars at New Castle Airport
Rates and Charges/FBO Agreement Structure
It is important that new agreements include rent escalators that are tied to the CPI or other
inflation index. Current DRBA leases contain these escalators. Thus, it is recommended that:
R.A. Wiedemann & Associates, Inc., in association with
Delta Airport Consultants, Inc.
54
New Castle Airport
Draft Business Plan
December, 2005
Escalator clauses should be included in all lease agreements, tying rent
increases to the CPI or other cost of living index.
It is important to include the new hangars in this category. During the rent-up period (which can
be as long as 2 years) a moratorium on price increases should be observed. After that time, leases
should stipulate the escalation method and terms.
Rates and charges for fuel, hangar space, and tie-down space were examined as a part of the
business plan. All appeared reasonable and competitive for the market in which there is
competition. Although 11 airports were examined, only Northeast Philadelphia, Philadelphia
International, Chester County, Millville, and possibly Summit Airport are actual competitors. The
other facilities are too small to compete for the same services and clientele. The fuel flowage fees
of $0.11 per gallon for signatory users and $0.09 per gallon for FBOs are reasonable and should be
continued. Therefore it is recommended that:
No changes should be made to existing rates and charges for fuel, hangar
space and tie-down space in the near term.
State and Federal Grants
Another area that can help balance the books in terms of overall capital spending at the
Airport involves the efficient use of Federal and State grants. In this regard, a total of $18.9 million
is shown on the Airport Capital Improvement Program for the years 2006-2010. An additional $13.9
million would be required for the airline-related capital projects. Therefore, between $18.4 and
$24.4 million of this requirement will be made up of State and Federal grants.
It is recommended that grants for all eligible projects be sought
from both the FAA and DelDOT.
The key to State contributions of capital will be early coordination with DelDOT on all budget
items. Also of importance will be the minimum $1.0 million annual airline entitlement grant from
FAA for all primary airports (airports with over 10,000 annual enplanements).
Air Cargo Carrier
There have been recommendations over the years that ILG attract an air cargo carrier such
R.A. Wiedemann & Associates, Inc., in association with
Delta Airport Consultants, Inc.
55
New Castle Airport
Draft Business Plan
December, 2005
as FedEx or UPS. These and other smaller air cargo operators haul freight and overnight cargo for
both priority and non-priority packages. For just-in-time inventories, air freight is sometimes used.
This occurred at ILG some years ago when supply chains were crippled by a rail strike. The GM
plant near Wilmington shipped car doors from Dayton directly to ILG for use in keeping the
production line running. These shipments sometimes occurred after midnight, creating noise-related
complaints from neighbors. Unfortunately, late-night operations and air cargo go together. As such,
there is a high public relations price to pay for such service. DRBA is in the best position to judge
whether or not the noise compatibility issue is significant enough to eliminate consideration of air
cargo service.
In addition to noise issues, there are significant facility considerations. That is, a large air
cargo operation needs ground facilities for handling, sorting, and transitioning the cargo to ground
or air mode. Those facility options may have existed if the Air National Guard facility was available
for other development. However, that option is not in play and it would be difficult to locate such
a facility on the Airport in addition to a new passenger terminal area. For these reasons, it is
recommended that:
Air cargo operations should not be sought unless significant community
support is forthcoming and space becomes available on the Airfield.
R.A. Wiedemann & Associates, Inc., in association with
Delta Airport Consultants, Inc.
56
New Castle Airport
Draft Business Plan
8.
December, 2005
SUMMARY OF BUSINESS PLAN RECOMMENDATIONS
NUMBER OF RECOMMENDATIONS HAVE BEEN MADE as a part of this business plan study, all
A
with the goal of improving financial performance at the Airport and increasing economic
development and employment in the area. The recommended plan of action from this report
rests on three primary strategic initiatives:
1)
Attraction of Low Fare Airline: The attraction of JetBlue to ILG is a major
component of this business plan. Low fare service at ILG can compete with other
low fare carriers at PHL and BWI. In addition, the development of airline service
at ILG is projected to serve more than 275,000 air travelers each year. An added
benefit to DRBA is that revenues from airline operations at ILG would more than
double the current revenues within five years. Overall employment and economic
development will increase as a result of airline service.
2)
Attraction of More Corporate Aviation: The current vacancies in corporate hangar
facilities requires marketing attention. By filling the existing vacant hangars, an
additional $150,000 could be added to the Airport’s revenues. As a Part 139
certified airport, ILG is ideal for any corporate aviation operator that desires allweather capability. Expanded marketing is a key to promoting ILG to corporate
aviation interests.
3)
Clientele Diversification: For some time, ILG has focused on the corporate aviation
market as the primary source of revenue for the Airport. One downside to this policy
is the impact of a sluggish corporate aviation market on the Airport’s revenue base.
In this regard, the loss of 3 or 4 tenants can negatively impact overall revenues at the
Airport. Thus, it is recommended that a diversified client base be targeted by DRBA.
This would include the attraction of more specialty FBOs, smaller general aviation
tenants, and of course, the airline.
Specific recommendations by timeframe are as follows:
Immediate
!
1st Priority - Attract Low Fare Airline: DRBA should seek to attract a low fare
airline to ILG.
A high-end presentation should be developed for use in attracting JetBlue to
ILG, including feasibility study, video, and PowerPoint.
nd
!
2 Priority - Attract More Corporate Aviation: Corporate aviation clients should
be marketed directly by the DRBA or through the use of an industry “insider.”
!
3rd Priority - Federal & State Grants: It is recommended that grants for all eligible
projects be sought from both the FAA and DelDOT. Coordination with DelDOT
should be completed well in advance of the need for funding.
R.A. Wiedemann & Associates, Inc., in association with
Delta Airport Consultants, Inc.
57
New Castle Airport
Draft Business Plan
December, 2005
1/2006-6/2007
!
1st Priority - Prepare Airport Facilities: If an airline is attracted to ILG, terminal and
other airline-related facilities should be prepared or developed to accommodate the
new service.
Retrofit existing terminal building to accommodate start-up airline service.
Expand parking area at the existing terminal to support airline service
!
2nd Priority - Marketing for Airline Service: If airline service occurs, additional
money should be budgeted for marketing activities related to the new service.
New Castle Airport should be renamed to convey its regional significance
and new airline market reach.
!
3rd Priority - Attract Specialty FBOs: Marketing efforts should be directed toward
the attraction of additional specialty FBOs for the Airport.
!
4th Priority - GA Hangars: DRBA should examine the possibility of developing
additional T-hangars to attract smaller GA users and help diversify its revenue base.
DRBA should seek additional FAA grant money to develop hangars.
If private investment is desired, hangar construction should be encouraged
through tax and lease agreement incentives.
7/2007-12/2011
!
1st Priority - Prepare Airport Facilities: If airline service looks to be long-term,
begin construction of a new terminal building and parking area. This should be
completed by 2009.
Other Items:
!
Accounting: No changes in the system of accounts are recommended at this time.
!
Rates & Charges: No changes except for CPI adjustments should be made to
existing rates and charges for fuel, hangar space and tie-down space in the near term.
!
Air Cargo Operations: Air cargo operations should not be sought unless significant
community support is forthcoming and space becomes available on the Airfield.
When the enhanced operating revenue forecast is compared to the associated operating
expenses, the new net operating revenues for the Airport can be predicted:
!
!
!
!
!
!
2006
2007
2008
2009
2010
2011
Operating
Expenses
$2,467,100
$3,729,600
$3,715,100
$3,614,700
$3,517,000
$3,408,500
Operating
Revenues
$3,819,200
$5,322,200
$7,070,200
$8,160,700
$8,766,700
$9,134,300
Net Operating Revenues
$1,352,100
$1,592,600
$3,355,100
$4,546,000
$5,249,700
$5,725,800
Comparison of the enhanced forecasts of revenues and expenses show the Airport moving from
$1.35 million to a steadily increasing revenue surplus. Key to this improving financial performance
is the development of scheduled airline service at the Airport, the attraction of more corporate
R.A. Wiedemann & Associates, Inc., in association with
Delta Airport Consultants, Inc.
58
New Castle Airport
Draft Business Plan
December, 2005
aviation, and diversification of Airport clientele
If the annual local capital expenditures and debt service are included with the operating
expenses, and the primary airport entitlement funding is added to the enhanced operating revenue
projection, the following projection of total net revenues can be made:
!
!
!
!
!
!
2006
2007
2008
2009
2010
2011
Capital Costs
& Expenses
$3,228,200
$4,170,300
$6,551,300
$6,292,000
$6,376,500
$6,411,000
Entitlement $ +
Op. Revenues
$3,819,200
$6,322,200
$8,070,000
$9,188,500
$9,874,000
$10,501,600
Net Revenues
$ 591,000
$2,151,800
$1,518,700
$2,896,500
$3,497,500
$4,090,600
As shown, the Airport will still show positive net revenues even when the local share capital
development costs and the principal debt retirement payments are included in the expenses.
8.1
Timetable and Trigger Points
Table 20 presents a timetable and listing of trigger points for implementation of the
recommended plan, grouped by type of action (administrative, marketing, etc.).
Table 20 - Action Plan Trigger Points: New Castle Airport
Action
Description
Trigger Point
Timeframe
System of Accounts
No changes to current system of accounts.
Immediate
Immediate
Allocate Marketing
Budget
Allocate money toward marketing and
implementation of new airline service.
As soon as
practical
1/2006
Branding
Rename Airport to recognize its regional market.
Immediate
Immediate
Market Airline
Develop high-end marketing program to approach
and market JetBlue or other low fare carrier.
Immediate
1/2006
Market Corporate
Aviation
Begin direct marketing of corporate aviation either After brochures/
video become
by the Authority or combination of common
available
interest entities.
Market Specialty FBO
Attract new specialty FBO or aviation business to
the Airport.
Administrative
Marketing
2/2006
After brochures 1/2007
become available
Airport Development
Existing Terminal
Area
Retrofit existing terminal building to accommodate As soon as an
start-up airline service. Expand existing parking to airline is signed
to serve ILG
accommodate additional automobiles.
R.A. Wiedemann & Associates, Inc., in association with
Delta Airport Consultants, Inc.
6/2006
59
New Castle Airport
Draft Business Plan
December, 2005
Table 20 - Action Plan Trigger Points: New Castle Airport
Action
Description
Trigger Point
Timeframe
New Terminal Area
Construct new terminal building and auto parking
area.
As capital
improvement
money becomes
available.
1/2008
Aircraft Hangars
Hangar construction should be undertaken as
demand warrants. Either grant money debt
financing or private investment should be used.
Upon securing
enough firm
commitments
from based
aircraft owners
6/2008
Rates & Charges
State/Federal Grants
Apply for eligible grants and close out open grants As soon as
permitted by project completion.
practical
Immediate
Hangar and Fuel Fees
No changes to these fees are needed except annual Upon contract
CPI or other inflation index escalation.
renewal.
6/2006
R.A. Wiedemann & Associates, Inc., in association with
Delta Airport Consultants, Inc.
60
New Castle Airport
Draft Business Plan
9.
December, 2005
ECONOMIC IMPACT ASSESSMENT
HE PURPOSE OF THIS SECTION IS TO quantify the economic impact and contribution of New
Castle Airport to the local economy. By showing the current and future jobs, income, and
total economic output, acceptance and support for Airport projects may be generated. This
analysis demonstrates the economic effects of Airport and aviation use within northern Delaware
by tracing the movement of expenditures through the various economic sectors until the money is
exported incrementally from the New Castle County through purchases of outside goods and
services. In particular, the analysis highlights the economic impacts that airline service would have
on northern Delaware’s economy.
T
9.1
Goals and Methods of Analysis
The goal of this analysis was to quantify the following economic aspects of New Castle
Airport for the existing situation:
!
!
!
!
!
Direct Spending: On-airport and off-airport spending on employment, operations,
and capital projects. Associated with providers and users of airport services. Also
includes rental car, hotel, and restaurant spending.
Induced Benefits: Impacts created by the successive rounds of spending in the local
economy until the original direct or indirect impact has been incrementally exported
from the local area.
Jobs and Income: Income generated by aviation and the number of jobs supported
by the Airport.
Total Output in Dollars: The combined impacts of direct, indirect, and induced
spending.
Taxes: Tax revenue contribution of the Airport and aviation industry to local and
State units of government in Delaware.
To accomplish this goal, the study utilized the following simplified process and methodology:
!
!
!
Collect data on direct impacts from previous survey work and new business plan
data.
Apply regional multipliers to direct impact numbers.
Describe non-monetary impacts of New Castle Airport and local aviation.
One measure of the economic significance of the Airport involves the number and size of
companies that base their aircraft or rent facilities at ILG. In this regard, the Airport serves clients
such as Boeing Defense & Space Group, ITT Industries, DuPont, Flight Safety International, W.L.
Gore, Campbells Soup Company, Penske Jet, Overhead Door, CitiCorp North America, and many
others. In addition, the Airport supports significant military training and fueling operations from
the National Guard units on the field.
R.A. Wiedemann & Associates, Inc., in association with
Delta Airport Consultants, Inc.
61
New Castle Airport
Draft Business Plan
9.2
December, 2005
Results of Analysis
The economic impact methodology first identified the direct spending and employment at
New Castle Airport (called direct impacts) and included the direct spending at off-airport sites such
as hotels and restaurants. Armed with this information, regional respending multipliers derived from
IMPLAN software were applied to the data to determine the multiplied impacts of direct and indirect
spending (called induced impacts). Table 21 presents a summary of New Castle Airport’s direct,
indirect, and induced economic impacts.
Table 21 - Direct, Indirect, and Induced Economic Impacts
Item
Estimated Current
Impacts
Year 2011
Additional Impacts
Total Year 2011
Impacts of Rec. Plan
Airport Related Income*
$91,128,900
$6,157,200
$97,286,100
Airport Related Expenditures (Total
including capital costs)
$154,487,500
$18,860,400
$173,347,900
Airport Related Employment (Total
including capital spending)
1,819
218
2,037
$71,462,600
$8,150,400
$79,613,000
905
76
981
Estimated State/Local Taxes
$9,253,700
$1,812,400
$11,066,100
Grand Total Dollar Impacts
$225,950,100
$27,010,800
$252,960,900
Grand Total Income Impacts*
$120,432,000
$8,973,700
$129,405,700
2,724
294
3,018
Direct Impacts
Induced Impacts**
Induced from Direct Spending
Total Induced Employment Impacts
Grand Total Employment Impacts
* Includes indirect incomes from visitor spending and capital development. This is a subset of the total impacts and is
already included in the output number.
** Source: IMPLAN Software - Developed originally by the US Forest Service, it is a comprehensive impact system
built on the framework of input-output and social accounting methodology.
As shown, New Castle Airport currently supports over 2,700 jobs, $120.4 million in
incomes, and almost $226.0 million in total economic output. The aviation activity at the Airport
generates over $9.25 million in State and local taxes. If the recommended plan is implemented,
these impacts will increase in the future by almost 300 jobs and $27 million, annually.
9.3
Non-monetary Impacts
There are a number of non-monetary benefits of aviation that have not been mentioned in
this analysis. Some of these benefits include:
!
Transportation Benefits: Defined as the time saved and cost avoided by travelers
who use airports rather than the next best alternative. New Castle Airport would
R.A. Wiedemann & Associates, Inc., in association with
Delta Airport Consultants, Inc.
62
New Castle Airport
Draft Business Plan
!
!
!
December, 2005
provide more convenient access to the National Air Transportation System than outof-state airports such as PHL and BWI.
Stimulation of Business: Airports have been shown in other studies to be an
important factor in the attraction and siting of new businesses in a community. This
is particularly true for businesses with over 100 employees.
Aeromedical Evacuation: New Castle Airport serves as a base for aeromedical
evacuation. This life-saving function has intrinsic value that often cannot be
adequately quantified.
Recreation: Roughly 50 percent of commercial airline travel and 60 percent of
general aviation travel is for recreational purposes. This includes the valuable tourist
trade which brings economic activity to the study region.
All of the above factors point to a value of an airport that is not easily quantified. The
impacts that were estimated within the body of this report - direct and induced - are only one facet
of the overall picture. New Castle Airport enjoys a significance that is much larger than these
numbers can estimate. It is part of a scarce resource that needs support, protection, and appreciation
from all the citizens that benefit from its operation, both directly and indirectly.
R.A. Wiedemann & Associates, Inc., in association with
Delta Airport Consultants, Inc.
63
Appendix A:
Top 50 O&D
Appendix A - Top 50 Origin & Destination Passengers PHL, BWI, ABE
PHL
Rank
BWI
Market
Passengers
Rank
1
MCO ORLANDO/ FL
1,080,510
1
2
CHI CHICAGO/ IL
980,710
2
3
FLI FL SOUTH/ FL
833,020
4
LBO MAJOR LOS ANGELES/ CA
5
6
Market
ABE
Passengers
Rank
Market
Passengers
MCO ORLANDO/ FL
771,920
1
MCO ORLANDO/ FL
16,080
CHI CHICAGO/ IL
668,530
2
FLI FL SOUTH/ FL
9,800
3
LBO MAJOR LOS ANGELES/ CA
643,620
3
ATL ATLANTA/ GEORGIA
7,420
802,470
4
FLI FL SOUTH/ FL
635,320
4
CHI CHICAGO/ IL
7,250
ATL ATLANTA/ GA
775,050
5
PVD PROVIDENCE/ RI
559,460
5
TPA TAMPA(INTL)/ FL
6,730
BOS BOSTON/ MA
694,560
6
ATL ATLANTA/ GA
551,270
6
CLE CLEVELAND/ OH
5,990
7
LAS LAS VEGAS/ NV
573,640
7
LAS LAS VEGAS/ NV
497,580
7
PIT PITTSBURGH/ PA
5,820
8
SOS MAJOR SAN FRANCISCO
567,220
8
MHT MANCHESTER/ NH
492,500
8
DTT DETROIT/ MI
5,410
9
10
TPA TAMPA(INTL)/ FL
DAS DALLAS(ALL AIRPORTS)/TX
525,800
404,830
9
10
BOS BOSTON/ MA
DAS DALLAS(ALL AIRPORTS)/TX
487,380
481,930
9
10
CLT CHARLOTTE/ N. C.
LAS LAS VEGAS/ NV
4,210
3,750
11
RDU RALEIGH-DURHAM/N. C.
370,050
11
TPA TAMPA(INTL)/ FL
471,480
11
CVG CINCINNATI/ OH
3,630
12
PHX PHOENIX/ AZ
360,250
12
SOS MAJOR SAN FRANCISCO
408,190
12
LBO MAJOR LOS ANGELES/ CA
3,500
13
DEN DENVER/ CO
332,790
13
PHX PHOENIX/ AZ
392,090
13
DAS DALLAS(ALL AIRPORTS)/TX
3,200
14
HOS HOUSTON(HOU+IAH)/ TX
325,760
14
HOS HOUSTON(HOU+IAH)/ TX
381,500
14
SOS MAJOR SAN FRANCISCO
3,120
3,040
15
PBI WEST PALM BEACH/ FL
314,770
15
CLE CLEVELAND/ OH
329,870
15
RSW FORT MYERS/ FL
16
PVD PROVIDENCE/ RI
265,380
16
BNA NASHVILLE/ TN
327,950
16
PBI WEST PALM BEACH/ FL
2,570
17
SJU SAN JUAN/ PUERTO RICO
259,880
17
BDL HARTFORD(INTL)/CT
320,860
17
PHX PHOENIX/ AZ
2,500
18
MSP MINNEAPOLIS-ST. PAUL/MN
252,320
18
SAN SAN DIEGO/ CA
317,250
18
MSP MINNEAPOLIS-ST. PAUL/MN
2,140
19
SAN SAN DIEGO/ CA
251,310
19
STL ST. LOUIS/ MO
294,820
19
DEN DENVER/ CO
2,130
20
DTT DETROIT/ MI
233,760
20
DEN DENVER/ CO
255,180
20
HOS HOUSTON(HOU+IAH)/ TX
2,130
21
SFF SEATTLE - ALL AIRPORTS
215,010
21
BUF BUFFALO/ NY
253,020
21
MSY NEW ORLEANS/ LA
2,130
22
MSY NEW ORLEANS/ LA
209,730
22
MSY NEW ORLEANS/ LA
242,760
22
STL ST. LOUIS/ MO
1,900
23
MHT MANCHESTER/ NH
189,590
23
ALB ALBANY/ NY
210,590
23
BNA NASHVILLE/ TN
1,730
1,700
24
STL ST. LOUIS/ MO
186,440
24
RDU RALEIGH-DURHAM/N. C.
206,630
24
SAN SAN DIEGO/ CA
25
RSW FORT MYERS/ FL
182,460
25
ISP LONG ISLAND/ NY
203,900
25
BOS BOSTON/ MA
1,630
26
JAX JACKSONVILLE/ FL
178,150
26
SDF LOUISVILLE/ KY
203,290
26
MCI KANSAS CITY/ MO
1,580
27
PIT PITTSBURGH/ PA
175,400
27
SFF SEATTLE - ALL AIRPORTS
199,780
27
1,570
1,560
1,510
28
BNA NASHVILLE/ TN
151,480
28
JAX JACKSONVILLE/ FL
192,960
28
GSO GREENSBORO-HIGH POINT/
N.CAROL
IND INPOLIS/ IN
29
CLT CHARLOTTE/ N. C.
146,440
29
DTT DETROIT/ MI
191,190
29
CMH COLUMBUS/ OH
30
MCI KANSAS CITY/ MO
137,710
30
PBI WEST PALM BEACH/ FL
190,170
30
JAX JACKSONVILLE/ FL
1,420
31
IND INPOLIS/ IN
136,300
31
SAT SAN ANTONIO/ TX
186,850
31
AUS AUSTIN/ TX
1,230
32
SLC SALT LAKE CITY/ UTAH
114,140
32
CMH COLUMBUS/ OH
181,680
32
SJU SAN JUAN/ PUERTO RICO
1,230
33
CVG CINCINNATI/ OH
110,120
33
MCI KANSAS CITY/ MO
171,360
33
GSP GREENVILLESPARTANBURG/S.C./US
1,220
Appendix A - Top 50 Origin & Destination Passengers PHL, BWI, ABE
34
MKE MILWAUKEE/ WI
108,180
34
AUS AUSTIN/ TX
167,750
34
SFF SEATTLE - ALL AIRPORTS
35
CLE CLEVELAND/ OH
96,980
35
MSP MINNEAPOLIS-ST. PAUL/MN
159,560
35
RDU RALEIGH-DURHAM/N. C.
1,190
1,150
36
CMH COLUMBUS/ OH
94,860
36
SLC SALT LAKE CITY/ UTAH
156,880
36
SRQ SARASOTA-BRADENTON/FL
1,140
37
MEM MEMPHIS/ TN
83,480
37
BHM BIRMINGHAM/ AL
148,800
37
SAT SAN ANTONIO/ TX
1,100
38
SAT SAN ANTONIO/ TX
79,950
38
IND INPOLIS/ IN
144,020
38
SDF LOUISVILLE/ KY
1,100
39
PDX PORTLAND/ OR
75,700
39
ABQ ALBUQUERQUE/ NM
119,970
39
CHS CHARLESTON/ S. C.
1,090
40
AUS AUSTIN/ TX
74,260
40
PDX PORTLAND/ OR
118,770
40
SLC SALT LAKE CITY/ UTAH
1,060
41
BDL HARTFORD(INTL)/CT
65,890
41
RSW FORT MYERS/ FL
109,690
41
BHM BIRMINGHAM/ AL
980
42
ABQ ALBUQUERQUE/ NM
61,760
42
ROC ROCHESTER/ NY
101,410
42
DAY DAYTON/ OH
950
43
STT ST. THOMAS/ VIRGIN
ISLANDS
GSO GREENSBORO-HIGH POINT/
N.CAROL
SMF SACRAMENTO/ CA
60,700
43
SMF SACRAMENTO/ CA
94,810
43
MKE MILWAUKEE/ WI
950
60,050
44
MKE MILWAUKEE/ WI
94,570
44
DAB DAYTONA BEACH/ FL
920
58,950
45
ORF NORFOLK/ VIRGINIA
88,210
45
SAV SAVANNAH/ GA
920
46
SAV SAVANNAH/ GA
55,680
46
DAY DAYTON/ OH
87,380
46
HNI MAJOR HAWAII
880
47
DAY DAYTON/ OH
54,860
47
HNI MAJOR HAWAII
85,010
47
TYS KNOXVILLE/ TN
830
44
45
48
HNI MAJOR HAWAII
53,950
48
CLT CHARLOTTE/ N. C.
78,870
48
PDX PORTLAND/ OR
750
49
CHS CHARLESTON/ S. C.
50,340
49
TUS TUCSON/ AZ
78,430
49
GRR GRAND RAPIDS/ MI
700
50
SDF LOUISVILLE/ KY
49,800
50
SJU SAN JUAN/ PUERTO RICO
68,210
50
SBN SOUTH BEND/ IN
700
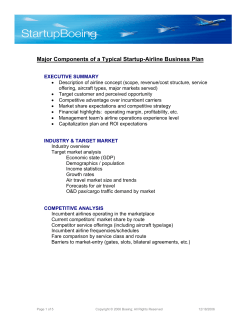


© Copyright 2026