
Summary Table of Contents 2004 Financial Requirements Presentation ................................................................1
TABLE OF CONTENTS
Internal Support Services
Summary
Table of Contents
2004 Financial Requirements Presentation ................................................................1
Executive and Council
Table of Contents
Background .................................................................................................................1
Description of Current Services..................................................................................2
Trends and Issues........................................................................................................5
Mandate, Objectives and Actions ..............................................................................6
Monitoring and Measuring the Service Strategy Business Plan ................................8
2004 Financial Requirements Presentation ..............................................................11
Human Resources
Table of Contents
Background .................................................................................................................1
Description of Current Services..................................................................................2
Trends and Issues........................................................................................................6
Mandate, Objectives and Actions ..............................................................................7
Monitoring and Measuring the Service Strategy Business Plan ..............................10
2004 Financial Requirements Presentation ..............................................................14
Information Technology
Table of Contents
Background .................................................................................................................1
Description of Current Services..................................................................................2
Trends and Issues........................................................................................................6
Mandate, Objectives and Actions ..............................................................................8
Monitoring and Measuring the Service Strategy Business Plan ..............................11
2004 Financial Requirements Presentation ..............................................................14
Corporate Services
Table of Contents
Background .................................................................................................................1
Description of Current Services..................................................................................2
Trends and Issues........................................................................................................6
Mandate, Objectives and Actions ..............................................................................7
Monitoring and Measuring the Service Strategy Business Plan ................................9
2004 Financial Requirements Presentation ..............................................................15
2 0 0 4
S E R V I C E
S T R A T E G Y
B U S I N E S S
P L A N
Finance
Table of Contents
Background .................................................................................................................1
Description of Current Services..................................................................................2
Trends and Issues........................................................................................................7
Mandate, Objectives and Actions ..............................................................................9
Monitoring and Measuring the Service Strategy Business Plan ..............................11
2004 Financial Requirements Presentation ..............................................................20
2 0 0 4
S E R V I C E
S T R A T E G Y
B U S I N E S S
P L A N
INTERNAL SUPPORT
SERVICES SUMMARY
I N T E R N A L S U P P O R T S E R V I C E S S U M M A R Y
2 0 0 4 S E R V I C E S T R A T E G Y / B U S I N E S S P L A N
TABLE OF CONTENTS
Sections A to E (inclusive) of the standard Service Strategy Business Plan are not applicable to this
summary.
F.
2004 Financial Requirements Presentation
F.1
Current Budget Introductory Comments/Analysis ..........................................................1
F.2
Financial Structure Chart – Current Budget....................................................................2
F.3
2004 Current Budget ...........................................................................................................3
I N T E R N A L S U P P O R T S E R V I C E S S U M M A R Y
2 0 0 4 S E R V I C E S T R A T E G Y / B U S I N E S S P L A N
F.
2004 Financial Requirements Presentation
F.1
Current Budget Introductory Comments/Analysis
In accordance with the Region’s overall support of the provincially mandated Ontario
Municipal CAO’s Benchmarking Initiative (OMBI) protocols and its commitment to an
enhanced performance management accountability framework, all Internal Support
providers are required to allocate costs to the core programs for the services they provide.
The internal charge process also forces a level of discipline on services providers, whereby
they must develop efficiency and effectiveness measures as well as identify appropriate
benchmarks to all service users in order to justify both costs and service levels. While the
internal charge process continues to be refined, it has proven effective in monitoring and
controlling support costs.
For 2004, through Fees & Services Charges and the Internal Charge Process, Internal
Support Services has effectively allocated $78.2 million or 79.28 per cent of all costs to
core program areas. The remaining $20.4 million or 20.72 per cent represents “Corporate”
overhead costs which have not been apportioned out to specific program managers given
these costs are not “controllable” by program managers. The “Corporate” overhead
primarily represents governance (i.e. Council, Chair and CAO) and fiscal controllership
(i.e. internal audit) costs. These costs are then attributed to both the property tax and utility
rate supported non program areas at 60% and 40% respectively. The 2004 Current Budget
does not net to zero due to the budget reduction incorporated into the 2004 Current Budget
– Proposed Approval Council Report.
During 2004, Finance will continue to review the options available to the Corporation in
improving this important facet of the business planning process by refining and enhancing
our Activity Based Costing (ABC), Corporate Performance Measurement (CPM) and
Benchmarking Initiatives. Staff will also continue to be involved in a number of joint
initiatives with the province, including the Regional CAO’s group, the OMBI and the
Canadian Institute of Chartered Accountants (CICA). Feedback from all initiatives will be
incorporated into the Corporation’s business plan.
This year the Finance Department has amalgamated all divisions into one Service Strategy
Business Plan (SSBP). The People, Information and Technology (PIT) department
produces a separate SSBP for each division (Information Technology (IT) and Human
Resources (HR)). The Office of the Commissioner and the PIT Business Unit report with
HR.
Property and Facilities Asset Management and Public Works Services report with the core
programs Housing and Property and Public Works Services respectively due to their close
relationships. This allows these services to directly connect with the appropriate SSBP.
I N T E R N A L S U P P O R T S E R V I C E S S U M M A R Y
2 0 0 4 S E R V I C E S T R A T E G Y / B U S I N E S S P L A N
1
F.2 Financial Structure Chart – Current Budget
INTERNAL SUPPORT SERVICES
CORPORCP
Executive & Council
EXECSECP
Chief Admin Officer
GC01001
Council & Chair
ADMEXECP
Corporate Services
CORPADCP
Finance Services
FINANCCP
Public Works Services
PWORKSCP
Property & Facility Assets Mgt
HSGFACCP
People & Info Tech Systems
PEOITSCP
PIT Business Unit
GC19100
PIT Commissioner’s Office
GC19000
Human Resources
CORPERCP
Information Technology
INFTECCP
I N T E R N A L S U P P O R T S E R V I C E S S U M M A R Y
2 0 0 4 S E R V I C E S T R A T E G Y / B U S I N E S S P L A N
2
F.3 2004 Current Budget
1. Activity Analysis
Budgeted Net Cost
Change
2004
from 2003
Executive & Council
Human Resources
Information Technology
Corporate Services
Finance
Public Works Services
Property & Facilities Asset Mgmt
3,493,355
1,024,399
3,399,332
2,517,688
10,004,694
-
328,697
(19,309)
(351,987)
259,840
118,235
110,000
(38,026)
Net Program Cost
20,439,468
407,450
Overhead Allocations to:
Tax Non Program
Rate Non Program
12,368,688
8,245,790
826,777
551,184
$
2. Account Analysis
(175,010)
3.
10.27
3.01
10.00
7.40
29.43
$
34,366,703
51,143,557
13,113,024
Gross Program Cost
60.12
0.71
(0.14)
(1.34)
0.58
(0.44)
0.33
(0.11)
$
(0.40)
$ (970,511)
Budgeted Gross & Net Cost
Change
2004
from 2003
Goods & Services
Salaries & Wages
Capital Financing
Budgeted Net Cost/Unit
Change
2004
from 2003
5,453,280
9,263,531
(345,641)
Budgeted Units of Service
*Change
2004
from 2003
Brampton
Caledon
Mississauga
115,000
17,000
208,000
6,000
3,000
98,623,284
14,371,170 Total Households
340,000
9,000
Fees, Charges & Other
78,183,816
13,963,720
Net Program Cost
Overhead Allocations to:
20,439,468
407,450
Tax Non Program
Rate Non Program
12,368,688
8,245,790
$ (175,010)
826,777
551,184
$ (970,511)
* Due to a policy change, household forecasts
previously forecast to the nearest hundred are ow
forecast to the nearest thousand
I N T E R N A L S U P P O R T S E R V I C E S S U M M A R Y
2 0 0 4 S E R V I C E S T R A T E G Y / B U S I N E S S P L A N
3
EXECUTIVE
AND
COUNCIL
2 0 0 4
S E R V I C E
E X E C U T I V E A N D C O U N C I L
S T R A T E G Y B U S I N E S S P L A N
TABLE OF CONTENTS
A. Background
A.1
Preparing the Service Strategy Business Plan .................................................................. 1
A.2
Key Contacts ........................................................................................................................ 1
A.3
Additional Information ....................................................................................................... 1
B. Description of Current Services
B.1
Program Location Map ....................................................................................................... 2
B.2
Profile of Current Services.................................................................................................. 2
B.3
Description of Clients/Customers....................................................................................... 2
B.4
Description of Suppliers, Partners and Stakeholders....................................................... 3
B.5
Overall Organization Structure and Staffing ................................................................... 4
B.6
Significant Recent Activities/Initiatives ............................................................................. 4
C. Trends and Issues
C.1
Emerging Trends ................................................................................................................. 5
C.2
Key Strategic Issues ............................................................................................................. 5
D. Mandate, Objectives and Actions
D.1
Mandate and Objectives...................................................................................................... 6
D.2
Objectives and Actions ........................................................................................................ 6
D.3
Strategic Plan Connection................................................................................................... 7
2 0 0 4
S E R V I C E
E X E C U T I V E A N D C O U N C I L
S T R A T E G Y B U S I N E S S P L A N
TABLE OF CONTENTS (Cont’d)
D.4 Service Principles (optional) ................................................................................................ 7
E. Monitoring and Measuring the Service Strategy Business Plan
E.1 Objectives and Outcomes..................................................................................................... 8
E.2 Performance Targets .............................................................................................................9
E.3 Corporate Performance Measurement and Benchmarking (not applicable)
F.
2004 Financial Requirements Presentation
F.1
Current Budget Introductory Comments/Analysis .......................................................... 11
F.2
Financial Structure Chart – Current Budget.................................................................... 11
F.3
2004 Current Budget ...........................................................................................................12
For F.4 Capital Budget & Forecast Introductory Comments/Analysis and F.5 2004 Capital Budget
& Forecast to 2013 Reports please refer to the Internal Support – Executive and Council section of
the 2004 Capital Budget and 2005-2013 Capital Forecast document.
2 0 0 4
S E R V I C E
E X E C U T I V E A N D C O U N C I L
S T R A T E G Y B U S I N E S S P L A N
A.
Background
A.1 Preparing the Service Strategy Business Plan (SSBP)
Regional Council does not require a Service Strategy therefore sections A.1 to E.3 will only
talk about the Executive Office.
All members of the Executive Office team participated in the development of the SSBP.
Team members included:
Regional Chair
Chief Administrative Officer (CAO)
Director, Strategic Initiatives
Executive Assistant to Regional Chair
CAO’s Policy/Program Support Analyst
Executive Administrative Assistant to the Chair
Executive Administrative Assistant to the CAO
Executive Clerk
A.2 Key Contacts
Emil Kolb, Regional Chair
905-791-7800, ext. 4310
Roger Maloney, Chief Administrative Officer (CAO)
905-791-7800, ext. 4312
[email protected]
Janine Elias Joukema, Director, Strategic Initiatives
905-791-7800, ext. 4961
[email protected]
A.3 Additional Information
This is the second SSBP for the Executive Office.
2 0 0 4
S E R V I C E
E X E C U T I V E A N D C O U N C I L
S T R A T E G Y B U S I N E S S P L A N
1
B.
Description of Current Services
B.1 Program Location Map
The Region of Peel’s Executive Office, which consists of the Office of the Chair and the
Office of the CAO, is located at 10 Peel Centre Drive in Brampton.
B.2 Profile of Current Services
Council Relations
Various activities are required in order to ensure successful Council relations, including:
agendas, reports and pending items management, Councillor inquiries and administrative
support, issues management, citizen inquiries and co-ordination of departmental
information.
Employee Relations
This service involves proactively managing, working with and supporting Regional
employees through such activities as the CAO Advisory Committee, Together We’re Better
Awards Program, United Way Employee Campaign and other employee-oriented events
including “Ask Roger” and measuring employee satisfaction.
Corporate Policy/Projects/Initiatives
The Executive Office works with, manages or supports various groups. Externally this
includes: Peel Regional Police, United Way of Peel Region, and Ontario Municipal
Benchmarking Initiative (OMBI), Members of Parliament (MP) and Members of Provincial
Parliament (MPP) and other Regions. Internally, the Executive Office’s involvement is
evident in key initiatives including: the Strategic Plan, Excellence and Continuous
Improvement, inter-departmental projects and corporate administrative policies
Administrative Management
Regular Executive Management Team (EMT) meetings, performance management,
departmental reorganizations, Executive Office Team functions, information management
and general administration are examples of what is included in this service area.
B.3 Description of Clients/Customers
Taxpayers
The citizens who live and work in Peel are ultimately the clients served by the various
supports and services provided by the Executive Office.
2 0 0 4
S E R V I C E
E X E C U T I V E A N D C O U N C I L
S T R A T E G Y B U S I N E S S P L A N
2
Regional Council
The 22 member Regional Council includes the Regional Chair and Regional Councillors
from the City of Mississauga, City of Brampton and the Town of Caledon.
Regional Departments
Excluding the Executive Office, there are eight Regional departments: Corporate Services,
Finance, Health, Housing and Property, People Information and Technology, Planning,
Public Works and Social Services.
Regional Employees
Region of Peel’s diverse workforce has approximately 3,000 employees who deliver
programs and services to more than one million Peel citizens.
B.4 Description of Suppliers, Partners and Stakeholders
Suppliers
Where appropriate, the Executive Office will contract out services to support
implementation of strategic, political and administrative initiatives.
Partners
Area Municipalities, Province, Regional CAOs and Chairs, Peel Regional Police,
Boards of Trade and Chamber of Commerce, United Way of Peel Region, Greater
Toronto Airports Authority (GTAA), Ontario Municipal Benchmarking Initiative
(OMBI).
Stakeholders
Council, Taxpayers, Employees, Provincial and Federal Government
2 0 0 4
S E R V I C E
E X E C U T I V E A N D C O U N C I L
S T R A T E G Y B U S I N E S S P L A N
3
B.5 Overall Organization Structure and Staffing
Executive Office
Regional Chair
(1)
Chief Administrative Officer
(1)
Director
Strategic Initiatives
(7)
Total Full-time Equivalent (FTE) = 9.0
(reflects Council approved positions only)
Note:
All positions listed have supervisory responsibilities.
( ) Denotes all FTE in the group including the boxed position.
B.6 Significant Recent Activities/Initiatives
•
•
•
•
•
•
•
•
•
•
•
•
Maintained 0 per cent tax rate for Regionally controlled programs for the 13th year
Partnered with the province to host Annual Central Ontario Municipal Conference
Implemented first annual employee driven satisfaction survey Building Employee
Satisfaction Together (BEST) which yielded a 72 per cent response rate
Contributed significantly to the United Way of Peel Region Board
Reviewed Executive Office organizational structure and implemented
recommendations
Established external Policy Advisor’s network
Participated in the organization of the tribute dinner for Chair Kolb in support of
Community Living Mississauga Foundation raising $85,000
Chair Kolb received Queen’s Jubilee Award
Met implementation objectives for excellence and continuous improvement activities
Staff presented at major national and international conferences
Executive Office held first annual Open House
Demonstrated the philosophy of two-way communication through CAO Advisory
Committee, “anonymous electronic mail box directly to the CAO” and “Ask Roger”
2 0 0 4
S E R V I C E
E X E C U T I V E A N D C O U N C I L
S T R A T E G Y B U S I N E S S P L A N
4
C.
Trends and Issues
C.1 Emerging Trends
•
•
•
•
•
•
•
•
•
•
The percentage of Peel’s population speaking a language other than English at home
has increased, and immigration is becoming more important to Peel
Municipalities are raising property tax rates after years of tax freezes to pay for
infrastructure upgrades and to meet the growing demand for human services
Municipalities explore alternative funding mechanisms and revenue sources (i.e.
business sponsorships, share of the gas tax or sales tax)
Citizens are more and more concerned with public security and public health matters
Some municipalities in the Greater Toronto Area (GTA) are focusing on governance
changes as a way of resolving major challenges such as gridlock, waste and urban
sprawl
Increasing pressure from citizens to be transparent and accountable
Citizens demanding services be delivered in a way that meets their needs and citizens
want ongoing, two-way communication to better engage in the governance process
Increase in public/private sector partnerships as a way of doing business
Technology continues to change the way we manage work and deliver services
Signs of a looming labour shortage of skilled workers means well qualified and
experienced staff will be increasingly hard to attract and retain
C.2 Key Strategic Issues
•
•
•
•
•
•
•
Inadequate provincial recognition of the Region’s key political and service delivery
issues
Inadequate provincial and federal funding to support growing service needs
Increasing the awareness and profile of the Region of Peel and its services
Supporting Regional Councillors and encouraging reciprocal and visible support of the
Region
Need to build a sense of Peel citizenry
Proactively managing workload of the Executive Office, including alignment of
resources to priorities
Increasing employee knowledge of the roles and responsibilities of the Executive
Office and Regional Council
2 0 0 4
S E R V I C E
E X E C U T I V E A N D C O U N C I L
S T R A T E G Y B U S I N E S S P L A N
5
D.
Mandate, Objectives and Actions
D.1 Mandate and Objectives
Mandate:
The Executive Office will provide strategic, political and administrative direction and
advice to support the interest of Peel citizens and the employees of the Regional
Municipality of Peel.
Objectives:
1.
To operate an open, accessible office
2.
To champion corporate thinking and initiatives throughout the organization
3.
To lead in the management of the factors that affect our programs and services
4.
To enhance the efficiency and effectiveness of Executive Office work activities
5.
To demonstrate the effectiveness of the Region’s programs and services
D.2 Objectives and Actions
1. To operate an open, accessible office.
1.1 Communicate the roles within and responsibilities of the Executive Office and
Regional Council
1.2 Ensure effective management of departmental events listing for use by Chair and
CAO
1.3 Review and refine customer service standards
1.4 Create an annual opportunity to invite Regional employees to the Executive
Office
1.5 Lead in the demonstration of Regional Values
2. To champion corporate thinking and initiatives throughout the organization.
2.1 Implement the Excellence Framework including key corporate improvements and
the Healthy Workplace recommendations
2.2 Advance the strength and effectiveness of the EMT and Corporate Management
Resource Team (CMRT)
2.3 Develop a process for project management and accountability
2.4 Promote an early warning and “no surprises” concept across all departments with
regard to all programs
2 0 0 4
S E R V I C E
E X E C U T I V E A N D C O U N C I L
S T R A T E G Y B U S I N E S S P L A N
6
3. To lead in the management of the factors that affect our programs and services.
3.1 Develop timely strategies that work towards eliminating GTA Pooling
3.2 Support a competitive environment for business
3.3 Engage Regional Councillors in proactively supporting the Regional Municipality
of Peel
3.4 Establish and facilitate effective relationships with stakeholders and partners
3.5 Identify opportunities to involve Peel Regional Police in Regional events and
activities
4. To enhance the efficiency and effectiveness of Executive Office work activities.
4.1 Streamline current work processes to determine ongoing needs and reduce
duplication
4.2 Proactive management of workload
4.3 Develop a strategy to ensure team skills can fully support Executive Office
functions
5. To demonstrate the effectiveness of the Region’s programs and services.
5.1 Showcase Region of Peel initiatives
5.2 Support participation in external performance measurement initiatives
5.3 Actively seek external recognition and formal accreditation of Region of Peel
programs and services
D.3 Strategic Plan Connection
The objectives and actions in the SSBP are consistent with, and support, the following
Goals in the Region of Peel’s strategic plan, Directions for Success: Investing in Peel’s
Future.
Goal 4: Contribute to a vibrant and diverse regional economy
Goal 5: Be a leader in the provision and co-ordination of Regional services
D.4 Service Principles (Optional)
The Regional Values function as the Executive Office service principles.
2 0 0 4
S E R V I C E
E X E C U T I V E A N D C O U N C I L
S T R A T E G Y B U S I N E S S P L A N
7
E.
Monitoring and Measuring the Service Strategy Business Plan
E.1 Objectives and Outcomes
1.
To operate an open, accessible office.
Increased awareness of the role of Executive Office and Regional Council
•
Recognized as a leader in “walking the talk”
•
Recognize Chair and CAO as interested in and active with departments
•
2.
To champion corporate thinking and initiatives throughout the organization.
Clear understanding of organizational priorities, and related initiatives
•
Alignment of human, financial and technical resources to support priorities
•
3.
To lead in the management of the factors that affect our programs and services.
Recognized as proactive and productive in addressing Regional issues
•
Recognized as taking a partnership approach with key partners and stakeholders
•
4.
To enhance the efficiency and effectiveness of Executive Office work activities.
Effective, value-added work processes
•
Integration and recognition of internal improvement initiatives as a priority
•
Handle
tasks, technical or otherwise, with confidence
•
Increased comfort to learn/train at desk
•
5.
To demonstrate the effectiveness of the Region’s programs and services.
External recognition for Region of Peel as a leader in service delivery,
•
performance measurement and administrative excellence
2 0 0 4
S E R V I C E
E X E C U T I V E A N D C O U N C I L
S T R A T E G Y B U S I N E S S P L A N
8
E.2 Performance Targets
a)
2003
Support the operation of the United Way of Peel Region
Four Regional staff members actively participate on the United Way Board of
•
Directors
2002 United Way employee campaign raised over $167,000, and was one of the
•
top 10 fundraisers in the Region
Funded a Resource Lead Position for the 2002 and 2003 campaign
•
Completed Stewardship Agreement with the United Way of Peel.
•
Strategy for Peel’s Fair Share
Social Services partnered with the United Way to work with the Fair Share Task
•
Force and has brought the issue to the attention of the Minister of Community
and Social Services with the full support of the business community
Excellence Framework, including corporate key improvements
Completed second iteration of SSBP process
•
Created and implement an action plan to act on the results of the BEST survey
•
Developed framework for citizen/client/customer satisfaction and created a
•
glossary of terms and symbols for process mapping efforts
Prepared for second corporate-wide Progressive Excellence Program (PEP)
•
application to the National Quality Institute (NQI)
b)
2004
Region’s Corporate Planning Process
Renew the Region of Peel’s strategic plan
•
Strengthen management and measurement tools to monitor the strategic plan and
•
service strategy business plans
Align policy and budget discussions to enhance Council decision-making
•
Excellence Journey
Become the first municipality in Canada to receive Progressive Excellence
•
Program (PEP) Level III Award
Develop a process management framework and establish training for staff
•
Implement citizen/client/customer focus framework and measurement tools
•
2 0 0 4
S E R V I C E
E X E C U T I V E A N D C O U N C I L
S T R A T E G Y B U S I N E S S P L A N
9
Increase opportunities to involve Peel Regional Police in Regional activities
Request joint participation in 2003 United Way Campaign
•
Invite to EMT meetings and corporate training events
•
E.3 Corporate Performance Measurement and Benchmarking (not applicable)
2 0 0 4
S E R V I C E
E X E C U T I V E A N D C O U N C I L
S T R A T E G Y B U S I N E S S P L A N
10
F.
2004 Financial Requirements Presentation
F.1 Current Budget Introductory Comments/Analysis
The Region continues to move toward a corporate-wide approach on strategic,
political and administrative matters. The budget supports this direction, and provides
for strategic initiatives, political issues management, including funds for Councillor
newsletters and employee recognition.
The Executive Office, which includes the budgets for Council Administration, the
Chair’s Office and the CAO’s Office, has increased primarily for annual salary/fringe
increase, OMERS and Councillors’ communication, e.g. newsletters. Councillor
communication in the first year of a new term is a priority, and a budget has been
established to support that priority.
F.2 Financial Structure Chart – Current Budget
EXECUTIVE & COUNCIL
EXECSECP
Council & Chair
ADMEXECP
CAO
GC01001
2 0 0 4
S E R V I C E
E X E C U T I V E A N D C O U N C I L
S T R A T E G Y B U S I N E S S P L A N
11
F.3 2004 Current Budget
1. Activity Analysis
Budgeted Net Cost
Change
2004
from 2003
3.
Budgeted Net Cost/Unit
Change
2004
from 2003
Council and Chair
1,880,944
225,615
5.53
0.53
CAO
1,612,411
103,082
4.74
0.18
Net Program Cost
$ 3,493,355
2. Account Analysis
$
328,697
$
10.27
$
0.71
Budgeted Units of Service
*Change
2004
from 2003
Budgeted Gross & Net Cost
Change
2004
from 2003
Goods & Services
Salaries & Wages
Capital Financing
1,461,722
2,002,103
29,530
64,025
214,672
-
Brampton
Caledon
Mississauga
115,000
17,000
208,000
6,000
3,000
Gross Program Cost
3,493,355
278,697
Total Households
340,000
9,000
Fees, Charges & Other
Subsidies
Net Program Cost
$ 3,493,355
(50,000)
- * Due to a policy change, household forecasts
$
328,697
previously forecast to the nearest hundred are now
forecast to the nearest thousand.
4. Budget Variance Explanation
Net Program Costs
Change from
2003
Council and Chair
Increase primarily due to expenses relating to the publication and distribution of councillor
newsletters allowed by Regional policy and the full reinstatement of the OMERS pension
contributions
225,615
CAO
Increase primarily in salary costs due to annual salary and fringe increases
Net Program Cost Variance
2 0 0 4
S E R V I C E
103,082
$
328,697
E X E C U T I V E A N D C O U N C I L
S T R A T E G Y B U S I N E S S P L A N
12
HUMAN RESOURCES
2 0 0 4
S E R V I C E
H U M A N R E S O U R C E S
S T R A T E G Y B U S I N E S S P L A N
TABLE OF CONTENTS
A.
Background
A.1 Preparing the Service Strategy Business Plan ....................................................................1
A.2 Key Contacts ..........................................................................................................................1
A.3 Additional Information .........................................................................................................1
B.
Description of Current Services
B.1 Program Location Map .........................................................................................................2
B.2 Profile of Current Services....................................................................................................2
B.3 Description of Clients/Customers.........................................................................................3
B.4 Description of Suppliers, Partners and Stakeholders.........................................................3
B.5 Overall Organization Structure and Staffing .....................................................................4
B.6 Significant Recent Activities/Initiatives ...............................................................................5
C.
Trends and Issues
C.1 Emerging Trends ...................................................................................................................6
C.2 Key Strategic Issues ...............................................................................................................6
D.
Mandate, Objectives and Actions
D.1 Mandate and Objectives........................................................................................................7
D.2 Objectives and Actions ..........................................................................................................7
D.3 Strategic Plan Connection.....................................................................................................9
2 0 0 4
S E R V I C E
H U M A N R E S O U R C E S
S T R A T E G Y B U S I N E S S P L A N
TABLE OF CONTENTS (Cont’d)
D.4 Service Principles (optional) .................................................................................................9
E.
Monitoring and Measuring the Service Strategy Business Plan
E.1 Objectives and Outcomes....................................................................................................10
E.2 Performance Targets (not applicable)
E.3 Corporate Performance Measurement and Benchmarking ............................................12
F.
2004 Financial Requirements Presentation
F.1
Current Budget Introductory Comments/Analysis ..........................................................14
F.2
Financial Structure Chart – Current Budget....................................................................14
F.3
2004 Current Budget ...........................................................................................................15
F.4 Capital Budget & Forecast Introductory Comments/Analysis and F.5 2004 Capital Budget &
Forecast to 2013 Reports are not applicable.
2 0 0 4
S E R V I C E
H U M A N R E S O U R C E S
S T R A T E G Y B U S I N E S S P L A N
A.
Background
A.1 Preparing the Service Strategy Business Plan (SSBP)
The SSBP was created by a Facilitated Project Team. The members of the team included:
Commissioner of People, Information and Technology (PIT)
Human Resources (HR) Managers
Four HR staff members
A.2 Key Contacts
Laura Nashman, Commissioner, PIT
905-791-7800, ext. 4201
[email protected]
Brenda Pelletier, Manager, Business and Administration
905-791-7800, ext. 4737
[email protected]
A.3 Additional Information
This is the second SSBP for HR developed under the direction of the PIT Commissioner.
2 0 0 4
S E R V I C E
H U M A N R E S O U R C E S
S T R A T E G Y B U S I N E S S P L A N
1
B.
Description of Current Services
B.1 Program Location Map
HR is located primarily on the 1st floor of 10 Peel Centre Drive in Brampton. However,
some staff are located with client departments or divisions and the Learning and
Development Centre and staff are located at 150 Central Park Drive in Brampton.
B.2 Profile of Current Services
Employment Program Development & Maintenance
A core business of HR is the development and maintenance of corporate employment
programs which include, but are not limited to recruitment, selection, compensation,
corporate orientation, performance management, corporate learning and staff development,
leadership development, health & safety, wellness and succession management.
Advice, Guidance and Consultation
The division provides advice and guidance, coaching and consulting on all aspects of the
employment relationship and on all workplace and employment policies and programs to
managers and staff.
Workplace and Employment Related Policies and Processes
HR supports the development of various workplace and employment related policies and
accompanying processes. These workplace and employment policies and procedures
establish the parameters of the employer-employee relationship throughout the
organization.
Learning and Development
To ensure a highly qualified, talented and committed workforce, HR provides corporate
learning and development programs and opportunities, to support the needs of the
corporation, its management and its employees.
Labour Relations
HR provides leadership, advice and guidance for collective bargaining, contract
interpretation and administration, and the complaint and grievance process. One half of our
workforce is organized among nine different bargaining units represented by four unions.
Eighty-seven per cent of Peel’s unionized workforce is represented by the Canadian Union
of Public Employees (CUPE).
2 0 0 4
S E R V I C E
H U M A N R E S O U R C E S
S T R A T E G Y B U S I N E S S P L A N
2
Employee Information Management
HR develops and administers the HR Management System (HRMS) and the corporate
employee files. The information in HRMS and in the employee files provides for accurate
and timely reporting on employee data which is used for decision making at all levels of the
organization.
B.3 Description of Clients/Customers
Regional Departments
In addition to PIT, there are eight Regional departments: Corporate Services, Executive
Office, Finance, Health, Housing and Property, Planning, Public Works and Social
Services.
Regional Employees
The Region of Peel’s diverse workforce has approximately 2,895 employees who deliver
programs and services to over one million Peel citizens.
Retirees
HR provides benefit administration for former employees eligible for early retirement/post
retirement benefits.
Peel Regional Police, Town of Caledon, Credit Valley Conservation Authority
HR provides services as requested to these organizations.
B.4 Description of Suppliers, Partners and Stakeholders
Suppliers
• Professional services ranging from; insurance and benefits providers, HR consulting,
physiotherapy providers, legal and arbitration, employee development
• Training providers
• Products including HRMS software
Partners
• Health department, to promote a healthy workplace and lifestyle
• Peel Regional Police, to leverage our investment in HRMS
• Finance department, for HRMS data entry, HRMS initiatives, benefit administration,
administer funding for Workplace Safety and Insurance Board (WSIB), employee
benefits, tuition reimbursement administration, and risk management
• Information Technology (IT) Services, as part of the department in “making the
workplace better”, and IT/HRMS initiatives
2 0 0 4
S E R V I C E
H U M A N R E S O U R C E S
S T R A T E G Y B U S I N E S S P L A N
3
Stakeholders
• Regional Council approves collective agreements and compensation changes
• Ministry of Labour, if a workplace accident occurs or a health and safety complaint is
reported
• WSIB, liaise with the board, file all applicable documentation, manage modified work
programs and provide claims management
B.5 Overall Organization Structure and Staffing
Human Resources Division
Commissioner
P.I.T. †
(2)
Human Resources
Director
(1)
Manager
Finance
Administration
(9)
Manager
Compensation
and Benefits
(6)
Manager
Learning and
Development
(4)
Manager
Workplace Health
and Safety
(9)
Manager
Corporate HR
Initiatives
(4)
Total Full-time Equivalent (FTE) = 50
(reflects Council approved positions only)
Manager
Employee
Relations
(15)
HR Associate
Ontario Works
Note:
All positions listed have supervisory responsibilities.
( ) Denotes all FTE in the group including the boxed position.
† Also serves Information Technology Services.
2 0 0 4
S E R V I C E
H U M A N R E S O U R C E S
S T R A T E G Y B U S I N E S S P L A N
4
B.6 Significant Recent Activities/Initiatives
•
•
•
•
•
•
•
•
•
Designed new job evaluation system and compensation system for non-bargaining
positions, as well as the Ontario Works and Public Works bargaining positions
Designed, developed and implemented corporate employee orientation package
Produced the inaugural HR Annual Report “Managing Wellness”
Enhanced profile of “Wellness at Peel” with new programming aimed at
cardiovascular health and mental illness as top wellness priorities for staff. Programs
and activities heightened awareness.
Played a significant role in Region achieving the award “Work and Well Being” for the
promotion of mental health in the workplace from the Canadian Mental Health
Association
Established an e-recruitment solution for Peel by contracting to provide online
recruitment and selection
The “I Can Manage” e-newsletter enhanced communications with managers and
among the management group and won the “Dalton Pen Award”, given by a major
American publishing company
Completed first phase of Electronic Information Management (EIM) Project/HR
Digitization which included Livelink configuration, inventory of HR forms and their
properties for scanning, reviewed and revised the retention schedules
Developed the talent management framework, an innovative and creative approach to
the redevelopment of all major HR programs
2 0 0 4
S E R V I C E
H U M A N R E S O U R C E S
S T R A T E G Y B U S I N E S S P L A N
5
C.
Trends and Issues
C.1 Emerging Trends
•
• HR issues prominent among business leaders
• Decreasing labour market growth
• Technology replacing manual labour
• New skills required to meet technical advances and workplace innovations
• Employee satisfaction becoming increasingly important
• Employee wellness becoming increasingly important
• Employees expect more than one employer/career
• Trend to 24/7 service
• Trend for telecommuting
• Trend for purchase of service arrangements
• Governments are recognizing the need to be an employer of choice
• Human rights code restrictions regarding age are changing
• Increased emphasis on importance of the role of the manager
C.2 Key Strategic Issues
•
• Supporting the Region’s desire to be an employer of choice, empowering
staff/accountability
• Ensuring a clear and consistent understanding of role of HR at the Region
• Becoming strategic partners with clients
• Understanding and meeting the needs of clients
• Demonstrating the value of HR programs and services
• Building the skills capacity within the division
• Developing a collective corporate understanding of the importance of the role of the
manager to build skills capacity of managers
• Developing a process to manage workload
• Securing organization wide commitment and support for HRMS
2 0 0 4
S E R V I C E
H U M A N R E S O U R C E S
S T R A T E G Y B U S I N E S S P L A N
6
D.
Mandate, Objectives and Actions
D.1 Mandate and Objectives
Mandate:
HR will create a people-focused work environment through strategic partnerships, expert
advice and client-focused human-resource solutions.
Objectives:
1. To strengthen the skills and abilities of HR staff and support their needs
2. To demonstrate the value of HR programs and services
3. To enhance HR programs and services with a focus on client needs
4. To support development and career advancement for all staff
5. To support the Region’s commitment to a healthy workplace
6. To ensure effective use of HRMS as the primary system for employee information
D.2 Objectives and Actions
1. To strengthen the skills and abilities of HR staff and support their needs
1.1 Create a continuous learning environment for HR staff
1.2 Build capacity of the HR team
1.3 Develop workload management strategy
1.4 Recognize and reward staff performance
1.5 Enhance communications within the division
2. To demonstrate the value of HR programs and services
2.1 Create communication plans for all HR programs
2.2 Communicate the roles and functions of key client driven HR positions
2.3 Seek partnership opportunities internally and externally
2.4 Initiate regular communication with clients
2.5 Define our service offerings
2 0 0 4
S E R V I C E
H U M A N R E S O U R C E S
S T R A T E G Y B U S I N E S S P L A N
7
3. To enhance HR programs and services with a focus on client needs
3.1 Establish a solid understanding of client needs
3.2 Revise the current performance management plan
3.3 Revise and create job evaluation and pay systems
3.4 Further develop and implement the HR planning model/process
3.5 Enhance HR programs incorporating the Employee Satisfaction Improvement
Team (ESIT) recommendations
3.6 Review and revise benefit programs
3.7 Digitization of employee files housed in HR EIM
4. To support development and career advancement for all staff
4.1 Further develop the talent management framework
4.2 Rebuild the corporate learning and development program
4.3 Create and implement non-traditional learning and development programs
4.4 Develop and implement the succession management model/process
5. To support the Region’s commitment to a healthy workplace
5.1 Enhance the healthy workplace program including Wellness at Peel
5.2 Develop a framework to assist with workload management
5.3 Improve the Region’s Employee Assistance Program (EAP)
5.4 Enhance the Region’s occupational health and safety programs
5.5 Develop a comprehensive corporate disability management program
6. To ensure effective use of HRMS as the primary system for employee information
6.1 Re-engineer people management administrative processes
6.2 Build the HRMS system to support all core HR programs
6.3 Enhance the accessibility of HRMS for all managers and staff
6.4 Develop a communication strategy to enhance awareness and encourage use of
HRMS
2 0 0 4
S E R V I C E
H U M A N R E S O U R C E S
S T R A T E G Y B U S I N E S S P L A N
8
D.3 Strategic Plan Connection
The objectives and actions in the HR SSBP are consistent with, and support, the following
Goals in the Region of Peel’s strategic plan, Directions for Success: Investing in Peel’s
Future.
Goal 1: Improve the community’s health, social well being and safety
Goal 4: Contribute to a vibrant and diverse regional economy
Goal 5: Be a leader in the provision and co-ordination of Regional services
D.4 Service Principles (optional)
• Treat all Regional employees consistently and equitably
• Keep employee information confidential
• Understand our clients’ business, contribute to and care about their success
• Give people-focused, impartial and expert information, advise and guidance
• Enhance the capacity of management and staff to make informed workplace decisions
• Recognize the broader corporate impacts on the organization when providing our
services
• Be committed to having a healthy workplace with motivated and healthy Regional
employees
2 0 0 4
S E R V I C E
H U M A N R E S O U R C E S
S T R A T E G Y B U S I N E S S P L A N
9
E.
Monitoring and Measuring the Service Strategy Business Plan
E.1 Objectives and Outcomes
1. To strengthen the skills and abilities of HR staff and support their needs
Highly skilled, innovative and adaptable HR staff
•
Meeting current and future HR needs of the organization
•
Highly engaged and committed HR staff
•
Knowledge transfer and information sharing among HR staff
•
HR staff feel valued
•
2. To demonstrate the value of HR programs and services
Strategic partners with our clients
•
Involved
in business planning
•
Increased recognition of HR abilities
•
Clear and common understanding of HR role in the organization
•
Recognized
as a high performing HR organization
•
Recognized for HR best practices
•
3. To enhance HR programs and services with a focus on client needs
Satisfied clients, positive reports and feedback
•
Committed,
engaged and satisfied employees
•
Strategically connected with our clients
•
Involved in business planning of our clients
•
A
leader in HR best practices
•
Efficient user friendly HR programs
•
Attract, retain, and reward top quality employees/employer of choice
•
4. To support Regional staff development and career advancement
Attract, retain, develop and reward top quality employees/employer of choice
•
Internal promotion and movement
•
Broader talent pool, capable to meet current/future staffing needs
•
Committed,
engaged and satisfied employees
•
Highly skilled, adaptable and flexible workforce
•
Supportive environment enabling employees to reach potential
•
2 0 0 4
S E R V I C E
H U M A N R E S O U R C E S
S T R A T E G Y B U S I N E S S P L A N
10
5. To support the Region’s commitment to a healthy workplace
Physically safe environment
•
Mentally and socially supportive environment
•
Wellness culture
•
Recognized as an employee focused organization
•
Increased employee productivity
•
Physically, emotionally and socially healthy employees
•
Well balanced (work/life) employees
•
Business decisions include impact on the wellness of staff
•
6. To ensure effective use of HRMS as the primary system for employee information
Managers directly manage employee data
•
Information based decision-making processes
•
Readily accessible, accurate workforce data
•
Data and process management efficiencies
•
Demonstrated return on investment in HRMS
•
Support from managers as the system of choice for employee information
•
Increased use and functionality of HRMS
•
2 0 0 4
S E R V I C E
H U M A N R E S O U R C E S
S T R A T E G Y B U S I N E S S P L A N
11
E.2 Performance Targets (not applicable)
E.3 Corporate Performance Measurement and Benchmarking
1. Program Efficiency (not applicable)
2. Community Impact (not applicable)
3. Date (not applicable)
4. Customer Service (not applicable)
5. External Benchmarking
HR participates in an annual benchmarking survey to help to ensure efficiencies. The results for the
most recent survey representing 2002 results are shown below.
2003
Region of Peel
Benchmark
Indicator
Value
Benchmark Description
Turnover Rate
# First Step Grievances received
divided by average # Union
Employee
# Final Step Grievances received
divided by average # Union
Employees
Workers Compensation Lost
Time Incidents divided by the
average employee count
Modified Work Accommodation
divided by average employee
count
Workers Compensation Lost
Work Hours per eligible
employee
Training Expenditures for
courses offered by HR divided by
employee count
2 0 0 4
2002
Region of Peel
Benchmark
Indicator Value
18.5%
7.28%
2003
External
Benchmark
Indicator Value
Average
(Municipal
Sector =14)
17.6%
4.67%
16.8%
6.62%
2002
External
Benchmark
Indicator Value
Average
(Municipal Sector
=11
13.6%
3.39%
2.26%
2.03%
4.54%
1.98%
3.26%
4.30%
3.70%
4.32%
3.4%
2.8%
7.5%
3.4%
6.91
8.25
6.99
7.80
$567
$617
$604
$414
S E R V I C E
H U M A N R E S O U R C E S
S T R A T E G Y B U S I N E S S P L A N
12
HR FTE Indicator (# of
employees to full-time HR
person)
HR Expense Indicator (HR
Administration exp. as a % of
operating expense)
2 0 0 4
72.3
99.2
88.1
111.8
0.5%
0.8%
0.5%
0.7%
S E R V I C E
H U M A N R E S O U R C E S
S T R A T E G Y B U S I N E S S P L A N
13
F.
2004 Financial Requirements Presentation
F.1
Current Budget Introductory Comments/Analysis
People Information and Technology (PIT) was formed in 2003. This new department brings
together HR and Information and Technology (IT). For the purpose of the 2004 budget HR
includes HR and the Office of the PIT Commissioner. A separate budget was prepared for
the IT 2004 budget.
In HR the gross expenditure for 2004 is anticipated to be $6,496,700. This is an increase of
24.4 per cent over last year’s HR budget of $5,221,676, and is mostly due to increases in
salaries, Ontario Municipal Employees Retirement System (OMERS) and the addition of
the Office of the PIT Commissioner. This increase however is offset by an increase in
recoveries resulting in an overall decrease in the net expenditures of $19,309.
F.2
Financial Structure Chart – Current Budget
PEOPLE & INFO TECH SYSTEMS
PEOITSCP
PIT Commissioner’s Office
GC19000
PIT Business Unit
GC19100
Human Resources
CORPERCP
Compensation & Administration
PERADMCP
Employee Relations
PEREMPCP
Org Development & Education
PERTRACP
Workplace Safety, Insurance & Benefits
PERWSICP
2 0 0 4
S E R V I C E
H U M A N R E S O U R C E S
S T R A T E G Y B U S I N E S S P L A N
14
F.3 2004 Current Budget
1. Activity Analysis
Budgeted Net Cost
Change
2004
from 2003
1,024,399
(19,309)
Human Resources
Net Program Cost
$ 1,024,399
2. Account Analysis
$
3.
(19,309)
Budgeted Net Cost/Unit
Change
2004
from 2003
3.01
(0.14)
$
Budgeted Gross & Net Cost
Change
2004
from 2003
3.01
$
(0.14)
Budgeted Units of Service
*Change
2004
from 2003
Goods & Services
Salaries & Wages
Capital Financing
2,837,780
3,658,920
-
704,826
570,198
-
Brampton
Caledon
Mississauga
115,000
17,000
208,000
6,000
3,000
Gross Program Cost
6,496,700
1,275,024
Total Households
340,000
9,000
Fees, Charges & Other
5,472,301
1,294,333
Net Program Cost
$ 1,024,399
$
(19,309)
* Due to a policy change, household forecasts
previously forecast to the nearest hundred are now
forecast to the nearest thousand.
4. Budget Variance Explanation
Net Program Costs
Change from
2003
Increase in recoveries for HR services due primarily to staffing increases for new Long Term
Care facilities, and departmental administrative support
(708,825)
Net increase in salary costs for increased staffing, merit and benefit costs due to OMERS
570,198
Increase in Goods and Services due to e-recruitment solution, software maintenance fees,
Communications support and departmental administrative costs
119,318
Net Program Cost Variance
2 0 0 4
S E R V I C E
$
(19,309)
H U M A N R E S O U R C E S
S T R A T E G Y B U S I N E S S P L A N
15
INFORMATION TECHNOLOGY
2 0 0 4
I N F O R M A T I O N T E C H N O L O G Y
S E R V I C E S T R A T E G Y B U S I N E S S P L A N
TABLE OF CONTENTS
A.
Background
A.1 Preparing the Service Strategy Business Plan ....................................................................1
A.2 Key Contacts ..........................................................................................................................1
A.3 Additional Information .........................................................................................................1
B.
Description of Current Services
B.1 Program Location Map .........................................................................................................2
B.2 Profile of Current Services....................................................................................................2
B.3 Description of Clients/Customers.........................................................................................2
B.4 Description of Suppliers, Partners and Stakeholders.........................................................3
B.5 Overall Organization Structure and Staffing .....................................................................4
B.6 Significant Recent Activities/Initiatives ...............................................................................5
C.
Trends and Issues
C.1 Emerging Trends ...................................................................................................................6
C.2 Key Strategic Issues ...............................................................................................................7
D.
Mandate, Objectives and Actions
D.1 Mandate and Objectives........................................................................................................8
D.2 Objectives and Actions ..........................................................................................................8
D.3 Strategic Plan Connection.....................................................................................................9
2 0 0 4
I N F O R M A T I O N T E C H N O L O G Y
S E R V I C E S T R A T E G Y B U S I N E S S P L A N
TABLE OF CONTENTS (Cont’d)
D.4 Service Principles (optional) ...............................................................................................10
E.
Monitoring and Measuring the Service Strategy Business Plan
E.1 Objectives and Outcomes....................................................................................................11
E.2 Performance Targets (not applicable)
E.3 Corporate Performance Measurement and Benchmarking ............................................12
F.
2004 Financial Requirements Presentation
F.1
Current Budget Introductory Comments/Analysis ..........................................................14
F.2
Financial Structure Chart – Current Budget....................................................................15
F.3
2004 Current Budget ...........................................................................................................16
For F.4 Capital Budget & Forecast Introductory Comments/Analysis and F.5 2004 Capital Budget &
Forecast to 2013 Reports please refer to the Internal Support – Information Technology section of the
2004 Capital Budget and 2005-2013 Capital Forecast document.
2 0 0 4
I N F O R M A T I O N T E C H N O L O G Y
S E R V I C E S T R A T E G Y B U S I N E S S P L A N
A.
Background
A.1 Preparing the Service Strategy Business Plan (SSBP)
The work on the SSBP was undertaken under the direction of the Information Technology
(IT) Management Team including:
Director of IT
Manager Technology Infrastructure
Manager Technology Service Centre
Manager Business Solutions - Direct Service Programs
Manager Business Solutions - Internal Service Programs
The work began in April and involved six workshops of managers and supervisors, one all
staff meeting in June, a one-day excellence assessment and three managers’ meetings. All
supervisory and management staff were involved in the development of the SSBP.
A.2 Key Contacts
Roy Wiseman, Director of IT
905-791-7800, ext. 4512
[email protected]
A.3 Additional Information
This SSBP is built on earlier business plans developed by the division in 2002 and 1998.
2 0 0 4
I N F O R M A T I O N T E C H N O L O G Y
S E R V I C E S T R A T E G Y B U S I N E S S P L A N
1
B.
Description of Current Services
B.1 Program Location Map
Programs are located at 10 Peel Center Drive in Brampton.
B.2 Profile of Current Services
Information and technology planning
Preparing and maintaining corporate and departmental technology plans, Technology
Infrastructure Plan and Corporate and Application Architecture.
Information and technology solutions delivery
Researching, evaluating, recommending, implementing and supporting technology
solutions to address corporate or client business needs.
Information and technology support
“One call” service for receiving and resolving technology support requests, providing
advice and “how to” support or on-site training, ordering and installing new technology,
and developing technology usage policies, procedures and standards.
B.3 Description of Clients/Customers
Corporate IT
IT provides the Corporation with services related to the provision of technology services
including information and application architecture, capacity, security and disaster recovery
planning.
Regional Employees IT
IT integrates all technology (i.e. computers, telephones, copiers, fax, cellular, hand-helds)
used by employees and provides services related to ordering, using and supporting these
technologies.
Regional Departments IT
IT works with all Regional departments and assists in developing annual work plans and
service level agreements for the technology services provided.
Public IT
IT will become involved in partnership with other Regional programs in the
implementation and support of E-Government services.
2 0 0 4
I N F O R M A T I O N T E C H N O L O G Y
S E R V I C E S T R A T E G Y B U S I N E S S P L A N
2
B.4 Description of Suppliers, Partners and Stakeholders
Suppliers
• Software manufacturers and vendors
• Server hardware manufacturers
• Other data centre equipment manufacturers
• Desktop/notebook computer and peripherals manufacturers
• Telecommunications equipment manufacturers
• Telephone equipment and service
• Cellular and wireless equipment and service
• Computer and communications equipment resellers
• Public Sector Network (PSN) construction and maintenance
• Geographic Information Systems (GIS) data and services
• Photocopy equipment suppliers
• Computer consultants and contractors
Partners
• Peel area municipalities
• Other regions and municipalities
• Province of Ontario, various ministries
• Hydro utilities
• Telecommunications carriers
• Railways
• Peel Regional Police
• Region departments/divisions including Property and Facilities Asset Management,
Human Resources (HR) and Purchasing
Stakeholders
• PSN partners and subscribers
2 0 0 4
I N F O R M A T I O N T E C H N O L O G Y
S E R V I C E S T R A T E G Y B U S I N E S S P L A N
3
B.5 Overall Organization Structure and Staffing
Information Technology
Commissioner
Human Resources †
Director
Information Technology
(2)
Manager
Technology Infrastructure
(20)
Manager
Business Solutions Direct Service Programs
(19)
Manager
Business Solutions Internal Programs
(20)
Project Manager
Finance
Supervisor
Technology Infrastructure
Planning
Project Manager
Health/Social Services/
Housing
Supervisor
Data Centres
Project Manager
GIS/Planning
Project Manager
Human Resources/
Police/PeopleSoft
Supervisor
Technology Infrastructure
Services
Project Manager
Public Works
Project Manager
Corporate Services
Manager
Technology Service Centre
(20)
Project Manager
Corporate Tools
Total Full-time Equivalent (FTE) = 81.0
(reflects Council approved positions only)
Note:
All positions listed have supervisory responsibilities.
( ) Denotes all FTE in the group including the boxed position.
† Also serves Human Resources. FTE for this section is reflected in Human Resources.
2 0 0 4
I N F O R M A T I O N T E C H N O L O G Y
S E R V I C E S T R A T E G Y B U S I N E S S P L A N
4
B.6 Significant Recent Activities/Initiatives
•
•
•
•
•
•
•
•
•
•
•
•
•
•
Integrated IT into new People, Information and Technology (PIT)
Strengthened Technology Service Centre organization and service delivery
Obtained IT Service Management certification for all IT managers and supervisors
Received Executive Management Team (EMT) approval for Chief Information Officer
(CIO) role
Significantly enhanced corporate technology capacity, performance, security,
continuity and recovery
Implemented enhanced work from home technology
Implemented Regional Emergency Operations Centre and Peel Inquiry Centre to
address Severe Acute Respiratory Syndrome (SARS)
Provided technology for new Cawthra Homeless Shelter in record time (recognized in
Together We’re Better Awards Program)
Upgraded to current technology (PeopleSoft, Oracle, Powerbuilder, Windows 2000
server, Windows XP desktop)
Developed technology strategy for Health
Re-integrated Peel Living into Regional standard technology
Implemented E-Government capability for credit card payment and e-registration
Received Showcase Ontario and Open Text LiveLinkUp Awards for Electronic
Information Management (EIM)
Expanded PSN to include 166 connected sites for 10 public sector organizations,
including Town of Caledon as new PSN Partner - meaning all Peel area municipalities
are now partners
2 0 0 4
I N F O R M A T I O N T E C H N O L O G Y
S E R V I C E S T R A T E G Y B U S I N E S S P L A N
5
C.
Trends and Issues
C.1 Emerging Trends
•
•
•
•
•
•
•
•
•
•
•
•
•
•
•
•
•
•
•
•
•
•
•
•
Renewed trend towards outsourcing technology services
Greater scrutiny for information and technology procurement and supplier relationships
Professional standards IT Infrastructure Library (ITIL) adoption by leading
organizations for IT Service Management
Need to capture process and knowledge as large portion of the workforce approaches
retirement
Sharing more information or applications with other municipalities, agencies or levels of
government
Increased involvement with community partners
Increased dependence on technology in work environment, including expectation for
expanded hours (up to 24/7) for technology availability and support
Need for very high technology availability and rapid recovery from major failures
Cultural diversity (many languages)
Possibility of changes to retirement age policies/practices
Increasing interest in employees being able to work from home
Move toward virtual employees/offices
Need for more and better technology training
Increasing importance and value of GIS
Increased emphasis on corporate information, applications, and governance of IT
initiatives
Increased emphasis on sound business cases for IT initiatives
Technology projects increasingly interdisciplinary and led by client project managers
Shorter technology life cycles
Technology solutions are increasingly interdependent and complex
Increasing importance of wireless technology to support a mobile workforce
Growing client base, with potential to double as technology provided to non-office staff
Access to and use of regional information and technology directly by the public
Public interest in “one window” service access within and across jurisdictions (i.e. call
centre integration, Seniors Portal)
Increased importance of security and privacy
2 0 0 4
I N F O R M A T I O N T E C H N O L O G Y
S E R V I C E S T R A T E G Y B U S I N E S S P L A N
6
C.2 Key Strategic Issues
•
•
•
•
•
•
•
•
•
•
•
•
Successfully integrating IT into PIT
Implementing the CIO mandate and role
Adopting IT Service Management into working environment
Attracting and retaining top quality staff
Understanding and addressing client expectations and business needs
Managing and addressing client expectations for high service availability
Becoming more proactive and strategic
Developing new approaches for recommending and approving IT plans and priorities
Improving processes for IT Project Management, including business case development
and review
Implementing talent management and succession planning for IT management and staff
Improving access to regional technology for all Regional staff and from all Regional
locations
Implementing knowledge management
2 0 0 4
I N F O R M A T I O N T E C H N O L O G Y
S E R V I C E S T R A T E G Y B U S I N E S S P L A N
7
D.
Mandate, Objectives and Actions
D.1 Mandate and Objectives
Mandate:
The IT will plan, deliver and support innovative, integrated, customer focused information
and technology services.
Objectives:
1. To provide Regional direction for corporate information and technology.
2. To partner with clients to address their business technology needs.
3. To maintain a leadership position in technology.
4. To practice Service Excellence.
5. To strengthen the IT Team.
D.2 Objectives and Actions
1. To provide Regional direction for corporate information and technology.
1.1 Define and establish corporate CIO role
1.2 Develop and communicate a corporate information and technology vision and
plan
1.3 Develop ongoing information and technology planning capabilities
1.4 Establish role of IT in data and information management
1.5 Provide leadership to ensure success of corporate technology initiatives
1.6 Update, expand and communicate corporate information and technology user
standards and policies
2. To partner with clients to address their business technology needs.
2.1 Develop a customer service strategy
2.2 Improve understanding of Regional businesses and potential technologies
2.3 Identify opportunities for cost effective application of existing or new
technologies in client businesses
2.4 Coach departments in the implementation of their technology
2.5 Provide opportunities for expanding technology awareness
2 0 0 4
I N F O R M A T I O N T E C H N O L O G Y
S E R V I C E S T R A T E G Y B U S I N E S S P L A N
8
3. To maintain a leadership position in technology.
3.1 Invest in technology infrastructure to support future needs
3.2 Research and adopt new technologies
3.3 Research and implement best practices for application development and
information management
3.4 Strengthen relationships with other municipalities, government agencies and the
private sector
3.5 Recognize and promote technology excellence
4. To practice service excellence.
4.1 Adopt proven methodologies for information and technology service management
4.2 Enhance technology security, continuity and recovery
4.3 Implement performance measurement and reporting for all services
4.4 Prepare service strategies/business plans for units in IT
4.5 Implement a consistent project management methodology within IT
4.6 Enhance information and technology asset management
4.7 Identify and implement cost savings opportunities
5. To strengthen the IT Team.
5.1 Identify and document key IT business processes
5.2 Broaden participation in the management of the division
5.3 Improve IT internal communications and information sharing
5.4 Review the division’s planning and delivery of services
5.5 Attract, develop and retain top IT professionals
D.3 Strategic Plan Connection
The objectives and actions in the IT SSBP are consistent with, and support, the following
Goals in the Region of Peel’s strategic plan, Directions for Success: Investing in Peel’s
Future.
Goal 1:
Goal 2:
Goal 4:
Goal 5:
Improve the community’s health, social well-being and safety
Assess and manage all aspects of growth that affect Peel
Contribute to a vibrant and diverse regional economy
Be a leader in the provision and co-ordination of Regional services
2 0 0 4
I N F O R M A T I O N T E C H N O L O G Y
S E R V I C E S T R A T E G Y B U S I N E S S P L A N
9
D.4 Service Principles (Optional)
In support of the Regional Values, IT has the following service principles:
• Value our ability to use technology to help clients deliver enhanced cost effective
business services
• Committed to making IT services universally available
• Are responsible custodians of the technology infrastructure
• Recognize data as a key corporate resource which should be available to and shared by
all Regional programs
• Committed to innovation and searching out new technology to meet future needs
• Committed to sound technology investments
2 0 0 4
I N F O R M A T I O N T E C H N O L O G Y
S E R V I C E S T R A T E G Y B U S I N E S S P L A N
10
E.
Monitoring and Measuring the Service Strategy Business Plan
E.1 Objectives and Outcomes
1. To provide Regional direction for corporate information and technology
The organization understands how technology will be used to advance corporate
•
priorities
Agreement on corporate information and technology priorities
•
Corporate applications leveraged effectively across all departments
•
Recognized and respected set of consistent standards and policies
•
Data is treated as a corporate asset
•
2. To partner with clients to address their business technology needs
Clients are using technology strategically
•
Clients are recognized for effective use of technology in their business
•
Clients respect and seek our advice on technology solutions
•
Clients see the value of the technology we provide
•
3. To maintain a leadership position in technology
Sought out by other municipalities and organizations for advice
•
Winning awards, speaking at conferences, publishing articles
•
Attracting and retaining top quality candidates
•
Suppliers seeking to partner with us
•
Seen as making effective use of leading-edge technology
•
4. To practice service excellence
Best practices in place and being followed (i.e. ITIL, Project Management Body
•
of Knowledge (PMBOK)
Service level agreements in place and clearly understood by staff and clients
•
Demonstrated
improvement of services
•
Confidence in the reliability and resilience of our technology and services
•
5. To strengthen the IT Team
Appreciation and respect for each others’ work
•
Common understanding and commitment to division and corporate priorities
•
Staff sought out for and participate in corporate initiatives
•
Qualified candidates ready to accept more responsible positions
•
Staff
engaged in activities of the division and the Corporation
•
2 0 0 4
I N F O R M A T I O N T E C H N O L O G Y
S E R V I C E S T R A T E G Y B U S I N E S S P L A N
11
E.2 Performance Targets (not applicable)
E.3 Corporate Performance Measurement and Benchmarking
1. Program Efficiency
Annual Charge
IT Services - Internal Charges per Unit Support Costs
$2,000
$1,800
$1,600
$1,400
$1,200
$1,000
$800
$600
$400
$200
$0
1998
1999
2000
2001
2002
Computers
Phones
Types of Technology
The region of Peel allocates support costs based on the type of technology used. IT has
reduced its support costs by $250 per computer and by $300 per telephone since 1998.
This has been reflected in lower recharges to technology users in all Regional
departments.
Unit support costs for 2004 for both computers and phones have not changed from the
2001 level.
2. Community Impact (not applicable)
3. Date (not applicable)
4. Customer Service
Customer Service continues to be a major focus of IT. The division has adopted the
following Customer Service Statement to guide its provisions of service to its
(primarily) internal clients.
2 0 0 4
I N F O R M A T I O N T E C H N O L O G Y
S E R V I C E S T R A T E G Y B U S I N E S S P L A N
12
As a Team, IT is committed to providing total customer satisfaction, by helping our
customers meet or exceed their business needs.”
Following an organizational review of Information Customer Service in 2000, IT has
implemented a centralized Help Desk and Technology Support Team which provides
IT clients with a single point of contact for all technology requests and the resolution of
client issues.
5. External Benchmarking
The Region of Peel’s ratio of one IT Staff position for every 24.7 computer users places
the Region in the middle of the selected regional and area municipalities (2001 date). A
higher number implies more users per IT staff member and a correspondingly lower
ability to provide quality information technology support.
2 0 0 4
I N F O R M A T I O N T E C H N O L O G Y
S E R V I C E S T R A T E G Y B U S I N E S S P L A N
13
F.
2004 Financial Requirements Presentation
F.1
Current Budget Introductory Comments/Analysis
Gross expenditures for 2004 for IT are anticipated at $15,986,908 compared to $15,137,055
in 2003, an increase of $849,853 or 5.6 per cent. After deducting for recoveries and
chargebacks for application development and support, and for support of the desktop,
network and telephone environment, net expenditures for 2004 are anticipated to come in at
$3,399,332 compared to $3,751,319 in 2003, a decrease of $351,987 or 9.4 per cent.
The Peel Living integration into the Regional network in July 2003 has resulted in the
transfer of two Peel Living technology staff to IT. The combined effect of annual merit
increases including an accelerated provision for Ontario Municipal Employee Retirement
System (OMERS) contributions and the cost of additional resources have resulted in an
overall increase in salaries of $553,933 or 9.5 per cent. This increase has been offset to a
large extent by additional recoveries being generated through IT support to a larger client
community.
It should be noted that the net budget of $3,399,332 is comprised mainly of contributions to
the IT New Capital reserve ($3,250,000) and the cost of providing corporate GIS support
($446,000) partially offset by a one time savings of $332,000 resulting from the extension
of the PC replacement cycle from three years to four years. The IT New Capital Reserve
funds various corporate IT initiatives such as Electronic Information Management, Network
Enhancements and Deployment of Corporate Technology and Desktop Tools.
2 0 0 4
I N F O R M A T I O N T E C H N O L O G Y
S E R V I C E S T R A T E G Y B U S I N E S S P L A N
14
F.2
Financial Structure Chart – Current Budget
People & Information & Technology
PEOITSCP
Information Technology
INFTECCP
PSN Current Operation
FI50000
Internal Computer Lease
FI50010
Total IT Excl PSN/Client Comp
FITGXPCP
IT Services Admin
FI00000
Technology Service Centre
FI60010
Business Solutions Internal
FITBUSCP
Business Solutions Direct
FITDSCP
Technology Services
FITSERCP
2 0 0 4
I N F O R M A T I O N T E C H N O L O G Y
S E R V I C E S T R A T E G Y B U S I N E S S P L A N
15
F.3 2004 Current Budget
1. Activity Analysis
Information Technology
Net Program Cost
Budgeted Net Cost
Change
2004
from 2003
3,399,332
$ 3,399,332
2. Account Analysis
Goods & Services
Salaries & Wages
Capital Financing
$
10.00
(351,987)
$
Budgeted Gross & Net Cost
Change
2004
from 2003
393,756
553,933
(97,836)
Gross Program Cost
15,986,908
849,853
Fees, Charges & Other
12,587,576
1,201,840
$ 3,399,332
Budgeted Net Cost/Unit
Change
2004
from 2003
(351,987)
4,166,021
6,375,577
5,445,310
Net Program Cost
3.
$
10.00
(1.33)
$
(1.33)
Budgeted Units of Service
*Change
2004
from 2003
Brampton
Caledon
Mississauga
115,000
17,000
208,000
6,000
3,000
Total Households
340,000
9,000
(351,987) * Due to a policy change, household forecasts
previously forecast to the nearest hundred are now
forecast to the nearest thousand.
2 0 0 4
I N F O R M A T I O N T E C H N O L O G Y
S E R V I C E S T R A T E G Y B U S I N E S S P L A N
16
4. Budget Variance Explanation
Net Program Costs
Change from
2003
Net increase in recoveries primarily for Computer and Network Infrastructure support
and PC Internal lease due to an increase in the number of Regional computers and
expansion of the telephony network environment (some $300,000 is related to the Peel
Living Integration)
(977,000)
Net increase in salary costs resulting from annual merit increases, including a catch-up
for Ontario Municipal Employee Retirement System (OMERS) contribution and the
transfer of two staff from Peel Living (the additional cost of $124,000 for the Peel
Living transfer is offset by the additional recoveries being generated from the Peel
Living Integration)
553,933
Net decrease in contribution to Reserve for Regional PC purchases due to extension of
the PC replacement cycle to four years
(97,836)
Increase in internal allocation for departmental administrative support, Human
Resources support and dedicated purchasing support
190,000
Other operating costs
(21,084)
Net Program Cost Variance
2 0 0 4
$
(351,987)
I N F O R M A T I O N T E C H N O L O G Y
S E R V I C E S T R A T E G Y B U S I N E S S P L A N
17
CORPORATE SERVICES
2 0 0 4
S E R V I C E
C O R P O R A T E S E R V I C E S
S T R A T E G Y B U S I N E S S P L A N
TABLE OF CONTENTS
A. Background
A.1
Preparing the Service Strategy Business Plan................................................................... 1
A.2
Key Contacts......................................................................................................................... 1
A.3
Additional Information........................................................................................................ 1
B. Description of Current Services
B.1
Program Location Map ....................................................................................................... 2
B.2
Profile of Current Services .................................................................................................. 2
B.3
Description of Clients/Customers ....................................................................................... 3
B.4
Description of Suppliers, Partners and Stakeholders....................................................... 3
B.5
Overall Organization Structure and Staffing.................................................................... 4
B.6
Significant Recent Activities/Initiatives ............................................................................. 5
C. Trends and Issues
C.1
Emerging Trends.................................................................................................................. 6
C.2
Key Strategic Issues ............................................................................................................. 6
D. Mandate, Objectives and Actions
D.1
Mandate and Objectives ...................................................................................................... 7
D.2
Objectives and Actions ........................................................................................................ 7
D.3
Strategic Plan Connection ................................................................................................... 8
2 0 0 4
S E R V I C E
C O R P O R A T E S E R V I C E S
S T R A T E G Y B U S I N E S S P L A N
TABLE OF CONTENTS (Cont’d)
D.4
Service Principles (optional)................................................................................................ 8
E. Monitoring and Measuring the Service Strategy Business Plan
E.1
Objectives and Outcomes .................................................................................................... 9
E.2
Performance Targets ......................................................................................................... 10
E.3 Corporate Performance Measurement and Benchmarking............................................ 12
F.
2004 Financial Requirements Presentation
F.1
Current Budget Introductory Comments/Analysis ......................................................... 15
F.2
Financial Structure Chart – Current Budget ................................................................... 15
F.3
2004 Current Budget........................................................................................................... 16
For F.4 Capital Budget & Forecast Introductory Comments/Analysis and F.5 2004 Capital Budget
& Forecast to 2013 Reports please refer to the Internal Support – Corporate Services section of
the 2004 Capital Budget and 2005-2013 Capital Forecast document.
2 0 0 4
S E R V I C E
C O R P O R A T E S E R V I C E S
S T R A T E G Y B U S I N E S S P L A N
A.
Background
A.1 Preparing the Service Strategy Business Plan (SSBP)
A cross-divisional Project Team (excluding Ambulance and Emergency Programs which
developed a separate SSBP) was selected to develop the department’s SSBP. The team
included:
Commissioner of Corporate Services and Regional Solicitor
Director, Communication Services
Director, Legal Services
Deputy Clerk
Senior Financial Analyst, Commissioner’s Office
Project and Financial Support Co-ordinator
Administrative Assistant to Commissioner of Corporate Services and Regional Solicitor
A.2 Key Contacts
R. Kent Gillespie, Commissioner of Corporate Services and Regional Solicitor
905-791-7800, ext. 4315
[email protected]
A.3 Additional Information
This SSBP is the second departmental plan developed for Corporate Services.
2 0 0 4
S E R V I C E
C O R P O R A T E S E R V I C E S
S T R A T E G Y B U S I N E S S P L A N
1
B.
Description of Current Services
B.1 Program Location Map
Programs are located at 10 Peel Centre Drive in Brampton.
B.2 Profile of Current Services
Governance
Corporate Services contributes to excellence in the governance of the Region by Regional
Council through the provision of a Council and Committee Secretariat and by fulfilling the
statutory duties of the Regional Clerk. Corporate Services provides professional advice
regarding by-law and policy development and Council’s relationships with related boards
and agencies. Corporate Services advocates for Council positions both in legal proceedings
and with the public at large through effective communications.
Administration
The administration of the Regional Corporation by its executive officers is enhanced by
the provision of professional advice and services in connection with policy development,
issues management and conflict resolution. Corporate Services also provides leadership
and management of selected corporate change initiatives. Corporate Services provides and
manages key internal and external corporate communications and represents corporate
interests in legal proceedings.
Program Delivery
Corporate Services is a partner with all Regional programs in the delivery of programs and
services. Corporate Services contributes a broad range of advice and services including
legal, public relations, records management, print and copy, mail, courier and call centre,
graphic design, internet and intranet development, media relations and event management.
2 0 0 4
S E R V I C E
C O R P O R A T E S E R V I C E S
S T R A T E G Y B U S I N E S S P L A N
2
B.3 Description of Clients/Customers
Regional Council and Committees
Regional Council is comprised of the Regional Chair and 21 Regional Councillors from the
City of Mississauga, City of Brampton and the Town of Caledon. Committees are
comprised of selected Regional Councillors and others approved by Council.
Regional Programs
Corporate Services provides support services to all of the programs offered through
Regional departments and Peel Living.
The Regional Municipality of Peel Police Services Board
Corporate Services provides professional advice and support services to the Police Services
Board and Peel Regional Police (PRP).
External Agencies
Corporate Services provides limited advice and support services to external public and non
profit agencies.
General Public
Corporate Services acts as an official point of access for information and access to
Regional Council and Corporate administration.
B.4 Description of Suppliers, Partners and Stakeholders
Suppliers
• Products, ranging from promotional items, print production, office equipment and
supplies, and reference materials
• Support services, ranging from equipment maintenance, confidential shredding,
communications and legal advice
• Direct services to clients such as communications and legal advice
Partners
• Livelink Users Group
• Various levels of government
• Other Regional departments involved in collaborative service delivery endeavours
Stakeholders
• Regional Council
• Various levels of government
• Law Society of Upper Canada
2 0 0 4
S E R V I C E
C O R P O R A T E S E R V I C E S
S T R A T E G Y B U S I N E S S P L A N
3
B.5 Overall Organization Structure and Staffing
Corporate Services
Commissioner of
Corporate Services and
Regional Solicitor †
(5)
Director
Communications Services
(2)
Manager
Public Affairs
(17)
Senior Associate
(Finance/Planning/
Public Works)
Director
Legal Services
(2)
Director
Clerks and Regional Clerk
(4)
Senior Legal Counsel
(14.5)
Manager
Legislative Services
(10)
Legal Counsel
Legislative
Co-ordinator
Manager
Information
Management
(7)
Senior Associate
(Health/Social Services/
Housing & Property)
Senior Associate
(Executive Office/
Human Resources/
Corporate Services)
Manager
Access Peel Services
(9)
Manager
Creative Services
(12)
Print & Copy
Co-ordinator
Team Leader
Design
Webmaster
Total Full-time Equivalent (FTE) = 82.5
(reflects Council approved positions only)
Note:
All positions listed have supervisory responsibilities
( ) Denotes all FTE in the group including the boxed position.
† Also serves Ambulance and Emergency Services
2 0 0 4
S E R V I C E
C O R P O R A T E S E R V I C E S
S T R A T E G Y B U S I N E S S P L A N
4
B.6 Significant Recent Activities/Initiatives
•
•
•
•
•
•
•
•
Leading Ontarians with Disabilities Act implementation for the Region; establishment
of Accessibility Advisory Committee (AAC) & Accessibility Plan Working Group
(APWG) for production of Regional Accessibility Plan
Provided support services during the Severe Acute Respiratory Syndrome (SARS)
outbreak such as Legal Orders, Regional Emergency Operations Centre (REOC) and
Public Inquiry Service (Call Centre)
Received 2003 Canadian Public Relations Society “ACE” Awards for West Nile Virus
Communication Strategy, Peel Water Festival, 1-2-3 That’s the Key, Clear Scents,
School Health Profiler
Received 2003 Gold Quill Award from International Association of Business
Communicators (IABC) for “Well Worth It – a Public Health Campaign to Peel
Businesses”
Received 2003 IABC Ovation Award for Peel Children’s Water Festival
Electronic Information Management (EIM) solutions have been initiated in six
program areas throughout the corporation bringing greater efficiency and productivity
as part of an ongoing project to implement EIM
Developed and negotiated standard terms and conditions for the purpose of contract
tendering which enjoy the support of the Ontario General Contractors Association
(OGCA)
Developed the legal documentation to govern South Peel water and wastewater
treatment plant expansion projects having a value of approximately $400 million
2 0 0 4
S E R V I C E
C O R P O R A T E S E R V I C E S
S T R A T E G Y B U S I N E S S P L A N
5
C.
Trends and Issues
C.1 Emerging Trends
•
•
•
•
•
•
•
•
•
•
•
•
Increase in and rapid development of technology tools to enhance service and
maximize resources
Complexity and demand for increasing quantity, quality and speed of services
Increased demand for services to be delivered electronically
Aging workforce/population
Growing cultural diversity of population
Growing public interest and involvement in the roles and responsibilities of
government at all levels
Less funding from government for services
Quality of life issues in maturing communities
Movement toward non-traditional employment relationships
Fewer skilled/qualified workers
Economic boom/economic upswing
Increase in highly infectious diseases
C.2 Key Strategic Issues
•
•
•
•
•
•
•
Position ourselves strategically within the Corporation focusing on corporate priorities
Adequate planning for use of available outsourcing resources
Obtaining adequate resources to meet the demands for services
Understanding and managing client expectations and needs
Cost sensitivity and the increasing need to prioritize among competing demands
Culture shift in the way the organization is communicating
Working within a political environment where governance and the role of the Region is
an ongoing issue
2 0 0 4
S E R V I C E
C O R P O R A T E S E R V I C E S
S T R A T E G Y B U S I N E S S P L A N
6
D.
Mandate, Objectives and Actions
D.1 Mandate and Objectives
Mandate:
Corporate Services will be dedicated to high quality, innovative, customer focused
partnerships essential to the achievement of excellence in the Region’s governance,
administration and program delivery.
Objectives:
1. To position Corporate Services as integral to the success of client goals
2. To continue developing a highly skilled, inspired and well supported Corporate
Services team
3. To partner with clients to achieve highest level of customer expectations
4. To be a leader in the creative and innovative delivery of services and contribution to
corporate initiatives
D.2 Objectives and Actions
1. To position Corporate Services as integral to the success of client goals
1.1 Review processes and services to properly align with client goals
1.2 Develop a Corporate Services Strategic Communications and Outreach Plan that
will include proactive communication/education/influence
1.3 Develop a Business Continuity Plan for Corporate Services programs
2. To continue developing a highly skilled, inspired and well supported Corporate
Services team
2.1 Ensure that leadership attributes conform with Corporate Services culture and
these attributes are applied consistently
2.2 Utilize the results of the Building Employee Satisfaction Together (BEST) survey
to develop an action plan for improvement
2.3 Maintain a range of experience and skills throughout Corporate Services through
continuing education
2.4 Develop a strategically focused program for workload management to support our
staff
2 0 0 4
S E R V I C E
C O R P O R A T E S E R V I C E S
S T R A T E G Y B U S I N E S S P L A N
7
3. To partner with clients to achieve highest level of customer expectations
3.1 Develop a customer relationship management strategy for Corporate Services
3.2 Develop a common measurement tool that demonstrates the effectiveness of our
services
3.3 Develop with internal clients their annual internal communication strategies
3.4 Anticipate and track emerging issues to ensure that proactive steps are taken in
the client’s interest
3.5 Provide reputation/image management support to ensure that issues are tracked
and proactive steps are taken where appropriate
4. To be a leader in the creative and innovative delivery of services and contribution
to corporate initiatives
4.1 Sponsor the development of the corporate-wide framework to ensure a consistent
and comprehensive approach to Citizen/Client/Customer service
4.2 Encourage the implementation of effective technological solutions
4.3 Develop a strategy for electronic access and delivery of Regional services
4.4 Develop a strategy for involving citizens in issues affecting Peel Region
D.3 Strategic Plan Connection
The objectives and actions in the Corporate Services SSBP are consistent with, and
support, the following Goals in the Region of Peel’s strategic plan, Directions for Success:
Investing in Peel’s Future.
Goal 1: Improve the community’s health, social well-being and safety
Goal 5: Be a leader in the provision and co-ordination of Regional services
D.4 Service Principles (Optional)
The Regional Values function as Corporate Services service principles.
2 0 0 4
S E R V I C E
C O R P O R A T E S E R V I C E S
S T R A T E G Y B U S I N E S S P L A N
8
E.
Monitoring and Measuring the Service Strategy Business Plan
E.1 Objectives and Outcomes
1. To position Corporate Services as integral to the success of client goals
Clients proactively seek staff input and/or involvement
•
Client resource planning (budgeting) completed in partnership with Corporate
•
Services
Opportunities for recognition of programs and employees by Council, senior
•
management and external organizations
Greater strategic influence in client program decision-making
•
Council awareness of the roles of Corporate Services
•
2. To continue developing a highly skilled, inspired and well supported Corporate
Services team
Confident, entrepreneurial and empowered staff, willing to take calculated risks
•
and accept challenges
Staff participation in department and corporate activities
•
Staff
ready and willing to accept growth opportunities
•
Staff are aware of how their work relates to corporate and departmental priorities
•
Staff articulate the benefits of strong leadership
•
3. To partner with clients to achieve highest level of customer expectations
To be recognized as delivering excellent services
•
Positive working relationships with all clients
•
Perceived as partners in planning and execution of program objectives, and
•
sharing of risks
4. To be a leader in the creative and innovative delivery of services and contribution
to corporate initiatives
EIM embraced by the corporation
•
Regularly
sought out to develop the vision for, and lead corporate initiatives
•
Recognized and sought out by other organizations for best practices
•
Receiving awards
•
All
staff recognize their role as leaders, catalysts and problem solvers
•
Regularly challenge status quo
•
Confident, entrepreneurial and empowered staff, willing to take calculated risks
•
and accept challenges
2 0 0 4
S E R V I C E
C O R P O R A T E S E R V I C E S
S T R A T E G Y B U S I N E S S P L A N
9
E.2
Performance Targets
a)
2003
Communication Services
This service is provided to Regional programs on a cost recovery basis. Client
program directors and managers determine a budget for the year based on hours of
service needed to assist with all program communications needs. In 2003, 36,159
hours of service were estimated for the budget. Projections indicate that 37,073 hours
will actually be used. Service hours represent the time during which Communication
Services’ staff are actively engaged in work for client departments.
Clerk’s Division
The three programs in Clerk’s keep statistics on the volume of their services used. In
2003 Access Peel Services responded to approximately 13,000 general inquiries and
processed 7,500 water bill payments. The corporate call centre answered
approximately 150,000 telephone calls. The mailroom processed approximately
400,000 pieces of Canada Post mail, while the Copy Centre produced almost
6,000,000 black & white copies. Information Management Services stored
approximately 11,500 boxes and processed over 6,000 service requests (i.e. box/file
file retrieval and re-filing, box accessioning and box disposal). Approximately 55
Municipal Freedom of Information and Protection of Privacy Act requests were
processed. Approximately 390 Corporate forms were analysed, designed, revised and
enhanced to Portable Document Format (PDF). Approximately 56 Corporate policies
were reviewed, created/revised and updated to the Corporate repository. There were
about 48 Council and Committee meetings requiring 7,111 agendas, which produced
1,261 resolutions and 228 documents for execution.
Legal Services
Similar to Communication Services, billable hours are projected by Legal Services
based on discussions with client departments. The service demands are not as
predictable as for Communications but are notably increasing as programs undertake
projects and services required to meet growing demands generally. In 2003, about
11,500 billable hours of service were projected. The average cost of services provided
internally by Legal Services compares very favourably (at $114 per hour including all
overhead and support personnel who do not bill for service) with average hourly rates
for externally provided services, which were $200 per hour in 2003.
2 0 0 4
S E R V I C E
C O R P O R A T E S E R V I C E S
S T R A T E G Y B U S I N E S S P L A N
10
b)
2004
Communication Services
This service is provided to Regional programs on a cost recovery basis. Client
program Directors and Managers determine a budget for the year based on hours of
service needed to assist with all program communications needs. In 2004, 41,421
hours of service are estimated for the budget. Service hours represent the time during
which Communication Services’ staff are actively engaged in work for client
departments.
Clerk’s Division
In 2004, Access Peel Services will respond to approximately 13,000 general inquiries
and process 8,000 water bill payments. The corporate call centre will answer
approximately 155,000 telephone calls. The mailroom will process approximately
400,000 pieces of Canada Post mail, while the Copy Centre will produce almost
7,000,000 black & white copies. Information Management Services anticipates a box
storage count of 12,000 and will process 6,000 service requests. Approximately 80
Municipal Freedom of Information and Protection of Privacy Act requests will be
processed. Approximately 400 Corporate forms will be analysed, designed, revised
and enhanced to PDF. Approximately 50 Corporate policies will be reviewed,
created/revised and updated to the Corporate repository. There will be approximately
36 Council and Committee meetings requiring around 13,166 agendas, which should
produce about 1,325 resolutions and 257 documents for execution.
Legal Services
Legal Services Performance Targets for billable hours in 2004 have been established
based on a standard of 1,300 billable hours per lawyer with a resultant cumulative
target for the division of 10,530 hours. An additional 4,000 non-billable hours of
administrative and other non-billable services are projected based on 2002
performance levels.
2 0 0 4
S E R V I C E
C O R P O R A T E S E R V I C E S
S T R A T E G Y B U S I N E S S P L A N
11
E.3
Corporate Performance Measurement and Benchmarking
1.
Program Efficiency
These measures will vary by program. In some cases the measure is cost per service
hour. In others, the efficiency is measured by productivity gains and cost avoidance.
As a roll up measure these costs might be compared to various business costs and
overhead. A cost as a percentage of all program budgets, both current and capital, may
be determined.
Customer surveys are conducted on all Corporate Services’ programs. The responses
show a high degree of client and customer satisfaction.
Communication Services
A total of 59 surveys were returned to Communication Services via our on-line
survey.
The following are the results.
Level of Service
Quality of Service
Product Quality
Product Satisfaction
Excellent to
Very Good
88%
76%
67%
76%
Good
Fair to Poor
8%
21%
29%
22%
4%
3%
4%
2%
Clerk’s
In Clerk’s, surveys for each of the services provided have been undertaken. The
following is a sampling of the latest statistics and comments:
Access Peel Services
In 2002, survey results indicated that 91 per cent of respondents rated their overall
satisfaction with the Mailroom service as good to very good.
In 2002, survey results indicated that 96 per cent of respondents were very satisfied
with the Print and Copy Centre. Services utilized by survey clients included black and
white copying (96 per cent) and colour copying (60 per cent).
Legislative Services
Legislative Services surveys subscribers of the Decisions newsletter once each year.
In 2001, 74 per cent of respondents thought the overall design and layout was good,
and 84 per cent found the document easy to read. The transition of this newsletter to
2 0 0 4
S E R V I C E
C O R P O R A T E S E R V I C E S
S T R A T E G Y B U S I N E S S P L A N
12
digital format and distribution has also been very well received, resulting in a 41 per
cent increase in electronic circulation and a 22 per cent reduction in hardcopy
distribution.
Information Management Services
Semi-annually (April and November), Information Management Services conducts a
training session on MFIPPA; course evaluations are submitted by the participants.
Overall comments include 100 per cent rating of Good – Excellent. An additional
survey was completed in 2002 for the Business Forms program.
Legal Services
Client surveys in the Legal Services area show the highest level of satisfaction with
the quality and timeliness of service and are virtually 100 per cent positive.
2.
Community Impact
As a support service, the level of service is determined by the operational needs of
other programs and by Regional Council. There is no external community impact
indicator.
3.
Data (not applicable)
4.
Customer Service
In this regard the effectiveness measures largely indicate a high degree of customer
satisfaction.
2 0 0 4
S E R V I C E
C O R P O R A T E S E R V I C E S
S T R A T E G Y B U S I N E S S P L A N
13
5.
External Benchmarking
300
Benchmarking Comparison of Hourly Rate with Private Legal
Services
(Based on services retained during the year)
272
270
245
250
250
238
200
150
100
127
96
96
91
105
Hourly Rate
Internal
50
Average Hourly
Rate External
0
2 0 0 4
Actuals
Actuals
Actuals
Actuals
Actuals
1999
2000
2001
2002
2003
S E R V I C E
C O R P O R A T E S E R V I C E S
S T R A T E G Y B U S I N E S S P L A N
14
F.
2004 Financial Requirements Presentation
F.1
Current Budget Introductory Comments/Analysis
The 2004 net budget for Corporate Services reflects little change from 2003. Land
Division responsibilities were transferred to Caledon in June 2003. Due to new
legislation – Ontarians with Disabilities Act 2001, a new regional program Accessibility Planning was established in 2003. Corporate Services staff is continuing
to manage limited resources to deal with support service demands and these demands
continue to grow as client programs face increasing support needs. Additional funds
are being requested for external resources to meet the excess service demand over
available resources this year.
F.2
Financial Structure Chart – Current Budget
CORPORATE SERVICES
CORPADCP
Corporate Services Administration
GC00000
Legal Services
GC02001
Accessibility Planning
GC11103
Regional Clerk and Legislative Services
GC11101
Access Peel Services
CORMISCP
Communication Services
COMSERCP
Information Management Services
GC11102
Council Facilities
GE00002
2 0 0 4
S E R V I C E
C O R P O R A T E S E R V I C E S
S T R A T E G Y B U S I N E S S P L A N
15
F.3 2004 Current Budget
Budgeted Net Cost
Change
2004
from 2003
1. Activity Analysis
Corp. Serv. Admin.
Communication Services
Access Peel Services
Region Clerk/Legislative Serv.
Accessibility Planning
Council Facilities
Legal Services
Corporate Records
Net Program Cost
2. Account Analysis
295,191
114,049
434,020
1,000,423
109,879
214,524
102,383
247,219
$ 2,517,688
10,815
(5,951)
45,533
85,833
109,879
8,396
(20,384)
25,719
$
0.87
0.34
1.28
2.94
0.32
0.63
0.30
0.73
259,840
$
Budgeted Gross & Net Cost
Change
2004
from 2003
Goods & Services
Salaries & Wages
Capital Financing
3,062,693
5,489,158
13,375
Gross Program Cost
8,565,226
1,456,466
Fees, Charges & Other
6,047,538
1,196,626
Net Program Cost
$ 2,517,688
Budgeted Net Cost/Unit
Change
2004
from 2003
3.
860,693
633,273
(37,500)
$
259,840
7.41
0.01
(0.02)
0.11
0.18
0.32
0.01
(0.07)
0.06
$
0.60
Budgeted Units of Service
*Change
2004
from 2003
Brampton
Caledon
Mississauga
115,000
17,000
208,000
6,000
3,000
Total Households
340,000
9,000
* Due to a policy change, household forecasts
previously forecast to the nearest hundred are now
forecast to the nearest thousand.
2 0 0 4
S E R V I C E
C O R P O R A T E S E R V I C E S
S T R A T E G Y B U S I N E S S P L A N
16
4. Budget Variance Explanation
Net Program Costs
Change from
2003
$
Corporate Services Admin
10,815
The variance primarily reflects an increase in internal charges
(5,951)
Communication Services
The variance is due to increased revenue from programs
Access Peel Services
This variance is due primarily to the increase in fringe benefits
45,533
Regional Clerk/Legislative Services
This variance is due primarily to the increase in fringe benefits and loss of
revenue from transfer of Land Division to Caledon June 2, 2003
85,833
Accessibility Planning
109,879
Variance primarily due to the cost of the new Accessibility Planning Program in
order to comply with the Ontarians with Disabilities Act, 2001 and fringe benefit
increases. (OMERS)
Council Facilities
8,396
Additional audio visual support for the Council Chambers
Legal Services
(20,384)
Variance is due to anticipated increase in revenue from programs and capital
projects
Information Mgmnt. Services
This variance is due primarily to the increase in fringe benefits
Net Program Cost Variance
2 0 0 4
S E R V I C E
25,719
$
259,840
C O R P O R A T E S E R V I C E S
S T R A T E G Y B U S I N E S S P L A N
17
FINANCE
2 0 0 4
S E R V I C E
S T R A T E G Y
F I N A N C E
B U S I N E S S P L A N
TABLE OF CONTENTS
A.
B.
C.
D.
Background
A.1
Preparing the Service Strategy Business Plan ..................................................................1
A.2
Key Contacts ........................................................................................................................1
A.3
Additional Information .......................................................................................................1
Description of Current Services
B.1
Program Location Map .......................................................................................................2
B.2
Profile of Current Services..................................................................................................2
B.3
Description of Clients/Customers.......................................................................................3
B.4
Description of Suppliers, Partners and Stakeholders.......................................................3
B.5
Overall Organization Structure and Staffing ...................................................................5
B.6
Significant Recent Activities/Initiatives .............................................................................6
Trends and Issues
C.1
Emerging Trends .................................................................................................................7
C.2
Key Strategic Issues .............................................................................................................8
Mandate, Objectives and Actions
D.1
Mandate and Objectives......................................................................................................9
D.2
Objectives and Actions ........................................................................................................9
D.3
Strategic Plan Connection.................................................................................................10
2 0 0 4
S E R V I C E
S T R A T E G Y
F I N A N C E
B U S I N E S S P L A N
TABLE OF CONTENTS (Cont’d)
D.4
E.
Service Principles ..............................................................................................................10
Monitoring and Measuring the Service Strategy Business Plan
E.1
Objectives and Outcomes..................................................................................................11
E.2
Performance Targets .........................................................................................................12
E.3
Corporate Performance Measurement and Benchmarking ..........................................14
F.. 2004 Financial Requirements Presentation
F.1
Current Budget Introductory Comments/Analysis . ......................................................20
F.2
Financial Structure Chart – Current Budget..................................................................22
F.3
2004 Current Budget .........................................................................................................23
For F.4 Capital Budget & Forecast Introductory Comments/Analysis and F.5 2004 Capital Budget
& Forecast to 2013 Reports please refer to the Internal Support - Finance section of the 2004
Capital Budget and 2005-2013 Capital Forecast document.
2 0 0 4
S E R V I C E
S T R A T E G Y
F I N A N C E
B U S I N E S S P L A N
A.
Background
A.1 Preparing the Service Strategy Business Plan (SSBP)
The work on the SSBP was prepared by a project team comprised of the Treasurer and
Commissioner of Finance, Director Financial Services, Director Internal Audit, Director
Corporate Finance, Manager Business Planning, Manager Financial Systems Co-ordination,
Manager Accounts Receivable, Manager Internal Audit and the Supervisor of Business
Planning Projects.
A facilitated working group comprised of the SSBP Project Team, and all Finance
supervisory staff met at key stages to provide input.
A.2 Key Contacts
Dan Labrecque, Treasurer and Commissioner of Finance
905-791-7800, ext. 4258
[email protected]
A.3 Additional Information
This was the first departmental SSBP for Finance and throughout the process, staff was
conscious of the value of understanding the work in all four divisions – Corporate Finance,
Financial Services, Corporate Energy Management and Internal Audit.
2 0 0 4
S E R V I C E
S T R A T E G Y
1
F I N A N C E
B U S I N E S S P L A N
B.
Description of Current Services
B.1 Program Location Map
Finance staff are located primarily in 10 Peel Centre Drive in Brampton. Meter Operations
staff work from the Copper Road Yard and some staff are located at other Regional
facilities.
B.2 Profile of Current Services
Financial Management
Day to day and long-term financial management of the assets, liabilities, revenues and
expenditures of the Region of Peel (including reserves and reserve funds, cash in the bank
and investments, legal claims, risk management, debt management, procurement of
supplies and services, and the payment of vendors and staff)
Policies and By-laws
Research and development of financial policies and by-laws for approval and adoption by
Regional Council
Financial Reports
Preparation of the annual business plan, annual report and tri-annual financial reports
Analysis and Advice
Preparation of financial analysis and advice on an ongoing basis
Assurance Services
Performing objective and independent reviews of management systems, processes and
controls and specific examinations related to allegations of impropriety with regular
reporting to Regional Council
Risk Evaluation
Identification of risks that threaten the achievement of corporate objectives
Billing Services
Issuing and collecting of water and wastewater bills and special assessment bills, and
handling of related inquiries
Water Meter Services
Installation, reading and repair of water meters
2 0 0 4
S E R V I C E
S T R A T E G Y
2
F I N A N C E
B U S I N E S S P L A N
Claims Resolution
Investigate claims to determine liability, negotiate resolutions and make claims payments or
issue denials
B.3 Description of Clients/Customers
Regional Council
Regional Council is made up of twenty-two members which includes the Regional Chair
and Regional Councillors from the City of Mississauga, City of Brampton, and Town of
Caledon. This also includes all of the Agencies, Boards, and Commissions (ABC’s)
Regional Councillors sit on as representatives of the Region of Peel.
Audit Subcommittee
The Regional Chair and a Regional Councillor from each area municipality participate on
the Audit Subcommittee.
Tax and Utility Ratepayers in the Region of Peel
The citizens and businesses who live and or work in Peel are ultimately the clients served
by the various supports and services supplied by Finance.
CAO, Chair and Chief
The CAO, Regional Chair and the Chief of Police all receive support and service from
Finance, particularly from Internal Audit.
Claimants
Any third party person or company who files a legal claim against the Region of Peel for
damages related to personal injury, bodily injury, property damages or errors and
omissions.
B.4 Description of Suppliers, Partners and Stakeholders
Suppliers
• Consulting and Professional services
• Software sales and service
• Banking services
• Insurance services
• Water Meters suppliers
• Hardware and Software installation and support
• Office Facilities and Equipment
• Billing services
2 0 0 4
S E R V I C E
S T R A T E G Y
3
F I N A N C E
B U S I N E S S P L A N
•
Investment services
Partners
• Cost Centre Managers
• Regional departments
• Development Community
• Area Municipalities
• Public Works
• People Information and Technology (PIT)
• Professional associations
• Other municipalities (outside the Region of Peel)
Stakeholders
• Regional Council (including the Peel Housing Corporation (PHC) and Police Services
Board
• Provincial government ministries and agencies
• Federal government departments and agencies
2 0 0 4
S E R V I C E
S T R A T E G Y
4
F I N A N C E
B U S I N E S S P L A N
B.5 Overall Organization Structure and Staffing
Finance
Treasurer and
Commissioner of Finance
(3)
Director
Financial Services
(2)
Director
Corporate Finance
(2)
Manager
Accounting Services
(31.2)
Manager
Treasury
(4)
Manager
Internal Audit
(7)
Supervisor
Corporate Reporting
Manager
Meter Operations
(32.5)
Manager
Capital and
Development Financing
(14)
Supervisor
Meter Reading
Supervisor
Capital Planning
Supervisor
Development Financing
Supervisor
Business Planning
Manager
(3)
Excellence
Team
(9)
Supervisor
Payroll
Manager
Financial Policy and
Strategic Analysis
(6)
Supervisor
Business Planning
Projects
Director
Internal Audit
(2)
Supervisor
Accounts Payable
Manager
Risk Management
(4)
Manager
Business Planning
(17)
Corporate
Energy Management
(2)
Supervisor
Meter Installations
and Repairs
Manager
Accounts Receivable
(40.2)
Sr. Financial Analyst
Supervisor
Billing Operations
Total Full-time Equivalent (FTE) – 216.90
(reflects Council approved positions only)
Supervisor
Payments Processing
Supervisor
General A/R Collections
NOTE:
All positions listed have supervisory responsibilities
( ) Denotes all FTE in the group including the
boxed position.
Supervisor
New Accounts
Manager
Financial Systems
Coordination
(9)
Team leader
Administration
Team leader
Housing
Project Manager ERP
Team leader
Police
Project Manager IPFS
Team leader
Corporate
Manager
Purchasing
(29)
2 0 0 4
S E R V I C E
Team Leader
Public Works
S T R A T E G Y
5
F I N A N C E
B U S I N E S S P L A N
B.6 Significant Recent Activities/Initiatives
•
•
•
•
•
•
•
Received Government Finance Officers Association (GFOA) Awards for the Annual
Budget and Annual Report
Achieved a Triple-A Credit Rating
Process-related improvements and initiatives including benchmarking in Financial
Services, upgraded PeopleSoft to Version 8, developing an activity based service
pricing model, developing an Internal Audit Policy and Procedure Manual,
reorganizing the risk management function and providing leadership in the Ontario
Municipal Benchmarking Initiative (OMBI) process
Innovation and efficiency related improvements and initiatives including budget
approval by Council in November, outsourcing of printing, installing a record number
of meters and accounts, introducing radio frequency meters, and exceeding investment
market return rates
Accountability related improvements and initiatives including the Peel Living financial
services integration, expanding the customer base to include a Peel Regional Police
(PRP) risk based audit work plan, implementing formal action plans and follow-ups in
the Status of Management Action Plans annual report, and issuing purchasing reports
Corporate leadership related improvements and initiatives including starting the
Business Unit Managers Forum, holding Development Charge By-law workshops, and
standardizing purchasing terms and conditions for design build facilities
Organized Corporate Energy Management, in co-operation with the Public Works and
Housing and Property to research, develop and implement a proactive plan to protect
the Region’s interest from potential impacts of deregulation of the energy industry
2 0 0 4
S E R V I C E
S T R A T E G Y
6
F I N A N C E
B U S I N E S S P L A N
C.
Trends and Issues
C.1 Emerging Trends
•
•
•
•
•
•
•
•
•
•
•
•
•
•
•
Increasing the variety of service models (outsourcing, privatization, in-sourcing) for all
or parts of the services
Increasing pressure on municipal tax and water rates varies by upper and lower tier
municipalities
Prospect of increasing senior government grants
Changes in provincial and or federal fiscal policies
Economic issues such as lower interest and tax rates, and increased inflation rates
squeeze resources
Municipalities are seeking “New Deals” with senior governments that recognize the
pressures placed upon municipal finances and the importance of infrastructure
investment for the economy and quality of life
Increasing demands for process automation and self service
Increased demands and expectations around government accountability and standards
Government and citizen push for fiscal responsibility, accountability and disclosure
Increasing urbanization of the Greater Toronto Area (GTA)
Higher growth demands lead to emergency situations with widespread impacts
Customers and clients expect more diversity from the programs and services offered
(multiple languages, extended hours of operation)
Both health and physical environments will become more of a priority for elected
officials and the public
Workforce and population are aging overall (results in shrinking workforce and
increased competitions for staff resources)
Workforce is better educated and expects more (work at home flexibility, work/life
balance, people are changing jobs faster)
2 0 0 4
S E R V I C E
S T R A T E G Y
7
F I N A N C E
B U S I N E S S P L A N
C.2 Key Strategic Issues
•
•
•
•
•
•
•
•
•
•
•
•
•
Improving financial and non financial reporting and management capabilities
Providing corporate and provincial leadership by developing protocols, processes, and
policies to improve and add value
Maintaining sustainable tax and water rates
Establishing strategies for accessing the limited grant money that is available
Continuously demonstrating value and accountability for the public good
Continuously demonstrating honesty, integrity and transparency through open and easy
communication and access to information
Developing partnerships in the organization around financial management excellence
and accountability through a commitment to measurement
Understanding how growth cost drivers impact the services
Maintaining sustainable rates for development charges to pay for growth
Continuously meeting new and changing demands from the customers (multiple
language, and twenty-four hour, seven day a week service expectations)
Managing expectations around what the public good is
Balancing work and life demands and workload issues
Anticipating skills and needs
2 0 0 4
S E R V I C E
S T R A T E G Y
8
F I N A N C E
B U S I N E S S P L A N
D.
Mandate, Objectives and Actions
D.1 Mandate and Objectives
Mandate:
Finance will ensure the financial integrity, accountability and sustainability of the Region
of Peel for the public good of its taxpayers and residents.
Objectives:
1. To develop a strong Finance team
2. To provide appropriate corporate financial leadership to ensure fiscal sustainability
3. To ensure financial processes are efficient, effective and accountable
4. To identify and respond to the changing expectations of the citizens and clients
D.2 Objectives and Actions
1. To develop a strong Finance team
1.1 Develop an appropriate succession and knowledge transfer plan for Finance
1.2 Implement a staff recognition program
1.3 Develop a comprehensive communications strategy
1.4 Prepare training and development plans for all staff that focus on areas required to
deliver the mandate
1.5 Create capacity through filling of vacancies and reinvestment of efficiencies to
support career development opportunities
2. To provide appropriate corporate financial leadership to ensure fiscal
sustainability
2.1 Initiate a corporate-wide risk management annual assessment program
2.2 Lead the investigation of asset management needs and make specific
recommendations
2.3 Develop a reserve management strategy
2.4 Develop an integrated corporate approach through partnering and leveraging to
assess and manage the impact of new development
2.5 Develop and maintain a comprehensive financial business planning process for
the Region
2 0 0 4
S E R V I C E
S T R A T E G Y
9
F I N A N C E
B U S I N E S S P L A N
2.6 Ensure that financial management systems, tools and procedures are in place to
support effective decision-making
3. To ensure financial processes are efficient, effective and accountable
3.1 Promote and ensure the financial management roles and responsibilities between
Finance, departmental business units and departmental programs are clearly
understood and fulfilled
3.2 Establish, communicate and report on appropriate performance measures
4. To identify and respond to the changing expectations of the citizens and clients
4.1 Communicate the Region of Peel’s performance results to taxpayers
4.2 Create and implement an appropriate Customer Service Plan
4.3 Identify and implement reporting metrics
D.3 Strategic Plan Connection
The objectives and actions in the Finance SSBP are consistent with, and support, the
following Goals in the Region of Peel’s strategic plan, Directions for Success: Investing in
Peel’s Future.
Goal 2: Assess and manage all aspects of growth that affect Peel
Goal 4: Contribute to a vibrant and diverse regional economy
Goal 5: Be a leader in the provision and co-ordination of Regional services
D.4 Service Principles
The Regional Values function as the Finance ’s service principles.
2 0 0 4
S E R V I C E
S T R A T E G Y
10
F I N A N C E
B U S I N E S S P L A N
E.
Monitoring and Measuring the Service Strategy Business Plan
E.1 Objectives and Outcomes
1.
To develop a strong Finance team
Highly skilled, trained and well informed staff
•
Improved service to customers
•
Improved staff morale, motivation and job satisfaction
•
2.
To provide appropriate corporate financial leadership to ensure fiscal
sustainability
Effective allocation of resources
•
Impact of development managed
•
Appropriate investment in infrastructure
•
An understanding of corporate risks
•
3.
To ensure financial processes are efficient, effective and accountable
Continuous improvement mindset
•
Optimal utilization of Finance resources
•
Improved staff morale, motivation and job satisfaction
•
4.
To identify and respond to the changing expectations of the citizens and clients
Improved service to the customers
•
Continuous improvement mindset
•
Improved staff morale, motivation and job satisfaction
•
Increased accountability to customers
•
2 0 0 4
S E R V I C E
S T R A T E G Y
11
F I N A N C E
B U S I N E S S P L A N
E.2 Corporate Finance Performance Targets (not applicable)
Internal Audit Performance Targets (not applicable)
Corporate Energy Management Performance Targets
a) 2003 (not applicable)
b) 2004
•
•
•
Establish energy baselines for the corporation
Verify historical energy bills
Perform roll out of energy management software systems with priority buildings
connected for real time monitoring
Financial Services Performance Targets
Payroll, Purchasing, Accounting and Systems Performance Targets
a)
2003
•
•
•
•
•
In the second half of the year, Property & Housing to start using Corporate
Account Services to increase productivity and support levels
Before the start of the 2004 business planning process, establish unbundled
services and pricing using continuous improvement tools like Activity Based
Costing (ABC) and Benchmarking
Use unbundled services and pricing for the 2004 business planning process
Compare the 2003 Budgeted internal charges against the unbundled service
pricing using actual volume data and communicate the results to clients
Average service units percentage increases compare to 2002 as follows:
•
•
•
•
Payroll payments by 6 per cent
Accounts Payable transactions by 20 per cent
Corporate Reporting transactions by 22 per cent
Purchasing purchase orders by 26 per cent
2 0 0 4
S E R V I C E
S T R A T E G Y
12
F I N A N C E
B U S I N E S S P L A N
b)
2004
•
Average service units percentage increases compare to 2003 as follows:
•
•
•
•
Payroll payments by 9 per cent
Accounts Payable transactions by 20 per cent
Corporate Reporting transactions by 6 per cent
Purchasing purchase orders by 2 per cent
At each Triannual adjust the 2004 Budgeted internal charges for each client based on
their actual 2004 usage of services.
Meter and Revenue Performance Targets
a)
2003
•
•
b)
Prior to the 2004 Business Plan process to have completed the ABC cost models
for Meter and Revenue Services and from those to develop unbundled costs for
the services provided to Business Units as well as external clients/customers
To establish comparators for the services provided by reviewing benchmarks in
the private and public sector organizations
2004
•
•
•
Implement at least one best practice identified during the 2003 benchmarking
process
Carry out an intensive review of the functionality of AquaPeel for the purpose of
enhancing customer service capabilities
To identify best practices of other organizations providing similar services
Improve efficiency in payroll services by implementing at least one best practice
identified in the payroll benchmarking survey.
2 0 0 4
S E R V I C E
S T R A T E G Y
13
F I N A N C E
B U S I N E S S P L A N
E.3 Corporate Performance Measurement and Benchmarking
Internal Audit
1.
Program Efficiency (not applicable)
2.
Community Impact (not applicable)
3.
Date (not applicable)
4.
Customer Service
Internal Audit has developed eight service quality standards that will be reviewed
within the division and with Regional business units.
5.
External Benchmarking
The table below shows a comparison of the total staff and budgets of comparable
municipalities in 2003.
Municipality
Halton Region
York Region
City of Toronto
City of Ottawa
City of Hamilton
Region of Peel
City of
Mississauga
City of Brampton
2 0 0 4
No. of
Prof.
Audit
Staff
2
2
23
10
4
7
4
6
Total No. of
2003 Staff
1,414
3,200
34,400
12,355
6,200
5,079
3,400
1,600
S E R V I C E
Auditors per
Total 2003
1000 Staff
Current and
Capital Budget
(millions)
$565
1.4
$1,424
0.6
$6,408
0.7
$2,195
0.8
$843
0.6
$1,645
1.4
$502
1.2
$438
S T R A T E G Y
14
3.8
Budget per
Auditor
(millions)
$328
$712
$278
$220
$211
$235
$125
$62
F I N A N C E
B U S I N E S S P L A N
Corporate Finance
1.
Program Efficiency
By its very nature, the majority of the Corporate Finance’s areas of responsibility are
not readily measurable in an objective manner, with the exception of Risk
Management and Treasury. Treasury services are readily benchmarked, however,
given the timing of changes to the scope of the Risk Management function the only
trend lines that currently exist are related to the claims administration component of
the risk management function.
CORPORATE FINANCE
Unit Cost
Service Unit Costs
Unit
Actual
Budget
Budget
Growth
2003 Actual
Growth
2002
2003
2004
'04 vs '03
Service Units
03 vs 02
Process
Insurance: A $
Treasury*
482.54 $
3 b.p.
594.18 $
3 b.p.
636.71
3 b.p.
7.2%
482 claims
0.0%
1.5 billion
1.5%
average
portfolio
7.1%
Treasury costs expressed as a % of total holdings. "b.p." = basis point or 1/100th of a % point
2.
Community Impact (not applicable)
3.
Data (not applicable)
4.
Customer Service
One of the key components to the division’s long-term business plan is the
development of objective customer service indicators for all clients groups, both
internal and external.
5.
External Benchmarking
As part of the Finance department’s commitment to service excellence, its service
units have undertaken to identify opportunities to improve efficiency and
effectiveness. Given the complexity of some aspects of the department’s service
profile, not all areas have found benchmarks to be a clear “apples to apples”
2 0 0 4
S E R V I C E
S T R A T E G Y
15
F I N A N C E
B U S I N E S S P L A N
comparison and the following review represents a sample of recent benchmarking
initiatives.
The Region’s Treasury unit manages an investment portfolio in excess of one billion
dollars. Management assesses our total return against comparable market benchmarks
and we compare our operating costs against those being quoted by other market
providers.
Over the past five years, Treasury’s management fees have fluctuated between three
and four basis points (basis point = 1/100th of a percentage point) on total investment
assets. In comparison, the management fees for the Association of Municipalities of
Ontario (AMO)’s One Fund are 19 basis points for the money market fund and 40
basis points for the bond fund. This has resulted in savings of millions of dollars in the
portfolio management fees.
The Region’s total return is benchmarked against a composite of the Scotia Capital
Bond indexes. As shown in the chart below, the Region continues to out-perform the
market benchmark. Peel’s total return has been, on average, one per cent higher than
the benchmark over the past five years, which equates to $13 million per year.
TOTAL RETURN
Peel vs Scotia Capital Bond Indexes
as at July 31, 2003
5 Yr. Avg.
3 Yr. Avg.
1 Yr. Avg.
Region of Peel
7.0%
7.1%
4.8%
Scotia Capital Bond
5.9%
6.4%
3.6%
2 0 0 4
S E R V I C E
S T R A T E G Y
16
F I N A N C E
B U S I N E S S P L A N
Financial Services
Payroll, Purchasing, Accounting and Systems
1.
Program Efficiency
We have refined our 2004 unit costs in line with detailed Activity Based Costing
(ABC). We will be charging our clients based on their actual 2004 usage of our
services. Aside from these refinements, changes in unit cost are generally the result of
annual fluctuations in volume due primarily to growth and increases in total costs as a
result of inflation and performance
Payroll, Purchasing, Accounting & Systems
Service Unit Costs
2002
2003
2004
Process
Payroll Average Rate
Payroll Unbundled Rates:
$
6.82
$
7.00
$
7.35
$
$
$
$
$ 1,253
$
Pay Deposits
Pay Cheques
New Hires
Terminations
Purchasing Services
$ 1,268
Accounts Payable Average Rate **
$
Accounts Payable Unbundled Rates:
Regular Invoices
Express Cheques
Progress Payment Certificates
Recurring Payments
Purchase Cards **
7.48
Corporate Reporting Average Rate
$
Corporate Reporting Unbundled Rates:
Current Fund Cost Centres
Journals Entries
Capital Fund Journal Entries
General Ledger Training
Customized Reports
Bank Reconciliation
Cash Payments (Petty Cash)
Distribution Services:
Payroll Notifications
Accounts Payable Cheques
Manual Cheques
1.29
$
7.49
1.50
Unit Cost
Growth
04 vs. '03
2004
Service Units
5.0%
142,620
No. of pays
6.85
37.00
33.00
21.00
*
*
*
*
142,115
505
1,130
890
No.
No.
No.
No.
$
1,443
15.2%
$
8.14
$
$
$
$
$
6.65
14.30
9.70
16.60
38.70
$
1.50
1,800
of
of
of
of
pays
pays
hires
terminations
Unit
Growth
'04 vs '03
9.2%
*
*
*
*
No. of P.O.s
2.3%
20.0%
8.7%
143,770
No. of lines
*
*
*
*
*
130,515
3,390
3,260
845
5,760
Invoice lines
Invoice lines
No. of lines
No. of lines
No. of statements
0.0%
497,570
No. of lines
$ 295.00
$
0.25
$
2.10
$ 100.00
$ 75.00
$ 55.00
$ 75.00
*
*
*
*
*
*
*
1,225
451,505
46,065
70
115
975
90
Cost centres
No. of lines
No. of lines
Days
Labour hours
Labour hours
Per fund
*
*
*
*
*
*
*
$
$
$
*
*
*
142,115
42,400
930
No. of notifications
No. of cheques
No. of cheques
*
*
*
0.20
1.35
6.40
*
*
*
*
*
5.9%
* In 2004, unbundled service costs have been calculated for the first time.
** Accounts Payable Average Unit Costs re-stated for 2002 & 2003 - In 2004, Purchase Card Units changed from number of lines to statements
2.
Community Impact (not applicable)
3.
Data (not applicable)
2 0 0 4
S E R V I C E
S T R A T E G Y
17
F I N A N C E
B U S I N E S S P L A N
4.
Customer Service
The SSBP for Payroll, Purchasing, Accounting and Systems included an annual
surveying of both internal and external clients in regards to service satisfaction. We
have embarked on the benchmarking of our services to increase efficiency and
effectiveness. This work will include the continued development of objective customer
service indicators for all client groups
5.
External Benchmarking
As noted above, the SSBP for Payroll, Purchasing, Accounting and Systems includes
actions to refine costs using ABC and external benchmarking.
Meter and Revenue Corporate Performance Measurement and Benchmarking
1.
Program Efficiency
Meter & Revenue Services
Unit Cost
Process
Meter Installation/Repair
2002
Service Unit Costs
2003
2004
Unit
2004
Service Units
Growth
04 vs. '03
$
26.18
$
29.50
$
33.48
13.5%
21,150
Residential
$
0.78
$
0.77
$
0.79
2.6%
Commercial
$
2.22
$
2.30
$
2.48
7.8%
$
3.91
$
4.00
General Invoices
$
34.91
*
3,746
Receipt/Deposit
$
1.64
*
36,251
Weight Ticket Report
Growth
'04 vs '03
works orders
4.1%
934,000
reads
5.0%
82,650
reads
1.0%
Meter Reading:
Accounts Receivable
invoice lines
*
Receipt/Deposit Lines
*
$
23.69
*
1,212
No. of Reports
*
Trust Cheque
$
7.60
*
480
No. of Cheques
*
Letter of Credit
$
23.12
*
178
No. of L/Cs
*
Water/Wastewater Bill
$
2.94
*
1,057,404
No. of Bills
*
Special Assessement Billing
$
79.00
*
1,274
No. of Accounts
*
$
34.93
14.9%
1,600
meters
Meter Replacement:
Residential
$
28.72
$
30.40
0.0%
* In 2004, unbundled service costs have been calculated for the first time.
Further refinements have been made to the calculation of unit costs and volumes for 2004 as
a resulting from more detailed ABC rates and volumes. Also, changes in unit cost are
generally the result of annual fluctuations in volume due primarily to growth and increases in
total costs as a result of inflation and performance. The exception is Meter Installation/Repair
2 0 0 4
S E R V I C E
S T R A T E G Y
18
F I N A N C E
B U S I N E S S P L A N
where unit cost growth has increased significantly due to a provincial requirement to now use
licensed plumbers for commercial meter installation and repairs.
2.
Community Impact (not applicable)
3.
Data (not applicable)
4.
Customer Service
The SSBP for Meter and Revenue Services includes the continued surveying of clients in
regards to service satisfaction as well as actions to refine costs using ABC and benchmark
processes. This work will include the continued development of objective customer service
indicators for all clients groups.
5.
External Benchmarking
As noted previously, the SSBP for Meter and Revenue Services includes actions to refine
costs using ABC and external benchmark processes.
2 0 0 4
S E R V I C E
S T R A T E G Y
19
F I N A N C E
B U S I N E S S P L A N
F. 2004 Financial Requirements Presentation
F.1
Current Budget Introductory Comments/Analysis
Internal Audit
The Region has expanded and become more complex. The Housing and Property Department
has established the Housing Division. This new division will deal with social housing
administration responsibilities downloaded by the Ministry of Public Infrastructure and
Housing. Long Term Care will increase in size by adding 320 new beds in two new longterm care facilities. The Region has assumed responsibility for delivering the Ambulance
Program. Children’s Services is delivering several new subsidy and funding programs.
Internal Audit has expanded its client base to include Peel Regional Police and has approval
within their Risk Based Audit Plan to conduct several audits. The first audit will be a review
of the Information Technology (IT) area. Specialized technical expertise will be required to
efficiently and effectively carry out this audit.
Internal Audit aims to follow the International Standards for the Professional Practice of
Internal Auditing issued by the Institute of Internal Auditors. The standards require all
professional internal audit groups to develop and maintain a quality assurance and
improvement program. A requirement of the quality assurance and improvement program is
an external assessment to be conducted at least every five years by a qualified, independent
reviewer or team from outside the organization.
Our 2003 to 2005 Business Plan includes a request for additional budget funds in 2004 so
Internal Audit can continue to provide satisfactory assurance to management and the Audit
Subcommittee that new or enhanced functions are operating effectively, and that long
established programs are meeting the challenge of change. Specifically, additional funds are
being requested for consulting skills to assist with the audit of IT at Peel Regional Police, to
pursue accreditation as a Professional Internal Audit organization from the Institute of
Internal Auditors.
Corporate Finance
Corporate Finance’s 2004 Budget reflects an overall increase in gross spending of $937,317
on its 2003 budget base of $5.85 million, for a increase of 16.0%. After internal allocations
and other recoveries the net budget indicates an increase of $242,182 or 7.7% over the 2003
net budget of $3.16 million.
Most of the impact on the division’s budget is related to increases in the cost of staff due to
salary and benefit rate increases plus the impact of annualization.
2 0 0 4
S E R V I C E
S T R A T E G Y
20
F I N A N C E
B U S I N E S S P L A N
Financial Services
Payroll, Purchasing, Accounting and Systems
For 2004, the Payroll, Purchasing, Accounting and Systems services program of Financial
Services has an increase in gross expenditures of 4.4 per cent.
After internal recoveries and other revenues, the net budget decrease is 8.0 per cent.
Salaries and benefits accounted for the majority of the impact in gross expenditures with an
increase of 15.3 per cent mainly due to increase in the Ontario Municipal Employee
Retirement System (OMERS) pension contribution.
Relatively minor increases are anticipated in the maintenance costs for the Financial
Management Information Systems (FMIS).
Meter and Revenue
For 2004, the Meter and Revenue Services program of Financial Services has an increase in
gross spending by 4.2 per cent over the 2003 gross budget of $9,281,251. The net budget,
after internal allocations and other revenues, has increased by $1,722.
It is anticipated that billing volumes will increase by 3.5 per cent. This increase in new
accounts is driving the increase in the printing and insertion contract for water bills as well as
the bank payment processing service costs.
An increase in the new equipment costs is largely offset by substantial reductions in internal
charges from Public Works and IT as well as the increase in service fees and charges based
on actual costs of providing the services.
The balance of the increases is largely the result of salary progressions and fringe benefits
with the final phase out of the OMERS pension holiday. We have also added one full time
complement position to handle the increased volume of accounts.
2 0 0 4
S E R V I C E
S T R A T E G Y
21
F I N A N C E
B U S I N E S S P L A N
F.2
Financial Structure Chart – Current Budget
FINANCE
FINANCCP
Finance Admin
FA00000
Internal Audit
FA00001
Corp Energy Management
FA00004
Excellence Team
FA00005
Corporate Finance
FINCTLCP
Financial Policy and Analysis
FA00002
Planning & Budgets
FINFPRCP
Insurance & Risk Mgmnt.
INSURNCP
Corporate Finance Admin
FR00000
Treasury Services
FT10001
Capital Development Financing
FINCDFCP
Financial Services
FINSERCP
Financial Services Admin.
FC30000
Meter & Revenue Services
FINMORCP
Payroll, Purchasing, Acct’g & Systems
FINAPSCP
2 0 0 4
S E R V I C E
S T R A T E G Y
22
F I N A N C E
B U S I N E S S P L A N
F.3 2004 Current Budget
1. Activity Analysis
Office of the Commissioner
Internal Audit
Corporate Finance
Financial Services
Net Program Cost
2. Account Analysis
Budgeted Net Cost
Change
2004
from 2003
1,463,444
830,074
3,400,737
4,310,439
$ 10,004,694
Budgeted Net Cost/Unit
Change
2004
from 2003
134,420
135,353
242,182
(393,720)
$
4.30
2.44
10.00
3.82
118,235
$
Budgeted Gross & Net Cost
Change
2004
from 2003
Goods & Services
Salaries & Wages
Capital Financing
10,457,657
14,068,994
4,352,418
723,250
2,219,796
(612,500)
Gross Program Cost
28,879,069
2,330,546
Fees, Charges & Other
18,874,375
2,212,311
Net Program Cost
3.
$ 10,004,694
$
118,235
20.72
0.29
0.34
0.46
0.58
$
1.82
Budgeted Units of Service
*Change
2004
from 2003
Brampton
Caledon
Mississauga
115,000
17,000
208,000
6,000
3,000
Total Households
340,000
9,000
* Due to a policy change, household forecasts
previously forecast to the nearest hundred are now
forecast to the nearest thousand.
2 0 0 4
S E R V I C E
S T R A T E G Y
23
F I N A N C E
B U S I N E S S P L A N
4.
Budget Variance Explanation
Net Program Costs
Change from
2003
Increase of 3.6 Full Time Equivalent (FTE) Purchasing (1), Corporate Energy (1)
and Accounts Receivable (1.6) to reduce services pressures
158,100
Increase in Salary and Wages for the maintenance of existing staff including
merit, progressions and benefits including the cost of the OMERS
2,061,696
Contingency for specialist support in Internal Audit
40,000
Increase in insurance premiums due to market increases
304,232
Legal fees for Insurance program
445,000
Increase in volume based internal charge recoveries
(1,368,970)
Increase in external fees and charges primarily related to new accounts and meter
installations
(514,426)
Contribution from the Insurance reserve to phase in the cost increases
(350,000)
Reduction in reserve contribution based on lower forecasted system investments
in the capital plan
(612,500)
Net reduction in other expenses
(44,897)
$
Net Program Cost Variance
2 0 0 4
S E R V I C E
S T R A T E G Y
24
118,235
F I N A N C E
B U S I N E S S P L A N


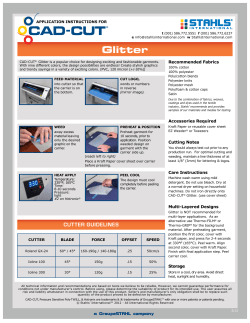


© Copyright 2026