
Business Plan Fiscal Year 2010-2011 San Diego Housing Commission 1122 Broadway, Suite 300
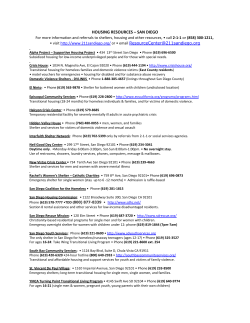
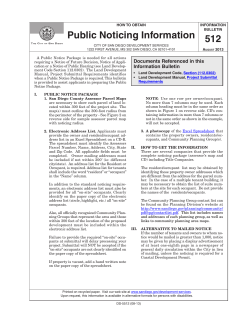
Business Plan Fiscal Year 2010-2011 San Diego Housing Commission 1122 Broadway, Suite 300 San Diego, CA 92101 www.sdhc.org Table of Contents Executive Summary …………………………………………………………….………. 2 Business Plan Goals, FY 2011…………….…………………….....………...…………… 3 Operations Plan……………………………………………………………….………… 4 Real Estate Department…………………………………………………………..…… 5 Rental Assistance Department……………………………………….……………….. 11 Board & Executive/Policy Department………………………………………….…… 15 Community Relations & Communications……………………………………….….... 17 Business Services…………………………………………………………………..…. 20 Financial Services…………………………………………………………………...…25 Special Housing Initiatives…………………………………………………………… 27 Financial Analysis………………………………………………………………………. 30 Agency Analysis…………………………………………………………………….…... 36 Market Analysis………………………………………………………………….….….. 38 Customer Analysis…………………………….……………………………………..…. 42 Marketing Plan………………………………………………………………………..…45 Appendix……………………………………………………………………………….. 48 Our Partners…………………………………………………………………………….51 Executive Summary The San Diego Housing Commission (SDHC) is a public agency working to expand affordable housing opportunities in the City of San Diego. Each year, the agency helps about 76,000 lower income individuals with affordable housing through award-winning programs that benefit the city’s economy and revitalize neighborhoods. The agency also finances affordable housing development and advises the San Diego City Council on housing policy matters. Founded in 1979 with just 50 employees and a budget of about $15 million, the agency now has an annual budget of more than $290 million and 260 employees. The agency’s primary source of funding is the U.S. Department of Housing and Urban Development (HUD). The agency does not receive any City of San Diego General Funds. In 2005, the agency’s leadership team began utilizing three-year business plans as a strategic management tool to identify priorities, guide agency activities, and align staff and resources behind common goals. This document, which builds upon previous plans, offers a clear roadmap for fiscal year 2011. The agency’s Business Plan and financial reporting run on a fiscal year calendar of July 1 through June 30. The FY 2011 Business Plan is being published as the agency begins the first year of a three- to five -year finance plan aimed at increasing by more than 1,000 the number of agency owned affordable housing units. Business Plan Structure: The Business Plan is modeled after private sector business planning practices: • The Operations Plan includes 49 strategies in support of the Housing Commission mission; • The Financial Analysis presents the agency’s fiscal position, revenue sources and financial projections; • The Agency Analysis reviews the agency’s past success indicators and unique qualifications; • The Market Analysis and customer analysis provides context of the agency’s current environment and identifies the agency’s customers and their needs; 2 Business Plan Goals, FY2011 The agency’s Commissioners, management team, and multiple levels of staff provided input into the development of the Business Plan. This effort resulted in five focused goals: 1. Broaden the Housing Commission’s mission to provide affordable housing for a wider San Diego population, from assistance for the homeless to opportunities for workforce housing. 2. Model effective application of private sector techniques in a public sector operation. 3. Become a national model in initiating and implementing new, progressive ideas to address affordable housing needs across the country. 4. Provide a positive customer experience through the seamless, efficient and professional delivery of our programs and services. 5. Continue to be an employer of choice in San Diego by offering professional development initiatives and treating staff members in a fair and equitable manner. 3 Operations Plan The San Diego Housing Commission’s organizational structure is composed of a President & Chief Executive Officer, an Executive Vice President & Chief Operating Officer, a Senior Vice President of Real Estate and five Vice Presidents as shown below. The President & CEO is responsible to the Board of Commissioners and to the City of San Diego Housing Authority. The Vice Presidents are charged with developing and operating all programs and activities under the direction of the Executive Vice President. Each year, Departments develop the next fiscal year budget based on existing strategies that continue and new strategies that will be added. The following Operations Plan includes new strategies supported by the action to be implemented, the measurement of success, and approximate cost. Each of the 49 strategies identified support one or more of the agency’s primary goals. Organizational Chart 4 Operations Plan: Real Estate Department The Real Estate Department applies its resources to seven areas of work: Asset Management: This unit of RED is responsible for the agency’s real estate assets, currently includes over 1800 apartment units, a main office location, and two satellite locations. The Asset Management unit is comprised of two sections: Asset Services and Property Management. Rental Housing Production: Working in coordination with the Special Housing Initiatives Department and through favorable financing and incentives to non-profit and for-profit developers, SDHC has helped produce more than 13,400 affordable housing units. Housing Rehabilitation: SDHC provides technical and financial assistance to owners of older homes in need of repair. This unit of RED also is responsible for achieving the goal of eliminating lead paint from homes. Homeownership/Compliance: Through closing cost assistance, down payment grants and “silent second” mortgages, SDHC has helped many families purchase their first home. This unit of RED also assists with placing first time homeowners in properties that SDHC has acquired through the use of Neighborhood Stabilization Program (NSP) funds. RED also is responsible for the on-going monitoring required to assure compliance with the various affordable housing policies and regulations. Acquisitions/Finance: With the conversion of the former public housing units to debt free ownership of the SDHC, this unit of RED is responsible for the placement of debt, securing real estate loans, and acquiring/producing additional affordable/workforce housing. Real Estate Management: The Real Estate Management team is responsible for the due diligence in acquiring new properties, development proforma, project schedules, entitlements, project budget maintenance, and all necessary governmental approvals. Public Housing: SDHC remains as the custodian of public housing units and is responsible for the maintenance of those units as well as the production of additional public housing units. 5 Operations Plan: Real Estate Department Affordable Rental Housing Production Strategies Action to Implement Measurement Estimated $ / Source 1. Provide for the development of affordable housing through a variety of activities. Provide project NOFA structuring, underwriting and residual receipts loans and land use incentives to affordable housing developers and operators. Annual creation of 220 new affordable housing units restricted for 55 years. $9.6 million/ year HOME, Affordable Housing Fund Manage Multifamily Bond Program by obtaining project financial analysis, underwriting and approvals to issue from both the State and Housing Authority. Production rate of 100 units or one (1) new bond issuance per year. Produce and complete additional SDHC-owned rental units to meet commitment of 350 units. 300 units built and/or acquired. 2. Develop additional affordable housing units. 3. Finance Plan Update Present quarterly reports including information from financial consultant when presenting Capital Budget. Quarterly reports to the San Diego Housing Commission and Semiannual reports to the San Diego Housing Authority. 4. Neighborhood Stabilization Program Manage the Neighborhood Stabilization Program and ensure that the program goals & deadlines are met. Compare established goals on a monthly basis to actual progress. 5. Public Housing Development Develop additional Public Housing units via acquisition through the U.S. Department of Urban Development. Creation of 30 units restricted as HUD public housing for 40 years. $60 million (FHA/Fannie Mae) $39,500 NSP Funds $4.2 million U.S. Department of Housing & Urban Development 6 Operations Plan: Real Estate Department Affordable Rental Housing Production Strategies Action to Implement Measurement 6. Pursue new affordable housing financing sources and tools to obtain better leverage of loan dollars. Encourage use of and interface existing loan programs with: MHSA, TOD and Infrastructure funds. Identify at least one additional new source in project finance structures. 7. Revise Rental Housing Production NOFA to include new acquisition standards, such as green building, energy efficiency and universal design. Consult developers, architects, experts, consultants to develop proper measurement standards or thresholds to be encouraged in the NOFA. Affordable housing projects that include these amenities are given preference for financing. Estimated $ / Source $100,000 7 Operations Plan: Real Estate Department Asset Services/Property Management Strategies Action to Implement Measurement 8. Manage Smart Corner Office. Participate in lease process for potential tenants on ground and second floors. Achieve full occupancy by leasing remaining ground floor and second floor spaces. 9. Update Capital Improvements. Identify new work items given transition to private sector methodology, establish funding source for work items, and contract for work. Complete needs assessment and highest priority work. 10. Explore repositioning of Commission-owned underperforming assets. Analyze viability of smaller properties for disposition or retention. Complete analysis. 11. Refinancing of Office building. Provide alternative funding options for the Housing Commission’s office building. Refinance the existing loan on the San Diego Housing Commission headquarters, prior to its maturity in 2011. 12. Implement methodology to monitor outside management of properties with the Commission ownership interest. Create policies and procedures. Create performance standards. Specific performance measures monitored by individual contract. Estimated $ / Source $1,400,000/year $100,000 Loan Fees, SWAP brokerage fee. 8 Operations Plan: Real Estate Department Homeownership Strategies Action to Implement Measurement 13. Provide first-time homebuyers resources and funding tools. Underwrite process and fund all first-time homebuyer program loans and grants in accordance with SDHC policies, guidelines and regulations. Assist a minimum of 80 homebuyers. 14. Market programs; attendance at housing fairs. Utilize staff to attend fairs and answer questions; make marketing materials available. Attend two promotional activities per year. Estimated $ / Source $3.7 million/ NSP, HOME, HTF, Inclusionary Housing & CCDC 9 Operations Plan: Real Estate Department Housing Rehabilitation Strategies 15. Offer Rehabilitation assistance through several programs. Action to Implement Measurement Estimated $ / Source $2.5 million/year HOME, Housing Trust Fund, NSP Review, obtain approvals and fund rehabilitation loans; provide technical assistance to low-income owner borrowers. Provide 180 Housing Rehabilitation loans/ grants per year. Review, approve and fund lead remedial grants; provide technical assistance; apply for two new HUD Lead Grants for FY2011-2013. Provide 10 accessibility grants per year. 16. Administer Redevelopment Area rehabilitation programs in eight redevelopment areas. Review, approve, and fund loans; provide technical assistance. Obtain a fee for services which generates $300,000 per year, and continue to market our services for additional redevelopment areas. Provide 70 rehabilitation loans per year. $2.25 million/ year Redevelopment 17. Perform in-house lead testing and clearances rather than out-sourcing for increased efficiency and additional revenue from general rehab and other SDHC programs. Purchase lead testing equipment and cover staffing of new inspector with existing HUD Lead Grants. Complete lead tests and clearances of all HUD lead grant projects plus additional 100 lead inspections and 65 clearances per year on general rehab and other HC programs. Existing HUD lead grant funds for lead testing and clearances plus estimated $60,000 per year net cash flow. Lead paint remediation for 160 units per year. $2.3 million per year for three years from HUD Lead Grants $35,000/year Housing Trust Fund 10 Operations Plan: Rental Assistance Department Each month, SDHC’s Rental Assistance Program helps more than 13,700 low-income families, seniors and persons with disabilities pay rent in private apartments. Over the fiscal year, Rental Assistance will focus on maximizing available Housing Assistance Payment funding to serve the maximum number of clients possible while remaining in strict compliance with federal, state and local requirements. The Department will also identify innovative methods to move away from the traditional model and toward a Profit Center/Private Sector model. Staff will streamline procedures involved in the processing of client files and adjust the structure of the department to remove redundancies among teams and maximize efficiency across the department. In addition, the Department will explore areas in which the customer experience can be improved (for example, expanded internet tools). 11 Operations Plan: Rental Assistance Department Estimated $ / Source $65,000 to be paid from HCV funding/HCV reserves. Strategies Action to Implement Measurement 18 Promote deconcentration of poverty. Create initiatives designed to move families from highpoverty areas to low-poverty areas by increasing Payment Standards in some areas of San Diego. Increase by 10% the number of HCV families moving to the seven zip codes designated as “low poverty”. 19. Provide Housing Opportunity for Homeless. Design MTW program to assist homeless families by partnering with local non-profit agency to provide needed services. Select agency partner and complete the design of the program. $350,000 per year to be paid from HCV funding/HCV reserves. 20. Improve Customer Experience. Provide Educational and Outreach seminars for current and prospective owners/ property managers, designed to educate owners about the program and to encourage participation. Schedule 2 owner outreach seminars and add 10% new owner participants. $1,500 from HCV Admin Funds. Complete implementation of new web services designed to improve customer service for owners and clients, including the ability to see unit inspection scheduling and results. 2 new web services available to clients. $10,000 from HCV Admin Funds. Conduct targeted outreach to inform clients of new MTW programs and developments and to seek feedback on new MTW initiatives. Tenant and Owners Newsletter sent twice per year to all owners and participants. $10,000 from HCV Admin Funds. 12 Operations Plan: Workforce & Economic Development Strategies 21. Promote client self-sufficiency efforts. Action to Implement Recruit tenants into FSS Program. Full and short term FSS programs are provided. Measurement 100 New enrollments. 50 New escrow accounts. Estimated $ / Source $400,000 HCV FSS Grant. 20 FSS graduates. Assist clients establish and complete academic goals. 23 Book scholarships. Provide referrals for vocational training. 35 Participants receive vocational training. Provide workforce skills training and employment search methods. 35 Unemployed tenants gain employment. $6,000 HCV Reserves. 25 Employed tenants gain higher paying jobs. 5 Participants start small/micro businesses. Conduct Asset Building Program recruitment. 50 Attend the Asset Building orientations. 35 Join and open Bank & IDA accounts. $170,000 HSS AFI Federal & Non Federal Grants. 20 Asset Building Program participants acquire selected asset. 22. Develop Homeownership Develop an effective Homeownership Curriculum and assist with first-time homebuyer programs. 35 Homeownership Track graduates. 3 New homeowners. 13 Operations Plan: Workforce & Economic Development Strategies 23. Implement new self-sufficiency efforts 24. MTW Initiative Action to Implement Measurement Establish an Economic Development Academy through redesign of program and relocating services to central location(s). Pursue ongoing funding. 130 youth and adults served. Utilize Moving To Work designation to include otherwise non-eligible tenants in Workforce Development and Asset Building programming. 10 youth and adults otherwise non-eligible for programming served. 5 Private and Public partners provide in-kind services, technical support, and/or funding. Estimated $ / Source $1.3 million HCV Reserves HUD NN Grant $10,000 HCV Reserves 14 Operations Plan: Board & Executive / Policy Department The Policy Unit is responsible for forming and revising local housing policy, acting as the policy advisor to the City Council, and for managing government relations activities on the local, state and federal levels. Over the next year, Policy will focus on local regulatory issues and will maintain existing relationships and housing policy committee memberships. Staff will also seek to establish and strengthen both state and federal connections to better serve low-income families in San Diego and raise the agency’s profile by bringing attention to SDHC’s legislative priorities. 15 Operations Plan: Housing Policy Strategies Action to Implement Measurement 25. Provide policy guidance to City on existing policies & ordinances that address housing issues. Develop recommendations for Housing Impact Fee based on report to be received in July 2010. 26. Continual participation on various San Diego Housing-related Board, Committees, and Working Groups. Participate on Housing Opportunities Collaborative (HOC) Board; SD Regional Chamber of Commerce’s Housing Policy Subcommittee; SD Housing Federation’s Policy Subcommittee; and SANDAG’s Regional Housing Working Group. Completion & submission of 2010 Housing Impact Fee Nexus Study to Housing Commission & City Council. Active role on Board, Subcommittees, and Working Groups. 27. Identify additional revenue sources for Housing Trust Fund (HTF). Analyze data received in July 2010. Develop recommendations based on report. Completion & submission of “Alternative Housing Revenue Sources” report to Housing Commission & City Council. 28. Implement TransitOriented Development (TOD) Plan(s). Identify potential activities & funding sources for Initiative. 29. Create a system to track local, state, federal legislative actions and establish a legislative priority list for each year. Work with IT Group to develop/provide database to compile/analyze legislative actions. Submit application; Foster local & national partnership to enhance San Diego’s presence in the TOD / Affordable Housing arena. Installation and operation of database; Initial data analysis and legislative action list prioritized. Recommend additional funding sources to policy makers. Estimated $ / Source $50,000 $50,000 $100,000 $10,000 16 Operations Plan: Community Relations and Communication Community Relations & Communications is responsible for the agency’s internal and external communications, community outreach, and media and public relations activities. The department was reorganized in mid-2009 to become more proactive in telling the agency’s story. Using new communication tools such as videography and social media the department will highlight major programs. In addition, the department will pursue new marketing strategies and a rebranding effort that includes refreshing the agency’s Web site to promote transparency in government. In early 2010, for the first time, the general public will be able to listen to the meetings of the Housing Commission Board via live streaming audio on the Web site. To make the Web site more user-friendly and easier to navigate, content is being revised and video clips are being added. Community Relations efforts will be heightened with the launch of a speakers’ bureau this year. 17 Operations Plan: Community Relations & Communication Department Strategies Action to Implement Measurement 30. Raise the profile of the Housing Commission by promoting its successful programs to key funding sources and decision makers. Use newly updated Web site to highlight agency’s accomplishments and its broad range of activities; incorporate social media tools to increase local, regional and national presence; publish timely, informative electronic communications; produce compelling video stories about the people SDHC helps; and coordinate with City Council offices to recognize major milestones, e.g., the completion of new affordable housing projects. Increased awareness, which will be measured by a survey. 31. Gauge the public’s perception of SDHC and its affordable housing mission. Conduct opinion survey. Data Summary completed will be used as another tool to and analyzed. Report set priorities. prepared for distribution. Estimated $ / Source In-house communication resources. $10,000 marketing survey consultant 32. Assist the Real Estate Department in its effort to market multi-family units that are rented at or below 80 percent AMI. Launch awareness campaign and produce marketing materials. Target businesses and their employees who work near the new multifamily developments. 95% occupancy rate at the agency’s new affordable apartments. In-house communications resources. 33. Highlight success of the Economic Development Academy. Develop marketing strategy in cooperation with the Work with Workforce and Economic Development staff. Increased grants and donations above those received in earlier fiscal years. In-house c ommunications resources. 18 Operations Plan: Community Relations & Communication Department Strategies Action to Implement Measurement 34. Enhance community relations efforts. Launch a speakers’ bureau; produce educational video touting the agency’s vision and accomplishments to be used by speakers at community events; and use Web site to solicit requests from the public for agency speakers. Increased number of requests for speakers, programs, and new partnerships for our diverse programs. More awareness in community & support for SDHC programs and activities. 35. Redesign the Intranet to use new technologies such as video posting. Work with Business Services to evaluate the need. Hire a Web site consultant to perform the work. Future survey to obtain feedback from staff regarding better communications. Estimated $ / Source In-house communications resources. $10,000 HC Local Funds 19 Operations Plan: Business Services During the next fiscal year, the focus of the Business Services Department will be to continue to improve customer experience and provide excellent service delivery in support of the operating departments through Human Resources, Purchasing, Information Technology, and Organizational Development & Training. The Agency’s mission will be accomplished through broad collaboration, recruiting and developing appropriate staff, providing the right goods and services and delivering the best current technology. 20 Operations Plan: Business Services Information Technology Estimated $ / Source Strategies Action to Implement Measurement 36. Implementation of agency business continuity and disaster recovery plan in conjunction with agency management team. Identify technology and implement solution. Successful completion of a business continuity test. $50,000 HC Local Funds 37. Utilize Microsoft SharePoint technology to facilitate better internal agency communication. Implement Intranet in SharePoint. Launch of new intranet site in SharePoint. $50,000 HC Local Funds Develop and implement SharePoint template for internal project management. Implementation of project management template. 21 Operations Plan: Business Services Human Resources Strategies 38. Explore purchasing of benefits pool with local agencies pool. Action to Implement Explore feasibility and willingness to collaborate with the other agencies in order to leverage purchasing power. Measurement Accomplish a reduction or smaller rate of increase in benefit costs for FY12 plan year. Estimated $ / Source $8,500 HC Local Funds Form required legal consortium to facilitate formal buying pool. Negotiate needed benefits contracts. 39. Develop a pay for performance system. Complete survey of similar public and private organizations that have implemented performance evaluation/pay for performance systems. Select and implement new systems for roll-out by FY12. Complete selection of evaluation instrument, required software and, training in order to implement for all unrepresented staff by FY12. $45,000 HC Local Funds 22 Operations Plan: Business Services Organizational Development & Training Strategies Action to Implement Measurement 40. Monitor the existing Professional Development Internship Training Program. Increase interest in affordable housing as a career opportunity. Meet with staff and supervisors for quarterly status updates. Create a self assessment survey to measure intern’s professional development and self esteem. Review program annually based on supervisors’ and interns’ feedback. 41. Ensure core competencies and capabilities are represented by the new evaluation instrument. Define the meaning and definition of each competency and capability agency wide. Establish a Core Training Committee to oversee and ensure the training progress. Meet with supervisors and front line staff to introduce the new evaluation process. Develop specific performance standards for each competency and capability to ensure appropriate rating on the performance evaluation. Estimated $ / Source $10,000 HC Local Funds $40,000 HC Local Funds 23 Operations Plan: Business Services Procurement Strategies Action to Implement Measurement 42. Ensure agency compliance with procurement policy. Review process to monitor cost and compliance. No annual audit finding on procurement process in each fiscal year. 43. Provide best quality, best service, and best value possible to all SDHC departments in support of agency functions. Create a streamlined vendor database process to increase supplier access to procurement opportunities (online form). Improve accountability in the procurement of goods and services. Deliver user-friendly and efficient buying methods by implementing online requisition program on SDHC intranet. Increase the amount of business SDHC does with qualified small, disadvantaged, and women-owned business concerns. Improve accessibility to information on qualified vendors via web. Estimated $ / Source $15,000 HC Local Funds 50% increase in time savings and efficiency for all departments. 10% increase in the number of contracts awarded to qualified small, disadvantaged, women-owned, business concerns. 24 Operations Plan: Financial Services Over the next year the Financial Services Department will be focusing on improving the processes within the department and improving the product delivered to the end user. We will be giving strong attention to finding innovative ways to increase customer satisfaction and becoming a national model of a Financial Services Department for a dynamic housing agency. 25 Operations Plan: Financial Services Strategies Action to Implement Measurement 44. Implement a new indirect cost allocation method for the Commission. Implement a new indirect cost allocation methodology that takes into consideration the new structure and initiatives of the Commission. A new cost allocation process will be in place that is equitable and encompasses funding source requirements. 45. Modify the structure of the accounting and budget systems. Establish a structure for accounting and budget that accommodates profit centers, Limited Liability Corporations, Limited Partnerships, new real estate acquisitions, and central office cost centers. A system that accommodates real estate accounting and reporting as well as grant accounting and reporting. 46. Assist RED in the profitability analysis of current units and projects for possible sale or replacement. Work with RED to develop accurate cost reporting on units to analyze profitability of current portfolio. Financial Recommendations regarding units owned. Estimated $ / Source $10,000 HC Local Funds 26 Operations Plan: Special Housing Initiatives Special Housing Initiatives (SHI) is responsible for the Housing Commission’s efforts to end homelessness in the City and provide affordable housing for persons with special needs. In this regard, the SHI team works with City staff and other regional organizations to coordinate planning and activities, and to reduce public sector costs. 27 Operations Plan: Special Housing Initiatives Strategies 47. Expand permanent housing opportunities for persons with special needs. Action to Implement Measurement Lead the City’s Continuum of Care for new and renewal HUD funding for permanent Supportive Housing. Submit successful application for renewal and new funding. Estimated $ / Source HUD annual renewals plus 1 new project $2 million . Assist County efforts to identify and house homeless who are high volume users of public services for indigents. 25 individuals in stable housing using project based vouchers. HCV Funding $225,000 Support expansion of VASH and link with HPRP. 20 veterans enrolled. HPRP/VASH $170,000 Expand inventory of “Low Demand” (Housing First) units. 1 project in development. 20 units in service. 28 Operations Plan: Special Housing Initiatives Strategies 48. Prevent and Reduce Homelessness. 49. Continue City’s temporary shelter system as needed. Action to Implement Measurement Fund rental assistance to enable timely exit from transitional housing and domestic violence programs to stable housing. 50 units/year Project-Based Vouchers. Provide grants for operation of temporary housing. 400 beds/year. Create a centralized service delivery system through Project Connect or other means. Plan, coordinate, and implement system. Expand inventory of interim housing beds. Identify site and funding plan. Adjust programs to maximize advantages of new HUD HEARTH Program. Increase funding from state and federal Programs (timing unknown). Assume responsibility for City’s contracts and services: winter shelters, family shelter, day center, medical services for shelters, data collection. Secure ESG and CDBG funds from City sources; put contracts into effect. Estimated $ / Source HOME TBRA $420,000 $1.1 million/HTF $25,000 HC Local Funds $2 million CDBG/ ESG/HC Local 29 Financial Analysis Introduction This section of the Business Plan will focus on proforma financial statements that present the forecast of the Housing Commission’s financial performance during this Business Plan cycle. Proforma statements are generally used in connection with a long-term financial planning process. Also, these proforma financial statements focus on the financial future of the Commission, reflecting a vibrant environment in which change is possible and quick and varied alternatives can be forecast. These proforma statements should not be relied upon for debt acquisition or credit worthiness which uses a more detailed and sophisticated analysis of income and expenses and simulation modeling. Projected Financial Highlights during FY2010 – FY2011: SDHC’s total assets will increase 36% from $389 million in FY2009 to $531 million by FY2011 due to $72 million increase in property acquisitions. SDHC’s unrestricted net assets will increase 35% from $152 million in FY2009 to $205 million by FY2011 due to use of funds for ongoing programs. SDHC Capital Assets will increase 62% from $97 million in FY2009 to $158 million by FY2011, a growth of $60 million due to the acquisition and development of real property. Operating revenues will increase 14% or $3.7 million from FY2009 to FY2011 due to increase in dwelling unit rents, land lease income, Smart Corner lease income and fee revenues. Net non-operating revenues are projected to increase 12% or $21 million from FY2009 to FY2011. The increase is largely attributed to 2% annual increases in state and local grant funds received during the next two years and increases in Housing Choice Voucher revenues, as well as increases in investment income from a higher annual interest rate. Operating expenses will increase approximately 5% annually from $175 million in FY2009 to $195 million by 2011. The increase is due principally to new programs, increases in grants and programs, administrative costs, asset management costs, and general expenses, through 2011. 30 Financial Analysis Overview of the Proforma Financial Statements The Proforma financial statements include historical data of the Statement of Net Assets, Statement of Activities and Changes in Net Assets and Statement of Capital Assets. The FY2008 and FY2009 audited financial statements were used as a starting point to which forecasts and estimates for FY2010-FY2011 were made to reflect the financial data projected for the time period covered by the proforma. These projections generally include an inflation factor, estimate of continuation of current federal and state grants, and the goals and future activities projected in the Business Plan. These financial statements offer short-term financial information about the Housing Commission’s activities using accounting methods similar to those used by private sector companies. Chart 1 - Balance Sheet (Statement of Net Assets) includes the Housing Commission’s assets and liabilities from actual amounts in FY2008 and FY2009 to projected amounts for FY2010 to FY2011, and provides information about the nature and projected amounts of investments in resources (assets) and the obligations to creditors (liabilities). It also provides the basis for computing liquidity ratios, evaluating the Housing Commission’s capital structure and assessing the future financial flexibility. Chart 2 - Income Statement (Statement of Activities and Changes in Net Assets) accounts for all of the Housing Commission’s revenues and expenses from actual amounts in FY2008 and FY2009 to projected amounts for FY2010 to FY2011. The statement reflects the forecasted results of operations over this business plan cycle and can be used to determine the Commission’s ability to successfully recover all costs through grants, tenant rents and other income. Chart 3 – Statement of Capital Assets shows the Commission’s investment in fixed assets, including land, buildings, building improvements, office furniture and equipment, vehicles, and work in progress from actual amounts in FY2008 and FY2009 to projections for FY2010-2011. Proforma Statements The following analysis focuses on the Housing Commission’s projected statement of net assets (Chart 1 – Projected Balance Sheet), and changes in net assets (Chart 2 – Projected Income Statement) during this four year (FY2008 – FY2011) cycle. The financial data expressed on Charts 1- 3 are taken from financial worksheets which are located in the Appendix of this business plan. . 31 Financial Analysis Chart 1 illustrates that Total Assets are projected to increase by $142 million (36%) to $531 million by 2011 from FY2009 (base year) as a result of real estate acquisitions. Total Liabilities are projected to increase by $89 million from FY2009 to FY2011 due to an increase in long term debt to acquire property and Net Assets (Net Worth) is projected to increase by $53 million. Balance Sheet $600,000 2008 2009 $400,000 2010 2011 Dollars $500,000 Assets 368,229 388,873 519,582 530,713 Liabilities 39,482 38,510 137,705 127,511 Net Assets 328,747 350,363 381,877 403,202 Assets Liabilities $300,000 Net Assets $200,000 $100,000 $0 2008 Chart 1 2009 2010 2011 Year The financial worksheet (Appendix – Table A) also indicates that: Current assets besides cash are projected to increase by $1 million and current liabilities are projected to increase $5.6 million by 2011. Investments in capital assets, net of debt, are projected to decrease by $29 million by 2011. Unrestricted net assets are projected to increase by $53 million to $205 million by 2011. Net assets include funds that have been encumbered for future years’ contractual obligations, funds that are invested in notes receivable and unrestricted funds available for operations. Restricted net assets will increase to $158 million, a 23% increase. Restricted net assets include HOME loans and associated accrued interest. Fiscal years 2010-2011, combined overall operating surpluses of $53 million represent similar yearly total net incomes as the base year. The surpluses are largely attributed to increases in grants and other income and gains on the portfolio investments. In addition, associated operating expenses will increase from year to year. 32 Financial Analysis Chart 2 indicates that operating revenues fall significantly short of operating expenses. The Housing Commission requires ongoing non-operating income in the form of grants and subsidies in order to provide essential services. The Commission currently administers over 100 individual grants and contracts. By 2011, the Commission will be administering over 115 individual grants and ongoing programs. Operating expenses will increase approximately 5.5% annually, primarily due to increases in administrative, tenant services, asset management, and grant expenditures. Income Statement Operating Revenues 250,000 19,920 2008 26,095 2009 26,911 2010 200,000 29,745 2011 Operating Expenses 163,198 175,395 184,967 195,331 Non-Operating Income, Net 178,281 173,213 194,501 193,931 Net Income 32,022 21,546 31,514 21,326 Operating Revenues Dollars 150,000 Operating Expenses Non-Operating Income, Net 100,000 Net Income 50,000 2008 Chart 2 2009 2010 2011 Year 33 Financial Analysis Capital Assets Chart 3 – Projected Capital Assets summarizes the Housing Commission’s capital assets from FY2008 – FY2011. At the end of fiscal year 2009, the Commission had over $97 million invested in fixed assets, including land, building, building improvements, office furniture and equipment and vehicles. The FY2009 capital assets were largely the Smart Corner office building and 1,371 units of locally owned housing. By the end of fiscal year 2011, an increase of 62% from FY2009 to $158 million is projected to be invested in fixed assets, including land and building acquisitions, equipment, vehicles, and building improvements. This increase is primarily due to the planned acquisitions and construction of over 1,000 additional units of affordable housing by 2011. Capital Assets Dollars Land & 180,000 Building 2008 160,000 86,189 88,965 2009 140,000106,918 2010 149,495 2011 120,000 Other Capital Assets 13,244 8,262 8,100 8,180 Total Assets 99,433 97,227 115,018 157,675 100,000 80,000 60,000 40,000 20,000 2008 2009 2010 2011 Year Chart 3 Land & Building Other Capital Assets Total Assets Proforma Financial Statements – Assumptions Made: General operating expenses will increase by 5% annually Administrative expenses will increase by 10% in FY2011. Grant revenues will grow by approximately 2% annually. All goals, strategies, and activities identified in the Business Plan will occur as projected. Investment income will increase due from a diversified portfolio and higher interest rates. Dwelling rental income will have increases of 3% in FY2011 due to the acquisition of additional units and slow growth in income from occupied units. Current liabilities will grow annually by 2% through 2011 before adding in the current portion of new debt. Current assets other than cash will increase by 7.5% annually through 2011. 34 Financial Analysis The US Bank note for the SmartCorner office building due in full in 2011 will be refinanced and not paid off. The Commission will continue to expand and manage housing units Political, Business, and Economic Factors Affecting the Projections The need for affordable housing in the San Diego area has historically, and will continue to be, very high in comparison to other large cities. The number of people served and the level of services provided are questions that will be addressed in coming years. The Housing Commission’s budget in FY2011 is balanced and reflects resources available to provide those services in the amount of over $290 million. The challenge the Housing Commission faces is the role played in the community in the coming years. The Commission will work to address new issues by adding to their affordable housing stock and proactively expanding their political role within the community. In addition, as new programs and grants are evaluated, staff will continue to apply discerning criteria to ensure that a program is self-supporting and administrative burdens are met, thus ensuring the ability to continue providing new and better services to our clients. It is anticipated that most of the Commission’s programs will continue to receive renewal funding. Section 8 will continue to be near 100% leased-up. With new rent incentives, occupancy rates should improve in the near future for the Commission owned units, increasing from the current vacancy rate of around 7%-8%. Although the Commission will face many financial, business, political and economical challenges in the future, the local economic growth is projected to be slow, local job growth will also be slow and the housing development for the San Diego area will be sluggish, the financial outlook for the Commission appears outstanding. The San Diego Housing Commission will continue to strive towards providing the highest quality services to all clients and the community, delivered in an efficient and fiscally prudent manner. Contacting SDHC’s Financial Management Questions concerning any of the information provided in this report or requests for additional information should be addressed to the Chief Financial Officer, San Diego Housing Commission, 1122 Broadway, Suite 300, San Diego, California 92101. 35 Agency Analysis Founded in 1979, the San Diego Housing Commission is a public agency working to expand affordable housing opportunities in the City of San Diego. Each year, the agency helps about 76,000 lower income individuals with affordable housing through award-winning programs that benefit the city’s economy and revitalize neighborhoods. With an annual budget of over $290 million, the agency has expanded its role and mission beyond that of a typical public housing agency. SDHC applies its resources to three areas of work: 1) Housing Assistance – The agency helps more than 13,700 families pay rent in private housing each month. SDHC also owns and manages over 1800 apartments and provides residents with academic support and career development tools. 2) Housing Finance Partner – Through favorable financing and incentives, SDHC has helped nonprofit and for-profit developers create nearly 25,000 homes, of which 13,000 units are currently affordable. Agency programs have enabled 4,400 families to buy their first homes and 11,000 to repair older homes. SDHC also assists in the development of supportive housing for vulnerable populations. The agency manages a $248 million loan portfolio and has issued nearly $1 billion in tax-exempt bonds for 43 projects. 3) Housing Policy Advisor – The agency helps shape the city’s affordable housing programs by providing policy advice to the San Diego City Council, as well as initiating, monitoring or implementing municipal ordinances that advance affordable housing production and protect existing stock (inclusionary zoning, density bonus, single room occupancy preservation, and condo conversion protections). Unique Qualifications Nationally, SDHC is recognized as one of the most innovative and well-managed housing agencies in the nation. In a special and rare commendation, the U.S. Department of Housing & Urban Development in 1994 stated, “This public housing agency is one of the best in the United States.” The agency’s success is largely due to applying private-sector management principles to ensure streamlined operations and fiscal accountability, as evidenced by low overhead of five percent. 36 Agency Analysis In addition, the agency’s leaders have proactively educated the community, policymakers and stakeholders about the need for affordable housing and its positive economic impact on the region. This has been accomplished by forging partnerships with groups and individuals not previously involved in affordable housing, such as chambers of commerce, builders, civic leaders, universities, and employers. As a result, SDHC has garnered widespread support for progressive initiatives, such as a local affordable housing trust fund and inclusionary zoning. Organizational Structure & Workforce The agency’s structure consists of a President & Chief Executive Officer, an Executive Vice President & Chief Operating Officer, and five Vice Presidents. The President & CEO is responsible to a Board of Commissioners and the Housing Authority. Certain financial commitments and housing policy matters must also be approved by the eight members of the City Council, who sit as the San Diego Housing Authority. Awards & Recognition SDHC has received more than 100 national and local awards for business-like practices, sophisticated programs and affordable housing developments from a variety of organizations, including: The National Association of Housing Development Officials (NAHRO) The National Association of Local Housing Finance Agencies (NAHLFA) San Diego Housing Federation San Diego County Apartment Association Chicano Federation of San Diego County San Diego Association of Governments Urban Land Institute San Diego/Tijuana 37 Market Analysis The activities of SDHC are affected by several external markets: first-time home buyers, housing development and rental housing. These external markets are presently in a state of extreme volatility following a fall in the economy and rising unemployment. Today the majority of San Diegans cannot afford to purchase the median price home in the city and must rely on rental housing. This Market Analysis focuses on the affordable rental housing market, as the agency’s activities target renters and the availability and use of affordable rental housing. Availability of Affordable Housing Historically, the City of San Diego has had a severe deficiency of available affordable housing, primarily for low- and very low-income residents and for persons with special needs. The 2007 American Community Survey (“ACS”) highlights this mismatch between supply and demand: there are 36,144 renters in the city who earn less than $15,000 per year and can afford to pay $325 per month or less for rent; there are 13,255 units available to serve these renters, leaving a shortage of 22,889 units.(1) Market Analysis Summary (2) The City of San Diego will continue to have a pressing need for affordable housing for lowincome renters; In 2007, 54 percent of the city’s renters paid more than 30 percent of their income toward housing costs; of these, 48 percent paid greater than 50 percent of income toward housing costs. The annual rent increase in the County of San Diego has averaged 4.8 percent since 2000; rents leveled off during 2009 and are expected to remain constant during 2010. The September 2009 unemployment rate was 10.2 percent. While 12,500 jobs are expected to be added in 2010, 52,500 positions were lost in 2009. The vacancy rate of available rental housing has averaged 3.3 percent between 2002 and 2008; the rate rose to 5.0 percent by the fall of 2009. 38 Market Analysis Affordable Housing Need In 2007, 68 percent of the city’s households paid more than $1,000 per month in housing costs, with 30 percent of those paying $2,000 and more. It is estimated however that only 52 percent of the city’s households actually earned enough to pay more than $1,000 in housing costs. Another way to demonstrate the need for affordable housing is through an analysis of cost burden. Housing is deemed affordable if no more than 30 percent of a household’s monthly income is needed to pay rent and utilities. If that portion exceeds 30 percent, the household is considered “cost burdened.” In 2007, the ACS estimated that 54 percent of the city’s renters pay more than 30 percent of the incomes in rent and utilities. Of these cost burdened households, 48 percent are considered severely cost burdened, meaning they pay more than 50 percent of their income in housing costs. Figures show a continuing increase in cost burden among renters since 2000, when 46 percent of all renters were cost burdened. In 2007, 22,400 more renters were cost burdened, a 24 percent increase since 2000.(3) Present Market Conditions The latter part of 2008 and all of 2009 found the country in an economic recession. Major banks were in trouble and the stock market fell. Corporations large and small were forced to lay -off workers resulting in job losses. Across the nation as well as in San Diego, home foreclosures were occurring at an alarming rate and claims for unemployment insurance reached an all-time high. By September of 2009, the unemployment rate was in double digits. While some feel there are early economic indicators of a recovery, most surveys remain cautious in their predictions for 2010. San Diego Apartment Vacancy Rates The San Diego County Apartment Association, in its December 2007 Vacancy Rate Survey, reported an overall 3.5 percent vacancy rate of available apartment units. By the fall of 2009, results showed a 5.0 percent vacancy rate across all unit types countywide. A February 2010 San Diego Daily Transcript article quoted Cassidy Turley/BRE Commercial’s prediction that the countywide vacancy rate will remain about 5 to 6 percent in 2010. This trend was attributed to the fact that over the last year, many renters have doubled up or have moved back home in order to cut their living expenses. Homeowners have rented out spare rooms and guest homes which compete with existing apartment rentals.(4) 39 Market Analysis Chart 4 shows the City of San Diego’s vacancy rate from 1990-2009. In September 2009, San Diego had a 5.0 percent vacancy rate. Chart 4 Average Rent Rates Rents countywide leveled off during 2009, but remain not far from their peak at a time when unemployment has moved into double digits. The weighted average rent for all unit types is $1,189; the weighted average rent for studio units is $996, $1,127 for one-bedroom units, $1,422 for two-bedroom units, and $1,754 for units with three or more bedrooms.(5) Rental rates are expected to remain stable in 2010, increasing by .01 percent. Growth is not expected until employment and household formation return to positive numbers. The Marcus & Millichap report claims that while 12,500 jobs are expected to be added this year, some 52,500 positions were lost in 2009.(4) 40 Market Analysis Chart 5. Footnotes 1. City of San Diego 2010-2014 Consolidated Plan and 2010 Action Plan, May 11, 2009. 2. City of San Diego General Plan, Housing Element, FY2005-2010. 3. City of San Diego 2010-2014 Consolidated Plan and 2010 Action Plan, May 11, 2009.. 4. San Diego Daily Transcript ‘Apartment Vacancy Challenges Could Affect Healthy Countywide Stats,’ Wednesday, February 10, 2010. 5. San Diego Metro Magazine, ‘Daily Business Report—Dec.7, 2009.’ 41 Customer Analysis The San Diego Housing Commission draws its housing tenant customers from its waiting list, which currently numbers over 47,000. Due to lower incomes, these households who currently rent on the open market are paying a disproportionate amount of their income for housing. Within SDHC’s various programs that draw from the waiting list there are established preferences to better serve the populations of elderly, disabled, homeless with disabilities, and families with children. Chart 6 – SDHC Waiting List Families Annual Income Percentage Below $20,000 79% Between $20,000 & $30,000 15% Between $30,000 & $40,000 5% Families with Children 51% Families with Disabilities 30% Elderly Families 10% Families Needing 1-Bedroom Unit 53% Families Needing 2-Bedroom Unit 41% Families Needing 3-Bedroom Unit 5% SDHC Owned and Managed Affordable Housing - Good Tenant / Neighbor Policy SDHC’s commitment to maintaining the quality of its housing is demonstrated by its responsibility to the public trust. SDHC’s property management program is designed to achieve the following objectives: To provide improved living conditions for extremely low, very low, and low income families while maintaining their rent payments at an affordable level. To operate a socially and financially sound public housing agency that provides decent, safe, sanitary and in good repair housing within a drug free, suitable living environment for residents and their families. To lawfully deny the admission of applicants, or the continued occupancy of residents, whose habits and practices reasonably may be expected to adversely affect the health, safety, comfort 42 Customer Analysis or welfare of other residents or the physical environment of the neighborhood, or create a danger to SDHC employees. To provide opportunities for upward mobility or families who desire to achieve self-sufficiency. Tenant Profile SDHC owns and manages over 1800 affordable housing units that are rented to low-income households living or working in the City of San Diego, including seniors 62 years and older, the disabled and families. Chart 7 shows the maximum eligible total household income limits. Household Size 1 person 2 person 3 person 4 person Maximum Income $46,250 $52,900 $59,500 $66,100 Household Size 5 person 6 person 7 person 8 person Maximum Income $71,400 $76,700 $81,950 $87,250 Self-Sufficiency and Asset Building Programs Each year, over 500 rental assistance clients participate in the SDHC’s self-sufficiency and asset building programs. Through strategic partnerships with local businesses and community agencies, SDHC offers program participants coordination of services, referrals, and support services to help them reach their goals in education, training, employment, financial stability, microenterprise, home ownership, and asset acquisition, all free of charge. 43 Customer Analysis Clarisa enrolled in the Family Self-Sufficiency Program (FSS) with the goal to obtain fulltime employment and a higher education. She developed a career plan with help from her FSS coordinator, and in five short years she received her A.A. Degree in Criminal Justice. She then advanced to a B.A. Degree in Operations Management. Clarissa’s hard work and commitment truly paid off. She now has a job with full benefits for herself and her children, and plans on pursuing a Masters Degree. She said that the FSS program motivated her to become self-sufficient and she intends to pursue homeownership. Jocabed 15, Damaris 16, Betzua 18, and Madai 19, are a dynamic set of siblings. With their mother, Elena, the five member family joined the San Diego Housing Commission’s asset building programs: Aspire and The Money Project (TMP). Elena, the matriarch of the family, has been engaged in the SDHC’s self-sufficiency and asset building programs for a number of years. She often shared the knowledge she learned at the workshops with her children, emphasizing her lack of knowledge on the topic at their age “If only I knew this.” Once the girls heard about TMP they knew they wanted to be part of it. Since joining TMP, the siblings have changed their understanding of the value of a dollar. Per Damaris: “forget the blouse; the $15.00 will be worth more. It’s a life lesson the program is kinda like the money police. At the first workshop we learned ‘is it a need or a want’ and now we always ask my mom ‘really mom, is that a need or a want” The family carpools to workshops and as a result have become closer. “We all set a time to ride to the workshops. After the workshops, we talk about the topics and clarify any issues with each other, like what did this mean to you?” 44 Marketing Plan Introduction Since its inception in 1979, the Housing Commission’s largest single program has been providing federally funded rental assistance to very low to low income households comprised of seniors, the disabled and families. Today, the agency assists more than 38,000 people through the rental assistance program. Recently, the Housing Commission expanded its constituency to include those affected by the recession. In the next several years, the Housing Commission will be focusing on housing for workforce families, many of whom are experiencing additional financial pressures. The agency will take advantage of the depressed real estate market to acquire properties that were previously out of its economic reach and offer those as additional housing opportunities. Looking forward to when the economy recovers, the Housing Commission will work collaboratively on “smart growth” initiatives. The next phase will focus on affordable housing development located close to mass transit facilities. Goals & Objectives Reinforce the Housing Commission’s roles as the region’s affordable housing advocate; Heighten awareness of the Housing Commission’s accomplishments to build support for the mission, programs, services, and funding; Improve the flow of information within the agency to deliver seamless customer service; Use private -sector business practices to inspire innovative ideas and strategies. Audiences The Housing Commission’s audiences are divided into six major groups: 1. Opinion Leaders & Advocates (Commissioners, City Staff, elected officials, other government agencies leaders, housing advocacy groups, industry groups, community leaders, community planning groups, non-profits, and business & civic leaders) 2. General Public 3. Media (local, regional & national) 45 Marketing Plan 4. Employees 5. Customers (users of programs and services) 6. Business Partners ( developers, landlords, vendors & donors) Research Research is needed to examine current attitudes and opinions about the agency’s public image, its delivery of programs and services, and its advocacy of affordable housing issues. The agency will conduct a public opinion survey in FY2011 to measure the perception of the agency and of affordable housing issues among the agency’s six primary audiences. The data will be used as another tool to set priorities. Strategies Advocacy Participate on affordable housing policy making boards at the local, regional and national levels. Customer Service Redesign the Housing Commission’s “Rent an Apartment From Us” website listing to make it more user-friendly and integrate onto the new website; Provide easy website access for the public to ask for Public Information Requests; Publicize Ombudsman services to respond to customer concerns and issues about the agency’s performance; Restructure the agency’s voicemail recording system to better serve customers who do not have access to the Internet; Heighten Awareness Develop a speakers’ bureau to educate the public about the Housing Commission’s programs and services; Launch a user-friendly website to provide the public with valuable information such as the Housing Commission’s Comprehensive Affordable Housing Guide, which receives 40,000 hits on the website; 46 Marketing Plan Integrate audio podcasting on the website of the Housing Commission’s meetings to increase transparency in government; Produce compelling video messages to reach out to different audiences about the Housing Commission’s accomplishments and programs and post on website and electronic communications Incorporate social media tools to increase local, regional and national exposure of the Housing Commission’s affordable housing mission, programs, and services; Rebrand the components of the Economic Development Academy to increase participation of recipients receiving housing assistance as well as participation by donors and partners; and Compete for national and housing industry awards that recognize the Housing Commission’s programs and services. 47 48 $217,183 Ttl Liabilities & NA $224,434 209,688 201,925 Total net assets 72,051 0 $264,827 243,799 103,730 68,018 $ 21,028 14,971 6,057 $ 264,827 192,319 19,240 53,268 Audited June 30, 2005 74,834 134,854 76,225 $ 14,746 9,446 9,370 $ 15,258 5,300 $ 224,435 $ 217,183 5,888 176,824 14,187 33,424 172,108 45,075 Audited June 30, 2004 125,700 Unrestricted Assets Net Assets: Invested in Capital Assets, Net of Debt Restricted Assets Total Liabilities Current Liabilities Notes Payable & Non-Current Liabilities Liabilities: Total Assets Other Current Assets Capital & NonCurrent Assets Cash & Investments Assets: Audited June 30, 2003 $289,680 270,196 127,912 74,995 $337,590 296,795 141,958 86,944 67,893 $ 40,795 $ 19,484 67,289 33,336 7,459 $ 337,590 251,408 9,961 76,221 Audited June 30, 2007 14,105 5,379 $ 289,680 215,756 10,580 63,344 Audited June 30, 2006 $368,299 328,817 137,314 122,521 68,982 $ 39,482 31,744 7,738 270,199 $ 368,299 9,398 88,702 Audited June 30, 2008 Table A Net Assets (in thousands of dollars) $388,873 350,363 152,042 128,863 69,458 $ 38,510 29,679 8,831 284,031 $ 388,873 6,685 98,157 Audited June 30, 2009 $519,582 381,877 249,890 143,598 (11,611) $ 137,705 124,726 12,980 $ 519,582 319,785 7,186 192,611 Projected June 30, 2010 $530,713 403,203 204,575 158,065 40,563 $ 127,511 113,065 14,446 $ 530,713 381,126 7,725 141,862 Projected June 30, 2011 Appendix 49 137,443 (119,071) 3,220 138,739 (121,405) 3,125 (124,530) 132,460 $7,930 Deficit before depreciation & other expenses Depreciation Deficit before other nonoperating income and expense Non-operating income and expenses, net Increase in net assets $38,664 160,955 (122,291) 18,372 17,334 June 30, 2005 June 30, 2004 Operating revenues Operating expenses Audited Audited $26,397 157,203 (130,806) 2,955 (127,851) 146,080 18,229 June 30, 2006 Audited $26,599 166,438 $32,022 178,281 (146,259) 2,981 3,629 (139,839) ($143,278) 163,198 $19,920 June 30, 2008 Audited ($136,210) 150,863 $14,653 June 30, 2007 Audited Table B Changes in Net Assets (in thousands of dollars) $21,546 173,213 (151,667) 2,367 ($149,300) 175,395 $26,095 June 30, 2009 Audited $31,514 194,501 (162,988) 4,932 ($158,056) 184,967 $26,911 June 30, 2010 Projected $21,326 193,931 (172,604) 7,018 ($165,586) 195,331 $29,745 Projected June 30, 2011 Appendix 50 $7,001 $1,261 $97,227 Equipment Total $88,965 1.00% 2.50% 20.18 % 2010 2009 Work in progress Land and buildings Grow th Rate Audited June 30 22,735 Plan 2010 Financial 150 Fees 2010 Capitalized -4,932 2010 Depreciation $115,01 8 $1,274 $6,826 $106,91 8 2010 Projected June 30 1.00% 1.00% 39.82 % 2011 Grow th Rate Table C Capital Assets (in thousands of dollars) 49,345 Plan 2011 Financial 250 Fees 2010 Capitalized -7,018 2011 Depreciation $157,67 6 $1,286 $6,894 $149,49 5 2011 Projected June 30 Appendix Our Partners The San Diego Housing Commission partners with hundreds of community organizations, businesses and other entities throughout San Diego and nationwide. This is just a partial list of the agency’s many partners, vendors and service providers. For more information on how to do business with SDHC and current contracting opportunities, please visit www.sdhc.org. Access to Independence Cal Pacific Mortgage Elder Legal Center of San Diego ACCION Ace Parking Affinity Financial Capital Cleaning, Inc Capstar Financial Group Casa Familiar Emerald Mortgage Emphasys Computer Solutions, Inc. Episcopal Community Services Affirmed Housing Group African Alliance After-School All Stars Aging & Independent Services Allstate Services Environmental Alvarado Design Studio American Mortgage & Credit Apple One Employment Services Asher & Company Keyser-Marston Community Interface Services Consumer Credit Counseling Aztec Landscaping Baja Pacific Bank of America Barrio Station Bayside Community Center BHI Mortgage Bonded Window Coverings, Inc Boys & Girls Clubs of San Dieguito Bradley Security & Detective Agency Burkett & Wong Dress for Success ElderHelp of San Diego National University Nationwide Realty Services, Inc. Neighborhood House Association Networking Interpreting Service Ninteman Construction Services San Diego Reinvestment Task Force San Diego Foundation San Diego Funding Nan McKay & Associates Catholic Charities Center for Social Advocacy Centre City Development Corp. Chase Home Finance Chelsea Investment Corp. Citibank City of San Diego College Opportunity Foundation Community HousingWorks Housing Opportunities Collaborative Gamma Builders, Inc. Fair Housing Council of SD Family Health Centers of SD Family Resource Centers of SD First American Mortgage First Magnus Financial Corp First Mortgage Corporation Fred Pryor Training FTHB & American Dream Association for Community Housing Solutions Automated Data Processing, Inc General Mortgage Corporation GMAC Mortgage Corporation Golden Care Academy Green Point Mortgage Funding Grondin Construction Guild Mortgage Company H&R Block Hawkins Delafield & Wood Hazlo Inc. Heads on Fire The Holman Group Cal Home Shared Appreciation J.P. Witherow Roofing Company Jacobs Family Foundation JTB Restorations, Inc. Junior’s Concrete Kaiser Financial Services Nonprofit Management Solutions Novadebt Office Depot Office Max Office Pavilion Countrywide Home Loans County of San Diego CSSE / Alpha Program D.R. Elrod & Associates Davis Davis Architects, Inc. Deaf Community Services of SD Del Sol Apartments, L.P. Denny & Son DHI Mortgage Company Dixieline Builders Fund Control Housing Development Partners Human Resources Capital San Diego Housing Federation San Diego Interfaith Housing Found. San Diego National Bank San Diego Padres San Diego Regional Center Latino Builders Industry Assn. Law Offices of Kimbal, Tirey & St John Legal Aide Society Loan Link Financial Services 51 Our Partners San Diego Safe Harbor San Diego Second Chance San Diego Workforce Partnership Veterans Village of San Diego Sadi Arbor Crest Salerno / Livingston Architects Tibbet & Associates Townspeople Unifirst Corporation Union Bank of California Union of Pan Asian Communities United Way of San Diego University of California, San Diego University of San Diego National Leased Group Urban Corps of San Diego US Bank Strategic Business Resources NAHRO Streamline Applications Solutions HARG YMCA of San Diego County Youth Council of San Diego YWCA of San Diego County San Diego Community College District San Diego County Apartment Assn. Environmental Health Coalition Southeast Economic Dev. Corp. Clancy Contracting Services Urban Housing Corporation San Diego Youth & Family Services Richard Bundy & David Thompson San Ysidro Livable Neighborhoods National Community Renaissance National Conflict Resolution Center National Credit Reporting (NCR) San Diego Bank & Trust San Diego Safe Harbor Mental Health Systems Michael Baker Electric Mission Federal Credit Union Morgan Home Loan Funding Corp San Diego-Imperial Counties Labor Council SCH Consulting Services The Lenders Group Strong Arm Construction Swift Real Estate Partners Tayman Industries, Inc. TCS Mortgage, Inc. The Association for Community Housing Solutions The Center for Social Advocacy The Centre for Organizational Effectiveness The Epler Company Stewart National Mortgage Comp. Villa Financial SANDAG Cricket Telecommunications 7-11 Stores Steadfast Villa Nueva Stepping Stone Sterling Companies, Inc. Hyland Software, Inc. Public Relations Society of America Rebuilding Together San Diego Rolling Readers San Diego Youth & Community Services Mortgage One Lending Intergis MAAC Project City of SD Redevelopment Agency Alpha Project City Heights CDC Bayview CDC Ashkins & Associates San Diego Home Loan Counseling & Education Center SDG&E Energy Team Jewish Family Services Corporation for Supportive Housing Chicano Federation of SD County HOPE Community Dev. Corp. Chicago Title Company Local Initiatives Support Corp. M.W. Steele Group, Inc. McCullough Landscape Architecture MDC Financial Service Group Mental Health Systems Optera Palm Engineering Pathfinders of San Diego Plaza Home Mortgage, Inc. Public Relations Society of America MSC Janitorial Service Salvation Army SCME Mortgage Bankers Senior Community Centers Signs & Services Co. Skillpath Small Business Development & International Trade Center. South Bay Community Services South County Career Center South Pacific Financial Corp. Springboard Father Joe’s Villages/St. Vincent De Paul Wakeland Housing & Community Development Corp Wells Fargo Home Mortgage West Coast Mortgage Windsor Capital Mortgage Interwest Electric 52


© Copyright 2026