
Using Market Segmentation for Better Customer Service and More Effective Strategic Planning CIVICTechnologies
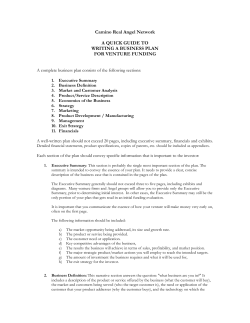
Using Market Segmentation for
Better Customer Service and
More Effective Strategic Planning
A White Paper for Public and Academic Libraries
CIVICTechnologies
www.civictechnologies.com
November 2009
Table of Contents
1.0
Purpose
2.0
Introduction
3.0
Market Segmentation Basics
4.0
Differentiation through a Customer-Centric Approach
5.0
Building Blocks of Tapestry Segmentation
6.0
Tapestry Library Applications
7.0
Conclusion
8.0
References
List of Figures
Figure 1: Business Applications of Market Segmentation
Figure 2: Importance of Customer Segmentation for Marketing Activities
Figure 3: Example of Customers Who Look Alike but Behave Differently
Figure 4: Segmentation Building Blocks
Figure 5: Sample Tapestry Segment Descriptions
Figure 6: Chart of All 65 Tapestry Segments
Figure 7: Changing Consumer Patterns
Figure 8: DS Waters Segment Map of Southern California
Figure 9: Start-Up Yoga Studio: Comparison of Competitor Segments
Figure 10: Segments in Topeka and Shawnee County
Figure 11: Usage of Print and Non-Print Materials by Segment
Figure 12: Library’s CommunityConnect Website
Appendix: Case Studies
Case Study 1: Customer Prospecting, DS Waters, Atlanta, Georgia
Case Study 2: Start-Up Yoga Studio, Los Angeles, California
Case Study 3: Student Advertising Campaign Project, Pellissippi State Community College,
Knoxville, Tennessee
Case Study 4: Strategic Plan: Topeka and Shawnee County Public Library (TSCPL), Kansas
1
CIVICTechnologies
1.0
Purpose
Public and academic libraries face a plethora of information age challenges. In a world of
customized service, where Amazon knows what books you might like to read and Netflix suggests
films you’d like to watch, libraries have an opportunity to reinvent their customer relationship and to
strategize how to create meaningful relationships with potential customers. Libraries that become
customer-centric – those that start from understanding their customers’ needs and develop
products, services, and programs to meet those needs – will ultimately find success as a 21st
century community leader.
We believe that market segmentation is instrumental to understanding customer needs and
reinventing the customer relationship. Within this context, the purpose of this white paper is to:
1. Provide a general introduction to the concept, methodology, and use of market
segmentation
2. Inform public and academic librarians, including administrators and reference librarians,
about the importance of market segmentation
3. Provide information about the Tapestry market segmentation system (Tapestry), one of the
nation's leading off-the-shelf (OTS) market segmentation systems
2.0
Introduction
According to www.bplans.com, a free resource to help entrepreneurs plan better businesses,
market segmentation is “the categorization of potential buyers into groups based on common
characteristics such as age, gender, income, and geography or other attributes relating to purchase
or consumption behavior.”
Medium and large companies have been using market segmentation for years.
> See Appendix for Case Study: Customer Prospecting, DS Waters, Atlanta, Georgia
Small businesses, non-profit organizations, entry-level entrepreneurs, and public and academic
libraries, however, know virtually nothing about market segmentation.
Until recently, the cost of segmentation systems and the level of expertise needed to employ them
have been beyond the reach of these organizations. With the entry of the BusinessDecision
database (www.businessdecision.info) into the public and academic library market, the Tapestry
segmentation system brings professional level segmentation to all public and academic library
patrons. This opportunity provides organizations, including libraries themselves, with a powerful new
tool to obtain the same benefits as large companies using market segmentation.
2
CIVICTechnologies
Organizations use market segmentation to 1) gain insight into their customers and use that
knowledge to enhance their profitability, revenue growth, and growth in the number of customers;
and 2) to become a customer-centric organization; that is, to make the customer an integral part of
their organization's strategy and decision-making.
Public and academic libraries can use market segmentation to achieve growth in the number of
customers; realize a higher return on investment (ROI) in materials and services; and increase the
utilization of their resources (e.g., books, DVDs, etc.) across a higher number of people (in business
terms to amortize or leverage their “sunk” investment in assets). Public and academic libraries can
specifically use market segmentation in two use cases:
•
Customer service use case:
•
To offer their small businesses, entry-level entrepreneurs, and non-profits a tool to find new
customers, retain existing customers, improve profitability, find the best location for their
business, and develop new products and services appropriate to their market.
> See Appendix for Case Study: Start-Up Yoga Studio, Los Angeles, California
•
For use by students to support research and class projects and to prepare students to use
market segmentation in their chosen profession.
> See Appendix for Case Study: Student Advertising Campaign Project, Pellissippi State
Community College, Knoxville, Tennessee
•
Strategic planning use case:
•
For use by the public library itself to improve services by better engaging library users and
those who don't yet use the library.
> See Appendix for Case Study: Strategic Plan: Topeka and Shawnee County Public Library
(TSCPL), Kansas
For public and academic libraries, market segmentation is applicable both as a customer service (to
businesses, entrepreneurs, non-profits, students, and faculty) and as an indispensable tool for the
library’s own strategic planning process. Recognizing these different use cases, this white paper will
use business terminology and library terminology interchangeably. We encourage the reader to
think broadly about the applications for market segmentation in his or her library environment.
3
CIVICTechnologies
3.0
Market Segmentation Basics
Most segmentation systems are off the shelf (OTS). Very large companies sometimes develop their
own internal segmentation systems by mining their proprietary customer data. The decision by a
business or organization to use an OTS segmentation system or to develop their own segmentation
system (or to use some combination of them) depends upon their business objectives, available
data, and budget. OTS segmentation systems can be general in nature or specific to an industry,
such as health care or financial services.
The following are the three most widely used OTS segmentation systems:
•
•
•
Tapestry Segmentation by ESRI
Prizm by Claritas
Mosaic by Experian
All segmentation systems share certain principles of utilizing data and analytical techniques such as
the use of multiple variables, complex mathematical formulas, and the incorporation of spatial
analysis utilizing geographic information systems (GIS).
"Today, segmentation is no longer a simple, or static, marketing
technique; it is core to the way successful companies run their business."
- IBM Institute for Business Value
Market segmentation is best known for its use in marketing: customer acquisition, retention, and
migration to higher value; and choosing the right location for a given facility, be it a retail store,
library, or other type of outlet. Over the last decade, however, the success of market segmentation
has expanded its application across other business functions. Market segmentation can be applied
to a range of business or organizational functions (see Figure 1: Business Applications of Market
Segmentation) including:
4
•
Strategic and tactical functions ranging from strategy development to customer acquisition and
retention
•
Core business practices and initiative-based activities including planning and forecasting and
development of new products and services
•
Customer management at the portfolio level and in one-to-one sales and services, including
media and distribution choices
CIVICTechnologies
Figure 1: Business Applications of Market Segmentation (Source: IBM Institute for Business Value)
Businesses are successfully using market segmentation to better reach profitable customers;
libraries are successfully using market segmentation to better reach prospective underserved and
underprivileged patrons. More importantly, all types of organizations are weaving market
segmentation into their business model and the range of business activities in order to improve top
line and bottom line performance. As a result of this, opportunities have been identified which
virtually all organizations can apply and from which they have the potential to derive benefits.
The following figure is from a survey of companies conducted by the IBM Institute for Business
Value, ranking the importance of segmentation through various types of marketing activities, shown
on the bottom of the figure.
Figure 2: Importance of Customer Segmentation for Marketing Activities (Source: IBM Institute for Business Value)
5
CIVICTechnologies
4.0
Differentiation through a Customer-Centric Approach
Markets are either product driven or customer driven. In the mature U.S. market, which includes
extensive use of mass-customization manufacturing techniques, the supply of goods and services is
moving more and more toward a customer driven approach. Customers themselves are always
learning, changing, and adapting. Changing expectations, lifestyles, life stages, access to ever
increasing information, and competition providing new products and services mean there is little
constancy in customer behavior. Customer preferences and buying decisions change from month to
month and year to year.
“A robust segmentation system reveals the differences between
how customers appear and how they act.”
Smart enterprises use segmentation to continually monitor, quantify, and qualify the changing
customer, in part to stay ahead of the competition. Segmentation data provides organizations with
information to develop timely goods and services that profitably serve customers, thereby sustaining
the organization's growth and ability to compete with the development of new products and
services. Companies must be able to discern the difference between how customers appear and
how they act; while some customers may look alike, they behave quite differently, as shown in the
example below.
Figure 3: Example of Customers Who Look Alike but Behave Differently (Source: IBM Institute for Business Value)
Demographics
6
CIVICTechnologies
Lifestage
Needs
Attitudes
Woman, early 40's
married, household
income of $125,000
Two kids under 10,
working mom
Menu planning
advice (low fat and
value oriented),
cooking club
Value shopper,
prefers low fat
products, enjoys
cooking
Woman, early 40's
married, household
income of $125,000
Two kids under 10,
working mom
Ready-to-eat
products, precooked entrees,
home grocery
delivery services
Convenience
shopper, prefers
organic foods, does
not like to cook
A robust segmentation system like Tapestry reveals these key differences. The comprehensive
customer picture provided by segmentation informs pivotal, organizational decisions. Segmentation
is instrumental in enabling organizations to manage a diverse and growing portfolio of customers,
leading them to discover, for example:
•
Highly profitable or high-use customers: What can we do to keep these customers and keep
them spending or using the library? How can we attract more like them?
•
Profitable or moderate-use customers: How do we get more of these customers to adopt the
habits (spending or use) of our highly profitable or high-use ones?
•
Unprofitable or low-use customers: From the perspective of a small business, how can we
phase out these customers and, in the meantime, serve them economically? From the
perspective of a library, how can we increase use?
5.0
Building Blocks of Tapestry Segmentation
The dynamic interaction of three key variables makes full use of a segmentation system’s potential:
segment characteristics, time, and profitability (see Figure 4: Segmentation Building Blocks).
Figure 4: Segmentation Building Blocks (Source: IBM Institute for Business Value)
7
CIVICTechnologies
Segment Characteristics
The core strengths of a segmentation system are the robust methodologies and diverse data sets
that create penetrating insights into the personalities, needs, capabilities, and limitations (e.g.,
financial, age, education) of each segment. In this respect, characteristics should be viewed multidimensionally utilizing diverse data sets and empirically validated methodologies. Segment
characteristics should generally be able to answer such questions as:
•
•
•
•
•
•
•
Who are they?
What do they look like?
What do they need?
How do they act?
What do they buy?
When do they need it?
Why do they want it?
Tapestry is a profiling model that classifies households (and persons) into 65 segments by
geographic level (see Sample List of Tapestry Segments). Tapestry is developed by ESRI, the
world's leading geographic information systems (GIS) software and data provider. ESRI's business
information group has over 30 years of experience in the preparation, development, and support of
business related data, software, and information systems. Tapestry is used by thousands of
organizations (businesses, non-profits, public agencies, universities, etc.) across a range of
industries and disciplines.
Sample List of Tapestry Segments
Midlife Junction
Green Acres
Top Rung
Exurbanites
Las Casas
Prairie Living
Urban Chic
Salt of the Earth
Wealthy Seaboard Suburbs
Urban Villages
Social Security Set
Suburban Splendor
Pacific Heights
Young and Restless
Rustbelt Retirees
Rural Resort Dwellers
The Elders
Trendsetters
Metro Renters
Heartland Communities
Connoisseurs
In Style
Home Town
Milk and Cookies
Silver and Gold
International Marketplace
City Dimensions
Tapestry analyzes and sorts over 60 data attributes for each neighborhood in the U.S. These
attributes are organized into four primary categories:
1. Demographic characteristics
2. Socio-economic characteristics
3. Residential characteristics
4. Consumer buying preferences
8
CIVICTechnologies
Some of the data attributes used in Tapestry include the following:
•
•
•
•
•
•
•
•
•
Population by Age and Sex
Population by Race and Ethnic Origins
Household Composition, Marital and Living Arrangements
Patterns of Migration, Mobility, and Commutation
General Characteristics of Housing
Economic Characteristics of Housing
Educational Enrollment and Attainment
Employment, Occupations, and Industrial Classifications
Household, Family, and Personal Incomes
Based on an in-depth statistical analysis, Tapestry’s 65 segments were determined to be the
optimal number to describe the diversity, subtleties, and complexities of the U.S. market and to
provide statistical stability. Data sources that comprise the segments include Census 2000 data,
ESRI proprietary demographic updates, the InfoBase-X consumer database from Acxiom
Corporation, and other sources. Data is available by neighborhood at census block group level and
up, including census tract, ZIP Code, and ZIP Code + Four levels.
A distinguishing factor of Tapestry is the way data is analyzed geographically, or geodemographically. By correlating diverse data sets at small geographic levels (e.g., census block
groups), powerful, insightful, predictive, and robust results are achieved. Neighborhood level
analysis is a chief component in Tapestry.
“By correlating diverse data sets at small geographic levels (e.g.,
census block groups), powerful, insightful, predictive, and robust results
are achieved.”
Neighborhoods are natural formations of people drawn together by their common need for a
“place”—for security and acceptance. Neighborhood tangibles are housing, land values, available
labor, infrastructure, transportation, school system, and other factors that remain stable over
decades. Intangibles are elements such as economic opportunities, race, lifestyles, and overall
ambience that separate and characterize neighborhoods. The most compelling feature about
neighborhoods is the ability to attract or repel residents and shape their living standards and tastes.
People need to feel that they belong and will seek places where their lifestyles and behaviors fit.
For users to derive value from a market segmentation system, access to segment characterizations
is a key issue: how easy is it to access, understand, and apply segment characterizations. In
9
CIVICTechnologies
Tapestry, access is made easy because each segment is described by a one page narrative with
relevant facts based upon certain data categories (see Figure 5: Sample Tapestry Segment
Descriptions). In addition, a chart provides easy cross-segment comparisons (see Figure 6: Chart of
All 65 Tapestry Segments).
Figure 5: Sample Tapestry Segment Descriptions (Source: ESRI)
10
CIVICTechnologies
Figure 6: Chart of All 65 Tapestry Segments (Source: ESRI)
11
CIVICTechnologies
Tapestry segments are combined into LifeMode Groups and Urbanization Groups. These groups
allow the segments to be rolled up to a higher level to allow for time sequence analysis,
generalizations, high level analysis, and for users wishing to work with fewer categories.
There are 12 LifeMode Groups each of whose segments represent similar consumption and
demographic patterns that reflect shared lifestyle and life stage characteristics. For instance, Group
L1, High Society, consists of the seven most affluent segments whereas Group L5, Senior Styles,
includes the nine segments with a high presence of seniors.
•
•
•
•
•
•
L1 High Society
L2 Upscale Avenues
L3 Metropolis
L4 Solo Acts
L5 Senior Styles
L6 Scholars and Patriots
•
•
•
•
•
•
L7 High Hopes
L8 Global Roots
L9 Family Portrait
L10 Traditional Living
L11 Factories and Farms
L12 American Quilt
LifeMode Groups
Each LifeMode Group has a description. The following sample is the description for Group L9
Family Portrait:
“The Family Portrait LifeMode Group is a fast-growing population. The growth is driven
primarily by the rapid increase in the Up and Coming Families segment. Youth, family life, and the
presence of children are the common characteristics across the five markets in Family Portrait. The
group is also ethnically diverse: nearly 30 percent of the residents are of Hispanic descent. The
neighborhoods are predominantly composed of homeowners who live in single-family homes. The
majority of households include married couples with children who contribute to the group’s large
household size averaging more than 3.11 persons per household. Their lifestyle reflects their youth
and family orientation—buying infant and children’s apparel and toys. Visits to theme parks and
zoos are popular. Their vehicle of choice is typically a minivan or a full-size SUV.”
There are 11 Urbanization Groups which represent shared settlement patterns and income levels.
These 11 groups are based on geographic and physical features such as population density, size of
city, location in or outside a metropolitan area, and whether or not it is part of the economic and
social center of a metropolitan area. For example, U1, Principal Urban Centers I, includes eight
segments that are mainly in densely settled cities within a major metropolitan area. The “I” or “II”
appearing after each group name designates the relative affluence within the group, with I being
more affluent than II.
12
CIVICTechnologies
•
•
•
•
•
•
U1 Principal Urban Centers I
U2 Principal Urban Centers II
U3 Metro Cities I
U4 Metro Cities II
U5 Urban Outskirts I
U6 Urban Outskirts II
•
•
•
•
•
U7 Suburban Periphery I
U8 Suburban Periphery II
U9 Small Towns
U10 Rural I
U11 Rural II
Urbanization Groups
Each Urbanization Group has a description. The following sample is the description for Group U4
Metro Cities II:
“The Metro Cities II Urbanization Group segments are found in larger cities and in
densely populated neighborhoods, ranking third in population density behind Principal Urban
Centers I and II. The eight markets in Metro Cities II are neighborhoods in transition including
young, starter households; retirees; single-person households; and families. Most householders rent
in multiunit buildings. The young population remains mobile. Many are enrolled in college; most
are still trying different jobs. The median household income of this group is $41,272. But household
wealth varies from $10,235 (Dorms to Diplomas) to $170,490 (Retirement Communities), reflecting
the wide range of age and lifestage in Metro Cities II. Consumers in this group share a
neighborhood with an emphasis on economy and convenience. Their preferences include
compact or subcompact cars, fast food, and convenience stores. With the high concentration of
renters, tenant insurance is common while home improvement projects are not.”
Time
Time-based characteristics describe how customers and their consumption patterns change over
time, and how this information can impact an organization's relationship with the customer. Timebased characteristics should answer questions such as:
•
•
•
•
•
How recently did a customer make a purchase?
How frequently do customers make purchases?
What is the customer lifestage?
What is the preferred channel for purchases?
What is the customer's motivation for purchasing?
Time-based characteristics address the motivational aspects of why customers consume what they
do during various periods of their lifetime (frequently referred to as "lifestage"); how frequently and
how recently they consume; and what marketing and sales channels they purchase through. All of
these elements -- motivation, lifestage, frequency, and channels -- are built into Tapestry either at
the segment level or the LifeMode Group level (see Figure 7: Changing Consumer Patterns).
13
CIVICTechnologies
Figure 7: Changing Consumer Patterns (Source: IBM Institute for Business Value)
It is important to capture the point at which a customer's consumption patterns change (their "points
of choice"), usually when there are lifestage changes such as age, income, family structure,
interests, and so forth. This period of change represents an opportunity for the organization to gain
traction with the customer or for a business to drop them. Gaining traction means to reconsider its
offering of goods and services and marketing and sales tactics. Not paying attention to changing
patterns could result in an organization wasting time and money targeting a customer who is no
longer (or never was) interested or profitable. If an organization decides to continue selling the
same goods and services and therefore no longer will cater to customers moving out of the
organization's sphere of business, then the organization must plan a specific effort to attract new
customers including the time needed to rebuild the customer base and establish loyalty, and the
higher monetary costs to obtain new customers, frequently one of the highest costs a business has.
Few organizations put in place strategies and plans to reach customers at their points of choice
(when their purchase or use habits change), thereby missing a prime opportunity to win business
(ahead of their competitors).
14
CIVICTechnologies
Life Stages in Tapestry
“The Solo Acts LifeMode Group includes five segments (Laptops and Lattes, Trendsetters,
Metro Renters, Old and Newcomers, and Young and Restless). These are singles who prefer city
life. Many are young, startup households located in America’s more densely populated
neighborhoods; some are well established singles who have eschewed homeownership and childrearing responsibilities. Contrary to modern migration patterns that flow away from the largest
cities, Solo Acts’ residents are moving into major cities. With considerable discretionary income
and few commitments, their lifestyle is urban, including the best of city life—dining out, attending
plays, and visiting museums—and, for a break from constant connectivity, extensive travel
domestically and abroad.”
“The Global Roots LifeMode Group includes eight segments (International Marketplace,
Industrious Urban Fringe, Urban Melting Pot, Las Casas, Inner City Tenants, NeWest Residents, City
Dimensions, and High Rise Renters). The common thread among the markets in Global Roots is
ethnic diversity. Households are young with modest incomes and tend to rent in multiunit
dwellings. The youth of this group reflects recent immigration trends; half of all households have
immigrated to the United States within the past 10 years. The households range from married
couples, typically with children, to single parents to individuals who live alone. Because households
with children dominate this marketplace, it is not surprising that spending for baby goods,
children’s apparel, and toys is higher here. Residents of Global Roots are less likely to have home
PCs but just as likely to use cell phones. They maintain ties with friends and relatives in their
countries of origin with foreign travel.”
15
•
Lifestage: this represents the period of a person's lifetime that dominates their basic
lifestyle: young adult in college or just graduated high school, just married, just starting a
family with children, middle age, senior citizen, etc. The concept of lifestage is captured by
Tapestry LifeMode Groups which organize individual segments (see Life Stages in
Tapestry).
•
Motivation: this represents the reason that people engage in purchasing. By understanding
the purchasing motivation an organization will have a handle on consumers’ state of mind.
Purchasing motivations are exemplified by new parents needing to buy items for the
newborn; senior citizens traveling; wealthy couples purchasing a second home; and so
forth.
•
Recency: this represents how recently a customer made a purchase. This aspect is not
built into Tapestry because it is unique to the business or organization that makes the sale.
Recency data should be kept as part of the organization's customer relationship
management (CRM) system and integrated with Tapestry segmentation. For a library, this
CIVICTechnologies
equates to the integrated library system (ILS) or cardholder database. By combining these
data sets an organization can benchmark its customer reach and connection, and then
measure effectiveness of its marketing and sales campaigns.
•
Frequency: this represents how often or frequently customers make purchases. This is a
key element in a business being able to forecast revenue and its investment in marketing
and sales including the use of segmentation. Increasing purchasing (or, in the case of the
library, borrowing) frequency by understanding customer lifestage and motivation through
segmentation is essential to building the customer relationship. By utilizing the latest
consumer expenditure survey data, Tapestry is able to distinguish consumer spending
patterns and related lifestyle choices.
•
Channels: these are the methods and media through which organizations market and/or
sell goods and services to the segments. These channels include print, television, radio,
and web-based methods, as well as direct and indirect marketing. Organizations must
actively choose and consider the best channels to reach each segment for the type of
marketing or sales campaign they are undertaking.
Evaluating Success
Effective segmentation must be both qualitative and quantitative. To make accurate, segmentationdriven decisions, companies need to evaluate success (including, for companies, measuring
profitability) at multiple levels, including the individual, sub-segment, segment, and the total
customer portfolio level. Companies must figure out measures of value – the success or profitability
variables that work best for them. Research at IBM indicates that these measures vary by industry
and by company, from recency, frequency, and monetary indices (RFM), to customer-value indices,
and revenue per customer versus cost to serve. IBM notes one caution in selecting profitability
measures: make sure the measure chosen provides an accurate, comprehensive view of
performance. Relying on per-customer revenue numbers only, for example, could be misleading;
customers at the same sales levels could be profitable in a low-rent retail location but unprofitable in
a high rent retail location. Make sure measures are comprehensive.
Pulling it Together: Interaction of the Three Segmentation Building Blocks
The interaction of these three segmentation building blocks (segment characteristics, time, and
profitability) is the continual tracking of customers. Tracking customers and prospective customers
on an annual basis or even a quarterly basis will not work in a marketplace in which customers have
the upper hand because so much potential information is available to inform their purchasing
decisions. Organizations must move away from infrequent tracking to always tracking and in turn
create an on-going relationship with the customer. In this sense the business networking
relationship is parallel to the social networking relationship. The organization that intentionally tracks
customers to understand current and future profitability and risk, likelihood of defection, channel
preference, propensity to purchase additional products, and lifestage has the competitive edge. An
16
CIVICTechnologies
organization can use segmentation data, industry data, and its own data to predict changes in the
marketplace and interpret the direction its business and its industry are moving.
6.0
Tapestry Library Applications
There are two library applications in which Tapestry is presented: BusinessDecision and
LibraryDecision.
BusinessDecision
BusinessDecision and BusinessDecision Academic (both hereinafter referred to as
“BusinessDecision”) are database services that enable end-users, through a library’s subscription,
to access Tapestry segmentation data. (Two case studies shown in the Appendix were prepared
using BusinessDecision – Case Study 2: Start-Up Yoga Studio, Los Angeles, California and Case
Study 3: Student Advertising Campaign Project, Pellissippi State Community College, Knoxville,
Tennessee).
BusinessDecision integrates Tapestry market segmentation data with other data sets including
demographic forecasts, consumer spending data, housing forecasts, and thematic maps to support
the individual, customized queries of any authorized end-user.
BusinessDecision is a consumer market database, reporting, and mapping service that targets
small business, entrepreneur, and non-profit patrons at public libraries; and students, faculty, and
staff at academic libraries. With BusinessDecision libraries can empower local businesses, nonprofits, and students with most of the same data, reports, and maps that are used by America's best
and most successful companies. BusinessDecision is wizard-driven and easy to use; the interface is
designed so that anyone can create Tapestry segmentation reports and maps without having to be
trained to use native geographic information systems (GIS) software.
Because BusinessDecision embeds Tapestry, the end-user has the ability to utilize powerful data
and analytical tools to:
•
•
•
•
•
Create and analyze trade areas
Perform competitive analysis
Evaluate market penetration
Identify new site locations
Target media buys and direct mail
campaigns
•
•
•
•
Find new customers
Reveal untapped markets
Select the right merchandise mix
Expand into appropriate new markets
BusinessDecision includes the use of powerful thematic maps. Thematic maps represent and
display data, including Tapestry data, consumer expenditure data, and demographic data. Maps are
designed and customized by the end-user including the location of the site studied and the study
17
CIVICTechnologies
area around each site. The study area can be overlapping rings, donut rings, drive times, or a handdrawn shape. Map data can be presented at a range of geographic levels including census block
groups, census tracts, and ZIP Codes, among others.
As a subscription service, BusinessDecision offers many user support features including an
unlimited number of reports and maps; can be used by an unlimited number of simultaneous users;
and any registered library user can access BusinessDecision through any desktop computer's web
browser or through the library's website.
LibraryDecision
LibraryDecision is a comprehensive suite of planning, marketing, and development services that
employs Tapestry market segmentation data to assist public libraries better connect with their
community. LibraryDecision utilizes Tapestry data to characterize the local populous and merges
the Tapestry data with selected patron, checkout, and program information from the library’s
integrated library system (ILS) to understand library use patterns and plan strategic initiatives.
LibraryDecision services are delivered and displayed using CommunityConnect, as described
below. Case Study 4: Strategic Plan: Topeka and Shawnee County Public Library (TSCPL), Kansas
(see Appendix) was prepared using LibraryDecision.
LibraryDecision includes four services that employ Tapestry:
SnapShot
SnapShot is a brief eye-catching report that analyzes Tapestry market segments, demographic
trends, socio-economic data, and consumer interests. SnapShot is a situational analysis of the
market in which the library is located. SnapShot provides hard data about the library’s service
area and is particularly useful as a top level analysis.
Patron
Patron is an in-depth analysis of patron use patterns put in the framework of the Tapestry
market segmentation system. Selected ILS data is merged with Tapestry data to develop
profiles of patrons and non-patrons. These profiles look at who uses the library and where they
live; and more importantly, who doesn’t use the library and how to connect with them. Patron is
particularly useful for strategic and facilities planning. Patron results can be used to develop
marketing campaigns, collection development, and planning facility locations.
Planner
Planner helps library administrators plan branch service areas and locate new outlets. Planner
utilizes Tapestry market segmentation and other tools such as population forecasts, library
service indicators, and thematic maps to identify underserved populations and develop plans of
service to meet local needs.
18
CIVICTechnologies
Voter
Voter helps library administrators to win library-related ballot elections. Voter compares
historical library use patterns, voting patterns and market segments to assist libraries in winning
funding support at the ballot box. Through the use of Tapestry segmentation, Voter helps
libraries in two ways: 1) strategically by predicting which voters will help win library funding
campaigns; and 2) tactically by developing the election campaign focused on key segments and
messages.
Consulting Services
Consulting services utilize Tapestry segmentation for special projects and other assignments
that do not fit the services described above.
CommunityConnect
CommunityConnect is an interactive website that enables public libraries to understand their
community by integrating market segmentation data with library statistics including patron,
checkout, and materials data from SnapShot, Patron, Planner, and Voter. With
CommunityConnect libraries have a powerful tool to deliver more effective services to meet the
specific needs of local communities and neighborhoods (see
www.tscplcommunityconnect.com). CommunityConnect can be customized to reflect a library’s
strategic planning initiatives and can include data updates from the library’s integrated library
system (ILS) to measure results and manage services, campaigns, and unique programs.
7.0
Conclusion: Market Segmentation and the 21st Century
Library
While market segmentation is new to the public and academic library market, its widespread
adoption by large businesses over a long period of time is testimony to its robust and reliable
predictive capabilities. With the affordability and ease-of-use of services such as BusinessDecision
and LibraryDecision, libraries are beginning to adopt market segmentation to meet a variety of
needs, including their own strategic planning.
Market segmentation can be used broadly or narrowly. In its broadest use, market segmentation is
strategic in nature and can help change the way an organization (e.g., library or business)
conceptualizes its business model to become customer-centric. Used narrowly, market
segmentation can be applied in a more traditional manner to marketing campaigns and sales
programs.
Because market segmentation is now an affordable commodity, public and academic libraries can
engage customers with a service that specifically meets their needs. Academic libraries are using
market segmentation to support the research needs of students and faculty; public libraries are
19
CIVICTechnologies
supporting the economic growth and development of their communities by providing market
segmentation tools to small businesses, entrepreneurs, and non-profits as well as using the tools for
strategic planning by the library itself.
8.0
References
Driving an Operational Model that Integrates Customer Segmentation with Customer Management,
IBM Institute for Business Value Executive Brief, IBM Consulting Services, 2003
Community Tapestry Handbook, ESRI, 2007-2009
Finding the Underserved: Close Examination Using Market Segmentation Can Reveal Useful
Surprises About the People Your Library Is Leaving Behind, Marc Futterman, Library Journal,
October, 15, 2008. http://www.libraryjournal.com/article/CA6602835.html
20
CIVICTechnologies
Appendix: Case Studies
Case Study:
Type
Objective
Large corporation
Inform a national advertising campaign to target potential customers whose
characteristics best match the company’s most profitable customers.
Background
Created in 2003, DS Waters is the producer and distributor of home, office and
retail bottled water products across the United States under the brand names
Alhambra, Belmont Springs, Crystal Springs, Hinckley Springs, Kentwood
Springs, Nursery Water, Sierra Springs, and Sparkletts. The Company is the U.S.
leader in home and office water delivery, focusing on five-gallon, one-gallon
and single-serve bottled water products. DS Waters employs approximately
4,500 Associates in more than 40 states.
Use of
We identified the top 20 percent of 2.3 million customers by profitability and
determined their market segments at the block group and zip code levels. Ten
segments accounted for these top earning customers. Then we identified the
average number of customers within each block group. Block groups with
lower than average number of customers (low penetration rate) were
identified as the most likely locations to solicit potential customers whose
profile closely matched proven, highly profitable customers.
Segmentation
21
Customer Prospecting
DS Waters, Atlanta, Georgia
Results
DS Waters undertook a multi-million dollar national advertising campaign
targeting the ten market segments that represent the highest profitability
customers, focused in under-performing census block groups.
Credits
Project by CIVICTechnologies in association with DDB
CIVICTechnologies
Figure 8: DS Waters Segment Map of Southern California
Market segments are mapped in relation to growth or decline in the customer base, indicating locales for
targeted marketing and sales.
22
CIVICTechnologies
Case Study:
Type
Objective
Background
Use of
Segmentation
Start-Up Yoga Studio
Los Angeles, California
Entrepreneur
There were two objectives: 1) use BusinessDecision Tapestry segmentation data
to find the best possible site for locating a start-up yoga studio; and 2) use
BusinessDecision demographic and market potential data to inform the
business plan revenue model.
A first time entrepreneur is starting up a yoga studio and needs reliable and
accurate data for preparing a business plan and obtaining a bank loan.
Upon discovering BusinessDecision on her public library’s website, the
entrepreneur prepared a Tapestry analysis of successful nearby yoga studios.
They each have between one and four dominant segments. These segments
have similar characteristics such as high disposable income, well-educated
professional women between 25 and 40, equal number of married-couple
families and families with children, and high home or condo ownership.
The entrepreneur prepared a Tapestry analysis of her market area to identify
same-segment locations. She then selected three alternative sites upon which
to pursue lease negotiations.
The entrepreneur prepared a revenue model for her business plan. Using
BusinessDecision demographic data she calculated that 23,606 people live in a
one mile radius around her preferred site. Using BusinessDecision market share
data, she found that 5.9 percent of the people purchase yoga services (5.9
percent x 23,606 people = 1,392 customers). Knowing her price per class, she
calculated projected core business revenue (1,392 customers x $15 per lesson
at two lessons per month = $501,120).
Results
The bank reviewing the business plan validated the data provided by
BusinessDecision. The bank and entrepreneur decided that the first phase of
implementation would be opening a national franchise juice bar so she could
gain operational business experience. She has been profitably running that
franchise since January 2008 and plans to open the yoga studio soon.
Testimonial
“I found BusinessDecision through the local public library website. I was
amazed at the detailed information accessible to me, information I could not
find elsewhere and, as it turns out, couldn’t have afforded on my own.
BusinessDecision let me take my business concept and test it through in-depth
demographic and Tapestry segmentation reports. The data I’ve gathered
through BusinessDecision has given me the proof I needed to develop my
business plan and the confidence to seek financing to realize my dream. The
library is providing an incredible service to entrepreneurs like me by offering
BusinessDecision.”
Alexia Cirino, Public Library Patron
Credits
23
CIVICTechnologies
Data provided by BusinessDecision
Figure 9: Start-Up Yoga Studio Comparison of Competitor Segments
The segments most likely to practice yoga were identified through an analysis of segments living close to
competitors. Those same segments were compared in relation to alternative sites for the start-up studio. The
preferred site, Alternative 2, was selected because it most closely matched segments that attend classes at
competitor locations.
24
CIVICTechnologies
Case Study:
Type
Objective
Background
Use of
Segmentation
Results
Testimonial
Student Advertising Project
Pellissippi State Community College, Knoxville,
Tennessee
College/University class project
As part of a comprehensive course, students develop an advertising
campaign for local businesses. The objective is for students to apply learning
concepts to a real client. In addition to the client, a group of local advertising
agency, media, and public relations professionals help evaluate the
campaign’s effectiveness.
The March of Dimes of East Tennessee needed help developing promotional
materials for two fund-raising events: the Signature Chefs’ gala which brings 20
local restaurant chefs together to sample their signature dish at a black tie
gala that includes a live and a silent auction; and a real estate breakfast
designed to honor an outstanding industry member. Both events support efforts
to minimize the risk of premature births. Developing promotional materials
requires a thorough understanding of the target market’s client profile and the
concentration of particular segments in the East Tennessee area.
Using Tapestry profiles enables students to target people who are interested in
attending the March of Dimes gala event. Student teams focus on segments
composed of professional and community volunteers who have or want to
have children and/or grandchildren. Tapestry segment descriptions paint an
accurate picture of the target audience so students can develop effective
communication strategies. Mapping selected segments allows effective and
efficient use of limited media funds to reach the most likely prospects.
Using BusinessDecision students learn how the different segmentation variables
work together to better understand the complexities of customer profiling. They
learn how to research a target market from many perspectives and choose
the approach that best works for the client. Having a database as powerful
and multifaceted as Business Decision dramatically increases students’
understanding of complex relationships and demonstrates student skills. Critical
thinking skills are sharpened, the ability to use library resources is enhanced,
and the projects are professionally completed.
“BusinessDecision is one of the most useful tools for teaching business I've ever
used. Students can investigate demographic, geographic, lifestyle and
behavioral dimensions of a target market on one site with minimal instruction
on the software. From a teaching perspective, this is phenomenal. As more
and more content is packed into the discipline, having a sophisticated
product like BusinessDecision allows me to demonstrate market segmentation
in a content rich manner without spending time I don't have doing so.”
Lisa Bogaty, Associate Professor, Business Computer Technology and Director
of Technology Programs, Pellissippi State Community College
Credits
25
CIVICTechnologies
Data provided by BusinessDecision
Case Study:
Type
Objective
Background
Use of
segmentation
Strategic Plan: Topeka and Shawnee County Public
Library, Kansas
Public library planning
The library wants to better understand the unique needs of the diverse people
in the library’s service area, find a better way of connecting with potential
library users, and provide staff with tools that enable them to grow
professionally.
TSCPL serves approximately 175,000 people with one facility. TSCPL sought to
identify underserved segments, assess their needs, develop appropriate
resources to meet those needs and deliver those services, and implement
marketing campaigns targeted at selected segments.
TSCPL began the process by mapping the relationships between patrons and
non-patrons and between patrons, checkouts, material types, and Tapestry
segments. The library found that the top six market segments account for 53%
of the population, with the remaining 47% fragmented across some 24 other
segments. Each segment was ranked for its potential to add patrons and
increase checkouts. This gives TSCPL a tool for identifying needs and for
developing and managing its service delivery and marketing.
The library learned important lessons: 1) they thought that customers living
farthest from the library use the mailing service the most but they learned that
distance is not a good predictor for how this service is used; 2) they thought
that people in rural Shawnee County prefer films over books but they learned
that people living in rural areas check out more books than films; and 3) they
thought that people who live in east Topeka are generally underserved and
are not big library users, but they learned that 77% of one local segment,
“Inner City Tenants” are library customers and have the 5th highest check out
per customer…they are receiving exceptional service.
Results
Testimonial
To implement the strategic plan the TSCPL CommunityConnect website was
created at www.tscplcommunityconnect.com. This website is a tool that
supports library staff’s initiatives to deliver services that target the unique needs
and interests of each of the 30 segments present in the county.
“My own epiphany about planning after working for more than 30 years as a
professional librarian is that the line between a library’s strategic plan and its
marketing/communications plan has begun to blur and merge. It is really all
about connecting with people and building relationships built on real
knowledge about each other. And the data that drives that is the GIS
(geographic information system) and market segmentation analysis.”
Gina Millsap, Executive Director, Topeka and Shawnee County Public Library
Credits
26
CIVICTechnologies
Data including Tapestry segmentation provided by ESRI
Figure 10: Segments in Topeka and Shawnee County
Market segmentation for the Topeka and Shawnee County Public Library lets the library know its community
better.
27
CIVICTechnologies
0%
28
CIVICTechnologies
Metropolitans
Prairie Living
Prosperous Empty Nesters
Sophisticated Squires
Up and Coming Families
Rustbelt Retirees
Green Acres
Exurbanites
Cozy and Comfortable
In Style
Milk and Cookies
Retirement Communities
Old and Newcomers
Aspiring Young Families
Midlife Junction
Print
Heartland Communities
College Towns
Crossroads
Rustbelt Traditions
Home Town
Midland Crowd
Metro City Edge
Great Expectations
Young and Restless
City Dimensions
Simple Living
Southwestern Families
Inner City Tenants
Social Security Set
Modest Income Homes
Percent of Population
Figure 11: Usage of Print and Non-Print Materials by Segment
100%
80%
Non-Print
60%
40%
20%
Tapestry Lifestyle Segment Name
Depending upon a host of variables, population segments lean to either print or non-print materials.
Figure 12: Library’s CommunityConnect Website
The CommunityConnect website enables staff to understand and compare segments, and access segment
data in planning and implementing library development programs and activities.
© Copyright CIVICTechnologies 2009. All Rights Reserved.
For more information contact Marc Futterman, (888) 606-7600 or
[email protected].
About BusinessDecision
BusinessDecision is a business database offered through public libraries that helps
small businesses succeed by increasing their market share and growing their
clientele, and that helps public libraries promote economic sustainability in their
local community by meeting the needs of small businesses, entrepreneurs, and
non-profits. BusinessDecision Academic is a business database offered through
academic libraries to help students and faculty undertake classroom and research
projects. For more about BusinessDecision visit www.businessdecision.info or
contact Julie Peterson toll free at (888) 606-7600 or by email at
[email protected].
About CIVICTechnologies
CIVICTechnologies provides a full suite of web services, customized applications
and consulting services to meet the complete geographic information systems (GIS)
needs of libraries and businesses—from small and medium enterprises to Fortune
500 companies—across a diverse range of industries. CIVICTechnologies enables
its customers to visualize data in new and innovative ways in order to deliver more
effective products and services, make better informed decisions, build consensus
faster, allocate resources more wisely, and implement organization-wide solutions
more effectively. For more information, call Marc Futterman toll free at (888) 6067600 or email him at [email protected]; or visit
www.civictechnologies.com
29
CIVICTechnologies


© Copyright 2026