
Spatial and temporal epidemiology of feline
Spatial and temporal epidemiology of feline immunodeficiency virus and feline leukemia virus infections in the United States and Canada by Bimal Kumar Chhetri A Thesis presented to The University of Guelph In partial fulfilment of requirements for the degree of Doctor of Philosophy in Population Medicine Guelph, Ontario, Canada © Bimal Kumar Chhetri, May 2015 ABSTRACT SPATIAL AND TEMPORAL EPIDEMIOLOGY OF FELINE IMMUNODEFICIENCY VIRUS AND FELINE LEUKEMIA VIRUS INFECTIONS IN THE UNITED STATES AND CANADA Bimal Kumar Chhetri University of Guelph, 2015 Advisor: Dr. Olaf Berke This thesis investigates the geographical and temporal variations in feline immunodeficiency virus (FIV) and feline leukemia virus (FeLV) infections, and the importance of known risk factors for these infections relative to each other in the United States and Canada. In addition, the effect of the modifiable areal unit problem (MAUP) on commonly used spatial analysis methods was assessed. Choropleth mapping and spatial scan testing revealed that compared to FIV, FeLV infection was predominant in western regions, and FIV infection was predominant in eastern regions of the US. A multilevel case-case study design for comparison of FIV and FeLV infections indicated that cats that were adult, male, healthy, or outdoor cats were more likely to be seropositive for FIV compared to FeLV when compared to juvenile, female, sick or cats kept exclusively indoors. Neuter status and testing at clinic or shelter did not differ significantly between the two infections. Time series analysis did not reveal an increasing or decreasing trend in FIV or FeLV seropositivity among cats tested at the Animal Health Laboratory (AHL) from 1999-2012. Further, the FIV vaccine introduction did not have a significant effect on changing seroprevalence for FIV. It was evident from this study that commonly used spatial epidemiological methods (Moran's I, the spatial scan test and spatial Poisson regression modeling) are sensitive to the choice of the spatial aggregation scale (state, county, postal code levels) for analysis, (i.e., are affected by the MAUP). The MAUP effect was expressed as differences in strength and significance of clustering, differences in size and number of clusters detected, and differences in significance and magnitude of associations between FIV or FeLV infections and predictor variables as the level of aggregation changed. ACKNOWLEDGEMENTS First and foremost, I would like to extend my sincerest gratitude to my advisor, Dr. Olaf Berke and the members of my advisory committee Drs. David Pearl and Dorothee Bienzle. Thank you for all the help and feedback you have provided me throughout the academic program. Olaf, I learnt a lot from you both inside and outside academics. You have always gone the extra mile to ensure that I get the most out of my academic program as well as keep a work-life balance. David, I have a better understanding of epidemiology because of your teaching and thoughtful insights. Dorothee, your subject matter expertise and advice on the project always provided me with solutions. I would also like to thank the Ontario Veterinary College Fellowship and Ontario Graduate Scholarship programs for funding my studies. Further, I would like to express my gratitude and admiration for the faculty at the Department of Population Medicine and Ontario Veterinary College from whom I learnt during various classes, seminars and other academic endeavors. I will always remember the friendly administrative staff who were always eager to sort things out for me – Thank you Mary, Sally, Linda and Carla. I also extend my sincerest gratitude to the Animal Health Laboratory (AHL) and IDEXX Laboratories for providing the data for this study; and especially to Dr. Beverly McEwen for her help extracting and managing the AHL data. Thank you also goes out to Khaled Gohary, Dan Shock, Steve Roche, Laura Pieper, Laura Falzon and Michael Eregae for being good friends and taking the journey through the program together. I extend my best wishes for your future. iv Last but not the least, I would like to extend my sincere gratitude and appreciation to my family, especially my wife Sumitra for the love and motivation. Thank you my children Ojjy and Jason for keeping things colorful. Dad, your resilience always inspires me. To Mom, Ravi, Manju and Mamata – thank you for your support from half a world away. v STATEMENT OF WORK DONE The electronic datasets for chapters 2 and 3 were obtained from IDEXX laboratories and consisted of two separate files of testing records and survey responses from two crosssectional studies. The data for chapter 4 were obtained as files from the AHL through Dr. Beverly McEwen and comprised of diagnostic test records and associated case histories. Dr. McEwen also provided assistance and clarification with respect to data quality and issues regarding data for chapter 4. Bimal Chhetri performed all of the data management and data quality assessments in consultation with IDEXX and the AHL. The boundary files for generating maps were provided by the Data Resource Centre at the Library of the University of Guelph. Bimal Chhetri conducted all of the data management and statistical analysis for this study with assistance from Dr. Olaf Berke. All of the chapters in this thesis were written by Bimal Chhetri with necessary revisions and advice concerning analysis provided by his advisory committee of Drs. Olaf Berke, David Pearl and Dorothee Bienzle. vi TABLE OF CONTENTS ABSTRACT ........................................................................................................................... ii ACKNOWLEDGEMENTS .................................................................................................. iv STATEMENT OF WORK DONE ........................................................................................ vi LIST OF TABLES ............................................................................................................... xii LIST OF FIGURES .............................................................................................................. xv CHAPTER 1: Introduction and Literature Review ................................................................ 1 1.1 Introduction ...................................................................................................................... 1 1.2 Literature review............................................................................................................... 2 1.2.1 Virus characteristics .................................................................................................. 2 1.2.2 Transmission pathways ............................................................................................. 4 1.2.3 Factors associated with retroviral seroprevalence ..................................................... 5 1.2.4 Geographic variation in seroprevalence of feline retroviral infections ..................... 6 1.2.5 Temporal patterns of feline retroviral infections ....................................................... 7 1.2.6 Challenges in interpretation of studies based on diagnostic tests .............................. 9 1.2.7 Concepts and methods – spatial analysis, case-case study design and time series analysis ............................................................................................................................. 11 1.2.7.1 Spatial analysis ..................................................................................................... 11 1.2.7.1.1 Disease cluster and the spatial scan test ........................................................ 11 1.2.7.1.2 Spatial Poisson regression ............................................................................. 12 1.2.7.1.3 The modifiable areal unit problem ................................................................ 13 vii 1.2.7.2 Case-case study design ......................................................................................... 14 1.2.7.3 Time series analysis .............................................................................................. 15 1.3 Study rationale ................................................................................................................ 16 1.4 Research objectives ........................................................................................................ 16 1.5 References ...................................................................................................................... 17 CHAPTER 2: Comparison of the geographical distribution of feline immunodeficiency virus and feline leukemia virus infections in the United States of America (2000-2011) ... 27 2.1 Abstract ........................................................................................................................... 27 2.2 Introduction .................................................................................................................... 28 2.3 Methods .......................................................................................................................... 30 2.3.1 Description of data................................................................................................... 30 2.3.2 Disease mapping - choropleth maps ........................................................................ 30 2.3.3 Disease cluster detection - spatial scan test ............................................................. 31 2.4 Results ............................................................................................................................ 33 2.5 Discussion....................................................................................................................... 33 2.6 Conclusion ...................................................................................................................... 36 2.7 Acknowledgements ........................................................................................................ 37 2.8 References ...................................................................................................................... 37 2.9 Tables and Figures .......................................................................................................... 43 viii CHAPTER 3: Comparison of risk factors for seropositivity to feline immunodeficiency virus and feline leukemia virus among cats: a case-case study. ........................................... 46 3.1 Abstract ........................................................................................................................... 46 3.2 Introduction .................................................................................................................... 47 3.3 Materials and methods .................................................................................................... 48 3.3.1 Data source and study participants .......................................................................... 48 3.3.2 Testing protocol ....................................................................................................... 49 3.3.3 Covariate information .............................................................................................. 49 3.3.4 Selection of study subjects: FIV and FeLV case groups ......................................... 50 3.3.5 Logistic regression ................................................................................................... 50 3.3.6 Univariable analysis ................................................................................................ 50 3.3.7 Multivariable analysis ............................................................................................. 51 3.4 Results ............................................................................................................................ 52 3.4.1 Descriptive statistics ................................................................................................ 52 3.4.2 Logistic regression analysis ..................................................................................... 52 3.5 Discussion....................................................................................................................... 53 3.6 Conclusion ...................................................................................................................... 56 3.7 References ...................................................................................................................... 57 3.8 Tables ............................................................................................................................. 63 CHAPTER 4: Temporal trends of feline retroviral infections diagnosed at the Ontario Veterinary College (1999-2012)........................................................................................... 67 ix 4.1 Abstract ........................................................................................................................... 67 4.2. Introduction ................................................................................................................... 67 4.3. Materials and methods ................................................................................................... 69 4.3.1 Data source and variables ........................................................................................ 69 4.3.2 Statistical modeling ................................................................................................. 70 4.4 Results ............................................................................................................................ 72 4.4.1 Descriptive statistics ................................................................................................ 72 4.4.2 Univariable associations and GLARMA modeling ................................................. 73 4.5 Discussion and conclusion ............................................................................................. 74 4.6 References ...................................................................................................................... 77 4.7. Tables and Figures ......................................................................................................... 81 CHAPTER 5: Disparities in spatial prevalence of feline retroviruses due to data aggregation: a case of the modifiable areal unit problem (MAUP)? .................................... 89 5.1 Abstract ........................................................................................................................... 89 5.2 Introduction .................................................................................................................... 89 5.3. Materials and methods ................................................................................................... 92 5.3.1. Data source, study area and population .................................................................. 92 5.3.2. Data aggregation ..................................................................................................... 93 5.3.3. Geocoding............................................................................................................... 93 5.3.4. Statistical methods .................................................................................................. 94 5.3.4.1. Spatial clustering ................................................................................................. 94 x 5.3.4.2. Spatial cluster detection ....................................................................................... 95 5.3.4.3. Spatial regression modeling ................................................................................ 96 5.4. Results and discussion ................................................................................................... 99 5.4.1. Results ................................................................................................................ 99 5.4.1.1. Descriptive statistics ........................................................................................ 99 5.4.1.2. Spatial clustering ............................................................................................. 99 5.4.1.3. Spatial cluster detection ................................................................................. 100 5.4.1.4. Spatial regression modeling .......................................................................... 100 5.4.2 Discussion.......................................................................................................... 101 5.5. Conclusion ................................................................................................................... 105 5.6. References ................................................................................................................... 106 5.7. Tables and Figures ....................................................................................................... 112 CHAPTER 6: Discussion, Limitations, Further Research and Conclusions ...................... 125 6.1 General discussion ........................................................................................................ 125 6.2 Limitations .................................................................................................................... 128 6.3 Future research directions............................................................................................. 130 6.4 Conclusions .................................................................................................................. 132 6.5 References .................................................................................................................... 133 xi LIST OF TABLES CHAPTER 2 Table 2.1. Descriptive statistics of FIV and FeLV infections, and the proportional morbidity ratios (PMR)………………………………………………………………………………..43 Table 2.2. Characteristics of high-risk areas (clusters) detected by spatial scan test for FIV and FeLV infections. ..……………………………………………………………………..44 CHAPTER 3 Table 3.1. Descriptive characteristics of the FIV and FeLV seropositive cat populations...63 Table 3.2. Results of univariable logistic regression analysis of risk factors for infection to FIV compared to FeLV…………………………………………………………………….64 Table 3.3. Results of the final mixed effects multivariable logistic regression model for analysis of risk factors for infection with FIV compared to FeLV……………………..…65 Table 3.4. Contrasts for the association between FIV seropositivity and sex/neuter characteristics compared to FeLV seropositivity…………………………………………..66 CHAPTER 4 Table 4.1. Associations between FIV seropositivity and risk factors recorded at AHL 19992012 from univariable quasi-likelihood Poisson regression models……………………….81 Table 4.2. Associations between FeLV seropositivity and risk factors recorded at AHL 1999-2012 from univariable quasi-likelihood Poisson regression models………………...82 xii Table 4.3a Estimated parameters of the final multivariable GLARMA model for the association between FIV seroprevalence and covariates recorded at AHL 1999-2012……83 Table 4.3b. Estimated parameters of the final multivariable quasi-likelihood Poisson model for the association between FIV seroprevalence and risk factors recorded at AHL 19992012………………………………………………………………………………………...84 Table 4.4a Estimated parameters of the final multivariable GLARMA model for the association between FeLV seroprevalence and covariates recorded at AHL 1999-2012….85 Table 4.4b. Estimated parameters of the final multivariable quasi-likelihood Poisson model for the association between FeLV seroprevalence and covariates recorded at AHL 19992012.......................................................................................................................................86 CHAPTER 5 Table 5.1a Descriptive characteristics of sampled cat population tested for FIV and FeLV infections in the US and Canada. ....................................................................................... 112 Table 5.1b. Descriptive statistics of FIV and FeLV seroprevalence (%), number of positive cats (cases) and number of cats tested for state, county and postal code aggregation level.....................................................................................................................................113 Table 5.2. Moran's I statistics based on empirical Bayesian smoothed seroprevalence of FIV and FeLV infections by spatial aggregation level. .....................................................114 Table 5.3a. Disease clusters as identified by the spatial scan test for FIV infections among cats in the US and Canada. ................................................................................................115 Table 5.3b. Disease clusters as identified by the spatial scan test for FeLV infections among cats in the US and Canada..................................................................................................116 xiii Table 5.4a. Results from multivariable spatial Poisson regression modeling of potential risk factors for FeLV infection at three spatial aggregation levels (postal code, county and state level). ..................................................................................................................................117 Table 5.4b. Results from multivariable spatial Poisson regression modeling of potential risk factors for FIV infection at three spatial aggregation levels (postal code, county and state level). ..................................................................................................................................118 xiv LIST OF FIGURES CHAPTER 2: Figure 2.1. Choropleth map of proportional morbidity ratios (PMR) of FIV to FeLV infections in the US…………………………………………………………………...……45 CHAPTER 4: Figure 4.1 - Time series plots of monthly FIV seroprevalence and total samples tested at AHL from 1999-2012…………………………………………...…………………………84 Figure 4.2 - Time series plots of monthly FeLV seroprevalence and total samples tested at AHL from 1999-2012..……………………………………………….……………………85 CHAPTER 5: Figure 5.1(a-c) - Spatial clusters of FIV infections (red circles) identified by the spatial scan test at postal code, county and state level aggregations. Arrows indicate clusters hidden by the black open circles that represent region centroids………….……………………119-121 Figure 5.1a Clusters at postal code level aggregation ………………....…………119 Figure 5.1b Clusters at county level aggregation……………………....…………120 Figure 5.1c Cluster at state level aggregation.…………………………....………121 Figure 5.2(a-c) - Spatial clusters of FeLV infections (red circles) identified by the spatial scan test at postal code, county and state level aggregations. Black open circles represent region centroids. ………….………………………….………………………………122-124 Figure 5.2a Clusters at postal code level aggregation…………….………………122 Figure 5.2b Clusters at county level aggregation.………….………..……………123 Figure 5.2c Cluster at state level aggregation…………………………………….124 xv CHAPTER 1: Introduction and Literature Review 1.1 Introduction Infections with feline immunodeficiency virus (FIV) and feline leukemia virus (FeLV) are common and important conditions in cats in the United States (US) and Canada (Levy et al., 2008a; Little et al., 2009). Both FIV and FeLV are immunosuppressive retroviruses and associated with a wide array of disease conditions affecting multiple organ systems and susceptibility to opportunistic infections. The infections may be characterised by prolonged latency of infection and there is no effective treatment. There is great interest in studying FIV in cats as an animal model for human immunodeficiency virus (HIV), developing diagnostic tests to distinguish vaccinated from infected cats, and to develop better vaccines to protect uninfected animals. However, little progress has been made towards the understanding of the distribution and causes of FeLV and FIV infections in large-scale cat populations. In terms of epidemiology, questions remain regarding burden of viral infection in large cat populations, the risk factors, and the temporal and geographic distribution. Furthermore, although known to share common risk factors, the relative importance attributed to each risk factor for acquiring FIV or FeLV is variable in the literature. For example while FeLV is thought to be affecting young cats (Hoover et al., 1976), other studies have shown that older cats may also be at high risk of acquiring infections (Little et al., 2009). Since no successful treatment exists for either infection, knowledge about the distribution and important risk factors of both infections would assist in defining prophylactic, management and therapeutic measures for stray, feral, and owned cats (Little et al., 2011). This literature review discusses the known epidemiology of FIV and FeLV infections and identifies gaps in our understanding of their epidemiology, with a focus on the prevalence in 1 North America, the geographic and temporal distribution, and risk factors for infection. 1.2 Literature review 1.2.1 Virus characteristics FIV and FeLV are retroviruses of the Lentivirus and Gammaretrovirus genera, respectively. Retroviruses are enveloped RNA viruses that rely on a DNA intermediate for replication. The term “retro” (reverse) relates to the property of retroviruses to use their RNA genome to produce DNA intermediates using reverse transcriptase. First isolated and described in 1987 from Petaluma, California (Pedersen et al., 1987), FIV has since been reported in both domestic and wild cats. Much research has been undertaken to understand the biology of the virus. Impetus on FIV research is primarily guided by its suitability as an animal model of HIV. Important from an epidemiological perspective, the genome of the FIV consists of three major genes, envelope (env), polymerase (pol), and group specific antigen (gag), in addition to at least three other accessory genes (vif, i and rev). The env gene encodes the viral glycoprotein (gp120) and the transmembrane protein (gp41), the pol gene encodes the capsid protein p24 and the gag gene encodes protease, integrase, and reverse transcriptase proteins (Dunham and Graham, 2008). FIV is known to have high mutation rates resulting in diverse viral variants and the possibility that FIV may continually evolve leading to new subtypes (Dunham and Graham, 2008). The diverse and continually evolving FIV viral variants pose a challenge for producing effective vaccines. FIV exists in six subtypes or clades, A-F, based on the nucleotide sequence of the env gene (Stickney et al., 2013), which is highly variable. Geographic variation in clade distribution has been noted. Subtype A has been reported from US, Canada, Argentina, Nicaragua, Japan, Australia, UK, Germany, Italy, Netherlands, 2 France, Switzerland, South Africa and New Zealand (Pistello et al., 1997; Nakamura et al., 2003; Reggeti and Bienzle, 2004; Kann et al., 2006a; Kann et al., 2006b; Iwata and Holloway, 2008; Weaver, 2010). Subtype B has been reported from US, Canada, Argentina, Japan, Australia, Germany and Italy (Reggeti and Bienzle, 2004; Kann et al., 2006b; Weaver, 2010). Subtype C has been reported from US, Canada, New Zealand, Japan, Taiwan, Vietnam, Germany and South Africa (Nakamura et al., 2003; Reggeti and Bienzle, 2004; Kann et al., 2006a; Weaver, 2010). Subtype D has been reported from Asia (Nishimura et al., 1998; Nakamura et al., 2003; Keawcharoen, 2006). Subtype E and F have only been reported from Argentina and US, respectively (Pecoraro et al., 1996; Weaver, 2010). Within the US, Clade A is predominant in the Western states whereas Clade B is predominant in the Eastern US. There is literature that suggests that the genomic sequence of the virus is an important factor in the pathogenicity. FIV subtype A is thought to be more pathogenic when compared to subtype B which is presumed to be more ancient and host adapted (Pistello et al., 1997; Bachmann et al., 1997). Subtype C was considered to be more pathogenic than subtype A, however, this is controversial (Pederson et al., 2001). FeLV has been reported mainly in domestic cats and was first described in 1964 (Jarrett et al., 1964). It is considered to be more pathogenic than FIV, and FeLV infection has a higher impact on mortality, because it causes cancer and more severe immunosuppression than FIV (Hartmann, 2006; Lutz et al., 2009). The FeLV genome contains env, pol, gag genes that code for the surface glycoprotein gp70 and the transmembrane (TM) protein p15E; reverse transcriptase, protease and integrase; and internal virion proteins; respectively. Presence of p27 is used for clinical detection of FeLV, and gp70 defines the virus subgroup (Hartmann, 2006; Lutz et al., 2009). FeLV is divided into several subgroups (based on the genetic map), but only 3 subgroup FeLV-A is infectious and transmitted from cat-to-cat (Hartmann, 2006). The other subgroups (e.g., FeLV-B, FeLV-C, FeLV-myc) are not transmitted from cat-to-cat under natural circumstances, but can be generated de novo in an FeLV-A-infected cat by mutation and recombination of the FeLV-A genome with cellular genes or genes from endogenous retroviruses in the cat's genome (Hartmann, 2006). 1.2.2 Transmission pathways Viremic cats are a source of FeLV infection and the virus is actively shed in saliva, nasal secretions, feces, milk and urine (Hardy et al., 1976; Pacitti et al., 1986). Although FeLV was previously thought to be of concern in “friendly cats” and primarily acquired through direct intimate contact with viremic cats through nursing, mutual grooming, sharing of food bowls and litter pans, it is now also suggested that biting is a major route of transmission and aggressive cats are at risk of transmitting and acquiring FeLV (Goldkamp et al., 2008; Gleich et al., 2009). Shed in high concentrations in saliva along with infected leukocytes (Levy et al., 2008a), FIV is primarily transmitted via parenteral inoculation of virus present in blood or saliva though bites (Sellon and Hartmann, 2006). Acutely infected queens can transmit FIV to developing offspring during pregnancy as well as post-partum though nursing (O'Neil et al., 1995; Allison and Hoover, 2003; Medeiros et al., 2012). Although experimental infection via sexual transmission (Jordan et al., 1998; Stokes et al., 1999) has been identified, it is considered uncommon in natural settings (Ueland and Nesse, 1992). Regarding the stability of these viruses in an external environment, virtually no literature exists. However, based on extrapolation from studies of other retroviruses and based on 4 properties of other enveloped viruses, FIV and FeLV are very susceptible to temperature, pH and humidity. 1.2.3 Factors associated with retroviral seroprevalence Age, sex and lifestyle are known to play an important role in a cat’s risk of acquiring infection with FIV or FeLV. Cats that are likely to encounter infected cats and prone to aggression and territorial fights are at higher risk of acquiring infection. Therefore, the known risk factors for acquiring both of these infections are male sex, adulthood and exposure to outdoors, whereas being neutered and indoor lifestyle are known protective factors (Hoover and Mullins, 1991; O'Connor Jr. et al., 1991; Levy, 2000; Levy, 2005; Levy et al., 2008a). Coinfection with FIV and FeLV has been reported (Fuchs et al., 1994; Arjona et al., 2000; Gibson et al., 2002; Gleich and Hartmann, 2009). The relative importance of age, outdoor exposure and sex for either infection is variable in the literature. Previously, FeLV was thought to be a disease of young, “friendly” cats living in multi-cat households, now it is believed that adulthood, outdoor lifestyle, neuter status, and fighting, factors commonly associated with FIV, are also associated with FeLV infection. While it has been suggested that the susceptibility of cats to FeLV is age dependent (Hoover et al., 1976) with younger cats being more susceptible, later studies have demonstrated natural and experimental infection in adult cats as well (Grant et al., 1980; Lehmann et al., 1991). Gleich et al. (2009) also did not find any significant difference in age between FeLV infected and non-infected cats while Levy et al. (2006) and Little et al. (2009) report a higher risk of FeLV infection in adult cats compared to juvenile cats. FeLV infections have also been associated with a history of fighting (Gleich et al., 2009) and fighting injuries (Goldkamp et al., 2008). While earlier studies did not find an association between sex and FeLV 5 infection (Lee et al., 2002; Muirden, 2002), several large seroprevalence studies have found an association of male sex with risk of FeLV infection (Levy et al., 2006; Gleich et al., 2009) suggesting that aggression may also play a role in FeLV infections. It is now suggested that FeLV and FIV have similar risk factors, however there is still contrasting evidence to indicate that these risk factors could be relatively more important for one or the other infection. While age could be an important known risk factor for acquiring both FIV and FeLV, other risk factors seem less important for FeLV. Nevertheless, the majority of studies that form the body of knowledge regarding risk factors for seropositivity are based on crosssectional surveys in different populations (e.g., all sick cats), have varied sample sizes, were placed in differing geographic locations, and were subject to several sources of bias. 1.2.4 Geographic variation in seroprevalence of feline retroviral infections Seroprevalence of FeLV and FIV are highly variable depending on age, sex, lifestyle, health status, and geographical location (Levy et al., 2008a). Furthermore, molecular studies of FIV report distinct geographic variation throughout the world. The reported seroprevalence of infection in Canada and the United States varies according to different sources, but these viruses are generally reported to be present in 2-5% of all cats (Levy et al., 2006; Little et al., 2009). The reported prevalence of infection is much higher in other countries, such as Italy, Australia and Japan, where studies have found prevalence at levels as high as 30% (Sellon and Hartmann, 2006). This difference has been attributed to a comparatively larger number of free-roaming animals in Europe, Japan, and Australia, as well as due to differences in viral subtypes. In contrast to considerable geographical variation of FIV prevalence, the FeLV infection rate is less 6 divergent throughout the world, ranging from 1% to 8% in healthy cats and up to 21% in sick ones (Hartmann, 2006). Prevalence of retroviral infection represents obvious regional patterns in some countries. A study from Vietnam reported FIV seroprevalence to be higher in the south when compared to the north (Nakamura et al., 2000). Similarly, in Germany, differences in prevalence of FIV between northern and southern states have been reported and attributed to lifestyle, sex and health status of cats (Gleich et al., 2009). A cross-sectional study carried out in Canada in 2007 including 10 provinces reported significant differences in FeLV infections between Quebec, British Columbia and Ontario (Little et al., 2009). Similarly, FIV infection rates were reported to be significantly different between Quebec and Nova Scotia. In the US, a study investigating the variation in regional rates of infection reported a lower FIV and FeLV seroprevalence for western states than for other regions (Levy et al., 2006). These regional differences in the US and Canada were still present after adjusting for known risk factors (Levy et al., 2006; Little et al., 2009) suggesting that currently unidentified spatially varying risk factors may contribute to these differences. 1.2.5 Temporal patterns of feline retroviral infections A number of studies speculate about variations in temporal patterns for FIV and FeLV occurrence (Levy et al., 2008a, Gleich et al., 2009). The prevalence of FeLV infection has reportedly decreased since its discovery in 1964 especially during the last 20 years (Jarrett et al., 1964; Levy et al., 2008a), presumably as a result of the implementation of widespread testing programs and control practices including vaccination (O'Connor Jr. et al., 1991; Moore, 2004; Levy et al., 2006; Little et al., 2011). The first FeLV vaccine was introduced in 1985, but the 7 observed decline in the overall infection rate began before this time (Hartmann, 2006). In contrast, the prevalence of FIV has not changed since the virus was discovered in 1986. Testing for FIV infection is less common, and a vaccine against FIV was not introduced until 2002. Whether the prevalence of FIV infection will change in the future is unknown (Levy et al., 2008a). While these temporal trends are generally accepted to be valid, the available literature is mostly based on cross-sectional sampling of cats at different time points with heterogeneity in characteristics of the tested populations, diagnostic tests, geographic locations, and time-varying confounders. Analysis of surveillance data to investigate the temporal variation can alleviate some aforementioned challenges. Studies of temporal trends usually involve data collected at regular intervals and an analysis using statistical time series methods. Surveillance data are well suited for such an analysis. Generally, the interest is either descriptive (e.g., comparison of disease rates over time) or analytical (e.g., identification of predictive factors for a trend). One may specifically be interested in an investigation of temporal trend and/or seasonal variation for infectious diseases. In addition, utilization of time series methods offers regression modeling to adjust for known confounders and to obtain reliable estimates of temporal effects of interest. No study has reported an investigation of temporal trends of FIV or FeLV using time series methods. Further, there is a paucity of literature reporting temporal trends based on analysis of surveillance data routinely collected over time. An early study from the US that involved records from 2000 diagnostic tests for FeLV reported a decrease in seroprevalence in US from 8% in 1989 to 4% in 1995 (Cotter, 1997). Based on routinely collected data in 850 Banfield Pet Hospitals across 43 states in the US encompassing approximately 470,000 cats annually from 2009 to 2013, the FIV prevalence increased from 23 cases to 33 cases per 10,000 8 cats. In contrast, the FeLV prevalence decreased slightly from 43 cases to 41 cases per thousand cats (Banfield Pet Hospital, 2014). Another study based on 17,289 hospital records from 1993 to 2002 in Germany reported a significant decrease in FeLV prevalence from 6% to 1% and a steady prevalence for FIV (3.1 to 3.5%) (Gleich et al., 2009). 1.2.6 Challenges in interpretation of studies based on diagnostic tests FIV infections are commonly diagnosed by screening for antibodies against viral proteins p24 and p15. The IDEXX SNAP® FIV/FeLV Combo and PetCheck® FIV are the most commonly used enzyme linked immunosorbent assay (ELISA) tests in clinical setting and have been shown to have very high sensitivity and specificity (Levy et al., 2004). Since the antibodies against FIV infection persists for life, a positive test is usually regarded as a sufficient indicator of infection in non-vaccinated cats (Hartmann, 1998; Levy et al., 2004). However, currently available commercial ELISA serological tests cannot distinguish between antibodies due to vaccination and those induced by infection with field strains. Antibodies against the virus can be detected as early as 2-4 weeks in experimental infections (Yamamoto et al., 1988). Although most cats seroconvert within 60 days, some cats may take longer to seroconvert (Barr, 1996). Despite high sensitivities and specificities for ELISA tests, it is generally recommended to confirm a positive test especially for low risk cats, and cats in populations with low prevalence, where the positive predictive values of these tests are lower (Jacobson, 1991). Options for confirmatory testing include virus isolation, second ELISA test from a different manufacturer, western blot test and immunofluoroscent antibody (IFA) test. In field settings, these tests are not routinely used either due to high labour costs (virus isolation) or availability. Further, IFA and western blot tests have been shown to be less sensitive and specific 9 than routinely used ELISA tests (Levy et al., 2004). A common problem with the use of antibody detection assays is the interpretation of positive test results from kittens less than 6 month of age and from vaccinated cats. Non-infected kittens with maternally derived antibodies against FIV may test positive, as will the vaccinated cats. Although, use of discriminant ELISA (Kusuhara et al., 2007; Levy et al., 2008b), polymerase chain reaction (PCR) and real time PCR methods have been suggested to confirm the true infection status of vaccinated cats, such tests are in most cases not routinely available and show variable performance compared to routinely used ELISA tests (Bienzle et al., 2004; Crawford et al., 2005; Little et al., 2011). FeLV infection is routinely diagnosed via detection of the core viral antigen p27 in blood. Most cats test positive within 30 days of infection but this is variable (Jarrett et al., 1982; Levy et al., 2008a). Confirming a positive ELISA with a second test using kits from a different manufacturer is strongly recommended to increase the positive predictive value, especially in healthy cats since the prevalence in this population is usually low. Confirmatory testing is also done via IFA tests but will not detect infection until 6 to 8 weeks after the bone marrow is infected and secondary viremia sets in (Little et al., 2011). Although virus isolation is the gold standard, this is not readily available, is time consuming and expensive. Similarly, PCR has been suggested to confirm FeLV, but is not routinely available and shows variable performance compared to routinely used ELISA tests (Bienzle et al., 2004; Crawford et al., 2005; Little et al., 2011). 10 1.2.7 Concepts and methods – spatial analysis, case-case study design and time series analysis 1.2.7.1 Spatial analysis The availability of geographically indexed health and population data, and advances in computing, geographical information systems, and statistical methodology, enable the efficient investigation of spatial variation in disease risk (Pfeiffer et al., 2008). Spatial epidemiological methods are commonly used to identify, describe and quantify spatial patterns in the distribution of health/disease events. Spatial patterns commonly of interest include trends, clustering and detection of clusters in the occurrence of health events in a population. Further, geographic correlation studies can be important tools to evaluate the association of spatial or environmental risk factors with the occurrence of health events after adjusting for confounders. The identification of such spatial patterns may provide clues for further testable hypotheses about an unknown disease etiology (Berke and Waller, 2010). Ecological studies, such as geographic correlation studies, are particularly valuable when an individual level association between infection and risk factors is evident and a group level association is assessed to determine the population health impact (Stevenson and McClure, 2005). 1.2.7.1.1 Disease cluster and the spatial scan test Disease clusters are generally defined as two or more connected cases that occur too close in time and/or space under the assumption of a homogenous risk distribution in the population-at-risk. The identification of disease clusters is an important component of public health practice. The scan statistic is a statistical method, which can be used to detect spatial, temporal and spatio-temporal clusters (Kulldorff, 1997). The spatial scan statistic is generally 11 based on a circular window of variable size that moves over a study region, and performs a likelihood ratio test for the window with the highest likelihood of observed disease occurrence. With rare diseases such as FIV and FeLV, a Poisson model is adopted with the scan test, and it is assumed under the null hypothesis that disease events in each region of the study area follow a Poisson distribution with the expected number of cases being proportional to the covariate (risk factor) adjusted tested cat population. High-risk cluster detection can be performed by comparing the observed number of cases within the scanning window with the expected number (i.e., if cases were to be distributed randomly in space) (Kulldorff, 1997). The statistical significance of the clusters is established by Monte Carlo hypothesis testing. The spatial scan test is suitable for detecting high-risk and/or low-risk clusters for FIV and FeLV infections (i.e., to identify areas that are predominant regions of infections). A variety of software programs can apply spatial scan test to detect clusters including SaTScan (Kuldorff, M 2010) and the R package SpatialEpi (Chen et al., 2014). 1.2.7.1.2 Spatial Poisson regression Poisson regression models are a class of generalized linear models suitable to model counts or rates of rare events (Cameron and Trivedi, 2013). Counts and rates are frequently used in epidemiology to investigate the occurrence of a disease over time, population or area (Dohoo et al., 2009). Since areal data are often available as counts or rates, spatial regression modeling using Poisson regression models can be used to quantify the effect of spatially referenced explanatory factors on the spatial distribution of disease events (Waller and Gotway, 2004; Pfeiffer et al., 2008). Spatially referenced data are inherently autocorrelated, therefore, it is critical to adjust for the spatial autocorrelation in the data in order to prevent type I errors 12 (Tango, 2010). Among many proposed approaches for spatial regression modeling for areal data (Richardson and Monfort, 2000; Dormann et al., 2007; Waller and Gotway, 2004; Pfeiffer et al., 2008), the generalized linear mixed models (GLMMs), or spatial GLMMs can be effectively used to model counts as well as to adjust for spatial autocorrelation by inclusion of an appropriate covariance structure in the random effects. Spatial GLMMs including spatial Poisson regression models can be fit to the data using quasi-likelihood estimation, as well as maximum likelihood and Bayesian approaches. A variety of software programs can be used to fit these models including R (R Development Core Team 2013). 1.2.7.1.3 The modifiable areal unit problem Epidemiological studies are either based on health outcome data for individuals or on aggregated data for subpopulations of the study population. Individual level data are often not available due to privacy concerns or because it is necessary to create meaningful subpopulations for data analysis. In spatial settings, certain administrative regions, (e.g., county or postal code areas) define the respective subpopulations. However, the way areal units are defined can influence the results and inferences based on aggregated data. Specifically, the number or size of areas used and how the area boundaries are drawn can influence spatial data analysis. This has been termed the modifiable areal unit problem (MAUP) and is a long known phenomenon (Openshaw, 1983; Gotway and Young, 2002) in the geographical literature. The MAUP stems from the fact that areal units are usually arbitrarily determined and can be modified to form units of different sizes or spatial arrangements (Jelinski and Wu, 1996). The MAUP consists of two interrelated components - the scale and zoning effect (Waller and Gotway, 2004). The scale 13 effect is the variation in results obtained when the areal data comprising smaller areal units is grouped to form increasingly larger units. The zoning effect, on the other hand, is the variation in results obtained due to varying location or shape and extent of the areal units (Openshaw, 1983; Waller and Gotway, 2004; Wong, 2008). Currently, there are no solutions available to fully overcome the effects of the MAUP. Recommendations have been made to minimize MAUP effects in statistical inference by analyzing the aggregated covariates in hierarchical levels of areal units from the finest spatial resolution possible to a coarser resolution, verifying consistent model results across different scales, avoiding ecological fallacy, collecting data at the scale at which inferences are to be made and using scale invariant statistics to make inferences (Fotheringham, 1989; Ratcliffe and McCullagh, 1999; Diez-Roux, 2000; Waller and Gotway, 2004). However, none of these recommendations easily eliminates the problem. In Chapter 5 of this thesis, the MAUP effect on tests for spatial clustering, cluster detection and fitting of spatial GLMM’s is evaluated for alternative choices of aggregation schemes (postal code, county and state/province level) for both FIV and FeLV infections in North America. 1.2.7.2 Case-case study design Case-control studies are used in analytical epidemiology to examine the strength, magnitude and direction of associations between exposure variables and an outcome of interest (Dohoo et al., 2009). Case-case studies are a variant of case-control studies when the disease of interest can be sub-classified in two or several groups that may have distinct risk factors (McCarthy and Giesecke, 1999). A case–case study differs from a case-control study in that the 14 comparison group (or control cases) is selected among the cases of a different strain or serotype, as reported by the same surveillance system. The case-case study approach has been used often in epidemiology to compare risk factors for two subtypes of the same disease with the goal of ascertaining relative importance of risk factors for either subtype (Dohoo et al., 2009). The main advantage of the case-case design is its ability to limit selection and information biases since often the cases being compared have similar clinical features, are identified through the same surveillance system, and are subject to the same biases as cases (McCarthy and Giesecke, 1999; Wilson et al., 2008). One of the problems of this study design is that the factors that are common to both comparison groups tend to be underestimated or unidentified (McCarthy and Giesecke, 1999; Wilson et al., 2008). The case-case study design is applied in Chapter 3 of this thesis to investigate the relative importance of known risk factors of seropositivity for FIV and FeLV. 1.2.7.3 Time series analysis Time series analysis is concerned with the study of temporal patterns in a series of observations. Often the patterns of interest in epidemiology relate to variation in trend and seasonality or to assess the effect of health care interventions. Occasionally interest may be to forecast future events based on past records. Traditionally, time series analysis has been based on the assumption of a Gaussian distribution for the model residuals. This assumption does not hold for surveillance data of rare diseases, where case counts are generally assumed to follow a Poisson distribution. While researchers thus relied on generalized linear models (GLMs) for count data such as Poisson and negative-binomial regression models for independent data, generalized linear autoregressive moving average models (GLARMA) offer a methodologically sound alternative that respects the temporal dependence structure of time series observations 15 (Davis et al., 2000; Davis et al., 2003; Dunsmuir et al., 2014). These new and advanced time series methods provide crucial information about infectious diseases and their epidemiological characteristics in a temporal context. Although use of Poisson regression models is widespread in environmental epidemiology for modeling time series counts, Poisson regression models assume independent observations, which cannot be assumed to be true for time series; rather, temporal dependence is expected to exist. Poisson time series analysis and Poisson regression modelling are applied in Chapter 4 of this thesis to study secular trends in the occurrence of FeLV or FIV infections, as well as to quantify the effect of FIV vaccine introduction. 1.3 Study rationale Given that successful treatment strategies for efficient management of FIV and FeLV infections are still challenging, prophylaxis remains paramount. There is a lack of knowledge regarding geographic and temporal variation of these infections in the North American context. Additionally, the relative importance of risk factors for exposure to FIV compared to FeLV is unclear. This gap in knowledge must be addressed to inform clinicians and pet owners alike of the current risks and to create best practice guidelines based on relevant North American data. 1.4 Research objectives The overall goal of this thesis was to investigate the temporal and spatial epidemiology of natural FIV and FeLV infections and its risk factors. The thesis objectives were the following: 1) To describe the geographical distribution and detect high-risk areas of FIV and FeLV infections relative to each other (Chapter 2). 16 2) To assess the relative importance of known risk factors between the FIV and FeLV infections using the case-case study approach (Chapter 3). 3) To explore and describe temporal patterns in FIV and FeLV infections, and to investigate known risk factors and potentially time-varying trend patterns (Chapter 4). 4) To assess the effect of the Modifiable Areal Unit Problem on spatial regression models examining the association of seroprevalence of FIV and FeLV with ecological risk factors (Chapter 5). 1.5 References Allison, R.W., Hoover, E.A., 2003. Feline immunodeficiency virus is concentrated in milk early in lactation. AIDS Res. Hum. Retroviruses 19, 245-253. Arjona, A., Escolar, E., Soto, I., Barquero, N., Martin, D., Gomez-Lucia, E., 2000. Seroepidemiological survey of infection by feline leukemia virus and immunodeficiency virus in Madrid and correlation with some clinical aspects. J. Clin. Microbiol. 38, 34483449. Bachmann, M.H., MathiasonDubard, C., Learn, G.H., Rodrigo, A.G., Sodora, D.L., Mazzetti, P., Hoover, E.A., Mullins, J.I., 1997. Genetic diversity of feline immunodeficiency virus: Dual infection, recombination, and distinct evolutionary rates among envelope sequence clades. J. Virol. 71, 4241-4253 Banfield Pet Hospital, 2014. State of Pet Health 2014 Report. Banfield, Portland, Oregon. Barr, M.C., 1996. FIV, FeLV, and FIPV: interpretation and misinterpretation of serological test results. Semin. Vet. Med. Surg. (Small Anim.) 11, 144-153. 17 Berke, O., Waller, L., 2010. On the effect of diagnostic misclassification bias on the observed spatial pattern in regional count data-a case study using West Nile virus mortality data from Ontario, 2005. Spat. Spatiotemporal Epidemiol. 1, 117-122. Bienzle, D., Reggeti, F., Wen, X., Little, S., Hobson, J., Kruth, S., 2004. The variability of serological and molecular diagnosis of feline immunodeficiency virus infection. Can. Vet. J. 45, 753-757. Cameron, A.C., Trivedi, P., 2013. Regression Analysis of Count Data. 2nd edn. Cambridge University Press, New York, NY. Cotter, S., 1997. Changing epidemiology of FeLV. Proceedings of the 15th Annual ACVIM Forum; 1997 Lake Buena Vista, FL. Crawford, P.C., Slater, M.R., Levy, J.K., 2005. Accuracy of polymerase chain reaction assays for diagnosis of feline immunodeficiency virus infection in cats. J. Am. Vet. Med. Assoc. 226, 1503-1507. Davis, R.A., Dunsmuir, W.T., Streett, S.B., 2003. Observation‐driven models for Poisson counts. Biometrika 90, 777-790. Davis, R.A., Dunsmuir, W.T., Wang, Y., 2000. On autocorrelation in a Poisson regression model. Biometrika 87, 491-505. Dohoo, I.R., Martin, W., Stryhn, H., 2009. Veterinary Epidemiologic Research. 2nd edn. AVC Incorporated, Charlottetown, Canada. Dormann, C.F., McPherson, J.M., Araujo, M.B., Bivand, R., Bolliger, J., Carl, G., Davies, R.G., Hirzel, A., Jetz, W., Kissling, W.D., Kuhn, I., Ohlemuller, R., Peres-Neto, P.R., Reineking, B., Schroder, B., Schurr, F.M., Wilson, R., 2007. Methods to account for 18 spatial autocorrelation in the analysis of species distributional data: a review. Ecography 30, 609-628. Dunham, S.P., Graham, E., 2008. Retroviral infections of small animals. Vet. Clin. North Am. Small Anim. Pract. 38, 879-901. Dunsmuir, W., Li, C., Scott, D.J., 2014. glarma: Generalized Linear Autoregressive Moving Average Models. R package version 1.1-0. Fuchs, A., Binzel, L., Lonsdorfer, M., 1994. [Epidemiology of FeLV and FIV infection in the Federal Republic of Germany]. Tierarztl Prax 22, 273-277. Gibson, K.L., Keizer, K., Golding, C., 2002. A trap, neuter, and release program for feral cats on Prince Edward Island. Can. Vet. J. 43, 695-698. Gleich, S., Hartmann, K., 2009. Hematology and serum biochemistry of feline immunodeficiency virus-infected and feline leukemia virus-infected cats. J. Vet. Intern. Med. 23, 552-558. Gleich, S.E., Krieger, S., Hartmann, K., 2009. Prevalence of feline immunodeficiency virus and feline leukaemia virus among client-owned cats and risk factors for infection in Germany. J. Feline Med. Surg. 11, 985-992. Goldkamp, C.E., Levy, J.K., Edinboro, C.H., Lachtara, J.L., 2008. Seroprevalences of feline leukemia virus and feline immunodeficiency virus in cats with abscesses or bite wounds and rate of veterinarian compliance with current guidelines for retrovirus testing. J. Am. Vet. Med. Assoc. 232, 1152-1158. Gotway, C.A., Young, L.J., 2002. Combining incompatible spatial data. J. Am. Statist. Assoc. 97, 632-648. 19 Grant, C.K., Essex, M., Gardner, M.B., Hardy, W.D., Jr., 1980. Natural feline leukemia virus infection and the immune response of cats of different ages. Cancer Res. 40, 823-829. Hardy, W.D., Jr., Hess, P.W., MacEwen, E.G., McClelland, A.J., Zuckerman, E.E., Essex, M., Cotter, S.M., Jarrett, O., 1976. Biology of feline leukemia virus in the natural environment. Cancer Res. 36, 582-588. Hartmann, K., 1998. Feline immunodeficiency virus infection: an overview. Vet. J. 155, 123137. Hartmann, K., 2006. Feline leukemia virus infection. In: Greene, C.E. (Ed.), Infectious Diseases of the Dog and Cat (3rd edn). Elsevier, Philadelphia, 107–131. Hoover, E.A., Mullins, J.I., 1991. Feline leukemia virus infection and diseases. J. Am. Vet. Med. Assoc. 199, 1287-1297. Hoover, E.A., Olsen, R.G., Hardy, W.D., Jr., Schaller, J.P., Mathes, L.E., 1976. Feline leukemia virus infection: age-related variation in response of cats to experimental infection. J. Natl. Cancer Inst. 57, 365-369. Iwata, D., Holloway, S.A., 2008. Molecular subtyping of feline immunodeficiency virus from cats in Melbourne. Aust. Vet. J. 86, 385-389. Jacobson, R.H., 1991. How well do serodiagnostic tests predict the infection or disease status of cats? J. Am. Vet. Med. Assoc. 199, 1343-1347. Jarrett, O., Golder, M.C., Stewart, M.F., 1982. Detection of transient and persistent feline leukaemia virus infections. Vet. Rec. 110, 225-228. Jarrett, W.F., Crawford, E.M., Martin, W.B., Davie, F., 1964. A virus-like particle associated with leukemia (lymphosarcoma). Nature 202, 567-569. 20 Jelinski, D.E., Wu, J.G., 1996. The modifiable areal unit problem and implications for landscape ecology. Landscape Ecol. 11, 129-140. Jordan, H.L., Howard, J.G., Bucci, J.G., Butterworth, J.L., English, R., Kennedy-Stoskopf, S., Tompkins, M.B., Tompkins, W.A., 1998. Horizontal transmission of feline immunodeficiency virus with semen from seropositive cats. J. Reprod. Immunol. 41, 341357. Kann, R., Seddon, J., Kyaw-Tanner, M., Schoeman, J.P., Schoeman, T., Meers, J., 2006a. Phylogenetic analysis to define feline immunodeficiency virus subtypes in 31 domestic cats in South Africa. J. S. Afr. Vet. Assoc. 77, 108-113. Kann, R.K.C., Kyaw-Tanner, M.T., Seddon, J.M., Lehrbach, P.R., Zwijnenberg, R.J.G., Meers, J., 2006b. Molecular subtyping of feline immunodeficiency virus from domestic cats in Australia. Aust. Vet. J. 84, 112-116. Keawcharoen, J., Wattanodorn, S., Pusoonthronthum, R., Oraveerakul, K., 2006. Phylogenetic analysis of a feline immunodeficiency virus isolated from a Thai cat. Annual Conference of the Faculty of Veterinary Science, Bangkok, Thailand, 77. Kulldorff, M., 1997. A spatial scan statistic. Commun. Stat. Theory Methods 26, 1481-1496. Kusuhara, H., Hohdatsu, T., Seta, T., Nemoto, K., Motokawa, K., Gemma, T., Watanabe, R., Huang, C., Arai, S., Koyama, H., 2007. Serological differentiation of FIV-infected cats from dual-subtype feline immunodeficiency virus vaccine (Fel-O-Vax FIV) inoculated cats. Vet. Microbiol. 120, 217-225. Lee, I.T., Levy, J.K., Gorman, S.P., Crawford, P.C., Slater, M.R., 2002. Prevalence of feline leukemia virus infection and serum antibodies against feline immunodeficiency virus in unowned free-roaming cats. J. Am. Vet. Med. Assoc. 220, 620-622. 21 Lehmann, R., Franchini, M., Aubert, A., Wolfensberger, C., Cronier, J., Lutz, H., 1991. Vaccination of cats experimentally infected with feline immunodeficiency virus, using a recombinant feline leukemia virus vaccine. J. Am. Vet. Med. Assoc. 199, 1446-1452. Levy, J., 2000. CVT update: feline immunodeficiency virus. In: Bonagura, J. (Ed.), Kirk's Current Veterinary Therapy XIII. WB Saunders Co, Philadelphia, 284-288. Levy, J., Crawford, C., Hartmann, K., Hofmann-Lehmann, R., Little, S., Sundahl, E., Thayer, V., 2008a. 2008 American Association of Feline Practitioners' feline retrovirus management guidelines. J. Feline Med. Surg. 10, 300-316. Levy, J., Crawford, PC, 2005. Feline leukemia virus. In: Ettinger, S., Feldman, E. (Eds.), Textbook of Veterinary Internal Medicine (7th edn). Elsevier Saunders, St Louis, 653659. Levy, J.K., Crawford, P.C., Kusuhara, H., Motokawa, K., Gemma, T., Watanabe, R., Arai, S., Bienzle, D., Hohdatsu, T., 2008b. Differentiation of feline immunodeficiency virus vaccination, infection, or vaccination and infection in cats. J. Vet. Intern. Med. 22, 330334. Levy, J.K., Crawford, P.C., Slater, M.R., 2004. Effect of vaccination against feline immunodeficiency virus on results of serologic testing in cats. J. Am. Vet. Med. Assoc. 225, 1558-1561. Levy, J.K., Scott, H.M., Lachtara, J.L., Crawford, P.C., 2006. Seroprevalence of feline leukemia virus and feline immunodeficiency virus infection among cats in North America and risk factors for seropositivity. J. Am. Vet. Med. Assoc. 228, 371-376. 22 Little, S., Bienzle, D., Carioto, L., Chisholm, H., O'Brien, E., Scherk, M., 2011. Feline leukemia virus and feline immunodeficiency virus in Canada: Recommendations for testing and management. Can. Vet. J. 52, 849-855. Little, S., Sears, W., Lachtara, J., Bienzle, D., 2009. Seroprevalence of feline leukemia virus and feline immunodeficiency virus infection among cats in Canada. Can. Vet. J. 50, 644-648. Lutz, H., Addie, D., Belak, S., Boucraut-Baralon, C., Egberink, H., Frymus, T., Gruffydd-Jones, T., Hartmann, K., Hosie, M.J., Lloret, A., Marsilio, F., Pennisi, M.G., Radford, A.D., Thiry, E., Truyen, U., Horzinek, M.C., 2009. Feline leukaemia. ABCD guidelines on prevention and management. J. Feline Med. Surg. 11, 565-574. McCarthy, N., Giesecke, J., 1999. Case-case comparisons to study causation of common infectious diseases. Int. J. Epidemiol. 28, 764-768. Medeiros, S.O., Martins, A.N., Dias, C.G., Tanuri, A., Brindeiro, R.D., 2012. Natural transmission of feline immunodeficiency virus from infected queen to kitten. Virol. J. 9, 99. Moore, G.E., Ward, M.P., Dhariwal, J., Al, E., 2004. Use of a primary care veterinary medical database for surveillance of syndromes and diseases in dogs and cats. J. Vet. Intern. Med. 18, 386. Muirden, A., 2002. Prevalence of feline leukaemia virus and antibodies to feline immunodeficiency virus and feline coronavirus in stray cats sent to an RSPCA hospital. Vet. Rec. 150, 621-625. Nakamura, K., Miyazawa, T., Ikeda, Y., Sato, E., Nishimura, Y., Nguyen, N.T., Takahashi, E., Mochizuki, M., Mikami, T., 2000. Contrastive prevalence of feline retrovirus infections between northern and southern Vietnam. J. Vet. Med. Sci. 62, 921-923. 23 Nakamura, K., Suzuki, Y., Ikeo, K., Ikeda, Y., Sato, E., Nguyen, N.T., Gojobori, T., Mikami, T., Miyazawa, T., 2003. Phylogenetic analysis of Vietnamese isolates of feline immunodeficiency virus: genetic diversity of subtype C. Arch. Virol. 148, 783-791. Nishimura, Y., Goto, Y., Pang, H., Endo, Y., Mizuno, T., Momoi, Y., Watari, T., Tsujimoto, H., Hasegawa, A., 1998. Genetic heterogeneity of env gene of feline immunodeficiency virus obtained from multiple districts in Japan. Virus Res. 57, 101-112. O'Connor Jr., T.P., Tonelli, Q.J., Scarlett, J.M., 1991. Report of the National FeLV/FIV Awareness Project. J. Am. Vet. Med. Assoc. 199, 1348-1353. O'Neil, L.L., Burkhard, M.J., Diehl, L.J., Hoover, E.A., 1995. Vertical transmission of feline immunodeficiency virus. AIDS Res. Hum. Retroviruses 11, 171-182. Openshaw, S., 1983. The modifiable areal unit problem. CATMOG - Concepts and Techniques in Modern Geography. Geo Books, Norwich, UK. Pacitti, A.M., Jarrett, O., Hay, D., 1986. Transmission of feline leukaemia virus in the milk of a non-viraemic cat. Vet. Rec. 118, 381-384. Pecoraro, M.R., Tomonaga, K., Miyazawa, T., Kawaguchi, Y., Sugita, S., Tohya, Y., Kai, C., Etcheverrigaray, M.E., Mikami, T., 1996. Genetic diversity of Argentine isolates of feline immunodeficiency virus. J. Gen. Virol. 77 ( Pt 9), 2031-2035. Pedersen, N.C., Ho, E.W., Brown, M.L., Yamamoto, J.K., 1987. Isolation of a T-lymphotropic virus from domestic cats with an immunodeficiency-like syndrome. Science 235, 790793. Pedersen, N.C., Leutenegger, C.M., Woo, J., Higgins, J., 2001. Virulence differences between two field isolates of feline immunodeficiency virus (FIV-A Petaluma and FIV-CP 24 Gammar) in young adult specific pathogen free cats. Vet. Immunol. Immunopathol. 79, 53-67. Pfeiffer, D., Robinson, T., Stevenson, M., Stevens, K.B., Rogers, D.J., Clements, A.C., 2008. Spatial Analysis in Epidemiology. Oxford University Press, New York. Pistello, M., Cammarota, G., Nicoletti, E., Matteucci, D., Curcio, M., Del Mauro, D., Bendinelli, M., 1997. Analysis of the genetic diversity and phylogenetic relationship of Italian isolates of feline immunodeficiency virus indicates a high prevalence and heterogeneity of subtype B. J. Gen. Virol. 78 ( Pt 9), 2247-2257. Reggeti, F., Bienzle, D., 2004. Feline immunodeficiency virus subtypes A, B and C and intersubtype recombinants in Ontario, Canada. J. Gen. Virol. 85, 1843-1852. Richardson, S., Monfort, C., 2000. Ecological correlation studies. In: Paul Elliott, J.W., Nicola Best, David Briggs (Ed.), Spatial Epidemiology: Methods and Applications. Oxford University Press, Oxford, 205-220. Sellon, R.K., Hartmann, K., 2006. Feline immunodeficiency virus infection. In: Greene, C. (Ed.), Infectious Diseases of the Dog and Cat (3rd edn). Elsevier, Philadelphia, 131-142. Stevenson, M., McClure, R., 2005. Use of ecological study designs for injury prevention. Injury Prev. 11, 2-4. Stickney, A.L., Dunowska, M., Cave, N.J., 2013. Sequence variation of the feline immunodeficiency virus genome and its clinical relevance. Vet. Rec. 172, 607-614. Stokes, C.R., Finerty, S., Gruffydd-Jones, T.J., Sturgess, C.P., Harbour, D.A., 1999. Mucosal infection and vaccination against feline immunodeficiency virus. J. Biotechnol. 73, 213221. Tango, T., 2010. Statistical Methods for Disease Clustering. Springer, New York 25 Ueland, K., Nesse, L.L., 1992. No evidence of vertical transmission of naturally acquired feline immunodeficiency virus infection. Vet. Immunol. Immunopathol. 33, 301-308. Waller, L.A., Gotway, C.A., 2004. Applied Spatial Statistics for Public Health Data. WileyInterscience, Hoboken, NJ. Weaver, E.A., 2010. A detailed phylogenetic analysis of FIV in the United States. PLoS One 5, e12004. Wilson, N., Baker, M., Edwards, R., Simmons, G., 2008. Case-case analysis of enteric diseases with routine surveillance data: Potential use and example results. Epidemiol. Persp. Innov. 5, 6. Yamamoto, J.K., Sparger, E., Ho, E.W., Andersen, P.R., O'Connor, T.P., Mandell, C.P., Lowenstine, L., Munn, R., Pedersen, N.C., 1988. Pathogenesis of experimentally induced feline immunodeficiency virus infection in cats. Am. J. Vet. Res. 49, 1246-1258. 26 CHAPTER 2: Comparison of the geographical distribution of feline immunodeficiency virus and feline leukemia virus infections in the United States of America (2000-2011) (As published: Chhetri et al. 2013: BMC Veterinary Research 9:2) 2.1 Abstract Although feline immunodeficiency virus (FIV) and feline leukemia virus (FeLV) have similar risk factors and control measures, infection rates have been speculated to vary in geographic distribution over North America. Since both infections are endemic in North America, it was assumed as a working hypothesis that their geographic distributions were similar. Hence, the purpose of this exploratory analysis was to investigate the comparative geographical distribution of both viral infections. Counts of FIV (n=17,108) and FeLV (n=30,017) positive serology results (FIV antibody and FeLV ELISA) were obtained for 48 contiguous states and District of Columbia of the United States of America (US) from the IDEXX Laboratories website. The proportional morbidity ratio of FIV to FeLV infection was estimated for each administrative region and its geographic distribution pattern was visualized by a choropleth map. Statistical evidence of an excess in the proportional morbidity ratio from unity was assessed using the spatial scan test under the normal probability model. This study revealed distinct spatial distribution patterns in the proportional morbidity ratio suggesting the presence of one or more relevant and geographically varying risk factors. The disease map indicates that there is a higher prevalence of FIV infections in the southern and eastern US compared to FeLV. In contrast, FeLV infections were observed to be more frequent in the western US compared to FIV. The respective excess in proportional morbidity ratio was significant with respect to the spatial scan test (α=0.05). The observed variability in the geographical distribution of the proportional morbidity ratio of FIV to FeLV may be related to the presence of an additional or 27 unique, but yet unknown, spatial risk factor. Putative factors may be geographic variations in specific virus strains and rate of vaccination. Knowledge of these factors and the geographical distributions of these infections can inform recommendations for testing, management and prevention. However, further studies are required to investigate the potential association of these factors with FIV and FeLV. 2.2 Introduction Infections with feline immunodeficiency virus (FIV) and feline leukemia virus (FeLV) are common and important conditions in cats [1]. Both FIV and FeLV are immunosuppressive retroviruses and associated with a wide array of disease conditions affecting multiple organ systems and susceptibility to opportunistic infections. The most important route for transmission of both retroviruses is through bites, although other less common modes of transmission such as nursing, mutual grooming or sharing dishes for FeLV [2]; and in utero [3], experimental infection via vaginal mucosa [4], and nursing in neonates [5] for FIV have been reported. Cats at high risk of encountering and fighting with infected cats, and thus getting infected, include those with outdoor lifestyles, and those that are male, adult and non-neutered [6-11]. There is great interest in developing diagnostic tests to identify vaccinated and infected cats and to develop better vaccines to protect uninfected animals [11]. However, little progress has been made in understanding the distribution and causes of FeLV and FIV infections in cat populations. Such knowledge about the prevalence of both infections would assist in defining prophylactic, management and therapeutic measures for stray, feral, and owned cats [12]. Recent studies estimate a seroprevalence of 2.3% (FeLV) and 2.5% (FIV) in the US [11], and 3.4% (FeLV) and 4.3% (FIV) in Canada [13]. 28 A number of studies suggested that the prevalence of retroviral infections in domestic cat populations may represent regional patterns of infection, which is likely attributable to variable population density, reproductive status, age, sex and housing conditions [14-16]. A study from Vietnam reported FIV seroprevalence to be higher in the south when compared to the north [17]. Similarly, in Germany, differences in prevalence of FIV between northern and southern states have been reported and attributed to lifestyle, sex and health status of cats [18]. However, regional differences in the US and Canada were still present after adjusting for similar factors [11, 13]. Furthermore, even though both infections are known to share similar risk factors, it is unclear whether they also have unique risk factors. Interestingly, in some studies cats tend to have co-infections with both viruses [13, 19], whereas in other studies the reverse was shown [20, 21]. These contradictory results, and residual variation in seroprevalence after adjusting for risk factors, might be expressions of geographic variation in the seroprevalence [11] or unknown spatial factors, which have not yet been explored. Further, geographical variation in the distribution of FIV and FeLV infections has been suggested previously but has not yet been studied using spatial statistics [11, 13, 22, 23]. In this study, we explored the geographical distribution of both viral infections relative to each other in 49 administrative regions (48 contiguous states and the District of Columbia) of the US. If underlying known or unknown risk factors for FIV and FeLV infections vary geographically, then regions with excesses of one infection over the other should exist. The objective of this study was to a) describe the geographical distribution and b) detect high-risk areas of FIV and FeLV infections relative to each other. 29 2.3 Methods 2.3.1 Description of data Counts of FIV (n=17,108) and FeLV (n=30,017) positive serological tests (FIV antibody and FeLV ELISA) were obtained for each of the 49 administrative regions of the US from the IDEXX laboratories’ public access website on FIV, FeLV and heartworm infections [24]. The data encompass positive test results for FIV and FeLV from IDEXX sponsored prevalence studies [11, 25], IDEXX VetLab Station data reported from veterinary practices, and IDEXX reference laboratories' results collected from 2000 to 2011 [24]. The screening serology for FIV and FeLV entails use of antigen and antibody capture Enzyme-Linked Immunosorbent Assays (ELISA) [26], with sensitivities of 100% and 97.6% and specificities of 99.5% and 99.1 %, respectively. The assay tests for both viruses in a combined kit format. Each administrative region was geo-referenced to latitude and longitude coordinates of the respective administrative region centroid obtained from the Environmental System Research Institute (ESRI) shapefile [27] for the US using the R statistical software [28]. 2.3.2 Disease mapping - choropleth maps The Proportional Morbidity Ratio (PMR) of FIV to FeLV infection was estimated for each administrative region and a choropleth disease map was used to visualize the spatial pattern of PMR. Choropleth maps represent regional values such as the prevalence by colour scales where each scale represents a discrete value or a range of values [29]. All maps were displayed in Albers equal area conic projection. Conventionally, a proportional morbidity/mortality ratio for a particular disease is the observed proportion of illness/death due to a cause over the expected proportion. The expected 30 proportion is the number of illness/death in a reference population from the specific cause over all illness/death in that population [30]. The PMR is likewise defined as the ratio of two morbidity measures, such as the seroprevalence for two infections: PMR = p1 / p2 = (m1 / n1) / (m2 / n2), where m1 and m2 denote the number of cases for FIV and FeLV infections respectively, similarly n1 and n2 denote the number of tested cats for the respective infections. For the present study only the total number of cats that tested positive for either infection was available. However, on the assumption that a combination ELISA was applied to test for both infections simultaneously, the number of tested individuals is the same for both infections (i.e., n1 = n2) and the PMR formula reduces to PMR = m1 / m2. Therefore, the PMR (FIV, FeLV) equals the number of cats testing positive for FIV over the number of cats testing positive for FeLV. An area, or administrative region, with PMR >1 represents an excess of FIV infections compared to FeLV infections. Alternatively, a PMR <1 for an area indicates excess of FeLV infections relative to FIV infections in that area. Respective PMRs for each administrative region were visualized as choropleth maps using breaks based on the quintiles of the empirical distribution of the 49 administrative region PMRs. 2.3.3 Disease cluster detection - spatial scan test In order to compare the relative distribution of FIV to FeLV (i.e., the PMR), data were aggregated to administrative region centroids. Statistically significant high-risk clusters of FIV (or FeLV) infection were identified using a weighted normal spatial scan test [31] as implemented in SaTScanTM [32]. Since the PMR is a continuous variable and its geographical distribution was of interest, the “normal” version of the spatial scan test was used to detect 31 clusters of high or low PMRs. The normal spatial scan statistic applies to continuously distributed data and not just Gaussian, i.e. normally distributed data [31]. Moreover the “weighted” version of the normal spatial scan test was used, which allows to adjust for varying regional uncertainty in the PMR estimates, due to varying sample sizes. The weights for each of the 49 administrative regions were computed as the mean of FIV and FeLV cases (i.e. the sample size). The spatial scan test identifies potential clusters of high or low risk by moving circular windows of varying radius (size) and location (region centroids) across the study area. The twosided test was performed to identify significant high and low risk clusters. A high-risk cluster was defined as an aggregation of administrative regions with mean PMR >1 (i.e., neighbouring regions in which FIV was more frequent), and a low risk cluster for mean PMR <1 (i.e., neighbouring regions in which FeLV was more frequent). The null hypothesis of the two-sided spatial scan test states the mean of the PMR as constant throughout the study area, i.e. not different inside and outside the scanning window [31]. The weighted normal spatial scan statistic therefore identifies as a cluster, a group of two or more regions with mean PMR higher or lower than outside the cluster. From the definition of the PMR in this study follows that a high-risk cluster is defined as a group of neighbouring regions with mean PMR > 1, i.e. FIV is significantly more frequent than FeLV. A low risk cluster means the opposite, i.e. mean PMR < 1 and thus FeLV is more frequent than FIV. The maximum window size was set to 50% of all administrative areas. A p-value was obtained by Monte Carlo hypothesis testing with 999 iterations and the significance level was chosen to be α = 0.05. Respective areas of relative FIV or FeLV excess were visualized by highlighted boundaries on the respective choropleth map. 32 2.4 Results The descriptive statistics of the data are presented in Table 2.1. A total of 14/49 administrative regions had a proportional morbidity ratio (PMR) >1 and 35/49 administrative regions had a PMR <1. PMR ranged from 0.04 to 2.05. The number of FIV and FeLV positive samples per administrative region ranged from 4 to 4610 (median = 92) and 3 to 9113 (median =163), respectively. The FIV and FeLV infections had distinct spatial distribution patterns. The choropleth map revealed more frequent infection with FIV compared to FeLV in the southern and eastern US. In contrast, FeLV infections were observed more frequently in the western and north-central US compared to FIV (Figure 2.1). The spatial scan test detected two high-risk clusters. One high-risk cluster consisted of administrative regions having an excess of FIV infections (Mean PMR =1.03, p <0.05, 24 administrative regions), and the other high-risk cluster consisted of administrative regions having an excess of FeLV infections (Mean PMR = 0.14, p < 0.005, 7 administrative regions) (Table 2.2 and Figure 2.1). 2.5 Discussion This exploratory analysis identified that areas of relative excess of FIV and FeLV exist in the US. Both the choropleth maps of PMR and the spatial scan test for evidence of high-risk clusters identified similar areas of relative excess of one infection over the other. Since it is assumed that both infections share similar risk factors, it would be expected that the occurrence of both infections relative to each other would be more or less uniform throughout the US. However, the spatial analysis revealed that higher numbers of FIV infections were reported in the southern and eastern US compared to FeLV infections. In contrast, reported FeLV infections 33 were observed to be higher in the western and north-central US compared to FIV infections. These results suggest that the relative excesses of one infection over the other may be the result of different factors affecting these geographical areas. The distinct pattern in the geographical variation of the PMR can be explained in a number of ways relating to the agent, environment and host factors. For example, the dominant viral strain might vary over the study area. Furthermore, environmental factors, vaccination management, level of veterinary care, and thus the age and survival times of cats, may differ from place to place. Factors that play a role in promoting aggression and bites are known to be most important in the transmission of infection from one cat to another for both FIV and FeLV. These known risk factors include feline population type (pet, stray and feral), cat density, sex, age, neutering status, and access to outdoors [6,7,11]. Previous studies indicated that FeLV infection is age dependent and primarily acquired by "friendly" cats through prolonged close contact between virus shedders and susceptible cats involving mutual grooming, sharing of food and water dishes, and use of common litter areas [33]. However, other studies have indicated adulthood, outdoor lifestyle, neutering status, and fighting to be associated with FeLV as well [11, 13, 18]. Thus, it is difficult to discern whether these known risk factors, being unique to one infection or the other, could lead to such geographical variability, and results suggest the existence of an unknown spatial risk factor. Further, previous studies have found differences in seroprevalence across the US despite controlling for these factors [11]. Identification and segregation have been the most important tools in the control of both infections [9]. Although a FIV vaccine was introduced in 2002 in the US, its efficacy remains controversial; whereas vaccination has been attributed as a factor associated with the decreasing prevalence of FeLV [9]. It is possible that the prevalence of vaccination may influence the 34 infection patterns observed in this study. The decision to vaccinate a pet would be dependent on owner compliance and related to their socio-economic status, and these factors would vary geographically. Previous studies have found that approximately 50% and 80% of FeLV infected cats in multi-cat households are likely to die in the two and three years following diagnosis, respectively [34, 35]. On the other hand, clinical signs in most FIV infected cats are reflective of secondary diseases, and FIV is not thought to cause severe clinical illness in naturally infected cats until advanced age. In fact, with proper care FIV infected cats can live for many years [36]. Therefore, one would expect to find more FIV than FeLV survivors when sampling from, on average, older populations. Further, cats testing positive for FeLV are likely to be much younger than those testing for FIV, which also implies that most older cats that are FIV positive are more likely to be pets, and therefore may belong to people of higher socioeconomic status than cats that are young, FeLV positive, and more likely to be owned by shelters or catteries. Different viral clades or strains of FIV are known to predominate in different geographical regions and could reflect the patterns observed in this study. Although cladespecific information was not available for this study, clade A viruses are common in the western US, whereas clade B viruses predominate in the eastern US [37]. However, the association between viral clades and pathogenicity is unclear [38]. It is important that limitations be considered when interpreting results from this study. The observed variability in infection could be reflective of diagnostic submissions specifically to IDEXX laboratories. This could lead to admission risk bias, a form of selection bias, as is common with registry or hospital based studies, particularly if preference of diagnostic lab by sample submitters in an area is related to the true prevalence of either FIV or FeLV. 35 Further, seroprevalence of co-infections with FIV and FeLV ranging from 0.3% to 1.6 % have been reported in North American cats [11, 13, 19, 39]. However, estimation of the PMR assumes both the infections to be independent of each other. Not accounting for coinfections would lead to biased estimates of the PMR. However, as the proportion of coinfections increases, the PMR converges to 1; this means the bias is towards the null. Thus, the PMR estimate in this study is rather conservative, i.e. less extreme. Similarly, the result of the spatial scan test is conservative, i.e. any significant results are truly significant. For this study, an exploratory approach was applied to compare two similar infections and explore the areas of relative excess rather than derive risk estimates for each area primarily because the underlying population (total number of tested cats in each administrative region) was not known. Such an approach has been reported in the veterinary literature to compare relative excess of one disease to the other [40]. An advantage of these study designs (e.g. case-case study) is that factors may be identified as more important for one disease than the other. The evidence of distinct clusters of infection necessitates the need to investigate overall spatial dependence in the occurrence of cases (clustering), and if these are identified, to adjust for their presence when evaluating the association of putative risk factors to these infections. Ignoring clustering may result in biased standard errors and thus can compromise risk factor studies [41]. 2.6 Conclusion In conclusion, this study identified geographical patterns in the distribution of the proportional morbidity ratio of FIV to FeLV infection among cats in the 49 administrative regions of the US over the period 2000 to 2011. These patterns might be an expression of 36 geographic variation in the pathogenicity of viral strains that are not evenly distributed in the study area, or reflect geographical differences in vaccination practices. Further studies are warranted to explore the association of these proposed factors with respective infections that allows for adjustment of spatial clustering if present in the data. 2.7 Acknowledgements This research was supported through a PhD Fellowship from the Ontario Veterinary College and funds from the OVC Pet Trust Foundation. 2.8 References 1. Little S: A review of feline leukemia virus and feline immunodeficiency virus seroprevalence in cats in Canada. Vet Immunol Immunopathol 2011, 143(3-4):243–245. 2. Levy J: Feline leukemia virus and feline immunodeficiency virus. In: Infectious Disease Management in Animal Shelters. Edited by Miller L, Hurley, KF. Hoboken, NJ, USA: Wiley-Blackwell; 2009: 307-317. 3. Jordan HL, Howard J, Barr MC, Kennedy-Stoskopf S, Levy JK, Tompkins WA: Feline immunodeficiency virus is shed in semen from experimentally and naturally infected cats. AIDS Res Hum Retroviruses 1998, 14(12):1087-1092. 4. Stokes CR, Finerty S, Gruffydd-Jones TJ, Sturgess CP, Harbour DA: Mucosal infection and vaccination against feline immunodeficiency virus. J Biotechnol 1999, 73(23):213-221. 5. Allison RW, Hoover EA: Feline immunodeficiency virus is concentrated in milk early in lactation. AIDS Res Hum Retroviruses 2003, 19(3):245-253. 37 6. Hoover EA, Mullins JI: Feline leukemia virus infection and diseases. J Am Vet Med Assoc 1991, 199(10):1287-1297. 7. O'Connor Jr. TP, Tonelli QJ, Scarlett JM: Report of the National FeLV/FIV Awareness Project. J Am Vet Med Assoc 1991, 199(10):1348-1353. 8. Levy J: CVT update: feline immunodeficiency virus. In: Kirk's Current Veterinary Therapy XIII. Edited by Bonagura J. Philadelphia, PA, USA: WB Saunders Co; 2000: 284-288. 9. Levy J, Crawford C, Hartmann K, Hofmann-Lehmann R, Little S, Sundahl E, Thayer V: 2008 American Association of Feline Practitioners' feline retrovirus management guidelines. J Feline Med Surg 2008, 10(3):300-316. 10. Levy J, Crawford, PC: Feline leukemia virus. In: Textbook of Veterinary Internal Medicine. 6th edition. Edited by Ettinger S, Feldman E. St. Louis, MO, USA: Elsevier Saunders; 2005: 653-659. 11. Levy JK, Scott HM, Lachtara JL, Crawford PC: Seroprevalence of feline leukemia virus and feline immunodeficiency virus infection among cats in North America and risk factors for seropositivity. J Am Vet Med Assoc 2006, 228(3):371-376. 12. Little S, Bienzle D, Carioto L, Chisholm H, O'Brien E, Scherk M: Feline leukemia virus and feline immunodeficiency virus in Canada: Recommendations for testing and management. Can Vet J 2011, 52(8):849-855. 13. Little S, Sears W, Lachtara J, Bienzle D: Seroprevalence of feline leukemia virus and feline immunodeficiency virus infection among cats in Canada. Can Vet J 2009, 50(6):644-648. 38 14. Lutz H, Addie D, Belak S, Boucraut-Baralon C, Egberink H, Frymus T, Gruffydd-Jones T, Hartmann K, Hosie MJ, Lloret A, Marsilio F, Pennisi MG, Radford AD, Thiry E, Truyen U, Horzinek MC: Feline leukaemia. ABCD guidelines on prevention and management. J Feline Med Surg 2009, 11(7):565-574. 15. Akhtardanesh B, Ziaali N, Sharifi H, Rezaei S: Feline immunodeficiency virus, feline leukemia virus and Toxoplasma gondii in stray and household cats in Kerman-Iran: seroprevalence and correlation with clinical and laboratory findings. Res Vet Sci 2010, 89(2):306-310. 16. Norris JM, Bell ET, Hales L, Toribio J-ALML, White JD, Wigney DI, Baral RM, Malik R: Prevalence of feline immunodeficiency virus infection in domesticated and feral cats in eastern Australia. J Feline Med Surg 2007, 9(4):300-308. 17. Nakamura K, Miyazawa T, Ikeda Y, Sato E, Nishimura Y, Nguyen NT, Takahashi E, Mochizuki M, Mikami T: Contrastive prevalence of feline retrovirus infections between northern and southern Vietnam. J Vet Med Sci 2000, 62(8):921-923. 18. Gleich SE, Krieger S, Hartmann K: Prevalence of feline immunodeficiency virus and feline leukaemia virus among client-owned cats and risk factors for infection in Germany. J Feline Med Surg 2009, 11(12):985-992. 19. Gibson KL, Keizer K, Golding C: A trap, neuter, and release program for feral cats on Prince Edward Island. Can Vet J 2002, 43(9):695-698. 20. Bandecchi P, Dell'Omodarme M, Magi M, Palamidessi A, Prati MC: Feline leukaemia virus (FeLV) and feline immunodeficiency virus infections in cats in the Pisa district of Tuscany, and attempts to control FeLV infection in a colony of domestic cats by vaccination. Vet Rec 2006, 158(16):555-557. 39 21. Bandecchi P, Matteucci D, Baldinotti F, Guidi G, Abramo F, Tozzini F, Bendinelli M: Prevalence of feline immunodeficiency virus and other retroviral infections in sick cats in Italy. Vet Immunol Immunopathol 1992, 31(3-4):337-345. 22. Hosie MJ, Addie D, Belak S, Boucraut-Baralon C, Egberink H, Frymus T, GruffyddJones T, Hartmann K, Lloret A, Lutz H, Marsilio F, Pennisi MG, Radford AD, Thiry E, Truyen U, Horzinek MC: Feline immunodeficiency. ABCD guidelines on prevention and management. J Feline Med Surg 2009, 11(7):575-584. 23. Baneth G, Kass PH, Steinfeld D, Besser M: A seroepidemiological study of feline coronavirus, feline immunodeficiency virus and feline leukemia virus among cats in Israel. Isr J Vet Med 1999, 54:39–43. 24. Protect your cat - kittytest.com [http://www.kittytest.com/index.jsp] 25. Levy JK, Crawford PC, Brien JL: Prevalence of FIV and FeLV in the United States. In: Proceedings of the Seventh International Feline Retrovirus Research Symposium: 1115 September 2004; Pisa, Italy. 26. Mermer B, Hillman P, Harris R, Krogmann T, Tonelli Q, Palin W, Andersen P: A recombinant-based feline immunodeficiency virus antibody enzyme-linked immunosorbent assay. Vet Immunol Immunopathol 1992, 35(1–2):133-141. 27. ESRI: Environmental Systems Research Institute. Redlands, CA. 2006. 28. R Development Core Team: R: A language and environment for statistical computing. R Foundation for Statistical Computing, Vienna, Austria. ISBN 3-90005107-0. 2011. 29. Berke O: Choropleth mapping of regional count data of Echinococcus multilocularis among red foxes in Lower Saxony, Germany. Prev Vet Med 2001, 52(2):119-131. 40 30. Aveyard P: A fresh look at proportional mortality ratios. Public Health 1998, 112(2):77-80. 31. Huang L, Tiwari RC, Zou Z, Kulldorff M, Feuer EJ: Weighted Normal Spatial Scan Statistic for Heterogeneous Population Data. J Am Stat Assoc 2009,104:886-898 32. Kuldorff M and Information Management Services, Inc: SaTScanTM v 8.0: Software for the spatial, temporal and space-time scan statistics. http://www.satscan.org/, 2009. 33. Hartmann K: Feline leukemia virus infection. In: Infectious Diseases of the Dog and Cat . 3rd edition. Edited by Greene CE. Philadelphia: Elsevier; 2006: 107–131. 34. Cotter SM: Feline viral neoplasia. In: Infectious Diseases of the Dog and Cat. 2nd edition. Edited by Greene CE. Philadelphia: WB Saunders; 1998:71. 35. Levy JK: FeLV and non-neoplastic FeLV-related disease. In: Textbook of Veterinary Internal Medicine. 5th edition. Edited by S.J. Ettinger, Feldman EC. Philadelphia: WB Saunders; 2000: 424-432. 36. Hartmann K: Clinical aspects of feline immunodeficiency and feline leukemia virus infection. Vet Immunol Immunopathol 2011, 143(3-4):190-201. 37. Dunham SP, Graham E: Retroviral infections of small animals. Vet Clin North Am Small Anim Pract 2008, 38(4):879-901. 38. Weaver EA: A detailed phylogenetic analysis of FIV in the United States. PLoS One 2010, 5(8):e12004. 39. Lee IT, Levy JK, Gorman SP, Crawford PC, Slater MR: Prevalence of feline leukemia virus infection and serum antibodies against feline immunodeficiency virus in unowned free-roaming cats. J Am Vet Med Assoc 2002, 220(5):620-622. 41 40. Wisener LV, Pearl DL, Houston DM, Reid-Smith RJ, Moore AEP: Spatial and temporal clustering of calcium oxalate and magnesium ammonium phosphate uroliths in dogs living in Ontario, Canada between 1998 and 2006. Prev Vet Med 2010, 95(1-2):144-151. 41. Dohoo I, Martin W, Stryhn H: Veterinary Epidemiologic Research. Charlottetown: AVC Inc; 2009. 42 2.9 Tables and Figures Table 2.1. Descriptive statistics of FIV and FeLV infections, and the proportional morbidity ratios (PMR). Parameters Mean Median Range Number of FIV Positives 349 92 4 - 4610 Number of FeLV Positives 612 163 3 - 9113 PMR 0.79 0.72 0.04 - 2.05 43 Table 2.2. Characteristics of high-risk areas (clusters) detected by spatial scan test for FIV and FeLV infections. Cluster Type Inside cluster Outside cluster Cluster radius p-value Number of Mean Number of Mean states PMR states PMR FIV 24 1.03 25 0.35 1688.96 0.02 FeLV 7 0.14 42 0.95 1127.96 0.002 44 (kms) Figure 2.1. Choropleth map of proportional morbidity ratios (PMR) of FIV to FeLV infections in the US. Colors on the map depict the range of PMR values for 48 contiguous states and District of Columbia of the US. Red and blue borders indicate high-risk areas of FIV and FeLV infection relative to each other. These high-risk areas were identified as 'clusters' by spatial scan test using a weighted normal model. Areas with blue borders depict administrative regions where FIV infections are greater than FeLV among cats. Areas with red borders indicate administrative regions where FeLV infections in cats are greater than FIV. 45 CHAPTER 3: Comparison of risk factors for seropositivity to feline immunodeficiency virus and feline leukemia virus among cats: a case-case study. (As published: Chhetri et al. 2015: BMC Veterinary Research 11:30) 3.1 Abstract Feline immunodeficiency virus (FIV) and feline leukemia virus (FeLV) are reported to have similar risk factors and similar recommendations apply to manage infected cats. However, some contrasting evidence exists in the literature with regard to commonly reported risk factors. In this study, we investigated whether the known risk factors for FIV and FeLV infections have a stronger effect for either infection. This retrospective study included samples from 696 cats seropositive for FIV and 593 cats seropositive for FeLV from the United States and Canada. Data were collected during two cross sectional studies, where cats were tested using IDEXX FIV/FeLV ELISA kits. To compare the effect of known risk factors for FIV infection compared to FeLV, using a case-case study design, random intercept logistic regression models were fit including cats’ age, sex, neuter status, outdoor exposure, health status and type of testing facility as independent variables. A random intercept for testing facility was included to account for clustering expected in testing practices at the individual clinics and shelters. In the multivariable random intercept model, the odds of FIV compared to FeLV positive ELISA results were greater for adults (OR= 2.09, CI: 1.50-2.92), intact males (OR= 3.14, CI: 1.85-3.76), neutered males (OR=2.68, CI: 1.44- 3.14), cats with outdoor access (OR= 2.58, CI: 1.85-3.76) and lower for cats with clinical illness (OR=0.60, 95% CI: 0.52-0.90). The variance components obtained from the model indicated clustering at the testing facility level. Risk factors that have a greater effect on FIV seropositivity include adulthood, being male (neutered or not) and having access to outdoors, while clinical illness was a stronger predictor for FeLV seropositivity. Further studies 46 are warranted to assess the implications of these results for the management and control of these infections. 3.2 Introduction Infections with feline immunodeficiency virus (FIV) and feline leukemia virus (FeLV) are two of the most common and important infectious diseases of cats [1, 2]. The most common mode of transmission of FIV is through bites [3, 4]. FeLV infection is also commonly acquired via the oro-nasal route through mutual grooming, nursing or sharing of dishes apart from bites [3]. The known risk factors for acquiring these infections are male sex, adulthood and exposure to outdoors, whereas being neutered and indoor lifestyle are known protective factors [5]. However, the relative importance attributed to age, outdoor exposure and sex among infected cats is variable in the literature. Some studies indicate that FeLV infections are age-dependent [6] and primarily acquired by “friendly” cats through prolonged close contact between virus shedders and susceptible cats through mutual grooming, sharing of food and water dishes, and use of common litter areas [3]. However, other studies have indicated adulthood [1,7], outdoor lifestyle [1,7], being not neutered [8], and fighting [8,9], factors commonly associated with FIV, to also be associated with FeLV infection. Thus, further research is necessary to investigate the relative importance of these factors to help in management and prevention of these infections. Case-control studies are often used in analytical epidemiology to examine the strength, magnitude and direction of associations between exposure variables and an outcome of interest [10]. Case-case studies are a variant of case-control studies when the disease of interest can be sub-classified in two or several groups that may have distinct risk factors [11]. A case–case study differs from a case-control study in that the comparison group (or controls) are also selected 47 among the cases, typically with same disease but a different strain or serotype, from the same surveillance system [11]. The case-case study approach has been used increasingly in epidemiology (e.g., to compare risk factors for two subtypes of the same disease with the goal of ascertaining relative importance of risk factors for either subtype) [11]. The main advantage of the case-case design is its ability to limit selection and information biases: control cases have similar clinical features, are identified through the same system and are subject to the same biases as cases [11, 12]. The goal of this study was to assess the relative importance of known risk factors between the two common feline retroviral infections, FIV and FeLV, using the casecase study approach. 3.3 Materials and methods 3.3.1 Data source and study participants A dataset consisting of diagnostic test results from 29,182 cats tested for FIV and FeLV between August and November of the year 2004 and 2007 from the United States (US) and Canada was obtained from two previous cross-sectional studies [1, 7]. The cats included in these studies were conveniently sampled from veterinary clinics and animal shelters across 40 contiguous states of the US and 9 Canadian provinces encompassing 641 US zip codes and Canadian forward sortation areas in 346 US counties and Canadian Census Divisions. The first study investigated cats in the US and Canada while the second study was restricted to the Canadian cat population. Data collection has been described elsewhere [1, 7]. Briefly, potential veterinary clinic participants in the US were identified from the membership roster of the American Association of Feline Practitioners (AAFP) as well as from the list of all individuals who had purchased test 48 kits for FIV and FeLV. Potential animal shelter participants (including cat rescue organisations, and groups participating in Trap-Neuter-Release (TNR) programs) were derived from various Internet directories [1]. In Canada, potential veterinary clinic and animal shelter (including cat rescue programs and feral cat programs in Canada) participants were identified as all those who had purchased test kits for FIV or FeLV or submitted samples to a diagnostic laboratory [7]. Potential study participants were sent an invitation letter to participate in the study. Enrolled participants submitted the diagnostic results for FIV and FeLV along with information on age, sex, neuter status, outdoor exposure, health status and test date using a standard reporting form. The testing and reporting was performed from August to November 2004 for the American and Canadian participants in the first study and from August to November 2007 for the Canadian participants in the second study. 3.3.2 Testing protocol The testing for FIV and FeLV was carried out in-house or in-laboratory employing a commercially available ELISA (SNAP® Combo FeLV antigen/FIV antibody, PetCheck® FIV Antibody and PetCheck® FeLV Antigen; IDEXX Laboratories) using whole blood, serum or plasma. The manufacturer reported sensitivity and specificity of the assay for detecting FeLV antigen of 97.6% and 99.1%, and for detecting FIV antibodies of 100% and 99.5%, respectively. Confirmatory testing was not performed. 3.3.3 Covariate information Information on postal code of testing facility, type of testing facility (clinic or shelter), age of the cat (juvenile [<6 months] or adult), sex and neuter status (sexually intact female, 49 spayed female, sexually intact male or castrated male), access to outdoors (indoors or outdoors) and general health at time of testing (healthy or sick) was also retrieved from the dataset (Table 3.1). 3.3.4 Selection of study subjects: FIV and FeLV case groups Cats testing positive for FIV antibodies in ELISA were compared to cats testing positive for FeLV antigen with all the cats having been tested for both infections. Cats were excluded from further analysis in this study if they tested positive for both FIV and FeLV. 3.3.5 Logistic regression Logistic regression models were fit to model the logit of the probability of FIV seropositivity as a function of predictor variables age, sex/neuter status, outdoor exposure, health status and testing facility in a random intercept logistic regression model framework. 3.3.6 Univariable analysis Variables were screened for inclusion into the multivariable logistic regression model by fitting univariable logistic regression models, without random intercepts, and those predictor variables with a liberal significance level (α = 0.2) were selected. However, care was taken not to remove predictor variables that were deemed clinically relevant. Since all the predictor variables were categorical (i.e. indicator variables), the significance in the model of each group of the predictors was analyzed by applying a likelihood ratio test. Collinearity among the predictor variables with significant unconditional association with FIV seropositivity were assessed by 50 using the Spearman rank-correlation test. When two variables were collinear, the one with the smaller P-value was considered for further multivariable analysis while the other was removed. 3.3.7 Multivariable analysis Backward selection was employed for multivariable model building and covariate removal from the model was based on the following criteria: (1) the highest non-significant Pvalue (with significance level α = 0.05); (2) a likelihood ratio test of the model with and without the variable that was non-significant and (3) the variable was not an important confounder for other variables in the model. A confounder was a non-intervening covariate whose removal from the model resulted in greater than 20% change in coefficients on the log-odds scale for any of the remaining variables in the model. Two-way interaction terms among type of testing facility, health status, outdoor exposure, age and sex were also assessed for statistical significance. However, interaction terms were dropped when these led to sparse cells and unrealistic estimates. Multicollinearity was tested among screened variables in the multivariable logistic regression model by estimating the variance inflation factor (VIF). All variables with a VIF value of 10 or above were considered to indicate multicollinearity, assuming that this was not due to variable construction (e.g., interaction terms) [5]. Non-nested multivariable models were compared using the Akaike Information Criterion (AIC) and the model with lowest AIC value was considered to be better fitting. To account for clustering by testing facility (i.e. clinics or shelters), all multivariable logistic regression models included a random intercept for testing facility. Relevance of the random effect term for facility ID was assessed by inspection of the variance component. A simpler model (without random effects) was chosen when the variance component was close to 51 zero [9]. Fit of the random effect model was assessed visually by plotting the QQ-plots of the Best Linear Unbiased Predictors (BLUPs) against the normal scores [5]. The random intercept models were fit in statistical software R (lme4 package) and Stata (xtmelogit) by seven point Gauss-Hermite adaptive quadrature method [14, 15], using complete cases (i.e., any observations with missing values excluded from the analysis). However, the point estimates from the final model were compared to the same model fit with missing values (coded as unknown) to observe any gross deviation in direction and magnitude. 3.4 Results 3.4.1 Descriptive statistics Table 3.1 presents the descriptive statistics of FIV and FeLV cases cross tabulated by risk factors. The total number of cases included in this study was 1289. Out of these retroviral cases, 696 tested positive for FIV and 593 for FeLV. 3.4.2 Logistic regression analysis All covariates met the inclusion criteria for multivariable modeling as explained above (Table 3.2). The final multivariable random intercept logistic regression model included the covariates/predictors age, sex/neuter status, outdoor exposure, and health status of cats (Table 3.3). The odds ratio (OR) associated with each variable is adjusted for the remaining variables in the model. No significant interactions were detected between the variables that remained in the final multivariable model. The odds of cats being seropositive for FIV relative to FeLV was significantly greater for adult cats than juvenile cats (Table 3.3). Similarly, the intact and neutered males were 52 significantly more likely to be seropositive for FIV than FeLV compared to intact females. The odds of being seropositive for FIV relative to FeLV was not significantly different between intact and spayed females based on the Wald test. Compared to cats kept indoors, cats with known outdoor exposure had higher odds of being seropositive for FIV relative to FeLV. For sick cats, the odds of being seropositive for FIV relative to FeLV were smaller compared to healthy cats. The variance components obtained from the multilevel logistic regression model for the individual level and clinic/shelter level were 3.29 and 1.19, respectively. The intracluster correlation coefficient (ICC) was 0.26. A random effects logistic regression model was deemed appropriate due to clustering expected for cats tested within the same facility and because the variance of the random effect was 1.19, which given the associated small standard error was interpreted as the variance being different from zero (Table 3.3). Normal quantile plot of the BLUPs indicated no gross deviation from normality. 3.5 Discussion This case-case study is based on cross-sectional or prevalence data and thus generally not suited to identify risk factors. However, only known risk factors [3] were evaluated in this study with respect to their importance as risk factors for infection with FIV compared to FeLV. The results from this study imply that risk factors commonly associated with FIV and FeLV differ in their relative effects for these two diseases. For example, adult, male, or outdoor cats are more likely to be seropositive for FIV than FeLV when compared to juvenile, female or cats kept exclusively indoors. In contrast, neuter status was not significantly different for either infection. Further, whether cats were tested at clinics or shelters was not different for these infections. 53 Most FIV infections are acquired as a consequence of bite wounds inflicted by an infected cat, presumably through inoculation of virus or virus infected cells [16, 17]. Although, vertical transmission of infection from queen to kitten may occur, it is considered rare [18]. Adult, male, outdoor exposed cats would be expected to have a higher likelihood of getting infected with FIV due to higher likelihood of encountering infected cats, and being prone to aggression and territorial fights. On the contrary, most FeLV infections occur after oro-nasal spread of the virus from the viremic cats [17, 19-22]. FeLV infection, thus, is a concern in cats that are “friendly” and in close contact with infected cats through nursing, mutual grooming or sharing dishes, but also through bites [3]. This study found a higher likelihood of FIV (compared to FeLV) seropositivity in adults. In contrast to FIV, FeLV is reported to be age dependent with older cats becoming increasingly resistant to infection [23, 24]. Of note, however, is the fact that while age at acquisition is similar for both infections, FeLV can cause serious, often fatal, disease. As a result, FeLV-infected cats have shorter survival rates [25, 26] and not many live to adulthood, while most FIV infected cats do. Higher probability of infection can be expected in males compared to females for FIV [9, 27-37]. But for FeLV, most studies did not find an association between sex and seropositivity [28, 38] except for a single report [9]. The association between male sex and FIV infection has been primarily related to increased risk of infection transmission due to greater predisposition of males to exhibit territorial behaviour involving fighting. In this study, regression models included contrasts to compare the likelihood of seropositivity of FIV between intact and neutered male cats as well as between intact and spayed female cats. Although, compared to females, males were found to be more likely to test seropositive for FIV compared to FeLV, no significant 54 differences were evident between intact and neutered cats for the same sex (Table 3.3 and 3.4). Various studies have reported an association between neutering and lower risk of infection of FIV and FeLV among domestic cats [39]. However, there are reports suggesting that neutering and spaying have no significant effect on the prevalence of FIV [27, 40, 41] and that such cats still retain territorial aggressiveness [40, 41]. It should be noted that when a predictor is common to both FIV and FeLV, due to its inherent design, a case–case study might not detect a difference between the two case groups. In other words, if neutering were significantly associated with both FIV and FeLV seropositivity, this study design would not detect it. Since a higher likelihood of seropositivity was found in intact compared to neutered cats when non-infected cats were included [1, 7], it is possible that sterilization characteristics are not different between FIV and FeLV infected cats. Cats were more likely seropositive for FIV than FeLV when exposed to outdoors than being indoors. This finding suggests that outdoor exposure is more important to acquire FIV infection than FeLV. Considering prevalence studies where non-infected cats were included, there seems to be consensus that the probability of FIV infection is higher for cats that roam outdoors [9, 42] due increased opportunity for transmission via fights. In contrast, the relationship between outdoor exposure and FeLV infection is not very clear. Healthy cats were more likely to test positive for FIV than FeLV compared to cats presenting as sick at the time of testing. Both viruses induce immunodeficiency, but FeLV is more rapidly pathogenic and its effects manifest sooner and include other disease conditions [26]. FIV infection causes gradually developing immunodeficiency and has only a minor impact on lifespan. Therefore, cats with FeLV are more likely to be presented having a disease condition. This contributes to more sick cats testing FeLV positive rather than FIV positive. 55 The variance components of the random effects model indicate that some degree of clustering was evident at testing facility (ICC= 0.26) suggesting that FIV seropositive status compared to FeLV was not independent of shelter or clinic. A few important limitations of the case-case study design in the context of this study merits attention. For a detailed account of pros and cons of case-case studies in general the reader is referred to McCarthy and Giesecke [11]. This study entailed comparison of FIV seropositive cats to FeLV seropositive cats with regard to known risk factors and explored the strength of their effects between the two infections. Therefore, care should be taken before extrapolating results of this study to the general population with non-infected cats. The risk factors that are common to both comparison groups tend to be underestimated or unidentified in a case-case study [11, 12]. Since the study does not include a disease-free population, the odds ratios can only be interpreted as the odds of exposure to one disease group (FIV) in reference to the other (FeLV), and do not provide the estimate of the association between a risk factor and disease in the general population [42, 43]. 3.6 Conclusion In conclusion, while similar risk factors have been reported for both FIV and FeLV infection, this study demonstrated, through comparison of one infection with the other, that adulthood, being male (neutered or not) and having access to outdoors are of greater importance to FIV seropositivity compared to FeLV. Clinical illness was a stronger predictor for FeLV seropositivity. Further studies are warranted to assess the implications of these findings in regard to the management and control of these infections. 56 3.7 References 1. Levy JK, Scott HM, Lachtara JL, Crawford PC: Seroprevalence of feline leukemia virus and feline immunodeficiency virus infection among cats in North America and risk factors for seropositivity. J Am Vet Med Assoc 2006, 228(3):371-376. 2. Little S, Bienzle D, Carioto L, Chisholm H, O'Brien E, Scherk M: Feline leukemia virus and feline immunodeficiency virus in Canada: Recommendations for testing and management. Can Vet J 2011, 52(8):849-855. 3. Levy J: Feline leukemia virus and feline immunodeficiency virus. In: Infectious Disease Management in Animal Shelters. Edited by Miller L, Hurley, K.F. Hoboken, NJ, USA: Wiley-Blackwell 2009: 307-317. 4. Sellon RK, Hartmann K: Feline immunodeficiency virus infection. In: Infectious diseases of the dog and cat. 3rd edn. Edited by Greene CE. Philadelphia, PA, USA: Elsevier 2006: 131-142 5. Levy J, Crawford C, Hartmann K, Hofmann-Lehmann R, Little S, Sundahl E, Thayer V: 2008 American Association of Feline Practitioners' feline retrovirus management guidelines. J Feline Med Surg 2008, 10(3):300-316. 6. Hoover, E A, Olsen, R G, Hardy, W D, Schaller, J P, Mathes, L E: Feline leukemia virus infection: age-related variation in response of cats to experimental infection. J Natl Cancer Inst, 57(2), 365-369. 7. Little S, Sears W, Lachtara J, Bienzle D: Seroprevalence of feline leukemia virus and feline immunodeficiency virus infection among cats in Canada. Can Vet J 2009, 50(6):644-648. 57 8 Goldkamp CE, Levy JK, Edinboro CH, Lachtara JL: Seroprevalences of feline leukemia virus and feline immunodeficiency virus in cats with abscesses or bite wounds and rate of veterinarian compliance with current guidelines for retrovirus testing. J Am Vet Med Assoc 2008, 232(8):1152-1158. 9. Gleich SE, Krieger S, Hartmann K: Prevalence of feline immunodeficiency virus and feline leukaemia virus among client-owned cats and risk factors for infection in Germany. J Feline Med Surg 2009, 11(12):985-992. 10. Dohoo IR, Martin W, Stryhn H: Veterinary Epidemiologic Research. Charlottetown: AVC Inc; 2009. 11. McCarthy N, Giesecke J: Case-case comparisons to study causation of common infectious diseases. Int J Epidemiol 1999, 28(4):764-768. 12. Wilson N, Baker M, Edwards R, Simmons G: Case-case analysis of enteric diseases with routine surveillance data: Potential use and example results. Epidemiol Persp Innov 2008, 5:6. 13. Twisk JWR: Applied multilevel analysis : a practical guide. Cambridge, UK ; New York: Cambridge University Press; 2006. 14. R Development Core Team: R: A language and environment for statistical computing. In: R Foundation for Statistical Computing, Vienna, Austria ISBN 3-90005107-0. 2011. 15. StataCorp: Stata Statistical Software: Release 11. In. College Station, TX: StataCorp LP; 2009. 16. Yamamoto JK, Hansen H, Ho EW, Morishita TY, Okuda T, Sawa TR, Nakamura RM, Pedersen NC: Epidemiologic and clinical aspects of feline immunodeficiency virus 58 infection in cats from the continental United States and Canada and possible mode of transmission. J Am Vet Med Assoc 1989, 194(2):213-220. 17. Dunham SP, Graham E: Retroviral infections of small animals. Vet Clin North Am Small Anim Pract 2008, 38(4):879-901. 18. Allison RW, Hoover EA: Feline immunodeficiency virus is concentrated in milk early in lactation. AIDS Res Hum Retroviruses 2003, 19(3):245-253. 19. Jarrett O, Hardy WD, Golder MC, Hay D: The frequency of occurrence of feline leukaemia virus subgroups in cats. Int J Cancer 1978, 21(3):334-337. 20. Jarrett O, Golder MC, Stewart MF: Detection of transient and persistent feline leukaemia virus infections. Vet Rec 1982, 110(10):225-228. 21. Jarrett WF, Martin WB, Crighton GW, Dalton RG, Stewart MF: Transmission experiments with leukemia (lymphosarcoma). Nature 1964, 202:566-567. 22. Jarrett WF, Crawford EM, Martin WB, Davie F: A virus-like particle associated with leukemia (lymphosarcoma). Nature 1964, 202:567-569. 23. Grant CK, Essex M, Gardner MB, Hardy WD, Jr.: Natural feline leukemia virus infection and the immune response of cats of different ages. Cancer Res 1980, 40(3):823-829. 24. Essex M, Cotter S, Sliski A, Hardy Jr W, Stephenson J, Aaronson S, Jarrett O: Horizontal transmission of feline leukemia virus under natural conditions in a feline leukemia cluster household. Int J Cancer 1977, 19(1):90-96. 25. Addie DD, Dennis JM, Toth S, Callanan JJ, Reid S, Jarrett O: Long-term impact on a closed household of pet cats of natural infection with feline coronavirus, feline leukaemia virus and feline immunodeficiency virus. Vet Rec 2000, 146(15):419-424. 59 26. Hartmann K: Clinical aspects of feline immunodeficiency and feline leukemia virus infection. Vet Immunol Immunopathol 2011, 143(3-4):190-201. 27. Hitt ME, Spangler L, McCarville C: Prevalence of feline immunodeficiency virus in submissions of feline serum to a diagnostic laboratory in Atlantic Canada. Can Vet J 1992, 33(11):723-726. 28. Lee IT, Levy JK, Gorman SP, Crawford PC, Slater MR: Prevalence of feline leukemia virus infection and serum antibodies against feline immunodeficiency virus in unowned free-roaming cats. J Am Vet Med Assoc 2002, 220(5):620-622. 29. Ishida T, Washizu T, Toriyabe K, Motoyoshi S, Tomoda I, Pedersen NC: Feline immunodeficiency virus infection in cats of Japan. J Am Vet Med Assoc 1989, 194(2):221-225. 30. Spada E, Proverbio D, della Pepa A, Perego R, Baggiani L, DeGiorgi GB, Domenichini G, Ferro E, Cremonesi F: Seroprevalence of feline immunodeficiency virus, feline leukaemia virus and Toxoplasma gondii in stray cat colonies in northern Italy and correlation with clinical and laboratory data. J Feline Med Surg 2012, 14(6):369-377. 31. O'Connor Jr. TP, Tonelli QJ, Scarlett JM: Report of the National FeLV/FIV Awareness Project. J Am Vet Med Assoc 1991, 199(10):1348-1353. 32. Shelton GH, Waltier RM, Connor SC, Grant CK: Prevalence of feline immunodeficiency virus and feline leukemia-virus infections in pet cats. J Am Anim Hosp Assoc 1989, 25(1):7-12. 33. Cohen ND, Carter CN, Thomas MA, Lester TL, Eugster AK: Epizootiologic association between feline immunodeficiency virus infection and feline leukemia virus seropositivity. J Am Vet Med Assoc 1990, 197(2):220-225. 60 34. Grindem CB, Corbett WT, Ammerman BE, Tomkins MT: Seroepidemiologic survey of feline immunodeficiency virus infection in cats of Wake County, North Carolina. J Am Vet Med Assoc 1989, 194(2):226-228. 35. Sukura A, Grohn YT, Junttila J, Palolahti T: Association between feline immunodeficiency virus antibodies and host characteristics in Finnish cats. Acta Vet Scand 1992, 33(4):325-334. 36. Ueland K, Lutz H: Prevalence of feline leukemia virus and antibodies to feline immunodeficiency virus in cats in Norway. J Vet Med B Infect Dis Vet Public Health 1992, 39(1):53-58. 37. Akhtardanesh B, Ziaali N, Sharifi H, Rezaei S: Feline immunodeficiency virus, feline leukemia virus and Toxoplasma gondii in stray and household cats in Kerman-Iran: seroprevalence and correlation with clinical and laboratory findings. Res Vet Sci 2010, 89(2):306-310. 38. Muirden A: Prevalence of feline leukaemia virus and antibodies to feline immunodeficiency virus and feline coronavirus in stray cats sent to an RSPCA hospital. Vet Rec 2002, 150(20):621-625. 39. Goldkamp CE, Levy JK, Edinboro CH, Lachtara JL: Seroprevalences of feline leukemia virus and feline immunodeficiency virus in cats with abscesses or bite wounds and rate of veterinarian compliance with current guidelines for retrovirus testing. J Am Vet Med Assoc 2008, 232(8):1152-1158. 40. Ravi M, Wobeser GA, Taylor SM, Jackson ML: Naturally acquired feline immunodeficiency virus (FIV) infection in cats from western Canada: Prevalence, disease associations, and survival analysis. Can Vet J 2010, 51(3):271-276. 61 41. Yilmaz H, Ilgaz A, Harbour DA: Prevalence of FIV and FeLV infections in cats in Istanbul. J Feline Med Surg 2000, 2(1):69-70. 41. Hosie MJ, Addie D, Belak S, Boucraut-Baralon C, Egberink H, Frymus T, GruffyddJones T, Hartmann K, Lloret A, Lutz H et al: Feline immunodeficiency. ABCD guidelines on prevention and management. J Feline Med Surg 2009, 11(7):575-584. 42 Pogreba-Brown K, Ernst K, Harris RB. Case-case methods for studying enteric diseases: A review and approach for standardization. OA Epidemiology 2014, 2(1):7. 43 Martínez ME, Cruz GI, Brewster AM, Bondy ML, Thompson PA. What can we learn about disease etiology from case-case analyses? Lessons from breast cancer. Cancer Epidemiol Biomarkers Prev 2010, 19(11):2710-4. 62 3.8 Tables Table 3.1. Descriptive characteristics of the FIV and FeLV seropositive cat populations. Factors Total samples FeLV+ FIV+ n (%, 95% CI) n (%, 95% CI) Testing Site Veterinary Clinic 1064 503 (47.3, 44.2-50.3) 561 (52.7, 49.7-55.8) Shelter 225 90 (40.0, 33.5-46.7) 135 (60.0, 53.3-66.5) Juvenile 281 165 (58.7, 52.7-64.5) 116 (41.3, 35.5-47.3) Adult 1008 428 (42.5, 39.4-45.6) 580 (57.5, 54.4 -60.6) Male Intact 469 174 (37.1, 32.7-41.6) 295 (62.9, 58.4-67.3) Male Castrated 380 147 (38.7, 33.8-43.8) 233 (61.3, 56.2-66.2) Female Intact 262 167 (63.7, 57.6-69.6) 95 (36.3, 30.4-42.4) Female Spayed 178 105 (59.0, 51.4-66.3) 73 (41.0, 33.7-48.6) No 217 126 (58.1, 51.2-64.7) 91 (41.9, 35.3-48.8) Yes 1072 467 (43.6, 40.6-46.6) 605 (56.4, 53.4-59.4) Healthy 708 303 (42.8, 39.1-46.5) 405 (57.2, 53.5-60.9) Sick 581 290 (49.9, 45.8-54.1) 291 (50.1, 45.9-54.2) Age Sex Outdoor Exposure Health Status 63 Table 3.2. Results of univariable logistic regression analysis of risk factors for infection to FIV compared to FeLV. Variable β OR (95% CI)a P (Wald test) 0.046 Type Clinic Shelter Ref. 0.296 1.34 (1.00,1.80) 0.047 <0.001 Age Juvenile Adult Ref. 0.656 1.93 (1.47,2.52) <0.001 <0.001 Sex and neuter status Intact Female Ref. Spayed Female 0.201 1.22 (0.83,1.81) 0.314 Intact Male 1.092 2.98 (2.18,4.08) <0.001 Neutered male 1.025 2.79 (2.01,3.86) <0.001 <0.001 Outdoor Exposure Indoor Outdoor Ref. 0.584 1.79 (1.33,2.41) <0.001 0.006 Health Status Healthy Sick a Ref. -0.287 0.75 (0.60,0.94) : Odds Ratios and 95% Confidence Intervals b P (LR test)b : Likelihood Ratio Test p-value 64 0.011 Table 3.3. Results of the final mixed effects multivariable logistic regression model for analysis of risk factors for infection with FIV compared to FeLV. OR (95 % CI)a Variable P-value (Wald test) Age Juvenile Ref. Adult 2.09 (1.50-2.92) Intact Female Ref. Spayed Female 1.35 (0.66-1.65) 0.227 Intact Male 3.14 (1.85-3.76) <0.001 Neutered Male 2.68 (1.44-3.14) <0.001 Indoor Ref. Outdoor 2.58 (1.74-3.93) Healthy Ref. Sick 0.60 (0.52-0.90) <0.001 Random effects Variance SE 95 % CI At testing facility level 1.196 0.25 1.06-1.77 <0.001 Sex and neuter status Outdoor Exposure <0.001 Health Status a : Odds Ratios and 95% Confidence Intervals 65 Table 3.4. Contrasts for the association between FIV seropositivity and sex/neuter characteristics compared to FeLV seropositivity. Contrast OR (95 % CI)a P-value (Wald test) Spayed female vs. Intact male (Ref.) 0.43 (0.31-0.62) <0.001 Neutered male vs. Intact male (Ref.) 0.85 (0.43-1.36) 0.374 Neutered male vs. Spayed female (Ref.) 1.98 (1.47-3.14) <0.005 a :Odds ratio after adjusting for age, outdoor exposure and health status. Ref. indicates referent category. 66 CHAPTER 4: Temporal trends of feline retroviral infections diagnosed at the Ontario Veterinary College (1999-2012) 4.1 Abstract Feline immunodeficiency virus (FIV) and Feline leukemia virus (FeLV) infections are frequently reported in domestic cats. Despite decades of discovery and significant gains in knowledge about these infections, they remain common and difficult to treat and control. FeLV infection is reported to have declined in frequency in recent decades due to effective prevention and control practices, including vaccination. A vaccine against FIV became available in 2003 in Canada, but findings regarding the efficacy of the vaccine are contradictory and market uptake of the vaccine is unknown. Temporal trends of FeLV and FIV infections have not previously been investigated using time series methods. In this study, monthly counts of FIV and FeLV diagnostic test results performed from 1999-2012 at the Ontario Veterinary College were modeled as a function of trend, seasonality and known risk factors (age, sex and neuter status) using Poisson regression and generalised linear autoregressive moving average models (GLARMA). The effect of FIV vaccine introduction was also tested. Results from regression models adjusted for known risk factors provided no evidence for secular trend, seasonal effect or FIV vaccine introduction effect. However, the proportion of males tested was significant predictor for FIV infection rates. In conclusion, there was no evidence of changes in FIV and FeLV seroprevalence. 4.2. Introduction Infections with feline immunodeficiency virus (FIV) and feline leukemia virus (FeLV) are among the most common infectious diseases of cats (Levy et al., 2008). The 67 infections have significant impact on the length and quality of life of infected cats. The most important risk factors for these infections are age, sex, and features associated with increased cat-to-cat contact (e.g., outdoor lifestyle, sexually intact status) (Hoover and Mullins, 1991; O'Connor et al., 1991; Levy et al., 2006). Although both retroviruses are readily inactivated by many environmental conditions, they are maintained within the environment by infected cats. While FeLV prevalence is thought to have declined over the last 20 years, FIV prevalence is assumed to have remained steady (Levy et al., 2008; Gleich et al., 2009). The decline in FeLV prevalence has been attributed to test and removal programs at breeding facilities, testing before adoption, and the widespread use of preventive vaccination (Levy et al., 2008; Gleich et al., 2009; Hosie et al., 2009). While the FeLV vaccine was introduced in Canada before the study period, a vaccine against FIV was introduced in 2003. There is general consensus concerning decreasing FeLV and stable FIV prevalence, however, these perceptions are based on prevalence studies from different geographical areas, at different times, and using subpopulations with different risk behaviours (Hosie et al., 1989; Ueland and Lutz, 1992; Arjona et al., 2000). Time series analysis is more suitable to reveal evidence of temporal trends for feline retroviral infections observed over a long time period in an adequately sized population. Time series analysis is concerned with the study of temporal patterns in a series of observations. Traditionally, such methods were based on the assumption of a Gaussian distribution for the residual component, and thus not suitable for surveillance data of rare diseases, where case counts are assumed to follow a Poisson distribution. While researchers often relied on generalized linear models (GLMs) for count data such as Poisson and 68 negative-binomial regression models for independent data, the development of generalized linear autoregressive moving average models (GLARMA) now offer a methodologically sound alternative that respects the temporal dependence structure of time series observations (Davis et al., 2000; Davis et al., 2003; Dunsmuir et al., 2014). These advanced time series methods can reveal important information about infectious diseases and their epidemiological characteristics in a temporal context. The goal of this study was to investigate the temporal pattern in feline retroviral infections using patient records from the Animal Health Laboratory at the Ontario Veterinary College, Guelph, Canada. The specific objectives were (i) to explore and describe temporal patterns in FIV and FeLV seroprevalence, and (ii) to model the seroprevalence time series to test for trend and intervention effects resulting from FIV vaccine introduction. 4.3. Materials and methods 4.3.1 Data source and variables Retrospective diagnostic test data on cats tested for FIV and FeLV (requested by veterinary clinics) were retrieved from electronic records of the Animal Health Laboratory (AHL) at the Ontario Veterinary College, University of Guelph. Daily records for a 14-year period from January 1999 to December 2012 were aggregated to monthly case counts. For the purpose of this study, cats testing positive for FIV antibody or FeLV antigen by ELISA were defined as cases. Test records based on diagnostic tests other than ELISA were excluded from this study. Specifically, excluded records comprised of immunofluorescent assay (IFA) and polymerase chain reaction (PCR) tests for FeLV and FIV, which were 69 carried out during the study period in less than 5% of submitted samples. The compiled dataset included FIV and FeLV test results, date of sample submission, postal code of the veterinary clinic that submitted the sample, as well as age, sex, and neuter status of each cat. The history on each cat’s outdoor exposure was recorded inconsistently so the variable could not be investigated. 4.3.2 Statistical modeling The observed monthly counts of FIV or FeLV cases (Yt) for each of the t =1,…, 168 months was assumed to follow a Poisson distribution with mean number of cases being μ. Thus, a GLM representation to model the case counts as a function of predictors is: Yt ~ Poisson(μt) t = log(µt) = Xtβ where t is the linear predictor and Xt is the vector of covariates. In order to adjust for varying monthly sample sizes the above model can be extended to a rate model using an offset. Hence, t = log(µt) = Xtβ+log(Ot) where Ot is the number of cats tested each month. To be more specific, inclusion of the offset results here in a model for the monthly seroprevalence (no. of cats positive / no. of cats tested). To account for over-dispersion and serial dependence as expected for time series data, the Poisson regression model is extended to include autoregressive and moving average (ARMA) components using the generalized linear autoregressive moving average (GLARMA) framework (Davis et al., 2000, Dunsmuir et al. 2014). Therefore, the above model is extended to the form: 70 t = Xtβ + log(Ot) + Zt Zt = 1 (Zt−1 + et−1) … p (Zt−p + et−p) + θ1et-1+……. θ2et-q et = (Yt - µt)/µt1/2, where, i i = 1,…,p, are autoregressive (AR) parameters and θj, j = 1,…,q, are moving average (MA) parameters, and et is the Pearson residual of the tth observation. The covariates of this model include terms for trend and seasonal variation, as well as known factors associated with the respective infection (FIV or FeLV). The seasonal pattern was assumed to be similar across years and modeled by annual harmonics: cos(2πt/12) and sin(2πt/12). Visual examination of the time series did not support the inclusion of higher order seasonal harmonics. A secular trend in seroprevalence was modeled through a linear or quadratic term based on visual examination and modeling. Putative predictors for FIV and FeLV seroprevalence investigated here, included the proportion of males, neutered and adult cats tested. To assess the effect of the vaccine introduction to control FIV, an intervention term was added as a series of 0’s and 1’s, with the value of 1 indicating the period after vaccine introduction (i.e. from 2003 onwards). Univariable Poisson GLARMA (p,q) models with orders 0 to 3 were fit to select predictors using a relaxed significance level (α = 0.2) for backward stepwise model fitting. However, if removed during the model fitting, the variables proportion of males, proportion of neutered cats and proportion of adult cats were included in the multivariable model because age, sex and neuter status are known risk factors of infection. A multivariable GLARMA (p,q) model with orders 0 to 3 adjusted for proportion of male cats, neutered cats and adult cats was used to test for trend and intervention effects. The most appropriate orders p and q was identified by sequentially increasing the orders. The model with the 71 lowest AIC indicates the best fitting p and q orders for the GLARMA model. The autoregressive order was cross-checked by a visual inspection of the autocorrelation function plot for the residuals. Then trend and intervention effects were tested. If necessary, predictors were removed and orders p and q newly determined before testing trend and/or intervention effects. Once the main effects were finalized in the multivariable model, twoway interactions were tested among all the variables in the model. Furthermore, for both univariable and multivariable GLARMA models a likelihood ratio test was performed to compare the likelihood of the fitted GLARMA model to the likelihood of the (ordinary) Poisson regression model with the same main effect structure. A Poisson regression model is deemed better when the AR or MA terms of the GLARMA model as well as likelihood ratio test are non-significant (α =0.05). In such case, all inferences were based on output from (ordinary) multivariable Poisson regression fitted by quasi-likelihood estimation to account for over-dispersion expected in the data. The presence of any residual autocorrelation was examined graphically using a partial autocorrelation coefficient function (PACF) plot of Pearson residuals. Separate models were fit for FIV and FeLV. All statistical analyses were performed in statistical software R using packages base, glarma and MASS (R Development Core Team, 2013). 4.4 Results 4.4.1 Descriptive statistics The total number of cats tested for FIV and FeLV was 2417 and 2429, respectively, during the 168 month study period from January 1999 to December 2012. On average, 14 ELISA tests were performed each month for FIV as well as FeLV, with a standard 72 deviation of 6 tests. The overall seroprevalence was 4.5% and 3.3% for FIV and FeLV, respectively. The monthly seroprevalence ranged between 0-44.0% and 0-33.3% for FIV and FeLV, respectively. The time series of monthly seroprevalence and number of submissions for both viruses are displayed in Figures 4.1 and 4.2. 4.4.2 Univariable associations and GLARMA modeling With respect to FIV, multivariable GLARMA modeling started with a full model including a temporal trend, the proportion of males, the proportion of neutered and proportion of adults for model selection. The selection of these variables was based on univariable regression models with trend, proportion of adults and the proportion of neutered cats forced into the model (Table 4.1). With respect to FeLV, univariable Poisson regression modeling indicated the same predictor variables for multivariable GLARMA modeling as in the case of FIV (Table 4.2). The final multivariable GLARMA model for FIV infection included effects for a temporal trend, the proportion of males, the proportion neutered, the proportion of adults and an autoregressive term of order p = 1 (i.e., a GLAR(1) model) based on model convergence and lowest AIC (Table 4.3a). However, the AR term was not significant and the likelihood ratio test comparing the GLAR(1) model to a Poisson GLM with the same regression structure did not promote the more complex GLAR(1) model (Table 4.3b). Based on the fitted Poisson model, for every percent increase in proportion of males tested for FIV, the seroprevalence increased by 1.01 times (CI: 1.01-1.03, P < 0.02). None of the interaction terms were statistically significant. The same GLAR(1) model structure resulted as best fitting model for FeLV with a temporal trend, and the proportions of males, 73 proportion neutered and adults as predictors (Table 4.2). However, similar to FIV modeling, a Poisson GLM was finally deemed a better model than the GLAR(1) model (Tables 4.4a and 4.4b). Although the likelihood ratio test was significant, the nonsignificant autoregressive term did not support fitting a more complex GLAR (1) model compared to a regular Poisson (Table 4.4a). None of the predictors or the interaction terms were statistically significant. 4.5 Discussion and conclusion This study did not identify statistical evidence for trend or seasonality in FIV and FeLV seropositivity among cats based on ELISA test results recorded by the AHL at the Ontario Veterinary College from 1999 to 2012. While the seroprevalence reported for FIV and FeLV varies in the US and Canada, it is generally thought that FeLV prevalence is declining due to vaccination and management programs. However, FIV seroprevalence has remained steady despite significant progress in research and development of a vaccine. Although various studies support this conclusion, interpretations are complicated by the fact that prevalence estimates come from different cat populations with geographical differences due to variation in background risk of disease, properties of infecting viruses, and control practices. The absence of any statistically evident trend in seroprevalence, adjusted for the effect of proportion of adults, proportion of males and proportion of neutered cats, suggests that seroprevalence fluctuated randomly from month to month during the 14 years-study period. Only linear and quadratic trend models were tested as there was no reason to fit higher order trend polynomials based on visual examination of time series and the finding 74 that a linear trend was not significant. Many infectious diseases show seasonal patterns in infection rates attributed to disease transmission dynamics, environmental factors or host interactions related to season (e.g., feline panleukopenia, Greene et al., 2006). However, as expected for retroviruses such as FeLV and FIV, there was no evidence for seasonality in this study. The time of testing (i.e., the month of diagnosis) does not accurately reflect the time of cat infection, but rather may be related to the time cats were presented to veterinary clinics due to illness or wellness appointments. This interpretation is supported by modest seasonality apparent in sample submissions (Figures 4.1 and 4.2). This study did not identify any temporal effect (increase or decrease) in the seroprevalence of infection with FIV after the introduction of the FIV vaccine. This suggests that vaccination against FIV either was not widely implemented or did not significantly affect prevalence of infection during the study period. The FIV vaccine (FelO-Vax FIV® ) was approved for use in Canada in 2003. Based on the available literature, the efficacy of the FIV vaccine is highly variable (Huang et al., 2004; Kusuhara et al., 2005; Pu et al., 2005; Dunham et al., 2006; Huang et al., 2010). While the manufacturers report good efficacy to confer protection against multiple subtypes, an independent study from the United Kingdom reports the vaccine is unable to confer protection against a subtype A field strain circulating in the United Kingdom. It should also be noted, that veterinarians may be discouraged to use the vaccine since it is known to induce antibodies that cannot be distinguished from those produced from natural infection, which renders interpretation of routine ELISA tests difficult. It should be noted here, that there was a weak positive association between the proportion of males tested and FIV seroprevalence over time. As sex is a known risk factor for FIV, increase in the proportion of males in the 75 tested population therefore would be expected to lead to an increase in seroprevalence. The selective testing of high risk cats may balance a protective vaccination effect, however, the regression models were adjusted for major risk factors including sex. Although age, sex and neuter status have been reported as risk factors for FIV as well as FeLV (Levy et al., 2008), only the proportion of males in the tested population was found to be associated with monthly FIV seroprevalence. However, it is important to note that risk factor variables were aggregated to monthly proportions among tested cats and are interpretable at population level rather than at an individual level. Further, the population sampled at the AHL may not be representative of the general population; AHL may be testing more severe referral cases from the OVC teaching hospital. The case counts of monthly feline retroviral test results are modeled here as Poisson distributed counts. However, Poisson regression models assume independent observations, which may not hold true for time series data, rather temporal dependence is expected to exist. The common practise to investigate residual autocorrelation using residuals from a model fit under the assumption of independence to dependent data leads to biased results and is at best not well understood (Schabenberger and Gotway, 2004). Thus, it is prudent to first fit a GLARMA model (which incorporates the temporal dependence) and then compare the model, using a likelihood ratio test, to the (ordinary) Poisson regression model fit under the independence assumption to select the better fitting model. The choice of the temporal aggregation scale, (i.e., weekly, monthly quarterly or yearly data) presents a challenge analogous to the MAUP in spatial data analysis (Openshaw, 1983; Rossana and Seater, 1995; Chhetri et al., 2014). Weekly or daily time series data were inappropriate for analysis due to sparse sample submissions (i.e., missing 76 data). The chosen monthly aggregated data resulted in a regular time series, and were deemed appropriate for analysis of a seasonal pattern as well. Further aggregated time series at the scale of fortnightly or quarterly data, might have masked any seasonal effects. In conclusion, at population level, no significant changes in monthly seroprevalence of FIV and FeLV and no effect of FIV vaccine introduction were observed among cats tested at the AHL during the 1999 to 2012 period. 4.6 References Arjona, A., Escolar, E., Soto, I., Barquero, N., Martin, D., Gomez-Lucia, E., 2000. Seroepidemiological survey of infection by feline leukemia virus and immunodeficiency virus in Madrid and correlation with some clinical aspects. J. Clin. Microbiol. 38, 3448-3449. Chhetri, B.K., Berke, O., Pearl, D.L., Bienzle, D., 2014. Disparities in spatial prevalence of feline retroviruses due to data aggregation: a case of the modifiable areal unit problem. J. Vet. Med. 2014, 11. Davis, R.A., Dunsmuir, W.T., Streett, S.B., 2003. Observation‐ driven models for Poisson counts. Biometrika 90, 777-790. Davis, R.A., Dunsmuir, W.T., Wang, Y., 2000. On autocorrelation in a Poisson regression model. Biometrika 87, 491-505. Dunham, S.P., Bruce, J., MacKay, S., Golder, M., Jarrett, O., Neil, J.C., 2006. Limited efficacy of an inactivated feline immunodeficiency virus vaccine. Vet. Rec. 158, 561-562. 77 Dunsmuir, W., Li, C., Scott, D.J., 2014. glarma: Generalized Linear Autoregressive Moving Average Models. R package version 1.1-0. Gleich, S.E., Krieger, S., Hartmann, K., 2009. Prevalence of feline immunodeficiency virus and feline leukaemia virus among client-owned cats and risk factors for infection in Germany. J. Feline Med. and Surg. 11, 985-992. Greene, C.E., Addie, D.D., 2006. Feline parvovirus infections. In: Greene, C. (Ed.), Infectious diseases of the dog and cat (3rd edn). 78-88. Hoover, E.A., Mullins, J.I., 1991. Feline leukemia virus infection and diseases. J. Am. Vet. Med. Assoc. 199, 1287-1297. Hosie, M.J., Addie, D., Belak, S., Boucraut-Baralon, C., Egberink, H., Frymus, T., Gruffydd-Jones, T., Hartmann, K., Lloret, A., Lutz, H., Marsilio, F., Pennisi, M.G., Radford, A.D., Thiry, E., Truyen, U., Horzinek, M.C., 2009. Feline immunodeficiency. ABCD guidelines on prevention and management. J. Feline Med. and Surg. 11, 575-584. Hosie, M.J., Robertson, C., Jarrett, O., 1989. Prevalence of feline leukaemia virus and antibodies to feline immunodeficiency virus in cats in the United Kingdom. Vet. Rec. 125, 293-297. Huang, C., Conlee, D., Gill, M., Chu, H.J., 2010. Dual-subtype feline immunodeficiency virus vaccine provides 12 months of protective immunity against heterologous challenge. J. Feline Med. Surg. 12, 451-457. Huang, C., Conlee, D., Loop, J., Champ, D., Gill, M., Chu, H.J., 2004. Efficacy and safety of a feline immunodeficiency virus vaccine. Anim. Health Res. Rev. 5, 295-300. 78 Kusuhara, H., Hohdatsu, T., Okumura, M., Sato, K., Suzuki, Y., Motokawa, K., Gemma, T., Watanabe, R., Huang, C., Arai, S., Koyama, H., 2005. Dual-subtype vaccine (Fel-O-Vax FIV) protects cats against contact challenge with heterologous subtype B FIV infected cats. Vet. Microbiol. 108, 155-165. Levy, J., Crawford, C., Hartmann, K., Hofmann-Lehmann, R., Little, S., Sundahl, E., Thayer, V., 2008. 2008 American Association of Feline Practitioners' feline retrovirus management guidelines. J. Feline Med. and Surg. 10, 300-316. Levy, J.K., Scott, H.M., Lachtara, J.L., Crawford, P.C., 2006. Seroprevalence of feline leukemia virus and feline immunodeficiency virus infection among cats in North America and risk factors for seropositivity. J. Am. Vet. Med. Assoc. 228, 371-376. O'Connor, T.P., Jr., Tonelli, Q.J., Scarlett, J.M., 1991. Report of the National FeLV/FIV Awareness Project. J. Am. Vet. Med. Assoc. 199, 1348-1353. Openshaw, S., 1983. The modifiable areal unit problem. CATMOG - Concepts and Techniques in Modern Geography. Geo Books, Norwich, UK. Pu, R., Coleman, J., Coisman, J., Sato, E., Tanabe, T., Arai, M., Yamamoto, J.K., 2005. Dual-subtype FIV vaccine (Fel-O-Vax FIV) protection against a heterologous subtype B FIV isolate. J. Feline Med. Surg. 7, 65-70. R Development Core Team, 2013. R: A language and environment for statistical computing. R Foundation for Statistical Computing, Vienna, Austria. ISBN 3900051-07-0. Rossana, R.J., Seater, J.J., 1995. Temporal aggregation and economic time series. J. Bus. Econ. Stat. 13, 441-451. 79 Schabenberger, O., Gotway, C.A., 2004. Statistical methods for spatial data analysis. CRC Press. Ueland, K., Lutz, H., 1992. Prevalence of feline leukemia virus and antibodies to feline immunodeficiency virus in cats in Norway. J. Vet. Med. B Infect. Dis. Vet. Public Health 39, 53-58. 80 4.7. Tables and Figures Table 4.1. Associations between FIV seropositivity and risk factors recorded at the AHL 1999-2012 from univariable quasi-likelihood Poisson regression models Variable Estimate SE P Linear trend 0.040 0.026 0.135 Seasonal harmonics P (LRT)* 0.730 cos(2πt/12) -0.115 0.146 0.429 sin(2πt/12) 0.012 0.147 0.937 Proportion of males 0.020 0.007 0.008 Proportion of neutered 0.005 0.005 0.364 Proportion of adults 0.004 0.003 0.202 Introduction of FIV vaccine 0.200 0.209 0.340 * P value for likelihood ratio test for the overall significance of the variable as a group. 81 Table 4.2. Associations between FeLV seropositivity and risk factors recorded at the AHL 1999-2012 from univariable quasi-likelihood Poisson regression models Variable Estimate SE P Linear trend 0.051 0.029 0.077 cos(2πt/12) 0.108 0.159 0.495 sin(2πt/12) 0.099 0.160 0.536 Proportion of males -0.007 0.008 0.176 Proportion of neutered 0.006 0.006 0.258 Proportion of adults 0.007 0.004 0.040 P (LRT)* Seasonal harmonics 0.660 * P value for likelihood ratio test testing the overall significance of the variable as a group. 82 Table 4.3a Estimated parameters of the final multivariable GLARMA model for the association between FIV seroprevalence and risk factors recorded at the AHL 19992012. Variable Estimate SE P Trend 0.020 0.040 0.593 Proportion of males 0.019 0.008 0.014 Proportion of adults 0.001 0.005 0.907 Proportion of neutered 0.006 0.005 0.258 1 -0.856 0.107 0.425 LRT -0.235 AIC 334.822 1.000 83 Table 4.3b. Estimated parameters of the final multivariable quasi-likelihood Poisson model for the association between FIV seroprevalence and risk factors recorded at the AHL 1999-2012. Variable Estimate SE P Trend 0.023 0.027 0.557 Proportion of males 0.019 0.007 0.014 Proportion of adults 0.002 0.005 0.975 Proportion of neutered 0.006 0.005 0.279 84 Table 4.4a Estimated parameters of the final multivariable GLARMA model for the association between FeLV seroprevalence and risk factors recorded at the AHL 19992012. Variable Estimate SE P Trend 0.025 0.042 0.550 Proportion of males -0.008 0.007 0.261 Proportion of adults 0.005 0.005 0.338 Proportion neutered 0.005 0.006 0.367 1 -0.010 0.125 0.941 LRT 15.84 AIC 294.62 < 0.001 85 Table 4.4b. Estimated parameters of the final multivariable quasi-likelihood Poisson model for the association between FeLV seroprevalence and risk factors recorded at the AHL 1999-2012. Variable Estimate SE P Trend 0.029 0.042 0.480 Proportion of males -0.008 0.006 0.232 Proportion of adults 0.007 0.003 0.399 Proportion neutered 0.004 0.005 0.367 86 0 5 1999 2000 2001 2002 2003 2004 2005 2006 2007 2008 2009 2010 2011 2012 Months Figure 4.1. Time series plots of monthly FIV seroprevalence and total samples tested at the AHL from 1999-2012. 87 Total Cats Tested 10 15 20 25 30 30 20 10 Prevalence 40 Tested Prevalence 40 5 10 1999 2000 2001 2002 2003 2004 2005 2006 2007 2008 2009 2010 2011 2012 Time Figure 4.2. Time series plots of monthly FeLV seroprevalence and total samples tested at the AHL from 1999-2012. 88 Total Cats Tested 30 20 30 20 10 0 Prevalence Tested Prevalence CHAPTER 5: Disparities in spatial prevalence of feline retroviruses due to data aggregation: a case of the modifiable areal unit problem (MAUP)? (As published: Chhetri, BK et al. 2014: Journal of Veterinary Medicine, Vol. 2014) 5.1 Abstract The knowledge of the spatial distribution feline immunodeficiency virus and feline leukemia virus infections, which are untreatable, can inform about their risk factors and high-risk areas to enhance control. However, when spatial analysis involves aggregated spatial data, the results may be influenced by the spatial scale of aggregation, an effect known as the modifiable areal unit problem (MAUP). In this study, area level risk factors for both infections in 28,914 cats tested with ELISA were investigated by multivariable spatial Poisson regression models, along with MAUP effect on spatial clustering and cluster detection (for postal codes, counties and states) by the Moran’s I test and spatial scan test, respectively. The study results indicate that the significance and magnitude of the association of risk factors with both infections varied with aggregation scale. Further, Moran’s I test only identified spatial clustering at postal code and county level of aggregation. Similarly, the spatial scan test indicated that the number, size and location of clusters varied over aggregation scales. In conclusion, the association between infection and area was influenced by the choice of spatial scale and indicates the importance of study design and data analysis with respect to specific research questions. 5.2 Introduction Infections with feline immunodeficiency virus (FIV) and feline leukemia virus (FeLV) have been reported from a number of countries and are important conditions in cats 89 (Little et al., 2009). The most common mode of transmission of these immunosuppressive retroviruses is through bite wounds. FeLV infection is also commonly acquired via the oronasal route though mutual grooming, nursing or sharing of dishes (Levy, 2009). The known risk factors for acquiring these infections are male sex, adulthood and exposure to outdoors, whereas being neutered and indoor lifestyle are known protective factors (Levy et al., 2008). Recent studies estimate a seroprevalence of 2.3% (FeLV) and 2.5% (FIV) in the United States (US) (Levy et al., 2006), and 3.4% (FeLV) and 4.3% (FIV) in Canada (Little et al., 2009). Despite decades of discovery, clinical management of cats infected with FIV and FeLV is still challenging without the existence of an effective therapeutic intervention (Levy et al., 2008). Therefore, better ways to control the infections and prophylactic management is the mainstay of disease prevention strategy for these infections. A number of previous studies have suggested that the prevalence of retroviral infections in domestic cat populations vary by regions and maybe attributed to variable population density, reproductive status, age, sex and housing conditions (Baneth et al., 1999; Nakamura et al., 2000; Norris et al., 2007; Gleich et al., 2009; Hosie et al., 2009; Lutz et al., 2009; Chhetri et al., 2013). For the US and Canada, spatial variation in FIV and FeLV seroprevalence has been reported in previous studies that generated data for this research (Levy et al., 2006; Little et al., 2009). Here we attempt to extend the findings by applying spatial statistical methods to illustrate geographic variation in the distribution of FIV and FeLV infections and assess the relationship with group-level risk factors. Spatial epidemiological methods are commonly used to identify, describe and quantify spatial patterns in the distribution of health events. Spatial patterns commonly of 90 interest include trends, clustering and detection of clusters in the occurrence of health events in a population. Further, geographic correlation studies can be important tools to evaluate the association of spatial or environmental risk factors with the occurrence of health events after adjusting for confounders. The identification of such spatial patterns may provide clues for further testable hypotheses about an unknown disease etiology (Berke and Waller, 2010). Ecological studies, such as geographic correlation studies, are particularly valuable when an individual level association between infection and risk factors is evident and a group level association is assessed to determine the population health impact (Stevenson and McClure, 2005). To this effect, spatial analysis of FIV and FeLV infections can be a valuable tool in epidemiological understanding of these infections. Due to lack of individual level data, client confidentiality, and to create meaningful units for data analysis, aggregated or area level data may be used to carry out such spatial epidemiological studies. However, the way areal units are defined can influence the results and inferences based on aggregated data. Specifically, the number or size of areas used and how the area boundaries are drawn can influence spatial data analysis. This has been termed the modifiable areal unit problem (MAUP) and is a long known phenomenon (Openshaw, 1983; Gotway and Young, 2002) in the geographical literature. The MAUP stems from the fact that areal units are usually arbitrarily determined and can be modified to form units of different sizes or spatial arrangements (Jelinski and Wu, 1996). The MAUP consists of two interrelated components - the scale and zoning effect. The scale effect is the variation in results obtained when the areal data comprising smaller areal units is grouped to form increasingly larger units. The zoning effect, on the other hand, is the variation in 91 results obtained due to alternative formations of areal units where the number of areal units is constant i.e. analysis comprising the same number of areal units but different area shapes (Openshaw, 1983; Waller and Gotway, 2004; Wong, 2008). The goal of this study was to evaluate the association of seroprevalence of FIV and FeLV with ecological risk factors in a spatial regression model. Specific objectives of the study were to examine the MAUP effects on a) the spatial clustering of FIV and FeLV infections; b) the occurrence of high-risk clusters of FIV and FeLV infections; and c) the relationship between area level seroprevalence and risk factors in context of aggregated covariates. 5.3. Materials and methods 5.3.1. Data source, study area and population A dataset consisting of diagnostic test results from 29,182 cats tested for FIV and FeLV between August and November of the year 2004 and 2007 from U.S. and Canada was obtained from previous cross-sectional studies (Levy et al., 2006; Little et al., 2009). The cats included in this study were conveniently sampled from veterinary clinics and animal shelters across 40 contiguous states of the US and 9 Canadian provinces encompassing 641 US zip codes and Canadian forward sortation areas in 346 US counties and Canadian Census Divisions (Statistics Canada, 2006). The testing for FIV and FeLV was carried out in-house or in-laboratory employing a commercially available ELISA (SNAP® Combo FeLV antigen/FIV antibody, PetCheck® FIV Antibody and PetCheck® FeLV Antigen; IDEXX Laboratories) using blood, serum or plasma. Information on postal code of testing facility, type of testing facility (clinic or shelter), age of the cat (juvenile [<6 92 months] or adult), sex and neuter status (sexually intact female, spayed female, sexually intact male or castrated male), access to outdoors (indoors or outdoors) and general health at time of testing (healthy or sick) was also retrieved from the dataset (Table 5.1a). 5.3.2. Data aggregation The three spatial aggregation scales of interest in this study were postal codes, counties and states. The US five digit zip code and Canadian forward sortation areas (FSA) were designated as postal codes, StatCan (Statistics Canada) census divisions (CDs) were defined as corresponding to US counties and Canadian provinces were defined as states. The counts of positive test results and number of tests for each area were aggregated to these three spatial aggregation scales of interest (641 postal codes, 346 counties and 49 states). In addition, group-level risk factors, constructed from individual risk factors, included the proportion of juvenile cats (< 6 months), intact males, intact females, cats that were exclusively indoors, cats tested at clinics, cats that were healthy at the time of testing as well as the seroprevalence of FIV and FeLV. These covariates were "constructed" for respective scales using categories of individual data presented in Table 5.1a. 5.3.3. Geocoding In order to spatially reference the postal codes, counties and states, the geographic coordinates (as centroids) of the US zip codes, counties, states and the Canadian FSAs were obtained from Environmental System Research Institute (ESRI) postal code shapefiles (ESRI, 2006). Each Canadian FSA was assigned to the respective county and state based on the postal code conversion file (PCCF) available from StatCan. 93 5.3.4. Statistical methods 5.3.4.1. Spatial clustering To investigate disease clustering (i.e. the presence of spatial autocorrelation in the data), Moran's I test was applied. Given the infectious nature of FIV and FeLV, clustering was assumed to be present. The interest in this study was to evaluate whether aggregation of data from postal code level (where the data were collected) to county and states had any effect on strength and presence of clustering. In this regard, the presence and strength of spatial clustering of FIV and FeLV infections for each level of aggregation was assessed by Moran’s I test on the smoothed seroprevalence estimates using empirical Bayesian smoothing (Assuncao and Reis, 1999). Since the number of tested cats varied among the areas, smoothed seroprevalence were estimated from crude seroprevalence (number of cats testing positive/number of cats tested) for each area using the empirical Bayesian (EB) estimation such that the area specific seroprevalence were adjusted towards the overall mean. The EB estimation technique can be interpreted as internal standardization (Berke, 2004). The null hypothesis of Moran's I test states that there is no spatial autocorrelation of FIV or FeLV seroprevalence between areas, and the respective Moran's I coefficient summarizes the degree to which similar observations (i.e. seroprevalence of FIV or FeLV) tend to occur near each other (Waller and Gotway, 2004). The Moran's I coefficient was estimated as follows: I= 𝑛 ∑𝑛𝑖=1 ∑𝑛𝑖=𝑗 𝑤𝑖𝑗 (𝑦𝑖 − 𝑦)(𝑦𝑗 − 𝑦) (∑𝑛𝑖=1(𝑦𝑖 − 𝑦)2 )(∑ ∑𝑖≠𝑗 𝑤𝑖𝑗 ) where, n = number of areas 94 wij = measure of spatial proximity between areas i and j yi= Poisson model based EB smoothed seroprevalence of FIV or FeLV in area i yj = Poisson model based EB smoothed seroprevalence of FIV or FeLV in area j y¯ = overall EB smoothed seroprevalence wij is the spatial weights matrix which considers three nearest neighbours (wij is 1 if area i and j are within a distance of three nearest neighbours and zero otherwise). The Moran's I test was applied using the spdep package of statistical software R (Bivand, 2012). 5.3.4.2. Spatial cluster detection While Moran's I summarizes the overall clustering pattern in the study area, disease cluster detection methods are used to identify the locations of clusters and thus are location specific. Of various methods proposed for cluster detection (Waller and Gotway, 2004), the most widely used is the spatial scan test (Kulldorff and Nagarwalla, 1995). Here, the MAUP effect on the spatial scan test was investigated with respect to FIV and FeLV infections. Furthermore, the spatial scan test can be extended to detect clusters after adjustment for known risk factors or confounders for FIV and FeLV infections. Therefore, the presence of statistically significant high-risk clusters of FIV (or FeLV) infection was investigated using a spatial scan test adjusted for risk factors under the Poisson assumption (Kulldorff, 1997), as implemented in SaTScan™ version 9.0 (Kulldorff and Information Management Services, 2010). The spatial scan test identifies potential clusters using circular windows of varying radius (size) and location (area centroids) across the study area. To apply the Poisson model, it was assumed under the null hypothesis that the number of FIV or FeLV cases in 95 each area followed a Poisson distribution with the expected number of cases in each area proportional to the covariate (risk factor) adjusted tested cat population (Kulldorff et al., 1998). High-risk cluster detection was performed by comparing the observed number of cases within the scanning window with the expected number, i.e. if cases were to be distributed randomly in space (Kulldorff, 1997). In other words, detection of high-risk clusters would indicate the prevalence of FIV (or FeLV) inside the circular window as significantly higher than outside the window. The statistical significance of the clusters was established by Monte Carlo hypothesis testing using 999 Monte Carlo replications with a significance level set to α = 5%. The significance of multiple clusters was tested sequentially conditional on the presence of the previously detected clusters such that secondary clusters were tested and reported only if the more likely cluster were significant (Zhang et al., 2010). The size of the scanning window in the spatial scan statistic was allowed to increase from individual areas and expanded to include neighbouring areas until a maximum of 50 % of the total tested population. No geographical overlap of clusters was allowed. Detected clusters were visualized by plotting respective circles on a map of the study area. The characteristics of detected clusters were compared across aggregation levels to assess the MAUP effect. 5.3.4.3. Spatial regression modeling Apart from describing the spatial patterns of disease in terms of clustering and cluster, geographic correlation analysis (or spatial regression modeling) for spatial data were carried out to quantify the effect of spatially referenced group-level risk factors on the spatial distribution of disease events, i.e. FIV and FeLV infections (Waller and Gotway, 96 2004; Pfeiffer et al., 2008). While these studies are similar to ecological regression methods, it is critical to adjust for the spatial autocorrelation in the data in order to prevent type I errors, i.e. providing “statistically significant” results when none exist (Tango, 2010). Among many proposed methods for spatial regression modeling for areal data (Richardson and Monfort, 2000; Waller and Gotway, 2004; Dormann et al., 2007; Pfeiffer et al., 2008), Poisson distributed counts for rare disease or infections such as FIV and FeLV can be effectively modeled to assess its relationship with group-level risk factors using generalized linear mixed models (GLMM) with spatially correlated random effects, also known as spatial GLMM. In this study, interest was to evaluate group-level risk factors for FIV and FeLV infections as well as to quantify the effect of MAUP as change in magnitude and significance of regression parameters with spatial aggregation scale. For each aggregation level, the count of FIV and FeLV infections in each area was modelled as a function of the group-level covariates in a Poisson regression model framework with the log of number of tested cats as the offset. Prior to inclusion of covariates in the regression models, the relationship between the outcome and covariates was assessed for linearity by plotting the log of the seroprevalence of infection for both FIV and FeLV against the covariate using a locally weighted regression. The covariates were modelled as dichotomized variables if the relationship was deemed to be non-linear. This decision was taken to ensure comparability of covariates across the aggregation levels. Covariates were modeled as dichotomous variables with cut-offs for low and high categories set at median value (50 %) of the respective covariates. When modeled as predictor variable and not the outcome, the cut-off for categories of covariate FIV and FeLV seroprevalence was set at 3%, 8% and over 8%. 97 The cut-off of 3% is the general prevalence of FIV and FeLV in cats in North America. Since all the covariates are deemed clinically important risk factors, they were included as fixed effects in a multivariable model, with no interactions. Further, the same model was fit to data at all 3 levels of aggregation (State, County and Postal Code) to avoid any influence of the selection method or covariate(s) exclusion in the comparison of models (Arsenault et al., 2012). For state level aggregation, covariates with sample size less than five were omitted. In order to account for spatial autocorrelation and over-dispersion in the models, an exponential spatial covariance structure was introduced and the models were re-run using penalized quasilikelihood (PQL) estimation (Breslow and Clayton, 1993; Dormann et al., 2007). An exponential covariance structure was based on a semivariogram fitted to the deviance residuals of the Poisson regression models and was deemed biologically appropriate because, for infectious agents such as FIV and FeLV, areas in proximity are expected to be similar with respect to disease prevalence. The presence of over-dispersion in (non-spatial) Poisson regression models was evaluated by testing the model deviance against degrees of freedom using a χ2 distribution and a 5% significance level (Faraway, 2006). Multicollinearity was tested among the covariates in the multivariable model by estimating the variance inflation factor (VIF) and all variables with a VIF value of 10 or above were considered collinear (Dohoo et al., 2003). All statistical modeling was done using statistical software R (R Development Core Team, 2011). 98 5.4. Results and discussion 5.4.1. Results 5.4.1.1. Descriptive statistics A total of 28,914 test results were included in this study from 688 veterinary clinics and 158 animal shelters from 40 states of the US and 9 Canadian provinces encompassing 346 counties and 641 postal codes. A total of 634 recorded postal codes (out of 648) were accurately matched during geocoding. Seven records were reassigned to proper postal codes using clinic address. In total, geographic coordinates were retrieved for 641 postal codes (out of 648) for 28,914 cats (out of 29,182 cats). The individual characteristics of FIV and FeLV infected cats and descriptive statistics of area wise counts are presented in Table 5.1a and 1b. Overall the observed seroprevalence of FIV was higher than that of FeLV, 3.16% and 2.71% respectively. The mean and variability in number of cats with positive test results for both infections and the number of cats tested increased with higher level of aggregation but decreased for seroprevalence (Table 5.1b). The seroprevalence of FIV infection for postal codes, counties and states ranged from 0- 100%, 0-50% and 0-13 % respectively, while the seroprevalence of FeLV ranged from 0-100%, 0-33% and 0- 20% for postal code, county, and state levels, respectively. 5.4.1.2. Spatial clustering The results of the Moran's I clustering test on EB smoothed seroprevalence is presented in Table 5.2. The Moran's I statistic indicated significant spatial clustering in seroprevalence of infection for FIV at postal code and county level aggregations (I = 0.09 99 and I=0.15 respectively, p < 0.01). Likewise, spatial clustering was identified for FeLV at postal code and county level aggregations (I=0.12 and 0.15 respectively, p <0.01). At state level of aggregation no spatial clustering was detected. 5.4.1.3. Spatial cluster detection Table 5.3a-b, Figures 5.1 and 5.2 display detailed information for all clusters identified by the spatial scan statistic. For both FIV and FeLV infections, spatial clusters were detected at all aggregation levels. However, the numbers of clusters detected for FIV and FeLV infections varied with the level of aggregation. For FIV infections, one cluster was detected for state, five for county and six for postal code level aggregation. Some clusters identified at postal code level were not detected at county level and state level aggregations (Table 5.3a and Figures 5.1a-c). For FeLV, three clusters each for state, county and postal code levels were identified, with location and size of the clusters slightly varying by spatial scale (Table 5.3b and Figures 5.2 a-c). Figures 5.2 a-c indicate that FeLV clusters were about the same size and in the same location for postal code and county levels of aggregation, whereas clusters at the state level differed with respect to size and, more importantly, location. 5.4.1.4. Spatial regression modeling Spatial Poisson regression indicated that the seroprevalence of FeLV infections was observed to be lower among areas with greater proportion of cats that were young and indoors (Table 5.4a). Conversely, seroprevalence of FeLV infections was higher among areas with a greater proportion of intact males, cats tested at clinics and with a higher 100 seroprevalence of FIV (Table 5.4a). Similarly, seroprevalence of FIV infection was higher among areas with a greater proportion of cats tested at clinics and with a higher seroprevalence of FeLV (Table 5.4b). The seroprevalence of FIV, however, was lower in areas with greater proportion of intact females. The significance and magnitude of observed associations were not consistent across all aggregation levels. The direction of change in magnitude of association was also not consistent. Associations seen at postal code and county levels may not be evident at the state level (e.g. percentage of juvenile cats in an area and FeLV). Or conversely, associations observed at state level were not detected at lower levels (e.g. percentage of male intact in an area and FeLV). 5.4.2 Discussion This study showed that commonly used spatial epidemiological methods (Moran's I, spatial scan test and spatial regression modeling) are sensitive to choice of the spatial aggregation scale for analysis, i.e. are affected by the MAUP. Recognizing the importance of bias due to the MAUP is important to the validity of spatial epidemiological inferences. The Moran’s I coefficient indicated clustering of FIV and FeLV positive test results. However, the strength and significance of clustering varied across spatial aggregation levels. Given the infectious nature of both retroviruses, areas near each other are expected to have similar seroprevalence levels. Therefore, positive autocorrelation in FIV and FeLV seroprevalence was expected. As the data are aggregated, variations at lower levels of aggregation dissolve to form more homogenous areas in terms of population characteristics (Waller and Gotway, 2004). With the postal codes aggregated to counties and states, the variability in seroprevalence estimates evident at the scale of postal code and counties 101 likely diminished as the seroprevalence estimates were averaged (Table 5.1b). Generally, spatial aggregation is expected to increase spatial correlations (Flowerdew et al., 2008). However, in this study the opposite effect was observed, the spatial autocorrelation present at postal and county levels disappeared at state level. This may imply that the biological processes which are associated with the clustering of infected cats at local levels (i.e. postal codes and counties) become irrelevant or unobservable at higher aggregation levels (i.e. states). It is important to note that there is a random aspect to the effects of the MAUP and it may be difficult to generalize about how different datasets with different spatial units are affected by the MAUP (Gotway and Young, 2002). Further, the aggregation process itself may induce positive spatial autocorrelation, particularly if the aggregation process allows overlapping units (Gotway and Young, 2002) such as postal code to form counties. Unfortunately, not all postal code areas or counties in the US and Canada were sampled for this study and the Moran's I test was based on a neighbourhood specification of three nearest neighbours. Therefore it is possible to get "first three nearest neighbours" areas too distant from a biological perspective on infection, which would tend to aggravate variability and reduce autocorrelation at lower levels of aggregation. Evidence of high-risk areas for FIV and FeLV infections as detected by the spatial scan test adjusted for known confounders suggests that yet unknown spatial factors may exist. This study also indicates that the results from the spatial scan test can be influenced by spatial aggregation as evident from the difference in size, number and location of clusters for both FIV and FeLV infections. Despite differences in cluster characteristics with respect to size and location across aggregation levels for FeLV, no clusters were detected in the western parts of United States 102 and Canada indicating that these areas had lower prevalence of infection compared to the rest of the study area. The results at county and postal code area levels were similar with respect to cluster size and locations. The sampled counties and postal codes were not very different with respect to population characteristics, and thus may be insensitive to aggregation effects. However, it is most likely an artificial effect as most counties had only a few postal codes sampled within them. While multiple clusters were detected for FIV at the postal code level, these were not detected at higher aggregation levels (Figure 5.1 a-c). Spatial aggregation reduced the sample size from 641 postal codes to 346 counties and 49 states (or provinces) in this study. Aggregation of data may smooth out local effects, but may also lead to reduced power to detect small clusters while stabilizing rates that may be unstable in smaller areas due to smaller at-risk-populations in the denominator (Gregorio et al., 2005; Neill, 2009). The results from spatial Poisson regression modeling indicate that the seroprevalence of both infections is higher in areas with the greater proportion of cats tested at clinics than at shelters. Although, the seroprevalence of FIV and FeLV in shelter cat populations mirrors that of cat populations served by veterinary clinics (Levy et al., 2008), the reasons for testing may be different. Housing considerations and potential for adoption may drive testing decisions in shelters, whereas at clinics mostly sick cats are tested (Goldkamp et al. 2008). Thus, the seroprevalence estimates in populations tested at clinics may be inflated. An increase in seroprevalence of FeLV was found to be associated with higher FIV seroprevalence. This is expected since both infections share similar risk factors (Lee et al., 2002) and as a result would have similar infection rates. Furthermore, the seroprevalence 103 of FeLV in an area was negatively associated with a higher proportion of young cats, indoor cats and neutered males. Consequently, the seroprevalence would be higher in areas with greater proportions of adults, outdoor cats and intact cats due to social interactions related to roaming, breeding and fighting. Therefore, the areas populated with cats of these characteristics can be expected to harbour cats with higher risk of acquiring retroviral infections. Areas with greater proportions of intact female cats had a lower seroprevalence for FIV than areas with greater proportions of spayed female cats. This finding seems to be counterintuitive from a biological perspective, as similar to areas with greater proportions of intact males; populations with greater proportions of intact females might be expected to be more susceptible to acquire an infection as a result of higher probabilities of animals fighting. However, the predictors that are derived variables (variables constructed as summaries of individual characteristics) in the group level analysis cannot distinguish the individual-level effect of the variable from its contextual or group level effect (Diez Roux, 2004). Derived variables are constructed mathematically by summarizing the individual characteristics in a group (Diez Roux, 2004), e.g. proportion of males in an area. The significance and magnitude of associations between health status and risk factors (or predictor variables) are governed by the scale of spatial aggregation. The associations observed at one scale should be used with caution when inferences are made at another scale. Except for FIV and FeLV seroprevalence, this study did not identify any covariate consistently associated with the outcome across all aggregation levels. The geographic scales at which these two variables are meaningful actors, probably include ones larger than postal code. This is likely true, since veterinary clinics generally service areas that overlap several postal code areas or occasionally across county barriers. For other 104 variables, the choice of the aggregation scale seems to affect the significance and magnitude of observed associations. Generally, most of the predictor variables were only significant at lower levels of aggregation. Suggesting that seroprevalence of FIV and FeLV at higher levels of aggregation depend on further group-level factors not considered in this study. It is important that this spatial scale dependence is not over-interpreted as a sole MAUP effect as multivariable analysis is a complex subject and nevertheless can be subject to missing but confounding variables (Jelinski and Wu, 1996). This study utilized an ecological regression framework based on covariates as derived variables from individual level data (Diez-Roux, 2000). Thus, the associations observed between covariates and the seroprevalence pertain to group levels. It is necessary to be cautious in extrapolating these findings to the individual level due to the potential for ecological bias. Currently, there are no solutions to fully overcome the effects of MAUP and related methodological issues have not yet been adequately addressed. Recommendations have been made to minimize MAUP effects in statistical inference by analyzing the aggregated covariates in hierarchical levels of areal units from the finest spatial resolution possible to a coarser resolution, verifying consistent model results across different scales, avoiding ecological fallacy, collecting data at the scale at which inferences is to be made and using scale invariant statistics to make inferences (Fotheringham, 1989; Ratcliffe and McCullagh, 1999; Diez-Roux, 2000; Waller and Gotway, 2004). 5.5. Conclusion This study demonstrated the importance of study design in the context of spatial epidemiological studies. Inference from spatial epidemiological studies dealing with 105 aggregated data could potentially be affected by the modifiable areal unit problem (MAUP). The MAUP can result in overlooking or conversely overstating the effect of risk factors as well as influence statistics designed to test for clustering and clusters. In the present study of FIV and FeLV seroprevalence among cats across the US and Canada it was found that disease clusters may become unidentifiable when data are aggregated. Therefore, it is of utmost importance that investigators define the appropriate scale for data collection and analysis with respect to their research questions. 5.6. References Arsenault, J., Berke, O., Michel, P., Ravel, A., Gosselin, P., 2012. Environmental and demographic risk factors for campylobacteriosis: do various geographical scales tell the same story? BMC Infect. Dis. 12, 318. Assuncao, R.M., Reis, E.A., 1999. A new proposal to adjust Moran's I for population density. Stat. Med. 18, 2147-2162. Baneth, G., Kass, P.H., Steinfeld, D., Besser, M., 1999. A seroepidemiological study of feline coronavirus, feline immunodeficiency virus and feline leukemia virus among cats in Israel. Israel J. Vet. Med. 54, 39–43. Berke, O., 2004. Exploratory disease mapping: kriging the spatial risk function from regional count data. Int. J. Health Geogr. 3, 18. Berke, O., Waller, L., 2010. On the effect of diagnostic misclassification bias on the observed spatial pattern in regional count data-a case study using West Nile virus mortality data from Ontario, 2005. Spat. Spatiotemporal Epidemiol. 1, 117-122. 106 Bivand, R., 2012. spdep: Spatial dependence: weighting schemes, statistics and models. R package version 0.5-53. http://CRAN.R-project.org/package=spdep. Breslow, N.E., Clayton, D.G., 1993. Approximate Inference in Generalized Linear Mixed Models. J. Am. Stat. Assoc. 88, 9-25. Cameron, A.C., Trivedi, P.K., 1998. Regression analysis of count data. Cambridge University Press, Cambridge. Chhetri, B.K., Berke, O., Pearl, D.L., Bienzle, D., 2013. Comparison of the geographical distribution of feline immunodeficiency virus and feline leukemia virus infections in the United States of America (2000-2011). BMC Vet. Res. 9, 2. Diez-Roux, A.V., 2000. Multilevel analysis in public health research. Annu. Rev. Public Health. 21, 171-192. Diez Roux, A.V., 2004. The study of group-level factors in epidemiology: rethinking variables, study designs, and analytical approaches. Epidemiol. Rev. 26, 104-111. Dohoo, I.R., Martin, W., Stryhn, H., 2003. Veterinary Epidemiologic Research. AVC Incorporated, Charlottetown. Dormann, C.F., McPherson, J.M., Araujo, M.B., Bivand, R., Bolliger, J., Carl, G., Davies, R.G., Hirzel, A., Jetz, W., Kissling, W.D., Kuhn, I., Ohlemuller, R., Peres-Neto, P.R., Reineking, B., Schroder, B., Schurr, F.M., Wilson, R., 2007. Methods to account for spatial autocorrelation in the analysis of species distributional data: a review. Ecography. 30, 609-628. ESRI, 2006. Environmental Systems Research Institute. Redlands, CA, USA. Faraway, J.J., 2006. Extending the linear model with R : generalized linear, mixed effects and nonparametric regression models. Chapman & Hall/CRC, Boca Raton. 107 Flowerdew, R., Manley, D.J., Sabel, C.E., 2008. Neighbourhood effects on health: Does it matter where you draw the boundaries? Soc. Sci. Med. 66, 1241-1255. Fotheringham, A.S., 1989. Scale-independent spatial analysis. In: Goodchild, M.F., Gopal, S. (Eds.), Accuracy of spatial databases. Taylor and Francis, London, pp. 221-228. Gleich, S.E., Krieger, S., Hartmann, K., 2009. Prevalence of feline immunodeficiency virus and feline leukaemia virus among client-owned cats and risk factors for infection in Germany. J. Feline Med. Surg. 11, 985-992. Goldkamp, C.E., Levy, J.K., Edinboro, C.H., Lachtara, J.L., 2008. Seroprevalences of feline leukemia virus and feline immunodeficiency virus in cats with abscesses or bite wounds and rate of veterinarian compliance with current guidelines for retrovirus testing. J. Am. Vet. Med. Assoc. 232, 1152-1158. Gotway, C.A., Young, L.J., 2002. Combining incompatible spatial data. J. Am. Stat. Assoc. 97, 632-648. Gregorio, D., Dechello, L., Samociuk, H., Kulldorff, M., 2005. Lumping or splitting: seeking the preferred areal unit for health geography studies. Int. J. Health Geogr. 4, 6. Hosie, M.J., Addie, D., Belak, S., Boucraut-Baralon, C., Egberink, H., Frymus, T., Gruffydd-Jones, T., Hartmann, K., Lloret, A., Lutz, H., Marsilio, F., Pennisi, M.G., Radford, A.D., Thiry, E., Truyen, U., Horzinek, M.C., 2009. Feline immunodeficiency. ABCD guidelines on prevention and management. J. Feline Med. Surg. 11, 575-584. Jelinski, D.E., Wu, J.G., 1996. The modifiable areal unit problem and implications for landscape ecology. Landscape Ecol. 11, 129-140. 108 Kulldorff, M., 1997. A spatial scan statistic. Commun. Stat. Theory, 1481-1496. Kulldorff, M., Athas, W.F., Feurer, E.J., Miller, B.A., Key, C.R., 1998. Evaluating cluster alarms: a space-time scan statistic and brain cancer in Los Alamos, New Mexico. Am. J. Public Health 88, 1377-1380. Kulldorff, M., Information Management Services, I.S.v., 2010. Software for the spatial, temporal and space-time scan statistics. http://www.satscan.org/, 2010. Kulldorff, M., Nagarwalla, N., 1995. Spatial disease clusters: detection and inference. Stat. Med. 14, 799-810. Lee, I.T., Levy, J.K., Gorman, S.P., Crawford, P.C., Slater, M.R., 2002. Prevalence of feline leukemia virus infection and serum antibodies against feline immunodeficiency virus in unowned free-roaming cats. J. Am. Vet. Med. Assoc. 220, 620-622. Levy, J., 2009. Feline Leukemia Virus and Feline Immunodeficiency Virus. In: Miller, L., Hurley, K.F. (Ed.), Infectious Disease Management in Animal Shelters. WileyBlackwell Hoboken, New Jersey, pp.307-317. Levy, J., Crawford, C., Hartmann, K., Hofmann-Lehmann, R., Little, S., Sundahl, E., Thayer, V., 2008. 2008 American Association of Feline Practitioners' feline retrovirus management guidelines. J. Feline Med. Surg. 10, 300-316. Levy, J.K., Scott, H.M., Lachtara, J.L., Crawford, P.C., 2006. Seroprevalence of feline leukemia virus and feline immunodeficiency virus infection among cats in North America and risk factors for seropositivity. J. Am. Vet. Med. Assoc. 228, 371-376. 109 Little, S., Sears, W., Lachtara, J., Bienzle, D., 2009. Seroprevalence of feline leukemia virus and feline immunodeficiency virus infection among cats in Canada. Can. Vet. J. 50, 644-648. Lutz, H., Addie, D., Belak, S., Boucraut-Baralon, C., Egberink, H., Frymus, T., GruffyddJones, T., Hartmann, K., Hosie, M.J., Lloret, A., Marsilio, F., Pennisi, M.G., Radford, A.D., Thiry, E., Truyen, U., Horzinek, M.C., 2009. Feline leukaemia. ABCD guidelines on prevention and management. J. Feline Med. Surg. 11, 565574. Nakamura, K., Miyazawa, T., Ikeda, Y., Sato, E., Nishimura, Y., Nguyen, N.T., Takahashi, E., Mochizuki, M., Mikami, T., 2000. Contrastive prevalence of feline retrovirus infections between northern and southern Vietnam. J. Vet. Med. Sci. 62, 921-923. Neill, D.B., 2009. An empirical comparison of spatial scan statistics for outbreak detection. Int. J. Health Geogr. 8, 20. Norris, J.M., Bell, E.T., Hales, L., Toribio, J.A., White, J.D., Wigney, D.I., Baral, R.M., Malik, R., 2007. Prevalence of feline immunodeficiency virus infection in domesticated and feral cats in eastern Australia. J. Feline Med. Surg. 9, 300-308. Openshaw, S., 1983. The modifiable areal unit problem. CATMOG - Concepts and Techniques in Modern Geography. Geo Books, Norwich. Pfeiffer, D., Robinson, T., Stevenson, M., Stevens, K.B., Rogers, D.J., Clements, A.C., 2008. Spatial analysis in epidemiology. Oxford University Press, New York. R Development Core Team, 2011. R: A language and environment for statistical computing. R Foundation for Statistical Computing, Vienna, Austria. ISBN 3900051-07-0. 110 Ratcliffe, J.H., McCullagh, M.J., 1999. Hotbeds of crime and the search for spatial accuracy. J. Geogr. Syst. 1, 385-398. Richardson, S., Monfort, C., 2000. Ecological Correlation Studies. In: Paul Elliott, J.W., Nicola Best, David Briggs (Ed.), Spatial Epidemiology: methods and applications. Oxford University Press, Oxford, pp. 205-220. Statistics Canada, 2006. Census Division (CD). http://www12.statcan.ca/censusrecensement/2006/ref/dict/geo008-eng.cfm. Stevenson, M., McClure, R., 2005. Use of ecological study designs for injury prevention. Injury Prev. 11, 2-4. Tango, T., 2010. Statistical methods for disease clustering. Springer, New York Waller, L.A., Gotway, C.A., 2004. Applied spatial statistics for public health data. WileyInterscience, Hoboken, New Jersey. Wong, D., 2008. The modifiable areal unit problem (MAUP). In: Fotheringham, A.S., Rogerson, P.A. (Eds.), The SAGE Handbook of Spatial Analysis. SAGE Publications Ltd., London, pp.105-123. Zhang, Z., Assunção, R., Kulldorff, M., 2010. Spatial scan statistics adjusted for multiple clusters. J. Probability Stat. 2010. 111 5.7. Tables and Figures Table 5.1a Descriptive characteristics of sampled cat population tested for FIV and FeLV infections in the US and Canada. Factors Testeda FIV Prevalence FeLV Prevalence positive (95% CI)b positive (95% CI)b Testing Site Veterinary Clinic 19314 674 3.5 (3.2-3.8) 617 3.2 (2.9-3.4) Shelter 9600 241 2.5 (2.2-2.8) 166 1.7 (1.5-2.0) Juvenile 15461 160 1.0 (0.9-1.2) 198 1.3 ( 1.1-1.5) Adult 13453 755 5.6 (5.2-6.0) 585 4.4 (4.0-4.7) Male Intact 8649 372 4.3 (3.9-4.8) 240 2.8 (2.4-3.1) Male Castrated 6027 299 5.0 (4.4-5.5) 198 3.3 (2.9-3.8) Female Intact 9211 139 1.5 (1.3-1.8) 198 2.2 (1.9- 2.5) Female Spayed 4987 102 2.1 (1.7-2.5) 144 2.9 (2.4-3.4) Unknown 40 3 7.5 (1.7-20.4) 3 7.5 (1.7-20.4) No 7142 99 1.4 (1.1-1.7) 136 1.9 (1.6-2.3) Yes 17968 708 3.9 (3.7-4.2) 565 3.1 (2.9-3.4) Unknown 3804 108 2.8 (2.3-3.4) 82 2.2 (1.7-2.7) Healthy 22311 507 2.3 (2.1- 2.5) 379 1.7 (1.5-1.9) Sick 6092 389 6.4 (5.8-7.0) 391 6.4 (5.8-7.1) Unknown 511 19 3.7 (2.3-5.7) 13 2.5 (1.4-4.3) Age Sex Outdoor Exposure Health Status a Total number of cats tested for FIV and FeLV infection. Cat were tested at the same time for both FIV and FeLV infection. b CI: Confidence intervals for seroprevalence estimates with α = 0.05. 112 Table 5.1b. Descriptive statistics of FIV and FeLV seroprevalence (%), number of positive cats (cases) and number of cats tested for state, county and postal code aggregation level. Infection FIV Aggregation Level State Characteristicsa Tested Tested Tested States Tested Tested 915 18.67 35.14 0-221 28914 590.08 903.01 8-5732 4 5 0-50 915 2.64 5.28 0-59 28914 83.57 125.81 1-958 4 7 0-100 915 1.43 1.78 0-26 28914 45.11 61.58 1-838 3 3 0-20 783 15.98 25.25 0-145 28914 590.08 903.01 8-5732 3 4 0-33 783 2.26 4.24 0-47 28914 83.57 125.81 1-958 3 6 0-100 783 1.22 2.12 0-19 28914 45.11 61.58 1-838 Seroprevalence Cases Tested a 0-13 Seroprevalence Cases Postal codes 2 Seroprevalence Cases County 3 Seroprevalence Cases FeLV Range Seroprevalence Cases Postal codes SDb Seroprevalence Cases County Mean Total The descriptive statistics for seroprevalence pertain to mean value among states, counties or postal codes. e.g. minimum and maximum seroprevalence for FIV among states is 0 and 13 respectively. bStandard Deviation 113 Table 5.2. Moran's I statistics based on empirical Bayesian smoothed seroprevalence of FIV and FeLV infections by spatial aggregation level. Infection Areal Unit I Ea Varb SDc P-value FIV Postal Code 0.09 -0.002 0.001 3.30 <0.01 County 0.15 -0.003 0.002 3.82 <0.01 State -0.06 -0.021 0.409 -0.37 0.66 Postal Code 0.12 -0.002 0.001 4.05 <0.01 County 0.15 -0.003 0.002 3.53 <0.01 State 0.00 -0.021 0.011 0.18 0.42 FeLV a Expected value of Moran's I under the null hypothesis of no spatial autocorrelation b Variance c Standard Deviation 114 Table 5.3a. Disease clusters as identified by the spatial scan test for FIV infections among cats in the US and Canada. Coordinatesa Radiusb Obsc Popd Expe Obs/Exp P-value 45.894, -73.425 0.00 118 1270 72.56 1.63 <0.01 1 41.615, -73.201 191.69 118 1191 69.26 1.70 <0.01 2 53.329, -114.075 0.00 33 462 13.46 2.45 <0.01 3 41.621, -83.653 641.51 345 9648 279.73 1.23 <0.01 4 28.515, -81.324 715.81 84 2545 52.83 1.59 <0.01 5 40.666, -105.461 1163.84 86 2336 52.41 1.64 <0.01 1 53.572, -114.046 0.00 25 25 0.70 35.54 <0.01 2 45.578, -73.800 147.14 127 1322 72.45 1.75 <0.01 3 41.650, -83.673 638.28 345 9625 274.98 1.25 <0.01 4 27.817, -82.6777 864.23 101 3085 65.73 1.54 <0.01 5 40.595, -105.129 1123.52 84 2260 49.19 1.71 <0.01 6 40.105, -74.353 109.25 22 645 8.34 2.64 <0.01 Cluster State 1 County Postal code a Longitude and latitude coordinates of the center of cluster. c Observed number of ELISA positive cats. d Total number of cats in the cluster. e Expected number of ELISA positive cats under Poisson assumption 115 b Radius in kilometers. Table 5.3b. Disease clusters as identified by the spatial scan test for FeLV infections among cats in the US and Canada. Coordinatesa Radiusb Obsc Popd Expe Obs/Exp P-value 1 48.045, -54.689 1437.00 164 2827 93.48 1.75 <0.01 2 45.228,-93.998 637.96 78 1918 47.37 1.65 <0.01 3 34.341, -80.767 999.14 272 10089 209.11 1.30 <0.01 1 48.785, -55.986 1381.90 162 2789 90.83 1.78 <0.01 2 47.109, -94.917 660.90 81 1697 43.05 1.87 <0.01 3 34.841, -79.480 932.22 275 9791 209.66 1.31 <0.01 1 48.949, -55.634 1403.07 150 2337 75.66 1.98 <0.01 2 46.948, -94.824 545.70 64 1169 31.03 2.06 <0.01 3 34.767, -79.452 936.10 274 9680 206.15 1.30 <0.01 Cluster State County Postal code a Longitude and latitude coordinates of the center of cluster. b Radius in kilometers. c Observed number of ELISA positive cats. d Total number of cats in the cluster. e Expected number of ELISA positive cats under Poisson assumption 116 Table 5.4a. Results from multivariable spatial Poisson regression modeling of potential risk factors for FeLV infection at three spatial aggregation levels. Postal Code PRa (95 % CI) % Juvenile <= 50 > 50 % Female Intact <= 50 >50 % Male Intact <= 50 > 50 % Indoors <= 50 > 50 % Healthy <= 50 > 50 % Tested at Clinics <= 50 > 50 Ref 0.66 (0.52-0.84) Ref 1.25 (0.97-1.61) Ref 1.05 (0.82-1.35) Ref 0.62 (0.48-0.81) Ref 0.99 (0.74-1.32) Ref 1.79 (1.34-2.39) County PRa (95 % CI) Pvalue <0.01 Ref 0.78 (0.65-0.94) 0.09 Ref 1.18 (0.96-1.45) 0.69 Ref 0.88 (0.72-1.07) <0.01 Ref 0.8 (0.63-1.02) 0.93 Ref 1.07 (0.82-1.4) <0.01 Ref 1.26 (1.04-1.54) Pvalue State PRa ( 95 %CI) Pvalue <0.01 Ref 0.74 (0.5-1.08) 0.13 0.12 Ref 0.63 (0.36-1.09) 0.10 0.19 Ref 2.06 (1.12-3.77) <0.05 0.07 - - 0.63 - - Ref 1.29 (0.86-1.92) 0.22 0.02 FIV seroprevalence < 3.0 3.0-8.0 Ref Ref Ref 1.42 <0.01 1.17 0.08 1.11 0.55 (1.12-1.80) (0.98-1.4) (0.78-1.57) >8.0 2.44 <0.01 2.4 <0.01 2.6 <0.05 (1.80-3.33) (1.87-3.09) (1.27-5.32) Intercept: -4.86, -3.86, -3.99 for postal code, county and state level respectively with a p value of <0.01. a Rate/risk ratios are interpreted as prevalence ratios. 117 Table 5.4b. Results from multivariable spatial Poisson regression modeling of potential risk factors for FIV infection at three spatial aggregation levels. Postal PRa (95 % CI) % Juvenile <= 50 > 50 % Female Intact <= 50 >50 % Male Intact <= 50 > 50 % Indoors <= 50 > 50 % Healthy <= 50 > 50 % Tested at Clinics <= 50 > 50 Ref 0.76 (0.56-1.02) Ref 0.73 (0.53-0.99) Ref 0.98 (0.71-1.34) Ref 1.03 (0.72-1.48) Ref 1.08 (0.73-1.60) Ref 1.03 (0.77-1.39) Pvalue County PR (95 % CI) 0.07 Ref 0.91 (0.71-1.16) 0.04 Ref 0.77 (0.59-1) 0.89 Ref 1.01 (0.78-1.3) 0.87 Ref 0.85 (0.58-1.24) 0.70 Ref 0.85 (0.61-1.2) 0.84 Ref 1.46 (1.13-1.89) FeLV seroprevalence < 3.0 3.0-8.0 Pvalue State PR ( 95 %CI) Pvalue 0.44 Ref 0.83 (0.57-1.21) 0.35 0.05 Ref 0.94 (0.55-1.62) 0.83 0.96 Ref 0.88 (0.48-1.59) 0.67 0.39 - - 0.36 - - Ref 1.23 (0.85-1.76) 0.28 <0.01 Ref Ref Ref 1.57 <0.01 1.29 0.04 1.18 0.38 (1.17-2.11) (1.02-1.63) (0.82-1.69) >8.0 2.30 <0.01 2.01 <0.01 5.19 0.04 (1.60-3.29) (1.44-2.81) (1.16-23.25) Intercept: -3.40, -3.30, -3.39 for postal code, county and state level respectively (P <0.01). 118 Figure 5.1 (a-c). Spatial clusters of FIV infections (red circles) identified by the spatial scan test at postal code, county and state level aggregations. Arrows indicate clusters hidden by the black open circles that represent region centroids. a) Clusters at postal code level aggregation b) Clusters at county level aggregation c) Cluster at state level aggregation. Figure 5.1a 119 Figure 5.1b 120 Figure 5.1c 121 Figure 5.2 (a-c). Spatial clusters of FeLV infections (red circles) identified by the spatial scan test at postal code, county and state level aggregations. Black open circles represent region centroids. a) Clusters at postal code level aggregation b) Clusters at county level aggregation c) Cluster at state level aggregation. Figure 5.2a 122 Figure 5.2b 123 Figure 5.2c 124 CHAPTER 6: Discussion, Limitations, Further Research and Conclusions 6.1 General discussion Despite decades of research since the discovery of FIV and FeLV much remains unknown about their epidemiology. While FIV and FeLV infections have been reported to vary geographically and temporally, these patterns have not been studied using standard spatial and time series methods. The main goal of this thesis was to understand the temporal and spatial epidemiology of cats naturally infected with FIV and FeLV. Additionally, the relative importance of factors influencing seropositivity for FIV and FeLV were compared. The first objective of this thesis was to describe the geographical distribution and detect high-risk areas of FIV and FeLV infections relative to each other (Chapter 2). The second objective was to assess the relative importance of known risk factors between the FIV and FeLV infections using the case-case study approach (Chapter 3). The third objective was to explore and describe temporal patterns in FIV and FeLV infections, and to investigate known risk factors and potentially time-varying trends (Chapter 4). The fourth objective was to assess the effect of the MAUP on spatial Poisson regression models examining the association of seroprevalence of FIV and FeLV with ecological risk factors (Chapter 5). In Chapter 2, the geographical distribution of FIV and FeLV infections in the US was explored using choropleth mapping and the spatial scan test to find areas of relative excess of one infection over the other. Since it is reported that both infections share similar risk factors, it was assumed that the occurrence of both infections relative to each other would be more or less uniform throughout the US. Contrary to this assumption, FeLV infections were more common in western regions and FIV infections in eastern regions. 125 This suggests that these regional differences are driven by some spatially varying factors that may influence one infection over the other. In the literature pertaining to FIV and FeLV epidemiology, differences in tested population characteristics have been suggested as possible driving factors for regional differences worldwide (Nakamura et al., 2000; Gleich et al., 2009). A lack of data on population characteristics did not allow to control for these factors in this thesis, however based on findings from Chapter 3, it would be expected that cat populations in areas with an excess of FIV would tend to have proportionately greater number of older cats, that are male and have access to outdoors. However, it is important to note that previous studies have found regional differences to remain, even after adjusting for population characteristics such as age, sex, health status, outdoor exposure and sampled population type (e.g., shelters versus owned cats). Consequently, unknown factors that vary spatially may explain the observed geographic variation (Levy et al., 2006; Little et al., 2009). Factors that have been speculated as possible reasons for geographical differences in relative excess of one infection over the other include contextual factors such as owner’s socioeconomic status, regional variations in vaccine efficacy, and geographical variation in FIV viral clades and related differences in pathogenicity. In Chapter 3, the relative importance of known risk factors of seropositivity for FIV and FeLV were compared. This study employed a multilevel case-case study design for comparison of FIV and FeLV infections. Cats that were adult, male, and/or outdoor cats were more likely to be seropositive for FIV compared to FeLV when compared to juvenile, female and/or cats kept exclusively indoors. Neuter status was not significantly different between these infections. Furthermore, whether cats were tested at clinics or shelters was not different for these infections. Sick cats were more likely to be positive for FeLV 126 compared to FIV. These findings suggest that adulthood, being male (neutered or not) and having access to outdoors have a greater effect on FIV seropositivity, while clinical disease was a stronger predictor for FeLV. Although temporal trends in FeLV and FIV seroprevalence have been discussed in the literature, no discernible trends over time either for FeLV or FIV seroprevalence were detected in the AHL data (Chapter 4). FeLV seroprevalence was repeatedly reported to have declined in recent decades which has been attributed to test and removal programs at breeding facilities, testing before adoption, and the widespread use of preventive vaccination (Levy et al., 2008; Gleich et al., 2009; Hosie et al., 2009). However, this study did not find any evidence of (linear or quadratic) temporal trends in the seroprevalence of FIV nor FeLV in cats tested at the AHL over 14 years. The effect of FeLV vaccine introduction on seroprevalence of FeLV was not assessed because FeLV vaccines have been available in Canada before the study period started. However, the introduction of a FIV vaccine did not have an effect on either increasing or decreasing the seroprevalence. The use of aggregated or group level data has become common in veterinary epidemiology involving spatial analysis without much focus on sensitivity of results to choice of boundaries or grouping/aggregation scale. In Chapter 5, it was demonstrated that commonly used spatial epidemiological methods (Moran's I, spatial scan test and spatial regression modeling) were sensitive to the choice of the spatial aggregation scale (i.e., state, county, postal code levels) for analysis (i.e., are affected by the MAUP). The Moran’s I coefficient indicated clustering of FIV and FeLV positive test results. However, the strength and significance of clustering varied across aggregation levels. Spatial clusters detected by the spatial scan test also differed in size, number and location for both FIV and 127 FeLV infections according to aggregation level. Similarly, in spatial regression models, the scale of spatial aggregation governed the significance and magnitude of associations between FIV or FeLV infection and respective predictor variables. This study demonstrated that inference from spatial epidemiological studies dealing with aggregated data could potentially be affected by the MAUP. The MAUP can result in overlooking or conversely overstating the effect of risk factors as well as influence statistics designed to test for clustering and clusters. In the present study of FIV and FeLV seroprevalence among cats across the US and Canada, it was found that disease clusters may become unidentifiable when data are aggregated from a smaller scale such as postal code to a larger one such as state level. 6.2 Limitations This study set out with a goal to use comprehensive data on cat populations to gather information on spatial and temporal variability in the distribution of FIV and FeLV infections in large cat populations in the US and Canada. Ascertaining the prevalence of FIV and FeLV in national cat populations is difficult as diagnostic testing is voluntary and results are not collected into a central database. In addition, the lack of any national registry of veterinary clinics, animal shelters, or pet owners precludes selection of a 2-stage random sample of cats for testing that is representative of the population as a whole (Levy et al., 2006). Therefore, large datasets (which may not be necessarily representative) comprising over 30,000 owned, shelter and feral cats from 40 US states and 10 provinces of Canada were used. The data used in this study comes from two sources, the IDEXX laboratories and the AHL at the OVC. Therefore, the observed geographic and temporal variability in 128 infections could be reflective of diagnostic submissions to these sources and make the generalization to target populations difficult. The use of the case-case study methodology allowed comparison of the relative importance of known risk factors for FIV and FeLV. However, the relative importance of neutering/spaying on these infections as reported previously in the literature could not be investigated here. Because the case-case study design cannot identify risk factors that are common to both cases and control cases, spay/neuter was interpreted as being common to both infections based on literature but this could not be investigated in this thesis. While studying the proportional morbidity ratio (Chapter 2) allowed for the comparison of geographic variation in the relative excess of FIV to FeLV, “true” clusters of FIV and FeLV infections (that would locate areas of high-risk) could not be identified. Further, because the study was focused at the state level, it precluded finding small clusters that may be driven by local factors and therefore more relevant to veterinary practitioners. Although it is unknown if FIV vaccine use is widespread in Canada, no effect of FIV vaccine introduction on seroprevalence was found in the time series study (Chapter 4). It is inconclusive if this was due to an “ineffective” vaccine itself, due to lack of recommended use by the veterinary practitioners or due to lack of uptake by the cat owners. Knowledge of vaccine sale volume would have allowed for the control of vaccine uptake in the cat population. This study is based on prevalence data from cross-sectional surveys and it is problematic to assess new risk factors of infection using prevalence data. In studies using prevalence data to assess the relationship between a disease and time variant exposure, it is challenging to ascertain whether exposure occurred before the outcome or after. Further, it 129 is difficult to assess whether the exposure is related to persistence of disease or leads to acquiring the disease. However, only confirmed risk factors as established in the literature have been investigated here. 6.3 Future research directions The results of this study have generated several ideas for future research in FIV and FeLV epidemiology. Firstly, spatial variability in the occurrence of FIV compared to FeLV infections was identified. Therefore, future research should focus on evaluating the underlying factors driving this variability. For example, putative risk factors can be incorporated to evaluate any residual variation in risk. Additionally, standardized or population adjusted maps of individual disease evaluating spatial variability in disease risk could be beneficial. Since FIV and FeLV are not treatable, prevention and control is the most important way to manage these infections and reduce the prevalence of the disease in susceptible populations. Disease mapping can be used to visualize variations in disease prevalence and locate high-risk areas that can be used by veterinarians to advocate preventive practices to control these infections. Disease mapping has a long history in epidemiology and has been used to explain geographical variation in risk in order to suggest possible but yet unknown risk factors as well as to provide estimates of risk in specific areas and to help reasonably allocate public health resources (Waller and Gotway, 2004; Pfeiffer et al., 2008) Secondly, current literature on molecular epidemiology of FIV indicates geographic variation in the distribution of FIV subtypes (i.e., it is geographically clustered) (Reggeti and Bienzle, 2004; Weaver, 2010; Bęczkowski et al., 2014). For instance, Clade A is 130 prevalent on the west coast of US while Clade B is more prevalent in the east. Although discovered in 1986 (Pedersen et al., 1987), FIV has been documented to be present in domestic cats since 1966 (Sellon and Hartmann, 2006). Despite extensive movement of humans and cats over decades that allows introduction/mixing of infected cats, some serotypes are inherently predominant in certain regions. While the reasons for clustering are not clear and most molecular studies are based on relatively small samples (e.g., 36 FIV isolates from infected domestic and feral cats in eight US cities in Weaver, 2010), using larger samples, disease mapping and cluster analysis can contribute to a better understanding of this geographic variability in the distribution of serotypes. Further, the case-case approach can be used to investigate serotype specific risk factors for infections with FIV. The case-case study methodology can be employed to evaluate serotype information and differences among them with respect to related risk factors of infection such as age, sex, neuter status, outdoor exposure as well as contextual factors related to a cat’s location (e.g., cat density). Thirdly, given that MAUP can potentially affect epidemiological studies with aggregated data, the scale choice should be well defined a priori and support the research question at hand. For instance, for mapping FIV/FeLV disease risk for cat owners, the most pertinent scale of choice would be the catchment area of the clinics, because clinics promote preventive measures based on the perceived risk in the population served by each clinic. Further, more sensitivity analyses could be carried out based on pertinent zones or aggregation scales that serve as a natural boundary of cat populations. For example, “natural” zones based on feral cat colony ranges could be used rather than zones based on human inhabitance (dissemination blocks). 131 Fourthly, although analyses evaluating the temporal trends of infection with FIV and FeLV did not reveal expected temporal trends, the data were fairly suitable for time series methods; regularly collected for 14 years from a population served by clinics that were regular clients of the AHL. However, both infections were rare and cats tested at submitting clinics such as the OVC may not be reflective of general cat population. Thus these data may not reflect the true temporal variability in disease, and the generalizability may be limited. With advances in technology as well as advances in veterinary medicine, fairly large population datasets on feline health have become available though private diagnostic laboratories and multisite pet hospitals. Such datasets provide an opportunity not only to explore variability in infection patterns over time but also to investigate the effect of preventative interventions on the burden of infection in population over time. 6.4 Conclusions While similar risk factors have been reported for both FIV and FeLV infections, this thesis demonstrated, through comparison of one infection with the other, that distinct highrisk areas of FIV and FeLV infections exist. Further, it was evident that some risk factors are of greater importance to one infection over the other. The assertion that FeLV prevalence has declined compared to FIV needs to be further investigated as no significant changes in monthly seroprevalence of FIV and FeLV were found and no effect of vaccine introduction was observed among cats tested at the AHL during 1999 through 2012. Finally, when using aggregated data for spatial analysis, the MAUP mask or exaggerate the effect of risk factors as well as influence statistics designed to test for clustering and 132 clusters. Therefore, it is of utmost importance that investigators define the appropriate scale for data collection and analysis with respect to their research questions. 6.5 References Bęczkowski, P.M., Hughes, J., Biek, R., Litster, A., Willett, B.J., Hosie, M.J., 2014. Feline immunodeficiency virus (FIV) env recombinants are common in natural infections. Retrovirology 11, 80. Gleich, S.E., Krieger, S., Hartmann, K., 2009. Prevalence of feline immunodeficiency virus and feline leukaemia virus among client-owned cats and risk factors for infection in Germany. J. Feline Med. Surg. 11, 985-992. Hosie, M.J., Addie, D., Belak, S., Boucraut-Baralon, C., Egberink, H., Frymus, T., Gruffydd-Jones, T., Hartmann, K., Lloret, A., Lutz, H., Marsilio, F., Pennisi, M.G., Radford, A.D., Thiry, E., Truyen, U., Horzinek, M.C., 2009. Feline immunodeficiency. ABCD guidelines on prevention and management. J. Feline Med. Surg. 11, 575-584. Levy, J., Crawford, C., Hartmann, K., Hofmann-Lehmann, R., Little, S., Sundahl, E., Thayer, V., 2008. 2008 American Association of Feline Practitioners' feline retrovirus management guidelines. J. Feline Med. Surg.10, 300-316. Levy, J.K., Scott, H.M., Lachtara, J.L., Crawford, P.C., 2006. Seroprevalence of feline leukemia virus and feline immunodeficiency virus infection among cats in North America and risk factors for seropositivity. J. Am. Vet. Med. Assoc. 228, 371-376. 133 Nakamura, K., Miyazawa, T., Ikeda, Y., Sato, E., Nishimura, Y., Nguyen, N.T., Takahashi, E., Mochizuki, M., Mikami, T., 2000. Contrastive prevalence of feline retrovirus infections between northern and southern Vietnam. J. Vet. Med. Sci. 62, 921-923. Pedersen, N.C., Ho, E.W., Brown, M.L., Yamamoto, J.K., 1987. Isolation of a Tlymphotropic virus from domestic cats with an immunodeficiency-like syndrome. Science 235, 790-793. Pfeiffer, D., Robinson, T., Stevenson, M., Stevens, K.B., Rogers, D.J., Clements, A.C., 2008. Spatial Analysis in Epidemiology. Oxford University Press, New York. Reggeti, F., Bienzle, D., 2004. Feline immunodeficiency virus subtypes A, B and C and intersubtype recombinants in Ontario, Canada. J. Gen. Virol. 85, 1843-1852. Sellon, R.K., Hartmann, K., 2006. Feline Immunodeficiency Virus Infection. In: Greene, C. (Ed.), Infectious diseases of the dog and cat (3rd edn). Elsevier, Philadelphia, 131142. Waller, L.A., Gotway, C.A., 2004. Applied Spatial Statistics for Public Health Data. WileyInterscience, Hoboken, NJ. Weaver, E.A., 2010. A detailed phylogenetic analysis of FIV in the United States. PLoS One 5, e12004. 134


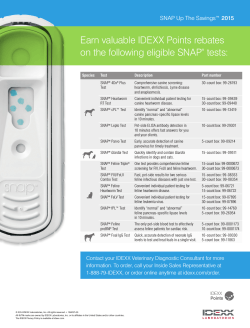


© Copyright 2026