
Temporary Service Interruption
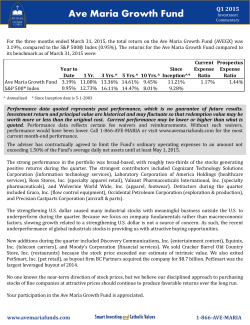
PROFILE BUILDER - EQUITY
CAPITAL MARKETS
Efficient profile and report generation based on the
industry-leading BD database
OVERVIEW
USER-FRIENDLY and versatile screening workflow
COMPREHENSIVE global ownership data, contacts and biographical content from the Bigdough database
CUSTOMIZED templates including multiple display options and client branding
FLEXIBLE output options - PDF, Excel, Word or PPT
Three easy steps to produce a profile
Capital World Investors (U.S.)
STEP 1
Research Associate
+1 213-486-9200
Greenfield is a research associate at Capital World Investors (U.S.). She joined the
firm in December 2011.
Chemicals, Computer Software and Services,
Insurance, Technology Hardware and Equipment
United States
Market Cap
Large Cap, Mega Cap, Mid Cap, Small Cap
Mr. David Carpenter
Analyst
Select investor and/or contact from our
comprehensive database.
Country/Region
United States, Europe
Market Cap
Large Cap, Mega Cap
Style
Value
60,317
Large Cap ($10 bb to $50 bb)
189,146
Mega Cap (>$50 bb)
220,537
Not Classified
3,026
Investment Approach
Capital World Investors (U.S.) maintains a fairly balanced equity portfolio that spans all
sectors. The firm invests primarily in common stock, but also holds a significant amount
of ADR/GDR and preferred stocks. These equity holdings are primarily in the United
States, but CWI also manages many U.K. and Canadian assets, as well as equity in most
of Europe, the BRICs, Japan, Austrialia, and South Africa. The firm invests in all market
capitalizations, with roughly half of its portfolio in companies larger than $10 billion. The
research effort is bottom up, and focuses on identifying the difference between
underlying value and market value. CWI prefers stocks with: (a) sound balance sheets;
(b) undervalued assets; and, (c) reasonable valuation multiples relative to growth
potential. The investment process is typically initiated by analysts who pitch their ideas to
portfolio managers. Each manager independently makes decisions regarding the
purchase or sale of stocks in their portfolio. All portfolios are team-managed, with a lead
manager who assures the overall portfolio's compliance with set benchmarks. Portfolios
are divided into several parts, each managed by one manager, and one part managed by
a team of analysts. CWI likes to visit with corporate management, competitors,
suppliers, and customers before making investment decisions.
+1 213-486-9093
Breweries, Cigarettes and Other Tobacco Products,
Distillers and Wineries, Household Goods and
Equipment, Personal Products, Processed and
Packaged Foods, Soft Drinks Manufacturers
AMZN Ownership
Industry
Top 10 Peer Holdings
Home Depot, Inc.
Amazon.com, Inc.
Costco Wholesale Corporation
Express Scripts Holding Co.
Lowe's Companies, Inc.
CVS Caremark Corporation
Whole Foods Market, Inc.
Industry
STEP 3
One click to generate the full list of selected
investors into a PDF, Excel, Word or PPT
document.
© 2013 Ipreo
Val ($mm) Chg ($mm)
11,945
-790
7,242
-209
2,893
-155
1,592
-1
1,192
-87
1,002
-11
672
-17
633
-34
630
-37
592
59
Top 5 Buys
Company:
Five Below, Inc.
Fast Retailing Company, LTD
Tiffany & Company
Rakuten Inc.
Shoprite Holdings Ltd 6.5% C
Val ($mm) Chg ($mm)
161
118
108
103
557
79
592
59
63
57
Top 5 Sells
Company:
Home Depot, Inc.
CVS Caremark Corporation
Amazon.com, Inc.
Magnit OAO GDR
Costco Wholesale Corporatio
Val ($mm) Chg ($mm)
11,945
-790
339
-466
7,242
-209
376
-186
2,893
-155
Val ($mm)
% Port
11,945
7,242
2,893
1,592
633
339
147
2.50%
1.52%
0.61%
0.33%
0.13%
0.07%
0.03%
Top 10 Industry Holdings
Biotechnology and Pharmaceutic
Oil and Gas
Retail
Food, Beverage, and Tobacco
Financial Services
Banking
Computer Software and Services
Semiconductors
Industrial Equipment
Aerospace and Defense
Industry: Retail
Top 10 Holdings
Company:
Home Depot, Inc.
Amazon.com, Inc.
Costco Wholesale Corporatio
Express Scripts Holding Co.
Shoprite Holdings Ltd
Industria de Diseno Textil S.
The Swatch Group, LTD
Lowe's Companies, Inc.
Wal-Mart Stores, Inc.
Rakuten Inc.
Percent of Portfolio
4,064
Mid Cap ($2 bb to $10 bb)
Carpenter is a vice president and analyst with Capital World Investors, where he is
the lead analyst on the beverage industry. He is also on the firm's board of directors,
and he is on the board of directors for the homeless-serving non-profit, Los Angeles
Mission.
Carpenter earned a BA in Economics from the College of William and Mary and a MBA
in Finance from University of California, Los Angeles (UCLA).
Industry Coverage
255
32,955
276
-39,027
160
Small Cap ($250 mm to $2 bb)
She received a BA in Government and International Relations from Cornell University
('06) and an MBA in Finance from Columbia Business School, Columbia University
('10).
Country/Region
Val ($mm)
Micro Cap (< $250 mm)
Greenfield was previously an equity research associate at Credit Suisse (U.S.) (July
2010-November 2011). Prior to that, she was an account management analyst at
BlackRock (July 2006-July 2008). Greenfield was also a production intern at CNN
International (June 2003-August 2003).
Industry Coverage
# of Stocks Bought
Value Bought ($mm)
# of Stocks Sold
Value Sold ($mm)
477,251
Value
1,120
-6,072
Market Cap Breakdown
Tier
Bio:
Bio:
STEP 2
Portfolio Stats
Equity Assets ($mm)
Investment Style
# of Stocks Held
Net Chg Value ($mm)
Meeting Contact(s)
Ms. Nicole S. Greenfield
Select a template from the library of Ipreo
standard templates or your customised set of
templates.
New York
630 Fifth Ave., 36th Fl.
New York, New York 10111-0121
Tel: +1 212-649-1554
Fax: +1 212-582-7878
Val ($mm)
Chg ($mm)
% Port
47,147
47,038
34,555
32,850
26,245
25,023
24,021
22,677
20,868
18,473
-1,488
488
-2,011
-1,269
1,997
780
172
2,196
663
626
9.88%
9.86%
7.24%
6.88%
5.50%
5.24%
5.03%
4.75%
4.37%
3.87%
Chg ($mm)
2,196
1,997
1,138
780
740
% Port
4.75%
5.50%
1.13%
5.24%
2.61%
Top 5 Industry Increases
Industry
Semiconductors
Financial Services
Health Services
Banking
Consumer Non-Durables
Val ($mm)
22,677
26,245
5,386
25,023
12,468
Top 5 Industry Decreases
Industry
Insurance
Chemicals
Retail
Biotechnology and Pharmaceutic
Medical Equipment
Val ($mm)
15,397
14,959
34,555
47,147
7,602
Chg ($mm)
-2,571
-2,303
-2,011
-1,488
-1,355
% Port
3.23%
3.13%
7.24%
9.88%
1.59%
Filing Data as of 3/31/2013
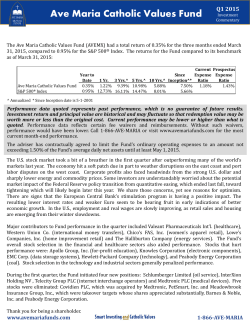
Sample profiles
Why Ipreo for profiles?
Lazard Asset Management, LLC (U.S.)
Analyst, Portfolio Manager
+1 212-632-6971
Hassan is a senior vice president, portfolio manager and an analyst at Lazard Asset
Management, LLC (U.S.). Previously, he was a corporate finance manager at SwicorpSigma (2004-2005). Prior to that, Hassan was a portfolio manager at the Swiss
Egyptian Portfolio Management Company (2000-2003). Before that, he was a senior
analyst at Concord International Investments after a brief stint as an investment
analyst with the International Finance Corporation. Prior to that, Hassan was an
associate at Concord International Investments (1995-1997).
Brazil, Chile, China, Colombia, Czech Republic, Egypt,
Hungary, India, Indonesia, Israel, Malaysia, Mexico,
Morocco, Peru, Philippines, Poland, Republic of Korea,
Russian Federation, South Africa, Taiwan Province of
China, Thailand, Turkey
Market Cap
Large Cap, Mega Cap, Mid Cap, Small Cap
Style
Growth
Mr. Christopher H. Blake
Portfolio Manager
Mid Cap
Value
Mid Cap ($2 bb to $10 bb)
19,665
Large Cap ($10 bb to $50 bb)
27,014
Mega Cap (>$50 bb)
18,551
95
LAM's research effort is bottom up and seeks stocks with: (a) low price-to-book values
relative to the industry and the market; (b) sustainability of attractive return on equity
and return on assets ratios; (c) low price-to-cash flow ratios relative to the industry and
the market; (d) catalysts to draw out underlying value (either financial or structural); (e)
sound balance sheets; (f) competitive market share; and, (g) quality management. The
firm uses a global database screen and accounting validation model to add to its global
fundamental research effort. LAM uses the Russell 2000 Index as its small-cap U.S.
1065and
Ave.the
of the Americas, 31st Fl.
Tel: +1 212-482-1600
Reported Equity Assets ($mm):
4,500.0
equity universe, the Russell Mid-Cap Index as its mid-cap U.S. equity universe,
New York, New York, 10018-2506
Fax: +1 212-480-9655
Institution Type:
Investment Advisor-Mutual Fund
S&P 500 Index as its large-cap U.S. equity universe. Funds and portfolios generally
consist of 50-80 positions and are all team managed. The Lazard European Opportunities
URL: http://www.adventcap.com/
Market Cap:
Multi Cap
and the Lazard Global Opportunities hedge funds use a long/short strategy of 120% long
Styles:
Specialty
and 80% short. The Lazard European Opportunities fund invests a minimum of 80% of
Overview
its portfolio in European equities and may invest up to 20% in non-European equities.
The Lazard Global Opportunities fund invests approximately 50% of its portfolio
in U.S.(ACM) manages equity and fixed-come hedge funds and mutual funds for institutions and high net worth clients. The firm was founded in 1995.
Advent Capital
equities, 35% in European equities, and 15% in Asia and emerging markets.
Advent Capital Management, LLC
+1 212-632-8272
Investment Approach
XOM Ownership
Industry
Industry
Industry: Oil and Gas
Company:
Val ($mm) Chg ($mm)
ConocoPhillips
1,018
13
Chevron Corporation
584
41
Apache Corporation
469
-20
Exxon Mobil Corporation
337
0
Occidental Petroleum Corpor
324
4
LUKoil (OAO) ADR
300
0
Ultrapar Participacoes SA PRF
276
-1
Spectra Energy Corporation
217
4
Anadarko Petroleum Corporat
178
6
Marathon Oil Corporation
170
3
Share Positions: FactSet Research Systems Inc.
Top 5 Buys
Company:
Schlumberger, LTD
Noble Corporation
Chevron Corporation
Valero Energy Corporation
Devon Energy Corporation
Val ($mm) Chg ($mm)
69
66
50
48
584
41
137
29
117
28
Val ($mm)
Top 5 Sells
Company:
Halliburton Company
Holly Corporation
Apache Corporation
Total Fina S.A. ADR
The Williams Companies, Inc.
Val ($mm) Chg ($mm)
79
-95
31
-31
469
-20
69
-14
52
-14
1,018
469
337
178
170
117
79
69
2
0
1.45%
0.67%
Odell Lambroza
0.48%
A. Hartswell
Woodson
0.25%
8,022
7,178
5,789
5,320
5,150
4,730
4,104
3,984
3,455
2,204
837
11.44%
511
10.24%
120
8.26%
325
7.59%
Region
60
7.34%
North America
376
6.74%
Europe
95
5.85%
Asia
21
5.68%
Africa
346
4.93%
C. America/Caribbean
311
3.14%
Contacts
Portfolio Manager
Portfolio Manager
+1 212-482-1600
+1 212-482-1600
0.24%
Market Cap Breakdown
0.17%
Tier
0.11%
Micro (< $250 mm)
0.10%
Small ($250 mm to $2 bb)
0.00%
Mid ($2 bb to $10 bb)
0.00%
Large ($10 bb to $50 bb)
Top 10 Industry Holdings Mega(>$50 bb)
Val ($mm) Chg ($mm)
% Port
N/A (Not Classified)
Banking
Financial Services
Oil and Gas
Metals and Mining
Computer Software and Services
Telecommunications
Food, Beverage, and Tobacco
Biotechnology and Pharmaceutic
Retail
Semiconductors
Industry
Banking
Financial Services
Telecommunications
Retail
Metals and Mining
Advent's research effort employs a four-step process that includes: (a) quantitative screening; (b) credit analysis to minimize downside risk; (c) fundamental analysis of a stock's earnings
momentum prospects; and, (d) portfolio monitoring. Overall, ACM prefers to invest in convertibles with: (a) cash flow momentum; (b) physical assets that can be used to provide credit
security; and, (c) experienced management. The firm's Convertible Strategy portfolio uses a buy and hold strategy to capture 75-85% of the appreciation potential of underlying stocks.
The Convertible Arbitrage hedge fund attempts to be market neutral by taking short positions in the underlying stocks, and uses leverage with a ratio of no more than 2:1. ACM's Phoenix
portfolio invests in ""busted"" or ""out of the money"" convertibles of which the underlying stock is temporarily depressed. The firm invests across all sectors with a typical portfolio holding
between 50 and 80 stocks. ACM's positions in public equity are mostly in preferred stock convertibles and occasionally the result of the maturation of associated convertibles.
% Port
Top 10 Peer Holdings
ConocoPhillips
Apache Corporation
Exxon Mobil Corporation
Anadarko Petroleum Corporation
Marathon Oil Corporation
Devon Energy Corporation
Halliburton Company
Schlumberger, LTD
EOG Resources, Inc.
Baker Hughes, Inc.
Top 10 Holdings
Percent of Portfolio
487
Investment Approach
He received his BSBA in Finance from the University of Denver.
United States
576
7,100
386
-3,526
4,317
Not Classified
Blake is a managing director and portfolio manager the U.S. mid-cap team at Lazard
Asset Management, LLC (U.S.), which he joined in 1995.
Style
Val ($mm)
Small Cap ($250 mm to $2 bb)
Bio:
Market Cap
# of Stocks Bought
Value Bought ($mm)
# of Stocks Sold
Value Sold ($mm)
Micro Cap (< $250 mm)
He holds a BA in Business Administration (magna cum laude) from American
University and an MS in International Securities, Investments and Banking. Hassan
earned the CFA designation in 1999.
Country/Region
70,129
Value
1,706
3,573
Market Cap Breakdown
Tier
Bio:
Country/Region
Portfolio Stats
Equity Assets ($mm)
Investment Style
# of Stocks Held
Net Chg Value ($mm)
Meeting Contact(s)
Mr. Mostafa Hassan CFA
Most user-friendly and versatile screening workflow
on the market
Best-of-breed data analytics
Industry-leading template creation process
Flexible display and branding options
New York
30 Rockefeller Plaza, 50th Fl.
New York, New York 10112-6300
Tel: +1 212-632-6971
Fax: +1 212-632-6969
Top 5 Industry Increases
Val ($mm)
8,022
7,178
4,730
3,455
5,320
Industry
Chg ($mm)
% Port
Financials
837
11.44%
Consumer
Goods
511
10.24%
Energy
376
6.74%
Basic
346Materials
4.93%
Utilities
325
7.59%
Technology
Mutual Fund
Advent/Claymore Global Convertible Securities & Income Fund
Advent/Claymore Convertible Securities & Income Fund
Advent/Claymore Enhanced Growth & Income Fund
Oyster SICAV - Global Convertibles
Insinger de Beaufort Umbrella Fund NV - Global Convertible Fd.
Ownership by Region
% Port
62.3%
29.0%
8.1%
0.5%
0.2%
Val
150.8
70.1
19.5
1.2
0.4
Val
34.7%
84.0
15.8%
38.3
12.9%
31.1
9.0%
21.8
8.4%
20.3
7.5%
Country
United States
France
Luxembourg
Hong Kong
Sweden
18.2
% Port
61.9%
13.5%
8.5%
4.9%
3.7%
Val
150.0
32.8
20.7
11.9
9.0
Chg
Mid Industry Holdings
Chg
Top 5 Industry Decreases
Industry
Materials and Construction
Consumer Durables
Construction Products
Conglomerates
Media
AUM
92.4
62.5
58.5
8.3
3.9
Ownership by Country
Chg
Macro Industry Holdings
% Port
[email protected]
[email protected]
Largest Mutual Funds Managed
Industry
% Port
Val
Financial Services
Automotive
Energy Services
Metals and Mining
Utilities
Banking
Oil and Gas
Consumer Non-Durables
Computer Software and Services
27.6%
11.2%
9.6%
8.9%
8.4%
4.8%
3.3%
3.1%
3.1%
66.8
27.2
23.2
21.6
20.3
11.7
7.9
7.6
7.5
Chg
Industrials
5.3%
12.9
Val ($mm) Chg ($mm)
Healthcare% Port
3.6%
8.6
1,452
-163
2.07%
Consumer
Services
3.0%
7.1
1,164
-139
1.66%
Focus Company: ExxonMobil Corporation
510
-102
0.73%
Largest Oil and Gas Holdings
102
-37
0.14%
Top Oil and Gas Sells
1,332
-26
1.90%
Company
Val
Chg
% Port Company:
Cameron International Corporation
5.0
1.4
2.1% Nabors Industries, Inc. SR NT CV 144A 11
Valero Energy Corporation
1.2
0
0.5% GMX Resource, Inc. SR NT CV 144A13
PetroBakken Energy, LTD CL A
0.6
-1.1
0.2% GMX Resource, Inc. SR NT CV 5%13
© 2009 Ipreo Holdings Group,
Filing Data as ofCorporation
12/31/2010
ExxonMobil
0.6
-0.6
0.2% Schlumberger, LTD DEB-B CV2.125%23
Subsea 7 Inc. 2.8% CNV BDS 06/06/11 USD
0.4
0
0.2% PetroBakken Energy, LTD CL A
Largest Holdings in United States
Company
Citigroup, Inc. COM STK T-DECS
NextEra Energy, Inc. CORP UNIT
Great Plains Energy Incorporated CORP UNIT
Synovus Financial Corporation TANG EQTY UTS
Legg Mason, Inc. CORP UNIT
Val
43.9
23.2
20.3
10.4
5.7
Val
0
0
0
0
0.6
Chg
-4.0
-3.0
-3.0
-1.4
-1.1
Val
5.0
Chg
1.4
Top Oil and Gas Buys
Chg
-0.1
-6.9
-0.1
10.4
-0.4
% Port Company:
18.1% Cameron International Corporation
9.6%
8.4%
4.3%
2.4%
Holdings in Peers/Comparables ($mm)
Company
ExxonMobil Corporation
Anadarko Petroleum Corporation
Apache Corporation
ConocoPhillips
Devon Energy Corporation
06/30
0.6
0.0
0.0
0.0
0.0
03/31
1.3
0.0
0.0
0.0
0.0
12/31
0.0
0.0
0.0
0.0
0.0
09/30
0.0
0.0
0.0
0.0
0.0
Notes
About Ipreo
Share Positions: FactSet Research Systems Inc.
Ipreo is a global leader in providing market intelligence, data, and
technology solutions to all participants in the global capital markets,
including sell-side banks, publicly traded companies, and buy-side
institutions. By combining state-of-the-art new issuance systems with
the premier global financial and investor data, Ipreo enables our capital
markets clients to execute deals more efficiently. Our applications
include end-to-end bookbuilding systems, roadshow & conference
management platforms, and electronic document delivery.
© 2010 Ipreo Holdings Group
Additionally, Ipreo’s suite of investor prospecting and CRM solutions
offers the most accurate and comprehensive institutional contacts data
and profiles in the industry. Ipreo is the only financial services provider
to offer solutions across all asset classes for the Equity, Fixed Income,
Municipal, and Syndicated Loan markets. Ipreo is private-equity held
by Blackstone and Goldman Sachs Merchant Banking Division with more
than 800 employees supporting clients in every major financial center
around the world.
Visit www.ipreo.com or call us at +1 (877) 588-5030


© Copyright 2026