
S T R
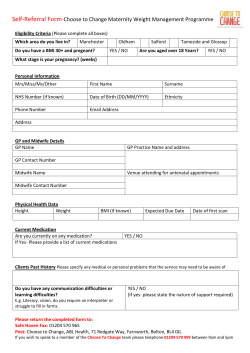
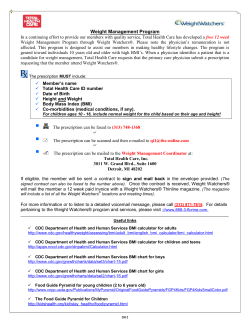
STRATEGIC PLAN 2009 - 2013
BERENDINA MICROFINANCE INSTITUTE
TABLE OF CONTENTS
ABBREVIATION: ................................................................................................................................................. 4
1.
2.
CURRENT SITUATION ............................................................................................................................... 5
1.1
COMPANY INFORMATION ........................................................................................................................... 5
1.2
MICROFINANCE METHODOLOGY ADOPTED BY BMI .................................................................................... 6
1.3
VISION AND MISSION ................................................................................................................................. 7
1.4
PRODUCTS AND SERVICES .......................................................................................................................... 7
STRATEGIC PLANNING METHODOLOGY .............................................................................................. 7
2.1
3.
SWOT A NALYSIS ...................................................................................................................................... 8
STRATEGIC GOAL & OBJECTIVES ........................................................................................................ 10
3.1
STRATEGIC GOAL FOR 2009-2013 ............................................................................................................ 10
3.2
STRATEGIC OBJECTIVES ........................................................................................................................... 11
STANDARD BRANCH MODEL ............................................................................................................................. 11
3.3
LEADERSHIP AND MANAGEMENT ............................................................................................................. 25
ANNEXURE 01: PRODUCTS AND SERVICES.......................................................................................................... 27
ANNEXURE 02: SELECTION OF INSURANCE PRODUCTS ...................................................................................... 28
ANNEXURE 03: LIST OF STEERING COMMITTEE MEMBERS .................................................................................. 30
ANNEXURE 04: THE STANDARD BRANCH PROJECTION MODEL ........................................................................... 31
ANNEXURE 05: PROJECTIONS FOR THE STANDARD BRANCH MODEL.................................................................... 32
LIST OF FIGURES
FIGURE 1: BMI OPERATING AREAS - 2008 ..................................................................................................... 10
FIGURE 2: PROPOSED BRANCH STRUCTURE FOR NEW BRANCHES ......................................................... 11
FIGURE 3: ACCUMULATIVE COST & INCOME .............................................................................................. 13
FIGURE 4: MONTHLY COST AND INCOME OF A BRANCH .......................................................................... 13
FIGURE 5: STRUCTURE FOR EMERGENCY LOANS ...................................................................................... 16
FIGURE 6: ORGANIZATIONAL STRUCTURE FOR 2009 ................................................................................. 26
FIGURE 7: CONCEPTUAL ORGANIZATIONAL STRUCTURE FOR 2013 ....................................................... 26
2
LIST OF TABLES
TABLE 1: BMI AT A GLANCE ...................................................................................................................... 5
TABLE 2: IMPORTANT ELEMENTS OF BMI CREDIT PLUS METHODOLOGY ....................................... 6
TABLE 3: SWOT ANALYSIS OF BMI ........................................................................................................... 8
TABLE 4: OUTREACH TARGETS FOR THE NEXT FIVE YEARS ............................................................ 12
TABLE 5: INITIAL PRODUCTS OFFERED BY A BRANCH ...................................................................... 12
TABLE 6: FUNDING REQUIREMENTS ...................................................................................................... 12
TABLE 7: EXPANSION STRATEGIES ........................................................................................................ 14
TABLE 8: STRATEGIES TO INCREASE THE EFFICIENCY ...................................................................... 15
TABLE 9: STRATEGIES TO ENSURE CLIENT RESPONSIVE TO PRODUCTS ........................................ 16
TABLE 10: STRATEGIES FOR STAFF RECRUITMENTS .......................................................................... 18
TABLE 11: STAFFING REQUIREMENT ..................................................................................................... 19
TABLE 12: STRATEGIES TO INCREASE THE PROFITABILITY .............................................................. 19
TABLE 13: STRATEGIES TO DEVELOP COOPERATIVE SOCIETIES ..................................................... 20
TABLE 14: STRATEGIES TO INCREASE EFFECTIVENESS AND SUSTAINABILITY OF EDS .............. 21
TABLE 15: STRATEGIES TO INCREASE FUND RAISING ........................................................................ 23
TABLE 16: STRATEGIES TO IMPROVE CO-OPERATE AND INTERNATIONAL IMAGE AND
LINKAGES ................................................................................................................................................... 24
3
Abbreviation:
AAO
Account & Administrative Officer
AM
Area Manager
BDS
Berendina Development Services
BM
Branch Manager
BMI
Berendina Microfinance Institute
Bu
Bulathkohupitiya Branch
EDO
Enterprise Development Officer
EDS
Enterprise Development Service
Gi
Ginigathhena Branch
GN
Grama Niladhari
MFO
Microfinance Officer
NDTF
National Development Trust Fund
PAR
Portfolio At Risk
ProMis
Promotion of Microfinance Sector Project
Th
Thirappane Branch
YA
Yatiyanthota Branch
4
1. Current situation
1.1 Company information
Berendina Microfinance Institute (BMI) was established in May 2007. It is a non profit
company registered in Sri Lanka with registration number N (PBG) 271 under Companies
Act number 7 of 2007 as a company limited by guarantee in Sri Lanka. The legal name of
the company is Berendina Microfinance Institute (Guarantee) Limited. BMI has 3 board
members who are leading microfinance and development related practitioners in Sri
Lanka and abroad. The BMI general body has 4 Dutch Nationals in addition to the 3 Sri
Lankan directors.
BMI is the microfinance organisation of Berendina Group in Sri Lanka. Berendina Group
has another organization ‘Berendina Development Services (BDS) for social development
work. Both BMI and BDS was restructured from the operations of Berendina Foundation
(Berendina Stichting) which was a international NGO operated in Sri Lanka since 1992
having head quarters in the Netherlands. Berendina Foundation implemented credit as
well as other social and economic development programs, now these activities are
continued under BMI and BDS separately. BMI operation commenced in May 2007 and
thus the organization is one and half years old. The performances of BMI as of 30th
November 2008 is given in the table No 1 bellow.
Table 1: BMI at a glance
No
Outreach
Indicator
1
No of districts covered
2
No of divisions covered
3
No of Branches
4
No of Clusters
5
No of borrowers
Portfolio and Efficiency
6
Outstanding loan balance (Rs m)
7
Portfolio at Risk (1 day)
8
No of staff
9
Case load (No of loans per MFO)
Sustainability
10
Operational Self Sufficiency
Poverty Focus (GNP per capita is (US $ 1,600 )
11
Average loan size Rs
12
Family income levels of borrowers Rs/month
2008 – November 30th
3
4
4
452
11,460 (including 556 BF loans)
163 (US $ 1.56 million) including Rs 10 m in BF portfolio
0.1%
34
727
123%
22,000 (US $ 208)
13% of GNP per capita
>15,000
52%
7,500 – 15,000
45%
<7,500
3%
Income of 50% of borrowers is less than 9% GNP per capita
5
1.2 Microfinance Methodology adopted by BMI
The first and foremost activity of BMI was designing the microfinance methodology
in a comprehensive manner and the development of a standard operational manual.
This initial work had to be done between February to April 2007 before
commencement of BMI operation in May 2007. There are number of changes in
microfinance methodology adopted by BMI compared to BF, where increased
outreach, poverty focus, efficiency, effectiveness and sustainability were targeted as a
best practice approach The 10 most salient features in the approach and methodology
are as follows.
Table 2: Important elements of BMI credit plus methodology
No
1
2
Feature
Cover the whole village
3
Less in number but frequent and
effective client meetings
Quick loan disbursement
4
Low interest rate
5
Increased efficiency in the
operation
Structured standard
methodology
6
7
Zero tolerance on delinquency
8
Operationally profitable
9
Cost effective and demand
driven EDS
10
100% collateral free loans
Description
Each microfinance officer is given maximum only 7 Grama Niladhari (GN) divisions
to have minimum 600 clients. Minimum average is 100 clients from each GN
Clients are met at a Cluster which has 30 borrowers maximum. They meet for 1
hour for each month. The clients have access to MFO fortnightly in the village.
Loans are disbursed within 7 days of the application. Usually it is 3-4 days.
Emergency loans disbursement as and when needed through an agent in the
village. The other MFIs usually take more than 2 weeks.
As a poverty focused approach BMI provides loans at the lowest interest rate in
the market. BMI rate is only 10% where as the interest rates charged by
competitors such as Lakjaya is 20%, SEEDS 15% and Ceylinco Grameen 24%.
Each MFO should have minimum 600 clients. The present average is 727.
The operation is standard as specified in the operational manual. This includes
client handling, documentation, disbarment, recovery and monitoring follow up
etc.
BMI achieve 0.1% PAR. BMI will never tolerate delinquency while clients’ genuine
issues are understood and responded.
BMI operation is profitable since the completion of its first year. However due to
low interest rate charged BMI will 10 months to reach 100% OSS and 16 months to
reach break even.
BMI adopts credit plus approach. Each branch office has an officer to provide
business advice to clients. A coupon system linked to credit is in operation to
increase clients’ capacity to pay for the services.
BMI does not take even savings as a collateral for loans as done in many MFIs.
6
1.3 Vision and mission
Vision
Create an empowered, equitable society
wh ere poverty do es not exist
Mission
BMI mission is en suring that p oor h as access to qu ality
microfinance and EDS services at the lowest possible
p rice resu lting in p rogressive future for them.
1.4 Products and services
BMI offer Loan Products and Enterprise Development Services (EDS) only. The common
name used for EDS is Business Development Services (BDS) but BMI use the EDS to
avoid confusion with its sister Company ‘BDS’. There are 10 loan products offered which
are client driven. In addition BMI has done an initial assessment to offer an insurance
product which is a major requirement of clients. The list of products BMI offer is given in
the annexure 01.
2. Strategic planning methodology
The strategic plan 2009 – 2013 for BMI started with the strategic planning process map.
The process map traverses a set of phases and identifies areas as follows.
•
Appoint of a strategic planning committee
A team of 17 staff and board members and external consultants were identified as
the strategic planning committee for BMI. The list is given in annexure 03.
•
Series of workshops
The team (board and staff) had several workshops to discuss and generate
strategies for the five years 2009-2013 under the guidance and facilitation by the
board.
From the inception in May, 2007 BMI use the team concept as much as possible and
decisions were made by the management with the consideration of staff ideas and views.
This team approach to plan and make decisions has helped BMI to forge ahead well. BMI
was able to increase the outreach, efficiency and impact to the satisfaction of all the stake
7
holders so far and at some point the performances are more than what were expected. But
there is a room for further improvement. This strategic plan is a result of the team work
of the staff where BMI used its own experiences; learn from the others and also the
experience gains from the exposure visit to BRAC, ASA and Grameen Bank in
Bangladesh and the best practices learnt.
2.1 SWOT Analysis
Strengths, weaknesses and opportunities and threats of BMI was analysed and results are
given bellow.
Table 3: SWOT Analysis of BMI
Strengths
Weaknesses
• Leadership comprising of specialists
• Inability to mobilize savings
• Experienced and skilled staff
• Inadequate access to loan funds
• Documented standard operational manual
• High PAR of loans issued under Berendina Foundation
• Having a Eusiness Development (ED) section and
• High cost of operations
sustainable ED approach (coupons)
• Inadequate mechanism for staff appraisal
• Sufficient transport facilities for field staff
• Inadequacies in utilization of co-operative methodology
• Linkages with external organizations
(savings are not utilized for on lending)
• Registration under Government as a Microfinance
• Working environment of the branch offices is not
Company
adequate
• Staff capacity development / Training programmes to
• Inadequate internal audit system
update the knowledge
• Insufficient promotion and marketing of BMI as an MFI
• Team work
• Limitations in lending mechanism – less flexibility for
• Social development activities (BDS company)
loan settlement
• Well maintained loan tracking and other information
• Insufficient interest income to reach FSS (even OSS
management systems
within a shorter period)
• Awareness of the international standards and usage of
• Liquidity issues arising from the longer term loans such
indicators
3 years.
• Incentive system for the staff
• Monitoring is not 100% coverage
• Funding and professional inputs from Berendina Stichting
• Take more time to implement the decisions
• Have several loan products
• Quick book accounting system is not up to date
• Bottom up approach of sharing information and
• Opening a branch is not standard: (Thirappane did not
communication – staff involvement for the development of
commence as a BMI branch)
organization.
• Weak fund management (Idling funds)
• Low PAR
• Weak documentation of out comes and impacts. (
• Being a part of a respected NGO in the area (Positive
inadequate impact monitoring system)
Image of Berendina)
• EDS coupon market is not tapped adequately by ED staff
8
Opportunities
• Existing untapped market
• There is no good competitors
• Competitors charging higher interest rates
• External organizations provide funding, technical services
like NDTF and ProMiS
• Can reduce the operational cost due to operating mainly
in rural area
• Clients attitudes – positive thinking
• Has the backing of Berendina Stichting a reliable
donor/support agency
• Berendina Development Services works with same clients
on other aspects of poverty alleviation
• The goodwill of Berendina Group
• Sufficient infrastructure for the microfinance operations
Threats
• Customers attitudes about the MFI operations is still
based on the BF operations in old areas
• BMI is treated as another NGO by stake holders
• Natural disasters such as floods, draughts
• Recession of the economy/tea industry
• Influence of government organizations such as state
banks & government projects which gives loans for very
low interest rates though they are limited in numbers• There are organizations provides ED freely
• Lack of government regulations for microfinance
• Estates are under the influence of a third party estate
management.
• Clients borrow from multiple organizations
• Inflation
The strategic goal was derived through a brainstorming discussion of the strategic
planning committee. To derive the strategic objectives the strategic goal and the SWOT
analysis is used. From the SWOT analysis the current weaknesses of the organization is
identified and from the goal, the future of the organization was determined. The strategic
changes for these two statuses were identified and taken to derive the strategic objectives
for next five years.
9
3. Strategic Goal & Objectives
3.1 Strategic Goal for 2009-2013
Red uce poverty amongst our beneficiaries who will co mprise o f a minimum of 20 %
minority commu nities and 70% wo men. We will reach the hard core poo r too in a
financially sustainab le manner with an o verall 6 0% annual growth rate wo rking in at least
8 districts in Sri Lanka. The 60 average annual growth over five years will be achieved
with higher gro wth rates such as 150% in 2009 and declining gro wth rates in t he other 4
years.
Figure 1: BMI operating areas - 2008
Thirappanee
Ginigathhena
Yatiyanthota
ota
Bulathkohupitiya
Ginigathhena
10
3.2 Strategic objectives
1. Development and Improvement of an appropriate expansion policy and
methodology
Presently BMI is operating in 04 branches in 3 districts in the country. To achieve the
strategic goal BMI will establish 23 new branches within the next 05 years.
Standard Branch Model
Standard branch model will be used in future expansion. In this model the branch
structure, furniture & equipments, funds requirements and products offered are all
standardized.
Branch Structure
The standard branch consists of 01 Branch Manager, 05 Microfinance Officers, 01
Accounts and Administration Officer and a watcher. The required furniture and
equipments for the standard branch together with the estimated cost is given in the
annexure 04.
Figure 2: Proposed Branch structure for new branches
BM
AAO
MFO 1
MFO 2
MFO 3
MFO 4
MFO 5
EDO 1
Clusters 30
Watcher
30 members
BM – Branch Manager
AAO – Accounts & Administrative Officer
MFO – Microfinance Officer
EDO – Entrepreneur Development Officer
Targets
The annual targets for the branch are as follows.
•
Case load per MFO
-
Maximum 900
Minimum 600
11
Case load Branch
•
-
Average 750
-
Maximum 4,500
Minimum 3,000
Average 3,750
Table 4: Outreach Targets for the next five years
Year
2009
2010
2011
2012
2013
# of
branches
8
14
20
24
27
Clients
Women
Men
Total
Minority
17,920
7,680
25,600
5,120
28,672
12,288
40,960
8,192
45,875
19,661
65,536
13,107
64,225
27,525
91,750
18,350
73,400
31,457
104,858
20,972
Products and services
Initially branch will start with two loan products.
Table 5: Initial Products offered by a branch
Loan
Consumption loan
Business starting loan
Duration
18 months
24 months
Loan size
20,000
25,000
Cost of funds
Initially the fund requirements of the branch will be borne by BDS funds at a rate of 5%
reducing balance and the other funds at the rate of 9% reducing balance from NDTF and
other sources. During the different years of the operations the funding composition from both
sources will be as follows.
Table 6: Funding Requirements
Year
# of
new
branc
hes
Total fund
requirement
per year /new
branches
Total fund
requirements per
existing
branches
2009
4
270,988,393
239,324,000
2010
6
406,482,590
2011
6
406,482,590
2012
4
2013
Total fund
requirements
Source of funds
BDS
510,312,393
75,000,000
510,312,393
916,794,983
916,794,983
1,323,277,572
270,988,393
1,323,277,572
3
203,241,295
Total
1,558,183,260
NDTF/Other
% of funding
requirement
BDS
NDTF/
Other
435,312,393
15%
85%
80,000,000
836,794,983
9%
91%
85,000,000
1,238,277,572
6%
94%
1,594,265,965
90,000,000
1,504,265,965
6%
94%
1,594,265,965
1,797,507,260
95,000,000
1,702,507,260
5%
95%
4,583,974,913
6,142,158,173
425,000,000
5,717,158,173
7%
93%
12
Overheads
Overheads in a branch include 1/8 from the Head Office cost which is nearly Rs. 40,000. The
total overhead for the standard branch is Rs. 99,140. The annexure 4 gives a detail of the
overheads.
Figure 3: Accumulative Cost & Income
12,000,000
10,000,000
8,000,000
6,000,000
4,000,000
2,000,000
Ja
nu
Fe ary
br
ua
ry
M
ar
ch
Ap
r il
M
ay
Ju
ne
Ju
l
A y
Se ugu
pt s t
em
b
Oc er
No tobe
ve r
m
D b er
ec
em
b
Ja er
nu
Fe ary
br
ua
r
M y
ar
ch
Ap
r il
M
ay
Ju
ne
-
Accumulative Cost
Accumulative Income
Figure 3 shows that it takes 15 months to breakeven. And figure 4 shows that using this
standard model in the 9th month from the commencement of the operation, new branch
begin to earn profits. The annexure 5 shows the projections for the standard branch
model.
Figure 4: Monthly Cost and Income of a branch
1,600,000
1,400,000
1,200,000
1,000,000
800,000
600,000
400,000
Total cost for the branch
Total Income
Linear (Total cost for the branch)
Linear (Total Income)
200,000
Ja
n
Fe uar
br y
ua
M ry
ar
ch
A
pr
il
M
ay
Ju
ne
Ju
l
Se Aug y
p t us
em t
O be
N ctob r
ov e
r
D emb
ec e
em r
Ja ber
n
Fe uar
br y
ua
M ry
ar
c
Ap h
ril
M
ay
Ju
ne
-200,000
-400,000
BMI use the branch as the base structure for the expansion. For the year 2009, BMI
13
expansion policy is to use existing operating areas as centre and expand periphery
including plantation areas. In addition the eastern province will be added as a new area
for the core program in 2009. The following table elaborates the strategies adopt with
regard to expansion.
Table 7: Expansion strategies
No
Strategy
Description of the strategy
1
Development of an
expansion policy to
achieve the required
growth
A branch covers average of 3,750 clients (range 3,000 to 4,500). To achieve 100,000
clients BMI should have 27 branches at the beginning of the 5th year. The current
number of branches is 4 and there is a need of 23 new branches. The new branch
commencement pan would be as follows.
2009 – 4 branches, 2010 - 6 branches, 2011- 6 branches, 2012 – 4 branches, 2013 – 3
branches
2
Develop a approach
and methodology for
selection of districts
and divisions
The criteria for selection of locations for a branch will depend on poverty levels and
market potential and operational feasibility for profitable operation. BMI will avoid
unhealthy competition as much as possible as a new entrant to areas. For 2009, two
branches in the periphery of Yatiyantota (one next to Ginihathhena and another next to
Yatiynatota and two in eastern province will be commenced. The locations for each
year will be decided on the above criteria and any other consideration appropriate for
that time at the beginning of each year.
3
Yearly review of the
expansion policy and
methodology and
continuous
improvement.
Expansion policy & methodology will be reviewed and improved by the senior
management and the board from time to time but ensures that each year the annual
policy statement is reviewed and published
2. Improvement of systems and procedures for increased efficiency and effectiveness
From the inception BMI was focused on improving its efficiency and effectiveness.
The process and procedures have streamlined to get the maximum efficiency and
effectiveness from the system. The table number 01 provides some ratios to indicate
the current efficiency and effectiveness of the organization.
Effectiveness is related to the impact of our microfinance programme. BMI is
dedicated on poverty reduction as per vision and the mission of the organization. Five
year strategic goal commits inclusion of marginalized with a minimum of 20% of the
clients representing minorities and 70% been women. BMI collects baseline
information such as family income, household assets to asses how poor is our
clientele before loans are granted. Baseline information reflects whether our
borrowers are comparatively poor. At the initial stage BMI changed the focus on
14
increased participation of poor as it was evident that borrowers are not comparatively
poor when this focus was not on such targeting
BMI will continue to adopt following strategies to ensure the increased efficiency and
effectiveness of the organization.
Table 8: Strategies to increase the efficiency
No
1
2
Strategy
Description of the strategy
Increase the productivity of Information and Communication Technology (ICT) is a strategic tool for microfinance
back office staff
institutions to reduce the operating costs, making it viable for MFI to expand and have
a greater outreach. BMI with its rapid growth plan it is fairly high stage to get the
usage of ICT to enhance the quality of microfinance services. After doing an
assessment of the available MIS in the Sri Lankan context and the performance, after
Increase timely availability of sale services and customization it was decided to use “Senova” as the MIS of BMI for
the next few years. Senova is not a new to BMI because for more than 1 and1/2 years
accurate information
BMI was using Senova system in cooperative societies supported by BMI.
BMI strategy will look into the customization of Senova for BMI operations and use of
the information for further customization. Initially technical know how will be
outsourced but once the system is developed and implemented with a substantial
scale technically capable Human Resources will be needed as an in house IT Manager.
3
4
5
6
Improved
customer
convenience
Establishment of a policy on
composition of vulnerable
people in cluster to the
branch level
Development of a practical
mechanism
to
enroll
vulnerable groups
Establishment of impact
monitoring mechanism
The 70% women will be established as a policy at cluster level together with at least at
MFO level in case each cluster cannot maintain this composition. 20% marginalized
composition will be established at cluster, MFO and at least at branch level.
BMI will develop indicators to identify the vulnerable groups such as minority
communities, disabled, ultra poor such as widows, land less etc. Then mechanism to
ensure they are inclusive will be developed.
The measurement of impact of BMI work on the lives of the poor is challenging and a
difficult task . The issues are accuracy of impact data, level of attribution to BMI
interventions and cost of impact measurement. However, BMI in 2009 will develop an
appropriate impact monitoring methodology and improve this over the next 4 years.
The social performance of the programme will be monitored and the indicators will be
used to measure how we have achieved our social objectives within BMI microfinance
programme.
15
3. Ensure products/services are client responsive.
Currently BMI has adopted a bottom - up approach to get the client requirements and
develop products that are client driven. Seven (07) loan products were introduced in
2007 and only 06 products were received by the clients. One product was rejected by
the clients due to the product objective was not met by the product. A new product for
emergency loans was introduced in place of rejected product on pilot basis.
Figure 5: Structure for emergency loans
MFO
Cluster 1
Cluster Leader / Agent
Cluster members
Non members
Micro Insurance is a valuable service that the most clients are demanded. It can be
seen that most clients prefer to take loans from Ceylinco Grameen even for a very
high interest rate, simply to benefit from the life insurance they provide. Following
table provide strategies of BMI related to products in next 5 years.
Table 9: Strategies to ensure client responsive to products
No
Strategy
Description of the strategy
1
Monitor performance
of each credit product
offered and
understand relative
demand and feed back
of clients in a informal
manner
The MIS will be segregated product wise. The product performance in terms of
disbursements, interest income, PAR and the seasonal variances of those aspects will
be monitored. The directors and staff from senior management and field staff will
provide a feed back on the products from clients. These information will be used in the
annual update of the operational manual as well as in between times to improve or
change of the products.
2
Work towards
identification of micro
insurance products
suitable for BMI
clients
The demand on the microinsuranace product is now evident to BMI from client feed
back. However, BMI is not legally able to provide insurance. Therefore, BMI is looking at
the feasibility for a strategic partnership with a reputed insurance provider in the
country. A product survey was undertaken. Out of 12 products surveyed, 4 products
were identified for filed testing. The list and features of those products are given as
16
annex 02. The product will be discussed with clients in focus groups and test clients
willingness to buy them and also understand possible improvements required. By this
way BMI will identify a product or product mix and offer those to BM clients.
3
Improve savings
products offered
through Cop-ops and
commence BMI
savings when it is
possible legally
The savings by co-operatives will be increased. So far savings were made as a
mandatory requirement for loans and not as a product itself useful for clients. New
products and a methodology developed for that is given in annex 01. The excess staff
member due to automation of the accounts and MIS in Co-op will be in charge for this
work.
4
Ensure clients need
identification and feed
back through formal
client satisfaction
surveys
There will be minimum of one client satisfaction survey undertaken by external
consultants and not by the operating staff. Such surveys will be scheduled prior to
annual operational manual update so that the clients’ feedback can be used in
improving products in the manual.
5
Alert on offerings of
competitors and
adjust BMI offerings
accordingly
BMI will keep the eye on product offering of competitors in the country. The salient
positive features in the competitor products will be embedded in to BMI products in
the product improvement processes.
BMI will wait till the microfinance act is in place for mobilization of savings.
4. Development of Appropriate Human Resource (HR) policy
BMI treat its staff as the most valuable resource. Development of appropriate HR
policy is the key strategy for the development and enhancing the HR within the next
five years. The policy will includes
– Recruitments
– Salaries & incentives
– Performance evaluation
– Succession plan
– Training and Capacity Development
Currently BMI uses a strong Incentive policy which is one of the reasons for the
strong portfolio quality of the organization. These policies will be reviewed and
change from time to time taking into account the views of staff and other external
factors such as economic status of the country, efficiency and effectiveness of the
staff members and profitability of the organization.
17
Table 10: Strategies for staff recruitments
No
1
Strategy
Recruitments of employees
2
Salaries
Description of Strategy
Micro Finance Officers (MFO) and Accounting and Administrative
Officers (AAO) will be recruited 100% externally. However, Assistant
AAOs in two existing branches will be given an opportunity for
promotion. Entry level recruitments will be done for 1-3 months
training period. Those who do not fit in to BMI will be discontinued
within the training period. BMI will recruit more than entry requirement
in order to implement this strategy smoothly. For other potions the
internal staff with suitable qualification which will be prepared before
each recruitment will get the priority where as if there is no suitably
qualified internal staff external candidates will get the opportunity.
Already decided salary scale will be affected for the new recruitments
from the external people. If it is internal staff then;
1. MFO promoted as a BM
• If the salary of MFO is lesser than Rs. 18,000 then
increase it up to 20,000 and promote him as an acting
BM under probation of 06 months. After the probation
period confirm him as BM through a proper
performance evaluation.
• If the salary is greater than Rs. 18,000 then increased
it by RS 2,000 and after the probation period increased
his salary through a proper performance evaluation
2. Assistant AAOs internally promoted to AAO
• If an internal staff is promoted and the current
salary is lesser than Rs. 12,000 then increased it
up to Rs. 12,000.
3
Increments
4
Staff Capacity Development
If the salary is greater than Rs. 12,000 no increase.
Increments for new staff in the first year should be calculated as
follows;
Salary increment = approved increment/12 * no. of months worked
All the staff will be provided basic operational knowledge. For MFO’s full
exposure to operational manual and loan appraisal will be basic and
essential. This will be classroom and on the job training during the first
6 months. For AAO’s BMI accounting and MIS and back office functions
will consist the training.
In addition the staff will be given specific training such as standard
CGAP training. For MFO, Delinquency management and operational risk
management will be essential. For AAO’s accounting and Financial
Analysis will be essential. For BM’s all these training including business
planning and product development will be essential.
18
The best staff will also be given opportunity to attend MF related
training conducted locally and internationally depending on availability.
BMI will also organize international best practice exposure programs
itself or participate in such programs organized by others such as net
work organizations.
Staffing requirement
Table 11: Staffing requirement
Year
# of
branches
Senior
Management
GM
Middle Management
EDM
BM
AAO
Field
Staff
Total
2008
4
1
0
0
Investigation
/Audit
0
5
6
5
17
34
2009
4
0
1
1
1
4
2
4
22
35
2010
6
0
1
1
1
6
6
6
30
51
2011
6
0
0
0
0
6
6
6
30
48
2012
4
0
1
1
1
4
4
4
20
35
2013
3
0
0
0
0
3
3
3
15
24
27
1
3
3
3
28
27
28
134
227
Total
AM
Junior Management
EDO
5. Increasing the Profitability of the organization
BMI has a strong vision of eradicating the poverty and BMI do not envisage extreme
profits. The FSS that BMI wishes to achieve is 120% where the surplus profits will be
reinvested in the microfinance operation. For the initial 6 months of 2008 BMI
achieved operational self sufficiency (OSS) 74%. The OSS for the month of
November 2008 has been 123%. The strategies to achieve estimated profitability are
as follows.
Table 12: Strategies to increase the profitability
No
Strategy
Description of the strategy
1
Operational Cost
reduction
Immediately in 2009, BMI work towards operational cost reduction. A standard branch
structure with lowest possible cost was developed and the annexure 4 gives the details
and the estimated cost reduction. BMI will continue to review operational methodology and
reduce unnecessary costs wherever it occurs.
2
Increase in
income
The main income sources are loan interest income and fees for EDS. As a poverty focused
MFI, BMI will continue to provide lowest interest loans and low cost EDS. In 2008, the
average interest rate was 10% flat which is equivalent to 18% in declining balance. This
rate was the lowest in the market. However, as per the realistic projections made taking
current inflation into account, BMI will increase its interest rate to 13% flat average which
is equivalent to 23% in declining which is also lower than all other providers except
19
SANASA which has some unforeseen costs in borrowing.
3
Maintain high
portfolio quality
BMI throughout its one and half year history maintained zero PAR and recently it was
increased to 0.1% due to few issues in Thirppane branch. BMI will ensure that the existing
delinquency will be addressed soon and zero PAR will be continued to be maintained in next
five years so that costs can be further lowered.
6. Increased capacity of Co-operative societies to undertake MF independently
BMI extends credit to clients in Yatiyantota division and workers in plantations areas
through people owned and managed co-operative societies. BMI provides a bulk loan
to Cooperative society for on lending to clients. Co-operative mobilizes savings from
clients and provide loans for short term needs of members in addition to BMI funded
loans. However, major portion of the savings are kept in commercial banks as fixed
deposits. BMI provided various kinds of capacity development support for 4 cooperatives in Yatiyantota. The most rewarding support in 2007/8 was computerization
of accounting and MIS with standard microfinance software. BMI will further
develop these Co-operative societies as described in following table no. 13 bellow,
with the strategic view of increasing the contribution towards five years strategic goal
of BMI.
.
Table 13: Strategies to develop Cooperative societies
No
Strategy
Description of the strategy
1
Develop the capacity of The 4 cooperatives in Yatiyantota will be made 100% operationally independent from BMI
the BOD and staff
at the end of 2009. All the existing estate cooperatives will also make operationally
independent by 2010. BMI will also strategically work with new estate cooperatives with
2 year horizon for making them 100% operationally independent. In order to do this the
capacity development of director board and staff of those cooperatives will be
undertaken in a well designed approach.
2
Assess cooperatives
as per standard
performance criteria
and offer BMI services
in a way Cops motivate
for increased
performance
The relationship with BMI after making co-ops independent will be providing bulk loans
and regulation and supervision. The future BMI role will be further refined during 2009. A
set of performance standards to assess cooperatives together with a grading system
will be developed by BMI together with those cooperatives. The amount of bulk loans and
even interest rates and other benefits will be related to the level of achievement of
performance standards.
3
Increased Savings
mobilization
This is an strategy related which was described in the table 09.
20
7. Increased effectiveness, and sustainability EDS
During the first year of BMI operation, the use of coupon system for the payment of
fees for Enterprise Development Services (EDS) as an demand driven service too
proved successful. This was an extremely innovative tool to provide enterprise
development or credit plus services and was practiced for the first time in Sri Lanka.
The service started with one Enterprise Development Officer (EDO) was increased to
2 in 6 months and after observing performance of the first year, BMI has decided to
appoint one EDO for each Branch Office and one Market Development Officer for
BMI. The main service provided was different kind of training with limited support
for marketing and other forms of EDS. BMI defines effectiveness of EDS in terms
improvement in businesses of clients and impacting on income and employment
generation and the sustainability in terms of BMI’s ability provide EDS in the long
term with marginal profitably to BMI.
The strategies for achieving the objective includes:
Table 14: Strategies to increase effectiveness and sustainability of EDS
No
Strategy
Description of the strategy
1
Organsing clients by sectors
and area based business clubs.
This is the BMI outreach strategy for enterprise service clients. Business club
will be a society of businessmen in one sub sector. The minimum membership
for a club would be 25. Ex: Poultry producers, poultry feed supplies, poultry
product sellers (main business). The objective is to make an effective
communication mechanism between BMI and service providers with the
businessmen in the sector. This club will be a body which can work regarding
common issues in the sector and also organize ED services such as training and
advisory services with BMI. The minor sectors which does not have sufficient
number of clients to make a club will be reached thorough clusters and also on
individual basis.
2
Out sourcing technical
knowledge and expertise:
The EDO in the branch office will be a general business consultant. EDO will not
have technical know-how related to each and every business. BMI does not see
that there enough work for full time staff in each technical area. BMI also know
that such technical expertise is available in specialized institutes such as
agriculture department, tea small holding authority industrial development board
etc. There are professional private providers also. Therefore, it is cost effective
to out source these human resources and will continue the same strategy. BMI
will develop a directory of such experts in each area of operation so that such
resources can be outsourced effectively.
3
Work towards development of
new business with growth
potential in the area.
BMI believe that there are unidentified business opportunities for most of the
areas. The identification of such opportunities and supporting the
commencement of such activities will boost businesses activity in those areas.
BMI will identify such opportunities with full feasibility study. Then such
interventions will be piloted with small number of clients in economical scale and
21
based on the results of the pilot, rolling out to other potential clients will take
place. Ex. Cut flowers cultivation for export.
4
Develop practical interventions
to address issues in existing
business sectors with growth
potential.
The existing businesses are the low risk interventions for those areas compared
to new businesses. There are existing business opportunities which have
potential for multiplication and growth. However, the growth in such sectors is
hampered due to major issues in the sector. BMI will identify such issues and
intervene on them in a sustainable manner. One of such example is dairy farming
which is profitable with a good demand in the market. The expansion of diary
farming is difficult mainly due to lack of good cows for new entrants. BMI will
attempt to develop cattle breeding as an enterprise opportunity so that high yield
cows can be produced in a planned manner to address the issue.
5
Develop basic standards of a
business supported by BMI and
ensure those standards
achieved by business clients.
BMI believes that the majority of businesses supported by BMI should have
minimum business standards. Such standards would vary from one business type
to sector. Some examples of such standards would be minimum monthly profit,
having a calf from each cow every year in cattle farms, having pruning of tea
plants every 3 years, having recommended soil erosion techniques in tea
gardens etc. BMI will develop such standards for key sectors where there are
more than 50 clients and develop a system which ensures those standards are
met by BMI clients. This will be an identity of BMI supported business enterprise.
6
Establishment of market
linkages
Marketing is key to the success of any business. Market is one of the major
issues faced by many clients due to its vibrant nature. Therefore, BMI will have
specific market development approach for the clients while marketing will be
handled in other strategies too. BMI will recruit a market development officer
who will identify better and new markets for existing products. He or she will help
clients to win new markets through provision of market intelligence and
improving the competitiveness of products and services to ensure long term
existence in such markets. BMI will also investigate existing demand and supply
for products and services and introduce market niches to BMI clients which are
appropriate and suitable for them.
7
Regular monitoring and
evaluation of effectiveness of
EDS and continuous
improvement.
The BMI will ensure high quality service through a rigorous monitoring and
regular improvement mechanism. Each EDO service will be monitored by a
monitoring officer. Such a monitoring officer will be recruited for 5 - 10 EDO’s
depending on the geographical area and number of branches. The EDOs and
monitoring officer will work as a team together with BM’s of BMI in ensuring high
quality and impact of services. There will be a workshop in very six month to
improve the ED service and operation based on new learning coming from
experience and other ways
22
8. Increased fund raising
The funding requirement for targeted growth is Rs 6,142Mn over the five years.
Currently BMI has two sources of funding. They are annual contribution by
Berendina Stichting (at 5% interest from BDS company) and borrowing at low
interest rates (9% declining) from National Development Trust Fund (NDTF). There
are other fund raising activities under way such as from GTZ for computerization of
branches and savings improvement in plantation sector, Sri Lanka German Sri Lankan
Association for the plantation sector are grant support expected.BMI is also working
with ETIMOS for a loan at 12% declining balance interest rate. BMI also has
approached Cordiad and Rabo Bank Foundation in the Netherlands and APT
enterprise development, the current partner for Tsunami support project implemented
by BMI for further funding support. Like wise BMI will continue to involve raising
funds in the form of grants and soft loans to meet the above mentioned funding
requirements.
The financial projections of a branch is given in the annex 05. A branch needs Rs 79
million for loan funds and operational expenses for 15 months period at which the
branch operation reaches breakeven. However, the branch will be operationally
sustainable in 9 months. These projections are based on funds borrowing at 5% from
Berendina Stichting and 9% from NDTF and on lending rate of 13% to borrowers.
BMI in order to maintain poverty focus, charges only 13% average flat rate (declining
23%). Depending on availability of funds at low interest rates BMI can offer its
services profitably within a short period. Therefore, BMI attempts strategically to
seek minimum of Rs 25 million initial investments as a grant and balance Rs 54
million as a soft loan for a branch. The growth beyond this will be based mainly on
borrowing from microfinance wholesaling.
Table 15: Strategies to increase fund raising
No
Strategy
Description of the strategy
1
Use of BS funds in initial
loans as much as
possible
The initial loans are small in size and given to more vulnerable clients. The risks of these
loans are also high where increased credit and client assessment is essential. Most of
these loans will be in new branches during first 2 years. BMI will utilize the funds given by
BS for this segment as a policy. This will ensure BMI will continue to expand even with BS
funds and also ensure continuous fund raising from other sources for continuity in
branches older than 2 years.
2
Borrow from other
Development finance
sources for repeated
loans
Repeated loans are large in size and clients are known to BMI. The credit worthiness of
those clients is already known to BMI to a larger extent. BMI will dedicate as a policy to
raise funds to on lending for repeated loans. BMI is already borrowing from National
Development Trust Fund (NDTF) and applied for ETIMOS – an Italian funding source also
for a loan.
3
Raise grant funds for
The capacity development in BMI is a crucial and will be a continuous process. This
involves staff training and other forms of improving knowledge such as exposure visits.
23
4
capacity development
This also has components like system developments including computerization. BMI will
seek sources of grants for such interventions. Already BMI is having negotiations with
GTZ – ProMiS Project in Sri Lanka to support computerization of branches and staff
training etc.
Link with MF projects and
programs and other
donors which can
provide funding
There are potential donors for various forms of grants and loans for microfinance in Sri
Lanka as well as abroad. In Sri Lanka there are government sponsored credit lines such
as for diary sector development is an example. Internationally, BMI is in building up
linkages with Cordiad, Rabo Bank Foundation and Sri Lanka Germen Society. This process
will be continued.
9. Improving Co-operate and International Image and Linkages
Berendina is known in Sri Lanka as a development organization working in few districts
in the country. BMI as a new organization building its image in the country as a highly
efficient MFI. Further, BMI with its next five years strategy needs to be known better
nationally as well as internationally. BMI is featured in Berendina official web site and
also a member of Lanka Microfinance Practitioners Association holding a directorship in
that too.
Table 16: Strategies to improve Co-operate and International Image and Linkages
No
Strategy
Description of the strategy
1
BMI annual report
BMI will publish a printed annual report starting from year 2008. The achievements and
the progress of the year together with audited accounts will be reflected in the report.
2
Featuring BMI in MIX
Market
MIX market is a web site featuring performance of MFIs in the world. This is web site
managed by the Consultative Group for Alleviating Poverty (CGAP) of the World Bank. At
the moment MIX market has about 10 Sri Lankan MFIs. BMI will also be featured in this
web site soon after audited accounts of 2008 is ready by March 2009. The MFIs in the
MIX market get contacts with various organizations in the world whom can be benefited
to BMI in the future in terms of technical assistance and funding.
3
Obtaining membership
in network
organisations
There are number of international networks of MFIs. Womens’ World Banking, INAFI,
Banking with Poor Net Work, SEEP network are some of them. These net work
organizations work towards the betterment of the member organizations. They organize
meting, seminars workshops etc also. BMI can be benefited in increasing knowledge in
addition to building up of it’s co-operate image world wide through participation of these
networks.
24
10. Increased contribution of Policy influencing
Microfinance industry in Sri Lanka faces number of challenges. Some of them are
reflected in the BMI – SWOT analysis. Lack of appropriate legal structure is a main
issue. Difficulties related to foreign borrowing is another. BMI as an expanding best
practice MFI will actively contribute in the lobbying and advocating for a better
microfinance policy frame work during the next five years. BMI Directors are
already involved in National level policy work in the capacity of National level
consultants in Sri Lanka. For example Chairman and Director in charge of micro
finance work assisted International Fund for Agriculture Development a UN body
based in Rome to develop the microfinance strategy in Sri Lanka for next 5 years as
part of the Sri Lanka country strategy for next 5 years. The operations manager of
BMI is one of the directors of Microfinance Practitioner’s Association which is as
APEX body for microfinance industry. BMI will lead the MFIs in Sabaragamuwa
province for policy and other aspects common to practitioners.
3.3 Leadership and Management
The organizational structure will modernize with the strategic goal and the objectives for
the next five years. With the expansion plan for the next year the organizational structure
for 2009 is as follows.
25
Figure 6: Organizational Structure for 2009
GM
HO
AO & HR from BDS
office
AM
Ya
BM
Bu
6MFO
1EDO
BM
Ya
4Co-Op
1EDO
BM
Gi-I
6MFO
1EDO
BM
Gi - II
6MFO
1EDO
BM
New
MO
Estate
EDS
01 MO
01 Mkt.O
5MFO
1EDO
BM
Thi
5 MFO
1 EDO
1 BDO
Figure 7: Conceptual Organizational Structure for 2013
BOD
Audit Team
CEO
Area Managers
4
EDS
Audit
Branch Managers
10
26
Annexure 01: Products and services
Purpose of Loan
Repayment
period
(Month)
Maximum
Loan
Amount
BDS Coupon
Retained
Amount
Service
taking
Co-op
Individual
Consumption
Increase of Asset value
18
20,000
-
500
7%
12 %
14
A-2
Consumption (repeat)
Increase of Asset value
24
40,000
-
500
10 %
14 %
14
B-1
Business Starting
Start a new Business for income
generation
24
25,000
250
750
7%
10 %
14
B-2
Business
Development
Expansion
activities
30
75,000
250
2,750
10 %
14 %
20
B-2 -1
Business
Development
previous A
borrowers)
24
50,000
250
2,750
10 %
14 %
14
B-3
Business Expansion
Expansion of Business activities
36
150,000
250
5,750
10 %
16 %
30
C
Foreign Employment
To meet expenses for
initial
arrangements (ticketing etc ) (except
house made jobs)
24
50,000
-
500
14 %
18 %
No
D
Motor cycle
To purchase brand new motor cycles
(70% of the market price up to
maximum Rs. 75000/- )
24
75,000
-
500
14 %
18 %
14
E
Emergency
4 months
5,000
N/A
5% per month
1
F
Agriculture loan –
only for Thrappane
6
15,000
N/A
12%
Types
Loan
Category
A-1
Product
–
(for
1
of
existing
Business
New business or Expansion
existing Business activities
of
To meet house loan emergency needs
such as medicine for sickness, funeral
etc.
To help finance farming less than 6
months season
0
Interest rate
0
Early
Settlement
(months)
No
27
Annexure 02:
Selection of Insurance Products
Option 01
Option 02
Option 03
Option 04
No
Description
Jeewana Sahana
Sithumina
Ceylnico Loan Insurance
Asian Alliance
1.
Provider
Sanasa Insurance
Sanasa Insurance
Ceylinco Insurance
Asian Alliance
2.
Legal base and stability
Legal Insurance Product
Legal Insurance Product
Legal Insurance Product
Legal Insurance Product
3.
Coverage
Life - Death , to the member and
Family due to an accident or
natural causes
Life - Death , to the member due to
an accident or any other and
permanent Disability
Loan Protection (death and total
disability) plus
Life - Death ,Total disability
or partial to the member
due to an accident or
natural cause
Life - Death ,Total disability or
partial to the member due to an
accident and
Hospitalization/medical cover to
the member
4.
Covers offered to
Member and Family
Member and spouse can be added
for an additional cost (for spouse
life insurance only)
Only to the member
Member
5.
General Conditions
Member,
spouse,
unmarried
children than 21 years old.
number of children not more than
4
The benefits depend on the age the
beneficiary avails the policy
Loan period should not exceed one
year
No
Rs. 225 – family
Rs. 3,000 ( One time payment annually) and additional cost for
Up to Rs. 50,000 Rs. 300+tax
Rs.240
6.
Premium
First year only for the accidental
causes
Above Rs. 50,000 Rs. 0.7% +tax
additional benefits
28
7.
7.1
Coverage Changes
Death
Rs. 5,000 Natural
Rs.10, 000 Accidental.
Little difference on family
member
Rs. 392,040 ( For average payment
period 15 years and the age
beneficiary gets the policy is 18-35
years old)
Rs. 50,000
Rs.100,000
7.2
Permanent /Partial
Disability
No
Incentive payment for 10 years
Rs. 50,000 (Rs.25,000 for partial
disability)
Rs.100,000
7.3
Funeral Expenses
No
Rs.10,000 ( on small additional
cost)
Rs.7,500
Rs.10,000
7.4
Hospitalization Rates
No
Rs.200 per day (additional
premium of Rs.240)
Yes
No
hospitalization:
Conditions
No
Maximum 10 days
Rs. 4,000 annual limit
No
Rs. 2,000 event limit
(Per day 200 max)
8.
Coverage Effectiveness
Immediate
Immediate
Immediate
Immediate
9.
Maturity benefit
No
Rs.35, 640
No
No
10.
Loan Protection
No
No
Balance loan capital outstanding
amount will be paid – on death or
permanent disability
No
11.
Present Market
penetration
No figures available ( This is sold
Sanasa societies and other
societies )
No figures available ( This is sold
Sanasa societies and other societies
)
No figures available ( This is sold
to Ceylinco Grameen with some
additional benefits)
No figures available (It is
new product proposed)
29
Annexure 03: List of Steering Committee members
1. Mr. Dulan De Silva- Chairman
2. Mr. Anura Atapattu – director
3. Mr. Jagath Godakanada – Director
4. Mr. Kapila Subasinghe – Operations Manager
5. MS Chamila Perera – Accountant
6. Mr. A M Jayawardena – Manager BDS - Thirappane
7. Mr. Sisira Thilakarathene– Accountant
8. Mr. A N Udayasiri – Branch Manager
9. Mr. Ishan Rajika – Branch Manager
10. Mr. K P S Dhammika – Branch Manager
11. Mr. Rathnayake B M P– Branch Manager
12. Mr. Anusha Maniyangama – EDO
13. Mr. Buwaneka Samarasunda- EDO
14. Mr. A H M Ilham- Branch Manager
15. MS. Dumindi Pemadasa - AAO
16. Mr. Sisira Gunasena– MFO
17. Mr. Ravindra Kumara - MFO
18. Ms. Niroshani Swarnamadu- Consultant
30
Annexure 04:
The standard Branch projection model
Standard branch staff
Position
Nos
Rate (Rs)
Branch Manager
Accounts and Administration
Officer
Microfinance Officer
Watcher
01
01
20,000
12,000
05
01
10,000
7,500
Furniture & Equipments for a standard branch
Item
Table
Qty
BM
Chairs
AAO
MFO
BM
Staff
File cupboards
Office cupboards
visitors chair
Plastic table - visitors
Senova system
Computer
Jet Matrix
Telephone & Email
Safe
Cash box small
Rate
1
9,000
1
5
1
6
2
1
6
1
1
1
1
1
1
9,000
6,000
6,500
4,500
12,500
9,500
700
1,200
150,000
75,000
20,000
25,000
35,000
2,000
Overheads of a standard branch
Office rent
Electricity
Telephone & Email
Stationary
Financial Charges
Staff Welfare
Depreciation
Office & Equipments
maintenance
HO overheads
Mislleneous
12,000
3,000
6,000
10,000
10,000
5,000
7,140
3,000
40,000
3,000
31
Annexure 05:
Projections for the standard branch model
Branch Cost
Qty
Direct Cost
Staff requirement
BM
AAO
MFO
Watcher
ETF/EPF
Total for Salary
April
May
20,000
12,000
50,000
7,500
16,110
105,610
20,000
12,000
50,000
7,500
16,110
105,610
20,000
12,000
50,000
7,500
16,110
105,610
900,000
-
18,750
18,750
18,750
18,750
45,000
7,500
2,000
1,060,110
45,000
7,500
2,000
160,110
45,000
7,500
2,000
160,110
45,000
7,500
2,000
160,110
45,000
7,500
2,000
160,110
99,140
99,140
99,140
99,140
99,140
Total operational cost of Branch
1,159,250
259,250
259,250
259,250
259,250
Funds Required
cost of funds
Total cost for the branch
Accumulative Cost
1,587,650
1,159,250
1,159,250
259,250
5,292
264,542
1,423,792
259,250
6,156
265,406
1,689,199
259,250
7,021
266,271
1,955,469
259,250
7,885
267,135
2,222,604
Runing expenses
Allowances
BM + MFO
MFO
BM
Incentives
Total Direct Cost
Cost of funds
March
20,000
12,000
50,000
7,500
16,110
105,610
Cost
Recovery
Total Over heads
1
1
5
1
February
20,000
12,000
50,000
7,500
16,110
105,610
Motor cycle investment
Over heads
January
6
Page 01
32
June
July
August
September
October
November
December
January
February
March
April
May
June
20,000
12,000
50,000
20,000
12,000
50,000
20,000
12,000
50,000
20,000
12,000
50,000
20,000
12,000
50,000
20,000
12,000
50,000
20,000
12,000
50,000
20,000
12,000
50,000
20,000
12,000
50,000
20,000
12,000
50,000
20,000
12,000
50,000
20,000
12,000
50,000
20,000
12,000
50,000
7,500
16,110
105,610
7,500
16,110
105,610
7,500
16,110
105,610
7,500
16,110
105,610
7,500
16,110
105,610
7,500
16,110
105,610
7,500
16,110
105,610
7,500
16,110
105,610
7,500
16,110
105,610
7,500
16,110
105,610
7,500
16,110
105,610
7,500
16,110
105,610
7,500
16,110
105,610
18,750
18,750
18,750
18,750
18,750
18,750
18,750
18,750
18,750
18,750
18,750
18,750
18,750
45,000
7,500
2,000
22,912
183,022
45,000
7,500
2,000
35,255
195,365
45,000
7,500
2,000
48,467
208,577
45,000
7,500
2,000
59,489
219,599
45,000
7,500
2,000
69,885
229,995
45,000
7,500
2,000
79,656
239,766
45,000
7,500
2,000
88,801
248,911
45,000
7,500
2,000
89,846
249,956
45,000
7,500
2,000
96,592
256,702
45,000
7,500
2,000
102,783
262,893
45,000
7,500
2,000
108,417
268,527
45,000
7,500
2,000
107,515
267,625
45,000
7,500
2,000
112,315
272,425
99,140
99,140
99,140
99,140
99,140
99,140
99,140
99,140
99,140
99,140
99,140
99,140
99,140
282,162
294,505
307,717
318,739
329,135
338,906
348,051
349,096
355,842
362,033
367,667
366,765
371,565
9,318,523
65,433
9,858,741
96,495
8,091,398
129,357
7,509,045
156,328
6,926,066
181,359
6,342,462
204,446
151,982
225,587
4,374,304
226,094
3,853,606
240,675
3,332,352
253,520
264,628
2,545,918
264,628
2,023,273
273,114
347,595
391,000
437,074
475,067
510,494
543,352
573,638
575,189
596,517
615,553
632,295
631,393
644,679
2,644,222
3,035,221
3,472,295
3,947,363
4,457,857
5,001,209
5,574,847
6,150,036
6,746,553
7,362,106
7,994,401
8,625,793
9,270,473
Page 02
33
Branch Income
Borrowers
Cash flow
Interest Income
January
Number of Existing Loans (1st of the month)
Number of New Loans
Number Current Loan (end of the month)
Opeinng OB
Average size of CL
Disbursements of CL
Average size of BSL
Disbursements of BSL
Total Disbursements
Recoveries from existing loans
Closing OB
Loan Risk Fund
Interest income from existing loans (BMI)
Total Income
February
-
March
50
50
April
50
175
225
May
225
225
450
450
350
800
20,000
25,000
0
-
20,000
400,000
25,000
750,000
1150000
1,150,000
28,750
-
1,150,000
20,000
1,400,000
25,000
2,625,000
4025000
53,472
5,121,528
100,625
12,458
12,458
5,121,528
20,000
1,800,000
25,000
3,375,000
5175000
240,625
10,055,903
129,375
56,063
56,063
10,055,903
20,000
2,800,000
25,000
5,250,000
8050000
481,250
17,624,653
201,250
112,125
112,125
0
0
12458.33333
68520.83333
180645.8333
Monthly Profit/Lost
(1,159,250)
(264,542)
(258,181)
(233,470)
(200,538)
Accumulative Profit
(1,159,250)
(1,423,792)
(1,681,973)
(1,915,443)
(2,115,981)
Accumulative Income
Page 3
34
June
July
August
September
October
November
December
January
February
March
April
May
2,200
2,650
3,100
3,550
3,750
4,150
4,550
4,950
450
450
450
200
400
400
400
200
2,650
3,100
3,550
3,750
4,150
4,550
4,950
5,150
800
450
1,250
1,250
500
1,750
1,750
450
2,200
17,624,653
20,000
3,600,000
25,000
6,750,000
10,350,000
855,556
27,119,097
258,750
199,333
199,333
27,119,097
20,000
4,000,000
25,000
7,500,000
11,500,000
1,336,806
37,282,292
287,500
311,458
311,458
37,282,292
20,000
3,600,000
25,000
6,750,000
10,350,000
1,871,528
45,760,764
258,750
436,042
436,042
45,760,764
20,000
3,600,000
25,000
6,750,000
10,350,000
2,352,778
53,757,986
258,750
548,167
548,167
53,757,986
20,000
3,600,000
25,000
6,750,000
10,350,000
2,834,028
61,273,958
258,750
660,292
660,292
61,273,958
20,000
3,600,000
25,000
6,750,000
10,350,000
3,315,278
68,308,681
258,750
772,417
772,417
68,308,681
20,000
1,600,000
25,000
3,000,000
4,600,000
3,796,528
69,112,153
115,000
884,542
884,542
69,112,153
20,000
3,200,000
25,000
6,000,000
9,200,000
4,010,417
74,301,736
230,000
934,375
934,375
74,301,736
20,000
3,200,000
25,000
6,000,000
9,200,000
4,438,194
79,063,542
230,000
1,034,042
1,034,042
79,063,542
20,000
3,200,000
25,000
6,000,000
9,200,000
4,865,972
83,397,569
230,000
1,133,708
1,133,708
379,979
691,438
1,127,479
1,675,646
2,335,938
3,108,354
3,992,896
4,927,271
5,961,313
(148,262)
(79,541)
(1,032)
73,099
149,798
229,065
310,903
359,186
(2,264,243)
(2,343,784)
(2,344,816)
(2,121,919)
(1,892,854)
(1,581,951)
(1,222,765)
(2,271,717)
June
5,150
400
5,550
5,550
400
5,950
83,397,569
20,000
1,600,000
25,000
3,000,000
4,600,000
5,293,750
82,703,819
115,000
1,233,375
1,233,375
82,703,819
20,000
3,200,000
25,000
6,000,000
9,200,000
5,507,639
86,396,181
230,000
1,283,208
1,283,208
86,396,181
20,000
3,200,000
25,000
6,000,000
9,200,000
5,935,417
89,660,764
230,000
1,382,875
1,382,875
7,095,021
8,328,396
9,611,604
10,994,479
437,525
518,156
601,080
651,815
738,196
(785,241)
(267,085)
333,995
985,811
1,724,006
Page 4
35


© Copyright 2026