
1997 Annual - AARC.org - American Association for Respiratory Care
Respiratory Care
Education
Annual
The American Association
for Respiratory Care
Volume 6
Spring 1997
Original Research
The Impact of Restructuring on Respiratory Care
Clinical Education
Crystal L. Dunlevy, Phillip Hoberty, and William F. Galvin........3
Effects of Content, Process, Computer-Assisted
Instruction, and Critical-Thinking Ability on
Students’ Performance on Written Clinical
Simulations
David C. Shelledy, Mark A. Valley, Douglas L. Murphy,
and Michael E. Carpenter..........................................................11
Exploring the Relationships Between Reading
Ability and CRTT Examination Performance
Robert C. Shaw and Steven J. Osterlind ....................................31
Editorial Staff
Editor
Linda Van Scoder, EdD, RRT
Ball State University/Methodist Hospital
Indianapolis, Indiana
Editorial Board
Wilmer Beachey, MEd, RRT
St. Alexius Medical Center/
University of Mary
Bismarck, North Dakota
William F. Clark, MEd, RRT
UMDNJ/School of Health Related
Professions
Newark, New Jersey
Phillip D. Hoberty, EdD, RRT
The Ohio State University
Columbus, Ohio
Arthur Jones, EdD, RRT
University of Texas Health Science Center
at San Antonio
San Antonio, Texas
Paul Mathews, Jr., EdS, RRT, FCCM
University of Kansas Medical Center
Kansas City, Kansas
Sharon McGenity, BA, RRT
Macon College
Macon, Georgia
David Rice, PhD, RRT
National-Louis University
Evanston, Illinois
Christine Romeo, BA, RRT
The Nebraska Methodist College
Omaha, Nebraska
David C. Shelledy, PhD, RRT
University of Texas Health Science Center
at San Antonio
San Antonio, Texas
Publisher
Sam P. Giordano MBA RRT
Executive Director
American Association for Respiratory Care
Dallas, Texas
Respiratory Care Education Annual, formerly published as Distinguished Papers Monograph, is a publication of the
American Association for Respiratory Care, 11030 Ables Lane, Dallas, TX 75229-4593. Copyright © 1997 by the
American Association for Respiratory Care. All rights reserved. Respiratory Care Education Annual is a refereed journal
committed to the dissemination of research and theory in respiratory care education. The editors seek reports of research,
philosophical analyses, theoretical formulations, interpretive reviews of the literature, and point-of-view essays.
Manuscripts should be submitted in three copies. The title page should contain (a) the title of the manuscript; (b) full
names, institutional affiliations, and positions of the authors; and (c) acknowledgments of formal contributions to the work
by others, including support of the research, if any. The first page of the article should repeat the title of the article and
include an abstract of no more than 120 words. The name(s) of the author(s) should not appear on this or any subsequent
page of the text. For rules governing references and style, consult the fourth edition of the Publication Manual of the
American Psychological Association. Manuscripts that do not conform to these standards will be returned for revision.
Send all submissions and editorial correspondence to the following address:
Education Department
American Association for Respiratory Care, 11030 Ables Lane, Dallas, TX 75229-4593
Respiratory Care
Education
Annual
Volume 6
Spring 1997
Original Research
The Impact of Restructuring on Respiratory Care
Clinical Education
Crystal L. Dunlevy, Phillip Hoberty, and William F. Galvin........3
Effects of Content, Process, Computer-Assisted
Instruction, and Critical-Thinking Ability on
Students’ Performance on Written Clinical
Simulations
David C. Shelledy, Mark A. Valley, Douglas L. Murphy,
and Michael E. Carpenter..........................................................11
Exploring the Relationships Between Reading
Ability and CRTT Examination Performance
Robert C. Shaw and Steven J. Osterlind ....................................31
IMPACT OF RESTRUCTURING ON RC CLINICAL EDUCATION
Respiratory Care Education Annual
Volume 6, Spring 1997, 3-10
THE IMPACT OF RESTRUCTURING ON RESPIRATORY CARE
CLINICAL EDUCATION
Crystal L. Dunlevy and Phillip Hoberty
The Ohio State University, Columbus, OH
William F. Galvin
Gwynedd Mercy College, Gwynedd, PA
Abstract
In light of the hospital restructuring debate, there is the possibility that the
redesign of respiratory care as we know it, may unintentionally injure academic
respiratory therapy. The purpose of this study was to determine how hospital
restructuring has affected the clinical curricula of respiratory care education
programs and to identify strategies for survival in the evolving atmosphere that
exists in health care today. One hundred eighty-six questionnaires were sent to a
random sample of respiratory care program directors nationwide. Descriptive
statistics were compiled. One hundred twenty-four (67%) program directors
responded to the survey. Fifty-five percent indicated that hospital restructuring has
affected their clinical curricula. Of those not yet affected, 68% reported that they
used paid instructors or program faculty to provide clinical instruction. Strategies
are presented that may be useful in minimizing the negative impact of hospital
restructuring on the clinical curricula of respiratory care programs.
3
IMPACT OF RESTRUCTURING ON RC CLINICAL EDUCATION
The Impact of Restructuring on Respiratory Care Clinical Education
In the heat of the hospital restructuring debate, there is the possibility that the
downsizing, or redesign of respiratory care as we know it, may unintentionally injure
academic respiratory therapy. Downsizing, patient-focused care, and total quality
management challenge respiratory care departments to ‘do more with less’. In such an
environment, clinical education is often one of the first casualties. In 1993, the American
Association for Respiratory Care (AARC) issued its Policy Statement on Health Care
Reform and the Role of Respiratory Care (AARC, 1993). The policy called for universal
access to health care, delivery-site neutrality, cost containment, and increased emphasis on
health promotion. The AARC further encouraged the development of respiratory care
practitioners (RCPs) as multicompetent hospital caregivers and forecasted an increased
demand for respiratory care in the home setting. Even before hospital restructuring
became a part of every health care worker’s vocabulary, Arthur Andersen Consulting
conducted a survey for the AARC and reported that respiratory care departments were
already expanding into new practice areas, such as bronchoscopy, cardiac rehabilitation,
electrocardiograms, electroencephalograms, extracorporeal membrane oxygenation,
hyperbaric oxygenation, sleep study, and invasive and noninvasive cardiac testing
(Andersen & AARC, 1992). The respiratory care profession has, thus far, met the
challenges brought on by restructuring by being an integral part of the decision-making
process, remaining informed, and being a ‘team player’. Respiratory care managers have
played to the strengths of the RCP by maintaining or strengthening their position within
the organization; their presence in the intensive care unit (ICU), coupled with their
scientific background and technical training, make RCPs ideal candidates to take on more
sophisticated procedures (Bunch, 1992). In so doing, many RCPs have firsthand
experience with change in the practice of respiratory care. Many new responsibilities and
procedures have been taken on and some relinquished.
Respiratory therapy program faculty have been forced to adapt to this changing clinical
picture in order to continue to provide comprehensive, up-to-date clinical instruction for
their students. The associate director of the Pew Health Professions Commission
encouraged educational programs to conform to the needs of the changing hospital
environment or risk extinction (O’Daniel, 1995). The 1992 AARC Consensus
Conference suggested that RCPs be multicompetent, multicredentialed professionals who
could work well in team-structured environments (Galvin et al., 1995). The purpose of
this study was to determine how hospital restructuring has affected the clinical curricula
of respiratory care education programs and to identify strategies for survival in the
evolving atmosphere that exists in health care today. A review of the literature indicated
that although the impact of various aspects of restructuring on clinical curricula have been
evaluated in other professions, no study has been previously published that addresses the
issue in the respiratory care profession (Meyers, 1995; Satran et al., 1993; Reimer, 1992).
4
IMPACT OF RESTRUCTURING ON RC CLINICAL EDUCATION
Materials and Methods
A two-page questionnaire, consisting of four core questions was developed by the
investigators. It was subsequently reviewed for readability and content validity by three
respiratory care program faculty members at separate institutions, three clinical
instructors, two respiratory care senior-level students, and a statistician. The document
was revised according to feedback from these individuals.
The study population consisted of respiratory care educational programs in the United
States, as recorded in a list of 372 accredited programs published in 1995 by the Joint
Review Committee for Respiratory Therapy Education. The list was comprehensive,
including respiratory care programs offering the baccalaureate degree, associate degree,
and certificate of completion. Beginning with Alabama and ending with Wyoming, the
programs were numbered 1 through 373. The principal investigator tossed a coin,
assigning heads to even-numbered programs from the list and tails to odd-numbered
programs. As a result of the coin toss, programs listed as odd numbers were chosen to
comprise the sample. The study population was comprised of 131 programs offering the
associate degree, 46 programs offering a certificate of completion, and 19 baccalaureate
programs. Program directors from each of these 186 institutions were mailed a copy of
the survey and a self-addressed, stamped envelope. Subjects were asked to return the
completed questionnaires within two weeks of receipt. Statistics were descriptive in
nature with responses tallied and total number of responses for each item reported.
Anecdotal remarks were compiled and are included in the discussion section.
Results
One hundred twenty-four program directors responded to the survey (67% response
rate). Baccalaureate program response rate was 88%, associate degree program response
rate was 63%, and certificate program response rate was 54%. Respondents indicated
that the majority of clinical education is provided by respiratory therapy program faculty,
followed by paid preceptors as the second most frequent providers. Table 1 contains data
that show how clinical education is provided to students. Sixty-eight respondents (55%)
indicated that hospital restructuring has affected their clinical curricula, while 56
respondents (45%) reported that they were unaffected, thus far. Of those 56 respondents,
38 (68%) reported that they used paid clinical instructors or respiratory care program
faculty to provide clinical instruction.
5
IMPACT OF RESTRUCTURING ON RC CLINICAL EDUCATION
Table 1
Provision of Clinical Education among Respiratory Care Education Programs (N=124)
Private Means of Providing Clinical Education
(Respondents Could Select > 1 Response)
Affiliate reimbursed by school
Affiliate required to provide instruction (per contract)
Volunteer clinical instructors
Paid clinical instructors
Respiratory care program (college/university) faculty
Number of
Respondents
18
41
37
43
79
Table 2 includes information about how hospital restructuring is affecting programs’
clinical rotation schedules. Thirty-five respondents indicated that their affiliate
departments were accepting fewer students per clinical rotation, while 33 respondents
reported a change in the services provided by their affiliates’ respiratory therapy
departments.
Table 2
Effects of Hospital Restructuring on Respiratory Care Programs’ Clinical Rotation
Schedule (N=68) (56 Respondents Reported that their Programs Were Currently
Unaffected by Hospital Restructuring)
Private Effect of Hospital Restructuring on
Respiratory Care Program Clinical Rotation Schedule
(Respondents Could Select > 1 Response.)
Departments no longer willing to accept respiratory
care students
Departments accepting fewer respiratory care students
Departments unable to provide volunteer (‘free’) instructors
Change in services provided by respiratory care practitioners
Specific rotations canceled
Number of
Respondents
16
33
21
35
8
Table 3 lists the frequency of alternative strategies used to counterbalance the negative
effects of restructuring. Forty-seven respondents indicated that they are using alternate
sites in order to provide clinical rotations; these sites included subacute care facilities,
skilled nursing facilities, home care agencies, pulmonary rehabilitation programs, and
smaller, outlying community hospitals. Thirty-four respondents indicated that they are
trying to send better-prepared students to clinical rotations by strengthening the
6
IMPACT OF RESTRUCTURING ON RC CLINICAL EDUCATION
laboratory component of their programs. Others indicated that they had recently added
phlebotomy, electrocardiogram, and sleep laboratory rotations to their existing clinicalsite offerings. It is interesting to note that 14 respondents indicated that they are using
nursing or other health professionals as clinical instructors.
Table 3
Alternative Strategies Used To Counteract Effects of Hospital Restructuring on the
Clinical Component of Respiratory Care Education Programs (N = 68)
Strategy
(Respondents Could Select > 1 Response.)
Number of
Respondents
Use of alternate clinical sites (outpatient care, subacute,
community hospitals)
Requiring fewer clinical hours in curriculum
Requiring different clinical rotations at affiliate
Increased use of other health professionals or nurses
as preceptors
‘Beefing up’ respiratory care labs
47
2
16
14
34
Table 4 reports data on how respiratory care programs are ‘beefing up’ their
laboratories in an effort to better prepare students for clinical rotations. All respondents
to this section indicated that they were adding, or planning to add in the near future,
some type of computer-assisted instructional tool. More than half are also using more
‘real-life’ examples in their labs, including buying better quality manikins, using more
role play, using real patient cases, and purchasing more up-to-date equipment.
Table 4
Methods Used To Enhance the Quality of Respiratory Care Laboratories
Method
(Respondents Could Select > 1 Response) (N=34)
Requiring more lab hours In curriculum
Using more ‘real-life’ lab experiences
(case studies, critical pathways, role play)
Adding or increasing amount of open lab time
Using lab instructors for open lab time
Computer-assisted learning
Number of
Respondents
11
19
18
11
34
7
IMPACT OF RESTRUCTURING ON RC CLINICAL EDUCATION
Discussion
It is clear from the data that hospital restructuring is effecting the clinical curricula of
respiratory care education programs. How we allow it to affect us is, in large part, up to
us. Restructuring affords new opportunities to acquire new skills. While some RCPs may
take responsibility for routine activities, such as patient hygiene, many RCPs are seizing
the opportunity to take on more sophisticated procedures such as hemodynamic
monitoring and sleep study. In order to do this, some less complex procedures (i.e.,
incentive spirometry, pulse oximetry checks, oxygen rounds) may need to be shifted to the
responsibility of other health care professionals. Like other professional groups, RCPs are
inclined to ‘hold on’ to every procedure; we need to exercise flexibility in the area of role
delineation. If certain simpler procedures traditionally performed by respiratory therapists
are given over to another caregiver, the opportunity to educate presents itself. Whether
nursing personnel or patient care technicians are to assume these skills, someone has to
teach them. As respiratory care program faculty, we are in the unique situation to assist
the hospital department by offering our skills and taking responsibility for such training.
As a result of the implementation of critical pathways, therapist-driven protocols, and
total quality management approaches, RCPs need critical-thinking and assessment skills.
The RCP is no longer in the position of simply carrying out orders prescribed by the
physician. But critical thinkers are made, not born. There is no better place to begin
practicing these skills than the classroom and the respiratory therapy laboratory. Students
require lots of practice working through critical pathways, role playing, and selecting the
appropriate information from care histories. We need to shift our focus in our educational
programs from task-orientation and psychomotor skilling to the development of critical
evaluation and assessment skills. Students who have some background in the research
process are better able to perform total quality management activities and spend time on
the development of basic research skills.
The results of this study also indicate that respiratory care programs are facing greater
difficulty placing students in clinical rotations. In order to change this, we have to adopt a
‘what-can-we-do-for-you’ negotiating style. There are a myriad of ways that we can make
ourselves useful to the hospital and show our appreciation by offering in-services to
department personnel or providing training to other departments who are taking on
‘respiratory’ responsibilities. We can assist departments in the development of protocols
and critical pathways, or we can actively participate in the clinical instruction of our
students (recall that those faculty who actually ‘do’ clinical instruction are having fewer
problems related to restructuring).
Perhaps, one of the most important ways we can effect change is in the preparation of
students. We need to be positive; the way in which our students come to perceive other
health care professionals and the situations they encounter at the clinical affiliate is largely
a reflection of our own attitudes. As educators we need to identify the strengths of our
programs and students and play to them. We should send students who are well prepared,
self directed, reliable, and motivated, and coach them actively in these areas. The
literature abounds with studies showing that preceptors teach because of the intrinsic
8
IMPACT OF RESTRUCTURING ON RC CLINICAL EDUCATION
rewards that they receive from these types of students (Dunlevy & Wolf, 1992a, 1992b,
1994; Gwyer, 1993). Let students know that it is important to show appreciation to their
clinical instructor(s) by saying “thanks for your time” at the end of the day. Let the
students know that you will be checking to see if they are doing these things, and make it
worth their while to do so.
The changing arena in health care today is nothing new. This has not been the first
storm that respiratory care educators have weathered, and it is unlikely to be the last. In
order to survive, we must be positive, willing to compromise, informed and involved,
objective; and we must communicate often with students and preceptors. Educators are
in the enviable position of being able to effect change in the practice of respiratory care,
the lives of students, and the patients for whom they care. If we are proactive rather than
reactive, we can influence the impact that hospital restructuring has on our programs and
on our profession. In his autobiography, Henry Adams reflected upon the nature and
purpose of education. He celebrated the importance of the teacher: “A teacher affects
eternity; he can never tell where his influence stops.”
References
American Association for Respiratory Care. (1993) AARC policy statement on health
care reform and the role of respiratory care. AARC Times, 17(4), 39-40.
Andersen, A. & American Association for Respiratory Care. (1992). A study of
respiratory care practice. Dallas: American Association for Respiratory Care.
Bunch, D. (1992). Hospital restructuring: The respiratory care director’s perspective.
AARC Times, 16(4), 32-4.
Dunlevy, C.L. & Wolf, K.N. (1992a).Perceived differences in the importance and
frequency of practice of clinical teaching behaviors. Journal of Allied Health, 21, 175-84.
Dunlevy, C.L. & Wolf, K.N. (1992b). Perspectives on teaching practices in
clinical/field settings. Distinguished Papers Monograph, 1, 39-47. Dallas: American
Association for Respiratory Care.
Dunlevy, C.L. & Wolf, K.N. (1994). Clinical learning experiences of allied health
students. Distinguished Papers Monograph, 3, 3-10. Dallas: American Association for
Respiratory Care.
Galvin, B., Rinker, R.M., & Wojciechowski, W.V. (1995). Respiratory care education:
Changing with the evolving health care system. AARC Times, 19(3), 16-20.
Gwyer, J. (1993). Rewards of teaching physical therapy students: Clinical instructors’
perspectives. Journal of Physical Therapy Education, 7(2), 63-6.
9
IMPACT OF RESTRUCTURING ON RC CLINICAL EDUCATION
Meyers, S.K. (1995). Exploring the costs and benefits drivers of clinical education.
American Journal of Occupational Therapy, 49(2), 107-11.
O’Daniel, C. (1995). Health care skill standards and multiskilling: Implications for
respiratory care education. AARC Times, 19(3), 8-14.
Reimer, M.S. (1992). Computerized cost analysis for the nursing skills laboratory.
Nurse Educator, 17(4), 8-11.
Satran, L., Price W.G., Anderson, C. & Minsck, R. (1993). Hospital-based versus
community-based clinical education: Comparing performances and course evaluations by
students in their second year pediatrics rotation. Academic Medicine, 68(5), 380-2.
Author Note
At the time this paper was accepted for publication, Crystal L. Dunlevy, EdD, RRT,
was Associate Professor & Director of Clinical Education; and Phillip Hoberty, EdD,
RRT, is Assistant Professor, Respiratory Therapy Division. Dr. Dunlevy is now a faculty
member at Georgia State University, Atlanta, Georgia. William F. Galvin, MSEd, RRT, is
Program Director, Respiratory Care.
Correspondence concerning this article should be addressed to Crystal L. Dunlevy,
Georgia State University, Atlanta, GA 30303-3083.
10
STUDENTS’ PERFORMANCE ON WRITTEN CLINICAL SIMULATIONS
Respiratory Care Education Annual
Volume 6, Spring 1997, 11-29
EFFECTS OF CONTENT, PROCESS, COMPUTER-ASSISTED
INSTRUCTION, AND CRITICAL-THINKING ABILITY ON STUDENTS’
PERFORMANCE ON WRITTEN CLINICAL SIMULATIONS
David C. Shelledy, Mark A. Valley, and Douglas L. Murphy
The University of Texas Health Science Center at San Antonio
Michael E. Carpenter
St. Philip’s College, San Antonio, Texas
We compared the effects of content instruction (CI), process instruction (PI),
computer-assisted instruction (CAI), and critical-thinking ability on student
performance on a written latent-image clinical simulation problem (CSP). CAI
and CI were associated with significant improvements in students’ decisionmaking (DM) scores. PI was associated with significant improvements in students’
information-gathering (IG) scores. It appears that understanding the exam process
improves student IG performance, while content knowledge and CAI improve
DM. There was a moderate correlation between critical-thinking ability and
performance on IG. Critical thinking was not related to initial DM performance,
but may have had an impact on students’ ability to gain from instruction and
practice.
11
STUDENTS’ PERFORMANCE ON WRITTEN CLINICAL SIMULATIONS
EFFECTS OF CONTENT, PROCESS, COMPUTER-ASSISTED
INSTRUCTION, AND CRITICAL-THINKING ABILITY ON STUDENTS’
PERFORMANCE ON WRITTEN CLINICAL SIMULATIONS
Introduction
In 1979 the National Board for Respiratory Care (NBRC) began administering clinical
simulation patient management problems as part of the examination system for
credentialing registered respiratory therapists (Reinecker, 1985; Rosen, 1983; Traband &
George, 1994). Previously, oral examinations were used in an attempt to assess
conditional problem-solving abilities. Oral examinations had certain logistical problems,
and the use of clinical simulation examinations corrected these problems. Candidates for
the oral examinations were often required to travel long distances to limited test sites
(Rosen, 1983). The examinations were subjective, expensive to administer, and required a
trained cadre of oral examiners. Only a limited number of the total applicant pool could
be tested at a given time (Rosen, 1983; Traband & George, 1994). Variations in
individual examination content and bias of examiners may have resulted in inconsistent
and subjective outcomes (Rosen, 1983). The implementation of the written clinical
simulation examination allowed for multiple testing centers with increased frequency of
test dates (Traband & George, 1994). Individual examiner bias and subjectivity were
eliminated (Rosen, 1983).
Clinical simulation testing is thought to assess problem-solving ability, critical thinking,
judgment, and clinical decision-making competence in a way that may not be measured
using multiple choice tests (Bersky & Yocom, 1994; Reinecker, 1985). Clinical simulation
testing has been used to assess competence in medicine and respiratory care and is
currently being considered in the field of nursing (Bersky & Yocom, 1994; Norcini, 1986;
Reinecker, 1985; Rosen, 1983; Traband & George, 1994).
Computer-assisted instruction (CAI) offers a method to provide automated,
individualized instruction that allows students to proceed at their own pace (Hmelo,
1989; Shelledy, 1987). CAI can provide branching in the instructional program with
immediate feedback based on the individual student’s response (Chop, 1989; Reinecker,
1985; Shelledy & Mikles, 1987). CAI offers an alternative teaching method that can be as
effective as classroom instruction while offering greater freedom in scheduling student
access without consuming additional instructor time (Hmelo, 1989; Shelledy & Mikles,
1987). By increasing instructional efficiency, CAI may provide educators with more time
to focus on students with additional problems (Hmelo, 1989).
CAI is able to reinforce previous learning and may help students gain clinical problemsolving skills without jeopardizing patients (Boh, 1987; Chop, 1989; Hmelo, 1989;
Reinecker, 1985; Shelledy, 1987). Computerized clinical simulation testing is a way to
realistically simulate clinical decision making and evaluate clinical competence (Bersky &
Yocom, 1994). Many respiratory care educators use CAI for its simulation capabilities to
prepare students for the NBRC examination (Chop, 1989; Reinecker, 1985). Schools of
dentistry, pharmacy, nursing, medicine, and other allied health professions incorporate
12
STUDENTS’ PERFORMANCE ON WRITTEN CLINICAL SIMULATIONS
clinical simulation software in their training programs (Bersky & Yocom, 1994; Boh,
1987; Chop, 1989; Friedman, 1995; Norcini, 1986; Reinecker, 1985).
Hmelo (1989, 1990) offers an excellent review of the published literature regarding the
use of CAI in health professions education. It is interesting that Hmelo (1989-90) states
that most of the literature is descriptive in nature, and that only 7 of more than 100
papers reviewed contained detailed evaluations of the effectiveness of the computer
programs used. There have been problems in assessing the effect of CAI on problem
solving and critical thinking due to the difficulty in finding a suitable measurement tool
(Bitzer & Bitzer, 1973; Hmelo, 1989, 1990). There is some evidence that students
acquire better decision-making skills with the use of a computer (Jones & Keith, 1983).
There also may be relationships between critical thinking, length of education, and types
of instruction; however, these relationships need further study (Dobrzykowski, 1994;
Dowd, 1991; Miller, 1992; Pond, Bradshaw & Turner, 1991; Robbins, 1988). Hmelo
also writes that despite the widespread use of CAI in health education, very little research
has been done to validate its use.
The NBRC Examinations as a Measure of Program Success
Graduates of advanced-level respiratory care education programs are expected to
demonstrate the ability to comprehend, apply, and evaluate information relevant to the
role of the respiratory therapist (Joint Review Committee for Respiratory Therapy
Education [JRCRTE], 1995). Current accreditation guidelines for therapist programs
require that pass rates on the NBRC written and clinical simulation registry examinations
be used as measures of an education program’s success in meeting this standard. As a
measure of advanced-practitioner education program effectiveness, the number of
graduates who go on to become registered respiratory therapists (RRT) may be one of the
most important indicators of program success.
National new graduate pass rates on the NBRC written registry examinations generally
range from about 75 to 77% for first-time takers of the exam (NBRC, 1994, 1995). Pass
rates for first-time examination takers for the NBRC clinical simulation examinations
averaged 53% for the period of 1989-1994 (Traband & George, 1994). The first-time
pass rate (i.e., cumulative score) for both exams, which must be passed for takers to be
awarded the RRT credential, must be less than or equal to the pass rate of the most
difficult examination. Consequently, first-time pass rates on the combined examinations
for registry may be less than desirable. If one purpose of advanced-practitioner education
programs is to prepare students to become registered respiratory therapists, it is apparent
that, on average, the education community has not demonstrated a great deal of success in
achieving this goal. First-time and repeat candidate registry examination pass rates for the
period 1993-1995 are found in Figure 1 (NBRC, 1994; 1995; 1995).
13
STUDENTS’ PERFORMANCE ON WRITTEN CLINICAL SIMULATIONS
Figure 1. First time and repeat candidate pass rates for the National Board for Respiratory
Care written registry examinations and clinical simulation examinations for period 1993
through June of 1995. NOTE: WRRT = written registry examination; CSE = clinical
simulation examination.1
1
Data used to develop the figure from “1993 Examinations in Review,” 1994; NBRC
Horizons, 20(2), p. 7; “’94 Examination Statistics,” 1995; NBRC Horizons, 21(2), p. 67; and “NBRC Bulletin Board: RRT Examination,” 1995; NBRC Horizons, 25(5), p. 8.
14
STUDENTS’ PERFORMANCE ON WRITTEN CLINICAL SIMULATIONS
Problem
While education programs have been modestly successful in preparing graduates to pass
the NBRC written registry examinations, they have had limited success in preparing
graduates to pass the clinical simulation examination. We sought to determine if specific
types of instruction can be useful in improving performance on the clinical simulation
examination.
Factors That May Be Related to Examination Performance
Candidates’ success on the NBRC clinical simulation examination may be related to
their achievement or abilities in five broad areas. First, successful candidates should
possess content knowledge in the area being tested. For example, in completing a clinical
simulation problem (CSP) concerning the care of a patient with chronic obstructive
pulmonary disease (COPD), the successful candidate should possess content knowledge
related to the diagnosis, treatment, and application of respiratory care to COPD patients.
We hypothesized that instruction about content related to the care of a specific patient
condition tested by a CSP would improve student performance.
Second, successful clinical simulation examination candidates should understand the
process of taking the examination. This includes understanding the mechanics of the
exam, how points are awarded, and techniques to maximize performance (e.g., making a
map). Even expert clinicians may perform poorly on clinical simulation exams if they do
not understand the mechanics of the test. We hypothesized that instruction about the
process of taking the exam would improve student performance on written CSPs.
Third, it was believed that practice with actual SPs would enhance a candidate’s
performance on the real thing. Learning usually improves with repetition and
performance tends to improve with practice. Because CAI clinical simulations are widely
available, many clinical simulation exam candidates use these programs in preparation for
taking the actual test. Using a commercially available computer simulation run in the
teach mode, we evaluated the effect of CAI on students’ performance on a written latentimage simulation. The computer program provides the student with feedback based on
their choices as the student works through the CSP.
Fourth, it was hypothesized that generalized critical-thinking skills and problem-solving
ability would be related to candidates’ success on specific clinical simulation problems.
Clinical simulations purport to test candidates’ problem-solving and critical-thinking
abilities. It would seem that individuals with strong critical-thinking skills would tend to
outperform those with weaker critical-thinking abilities.
Fifth, it is generally thought that clinical experience caring for a variety of patients will
improve candidates’ scores on the clinical simulation examinations (George & Oslick,
1995; Traband & George, 1994). Prior to 1983, a year of clinical experience was required
before candidates were allowed to sit for the NBRC clinical simulation exams (NBRC,
1995). In spite of this experience requirement, new candidate pass rates on the exam were
in the 50-55% range. Examination candidates prior to 1983 did not do appreciably better
than today’s candidates who do not have a specific experience requirement.
15
STUDENTS’ PERFORMANCE ON WRITTEN CLINICAL SIMULATIONS
This raises the question as to what amount and type of clinical experience is most
beneficial. Last, it should be recognized that a major factor in determining performance
on clinical simulation examinations may be the amount of time and effort spent by the
individual student in preparation for the exam.
Purpose
The purpose of this study was to compare the effects of content instruction (CI),
process instruction (PI), and CAI on student performance on a written latent-image
clinical simulation problem. Further, the study assessed the relationship of general criticalthinking ability to performance on a written clinical simulation problem. Research
questions addressed were:
1. What impact does content instruction have on student performance on written
latent-image clinical simulation problems?
2. What impact does knowledge of the structure and process of taking clinical
simulation problems have on student performance on written latent-image clinical
simulation problems.
3. What impact does practice using CAI programs with feedback have on student
performance on written latent-image clinical simulation problems?
4. What is the relationship between general critical-thinking skills and performance on
clinical simulation problems?
Method
An available sample of all first-year students (N = 24) enrolled in a community college
respiratory care program were selected for study. All students had successfully completed
all program prerequisites and one semester of academic and clinical respiratory care
coursework. The students were pretested using a CSP provided by the NBRC. The
students were then randomly assigned to three groups. Each group received one hour of
instruction: Group 1—CAI practice using a commercially available clinical simulation
run in the teach mode (Medi-Sim, Inc.); Group 2—CI relevant to the written simulation;
Group 3—PI over the structure of written simulations and techniques to maximize
performance. Outlines of the instruction provided for each group are found in Tables 1-3.
Following instruction, students repeated the CSP. Students also completed the WatsonGlaser Critical-Thinking Appraisal. This test is designed to determine subjects’ ability to
reason analytically and logically. The Watson-Glaser uses five subtests to assess the
subject’s ability to make inferences, recognize assumptions, perform deduction, and
interpret and evaluate arguments (Berger, 1985). The scores on these five subtests are
combined to generate an overall critical-thinking score (Berger, 1985).
16
STUDENTS’ PERFORMANCE ON WRITTEN CLINICAL SIMULATIONS
Table 1
Outline of the Optimal Path for the Computer Simulation: Adult Asthmatic
I. Initial menu choice: Teach mode—provides immediate feedback to the student
following each selection during the simulation
II. An adult asthmatic in the emergency room in acute distress
A. Decision making: Administer low flow oxygen
B. Information gathering: Gather patient assessment data and blood gases
C. Decision making: Administer bronchodilator therapy
D. Decision making: Patient condition worsens, increase oxygen flow
III. Time passes, patient condition worsens
A. Decision making: Intubate and mechanically ventilate
B. Decision making: Select mode of ventilation
C. Decision making: Select initial ventilation setting
IV. Patient stabilized, problematic secretions
A. Decision making: Begin chest physical therapy
V. Four days pass on the ventilator—patient in IMV mode
A. Decision making: Decrease the IMV rate
B. Decision making: Based on assessment data provided, institute “T” tube trial
C. Decision making: Based on assessment provided, extubate the patient
NOTE: IMV = intermittent mandatory ventilation; “T” tube = Briggs adaptor. Adapted
from the computer simulation, “Clinical Simulation in Respiratory Therapy: Adult
Asthmatic,” B. Kacmarek, 1991, Williams and Wilkins Electronic Media, with
permission of the author.
17
STUDENTS’ PERFORMANCE ON WRITTEN CLINICAL SIMULATIONS
Table 2
Management and Monitoring of the Ventilated Patient Lesson Plan Outline
I. Objectives
II. Physical assessment of the mechanically ventilated patient
A. General appearance
1. Color
2. Sensorium
B. Vital signs
1. Heart rate
2. Respiratory rate
3. Blood pressure
4. Temperature
a. Presence of infection
C. Chest examination
D. Miscellaneous
E. Lab data
1. Arterial blood gases
2. Chest x-ray
III. Monitoring typical ventilation parameters
A. Mode
B. Tidal volume
1. Calculating ideal body weight
C. Frequency of mechanical breaths
D. Peak inspiratory pressures
E. FIO2
1. If > 40%, consider PEEP
F. Flow
G. Compliance
H. PEEP
I. Inspired gas temperature
J. Alarm
K. Other important checks
IV. Administering medication “in-line” to a ventilator patient
A. Medications
B. Procedure
V. Troubleshooting the ventilator for typical problems and alarm states
A. High pressure
B. Low pressure
C. Complications
1. Pneumothorax
D. Corrective actions
NOTE: Developed by David C. Shelledy.
18
STUDENTS’ PERFORMANCE ON WRITTEN CLINICAL SIMULATIONS
Table 3
Clinical Simulation Examination Structure and Process Lesson Plan Outline
I.
II.
III.
IV.
V.
VI.
VII.
VIII.
IX.
X.
XI.
Objectives
A. Insight into exam structure and content
B. Strategies and techniques for successful examination performance
Definition of a simulation
Types of simulations
A. Models
B. Oral simulations
C. Computer simulations
D. Latent image hidden response written simulation
General rules
A. Take charge
B. Follow standards of practice
C. Take your time
D. Think before acting
E. Follow directions
Design
A. Scenario
B. Information gathering
C. Decision making
The scenario
A. Purpose
B. Main ingredients
C. Example
Information gathering
A. Identify the problem
B. Techniques to succeed
C. Process
D. Criteria
E. Key elements to select
F. Key elements to avoid
G. Triggers
H. Identify the problem
Decision making
A. Item selection
B. Physician disagrees
1. What to do
2. Identify the problem
Selection of exam problem
Branch mapping
Types of branching
A. Example of single branching
19
STUDENTS’ PERFORMANCE ON WRITTEN CLINICAL SIMULATIONS
B. Example of complex branching
XII. Routes and importance of making a map
XIII. Scoring
XIV. Related terms
A. Alternate sections
B. Option
C. Responses
D. Bridge statement
XV. Common errors
A. Technical
B. Nontechnical
XVI. Summary and points of emphasis
NOTE: PEEP = positive end-expiratory pressure. Adapted from “Preparing for
Successful Completion of the Clinical Simulation Exam” by W. Galvin, 1992, Gwynedd
Mercy College, Gwynedd, PA, with permission of the author.
Data Analysis
Pretest scores IG and DM scores for the three groups were compared using the
Kruskal-Wallis ANOVA. No significant difference (p > .05) on pretest scores would
indicate that the three groups were similar prior to instruction (CSS, 1991). Pretest and
post-test scores for information gathering (IG) and decision making (DM) were compared
to determine if there were significant improvements using the Wilcoxon matched pairs
test for dependent samples (CSS, 1991). Overall critical-thinking scores were compared to
pretest scores, post-test scores, and change scores for IG and DM using the Pearson
product moment correlation to determine if there were significant (p < .05) correlations
between sets of scores (Ary, Jacobs, & Razavich, 1985).
Results
Individual scores, change scores, group means, and standard deviations are reported in
Table 4. There were no significant differences in pretest scores for IG (p = .31) or DM (p
= .37) using the Kruskal-Wallis ANOVA (Table 5). Following instruction, change scores
ranged from -9 to +14 in IG and -20 to +80 in DM for the CAI group. Change scores
ranged from -5 to +36 in IG and 0 to +70 in DM for the CI group. Individual change
scores for the PI group ranged from -14 to +27 for IG and -20 to +90 for DM. The CAI
group mean scores improved +5 (SD = 10) for IG and +31 (SD = 41) for DM. The CI
group mean scores improved +4 (SD = 14) for IG and +21 (SD = 24) for DM. The PI
group mean scores improved +8 (SD = 13) for IG and +11 (SD = 36) for DM.
20
STUDENTS’ PERFORMANCE ON WRITTEN CLINICAL SIMULATIONS
Table 4
Comparison of the Scores of Three Student Groups on a Written Simulation Problem
Information-Gathering Scores
Student Instruction Pretest Post-Test Change
1
2
3
4
5
6
7
8
Mean (SD)
9
10
11
12
13
14
15
16
Mean (SD)
17
18
19
20
21
22
23
24
Mean (SD)
CAI
CAI
CAI
CAI
CAI
CAI
CAI
CAI
CI
CI
CI
CI
CI
CI
CI
CI
PI
PI
PI
PI
PI
PI
PI
PI
46
86
73
73
77
77
55
46
67 (15)
77
77
96
50
73
77
73
91
77 (14)
68
91
46
73
86
73
59
59
69 (15)
55
77
82
73
68
91
68
59
72 (12)
86
77
91
86
73
77
68
91
81 (9)
73
77
68
82
86
77
86
73
78 (7)
+9
-9
+9
0
-9
+14
+13
+13
+5 (10)
+9
0
-5
+36
0
0
-5
0
+4 (14)
+5
-14
+22
+9
0
+4
+27
+14
+8 (13)
Decision-Making Scores
Pretest Post-Test Change
50
30
-30
70
100
40
0
60
40 (41)
40
60
100
80
40
30
80
80
64 (25)
10
90
80
80
20
70
50
100
63 (33)
70
100
50
50
90
100
60
50
71 (22)
40
100
100
80
60
100
100
100
85 (23)
100
100
60
100
-10
70
70
100
74 (38)
+20
+70
+80
-20
-10
+60
+60
-10
+31 (41)
0
+40
0
0
+20
+70
+20
+20
+21 (24)
+90
+10
-20
+20
-30
0
+20
0
+11 (36)
NOTE: CAI = computer-assisted instruction; CI = content instruction; PI = process
instruction; SD = standard deviation.
21
STUDENTS’ PERFORMANCE ON WRITTEN CLINICAL SIMULATIONS
Table 5
Results of the Kruskal-Wallis ANOVA by Ranks Test for Comparing Pretest IG and DM
Scores on a Written Latent-Image Clinical Simulation Problem
Independent
Variable
Group
Assignment
Dependent
Variable
Pretest IG Scores
Mean (SD)
N
Sum of
Ranks
H (2,24)
p
CAI
CI
PI
67 (15)
77 (14)
69 (15)
8
8
8
86.5
124.5
89.0
2.32
.31
Independent
Variable
Group
Assignment
Dependent
Variable
Pretest DM Scores
Mean (SD)
N
Sum of
Ranks
H (2,24)
p
8
8
8
77.0
111.0
112.0
2.01
.37
CAI
CI
PI
40 (41)
64 (25)
63 (33)
NOTE: CAI = computer-assisted instruction; CI = content instruction; PI = process
instruction; IG = information gathering; DM = decision making; SD = standard
deviation; N = number of subjects; H = Kruskal-Wallis matched pairs test (This is a
nonparametric alternative to between groups one-way analysis of variance. The
interpretation is similar to the parametric one-way ANOVA, except that it is based on
ranks rather than means); p = probability.
The results of the Wilcoxon matched pairs test for comparing pretest and post-test
student scores are found in Table 6. There were significant improvements in IG for PI (p
= .05) while DM improved significantly for CAI (p = .05) and CI (p = .02) There were no
significant differences in pretest and post-test scores (p > .05) in IG for CAI or CI or in
DM for PI.
22
STUDENTS’ PERFORMANCE ON WRITTEN CLINICAL SIMULATIONS
Table 6
Results of the Wilcoxon Matched Pairs Test for Comparing Pretest and Post-Test
Student Scores on a Written Latent-Image Clinical Simulation Problem.
Group
Exam Section
N
T
p
IG
DM
IG
DM
IG
DM
8
8
8
8
8
8
5.0
6.5
3.0
0.0
4.5
8.0
.06
.05*
.23
.02*
.05*
.30
CAI
CI
PI
NOTE: CAI = computer-assisted instruction; CI = content instruction; PI = process
instruction; IG = information gathering; DM = decision making; N = number of
subjects; T = Wilcoxon matched pairs test (This test is a nonparametric alternative to
the t test for dependent samples, except that it is based on ranks rather than means);
p = probability.
* Significant at the .05 level for a one-tailed test.
The correlations between the Watson-Glaser Critical-Thinking Appraisal, pretest, posttest, and IG and DM change scores are found in Table 7. There was a moderate, but
significant correlation between general critical-thinking ability, pretest IG (r = .60; p =
.002), and post-test IG (r = .55; p = .006). There was not a significant relationship
between general critical-thinking ability and pretest DM (r = .25; p =.24). There was a
weak, but significant correlation between general critical-thinking ability and post-test
DM (r = .49; p =.015).
Table 7
Pearson-Product Moment Correlations between Critical Thinking Scores, and Pretest,
Post-Test and Change Scores for Information Gathering (IG) and Decision Making (DM)
Pretest
IG
DM
r = .60
(p = .002)*
r = .25
(p = .24)
IG
Post-Test
DM
r = .55
r = .49
(p = .006)* (p = .015)*
Change Scores
IG
DM
r = -.30
(p = .16)
r = .16
(p = .46)
NOTE: IG = information gathering; DM = decision making; r = Pearson product
moment correlation; p = probability.
* p < .05
23
STUDENTS’ PERFORMANCE ON WRITTEN CLINICAL SIMULATIONS
There was no relationship between critical-thinking ability and IG change scores (r =
-.30; p = .16) or DM change scores (r = .16; p = .46).
Discussion
Pretest Results
There were no significant differences (p = .31) between the three groups on pretest IG
and DM portions of the written simulation, indicating that the groups were evenly
matched prior to receiving instruction.
Information Gathering
PI was useful in significantly improving IG scores for most of our students. Six of 8
students (75%) receiving PI improved their post-scores from 4 to 27 points. Post-test
scores for those receiving PI improved, on average, 8 points (p = .05). One student
showed no improvement and one student’s post-test scores declined following PI. It
appears that knowledge of the objectives, design, exam structure, mechanics of the test,
scoring, branch mapping, and techniques to maximize scores was useful in improving IG
for most students.
CI was of little value in improving our students’ information-gathering skills. While
average scores for information gathering did improve for students receiving CI, the
improvement was not statistically significant (p = .23). Further, 6 of 8 students (75%)
showed no improvement or a decline in performance following instruction. Frankly, we
found this to be surprising. At least for our sample, additional instruction regarding the
respiratory care management of the disease state or condition tested by the CSP did not
improve students’ ability to select appropriate items from information-gathering sections
of the problem. It appears that performance on information-gathering sections of clinical
simulations may not be as strongly related to content knowledge as one might assume.
CAI may be of some value in preparing students to succeed on information-gathering
sections of clinical simulation examinations. Mean post-test IG scores improved 5 points
following CAI, and this improvement approached clinical significance (p = .06). Five of 8
students (62.5%) showed improvement on the post-test, one student showed no change,
and two students’ scores declined on the post-test following CAI. Thus, CAI may be of
value in improving some students’ IG scores.
To summarize, the results suggest that CI was of little value in improving IG for our
students. CAI may be of some value in improving students IG scores, though our results
do not clearly support this conclusion. The good news is that most students receiving
process instruction showed a significant improvement in information-gathering scores.
We believe that PI is an important method to consider when preparing students to
succeed on the clinical simulation examinations.
Decision Making
Mean post-test scores for DM improved 31 points for the group receiving CAI (p =
.05). Five out of 8 students (62.5%) receiving CAI improved their scores from 20 to 80
24
STUDENTS’ PERFORMANCE ON WRITTEN CLINICAL SIMULATIONS
points following instruction. Three students receiving CAI showed a decline in their
scores following instruction. Thus, CAI was useful in improving most, but not all
students’ DM scores.
Mean post-test scores for DM improved 21 points for the group receiving CI (p = .02).
With respect to CI, 5 of 8 students (62.5%) improved their DM scores from 20 to 70
points following instruction. Three students receiving CI showed no change in DM, one
achieved 100% on both the pretest and post-test. Thus, CI appears to be useful in
improving most students’ DM scores.
There was no significant improvement in DM for those receiving PI (p = .30). Thus,
understanding the mechanics of the test was of little value in improving our students
performance in DM.
To summarize, CI significantly improved DM performance. It appears that success in
DM is related to content knowledge regarding the respiratory care management of the
disease state or condition tested by the CSP. Instruction related to content outline of the
NBRC clinical simulation examination should be helpful in preparing students for
success, at least on DM sections of the exam. CAI using a commercially available clinical
simulation also was helpful in improving DM scores. The use of CAI clinical simulation
programs in NBRC exam preparation should be considered.
Critical Thinking and Clinical Simulation Exam Performance
There was a moderate correlation between critical-thinking ability and students’ scores
on the pretest (r = .60; p = .002) and post-test (r = .55; p = .006) IG sections of the CSP.
Thus, it appears that students with good general critical-thinking abilities may perform
better on IG sections of clinical simulation exams than those with poor critical-thinking
abilities.
There was not a significant relationship between critical thinking and pretest DM
scores (r = .25; p = .24). This was surprising in that clinical simulation exams purport to
measure problem-solving and applied critical-thinking ability. Perhaps our sample was too
small to demonstrate a relationship. Further, the CSP we used may not be representative
of the domain of interest. The possibility should be considered, however, that success in
making correct decisions on CSPs may not be as strongly related to general criticalthinking ability as is commonly thought. There also was no relationship between criticalthinking ability and the IG and DM change scores, indicating that the degree of
improvement in IG and DM scores following instruction was not related to general
critical-thinking ability.
There was a weak, but significant relationship between critical-thinking ability and
CSP post-test scores for DM (r = .49; p = .015). Those with good critical-thinking
abilities tended to do somewhat better in DM following instruction.
Limitations and Recommendations for Further Study
We found a relationship between CI, CAI, and success with DM. There also were clear
relationships between process instruction, critical-thinking ability, and success with IG.
The unexpected findings of this study included a poor correlation between general
critical-thinking ability and DM and the lack of a relationship between content
25
STUDENTS’ PERFORMANCE ON WRITTEN CLINICAL SIMULATIONS
instruction and IG. These findings need to be verified by further study. The relationship
between general critical-thinking ability and real-life decision making in the clinical
setting needs to be explored. Further study is also needed to determine if there is a
relationship between specific respiratory care content knowledge and performance on IG
sections of clinical simulation problems. The relationships between clinical simulation
exam performance and real-life clinical problem-solving and critical-thinking ability also
needs further study.
Caution must be used in interpreting the results of this study, for several reasons.
Sample size was small, and the sample may not be representative of the larger population.
The CSP used may not be a good example of actual NBRC simulations currently in use.
Further, the use of a pretest may have inadvertently improved student scores on the posttest by providing practice with the written CSP format. In addition, the instruction
provided may not have been powerful enough to generate a strong effect because of the
content or short duration (1 hour). Lastly, the instruction provided may not be
representative of other forms of PI, CI, or CAI.
Recommendations for Practice
While our study raises a number of interesting questions, respiratory care educators are
still left with the problem of trying to adequately prepare students for success on the
NBRC registry examinations. Our results support the contention that students should
receive instruction covering the objectives, design, exam structure, mechanics of the test,
scoring, branch mapping, and techniques to maximize scores, as this may be useful in
improving IG performance. Students should also receive instruction based on the NBRC
clinical simulation examination content matrix, as this may improve DM performance.
CAI using commercially available clinical simulations should also be considered, as our
study provides evidence that CAI can be useful in improving DM and may be useful in
improving IG. The role of clinical experience in improving candidates’ performance on
CSPs and the relationships between critical thinking and clinical problem solving need
further study.
Conclusions
CAI and CI were associated with significant improvements in students’ DM scores. PI
was associated with significant improvements in students’ IG scores. It appears that
understanding the exam process has the greatest impact on student performance in IG,
while content knowledge and CAI practice have the greatest impact on DM. There was a
moderate correlation between critical-thinking ability and performance in IG. Critical
thinking was not related to initial DM performance, but may have had an impact on
students ability to gain from instruction and practice. There was a large degree of
variation in individual student scores for each form of instruction suggesting that a given
method may not be effective for all students.
26
STUDENTS’ PERFORMANCE ON WRITTEN CLINICAL SIMULATIONS
References
Ary, D., Jacobs, L. C., & Razavich, A. (1985). Introduction to research in education (3rd
edition). New York: Holt, Rinehart and Winston.
Berger, A. (1985). Review of the Watson-Glaser critical thinking appraisal. In J. V.
Mitchell (Ed.). The ninth mental measurements yearbook. Lincoln: The University of
Nebraska Press.
Bersky, A. K., & Yocom, C. J. (1994). Computerized clinical simulation testing: Its use
for competence assessment in nursing. Nursing & Health Care, 15(3), 120-127.
Bitzer, M. D., & Bitzer, D. L. (1973). Teaching nursing by computer: An evaluative
study. Computers in Biology and Medicine, 3, 187-204.
Boh, L. E. (1987). Development and application of a computer simulation program to
enhance the clinical problem-solving skills of students. American Journal of Pharmaceutical
Education, 51(3), 253-61.
Chop, W. C. (1989). Computer survey: Most RC programs use CAI. AARC Times,
13(4), 66.
Complete Statistical System (CSS) Statistica: Reference for Statistical Procedures. (1991).
Tulsa, OK: Statsoft.
Dobrzykowski, T. M. (1994). Teaching strategies to promote critical-thinking skills in
nursing staff. Journal of Continuing Education in Nursing, 25(6), 272-276.
Dowd, S. B. (1991). Teaching strategies to foster critical thinking. Radiologic
Technology, 62(5), 374-378.
Friedman, C. P. (1995). Anatomy of the Clinical Simulation. Academic Medicine,
70(3), 205-209.
Galvin, W. (1992). Preparing for successful completion of the clinical simulation exam.
Unpublished lesson plan, Gwynedd Mercy College, Gwynedd, PA.
George, B. F., & Oslick, T. (1995). Improving performance on the clinical simulation
examination. NBRC Horizons, 21(5), 1, 5-7.
Hmelo, C. E. (1989). CAI in the respiratory care educational program. AARC Times,
13(4), 58-63.
27
STUDENTS’ PERFORMANCE ON WRITTEN CLINICAL SIMULATIONS
Hmelo, C. E. (1989-90). Computer-assisted instruction in health professions
education: A review of the literature. Journal of Educational Technology Systems, 18(2), 83101.
Joint Review Committee for Respiratory Therapy Education. (1995). Respiratory care
accreditation handbook. Euless, TX.
Jones, G., & Keith, K. (1983). Computer simulations in health sciences. Journal of
Computer Based Instruction, 9, 108-114.
Kacmarek, B. (1991). Clinical simulation in respiratory therapy: Adult asthmatic.
Baltimore, Williams and Wilkins Electronic Media.
Miller, M. A. (1992). Outcomes evaluation: Measuring critical thinking. Journal of
Advanced Nursing, 17(12), 1401-1407.
National Board for Respiratory Care. ’94 Examination Statistics. (1995). NBRC
Horizons, 21(2), 6-7.
National Board for Respiratory Care. 1993 Examinations in Review. (1994). NBRC
Horizons, 20(2), 7.
National Board for Respiratory Care. Entry level examination system implemented in
1983. (1995). NBRC Horizons, 21(4), 5, 7.
National Board for Respiratory Care. NBRC Bulletin Board: RRT Examination.
(1995). NBRC Horizons, 21(5), 8.
Norcini, J. J. (1986). An evaluation of a computer simulation in the assessment of
physician competence evaluation & the health professional. Evaluation & the Health
Professional, 9(3), 286-304.
Pond, E. F., Bradshaw, M. J., & Turner, S. L. (1991). Teaching strategies for critical
thinking. Nurse Educator, 16(6), 18-22.
Reinecker, L. (1985). Computerized clinical simulations. Computer Education, 9(1),
57-66.
Robbins, Y. (1988). Teaching critical thinking to the respiratory care student. AARC
Times, 12(5), 23-24, 26-27.
Rosen, H. K. (1983). Clinical simulation examination of the NBRC: Is it better than
the oral examination? Respiratory Therapy, 13(1), 59-60, 63.
28
STUDENTS’ PERFORMANCE ON WRITTEN CLINICAL SIMULATIONS
Shelledy, D. C. (1987). Computer-assisted instruction (CAI) in arterial blood gas
interpretation: Part I: The effect of CAI on students’ ability to interpret blood gas values.
RESPIRATORY CARE, 32(2), 95-98.
Shelledy, D. C., & Mikles, M. A. (1987). Computer-assisted instruction (CAI) in
arterial blood gas interpretation: Part II: A comparison of the effects of CAI and
classroom instruction. RESPIRATORY CARE, 32(2), 99-102.
Traband, M. F., & George, B. F. (1994). The clinical simulation examination: Fact vs.
fiction. NBRC Horizons, 20(5), 1, 3-5.
Acknowledgments
Special thanks to William F. Galvin, MSEd, RRT, Director, Respiratory Care Program,
Gwynedd Mercy College, for use of his instruction materials, “Preparing for Successful
Completion of the Clinical Simulation Exam.”
Authors’ Note
David C. Shelledy, PhD, RRT, Chairman, and Mark A. Valley, MEd, RRT, Assistant
Professor, Department of Respiratory Care, Douglas L. Murphy, PhD, Evaluation
Specialist, Division of Instructional Development, The University of Texas Health Science
Center at San Antonio, and Michael E. Carpenter, MS, RRT, Program Director,
Respiratory Therapy Program, St. Philip’s College. Correspondence may be directed to
David C. Shelledy, PhD, RRT, Chairman, Department of Respiratory Care, The
University of Texas Health Science Center at San Antonio, 7703 Floyd Curl Drive, San
Antonio, TX 78284-7784.
29
NOTES
30
RELATIONSHIPS BETWEEN READING ABILITY & CRTT EXAMINATION PERFORMANCE
Respiratory Care Education Annual
Volume 6, Spring 1997, 31-46
EXPLORING THE RELATIONSHIPS BETWEEN READING ABILITY
AND CRTT EXAMINATION PERFORMANCE
Robert C. Shaw, Applied Measurement Professionals, and Steven J. Osterlind,
University of Missouri-Columbia.
Abstract
A nationally representative sample (N = 281) from three distinct preparatory programs,
whose ages ranged from 19-53 years, took a retired version of the CRTT examination and
the Nelson Denny Reading Test (NDRT). We hypothesized that identifying, isolating,
and understanding reading-related error factors could direct efforts to improve the
measurement precision and performance on the CRTT examination. We used
discriminant analysis to analyze the association between correctly responding to CRTT
examination items and reading ability and to determine whether the number of words
and syllable density could predict items possessing discriminant reading function. Using
regression analysis, we examined overlapping variance between CRTT examination and
NDRT total reading ability scores. With two-way ANOVA and MANOVA, we compared
CRTT examination and NDRT score means among program and age groups.
Discriminant analysis found that providing correct responses to 37 CRTT examination
items was predicted (p < .01) by vocabulary scores (+VOCDISC). The 37 +VOCDISC
items had stems with significantly (p < .05) higher mean syllable densities and fewer mean
words. The 37 +VOCDISC CRTT examination items also provided significantly (p <
.05) diminished contributions to the reliability of the CRTT examination. Younger (1927 years) candidates and Technician program candidates had significantly (p < .05) lower
mean CRTT examination and vocabulary scores. Encouraging lower syllable density and
more context in item stems could diminish vocabulary-related error to a small degree.
Programs training technician-level respiratory care candidates could probably improve
their students’ CRTT examination performance by considering reading ability as an
admission criterion and emphasizing vocabulary building skills in their curriculum.
31
RELATIONSHIPS BETWEEN READING ABILITY & CRTT EXAMINATION PERFORMANCE
EXPLORING THE RELATIONSHIPS BETWEEN READING ABILITY
AND CRTT EXAMINATION PERFORMANCE
Introduction
The certified respiratory therapy technician (CRTT) examination relies on responses to
written questions that candidates must read to infer achievement of entry level. This does
not seem remarkable. After all, paper and pencil examinations are routinely used
throughout general and professional education curricula and in credentialing and
licensing programs. However, what if some candidates were systematically prevented from
completely understanding the questions? Would the process be considered fair? Would the
test measure achievement as accurately as it could if candidates enjoyed more equal
understanding of the questions before responding? These questions are rhetorically
offered, but are important to consider as we begin exploring the relationships between
reading and CRTT performance.
Fortunately, we were not the first to explore this area. Ironson, Homan, & Willis
(1984) found that fourth graders with lagging reading abilities did less well on fourth
grade math problems they were capable of answering when the items were written to their
grade level. Therefore, it is possible that CRTT examination items may be written in such
a way that those with lagging reading abilities may fail to fully understand and thus offer
responses inconsistent with their underlying respiratory care ability. Inconsistent responses
inflate measurement error. We already know that cognitive measures are less than perfectly
precise. However, if we could identify a part of the source of imprecision, we could better
direct efforts to avoid reading-related error.
The first study of reading difficulty associated with respiratory care textbooks was
reported by Watson and Scully (1988). The following year, Chang (1989) attempted to
measure the reading difficulty of the 100-item written examination for registered
respiratory therapists (RRT). When he found that the average reading level of the
examination was less than the level of textbooks he reviewed, Chang concluded that there
was little chance that examinee performance would be effected by the difficulty of the text
presented in the examination items.
However, Chang’s methods weaken that assertion. Chang grouped the 100 items into
10 blocks of 10 items. His reading difficulty measures were derived from groups of items,
not individual items. This misses the critical point. A test item is a self-contained entity.
Responses to the item are not usually effected by surrounding items as they are intended
to measure an isolated construct. Were an item to interact with lower ability readers in a
way that engendered responses inconsistent with their respiratory care ability, Chang’s
technique would obscure the lack of understanding produced by one difficult to read item
by lumping it with other benign items. Further, Chang’s method ignored candidates’
responses to the items entirely because item responses were not measured. He inferred
how typical candidates would have responded based on the assumption that they first had
to read textbooks apparently more difficult to read than groups of test items.
32
RELATIONSHIPS BETWEEN READING ABILITY & CRTT EXAMINATION PERFORMANCE
Also, while there are many uses for reading difficulty measures (Klare, 1987; Fry, 1987
& 1990), measuring the reading difficulty of a credentialing/licensing examination like
the CRTT examination cannot be counted among them. In fact there is no generally
accepted way to measure reading difficulty of text presented in testing situations (Klare,
1987; Fry, 1987). As Klare and Fry suggest, trying out text on the intended audience is
the only way to definitively know how well they understand.
This is the approach we adopted for our study. To measure achievement of entry-level
respiratory care abilities, we used a 140-item version of the CRTT examination retired
after its use in the 1987 National Board for Respiratory Care (NBRC) validation study.
Since then, the test specifications have changed as a result of a 1993 job analysis study.
Certainly, there was substantial overlapping content before and after 1993, but it cannot
be said that the CRTT examination used in this study reflected current practice in every
way.
To measure reading abilities, we used the Nelson Denny Reading Test (NDRT). The
NDRT is a commercially available examination that used a substantial standardization
sample including subjects like those we intended to test (Brown et al., 1981). From the
NDRT, sample subjects generated vocabulary (VOC), comprehension (COMP), and
reading-rate (RATE) scores from 100 vocabulary items, 36 comprehension items and one
reading rate measure. VOC and COMP subscores were mathematically combined (2 M
COMP + VOC) to produce a TOTAL (TOT) score that could be compared to the
NDRT table of norms to describe a candidate’s reading grade level. However, we used the
raw NDRT scores, not the transformed grade-level scores.
Prospectively Stated Null Hypotheses
Lacking evidence that entry-level candidates’ reading abilities were related to CRTT
examination scores, we limited our prospective hypotheses to null statements and then
looked for evidence refuting those hypotheses.
1. VOC, COMP, and CRTT scores were not related to correctly answering CRTT
items.
2. CRTT scores could not be predicted from TOT scores from program and age
groups.
3. Mean CRTT, VOC, COMP, and RATE scores did not differ among program and
age groups.
These last two hypotheses reflected our interest in the interaction between candidates’
programmatic preparation and age, in addition to the straightforward relationship that
might exist between reading ability and CRTT examination performance for the whole
population.
Methods
Sampling
We created a database to sort all 460 accredited respiratory care programs by three
levels of geographic region (eastern, central, and western states) and program type
33
RELATIONSHIPS BETWEEN READING ABILITY & CRTT EXAMINATION PERFORMANCE
(Technician; associate’s degree, AS-Therapist; or bachelor’s degree, BS-Therapist). Once
sorted, we randomly selected nine sets of programs to solicit for the study. Program
directors were asked to have students participate who were within three months of
graduating. Testing began in March 1993 and continued through December 1993.
Twenty education programs from 12 states participated in the study. By the conclusion of
the testing phase, 282 usable exam score sheets were returned. This was 72.3% of the
score sheets sent to participating programs. There was one CRTT examination outlier, so
the sample size for data analysis was 281. Twelve subjects improperly completed the
reading rate section of the NDRT. Therefore, analyses involving reading rate included 269
subjects.
Data Screening
Because of the planned statistical procedures, we had to take special care to meet the
assumptions. A general guide describing the rational and methods of data screening while
preparing to conduct analysis of behavioral factors has been recently offered in
RESPIRATORY CARE (Shaw & Prewitt, 1995). Therefore, we need not belabor how we
sought to ensure the variables were normally distributed, and that the variables shared
linear relationships with one another. Also, because we planned to use two derivations of
correlation, we sought to root out collinear relationships among potential predictors.
Table 1 reveals that the RATE variable was normalized by square root transformation.
Therefore, SqrtRATE was used in subsequent analyses involving reading rate. The
remaining variables in Table 1 were used in raw form.
Table 1
Descriptive Statistics and Summary of Data Screening
Variable
N
Range
Mean
Median
SD
CRTTa
VOCa
COMPa
RATE
SqrtRATEb
281
281
281
269
269
60-139
22-100
4-36
74-472
8.6-21.7
102.4
62.9
25.1
238.5
15.3
102.0
64.0
26.0
232.0
15.2
14.69
17.21
5.79
72.73
2.37
Note:
Skewdness Kurtosis
-.020
-.010
-.545
.491
.000
-.023
-.584
-.002
.352
.171
a
Original variable.
Transformed variable.
b
Planned Analysis of the First Null Hypothesis
Satisfied by data screening that VOC, COMP, and CRTT were linearly related to one
another, restating the first null hypothesis asked whether classifying subjects who provided
a correct response to each CRTT item could be predicted by knowing their reading34
RELATIONSHIPS BETWEEN READING ABILITY & CRTT EXAMINATION PERFORMANCE
ability scores (VOC and COMP). Such a question requires discriminant analysis. The
hypothesis was posed 140 times for each CRTT item, with the attendant inflation in Type
I error rate (Kirk, 1968; Leary & Mitchell, 1980) To counter this inflation, we adopted a
more conservative value (.01) to reject null hypotheses.
We made it still more difficult to reject null hypotheses regarding discriminant
relationships between reading scores and providing correct responses to CRTT items by
including CRTT total scores as a predictor variable with VOC and COMP. At first
glance, the reader may think, because CRTT scores are composite expressions of the items
answered correctly, there must be significant discriminant relationships between correctly
answering CRTT items and CRTT scores. Generally, this is true. However, the purpose
behind including CRTT scores as a discriminant predictor was to control for factors that
CRTT scores and reading scores shared: the subjects’ general intelligence, reasoning, and
problem-solving and critical-thinking abilities. In order to reject a null hypothesis under
these circumstances, VOC and COMP had to effect CRTT response variance
independently of CRTT total scores. Therefore, the discriminant analysis results reflected
unique reading prediction of subjects’ responses to CRTT items. If VOC, COMP, and
CRTT scores shared variance, then it was more difficult to reject null hypotheses. We
omitted reading rate from this phase of analysis because data screening revealed that
SqrtRATE had no significant correlation with CRTT scores and limiting the number of
predictors increases the robustness of discriminant analysis.
Planned Analysis of the Second Null Hypothesis
While the first null hypothesis sought to find relationships between reading subscores
and providing correct responses to CRTT examination items, the second hypothesis
sought prediction of CRTT examination scores from NDRT TOT scores. By using
multiple regression, we sought to find whether TOT scores and CRTT scores shared a
significant degree of variance. We conducted regression analysis for the whole sample and
for program and age groups. Therefore, we used an value of .01 as a criterion to reject
null hypotheses.
Planned Analysis of the Third Null Hypothesis
Because CRTT examination candidates were prepared in three distinct program types,
we used program as a treatment variable along with age groups to compare group means
for CRTT examination and NDRT scores. It is fair to ask why age groups were created
when age data was continuously (Shaw & Prewitt, 1995) distributed in the sample. Data
screening found that there were many more young subjects in the sample than older
subjects, producing a positive skew that could not be normalized by transformation
techniques. Therefore, ordinal (19-22 years, 23-27 years, 28-53 years) age groups were
created to allow analyses of age using a linearly based model. We compared CRTT
program and age group means by two-way ANOVA. Because the NDRT provided
multiple dependent variables, we used two-way MANOVA to compare VOC and COMP
program and age group means.
Our study was approved by our institutional review board and considered a minimal
risk to the subjects. Still, informed consent was secured from all subjects prior to their
35
RELATIONSHIPS BETWEEN READING ABILITY & CRTT EXAMINATION PERFORMANCE
participation. We used version 6.07 of SAS to analyze the data. (SAS Institute, Inc.; SAS
Circle Box 8000; Cary, NC 27512-8000)
Results
Sampling
We originally intended to draw subjects from nine cells stratified by three geographic
regions and three program types. Table 2 shows that we were not entirely successful in
meeting that goal. Though the results of our study cannot generalize to Technician or BSTherapist groups from the Western region, we were satisfied that the other cells were well
enough represented to continue the study.
Table 2
Distribution of Subjects Across Regions and Program Types
Program Type
Techniciana
AS-Therapistb
BS-Therapistc
(105) 37.4%
(114) 40.6%
(62) 22.0%
East
(83) 29.6%
Region
Central
(142) 50.5%
West
(56) 19.9%
(30) 10.7%
(33) 11.7%
(20) 7.1%
(75) 26.7%
(25) 8.9%
(42) 14.9%
(0) 0.0%
(56) 19.9%
(0) 0.0%
Note: aCertified respiratory therapy technician.
Associate’s degree therapist program.
c
Bachelor’s degree therapist program.
b
Reliability Analysis
Table 3 shows the reliability coefficients for CRTT examination and NDRT scores.
Without reliable measures of entry-level respiratory care and reading abilities, the analysis
could not continue. We found the scores satisfactorily reliable. Coupling the reliability
results with the normally distributed CRTT examination and NDRT scores shown in
Table 1, we concluded that our sample was a nonhomogeneous, normally variable group
that generally represented the population of entry-level candidates. The reliability and
descriptive data for CRTT examination and NDRT scores particularly encouraged us to
continue the study in spite of the deficiencies in western region programs.
36
RELATIONSHIPS BETWEEN READING ABILITY & CRTT EXAMINATION PERFORMANCE
Table 3
Kuder-Richardson (KR-20) Reliability Coefficients for Certified Respiratory Therapist
Technician (CRTT) Examination and Nelson Denny Reading Test (NDRT) Scores
Test
NDRT Vocabulary subtest
NDRT Comprehension subtest
CRTT Examination
KR-20
SEM
95% CI
.948
.807
.893
3.92
2.54
4.81
7.68
4.98
9.43
Note: SEM is the standard error of the mean; CI is the confidence interval.
CRTT Item Analysis
Producing a correct response to CRTT examination items could be discriminantly
predicted (p < .01) by COMP scores (+COMPDISC) for 31 items and by VOC scores
(+VOCDISC) for 37 items. Six of these items overlapped. This left 61 CRTT items with
an apparent discriminant relationship with at least one reading factor (and potential
contributors to reading-related measurement error).
CRU Multiple Regression Analysis
For the whole sample, TOT regression offered significant (R2 = .08, p < .0001, SEE =
14.1), though weak prediction of CRTT examination scores. As Table 4 shows, TOT
regressions for Technician program and 19- to 22-year-old subjects were stronger. For
candidates from Technician programs, nearly one quarter of CRTT score variance was
predicted by TOT. By inserting the CRTT cut score of 98 into the equation, we found
that Technician candidates who achieved a TOT score of at least 106 had a reasonable
probability of passing the CRTT examination. The 19- to 22-year-old subjects also
demonstrated a moderate degree of CRTT score prediction from TOT scores. The 28- to
53-year-old subjects also demonstrated significant CRTT score prediction from TOT
scores, but the degree of explanation was less than half that shown by the 19- to 22-yearolds and the Technician program subjects.
37
RELATIONSHIPS BETWEEN READING ABILITY & CRTT EXAMINATION PERFORMANCE
Table 4
Significant Regression Equations for Program and Age Groups
Group Analysis
Regression Equation
R2
TOT
Cut
TOT Cut
95% CI
Technicians
19-22 year olds
28-53 year olds
CRTT = 69.739 + TOT (.266)
CRTT = 69.432 + TOT (.295)
CRTT = 88.464 + TOT (.142)
.22*
.18*
.09*
106
97
67
81-132
71-123
39-95
Note: The therapist program group and the 23- to 27-year-old group did not show
significant relationships between reading ability and certified respiratory therapy
technician examination score (CRTT). TOT is the Nelson Denny examination total
score, and CI is the confidence interval. *p < .005
Program and Age Group Mean Comparisons
Table 5 shows that Technician program and younger subjects had significantly lower
mean CRTT scores than the other groups. The F value (2.03) for the program M age
group interaction approached significance (p = .0905, df 4,261). Because the error term of
the interaction analysis was inflated by small cell sizes within the two older BS-Therapist
age groups and because of the positive regression finding for Technician program and 19to 22-year-old subjects, we plotted the interaction means in Figure 1. In the figure, three
program M age groups had mean scores below the CRTT cut score. However, post-hoc
one-way ANOVAs found that only the two younger Technician program groups had
means systematically lower than their 28- to 53-year-old age group counterpart whose
mean score was above the CRTT cut. Although Figure 1 places the 23- to 27-year-old BSTherapist program group below the CRTT cut, the small size of the two older BSTherapist groups diminished the power of the ANOVA such that we saw an insignificant
mean comparison.
38
RELATIONSHIPS BETWEEN READING ABILITY & CRTT EXAMINATION PERFORMANCE
Table 5
Comparing Certified Respiratory Therapist Technician Score Means among Program
and Age Groups
Two-way ANOVA Model F = 4.23, df (8,261), p < .0001
Group
N
Mean (SD)
F
Technician
AS-Therapist
BS-Therapist
19-22 year olds
23-27 year olds
28-53 year olds
104
105
61
98
69
103
98.3 (14.8) B
106.0 (14.5) A
103.6 (13.9) A
99.1 (15.5) A
101.8 (15.4) A
105.5 (13.2) B
df
p
7.91
2,261
.0005
4.92
2,261
.008
Note: After Fisher’s LSD test, means with the same letter were not significantly (.05)
different. Technician is certified respiratory therapy technician; AS-Therapist is
associate’s degree therapist program; BS-Therapist is bachelor’s degree therapist
program.
Figure 1. Age group mean comparisons among program groups
T = technician program; A = associate’s degree therapist program; and B = bachelor’s
degree therapist program.
**p < .005.
39
RELATIONSHIPS BETWEEN READING ABILITY & CRTT EXAMINATION PERFORMANCE
Table 6 compares mean reading subscores among program and age groups. Technician
program subjects had significantly lower VOC and SqrtRATE scores and BS-Therapists
had significantly higher COMP scores. The 19- to 22-year-old group had significantly
lower VOC scores. The interaction of program M age groups on reading scores was
insignificant (p = .8045, F = 0.41, df 4,261).
Table 6
Comparing Reading Score Means (SD) among Program and Age Groups
Two-way MANOVA Model F = 5.94, df (8,261), p < .0001
Technicians
N = 104
VOC
COMP
SqrtRATE
VOC
COMP
SqrtRATE
AS-Therapists BS-Therapists
105
61
F
df
p
59.1 (17.5) B
24.2 (5.7) B
14.6 (2.6) B
66.4 (17.3) A
25.1 (6.0) B
15.6 (2.3) A
62.7 (15.7) AB
26.9 (5.2) A
15.7 (2.1) A
5.23
4.32
5.70
2,261
2,261
2,249
.0059
.0143
.0038
19-22 years
N = 98
23-27 years
69
28-53 years
103
F
df
p
58.9 (14.2) B
25.7 (5.4)
15.2 (2.4)
57.6 (15.4) B
24.1 (6.4)
14.9 (2.4)
69.9 (18.7) A
25.3 (5.6)
15.5 (2.3)
2,261
2,261
2,249
.0001
.3337
.1270
17.58
1.10
2.08
Note: After Fisher’s LSD test, means with the same letter were not significantly (.05)
different. Technician is certified respiratory therapy technician; AS-Therapist is
associate’s degree therapist program; BS-Therapist is bachelor’s degree therapist
program.
Post-Hoc Item Reading Predictor Analysis
Given the relationships demonstrated thus far between reading and CRTT scores, we
engaged post-hoc analyses to identify CRTT item characteristics associated with readingrelated error. Our first prospective null hypothesis and subsequent item analysis found
two groups of items with +VOCDISC and +COMPDISC relationships. Responding
correctly to these two groups of CRTT items could be discriminantly predicted with our
subjects’ VOC or COMP scores. The first post-hoc question then became: Can we
predict membership in +VOCDISC and +COMPDISC item groups by the difficulty of
the text presented in the items? Because reading difficulty measures typically used word
and syllable counts (Rakow & Gee, 1987; Rush 1985), we explored whether word,
syllable and syllable density (syllables/words) counts from CRTT item stems, and options
could predict membership in the +VOCDISC and +COMPDISC item classes. Predicting
40
RELATIONSHIPS BETWEEN READING ABILITY & CRTT EXAMINATION PERFORMANCE
+VOCDISC and +COMPDISC item classifications required discriminant analysis with
six predictor variables: stem words, stem syllables, stem syllables per word, option words,
option syllables, and option syllables per word. We used the backward elimination option
of discriminant analysis to test the first post-hoc null hypothesis: Stem and option words,
syllables, and syllable densities did not predict +VOCDISC and +COMPDISC item
classifications.
Several of the potential predictors were abnormally distributed and required
transformations (Shaw & Prewitt, 1995) to achieve normality. Only stem syllables per
word (SSPW) could be used in its raw form, the other transformed, potential
discriminant predictors were: log of stem words (LogSW), log of stem syllables (LogSS),
log of option words (LogOW), square root of option syllables (SqrtOS), and log of option
syllables per word (LogOSPW). The advantage of simultaneously analyzing all predictors
was that Type-I error remained fixed at the .05 level (Leary & Mitchell, 1980).
As a derivative of correlation, discriminant analysis is sensitive to collinear (Shaw &
Prewitt, 1995) predictors. SAS offers a feature within discriminant analysis that allowed us
to screen out collinear variables (R ≥ .70) while running the analysis. We also imposed a
significance level of ≤ .10 to eliminate extraneous variables. Therefore, we were able to
narrow the scope of exploration to only those predictors that were important to the
+VOCDISC and +COMPDISC classifications. Redundant and insignificant predictors
were eliminated with one procedure.
Post-Hoc Item Reading Difficulty Results
Addressing COMPDISC first, LogSW, SSPW, LogOW, and LogOSPW survived the
two tolerance tests we set in the discriminant procedure. LogSS and LogOS were
eliminated by the collinearity criterion. The 31 CRTT items possessing discriminant
relationships with COMP scores formed one item class (+COMPDISC) while the
remaining items formed the other class (ØCOMPDISC). Backward elimination
discriminant analysis removed all four predictors from the model. The lowest p value
among the four predictors was .41. Therefore, the analysis found there were no word or
syllable density counts that reliably predicted membership in the +COMPDISC item
group.
The 37 items with the +VOCDISC classification formed one group (+VOCDISC)
while the remaining items formed the other group (ØVOCDISC). Again, LogSW, SSPW,
LogOW and LogOSPW survived the collinearity tolerance test and were included in the
analysis. From Table 7, both of the factors involving item options eventually dropped out,
leaving two significant item stem factors. At the end of the backward elimination
procedure, LogSW had a Partial R2 = .05 (p = .0104; F = 6.752; df 2,137;) and SSPW had
a Partial R2 = .04 (p = .0140; F = 6.193; df 2,137).
41
RELATIONSHIPS BETWEEN READING ABILITY & CRTT EXAMINATION PERFORMANCE
Table 7
Backward Elimination Discriminant Analysis of VOCDISC Classification—Step 1
Item Component
Stem
Options
Reading Difficulty
Factors
LogSW
SSPW
LogOW
LogOSPW
Partial R2
F
p
.0397
.0425
.0013
.0025
5.577
5.998
0.179
0.339
.0196
.0156
.6725
.5614
Note: LogSW is log of stem syllables per word; SSPW is stem syllables per word;
LogOW is log of option words; and LogOSPW is log of option syllables per word.
We used discriminant analysis to highlight sources of difficult vocabulary that seemed
associated with responding correctly to CRTT items. Our focus was now set on the
number of words presented in the CRTT item stems and the syllable density of the words
used in the stems. To learn whether difficult vocabulary found in the +VOCDISC item
group was directly or indirectly related to stem words and syllable density, we ran
ANOVA procedures using +VOCDISC and ØVOCDISC as the independent variables.
LogSW and SSPW were the dependent variables. Because the ANOVAs were merely
confirmatory tests of null hypotheses rejected by discriminant analysis, we were
comfortable setting our value at .05.
Table 8 shows that the 37 items in the +VOCDISC group, had significantly higher
mean syllable density, yet fewer mean words in the stems. The third dependent variable in
Table 8, Zrpb, was a Z-score transformation of the traditional point-biserial correlation
commonly used by psychometricians to describe the degree of consistency between
responding correctly to an item and candidates’ total scores. With this final analysis, we
wanted to see if the item responses were positively influenced by vocabulary ability would
also encourage responses inconsistent with respiratory care ability. If so, then this group,
+VOCDISC items, would have a lower mean point-biserial value. The Z-score
transformation was necessary because it is not possible to directly compare point-biserial
values with inferential statistics because point-biserials are correlation derivatives.
Because transformation obscured the magnitude of the mean differences for stem words
and the point-biserial values, we also show the raw means for the VOCDISC groups in
Table 8. Therefore, in addition to averaging two syllables per word, the +VOCDISC
group of items tended to have seven fewer words and an average point-biserial value .036
points below the ØVOCDISC group.
42
RELATIONSHIPS BETWEEN READING ABILITY & CRTT EXAMINATION PERFORMANCE
Table 8
Comparing SSPW, LogSW and Zrpb Means (SD) between VOCDISC Item Classes
Variables
SSPW
LogSW
Stem Words
Zrpb
Point-Biserial
ØVOCDISC
103-Item Group
+VOCDISC
37-Item Group
F
df
p
1.89 (.29)
2.00 (.22)
4.89
1,138
.0287
3.38 (.47)
33.00
3.17 (.45)
26.00
5.44
1,138
.0211
4.36
1,138
.0387
0.264 (.09)
0.258
0.226 (.10)
0.222
Note: SSPW is the stem syllables per word; LogSW is the log of stem words; and Zrpb
is the z-scale equivalent for the point-biserial correlation (rpb); ØVOCDISC is the item
group for which the discriminant analysis null hypothesis for vocabulary scores was
accepted; and +VOCDISC is the item group for which the discriminant analysis null
hypothesis for vocabulary scores was rejected.
Discussion
We compared mean point-biserial values for the +VOCDISC and ØVOCDISC groups
because correctly responding to the 37 items in the +VOCDISC group could be predicted
to a significant degree by the subjects’ vocabulary scores. These items systematically
presented fewer words and higher syllable densities to the subjects. We wondered if these
same items would show less consistency with CRTT total scores given the apparent
vocabulary-related error associated with responses to these items. Table 8 indicates that
sources of vocabulary-related error introduced by CRTT items were associated with more
total score inconsistency. The significantly lower mean point-biserial value for the 37
items in the +VOCDISC group meant that the items contributed systematically less to
the reliability of the CRTT examination. The fact that these same items had significant
vocabulary factors affecting responses was very probably not a coincidence, although the
most we can say is that the findings in Table 8 are associated with one another. We cannot
say that fewer stem words and higher syllable densities cause reduced reliability because of
the methods and statistics we used.
This brought us back to where we began the study. We first inquired if there was
reading-related error associated with CRTT scores. In the process, we also found that
vocabulary factors seemed to affect CRTT scores for 19- to 27-year-olds and candidates
from Technician programs. Although our data does not definitively show evidence of a
program M age group interaction, we were unwilling to rule out that possibility. The
source of this relationship seemed to come from CRTT items that presented more
43
RELATIONSHIPS BETWEEN READING ABILITY & CRTT EXAMINATION PERFORMANCE
difficult to read, polysyllabic words embedded in shorter item stems. We assert that by
presenting little surrounding context with syllable intense words, younger candidates and
Technician program candidates may have been prevented from fully understanding the
questions. There is evidence that +VOCDISC item responses were slightly inconsistent
with respiratory care abilities and thus, we saw that +VOCDISC group contribution to
CRTT score reliability was slightly diminished.
Having identified this source of vocabulary-related error, NBRC item writers and
reviewers could take steps to diminish the affect vocabulary has on CRTT scores.
Particularly holding down syllable density and increasing the context offered in CRTT
item stems would help make CRTT items more universally understood by the candidates
taking the examination.
In spite of the apparently interrelated evidence, we found linking difficult vocabulary to
diminished CRTT score reliability, the magnitude of vocabulary-related error is small
compared to the general precision of CRTT scores. We found a reliability coefficient of
.89 which implies that 89% of CRTT score variance was attributed to candidates’
respiratory care abilities. The NBRC CRTT examination committee met its burden to
produce an exam that was acceptably reliable. Granted, the examination we used is now
nearly a decade old, but speculation about the current state of CRTT score reliability
must acknowledge that historically about 2,000 candidates take each form of the
examination which encourages normal variation in the score distribution. The candidates
continue to have widely variable backgrounds and training. The NBRC continues to
generate and review items in the same manner. Therefore, we cannot identify any new
opportunities for CRTT score reliability to diminish in the current forms.
We initially approached this study strictly from a measurement error perspective.
However, as we shared the results with interested persons, the question they consistently
raised asked whether candidates’ programs have met their burden preparing candidates to
take the CRTT examination. Our findings particularly should compel Technician
programs to review admission criteria. Admitting younger students without screening
reading abilities or offering vocabulary building in the curriculum could set students up to
be failing CRTT candidates. If Technician programs were interested in this kind of
screening and satisfied that our sample was drawn from a geographically diverse
population such that the results would generalize to their students, then the regression
equations and NDRT total score cuts we present in Table 4 could be used for their
program.
However, if Technician programs seriously wanted to screen candidates, they should
rely on more than NDRT scores. Table 4 shows wide 95% confidence interval ranges
around predicted TOT CUTS which means that there is a good deal of error using
NDRT TOT alone to predict CRTT scores. The real utility of NDRT TOT scores would
likely be as one of several predictor variables in a multiple regression model. Other
predictors could include high school academic performance measures, such as grade point
average or class rank, and college entrance examinations (e.g., ACT or SAT).
Are 23- to 27-year-old BS-Therapists also at risk? Figure 1 might suggest so, except the
mean CRTT score for the group was based only on 10 subjects from which we are
unwilling to generalize. Their mean CRTT score was statistically indistinguishable from
44
RELATIONSHIPS BETWEEN READING ABILITY & CRTT EXAMINATION PERFORMANCE
the younger and older groups of BS-Therapists with means above the CRTT cut score.
Therefore, the fact these 10 subjects had a CRTT mean below the cut, may have been an
aberration, or we may have lacked the statistical power to find a true difference because of
uneven group sizes. This is an area that deserves more attention. However, it may be
logistically difficult to find a critical mass of older BS-Therapists candidates to study
because Figure 1 also suggests that older students tend to select Technician or ASTherapist programs.
Before considering changing examination development methods or program curricula,
one must first be satisfied that the evidence presented here was generated from a
generalizable source. Our findings are delimited by not securing any volunteers from
Technician or BS-Therapist programs from the western region. In spite of that loss, our
important study variables—CRTT, VOC, and COMP scores—were normally distributed.
Normally distributed data does not just happen. Understanding that physical and
cognitive abilities are normally distributed in the population led us to conclude that we
had adequately sampled the population, even if that population did not include some
programs from the Western region.
Table 6 shows the only rejected null hypothesis concerning reading rate. In addition to
having significantly lower VOC and COMP scores, Technician program candidates had
significantly lower reading rates. However, we found that reading rates and CRTT scores
were unrelated. Even the slowest readers seemed to have adequate time to complete the
examination. Therefore, the three hours currently allowed to take the CRTT examination
seems sufficient according to this evidence.
Conclusions
Conclusions with substantial supporting evidence are that (1) responses to CRTT items
could be made less susceptible to vocabulary-related error by limiting high syllable density
words in the item stems and assuring sufficient context for the questions, (2) Technician
programs should consider screening the youngest admission candidates’ reading abilities
and incorporate vocabulary building into their curriculum.
References
Brown, J. I., Bennett, J. M., & Hanna, G. S. (1981). The Nelson-Denny reading test:
Examiner’s manual forms E and F. Chicago, IL: Riverside Publishing Company.
Chang, D. W. (1989). Reading levels of six respiratory therapy textbooks and the
NBRC written registry self-assessment examination [Abstract]. RESPIRATORY CARE, 34(11),
1040.
Fry, E. (1987). The varied uses of readability measurement today. Journal of Reading,
30(4), 338-343.
45
RELATIONSHIPS BETWEEN READING ABILITY & CRTT EXAMINATION PERFORMANCE
Fry, E. (1990). A readability formula for short passages. Journal of Reading, 33(8),
594-597.
Ironson, G., Homan, S., & Willis, R. (1984). The validity of item bias techniques with
math word problems. Applied Psychological Measurement 8(4), 28-31.
Kirk, R. E. (1968). Experimental design: procedures for the behavioral sciences. Belmont,
CA: Brooks/Cole Publishing Company.
Klare, G. R. (1987). The measurement of readability. Ames, IA: Iowa State University
Press.
Leary, M. R. & Mitchell, E. (1980). Type I error in counseling research: A plea for
multivariate analyses. Journal of Counseling Psychology, 27(6), 611-615.
Rakow, S. J. & Gee, T. C. (1987). Test science, not reading. Science Teacher, 54(2),
28-31.
Rush, R. T. (1985). Assessing readability: formulas and alternatives. The Reading
Teacher, 12(Dec.), 274-283.
Shaw, R. C. & Prewitt, M. W. (1995). A behavioral science approach to clinical
research. Respiratory Care, 40(10), 1038-1041.
Watson, M. E. & Scully, S. D. (1988). A survey of reading-level assessment methods
and determination of reading level of selected respiratory therapy textbooks. Respiratory
Care, 33(11), 1020-1026.
Authors’ Note
Robert C. Shaw, PhD, RRT, is Program Director, Lenexa, Kansas; and Steven J.
Osterlind, PhD, is Professor, Education and Counseling Psychology, Columbia, Missouri.
Correspondence regarding this article should be addressed to Robert C. Shaw, PhD,
RRT, Program Director, Applied Measurement Professionals, 8310 Nieman Road,
Lenexa, Kansas, 66214.
46
NOTES
47
NOTES
48
Respiratory Care Education Annual
American Association for Respiratory Care
11030 Ables Lane
Dallas, TX 75229-4593
Non-Profit
Organization
U.S. Postage
PAID
Permit No. 7607
Dallas, TX
Respiratory Care Education Annual is a publication
of the American Association for Respiratory Care


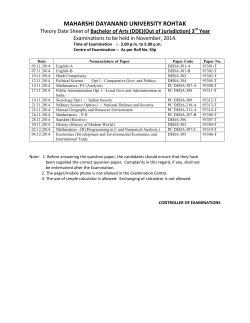
© Copyright 2026