
Ethiopian Journal of Reproductive Health
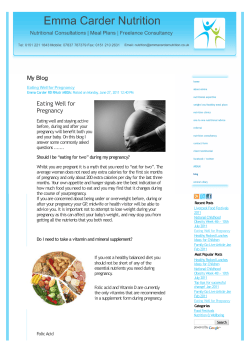
December2010, Volume 4, Number 1
Ethiopian Journal of Reproductive Health
Ethiopian Journal
of
Reproductive Health
December 2010, Volume 4, Number 1
December 2010
ORGAN OF THE ETHIOPIAN SOCIETY OF OBSTETRICIANS AND GYNECOLOGISTS
Editorial
2
ORIGINAL ARTICLES
Reducing maternal mortality and increasing use of skilled birth attendance: Ethiopia
and MDG 5
4
Ethiopian Journal of Reproductive Health, Volume 4, Number 1
Marge Koblinsky, Frances Tain and Solomon Tesfaye
Community based reproductive health (RH) intervention resulted in increasing age at
marriage: the case of Berhane Hewan Project, in East Gojam zone, Amhara region,
Ethiopia
16
Tekle-Ab Mekbib, Mitike Molla
Assessment of the status of PMTCT services in private for-profit health institutions in
Ethiopia
26
Eyasu Mesfin, Tigist G/Egziabher , Abdulfetah Abdulkadir Abdosh
Birth to pregnancy interval and its effect on perinatal outcomes in Addis Ababa,
Ethiopia
37
Berhanu Assefa Tegegne, Fikre Enquoselassie, Lukman Yusuf
A five year analysis of histo-pathological results of cervical biopsies examined in a
pathology department of a teaching hospital (2003-2007)
52
Balkachew Nigatu, Yirgu Gebrehiwot, Kassahun Kiros, Wondwossen Eregete
PROGRAM BRIEFS
Engender Health
58
Consortium of Reproductive Health Associations (CORHA)
60
JHPIEGO
63
Ethiopian Society of Obstetricians and Gynecologists (ESOG)
የIትዮጵያ የፅንስና የማህፀን ሐኪሞች ማህበር
Tele:- 251-11-5506068/69 Fax:- 251-115-506070 P.O.Box 8731 Addis Ababa
E-mail:- [email protected]
Web site:- www.esog.org.et
December2010, Volume 4, Number 1
Ethiopian Journal of Reproductive Health
ORIGINAL ARTICLE
Birth to pregnancy interval and its effect on perinatal outcomes in Addis Ababa, Ethiopia
Berhanu Assefa Tegegne1, Fikre Enquoselassie2, Lukman Yusuf3
Abstract
Background: Study findings on inter-pregnancy interval and its effect on birth outcome looks contradictory. Some
report that it is a risk factor for adverse perinatal outcome while others say it has no association. Still, there is no universally agreed recommendation on the ideal inter-pregnancy interval with regards to favorable perinatal outcome.
Objective: To assess birth to pregnancy interval and its effect on perinatal outcomesin Addis Ababa, Ethiopia.
Methods: A cross sectional study was undertaken on a sample of 1339 mothers who gave birth at a randomly selected public and private health facilities located in Addis Ababa, Ethiopia. Eligible mothers from selected health facilities were consecutively included in the study until the required sample was achieved. Data was collected using a structured questionnaire and appropriate measurements. Data was processed and analyzed using EPI Info and SPSS computer soft wares. Univariate and bivariate analysis were employed.
Result: The rate of preterm, low birth weight (LBW) and stillbirth were 7.1%, 5.6% and 3.1%, respectively. The
mean birth to pregnancy interval was 45.9+ 27.3 months (95% Confidence Interval (CI) 44.4, 47.3). Birth to pregnancy interval has shown no effect on poor perinatal outcome.
Conclusion: Further studies on the effect of birth to pregnancy interval on perinatal outcomes is recommended
Ethiopian Journal of Reproductive Health , 2010,4(1): 37-51
1
Family Health International/Ethiopia,
2, 3
AAU, Medical Faculty. P. O. Box 1176
37
December2010, Volume 4, Number 1
Ethiopian Journal of Reproductive Health
Introduction
Perinatal mortality is an indicator of poor obstetric care. It is generally influenced by prenatal, intrapartal and neonatal care. The most
common fetal conditions that lead to perinatal
death include congenital anomalies, Intra uterine growth restriction (IUGR) and sepsis (1).
Early neonatal death, which attributes to most
perinatal deaths, is caused by preterm birth and
low birth-weight (2). Stillbirth accounts for 74%
of all perinatal deaths (1). Worldwide, it is estimated that, 7.6 million perinatal deaths occur
annually; of which 98% take place in developing
countries (3). In Ethiopia, a community-based
study conducted to see the risk factor for outcome of prolonged labor in rural Ethiopian
women giving birth at home showed a perinatal
mortality of 45/1000 births (4).
The birth-weight of an infant is the single most
important determinant of newborn survival;
neonatal illness in general is closely related to
low birth-weight. More than 20 million infants
world wide, (representing 15.5 percent of all
births) are born with Low birth weight (LBW).
Some epidemiological observations revealed
that infants born under-weight (less than
2500gram) are approximately 20 times more
likely to die than heavier babies (5). In Ethiopia;
studies showed that the prevalence of low birth
weight varies from 6 – 10 % (6), another retrospective study conducted to establish birth
weight changes at Tikur Anbessa hospital
showed that low birth weight has increased
trend between 1976 and 1996 (7).
According to the 2005/06 annual activity report
of Addis Ababa City Administration Health
Bureau; the rate of low birth weight among all
deliveries attended from health institutions reporting to the city health bureau is 11% (8). In
an another paper, more than 60% of all low
birth-weights were preterm. Some are both premature and growth retarded while others may
be full term but under weight (small for gestational age) (9).
Preterm birth is the single most common causes
of perinatal mortality in Europe and North
America (10).
In Ethiopia, study done at Tikur Anbessa Hospital showed that preterm birth has increased
from 5.5% to 8.7% between 1980’s and 1990’s
(7). Stillbirth rate is an important indicator of
access to and quality of antenatal and delivery
care. Stillbirth prevalence at community level is
typically less than 1% in more developed parts
and could exceed 3% in less developed regions.
(11)
Some research revealed that, globally, there
are 3.2 million (2.5 - 4.1million) stillbirths per
year. The rate in Sub-Saharan Africa is 32 per
1000 births (12). In Ethiopia a study reported
that the prevalence of stillbirth is 19/1000
births (4). A study done at Tikur Anbessa Hospital has shown a stillbirth rate of 53.3/1000
births and contributed to 77.2% of gross perinatal mortality (13). The Ethiopian Demographic
and Health Survey (DHS) 2005 data indicated
that the still birth rate is 1.8% (14). The Addis
Ababa city administration health bureau 2005/06
annual activity report revealed that the rate of
stillbirth is 2.5%. (10).
Though, the time period (risk period) of interpregnancy interval to adverse perinatal outcome
is not specifically isolated and suggested yet,
different studies showed that inter-pregnancy
interval is one of the determinant factors for
preterm birth, low birth weight, small for gestational age births and stillbirth (15, 16).
According to DHS 2000, in Ethiopia; the over
all median birth interval is 34 months, 20% of
non-first births occur less than 24 months after
the preceding birth with 8% occurring in less
than 18 months, about 43% of women give
birth at least 36 months after the previous birth
and pregnancies that occur at less than a 15month interval are having a more than three
times perinatal mortality risk than those pregnancies occurring after long intervals. (17).
38
December2010, Volume 4, Number 1
One study done at Tikur Anbessa and St. Paul’s
hospital on the impact of spacing on out comes
of pregnancy has shown that conceiving within
12 months of previous delivery is a critical interval to cause low birth-weight baby. Short interpregnancy interval together with other sociodemographic factors is responsible for unfavorable birth outcomes (18).
The study done at Tikur Anbessa and St. Paul’s
hospital was the only study ever conducted in
Ethiopia to see any association between interpregnancy interval and perinatal outcomes. The
aim of this study, therefore is to assess birth to
pregnancy interval and its effect on perinatal
outcome in Addis Ababa, Ethiopia.
Subjects and Methods
A cross sectional study was conducted on mothers who delivered at selected health facilities
from Addis Ababa. Addis Ababa has an estimated population of 2.9 million. The town is
divided into ten sub-cities and hundred kebele
administrations. There are 12 hospitals, 29
health centers, 130 clinics, 43 health stations
and 382 private health facilities, with potential
health service coverage of 143%.(26). Health
care facilities that give delivery service in Addis
Ababa includes: five public hospitals, three military hospitals; 21 public health centers and 32
private health facilities. In 2006, 31,952 deliveries were attended.
Health institutions were stratified into public
hospitals, public health centers and private
health institutions. Three hospitals, ten health
centers and ten private clinics were selected using simple random sampling method. The number of subjects selected from each stratum was
determined according to the proportion of the
service they render. We enrolled all consecutive
laboring mothers coming to health facilities to
give births, who had at least one live-birth preceding the current pregnancy and with no history of abortion in between.
Ethiopian Journal of Reproductive Health
Data was collected from December 1st 2006 to
April 28/2007. Primary data was retrieved by
interviewing study participants. Birth weight of
the newborns was measured using a baby weighing scale graded in grams, taken within ten minutes after delivery, naked and before taking anything per mouth. Birth to pregnancy interval
was calculated by counting the time period from
the start of the index pregnancy (as evidenced by
last menstrual period) and the date of the preceding live birth calculated to the nearest
month. Weight for gestational age was computed by using standards of Lubchenco curve
(27). Data was entered, cleaned and analyzed
using EPI 6 and SPSS 11.0 computer software
programs.
Association of socio-demographic, past medical
and obstetric history and current pregnancy outcomes and birth to pregnancy intervals were
determined by cross-tabulating, chi square test
and odds ratio (OR) with 95% confidence intervals. Multiple logistic regressions were used to
control for confounders.
Ethical approval was obtained from Research
and Publication Committee of Addis Ababa
University Medical Faculty. Permission was obtained from head of study facilities and verbal
consent was obtained from study participants.
Result
A total of 1339 mothers, 432(32.3%) from public hospitals, 559(41.2%) public health centers
and 348(26%) private health institutions were
interviewed. Five hundred eighty two(43.5%)
were in the age group of 25-29 and 12(0.9%)
were below the age of twenty years.
The mean age was 28+ 4.5, ranging from 17 to
41 years. 291(21.7%) were illiterate, 431(32.4%)
had elementary school education, 461(34.6%)
secondary and 148(11.1%) tertiary education.
Among the study participants, 890(66.5%), 265
(19.8%) and 172(12.8%) were Orthodox Christians, Muslims and Protestants, respectively.
Majority of mothers 1282(96.1%) were married
and housewives 948(70.8%).
39
December2010, Volume 4, Number 1
Ethiopian Journal of Reproductive Health
There were 86(8.4%) mothers who had a birth
interval of less than 12 months and 316(23.9%)
had birth to pregnancy interval less than 24
months. However, 277(20.7%) has greater than
72 months and 388(29.2%) has greater than 60
months birth to pregnancy interval.
The average birth to pregnancy interval was
45.9+ 27.3 months with 95% CI (44.4, 47.3).
The median birth interval was 40 months ranging from two month to 99 months.
Fig 1 – Bar graph showing the distribution of birth to pregnancy intervals among study subjects in
Addis Ababa health institutions, Dec to April 2007
300
260
230
250
205
182
200
155
150
100
111
86
95
50
0
<12
Months
12-23
months
24-35
months
36-47
months
Forty three (3.2%) mothers coming for delivery
report that they have chronic medical problem:
diabetes constitutes 13(32.5%), hypertension 12
(27.9%), cardiac disease 4(9.3%) and tuberculosis
3(6.9%).
48-59
Months
60-71
months
72-83
months
>84
months
Pregnancy complications to the index pregnancy
has happened in 103(7.8%) of the cases, the
leading cause of pregnancy complication were
ante partum hemorrhage (APH) 31(27.7%) followed by pregnancy induced hypertension (PIH)
28(25%) and hyperemesis gravidarum 20(17.9%).
Nine mothers have reported history of smoking
cigarette, three still smoking. The duration of
smoking was less than one year, ranging from 1-8
cigarettes per day. The gap between stopping
smoking and pregnancy, among those who
stopped smoking ranges from one year to 12
years.
40
December2010, Volume 4, Number 1
Ethiopian Journal of Reproductive Health
Table 1– Current pregnancy complications and preceding birth outcomes of in women who gave
birth for second time in Addis Ababa health institutions from Dec to April2007
Characteristics (N=1339)
No. (%)
Does the current pregnancy have complications
YES
NO
Unknown
103(7.8%)
1225(92.2%)
11(0.8%)
Types of complications
APH
poly hydraminos
cervical incompetence
PIH
PROM
hyper emesis
31(27.7%)
11(9.8%)
2(1.8)
28(25%)
14(12.5%)
20(17.9%)
Preceding birth outcome
Preterm Birth
Cesarean section
PPH
SVD
14(1%)
122(9.1%)
19(1.4%)
1217(90.9%)
Preceding Birth/child/ sex
Male
712(53.2%)
Female
No response
Use of contraceptive in current pregnancy
Yes
No
Table 1 shows that, among all deliveries attended 171(12.8%) had experienced complications out of which 62.6% were managed in hospitals, the leading 64(37.4%) cause of labor
620(46.3%)
7(0.5%)
861(64.3%)
478(35.7%)
complication was prolonged labor followed by
mal position/ mal presentation 45(26.3%), neonatal asphyxia 26(15.2%) and obstructed labor
17(9.9%).
41
December2010, Volume 4, Number 1
Ethiopian Journal of Reproductive Health
Table 2– Current pregnancy outcome and complications of labor among mothers who give birth for
two or more times in Addis Ababa health institutions from Dec to April 2007
Characteristics (N=1339)
RH type
Positive
Negative
Unknown
Complications of labor
YES
NO
Methods of delivery
Vaginal
Cesarean section
Instrumental
Augmentation or Induction
No response
Is the neonate born alive?
YES
NO
No response
Birth weight
low birth weight
normal birth weight
Un known
Gestational age
Pre Term
Term
Post Term
Un known
Sex of new born (N=1305)
Male
Female
No response
Deliveries that are completed spontaneously
with vaginal delivery were 1050(78.6%) and 218
(16.3%) delivered by cesarean section. Majority,
1294(96.6%) of the neonates were born alive
and 42(3.1%) were still born. The mean birth
weight was 3172+ 515 grams with 95% CI
(3144, 3200). The rate of low birth weight was
7.2%. 109(8.4%) of the neonates were small for
gestational age. Nine (0.7%) neonates were born
with different types of congenital malformations
like club foot, anencephaly, cleft palate and four
were born as stillbirths. The preterm and post
term birth rates were 7% and 5.6 %, respectively. The mean gestational age was 39.2+2.1
months with 95% CI (39.1, 39.3).The male to
female ratio of the current birth was 1.05.
No. (%)
1218(91.9%)
51(3.8%)
70(5.2%)
171(12.8%)
1168(87.2%)
1050(78.4%)
218(16.3%)
57(4.3%)
10(0.7%)
3(0.2%)
1294(96.6%)
42(3.1%)
3(0.2%)
94(7.2%)
1212(90.3%)
33(2.5%)
93(7%)
1165(86.9%)
75(5.6%)
6(0.4%)
667(49.8%)
638(47.6%)
34(2.5%)
Factors associated with pre term birth
Preterm birth occurred in 7.1% of the cases.
Mothers of the age group >35 has the highest
proportion 18(11%) of preterm delivery, mothers who are unable to read and write had highest rate 26(9%) of preterm delivery. Deliveries
that happened following contraceptive failure
have high preterm birth 9(11%). But all these
variations are not statistically significant. Deliveries from mothers who have PIH and APH had
highest preterm birth (21.4% and 29%, respectively). The presence of any form of pregnancy
complication to current pregnancy with OR 3.1
and 95% CI = [1.8, 6.2] has a statistically significant association to preterm birth.
42
December2010, Volume 4, Number 1
Ethiopian Journal of Reproductive Health
Mothers who had postpartum hemorrhage
(PPH) in the preceding delivery were shown to
have high preterm birth rate 4(21%). Mothers
who have known chronic medical problems;
diabetes mellitus (DM), hypertension and cardiac disease showed to have high preterm birth
(14-25%).
Cigarette smoking showed association with preterm birth (10-11%). However, no statistically
significant association was observed between
birth to pregnancy interval and preterm birth.
Table 3- Past obstetrics history and Birth to pregnancy intervals Characteristics of pre term birth in
Women who give Birth for two or more times in Addis Ababa health institutions from Dec to April
2007
Variables
Yes
N=94
Pre term birth (7.1%)
OR 95% CI
Adjusted OR
95% CI
Parity
1
2 and 3
>4
29(8.1%)
56(6.7%)
10(7.5%)
1.00
0.8[0.5,1.3]
0.9[0.4,1.9]
1.00
1.02[0.6,1.8]
0.6[0.2,2.1]
Gravidity
2 and 3
>4
76(6.9%)
19(8.3%)
1.00
1.3[0.74,2.2]
1.00
1.29[0.55,2.7]
Preceding pregnancy outcome
Pre term
SVD
PPH
C/S
3(21.4%)
82(6.8%)
4(21%)
11(9%)
3.6[0.98,13.3]
0.7[0.4,1.44]
3.8[1.2,12]*
1.3[0.7,2.6]
3.8[0.89,16.5]
0.74[0.36,1.5]
5.1[1.5,17.1]*
-
59(6.7%)
0.9[0.6,1.4]
1.01[0.6,1.7]
9(11.4%)
2[0.9,4.2]
1.6[0.7,3.9]
18(17.5%)
3.1[1.8,5.5]*
3.4[1.8,6.2]*
87(7.2%)
3(6%)
3(4.3%)
1.00
1.9[0.6,6.4]
0.5[0.2,1.8]
16(8.1%)
24(7.6%)
29(7.5%)
22(8%)
1.2[0.67,2.1]
1.1[0.7,1.8]
1.7[0.7,1.7]
1.2[0.7,1.9]
Current pregnancy
Current pregnancy
planned
Contraceptive
failure
Complications to
current pregnancy
RH factor
Positive
Negative
Unknown
1.00
0.9[0.25,2.9]
0.56[0.2,1.9]
Birth to pregnancy interval
<18months
< 24 months
>60 months
>72 months
1.7[0.68,4.4]
0.8[0.34,1.87]
1.06[0.45,2.5]
1.1[0.4,2.72]
43
December2010, Volume 4, Number 1
Ethiopian Journal of Reproductive Health
Factors associated with Low Birth Weight
Low Birth weight was reported in 7.2% of cases.
Eighteen (11.3%) mothers who gave birth at age
of > 35 years gave LBW delivery. Birth to pregnancy interval of less than 18 month and greater
than 72 months had high LBW deliveries 18
(9%) and 24(9.2%), respectively. Six (11.8%)
mothers with RH negative blood type had given
LBW babies, and 25% of mothers with known
cardiac disease have delivered LBW babies.
Mothers who gave birth after sustaining complications of pregnancy like APH, premature rupture of membrane (PROM),
and PIH had 32.1%, 5.4%, 21.4% LBW deliveries, respectively. Mothers with secondary education level when compared with unable to read
and write were less likely to have LBW with OR
0.5 and 95% CI= [0.2, 0.8]. Mothers with history of PPH in the preceding delivery and pregnancy complication to current pregnancy has
shown a statistical significant association to
LBW with OR 3.5 and 95% CI = [1.2, 10] and
OR 4.5 and 95% CI = [2.6, 7.7] respectively.
Generally, no statistically significant association
was observed between Birth to pregnancy interval and LBW
Table 4: Past obstetrics history and birth to pregnancy interval of low birth weight observed in
Women who give birth for two or more times in Addis Ababa health institutions from Dec to April
2007
Variables
LBW (7.2%)
OR 95% CI
Yes
N=94
23(6.5%)
63(7.7%)
8(7.3%)
1.00
1.2[0.74,1.98]
1.13[0.5,2.6]
1.00
1.43[0.8,2.5]
1.33[0.4,5.3]
Gravidity
2 and 3
>4
81(7.5%)
14(6.3%)
1.00
0.9[0.5,1.65]
1.00
0.53[0.2,1.5]
Preceding pregnancy outcome
Pre term
SVD
PPH
C/S
1(7.7%)
88(7.4%)
4(21%)
6(5%)
1.1[0.1,8.4]
1.5[0.7,3.5]
3.5[1.2,10]*
0.6[0.3,1.5]
0.4[0.04,3.9]
1.4[0.6,3.5]
4.7[1.3,17]*
0.7[0.4,1.2]
53(6.1%)
0.6[0.4,0.97]*
0.72[0.44,1.2]
7(8.9%)
1.3[0.5,3.1]
0.9[0.3,2.3]
22(21.4%)
4.5[2.6,7.7]*
6.05[3.3,11]*
RH factor
Positive
Negative
Unknown
80(6.1%)
6(11.8%)
8(11.8%)
1.00
1.8[0.7,4.4]
1.8[0.8,3.9]
1.00
1.86[0.71,4.9]
1.98[0.84,4.6]
Birth to pregnancy interval
<18 months
< 24 months
>60 months
>72 months
18(9.3%)
24(7.8%)
29(7.7%)
24(9.0%)
1.3[0.8,2.4]
1.1[0.7,1.8]
1.6[0.7,1.7]
1.4[0.8,2.1]
Parity
1
2 and 3
>4
Current pregnancy
Current pregnancy
planned
Contraceptive
failure
Complications to
current pregnancy
Adjusted OR
95% CI
2.5[0.9,6.98]
0.67[0.26,1.7]
0.67[0.25,1.8]
1.76[0.6,4.9]
44
December2010, Volume 4, Number 1
Ethiopian Journal of Reproductive Health
Factors associated with stillbirth
The occurrence of stillbirth was 3.1%. Fifteen
(4.6%) of mothers with the age group 30 -34
had stillbirth. Muslims have the lowest (0.4%)
stillbirth rate. The maternal age groups with low
stillbirth rate were the age group 25 - 29 and
>35 with frequency of 9(1.5%) and 4(2.7%),
respectively. This occurrence when compared
with maternal age group 15-19 was not significant but when it is adjusted for variables of
socio-demographic factors, other past medical
and obstetric history, preceding birth outcome,
complication of labor, current pregnancy outcomes and birth to pregnancy interval is less
likely to have stillbirth with OR 0.05 and 95%
CI [0.005,0.55] and OR 0.04 and 95% CI
[0.003,0.6], respectively.
Mothers with educational status of elementary
and secondary when compared with those who
are unable to read and write with OR 0.2 and
95% CI = (0.1, 0.5) and OR 0.4 and 95% CI
(0.17, 0.8), respectively are less likely to have
stillbirth. Mothers from Muslim religion compared to Orthodox religion followers with OR
0.1 and 95% CI [0.013, 0.7] were less likely to
have stillbirth.
Birth to pregnancy intervals of >72months has
the lowest stillbirth rate (2.2%). Complications
of labor have the highest (10.5%) stillbirth rate,
the presence of complications of labor to index
(current) pregnancy with OR 5.6 and 95% CI=
[2.9, 10] was associated with stillbirth. Among
infants born with congenital malformations
44.4% were stillbirths with OR 27 and 95% CI
= [7,104] associated with stillbirth. Among those
mothers who had pregnancy complications to
the current pregnancy 10.7% has ended in stillbirth, the presence of pregnancy complications
to index (current) pregnancy with OR 4.7 and
95% CI = [2.3, 9.7] had statistically significant
association with stillbirth. From mothers who
had known chronic medical problems 8.3% of
diabetics, 14.3% of hypertensive and 25% of
cardiac patients experienced stillbirth. Generally, no statistically significant association is observed between birth to pregnancy interval and
stillbirth.
45
December2010, Volume 4, Number 1
Ethiopian Journal of Reproductive Health
Table 5:- Past obstetrics history and birth to pregnancy interval of stillbirth observed in women who
gave birth for two or more times in Addis Ababa health institutions from Dec to April 2007
Variables
Still birth (3.1%)
Yes
N=42
OR 95% CI
Adjusted OR
95% CI
Parity
1
2 and 3
>4
Gravidity
2 and 3
>4
Preceding pregnancy outcome
Pre term
SVD
PPH
C/S
Current pregnancy
Current pregnancy
planned
Contraceptive
failure
Complications to
current pregnancy
RH factor
Positive
Negative
Unknown
Complication of labor
Congenital abnormality
Birth to pregnancy interval
<18 months
< 24 months
>60 months
>72 months
12(3.4%)
25(3%)
6(4.4%)
1.00
0.89[0.44,1.8]
0.53[0.12,2.4]
1.00
1.32[0.6,3.1]
0.96[0.12,7.76]
35 (3.2%)
8(3.5%)
1.00
0.64[0.23,1.8]
1.00
0.92[0.2,4.65]
1(7.1%)
40(3.3%)
1(5.3%)
2(1.7%)
2.4[0.3,19]
2.0[0.5,8.4]
1.7[0.2,13]
0.5[0.12,2.1]
0.4[0.02,8.4]
2.8[0.6,13.3]
1.28[0.13,12]
-
23(2.6%)
0.6[0.3,1.2]
0.65[0.3,1.4]
3(3.8%)
1.7[0.5,5.2]
0.89[0.22,3.8]
11(10.7%)
4.7[2.3,9.7]*
3.7[1.69,8.02]*
38(3.1%)
3(5.9%)
1(1.4%)
18(10.5%)
4(44.4%)
1.00
1.9[0.6,6.5]
0.4[0.1,3.3]
5.6[2.9,10]*
27[7,104]*
1.00
3.4[0.9,12.7]
0.4[0.04,3.7]
4.2[1.76,10]*
20[2.5,164]*
6(3.0%)
11(3.5%)
11(2.8%)
6(2.2%)
0.9[0.4,2.3]
1.1[0.6,2.2]
0.9[0.4,1.7]
0.6[0.3,1.5]
0.6[0.16,2.3]
1.98[0.6,6.3]
1.7[0.54,5.8]
0.37[0.09,1.52]
Discussion
In this study, it was found that the mean birth
to pregnancy interval is 45.9+ 27.3 months
(95% CI 44.4, 47.3). This finding was consistent
with the finding from DHS 2005 for Addis
Ababa which was 45.2 months (28).
About 6.5 % had a birth interval less than 18
months while in DHS 2000 it was 8% and
23.9% of non first pregnancy which occurred
less than 24 months and in DHS 2000 it was
20% (17).
46
December2010, Volume 4, Number 1
Ethiopian Journal of Reproductive Health
Table 6: Association of birth to pregnancy interval to maternal socio-demographic situation among
women who delivered for two and more times in Addis Ababa at health institutions from December
– April 2007
Variables
Birth to pregnancy interval <24
month
(23.9%) N=316
OR (95% CI)
Adjusted OR
(95% CI)
Age of mother
15 – 19
20 – 24
25 – 29
30 - 34
>35
3(27.3%)
71(27.7%)
139(24%)
66(20.6%)
37(24.1%)
1.00
1.02[0.3,3.9]
0.8[0.2,3.2]
0.7[0.2,2.6]
0.8[0.2,3.3]
1.00
0.8[0.2,3.1]
0.64[0.16,2.55]
0.49[0.12,2.01]
0.59[0.14,2.4]
Educational status
Unable to read and write
Elementary
Secondary
Tertiary
65(22.6%)
95(22.3%)
105(23%)
50(34.2%)
1.00
0.98[0.7,1.4]
1.02[0.7,1.44]
1.8[1.15,2.76]*
1.00
1.1[0.76,1.7]
1.3[0.88,1.9]
2.6[1.52,4.4]*
Religion
Orthodox
Protestant
Muslim
203(23.1%)
42(24.4%)
68(25.9%)
1.00
1.07[0.7,1.6]
1.2[0.8,1.6]
1.00
0.98[0.7,1.5]
1.26[0.9,1.77]
Occupation
House wife
Self employed
Government employed
222(23.7%)
52(24.1%)
40(26.5%)
1.00
1.02[0.7,1.4]
1.2[0.8,1.7]
1.00
1.03[0.7,1.5]
0.89[0.6,1.43]
Current pregnancy planned -Yes
Preceding pregnancy mode of delivery -C/S
-SVD
Chronic medical illness
– yes(42)
Sex of preceding
baby-Male
Female
175(20.1%)
1.1[0.8,1.4]
0.47[0.35,0.6]*
39(32%)
277(23%)
0.5[0.26,0.8]*
2.2[1.2,3.8]*
1.65[1.07,2.54]*
-
10(23.8%)
1.9[1.06,3.7]*
0.92[0.43,1.96]
166(23.5%)
147(23.9%)
1.00
1.02[0.8,1.3]
1.00
1.03[0.79,1.36]
Parity
100 (28.5%)
183(22%)
32(24.1%)
1.00
0.7[0.5,0.94]*
0.7[0.5,1.26]
1.00
0.73[0.54,0.99]*
0.77[0.45,1.3]
1
2&3
>4
The mean birth to pregnancy interval in Addis Ababa was generally higher when compared to other developing country which was
three years (36 months) (19). This may happen
because the total wanted fertility for Addis
Ababa according to DHS Ethiopia 2005 was
1.2. This figure showed that women in Addis
Ababa tend to have small family size therefore
need to space their children, which affects the
birth to pregnancy interval.
From our study we saw that birth to pregnancy interval that happened following
planned pregnancies had 1.4 times more
chance to occur in greater than 60 months
than unplanned pregnancies.
47
December2010, Volume 4, Number 1
Generally short birth to pregnancy interval (<24
months) is influenced by mothers educational
status of tertiary education level, having previous mode of delivery through Cesarean section
(CS) and having chronic medical problem. Long
birth to pregnancy interval (>60 months) is also
influenced by planned pregnancy and preceding
birth delivered through spontaneous vaginal
delivery (SVD). Though the DHS Ethiopia 2005
finding revealed that there is a significant increase in the median number of months as maternal age increases (27), but our finding was
not consistent with that and there was no association observed.
Mothers with tertiary education level have a
significant short birth to pregnancy interval.
This finding may contradict to the fact that as
education increases the desire to limit family
size increases. But, the relation between short
birth to pregnancy interval and higher maternal
education might be explained by; first, the presence of short birth to pregnancy interval might
not necessarily reflect big family size. This study
used data from two consecutive births only and
this data doesn’t show the entire birth interval
trend. The second reason might be that women
who were busy in schooling may get older before getting married and have their family.
Birth to pregnancy interval showed non significant association to adverse perinatal outcomes.
This finding may contradict from other similar
studies done in St. Paul’s and Tikur Anbessa
Hospital in Ethiopia which reported conceiving
within 12 months of previous delivery is a critical interval to cause low birth weight. (18).
But the finding of this study is consistent with
findings from some other countries where they
reported that birth to pregnancy interval has no
association in causing preterm birth (23). In
Sweden the association between birth to pregnancy interval and stillbirth is confounded by
maternal socio demographic status (25). And a
study done in Boston (USA) reported no relation between inter pregnancy interval and risk
of preterm birth (24).
Ethiopian Journal of Reproductive Health
In this study it is observed that factors like having PPH in the preceding delivery and complications of pregnancy and labor to current pregnancy contribute to poor perinatal outcome
than birth to pregnancy interval. This finding
was almost found to be a universal fact and has
been revealed in many studies (1, 20, 21, 22).
The rate of premature delivery and LBW were
almost consistent with other studies done in
Ethiopia (6,7). But the findings from this study
showed low rate in LBW and prematurity as
compared to the Addis Ababa Health Bureau
1998 EC annual report (10). This might happen
because this study has used primary data from
health facility that might decrease non response
bias and avoids missing data.
The rate of stillbirth in this study was consistent
with other findings: the stillbirth rate in less
developed countries could exceed 3%. (12). But,
much higher than the DHS 2005 report which
shoed 1.8%, also from other study done in
Ethiopia which revealed 1.9% stillbirth rate (4).
and the Addis Ababa Health Bureau 1998 EC
report 2.5%. (10). But also very smaller when
compared with another study conducted in Tikur Anbessa Hospital with rate of 5.3% (13).
This may happen because in DHS data is collected by interview technique which creates a
recall bias and social desirability bias, culturally
most mothers don’t want to remember and
mention their lost child creating under reporting of stillbirths. This study uses primary data
and there is no chance of under reporting.
While in the Tikur Anbessa Hospital case; it is a
hospital where most complicated cases are referred to it,. As a result, getting higher stillbirth
rate in Tikur Anbessa Hospital might not be
strange. This study used data from health centers and this could dilute the stillbirth report
from hospitals. In this study also 53% of stillbirths were reported from government hospitals.
48
December2010, Volume 4, Number 1
Ethiopian Journal of Reproductive Health
Conclusion
Poor perinatal outcome, (LBW, and preterm
deliveries), were found to be significantly associated with current pregnancy/labor complications and the occurrence of PPH in the preceding labor but not shown to have an association
with birth to pregnancy interval, stillbirth;
influenced by maternal age >25 years, maternal educational status, religion, complication
of pregnancy and labor and presence of congenital malformations. Further study on the
effect of birth to pregnancy interval on perinatal outcome that includes other perinatal
outcomes is recommended.
Acknowledgement
I am very grateful to my advisors Dr. Fikre Enquoselassie and Prof. Lukman Yusuf from Addis Ababa
University medical faculty for their unreserved guidance and constructive suggestions from the stage of
proposal development to this end. My gratitude also goes to all data collectors, my brothers Mesfin, Bezuayehu and Wossenu for their valuable support and assistant during data collection. Also to Tsige Bekele and Tizita Ayalneh who has helped me in typography of the research. I am indebted with AAU
School of Public Health for partially sponsoring this research. I would like to extend my thanks to those
study participants who had volunteered to participate. I would take this opportunity to extend my
thanks to all of my teachers, the library and computer lab staffs of the School of Public Health, Addis
Ababa University for their encouragement during the whole research process.
Author Contact: [email protected]
49
December2010, Volume 4, Number 1
Ethiopian Journal of Reproductive Health
References
1. Behrman et. Al, Nelson text book of pediatrics, 17th edition 2004 saunders
2. March of Dimes, Neonatal death, available at:- http://www.marchofdimes.com/
professionals/681_1196.asp
3. Augustin Conde-Agudelo, Jose M. Belizan, Maureen H.Norton, Anyeli Rosas – Bermudez, Effect of
inter pregnancy interval on perinatal outcomes in Latin America, Obstertrics and gynecology
2005;106:359-366
4. Yemane Berhane and Ulf Hogberg, Prolonged labor in rural Ethiopia: a community base study, African journal of reproductive health 1999; 3[2]:33-39
5. UNCIEF, WHO, Low birth weight: country, regional and global estimates, Executive summary, New
York , 2004
6. Y. Feleke, F. Enquoselassie, Maternal age, parity and gestational age on the size of the new born in
Addis Ababa, East African medical journal Vol. 76 No. 8 August 1999.
7. Fikre Enquoselassie, Aklilu Minyilshewa, Changes in Birth weight of Hospital- delivered neonates in
Addis Ababa, Ethiopian journal of Health development 2000;14(2):169-176
8. Addis Ababa Health Bureau Family Health Team, Annual activity report for 1998 Ethiopian Calendar.
9. Fatima AL-Jasmi and et.al, Effect of inter pregnancy interval on risk of spontaneous preterm birth in
Emirate women, United Arab Emirates, Bulletin of world health organization vol. 18 No. 11, Geneva Nov. 2002.
10. University Virginia, High risk new born, Available at :-http://www.healthsystem.virginia.edu/
uvahealth/peds_hrnewborn/prematur.cfm
11. Lale Say and et al., The prevalence of still Births: A systematic review, Reproductive health 2006,3:1
12. Stanton C, Lawn JE, Rahman H, Wilezynska-Ketende K, Hill K, Still Birth rates : delivering estimates in 190 countries, Lancet 2006 may 6, 367(9521):1487-94.
13. Daniel Bisetegn, Determinants of still Birth at Tikur Anbessa hospital: a retrospective comparative
study, a thesis submitted to AAU Medical Faculty department of obstetrics and gynecology 2001.
14. Demographic and health survey preliminary report, Ethiopia, Central statistics Agency- Addis
Ababa, Ethiopia and ORC marco, Calverton, Maryland USA, November 2005.
15. Gordon C S Smith , Jill P Pell, Richard Dobbie, Inter pregnancy interval and risk of preterm birth
and neonatal death: retrospective cohort study, BMJ 2003;327:313 (August 9)
16. Augustin Conde-Agudelo, Anyeli Rosas – Bermudez, Ana Cecilia Kafury-Goeta, Birth spacing and
risk of adverse perinatal outcomes: A meta Analysis, JAMA 2006;295:1809-1823.
17. Demographic and health survey, Ethiopia, Central statistics Agency- Addis Ababa, Ethiopia and
ORC marco, Calverton, Maryland USA, May 2001.
18. Kokeb Getachew, Impact of spacing on outcome of pregnancy in Tikur Anbessa and St. Paul’s hospital, presented to AAU Medical Faculty Dpt. of Obs. & Gyne. in the partial fulfillment of certification in obstetrics and gynecology. December 1998.
19. Guldikas BM, Wood JW, Birth spacing patterns in humans and apes, American journal of physical
anthropology 1990;83:185-191
20. CDC, International notes update: Incidence of low birth weight, August 17, 1984/33(32)
21. F. Gary Cunningham and et.al, Williams Obstetrics, 22nd edition 2005, Mc Graw hill
22. Alan H. De Cherney and Martin L. Pernoll, Current Obstetrics and gynecologic diagnosis and treatment, 8th edition by Appleton and Lange.
23. Ferraz EM, Gray RH, Fleming PL, Maia TM. Inter pregnancy interval and low birth weight: a
finding from a case control study, American journal of epidemiology 1988 Nov; 128(5):1111-1116.
50
December2010, Volume 4, Number 1
Ethiopian Journal of Reproductive Health
24. Janet M. lang, Ellice lieberman, Kenneth J. Ryan and Richard R. Monson, Inter pregnancy interval
and risk of preterm labor, American journal of Epidemiology 1990Aug.; 132(2) ; 304-309
25. Olof Stephansson, Paul W. Dickman, Sven Cnattingius, The influence of Inter pregnancy interval on
the subsequent risk of still birth and early neonatal death, Obstetrics and gynecology 2003;102;101108
26. Ministry of health, Federal Democratic Republic of Ethiopia, Health and Health Related Indicators,
1997
27. Tesfaye Tessema, Guide for pediatric clinical examination, Gondar College of Medical Sciences.
28. Central Statistical Agency [Ethiopia] and ORC Macro. 2006. Ethiopia Demographic and Health Survey 2005. Addis Ababa, Ethiopia and Calverton, Maryland, USA: Central Statistical Agency and ORC
Macro
.
51


© Copyright 2026