
The Economic Value of College Majors
THE ECONOMIC VALUE
COLLEGE MAJORS
Anthony P. Carnevale
Ban Cheah
Andrew R. Hanson
2015
WHAT’S IT WORTH? THE ECONOMIC VALUE OF COLLEGE
INTRODUCTION
ACKNOWLEDGMENTS
We would like to express our gratitude to the individuals and organizations that
have made this report possible. Thanks to Lumina Foundation, the Bill & Melinda
Gates Foundation, and the Joyce Foundation for their generous support of our
research for the past several years. We are honored to be partners in their mission
of promoting postsecondary access and completion for all Americans. We are
especially grateful for the support of Jamie Merisotis, Holly Zanville, Daniel
Greenstein, Jennifer Engle, Elise Miller, Matthew Muench, and Whitney Smith.
We would like to thank our designers Janna Matherly and the team from
Woodpile; our editor Nancy Lewis; and our printer (insert printer). Our thanks
also go to our colleagues, whose support was vital to our success:
ww Jeff Strohl provided strong research direction and expertise
that contributed to both strategic and editorial decisions.
ww Andrea Porter provided strategic guidance in the
design and production of the report.
ww Ana Castañon assisted with the design and other
logistics of producing the report.
Many have contributed their thoughts and feedback throughout
the production of this report. That said, all errors, omissions,
and views remain the responsibility of authors.
The views expressed in this publication are those of the authors and do not necessarily represent
those of Lumina Foundation, the Bill & Melinda Gates Foundation, or the Joyce Foundation, or
their officers, or employees.
TABLE OF CONTENTS
4
INTRODUCTION
8
PART ONE: SEVEN MAJOR SUPERGROUPS
12
PART TWO: 15 MAJOR GROUPS
20
PART THREE: 137 DETAILED MAJOR SUBGROUPS BY 15 MAJOR GROUPS
21 AGRICULTURE AND NATURAL RESOURCES
29
ARCHITECTURE AND ENGINEERING
37ARTS
45 BIOLOGY AND LIFE SCIENCES
53
BUSINESS
61
COMMUNICATIONS AND JOURNALISM
67
COMPUTERS, STATISTICS, AND MATHEMATICS
75
EDUCATION
82
HEALTH
91
HUMANITIES AND LIBERAL ARTS
99
INDUSTRIAL ARTS, CONSUMER SERVICES, AND RECREATION
107
LAW AND PUBLIC POLICY
113
PHYSICAL SCIENCES
121
PSYCHOLOGY AND SOCIAL WORK
129
SOCIAL SCIENCES
137
APPENDIX ONE: REFERENCES, DATA SOURCES, AND METHODOLOGY
141
APPENDIX TWO: CLASSIFICATION OF MAJOR GROUPS AND SUBGROUPS
147
APPENDIX THREE: MAJOR SUBGROUPS RANKED BY MEDIAN ANNUAL WAGES
151
APPENDIX FOUR: MAJOR SUBGROUPS RANKED BY PREVALENCE
159
APPENDIX FIVE: MAJOR SUBGROUPS RANKED BY GRADUATE DEGREE ATTAINMENT
165
APPENDIX SIX: MAJOR SUBGROUPS RANKED BY GRADUATE DEGREE WAGE PREMIUM
171
APPENDIX SEVEN: PREVALENCE, WAGES, GRADUATE DEGREE ATTAINMENT, AND
GRADUATE DEGREE WAGE PREMIUM BY MAJOR GROUP AND SUBGROUP
180
EARNINGS AT THE 25TH, 50TH AND 75TH PERCENTILES, BY BACHELOR’S DEGREE MAJOR
184
THE GRADUATE ADVANTAGE, EARNINGS AT THE 25TH, 50TH AND 75TH PERCENTILES BY BACHELOR’S DEGREE MAJOR
200 ALL MAJORS BY GROUP, RANKED BY EARNINGS AND POPULARITY
204 LOWEST- AND HIGHEST-EARNING MAJORS, BACHELOR’S DEGREE HOLDERS
206 LOWEST- AND HIGHEST-EARNING MAJORS, GRADUATE DEGREE HOLDERS
208 MAJORS RANKED BY POPULARITY FOR BACHELOR’S DEGREE HOLDERS
209 MAJORS RANKED BY POPULARITY FOR GRADUATE DEGREE HOLDERS
210
HELP READING OUR CHARTS
Reprint Permission
The Center on Education and the Workforce carries a Creative Commons license, which permits noncommercial re-use of any of our content when proper attribution is provided.
You are free to copy, display and distribute our work, or include our content in derivative
works, under the CEW’s following conditions:
Attribution: You must clearly attribute the work to the Center on Education and the Workforce
and provide a print or digital copy of the work to [email protected].
Our preference is to cite figures and tables as follows:
Source: Georgetown University Center on Education and the Workforce, (name of publication).
Noncommercial: You may not use this work for commercial purposes. Written permission
must be obtained from the owners of the copy/literary rights and from Georgetown University
for any publication or commercial use of reproductions.
*Approval: If you are using one or more of our available data representations (figures, charts,
tables, etc), please visit our website at cew.georgetown.edu/publications/reprint-permission
for more information.
For the full legal code of this Creative Commons license, please visit creativecommons.org.
Should you need a form to be filled out by us, please email [email protected]
and we will send back in a timely manner.
THE ECONOMIC VALUE OF COLLEGE MAJORS
INTRODUCTION
INTRODUCTION
How much is a college major worth?
Today, 35 percent of jobs require a Bachelor’s degree or higher.1 On average, these
jobs pay $33,000 annually at the entry level and $61,000 at prime age. But averages
are deceiving. The economic risks and returns to Bachelor’s degrees vary greatly
among different majors. For today’s high school graduates, and an increasing share
of middle-aged adults who are pursuing a Bachelor’s degree, the decision about
what to major in will have critical economic consequences for the rest of their lives.
In some sense, deciding what to major in is more
important than deciding whether to attend college.
Over a lifetime, the average difference between
a high school and college graduate’s wages is $1
million, but the difference between the lowest and
the highest paying majors is $3.4 million. Over a
career, a Bachelor’s degree in petroleum engineering
pays $4.8 million, while a Bachelor’s degree in
early childhood education pays $1.4 million.
The importance of major is so powerful that
Bachelor’s degree holders in some majors earn
more than many graduate degree holders. For
example, architecture and engineering majors earn
an average of $83,000 annually over the course of
their careers, while graduate degree holders who
majored in education earn $60,000 annually.
At the same time, a college major is not destiny.
College provides access to particular occupations and
career pathways but college is only the ante in the
lifelong learning game.
1 Carnevale and Smith, Recovery, 2013.
4
Due to the complex relationships between college
and careers, some college graduates who major in
less lucrative fields of study earn more than those
in typically high-paying majors. For example, on
average, education majors have the lowest wages
while engineering majors have the highest wages.
But the top 25 percent of education majors earn more
than the bottom 25 percent of engineering majors.
College graduates’ wages are also influenced by
whether they work in the for-profit, nonprofit, or
public sector; which industry they work in; and
whether they pursue lifelong learning opportunities
and employer training that further hone their
career-related skills. Usually working in an occupation
aligned with a college field of study enhances
earnings and working outside of one’s field of study
reduces earnings–but not always. Engineering
majors who work as schoolteachers earn less than
other engineers and education majors who work
in business jobs earn more than most educators.
THE ECONOMIC VALUE OF COLLEGE MAJORS
INTRODUCTION
The fact that college majors play such an enormous
role in determining college graduates’ wages
and career trajectory has everyone asking: How
much is a college major worth? In this report,
we analyze the wages of college graduates by
15 major groups and 137 major sub groups. To
provide a more complete picture of what college
graduates are earning in the labor market, we
use the interquartile range of wages, or what the
However, this analysis alone is still incomplete because
one out of every three college graduates goes on to
earn a graduate degree. The fact that a college degree
is a stepping-stone on the way to a graduate degree
is a crucial part of its benefit: graduate degree holders
earn 28 percent more than Bachelor’s degree holders.
Moreover, some majors are substantially more likely to
lead to a graduate degree than others. For this reason,
we also analyze the likelihood that a major leads to a
middle half of college graduates are likely to earn
(i.e., the range from the 25th to 75th percentiles).
graduate degree and the graduate wage premium–the
percentage difference between a college graduate
and a graduate degree holder–across majors.
Today, 35 percent of jobs require a Bachelor’s
degree or higher.
Here are the major findings of our analysis:
Wages:
ww Among college graduates employed fulltime year round, Bachelor’s degree holders
earn an average annual salary of $61,000 over
the course of their careers, while graduate
degree holders earn $78,000 annually.
ww Among the 15 major groups, architecture
and engineering majors are paid the
most and education majors are paid the
least. College graduates who majored in
architecture or engineering earn an average
salary of $83,000 per year, while education
majors earn $45,000 per year.
ww Among the 137 major subgroups, petroleum
engineering majors are paid the most and early
childhood education majors are paid the least.
College graduates who majored in petroleum
engineering earn an average annual salary of
$136,000 over the course of their careers, while
those who majored in early childhood education
earn $39,000 annually.
ww Business majors’ wages vary the most. Business
majors earn $43,000 annually at the 25th percentile
and $98,000 annually at the 75th percentile, a
difference of $55,000.
ww Education majors’ wages vary the least. Education
majors earn $35,000 annually at the 25th percentile
and $59,000 annually at the 75th percentile, a
difference of $24,000.
5
THE ECONOMIC VALUE OF COLLEGE MAJORS
INTRODUCTION
Prevalence:
ww Among the 15 major groups, business is
the most common major. It accounts for
26 percent of college-educated workers.
Agriculture and natural resources is the least
common major. It accounts for less than
2 percent of college-educated workers.
ww Among the 137 major subgroups, business
management and administration is the
most common major, representing 8
percent of college-educated workers.
ww Science, technology, engineering,
and math (STEM) majors comprise 20
percent of college-educated workers
and include four of the 15 major groups:
engineering (8.3%); computers, statistics,
and mathematics (5.6%), biology and life
sciences (3.3%), and physical sciences (2.5%).
Graduate degree attainment:
ww Among the 15 major groups, biology and
life sciences majors are most likely to earn
a graduate degree, while communications
and journalism majors are the least likely to
earn a graduate degree. Fifty-eight percent
of biology and life sciences majors earn a
graduate degree, compared to 21 percent
of communications and journalism majors.
ww Health and medical preparatory programs
majors are the most likely to lead to a
graduate degree among the 137 major
subgroups: three out of four health and
medical preparatory programs majors
earn graduate degrees, compared to
35 percent of all college graduates.
ww The most lucrative majors are not
necessarily the most common. The
economic value of majors plays a role in
students’ choice of major, but students’
abilities, academic preparation, interests,
and values are also important.
2 While the majority of college majors are occupational, the exposure of students to courses beyond their major field of study
still dominates course taking. Most Bachelor’s degrees require that about one third of courses be taken in a major field of study.
Roughly half of courses are taken as general education in a broad set of disciplines required outside the major field of study and
the remaining 15 percent are electives. While there is wide variation, a Bachelor’s degree generally requires about 120 credit hours
divided into 60 credit hours of general education across a variety of fields of study including the sciences, social sciences, foreign
language, and humanities; 40 credit hours in a major field of study; and roughly 20 credit hours of electives chosen by the student.
The two-year Associate’s degree largely comprises general education courses parallel to those taken at the first two years of a
Bachelor’s degree and are oftentimes made eligible for transfer toward a Bachelor’s degree. The four-year Bachelor of Science and
two-year Associate of Science degree emphasize more technical and applied subject matter in technical fields of study but do not
exclude general education or humanities course requirements. Associate of Applied Science degrees focus on applied learning in
particular fields but credits generally are not eligible for transfer toward a Bachelor’s degree. The share of humanities and liberal
arts majors, for example, is relatively small (8.6 percent) but the exposure to humanities courses is growing. Humanities and liberal
arts majors peaked at 17 percent of all majors with the onrush of the baby boomers into the postsecondary system in the early
1970s. But by the end of the ‘70s, the share of liberal arts and humanities majors declined and has remained relatively stable, varying
between the high single digits and the low double digits as a share of all majors (Humanities Indicators, the National Academy
of Arts and Sciences, http://www.humanitiesindicators.org/content/indicatordoc.aspx?i=9). Nevertheless, humanities faculty
has grown by more than 50 percent since 1999 and has maintained its’ share of college faculty (Humanities Indicators, American
Academy of Arts and Sciences, http://www.humanitiesindicators.org/content/indicatorDoc.aspx?d=71&hl=faculty&m=0).
6
THE ECONOMIC VALUE OF COLLEGE MAJORS
INTRODUCTION
Graduate degree wage premium:
ww Biology and life sciences majors with
graduate degrees earn 63 percent more
than those with Bachelor’s degrees, the
largest graduate degree wage premium
among the 15 major groups. By comparison,
arts majors receive the lowest graduate
degree wage premium: 23 percent.
ww Graduate degree holders who majored
in health and medical preparatory
programs earn 137 percent more than
those with Bachelor’s degrees, the
largest graduate degree wage premium
among the 137 major subgroups.
Career-focused majors versus
humanities and liberal arts:
The report is organized into three parts. In Part 1,
we analyze college graduates’ wages, career wage
growth, and prevalence by seven major supergroups.
In Part 2, we analyze college graduates’ wages,
major selection, graduate degree attainment, and
the wage premium from a graduate degree across
the 15 major groups. In Part 3, we provide a similar
analysis, but use the more detailed 137 major
subgroups. We include a dashboard for each of the
15 major groups and their respective subgroups. For
each major subgroup, the dashboard provides the
following metrics for college graduates and collegeeducated workers between the ages of 25 and 59:
ww Prevalence
ww Median wages for Bachelor’s and
graduate degree holders
ww Four out of five college graduates
majored in a career-focused field.
ww Interquartile range of wages for Bachelor’s
and graduate degree holders
ww Since the 1980s, the share of students
in humanities and liberal arts majors
has declined, but the number of
students taking humanities and liberal
arts has gone up due to more rigorous
general education requirements. 2
ww Graduate degree attainment
ww Graduate degree wage premium
The appendices contain complete rankings
of the 137 major subgroups by:
ww Median wages of Bachelor’s degree holders
ww Prevalence
ww Graduate degree attainment
ww Graduate degree wage premium
The most lucrative majors are not necessarily the most common.
The economic value of majors plays a role in students’ choice
of major, but students’ abilities, academic preparation, interests,
and values are also important.
7
MAJORS | PART ONE
THE ECONOMIC VALUE OF COLLEGE MAJORS
SEVEN MAJOR SUPERGROUPS
INTRODUCTION
SEVEN MAJOR SUPERGROUPS
At the entry level, college graduates earn $37,000 annually. But their entry salaries
vary by major (Figure 1.1). STEM majors earn $43,000 upon entering the workforce,
while arts, liberal arts, and humanities majors earn $29,000 annually. No matter what
they major in, recent college graduates typically earn more than recent high school
graduates, who earn $22,000 annually.
FIGURE 1.1 | Among entry-level college-educated workers, STEM majors earn $43,000 annually, while arts,
humanities, and liberal arts majors earn $29,000 annually.
Median annual wages of college-educated workers (ages 21-24) by major supergroup (2013$)
STEM
$43,000
Health
$41,000
Business
$37,000
Social sciences
$33,000
All majors
$33,000
Teaching and serving
$30,000
Career-focused
$30,000
Arts, liberal arts, and humanities
High school graduate
$29,000
$22,000
Source: Georgetown University Center on Education and the Workforce analysis of U.S. Census Bureau, American Community Survey
micro data, 2009-2013.
Over the course of their careers, college graduates’
wages increase but so do the differences in wages
among majors. College graduates earn an average
annual salary of $61,000 over the course of their
careers. 3 But science, technology, engineering, and
mathematics (STEM) majors earn much more than
STEM majors earn $76,000 annually, while teaching
and serving majors earn $46,000 annually (Figure 1.2).
STEM, health, and business majors earn more than
the average college graduate, while social sciences
majors; career-focused majors4; arts, liberal arts,
humanities majors, and teaching and serving majors
teaching and serving majors, which include education,
psychology, and social work majors. On average,
all earn less than the average college graduate.
3 Annual wages are restricted to workers employed full-time year round in their prime working years (ages 25 through 59).
4 Career-focused majors include industrial arts, consumer services, recreation, communications, journalism, law and public policy,
agriculture, and natural resources.
8
PART ONE | THETHE
ECONOMIC
ECONOMIC
VALUE
VALUE
OF OF
COLLEGE
COLLEGE
MAJORS
MAJORS
SEVEN META-MAJOR
GROUPS
INTRODUCTION
Over the course of their careers, college graduates’ wages
increase but so do the differences in wages among majors.
FIGURE 1.2 | On average, science, technology, engineering, and mathematics (STEM) majors earn $76,000
annually, while teaching and serving majors earn $46,000 annually.
Median annual wages of college-educated workers (ages 25-59) by major supergroup (2013$)
Median annual wages of college-educated workers (ages 25-59) by major supergroup (2013$)
STEM
$76,000
Health
$65,000
Business
$65,000
All majors
$61,000
Social sciences
$60,000
Career-focused
$54,000
Arts, liberal arts, and humanities
$51,000
Teaching and serving
High school graduate
$46,000
$36,000
Source: Georgetown University Center on Education and the Workforce analysis of U.S. Census Bureau, American Community Survey
micro data, 2009-2013.
The differences in wages by major grow larger over the
course of one’s career (Figure 1.3). STEM majors’ annual
wages grow by $21,000 from early to mid-career. But
those who major in education, psychology, or social
work see their annual wages grow by only $8,000
over the same transitional period. Most wage growth
occurs in the transition from early to mid-career.
9
MAJORS | PART ONE
THE ECONOMIC VALUE OF COLLEGE MAJORS
SEVEN MAJOR SUPERGROUPS
INTRODUCTION
FIGURE 1.3 | STEM majors’ wages grow more than other majors’ wages over the course of a career, increasing
the wage gap between STEM and non-STEM majors.
Median annual wages and wage growth for college-educated workers by major supergroup and
age group (2013$)
STEM
$60,000
Health
$53,000
Business
Social sciences
Career-focused
Arts, liberal arts, and humanities
Teaching and serving
$14,000
$52,000
$49,000
$45,000
$42,000
$5,000
$5,000
$18,000
$21,000
$17,000
$15,000
$39,000 $8,000
$9,000
$21,000
$4,000
$1,000
$3,000
$3,000
Age Groups
25-34
35-44
45-59
Source: Georgetown University Center on Education and the Workforce analysis of U.S. Census Bureau, American Community Survey
micro data, 2009-2013.
STEM majors not only have the highest wages, they
experience the largest wage growth over the course
of their careers (Figure 1.4). Their wages grow by
50 percent, compared to 28 percent growth for
college graduates in teaching and serving-related
majors (education, psychology, and social work).
Business majors are the most common, followed
by STEM majors (Figure 1.5). Twenty-six percent
of college graduates majored in business,
while 20 percent majored in STEM. The more
academically focused majors–arts, liberal arts,
humanities, and social sciences–comprise
only 20 percent of college graduates.
STEM majors not only have the highest wages, they
experience the largest wage growth over the course
of their careers
10
PART ONE | THETHE
ECONOMIC
ECONOMIC
VALUE
VALUE
OF OF
COLLEGE
COLLEGE
MAJORS
MAJORS
SEVEN META-MAJOR
GROUPS
INTRODUCTION
FIGURE 1.4 | STEM majors’ wages increase by 50 percent over the course of their careers, compared to 32
percent growth for teaching and serving majors.
Median annual wages of college-educated workers (ages 25-59) by major supergroup (2013$)
Career wage growth of college-educated workers (ages 25-59) by major supergroup, 2013
STEM
50%
Business
44%
Social sciences
44%
Career-focused
43%
Arts, humanities, and liberal arts
42%
Health
36%
Teaching and serving
32%
Source: Georgetown University Center on Education and the Workforce analysis of U.S. Census Bureau, American Community Survey
micro data, 2009-2013.
FIGURE 1.5 | Business majors are the most common, followed by STEM majors.
Share of college graduates (ages 25-59) by major supergroup, 2013
26.1%
Business
STEM
19.6%
Teaching and serving
14.5%
Arts, humanities, and liberal arts
13.4%
Career-focused
11.9%
Health
Social sciences
7.5%
6.9%
Source: Georgetown University Center on Education and the Workforce analysis of U.S. Census Bureau, American Community Survey
micro data, 2009-2013.
Note: Percentages may not sum to 100 percent due to rounding.
11
MAJORS | PART TWO
THE ECONOMIC VALUE OF COLLEGE MAJORS
15 MAJOR GROUPS
INTRODUCTION
15 MAJOR GROUPS
In Part Two, we continue analyzing college graduates’ education and labor market
outcomes by major. But instead of using seven major supergroups, we use 15 major
groups to get a more detailed understanding of the value of college majors.4
Wages by major group
Recent college graduates’ annual wages vary from $27,000 to $50,000 depending on their major (Figure 2.1).
On average, recent college graduates earn $33,000 annually. Recent college graduates in five major groups
have above average wages: architecture and engineering; computers, statistics, and mathematics; health;
business; and social sciences. Recent college graduates with the lowest wages are concentrated in three
major groups: industrial arts, consumer services, and recreation; arts; and psychology and social work.
FIGURE 2.1 | Recent college graduates who majored in architecture or engineering earn $50,000 annually, while
those who majored in industrial arts, consumer services, or recreation earn $27,000 annually.
Median annual wages of college-educated workers (ages 21-24) by major group (2013$)
Architecture and engineering
$50,000
Computers, statistics, and mathematics
$43,000
Health
$41,000
Business
$37,000
Social sciences
$33,000
All majors
$33,000
Physical sciences
$32,000
Education
$32,000
Law and public policy
$31,000
Communications and journalism
$31,000
Humanities and liberal arts
$30,000
Agriculture and natural resources
$30,000
Biology and life sciences
$29,000
Psychology and social work
$28,000
Arts
$28,000
Industrial arts, consumer services, and recreation
High school graduate
$27,000
$22,000
Source: Georgetown University Center on Education and the Workforce analysis of U.S. Census Bureau, American Community Survey
micro data, 2009-2013.
4 See Appendix 2 for a detailed classification of the 15 major groups and their related subgroups.
12
PART TWO |THE
THEECONOMIC
ECONOMICVALUE
VALUEOF
OFCOLLEGE
COLLEGE MAJORS
15 MAJOR
GROUPS
INTRODUCTION
Business and health majors are the two non-STEM majors
that lead to above average wages.
The average wages of college-educated workers between the ages of 25 and 59 vary from $45,000 to
$83,000 depending on their major (Figure 2.2). Architecture and engineering majors and computers,
statistics, and mathematics majors are the only majors that lead to annual wages above $70,000.
Business and health majors are the two non-STEM majors that lead to above average wages. College
graduates who majored in education; psychology and social work; or arts earn less than $50,000
annually. Together, these three major groups comprise 20 percent of college-educated workers.
FIGURE 2.2 | On average, college graduates who majored in architecture or engineering earn $83,000
annually, while those who majored in education earn $45,000.
Median annual wages of college-educated workers (ages 25-59) by major supergroup (2013$)
Architecture and engineering
$83,000
Computers, statistics,
and mathematics
$76,000
Business
$65,000
Health
$65,000
Physical sciences
$65,000
All majors
$61,000
Social sciences
$60,000
Agriculture and natural resources
$56,000
Biology and life sciences
$56,000
Communications and journalism
$54,000
Law and public policy
$54,000
Humanities and liberal arts
$52,000
Industrial arts, consumer services,
and recreation
$52,000
Arts
$49,000
Psychology and social work
$47,000
Education
High school graduate
$45,000
$36,000
Source: Georgetown University Center on Education and the Workforce analysis of U.S. Census Bureau, American Community Survey
micro data, 2009-2013.
13
MAJORS | PART TWO
THE ECONOMIC VALUE OF COLLEGE MAJORS
15 MAJOR GROUPS
INTRODUCTION
No matter what a student’s major, he or she is likely to
earn more than high school graduates. The average
education major earns $45,000 annually, while the
average high school graduate earns $36,000.
Bachelor’s degree holders are not destined to earn
the median wage. Within each of the 15 major groups,
there is wide variation around the median (Figure
2.3). 5 This variation is due to differences in pay by
FIGURE 2.3 | The median wage of college graduates who majored in business is $65,000 annually, though as with
many of the high-paying major groups, there is a wide variation in the range of annual wages, such
that the lowest 25 percent of business majors earn less than the median wage of all major groups.
Median annual wages of college-educated workers (ages 25-59) by major supergroup (2013$)
Architecture and engineering
Computers, statistics, and
mathematics
Business
Health
Physical sciences
All majors
Social sciences
Agriculture and natural resources
Biology and life sciences
Communications and journalism
Law and public policy
Humanities and liberal arts
Industrial arts, consumer services,
and recreation
Arts
Psychology and social work
Education
High school graduate
$0
25th Percentile
$20,000
Median
$40,000
$60,000
$80,000
$100,000
$120,000
75th Percentile
Source: Georgetown University Center on Education and the Workforce analysis of U.S. Census Bureau, American Community Survey
micro data, 2009-2013.
5 Wage differences tend to vary at three levels of analysis: (1) among the traditional 15 Bachelor’s degree groups; (2) among the
detailed majors that represent specialties within the major groups – between accounting and marketing within the business major
group, for example; and (3) in the distribution of wages among people in the same majors or specialties within majors.
14
PART TWO |THE
THEECONOMIC
ECONOMICVALUE
VALUEOF
OFCOLLEGE
COLLEGE MAJORS
15 MAJOR
GROUPS
INTRODUCTION
industry, occupation, and for-profit or not for-profit
sector, as well as differences in skills development
over time on the job. Moreover, in a fast-changing
economy, degrees are only as valuable as the
circumstances in which they are employed and the
ability of individuals to keep up with that evolution.
The median wage reflects the wages of a typical
worker in that field, but there is always variation
in individual workers’ wages. For example, within
the 15 major groups, workers with a Bachelor’s
degree in the humanities and liberal arts have a:
ww 75 percent chance of earning at least $36,000;
ww 50 percent chance of earning
at least $52,000; and a
ww 25 percent chance of earning at least $78,000.
By comparison, workers with Bachelor’s degrees
in architecture and engineering have a:
ww 75 percent chance of earning at least $59,000;
ww 50 percent chance of earning
at least $83,000; and a
ww 25 percent chance of earning
at least $113,000.
As a result, some college graduates with lowpaying majors earn more than college graduates
with high-paying majors. For example, one
in four college graduates who majored in the
humanities or liberal arts earns more than a
quarter of college graduates who majored in
architecture or engineering. Conversely, the quarter
of architecture and engineering majors with the
lowest wages earn less than the average college
graduate who majored in business or health.
The majors with the highest median wages also
tend to have the greatest variation in wages
(Figure 2.3). The wide range of earnings implies
that there is a wide range of skills for the highest
earnings majors. Conversely, education majors
– the major group with the lowest wages – also
have the narrowest interquartile range6 at $24,000.
The two major groups with the widest range of
wages – business and computers, mathematics,
and statistics – are also high-wage majors. On the
other hand, health, which has relatively high median
earnings of $65,000, has a narrow interquartile
range of $39,000, about the same as arts majors.7
Prevalence of major groups
Business is the most common major among college
graduates (Figure 2.4). Business majors represent
26 percent of college graduates. While each of the
five STEM majors is relatively small, the STEM majors
combined represent almost 20 percent of all college
degrees. After business and STEM, education and
humanities and liberal arts majors are the most
common: education majors comprise 10 percent of
college graduates, while humanities and liberal arts
majors comprise 9 percent of college graduates.
Most students major in a field that is at least
tangentially career-related. The major groups with the
weakest ties to a career track–humanities and liberal
arts; arts; and social sciences–together comprise less
than 20 percent of college graduates. Despite the
fact that most majors are career-focused, college
students are now required to complete academic
courses in the humanities and liberal arts in order
to fulfill their graduation requirements. On average,
Bachelor’s degree programs require that about
half of coursework must be in general education
and one-third to be in major-related coursework.
STEM majors are closely aligned with particular
occupations and industries. Among STEM fields,
architecture and engineering majors are the most
common, followed by computers, statistics, and
mathematics majors; biology and life sciences
majors; and physical sciences majors.
6 An interquartile range is a measure of dispersion, or how spread out the data are. It is the difference between the 75th and 25th
percentiles. 7 Economists sometimes use wages as a proxy for skill as well as the economic value of skill. See David Autor, Lawrence Katz,
and Melissa Kearney, The Polarization of the U.S. Labor Market, NBER Working Paper No. 11986 (Boston: National Bureau of Economic
Research, 2006).
15
MAJORS | PART TWO
THE ECONOMIC VALUE OF COLLEGE MAJORS
15 MAJOR GROUPS
INTRODUCTION
An additional one-fifth of college graduates majored
in a career-focused field that prepares one for a
career in the teaching, public service, or healthcare
professions. These are education majors; psychology
and social work majors; and health majors.
developed abilities. The most lucrative majors are
not necessarily the most common and vice-versa. For
example, education, arts, and psychology and social
work majors pay the least and still attract more than
20 percent of students. Altogether, though, more than
half of all college students are majoring in the three
most lucrative areas: business, STEM, and healthcare.
Choosing majors is not just about dollars and cents.
It also involves interests, values, preparation, and
FIGURE 2.4 | Business majors are the most popular, with 26 percent of college graduates majoring
in business fields.
Share of college graduates (ages 25-59) by major group, 2013
Business
26.1%
Education
9.4%
Humanities and liberal arts
8.6%
Architecture and engineering
8.3%
Health
7.5%
Social sciences
6.9%
Computers, statistics, and
mathematics
5.6%
Psychology and social work
5.2%
Communications and journalism
5.2%
Arts
4.8%
Biology and life sciences
3.3%
Industrial arts, consumer services,
and recreation
2.7%
Law and public policy
2.6%
Physical sciences
2.5%
Agriculture and natural resources
1.5%
Source: Georgetown University Center on Education and the Workforce analysis of U.S. Census Bureau, American Community Survey
micro data, 2009-2013.
16
PART TWO |THE
THEECONOMIC
ECONOMICVALUE
VALUEOF
OFCOLLEGE
COLLEGE MAJORS
15 MAJOR
GROUPS
INTRODUCTION
Graduate degree attainment
STEM majors are
closely aligned
with particular
occupations
and industries.
Overall, one-third of college graduates complete a
graduate degree, but the likelihood of completing a
graduate degree varies by major (Figure 2.5). Among
college graduates who majored in biology or life sciences,
58 percent complete a graduate degree. By contrast, only
21 percent of communications and journalism majors
complete a graduate degree, the lowest attainment
rate among the 15 major groups. Many biology and life
sciences majors prepare for medical school, a primary
reason for their high rate of graduate degree attainment.
FIGURE 2.5 | College graduates who majored in biology or life sciences are the most likely to earn a graduate
degree, while those who majored in communications or journalism are the least likely.
Graduate degree attainment of college graduates (ages 25-59) by major group, 2013
Biology and life sciences
57.7%
Physical sciences
50.0%
Psychology and social work
45.3%
Education
44.6%
Humanities and liberal arts
41.4%
Social sciences
41.4%
Architecture and engineering
38.2%
All majors
35.1%
Health
33.8%
Computers, statistics, and
mathematics
33.3%
Agriculture and natural resources
27.9%
Industrial arts, consumer services,
and recreation
24.2%
Law and public policy
24.2%
Arts
Business
Communications and journalism
23.2%
22.2%
20.8%
Source: Georgetown University Center on Education and the Workforce analysis of U.S. Census Bureau, American Community Survey
micro data, 2009-2013.
17
MAJORS | PART TWO
THE ECONOMIC VALUE OF COLLEGE MAJORS
15 MAJOR GROUPS
INTRODUCTION
Graduate degree wage premium
The benefit of a graduate degree also depends on a
person’s major (Figure 2.6). Not only are biology and
life sciences majors the most likely to earn graduate
degrees, they also receive the largest wage premium
from graduate degrees. Among college graduates
who majored in biology and life sciences, graduate
degree holders earn 63 percent more than Bachelor’s
degree holders. By comparison, arts majors with
graduate degrees earn 23 percent more than those
with Bachelor’s degrees alone, the lowest graduate
degree wage premium among college majors.
FIGURE 2.6 | Graduate degree holders who majored in biology or life sciences have the highest wage
premium, earning 63 percent more than Bachelor’s degree holders with other major groups.
Graduate degree wage premium for college-educated workers (ages 25-59) by major group, 2013
Biology and life sciences
63.3%
Physical sciences
50.0%
Social sciences
44.6%
Humanities and liberal arts
34.2%
Psychology and social work
33.3%
Business
33.3%
Education
33.3%
Law and public policy
33.1%
Agriculture and natural resources
32.9%
Health
29.2%
All majors
28.4%
Computers, statistics, and
mathematics
25.6%
Communications and journalism
25.5%
Industrial arts, consumer services,
and recreation
25.4%
Architecture and engineering
25.0%
Arts
22.9%
Source: Georgetown University Center on Education and the Workforce analysis of U.S. Census Bureau, American Community Survey
micro data, 2009-2013.
18
PART TWO |THE
THEECONOMIC
ECONOMICVALUE
VALUEOF
OFCOLLEGE
COLLEGE MAJORS
15 MAJOR
GROUPS
INTRODUCTION
Top 25 detailed major subgroups ranked by earnings
TABLE 2.1 | Economics and business economics are the only two non-STEM majors in
the top 25 majors ranked by wages.
Rank
Major subgroup
Median annual wages of
college-educated workers
(ages 25-59) (2013$)
1
Petroleum engineering
136,000
2
Pharmacy, pharmaceutical
sciences, and administration
113,000
3
Metallurgical engineering
98,000
4
Mining and mineral engineering
97,000
5
Chemical engineering
96,000
6
Electrical engineering
93,000
7
Aerospace engineering
90,000
8
Mechanical engineering
87,000
9
Computer engineering
87,000
10
Geological and geophysical engineering
87,000
11
Computer science
83,000
12
Civil engineering
83,000
13
Applied mathematics
83,000
14
Industrial and manufacturing engineering
81,000
15
Physics
81,000
16
General engineering
81,000
17
Engineering mechanics,
physics, and science
81,000
18
Architectural engineering
80,000
19
Engineering and industrial management
78,000
20
Statistics and decision science
78,000
21
Management information
systems and statistics
77,000
22
Environmental engineering
76,000
23
Miscellaneous engineering
76,000
24
Economics
76,000
25
Business economics
75,000
Source: Georgetown University Center on Education and the Workforce analysis of U.S. Census Bureau,
American Community Survey micro data, 2009-2013.
19
MAJORS | PART TWO
THE ECONOMIC VALUE OF COLLEGE MAJORS
15 MAJOR GROUPS
INTRODUCTION
Bottom 25 detailed major subgroups ranked by earnings
TABLE 2.2 | The lowest-earning majors are concentrated in arts, education, consumer
services, psychology, and social work.
Rank
Major subgroup
Median annual wages of
college-educated workers
(ages 25-59) (2013$)
1
Early childhood education
39,000
2
Human services and community organization
41,000
3
Studio arts
42,000
4
Social work
42,000
5
Teacher education: multiple levels
42,000
6
Visual and performing arts
42,000
7
Theology and religious vocations
43,000
8
Elementary education
43,000
9
Drama and theater arts
45,000
10
Family and consumer sciences
45,000
11
Language and drama education
45,000
12
Special needs education
45,000
13
General education
46,000
14
Multi/interdisciplinary studies
46,000
15
Art and music education
46,000
16
Communication disorders
sciences and services
46,000
17
Composition and speech
47,000
18
Social sciences or history teacher education
47,000
19
Science and computer teacher education
48,000
20
Secondary teacher education
48,000
21
Neuroscience
48,000
22
Mathematics teacher education
49,000
23
Anthropology and archeology
49,000
24
Interdisciplinary social sciences
49,000
25
Music*
49,000
Source: Georgetown University Center on Education and the Workforce analysis of U.S. Census Bureau, American
Community Survey micro data, 2009-2013.
*Psychology; physical fitness; parks, recreation, and leisure; humanities; art history and criticism; fine arts; and
animal sciences also have median earnings of $49,000.
20
PART THREE | THE
THEECONOMIC
ECONOMICVALUE
VALUEOF
OFCOLLEGE
COLLEGE MAJORS
136 MAJOR
SUB-GROUPS
INTRODUCTION
PART 3: 137 MAJOR SUBGROUPS
In Part Three, we continue analyzing college graduates’
education and labor market outcomes by major. But instead
of using 15 major groups, we disaggregate the major
groups into 137 major subgroups to get a more detailed
understanding of the value of specific college majors.8
AGRICULTURE AND NATURAL RESOURCES
SHARE OF ALL MAJORS
1.5
%
GRADUATE DEGREE ATTAINMENT
27.9
%
8 See Appendix 2 for a detailed classification of the 15 major groups and their related subgroups.
21
THE ECONOMIC VALUE OF COLLEGE MAJORS MAJORS | PART THREE
AGRICULTURE
AND NATURAL RESOURCES
INTRODUCTION
Prevalence of major subgroups in the fields
of agriculture and natural resources
FIGURE 3.1 | General agriculture and animal sciences are the most common agriculture and natural
resources majors.
Share of college graduates with agriculture and natural resources majors (ages 25-59) by major
subgroup, 2013
General agriculture
18.1%
Miscellaneous agriculture
17.1%
Animal sciences
16.7%
Natural resources management
14.7%
Plant science and agronomy
13.0%
Forestry
9.8%
Agricultural economics
Food science
5.7%
4.0%
Source: Georgetown University Center on Education and the Workforce analysis of U.S. Census Bureau, American Community Survey
micro data, 2009-2013.
Note: Percentages may not sum to 100 percent due to rounding.
22
PART THREE | THE
THEECONOMIC
ECONOMICVALUE
VALUEOF
OFCOLLEGE
COLLEGE MAJORS
AGRICULTURE AND NATURAL
RESOURCES
INTRODUCTION
FIGURE 3.2 | Among agriculture and natural resources majors, agricultural economics and food science
majors earn the most, and animal sciences majors earn the least.
Median annual wages of college-educated workers with agriculture and natural resources majors (ages
25-59) by major subgroup (2013$)
Food science
$67,000
Agricultural economics
$67,000
Forestry
$62,000
Bachelor’s degree holder,
all majors
$61,000
Miscellaneous agriculture
$57,000
Natural resources management
$56,000
All agriculture and natural
resources majors
$56,000
Plant science and agronomy
$53,000
General agriculture
$53,000
Animal sciences
High school graduate
$49,000
$36,000
Source: Georgetown University Center on Education and the Workforce analysis of U.S. Census Bureau, American Community Survey
micro data, 2009-2013.
23
THE ECONOMIC VALUE OF COLLEGE MAJORS MAJORS | PART THREE
AGRICULTURE
AND NATURAL RESOURCES
INTRODUCTION
FIGURE 3.3 | Food science and agricultural economics majors have a 25 percent chance of earning at least
$100,000 annually.
Interquartile range of annual wages of college-educated workers with agriculture and natural resources
majors (ages 25-59) by major subgroup (2013$)
Food science
Agricultural economics
Forestry
Bachelor’s degree holder,
all majors
Miscellaneous agriculture
Natural resources management
All agriculture and natural
resources majors
Plant science and agronomy
General agriculture
Animal sciences
High school graduate
$0
25th Percentile
$20,000
Median
$40,000
$60,000
$80,000
$100,000
$120,000
75th Percentile
Source: Georgetown University Center on Education and the Workforce analysis of U.S. Census Bureau, American Community Survey
micro data, 2009-2013.
24
PART THREE | THE
THEECONOMIC
ECONOMICVALUE
VALUEOF
OFCOLLEGE
COLLEGE MAJORS
AGRICULTURE AND NATURAL
RESOURCES
INTRODUCTION
FIGURE 3.4 | Among agriculture and natural resources majors, food science majors are the most likely to
earn graduate degrees.
Graduate degree attainment of college graduates with agriculture and natural resources majors (ages
25-59) by major subgroup, 2013
Food science
40.6%
Animal sciences
36.7%
Bachelor’s degree holder,
all majors
All agriculture
and natural resources
27.9%
Natural resources management
27.9%
Agricultural economics
27.8%
35.1%
Plant science and agronomy
26.2%
Forestry
26.0%
General agriculture
Miscellaneous agriculture
24.7%
18.4%
Source: Georgetown University Center on Education and the Workforce analysis of U.S. Census Bureau, American Community Survey
micro data, 2009-2013
25
THE ECONOMIC VALUE OF COLLEGE MAJORS MAJORS | PART THREE
AGRICULTURE
AND NATURAL RESOURCES
INTRODUCTION
Outcomes for graduate degree holders in the
fields of agriculture and natural resources
FIGURE 3.5 | Among graduate degree holders with agriculture or natural resources majors, those who
majored in agricultural economics have the highest average wages.
Median annual wages of college-educated workers with agriculture and natural resources majors (ages
25-59) by major subgroup (2013$)
Agricultural economics
$83,000
Forestry
$80,000
Graduate degree holder,
all majors
$78,000
Food science
$77,000
Animal sciences
$76,000
All agriculture and natural
resources majors
$74,000
Natural resources management
$71,000
Miscellaneous agriculture
$70,000
Plant science and agronomy
$70,000
General agriculture
Bachelor’s degree holder,
all majors
$68,000
$61,000
Source: Georgetown University Center on Education and the Workforce analysis of U.S. Census Bureau, American Community Survey
micro data, 2009-2013.
26
PART THREE | THE
THEECONOMIC
ECONOMICVALUE
VALUEOF
OFCOLLEGE
COLLEGE MAJORS
AGRICULTURE AND NATURAL
RESOURCES
INTRODUCTION
FIGURE 3.6 | The top 25 percent of graduate degree holders with agricultural economics majors earn more
than $120,000 annually, while the bottom 25 percent of graduate degree holders with general
agriculture majors earn less than $50,000 annually.
Interquartile range of annual wages of graduate degree holders with agriculture and natural resources
majors (ages 25-59) by major subgroup (2013$)
Agricultural economics
Forestry
Graduate degree holder,
all majors
Food science
Animal sciences
All agriculture and natural
resources majors
Natural resources management
Miscellaneous agriculture
Plant science and agronomy
General agriculture
Bachelor’s degree holder,
all majors
$10,000
25th Percentile
$30,000
Median
$50,000
$70,000
$90,000
$110,000
$130,000
75th Percentile
Source: Georgetown University Center on Education and the Workforce analysis of U.S. Census Bureau, American Community Survey
micro data, 2009-2013.
27
THE ECONOMIC VALUE OF COLLEGE MAJORS MAJORS | PART THREE
AGRICULTURE
AND NATURAL RESOURCES
INTRODUCTION
TABLE 3.1 | Among agriculture and natural resources majors, animal sciences majors
receive the largest wage premium from a graduate degree (55%), while food
science majors receive the smallest (15%).
Median annual wages of
college-educated
workers (ages 25-59) with
agriculture and natural
resources majors (2013$)
Graduate degree wage
premium (2013$)
Major group
Bachelor’s
Graduate
$
%
All majors
61,000
78,000
17,000
28
All agriculture and natural
resources majors
56,000
74,000
18,000
32
Animal sciences
49,000
76,000
27,000
55
Plant science and agronomy
53,000
70,000
17,000
32
Forestry
62,000
80,000
18,000
29
General agriculture
53,000
68,000
15,000
28
Natural resources
management
56,000
71,000
15,000
27
Agricultural economics
67,000
83,000
16,000
24
Miscellaneous agriculture
57,000
70,000
13,000
23
Food science
67,000
77,000
10,000
15
Major subgroup
Source: Georgetown University Center on Education and the Workforce analysis of U.S. Census Bureau,
American Community Survey micro data, 2009-2013.
28
PART THREE | THE
THEECONOMIC
ECONOMICVALUE
VALUEOF
OFCOLLEGE
COLLEGE MAJORS
AGRICULTURE AND NATURAL
RESOURCES
INTRODUCTION
ARCHITECTURE AND ENGINEERING
SHARE OF ALL MAJORS
8.3
%
GRADUATE DEGREE ATTAINMENT
28.2
%
29
THE ECONOMIC VALUE OF COLLEGE MAJORS MAJORS | PART THREE
ARCHITECTURE
AGRICULTURE
AND
ANDNATURAL
ENGINEERING
RESOURCES
INTRODUCTION
Prevalence of major subgroups in the fields
of architecture and engineering
FIGURE 3.7 | Among architecture and engineering majors, petroleum engineering majors have the highest
wages, earning $136,000 annually — $40,000 more than chemical engineering majors.
Share of college graduates with architecture and engineering majors (ages 25-59) by major subgroup, 2013
Electrical engineering
20.3%
General engineering
16.0%
Mechanical engineering
16.0%
Civil engineering
10.1%
Architecture
9.3%
Miscellaneous engineering technologies
5.5%
Chemical engineering
5.2%
Industrial and manufacturing engineering
4.1%
Industrial production technologies
2.6%
Miscellaneous engineering
1.8%
Aerospace engineering
1.8%
Biomedical engineering
1.4%
Engineering technologies
1.2%
Mechanical engineering-related technologies
1.0%
Engineering and industrial management
1.0%
Architectural engineering
.5%
Engineering mechanics, physics, and science
.5%
Petroleum engineering
.5%
Environmental engineering
.4%
Mining and mineral engineering
.3%
Metallurgical engineering
.3%
Geological and geophysical engineering
.2%
Source: Georgetown University Center on Education and the Workforce analysis of U.S. Census Bureau, American Community Survey
micro data, 2009-2013.
Note: Percentages may not sum to 100 percent due to rounding.
30
PART THREE | THE
THEECONOMIC
ECONOMICVALUE
VALUEOF
OFCOLLEGE
COLLEGE MAJORS
AGRICULTURE
ARCHITECTURE
AND NATURAL
AND
ENGINEERING
RESOURCES
INTRODUCTION
FIGURE 3.8 | Among architecture and engineering majors, petroleum engineering majors have the highest
wages, earning $136,000 annually — $40,000 more than chemical engineering majors.
Median annual wages of college-educated workers with architecture and engineering majors (ages 2559) by major subgroup (2013$)
Petroleum engineering
$136,000
Metallurgical engineering
$98,000
Mining and mineral engineering
$97,000
Chemical engineering
$96,000
Electrical engineering
$93,000
Aerospace engineering
$90,000
Mechanical engineering
$87,000
Geological and geophysical engineering
$87,000
Civil engineering
$83,000
All architecture and engineering majors
$83,000
Industrial and manufacturing engineering
$81,000
General engineering
$81,000
Engineering mechanics, physics, and science
$81,000
Architectural engineering
$80,000
Engineering and industrial management
$78,000
Environmental engineering
$76,000
Miscellaneous engineering
$76,000
Industrial production technologies
$74,000
Miscellaneous engineering technologies
$72,000
Biomedical engineering
$70,000
Mechanical engineering-related technologies
$69,000
Architecture
$67,000
Engineering technologies
$66,000
Bachelor’s degree holder, all majors
High school graduate
$61,000
$36,000
Source: Georgetown University Center on Education and the Workforce analysis of U.S. Census Bureau, American Community Survey
micro data, 2009-2013.
31
THE ECONOMIC VALUE OF COLLEGE MAJORS MAJORS | PART THREE
ARCHITECTURE
AGRICULTURE
AND
ANDNATURAL
ENGINEERING
RESOURCES
INTRODUCTION
FIGURE 3.9 | Among architecture and engineering majors, petroleum engineering majors have the highest
wages, earning $136,000 annually — $40,000 more than chemical engineering majors.
Interquartile range of annual wages of graduate degree holders with agriculture and natural resources majors (ages 25-59) by major subgroup (2013$)
Petroleum engineering
Metallurgical engineering
Mining and mineral engineering
Chemical engineering
Electrical engineering
Aerospace engineering
Mechanical engineering
Geological and geophysical engineering
Civil engineering
All architecture and engineering majors
Industrial and manufacturing engineering
General engineering
Engineering mechanics, physics, and science
Architectural engineering
Engineering and industrial management
Environmental engineering
Miscellaneous engineering
Industrial production technologies
Miscellaneous engineering technologies
Biomedical engineering
Mechanical engineering-related technologies
Architecture
Engineering technologies
Bachelor’s degree holder, all majors
High school graduate
$0
25th Percentile
$50,000
Median
$100,000
$150,000
$200,000
$250,000
75th Percentile
Source: Georgetown University Center on Education and the Workforce analysis of U.S. Census Bureau, American Community Survey
micro data, 2009-2013.
32
PART THREE | THE
THEECONOMIC
ECONOMICVALUE
VALUEOF
OFCOLLEGE
COLLEGE MAJORS
AGRICULTURE
ARCHITECTURE
AND NATURAL
AND
ENGINEERING
RESOURCES
INTRODUCTION
FIGURE 3.10 | Among architecture and engineering majors, metallurgical engineering majors are the most
likely to earn a graduate degree, while mechanical engineering and related technologies
majors are the least likely to earn a graduate degree.
Graduate degree attainment of college graduates with architecture and engineering majors
(ages 25-59) by major subgroup, 2013
Metallurgical engineering
54.4%
Biomedical engineering
52.5%
Engineering mechanics, physics, and science
51.2%
Environmental engineering
51.0%
Chemical engineering
48.6%
Aerospace engineering
48.2%
Electrical engineering
42.5%
Industrial and manufacturing engineering
40.1%
Geological and geophysical engineering
39.9%
Mechanical engineering
39.7%
All architecture and engineering majors
38.2%
Civil engineering
36.5%
General engineering
35.8%
Mining and mineral engineering
35.6%
Bachelor’s degree holder, all majors
35.1%
Architecture
33.9%
Miscellaneous engineering
32.6%
Engineering and industrial management
31.6%
Petroleum engineering
29.5%
Architectural engineering
27.0%
Engineering technologies
Miscellaneous engineering technologies
Industrial production technologies
Mechanical engineering-related technologies
22.9%
21.6%
18.1%
17.1%
Source: Georgetown University Center on Education and the Workforce analysis of U.S. Census Bureau, American Community Survey
micro data, 2009-2013.
33
THE ECONOMIC VALUE OF COLLEGE MAJORS MAJORS | PART THREE
ARCHITECTURE
AGRICULTURE
AND
ANDNATURAL
ENGINEERING
RESOURCES
INTRODUCTION
FIGURE 3.11 | Among graduate degree holders with architecture or engineering majors, petroleum
engineering majors earn $128,000 annually, while architecture majors earn $76,000 annually.
Median annual wages of college-educated workers with architecture and engineering majors
(ages 25-59) by major subgroup (2013$)
Petroleum engineering
$128,000
Geological and geophysical engineering
$114,000
Electrical engineering
$112,000
Aerospace engineering
$112,000
Metallurgical engineering
$109,000
Chemical engineering
$109,000
Engineering and industrial management
$108,000
Mechanical engineering
$107,000
Engineering mechanics, physics, and science
$107,000
Mining and mineral engineering
$106,000
All architecture and engineering majors
$104,000
General engineering
$103,000
Industrial and manufacturing engineering
$101,000
Civil engineering
$101,000
Miscellaneous engineering
$98,000
Mechanical engineering-related technologies
$88,000
Industrial production technologies
$88,000
Environmental engineering
$88,000
Miscellaneous engineering technologies
$88,000
Biomedical engineering
$87,000
Architectural engineering
$81,000
Engineering technologies
$79,000
Graduate degree holder, all majors
$78,000
Architecture
Bachelor’s degree holder, all majors
$76,000
$61,000
Source: Georgetown University Center on Education and the Workforce analysis of U.S. Census Bureau, American Community Survey
micro data, 2009-2013.
34
PART THREE | THE
THEECONOMIC
ECONOMICVALUE
VALUEOF
OFCOLLEGE
COLLEGE MAJORS
AGRICULTURE
ARCHITECTURE
AND NATURAL
AND
ENGINEERING
RESOURCES
INTRODUCTION
FIGURE 3.12 | The top 25 percent of graduate degree holders who majored in petroleum engineering earn
more than $200,000 annually, while the bottom 25 percent of graduate degree holders who
majored in architecture earn less than $55,000.
Interquartile range of annual wages of college-educated workers with architecture and engineering
majors (ages 25-59) by major subgroup (2013$)
Petroleum engineering
Geological and geophysical engineering
Electrical engineering
Aerospace engineering
Metallurgical engineering
Chemical engineering
Engineering and industrial management
Mechanical engineering
Engineering mechanics, physics, and science
Mining and mineral engineering
All architecture and engineering majors
General engineering
Industrial and manufacturing engineering
Civil engineering
Miscellaneous engineering
Mechanical engineering-related technologies
Industrial production technologies
Environmental engineering
Miscellaneous engineering technologies
Biomedical engineering
Architectural engineering
Engineering technologies
Graduate degree holder, all majors
Architecture
Bachelor’s degree holder, all majors
IN THOUSANDS: $0
25th Percentile
$35
Median
$55
$75
$95
$115 $135
$155
$175
$195
$215
75th Percentile
Source: Georgetown University Center on Education and the Workforce analysis of U.S. Census Bureau, American Community Survey
micro data, 2009-2013.
35
THE ECONOMIC VALUE OF COLLEGE MAJORS MAJORS | PART THREE
ARCHITECTURE
AGRICULTURE
AND
ANDNATURAL
ENGINEERING
RESOURCES
INTRODUCTION
TABLE 3.2 | On average, architecture and engineering majors with graduate degrees earn
25 percent more than those with a Bachelor’s degree.
Major group
Median annual wages
of college-educated
workers (ages 25-59)
with architecture and
engineering majors (2013$)
Graduate degree
wage premium
(2013$)
Bachelor’s
Graduate
$
%
All majors
61,000
78,000
17,000
28
All architecture and
engineering majors
83,000
104,000
21,000
25
Engineering and industrial
management
78,000
108,000
30,000
38
Engineering mechanics,
physics, and science
81,000
107,000
26,000
32
Geological and geophysical
engineering
87,000
114,000
27,000
31
Miscellaneous engineering
76,000
98,000
22,000
29
Mechanical engineeringrelated technologies
69,000
88,000
19,000
28
General engineering
81,000
103,000
22,000
27
Industrial and manufacturing
engineering
81,000
101,000
20,000
25
Aerospace engineering
90,000
112,000
22,000
24
Biomedical engineering
70,000
87,000
17,000
24
Mechanical engineering
87,000
107,000
20,000
23
Miscellaneous engineering
technologies
72,000
88,000
16,000
22
Major subgroup
Civil engineering
83,000
101,000
18,000
22
Electrical engineering
93,000
112,000
19,000
20
Engineering technologies
66,000
79,000
13,000
20
Industrial production technologies
74,000
88,000
14,000
19
Environmental engineering
76,000
88,000
12,000
16
Chemical engineering
96,000
109,000
13,000
14
Architecture
67,000
76,000
9,000
13
Metallurgical engineering
98,000
109,000
11,000
11
Mining and mineral engineering
97,000
106,000
9,000
9
Architectural engineering
80,000
81,000
1,000
1
Petroleum engineering
136,000
128,000
-8,000
-6
Source: Georgetown University Center on Education and the Workforce analysis of U.S. Census Bureau,
American Community Survey micro data, 2009-2013.
36
PART THREE | THE
THEECONOMIC
ECONOMICVALUE
VALUEOF
OFCOLLEGE
COLLEGE MAJORS
AGRICULTURE
ARCHITECTURE
AND NATURAL
AND
ENGINEERING
RESOURCES
INTRODUCTION
ARTS
SHARE OF ALL MAJORS
4.8
%
GRADUATE DEGREE ATTAINMENT
23.2
%
37
THE ECONOMIC VALUE OF COLLEGE MAJORS MAJORS | PART THREE
AGRICULTURE
ARTS
AND NATURAL RESOURCES
INTRODUCTION
Prevalence of major subgroups in the field of arts
FIGURE 3.13 | Fine arts and commercial art and graphic design are the most popular arts majors.
Share of college graduates with arts majors (ages 25-59) by major subgroup, 2013
Fine arts
30.9%
Commercial art
and graphic design
30.0%
Music
13.8%
Drama and theater arts
10.1%
7.6%
Film, video, and photographic arts
Studio arts
Visual and performing arts
4.4%
3.2%
Source: Georgetown University Center on Education and the Workforce analysis of U.S. Census Bureau, American Community Survey
micro data, 2009-2013.
Note: Percentages may not sum to 100 percent due to rounding.
38
PART
PARTTHREE THREE | | THE
THEECONOMIC
ECONOMICVALUE
VALUEOF
OFCOLLEGE
COLLEGE MAJORS
AGRICULTURE AND NATURAL
RESOURCES
ARTS
INTRODUCTION
Outcomes for Bachelor’s degree
holders in the field of arts
FIGURE 3.14 | Arts majors earn less than the average college graduate.
Median annual wages of college-educated workers with arts majors (ages 25-59)
by major subgroup (2013$)
Bachelor’s degree holder,
all majors
$61,000
Film, video, and photographic arts
$51,000
Commercial art
and graphic design
$51,000
Fine arts
$49,000
Music
$49,000
All arts majors
$49,000
Drama and theater arts
$45,000
Studio arts
$42,000
Visual and performing arts
$42,000
High school graduate
$36,000
Source: Georgetown University Center on Education and the Workforce analysis of U.S. Census Bureau, American Community Survey
micro data, 2009-2013.
39
THE ECONOMIC VALUE OF COLLEGE MAJORS MAJORS | PART THREE
AGRICULTURE
ARTS
AND NATURAL RESOURCES
INTRODUCTION
FIGURE 3.15 | Some college graduates with arts majors earn $70,000 annually, but others earn only
$30,000 annually.
Interquartile range of annual wages of college-educated workers with agriculture and natural resources
majors (ages 25-59) by major subgroup (2013$)
Bachelor’s degree holder,
all majors
Film, video, and photographic arts
Commercial art
and graphic design
Fine arts
Music
All arts majors
Drama and theater arts
Studio arts
Visual and performing arts
High school graduate
IN THOUSANDS:
25th Percentile
$10
$20
$30
Median
$40
$50
$60
$70
$80
$90
$100
75th Percentile
Source: Georgetown University Center on Education and the Workforce analysis of U.S. Census Bureau, American Community Survey
micro data, 2009-2013.
40
PART
PARTTHREE THREE | | THE
THEECONOMIC
ECONOMICVALUE
VALUEOF
OFCOLLEGE
COLLEGE MAJORS
AGRICULTURE AND NATURAL
RESOURCES
ARTS
INTRODUCTION
FIGURE 3.16 | Music majors are the only arts majors who are more likely to complete a graduate degree
than the average college graduate.
Graduate degree attainment of college graduates with arts majors (ages 25-59)
by major subgroup, 2013
Music
42.9%
Bachelor’s degree holder,
all majors
35.1%
Studio arts
27.8%
Drama and theater arts
26.2%
Visual and performing arts
25.6%
All arts majors
23.2%
Fine arts
22.2%
Film, video, and photographic arts
Commercial art and graphic
design
16.0%
9.7%
Source: Georgetown University Center on Education and the Workforce analysis of U.S. Census Bureau, American Community Survey
micro data, 2009-2013.
Note: Percentages may not sum to 100 percent due to rounding.
41
THE ECONOMIC VALUE OF COLLEGE MAJORS MAJORS | PART THREE
AGRICULTURE
ARTS
AND NATURAL RESOURCES
INTRODUCTION
FIGURE 3.17 | Arts majors with graduate degrees earn less than the average graduate degree holder, and
many earn less than the average college graduate.
Median annual wages of graduate degree holders with arts majors (ages 25-59)
by major subgroup (2013$)
Graduate degree holder,
all majors
Commercial art
and graphic design
$78,000
$63,000
Bachelor’s degree holder,
all majors
$61,000
Music
$61,000
Film, video, and photographic arts
$60,000
Drama and theater arts
$60,000
Fine arts
$60,000
All arts majors
$60,000
Visual and performing arts
Studio arts
$56,000
$54,000
Source: Georgetown University Center on Education and the Workforce analysis of U.S. Census Bureau, American Community Survey
micro data, 2009-2013.
42
PART
PARTTHREE THREE | | THE
THEECONOMIC
ECONOMICVALUE
VALUEOF
OFCOLLEGE
COLLEGE MAJORS
AGRICULTURE AND NATURAL
RESOURCES
ARTS
INTRODUCTION
FIGURE 3.18 | Graduate degree-holders who majored in arts earn less than the average graduate-degree holder.
Interquartile range of annual wages of college-educated workers with arts majors (ages 25-59) by major
subgroup (2013$)
Graduate degree holder, all majors
Commercial art and graphic design
Bachelor’s degree holder, all majors
Music
Film, video, and photographic arts
Drama and theater arts
Fine arts
All arts majors
Visual and performing arts
Studio arts
IN THOUSANDS:
25th Percentile
$20
$30
$40
Median
$50
$60
$70
$80
$90
$100 $110 $120
$130
75th Percentile
Source: Georgetown University Center on Education and the Workforce analysis of U.S. Census Bureau, American Community Survey
micro data, 2009-2013.
43
THE ECONOMIC VALUE OF COLLEGE MAJORS MAJORS | PART THREE
AGRICULTURE
ARTS
AND NATURAL RESOURCES
INTRODUCTION
TABLE 3.3 | Among arts majors, drama and theater arts majors and visual and performing
arts majors receive the largest wage premium from a graduate degree, while
film, video, and photographic arts majors receive the smallest wage premium.
Major group
Median annual wages of
college-educated workers (ages
25-59) with arts majors (2013$)
Graduate degree wage
premium (2013$)
Bachelor’s
Graduate
$
%
All majors
61,000
78,000
17,000
28
All arts majors
49,000
60,000
11,000
22
Drama and theater arts
45,000
60,000
15,000
33
Visual and performing arts
42,000
56,000
14,000
33
Studio arts
42,000
54,000
12,000
29
Music
49,000
61,000
12,000
24
Commercial art and
graphic design
51,000
63,000
12,000
24
Fine arts
49,000
60,000
11,000
22
Film, video, and
photographic arts
51,000
60,000
9,000
18
Major subgroups
Source: Georgetown University Center on Education and the Workforce analysis of U.S. Census Bureau,
American Community Survey micro data, 2009-2013.
44
PART
PARTTHREE THREE | | THE
THEECONOMIC
ECONOMICVALUE
VALUEOF
OFCOLLEGE
COLLEGE MAJORS
AGRICULTURE AND NATURAL
RESOURCES
ARTS
INTRODUCTION
BIOLOGY AND LIFE SCIENCES
SHARE OF ALL MAJORS
3.3
%
GRADUATE DEGREE ATTAINMENT
57.7
%
45
THE ECONOMIC VALUE OF COLLEGE MAJORS MAJORS | PART THREE
AGRICULTURE
BIOLOGY AND AND
LIFE SCIENCE
NATURAL RESOURCES
INTRODUCTION
Prevalence of major subgroups in the
fields of biology and life sciences
FIGURE 3.19 | Biology majors comprise the majority of biology and life sciences majors.
Share of college graduates with biology and life sciences majors (ages 25-59) by major subgroup, 2013
Biology
62.0%
Environmental science
9.4%
Miscellaneous biology
6.9%
Biochemical sciences
5.5%
Microbiology
5.1%
Zoology
3.8%
Ecology
3.7%
Molecular biology
Botany
Neuroscience
2.0%
1.0%
.7%
Source: Georgetown University Center on Education and the Workforce analysis of U.S. Census Bureau, American Community Survey
micro data, 2009-2013.
Note: Percentages may not sum to 100 percent due to rounding.
46
PART THREE | THE
THEECONOMIC
ECONOMICVALUE
VALUEOF
OFCOLLEGE
COLLEGE MAJORS
AGRICULTUREBIOLOGY
AND NATURAL
AND
LIFE
RESOURCES
SCIENCE
INTRODUCTION
FIGURE 3.20 | Among biology and life sciences majors, microbiology majors have the highest wages, while
neuroscience majors have the lowest wages.
Median annual wages of college-educated workers with biology and life sciences majors (ages 25-59)
by major subgroup (2013$)
Microbiology
$62,000
Bachelor’s degree holder,
all majors
$61,000
Biochemical sciences
$59,000
Zoology
$58,000
Environmental science
$57,000
Biology
$56,000
All biology and
life sciences majors
$56,000
Miscellaneous biology
$54,000
Molecular biology
$54,000
Botany
$52,000
Ecology
$51,000
Neuroscience
High school graduate
$44,000
$36,000
Source: Georgetown University Center on Education and the Workforce analysis of U.S. Census Bureau, American Community Survey
micro data, 2009-2013.
47
THE ECONOMIC VALUE OF COLLEGE MAJORS MAJORS | PART THREE
AGRICULTURE
BIOLOGY AND AND
LIFE SCIENCE
NATURAL RESOURCES
INTRODUCTION
FIGURE 3.21 | Among arts majors, drama and theater arts majors and visual and performing arts
majors receive the largest wage premium from a graduate degree, while film, video, and
photographic arts majors receive the smallest wage premium.
Interquartile range of annual wages of college-educated workers with agriculture and natural resources
majors (ages 25-59) by major subgroup (2013$)
Microbiology
Bachelor’s degree holder,
all majors
Biochemical sciences
Zoology
Environmental science
Biology
All biology and
life sciences majors
Miscellaneous biology
Molecular biology
Botany
Ecology
Neuroscience
High school graduate
IN THOUSANDS:
25th Percentile
$10
$20
$30
Median
$40
$50
$60
$70
$80
75th Percentile
Source: Georgetown University Center on Education and the Workforce analysis of U.S. Census Bureau, American Community Survey
micro data, 2009-2013.
48
$90
PART THREE | THE
THEECONOMIC
ECONOMICVALUE
VALUEOF
OFCOLLEGE
COLLEGE MAJORS
AGRICULTUREBIOLOGY
AND NATURAL
AND
LIFE
RESOURCES
SCIENCE
INTRODUCTION
FIGURE 3.22 | Among biology and life sciences majors, those who majored in biochemical sciences and
neuroscience are the most likely to complete a graduate degree.
Graduate degree attainment of college graduates with biology and life sciences majors (ages 25-59)
by major subgroup, 2013
Biochemical sciences
68.3%
Neuroscience
68.0%
Molecular biology
64.5%
Zoology
62.8%
Miscellaneous biology
59.0%
Biology
58.9%
All biology and
life sciences majors
57.7%
Botany
56.8%
Microbiology
56.6%
Ecology
Bachelor’s degree holder,
all majors
Environmental science
35.6%
35.1%
31.3%
Source: Georgetown University Center on Education and the Workforce analysis of U.S. Census Bureau, American Community Survey
micro data, 2009-2013.
49
THE ECONOMIC VALUE OF COLLEGE MAJORS MAJORS | PART THREE
AGRICULTURE
BIOLOGY AND AND
LIFE SCIENCE
NATURAL RESOURCES
INTRODUCTION
FIGURE 3.23 | Among graduate degree holders with biology or life sciences majors, zoology majors earn
$104,000 annually, while neuroscience majors earn $61,000 annually.
Median annual wages of graduate degree holders with biology and life sciences majors (ages 25-59)
by major subgroup (2013$)
Zoology
$104,000
Biochemical sciences
$97,000
Biology
$96,000
All biology and
life sciences majors
$92,000
Microbiology
$89,000
Molecular biology
$88,000
Miscellaneous biology
$81,000
Graduate degree holder,
all majors
Environmental science
$78,000
$71,000
Ecology
$66,000
Botany
$66,000
Bachelor’s degree holder,
all majors
$61,000
Neuroscience
$61,000
Source: Georgetown University Center on Education and the Workforce analysis of U.S. Census Bureau, American Community Survey
micro data, 2009-2013.
50
PART THREE | THE
THEECONOMIC
ECONOMICVALUE
VALUEOF
OFCOLLEGE
COLLEGE MAJORS
AGRICULTUREBIOLOGY
AND NATURAL
AND
LIFE
RESOURCES
SCIENCE
INTRODUCTION
FIGURE 3.24 | Among graduate degree holders with biology or life sciences majors, the top 25 percent
of zoology majors earn more than $200,000 annually, while the bottom 25 percent of
neuroscience majors earn less than $50,000 annually.
Interquartile range of annual wages of graduate degree holders with biology and life sciences majors
(ages 25-59) by major subgroup (2013$)
Zoology
Biochemical sciences
Biology
All biology and
life sciences majors
Microbiology
Molecular biology
Miscellaneous biology
Graduate degree holder, all majors
Environmental science
Ecology
Botany
Bachelor’s degree holder,
all majors
Neuroscience
$0
25th Percentile
$50,000
Median
$100,000
$150,000
$200,000
$250,000
75th Percentile
Source: Georgetown University Center on Education and the Workforce analysis of U.S. Census Bureau, American Community Survey
micro data, 2009-2013.
51
THE ECONOMIC VALUE OF COLLEGE MAJORS MAJORS | PART THREE
AGRICULTURE
BIOLOGY AND AND
LIFE SCIENCE
NATURAL RESOURCES
INTRODUCTION
TABLE 3.4 | Zoology majors with graduate degrees earn 79 percent more than those
with Bachelor’s degrees, the largest wage premium among biology and life
sciences majors.
Major group
Median annual wages of
college-educated workers
(ages 25-59) with biology and
life sciences majors (2013$)
Graduate degree wage
premium (2013$)
Bachelor’s
Graduate
$
%
All majors
61,000
78,000
17,000
28
All biology and life
sciences majors
56,000
92,000
36,000
64
Zoology
58,000
104,000
46,000
79
Biology
56,000
96,000
40,000
71
Biochemical sciences
59,000
97,000
38,000
64
Molecular biology
54,000
88,000
34,000
63
Miscellaneous biology
54,000
81,000
27,000
50
Microbiology
62,000
89,000
27,000
44
Ecology
51,000
66,000
15,000
29
Neuroscience
48,000
61,000
13,000
27
Botany
52,000
66,000
14,000
27
Environmental science
57,000
71,000
14,000
25
Major subgroups
Source: Georgetown University Center on Education and the Workforce analysis of U.S. Census Bureau,
American Community Survey micro data, 2009-2013.
52
PART THREE | THE
THEECONOMIC
ECONOMICVALUE
VALUEOF
OFCOLLEGE
COLLEGE MAJORS
AGRICULTUREBIOLOGY
AND NATURAL
AND
LIFE
RESOURCES
SCIENCE
INTRODUCTION
BUSINESS
SHARE OF ALL MAJORS
26.1
%
GRADUATE DEGREE ATTAINMENT
22.2
%
53
THE ECONOMIC VALUE OF COLLEGE MAJORS MAJORS | PART THREE
BUSINESS
AGRICULTURE
AND NATURAL RESOURCES
INTRODUCTION
Prevalence of major subgroups in the field of business
FIGURE 3.25 | Business management and administration majors comprise one out of three of business majors.
Share of college graduates with business majors (ages 25-59) by major subgroup, 2013
Business management and
administration
31.2%
20.7%
General business
17.7%
Accounting
12.1%
Marketing and marketing research
Finance
8.9%
Hospitality management
2.2%
Human resources and personnel
management
Management information systems
and statistics
Miscellaneous business and
medical administration
1.9%
1.9%
1.0%
International business
.9%
Business economics
.7%
Operations logistics and
e-commerce
.6%
Source: Georgetown University Center on Education and the Workforce analysis of U.S. Census Bureau, American Community Survey
micro data, 2009-2013.
Note: Percentages may not sum to 100 percent due to rounding.
54
PART
PARTTHREE THREE | | THE
THEECONOMIC
ECONOMICVALUE
VALUEOF
OFCOLLEGE
COLLEGE MAJORS
AGRICULTURE AND NATURAL
RESOURCES
BUSINESS
INTRODUCTION
Outcomes for Bachelor’s degree holders in the field of business
FIGURE 3.26 | Among graduate degree holders with biology or life sciences majors, zoology majors earn
$104,000 annually, while neuroscience majors earn $61,000 annually.
Median annual wages of graduate degree holders with biology and life sciences majors (ages 25-59)
by major subgroup (2013$)
Management information
systems and statistics
$77,000
Business economics
$75,000
Finance
$73,000
Operations logistics and
e-commerce
$71,000
$69,000
Accounting
General business
$65,000
All business majors
$65,000
Marketing and marketing research
$63,000
Business management
and administration
$62,000
Bachelor’s degree holder,
all majors
$61,000
International business
$60,000
Miscellaneous business and
medical administration
$59,000
Human resources and
personnel management
$58,000
$52,000
Hospitality management
High school graduate
$36,000
Source: Georgetown University Center on Education and the Workforce analysis of U.S. Census Bureau, American Community Survey
micro data, 2009-2013.
55
THE ECONOMIC VALUE OF COLLEGE MAJORS MAJORS | PART THREE
BUSINESS
AGRICULTURE
AND NATURAL RESOURCES
INTRODUCTION
FIGURE 3.27 | Some business majors earn more than $100,000 annually, while others earn less than $50,000.
Interquartile range of annual wages of college-educated workers with business majors (ages 25-59)
by major subgroup (2013$)
Management information
systems and statistics
Business economics
Finance
Operations logistics
and e-commerce
Accounting
General business
All business majors
Marketing and marketing research
Business management
and administration
Bachelor’s degree holder,
all majors
International business
Miscellaneous business and
medical administration
Human resources
and personnel management
Hospitality management
High school graduate
IN THOUSANDS:
25th Percentile
$10
$20
$30
$40
Median
$50
$60
$70
$80
$90
$100
$110
75th Percentile
Source: Georgetown University Center on Education and the Workforce analysis of U.S. Census Bureau, American Community Survey
micro data, 2009-2013.
56
PART
PARTTHREE THREE | | THE
THEECONOMIC
ECONOMICVALUE
VALUEOF
OFCOLLEGE
COLLEGE MAJORS
AGRICULTURE AND NATURAL
RESOURCES
BUSINESS
INTRODUCTION
FIGURE 3.28 | Among business majors, business economics majors are the most likely to complete a
graduate degree, while hospitality management majors are the least likely.
Graduate degree attainment of college graduates with business majors by major subgroup, 2013
Bachelor’s degree holder,
all majors
35.1%
Business economics
30.1%
Human resources and
personnel management
29.0%
International business
28.7%
Finance
28.2%
Accounting
25.0%
Operations logistics and
e-commerce
23.0%
General business
22.6%
All business majors
22.2%
Management information systems
and statistics
Business management and
administration
Miscellaneous business and
medical administration
21.1%
20.7%
18.6%
Marketing and marketing research
Hospitality management
15.2%
11.6%
Source: Georgetown University Center on Education and the Workforce analysis of U.S. Census Bureau, American Community Survey
micro data, 2009-2013.
57
THE ECONOMIC VALUE OF COLLEGE MAJORS MAJORS | PART THREE
BUSINESS
AGRICULTURE
AND NATURAL RESOURCES
INTRODUCTION
FIGURE 3.29 | Among graduate degree holders with a business major, finance majors earn $101,000
annually, while hospitality majors earn $69,000.
Median annual wages of graduate degree holders with business majors (ages 25-59)
by major subgroup (2013$)
Finance
$101,000
Business economics
$100,000
Operations logistics and
e-commerce
Management information
systems and statistics
$97,000
$92,000
Accounting
$91,000
General business
$89,000
All business majors
$87,000
Marketing and marketing research
$81,000
Business management and
administration
$81,000
International business
$79,000
Graduate degree holder, all majors
$78,000
Miscellaneous business and
medical administration
Human resources and
personnel management
Hospitality management
Bachelor’s degree holder,
all majors
$78,000
$75,000
$69,000
$61,000
Source: Georgetown University Center on Education and the Workforce analysis of U.S. Census Bureau, American Community Survey
micro data, 2009-2013.
58
PART
PARTTHREE THREE | | THE
THEECONOMIC
ECONOMICVALUE
VALUEOF
OFCOLLEGE
COLLEGE MAJORS
AGRICULTURE AND NATURAL
RESOURCES
BUSINESS
INTRODUCTION
FIGURE 3.30 | The top 25 percent of finance majors with graduate degrees earn more than $150,000
annually; the bottom 25 percent of hospitality management majors with graduate degrees
earn less than $50,000 annually.
Interquartile range of annual wages of graduate degree holders with business majors (ages 25-59)
by major subgroup (2013$)
Finance
Business economics
Operations logistics
and e-commerce
Management information
systems and statistics
Accounting
General business
All business majors
Marketing and marketing research
Business management
and administration
International business
Graduate degree holder,
all majors
Miscellaneous business and
medical administration
Human resources and
personnel management
Hospitality management
Bachelor’s degree holder,
all majors
IN THOUSANDS:
25th Percentile
$0
$40
$60
Median
$80
$100
$120
$140
$160
$180
75th Percentile
Source: Georgetown University Center on Education and the Workforce analysis of U.S. Census Bureau, American Community Survey
micro data, 2009-2013.
59
THE ECONOMIC VALUE OF COLLEGE MAJORS MAJORS | PART THREE
BUSINESS
AGRICULTURE
AND NATURAL RESOURCES
INTRODUCTION
TABLE 3.5 | Finance majors receive the largest wage premium from a graduate degree
at 38 percent.
Major group
Median annual wages
of college-educated
workers (ages 25-59) with
business majors (2013$)
Graduate degree wage
premium (2013$)
Bachelor’s
Graduate
$
%
All majors
61,000
78,000
17,000
28
All business majors
65,000
87,000
22,000
34
Finance
73,000
101,000
28,000
38
General business
65,000
89,000
24,000
37
Operations logistics
and e-commerce
71,000
97,000
26,000
37
Business economics
75,000
100,000
25,000
33
Hospitality management
52,000
69,000
17,000
33
Miscellaneous
business and medical
administration
59,000
78,000
19,000
32
Accounting
69,000
91,000
22,000
32
International business
60,000
79,000
19,000
32
Business management
and administration
62,000
81,000
19,000
31
Human resources and
personnel management
58,000
75,000
17,000
29
Marketing and
marketing research
63,000
81,000
18,000
29
Management information
systems and statistics
77,000
92,000
15,000
19
Major subgroups
Source: Georgetown University Center on Education and the Workforce analysis of U.S. Census Bureau,
American Community Survey micro data, 2009-2013.
60
PART
PARTTHREE THREE | | THE
THEECONOMIC
ECONOMICVALUE
VALUEOF
OFCOLLEGE
COLLEGE MAJORS
AGRICULTURE AND NATURAL
RESOURCES
BUSINESS
INTRODUCTION
COMMUNICATIONS AND JOURNALISM
SHARE OF ALL MAJORS
5.2
%
GRADUATE DEGREE ATTAINMENT
21
%
61
THE ECONOMIC VALUE OF COLLEGE MAJORS MAJROS | PART THREE
MAJORS
AGRICULTURE
COMMUNICATIONS
AND NATURAL
AND JOURNALISM
RESOURCES
INTRODUCTION
Prevalence of major subgroups in the fields
of communications and journalism
FIGURE 3.31 | Communications and mass media majors comprise two out of every three communications
and journalism majors.
Share of college graduates with communications and journalism majors (ages 25-59)
by major subgroup, 2013
Communications
and mass media
68%
Advertising and public relations
34%
Journalism
22%
Source: Georgetown University Center on Education and the Workforce analysis of U.S. Census Bureau, American Community Survey
micro data, 2009-2013.
Note: Percentages may not sum to 100 percent due to rounding.
62
PART THREE | THE
THEECONOMIC
ECONOMICVALUE
VALUEOF
OFCOLLEGE
COLLEGE MAJORS
AGRICULTURE
COMMUNICATIONS
AND NATURAL
AND
JOURNALISM
RESOURCES
INTRODUCTION
FIGURE 3.32 | Communications and journalism majors earn less than the average college graduate.
Median annual wages of college-educated workers with communications and journalism majors
(ages 25-59) by major subgroup (2013$)
Bachelor’s degree holder,
all majors
$61,000
Journalism
$56,000
Communications and mass media
$54,000
Advertising and public relations
$54,000
All communications and
journalism majors
$54,000
High school graduate
$36,000
Source: Georgetown University Center on Education and the Workforce analysis of U.S. Census Bureau, American Community Survey
micro data, 2009-2013.
FIGURE 3.33 | The top 25 percent of communications and journalism majors earn more than $80,000
annually, while the bottom 25 percent earn less than $40,000.
Interquartile range of annual wages of graduate degree holders with business majors (ages 25-59)
by major subgroup (2013$)
Bachelor’s degree holder, all majors
Journalism
Communications and mass media
Advertising and public relations
All communications and journalism majors
High school graduate
IN THOUSANDS:
25th Percentile
$0
$20
Median
$30
$40
$50
$60
$70
$80
$90
$100
75th Percentile
Source: Georgetown University Center on Education and the Workforce analysis of U.S. Census Bureau, American Community Survey
micro data, 2009-2013.
63
THE ECONOMIC VALUE OF COLLEGE MAJORS MAJROS | PART THREE
MAJORS
AGRICULTURE
COMMUNICATIONS
AND NATURAL
AND JOURNALISM
RESOURCES
INTRODUCTION
FIGURE 3.34 | Communications and journalism majors are less likely than average college graduates
to complete graduate degrees.
Graduate degree attainment of college graduates with communications and journalism majors (ages 25-59) by major subgroup, 2013
Bachelor’s degree holder,
all majors
35.1%
Journalism
23.1%
All communications and
journalism majors
20.8%
Communications and mass media
20.8%
Advertising and public relations
16.4%
Source: Georgetown University Center on Education and the Workforce analysis of U.S. Census Bureau, American Community Survey
micro data, 2009-2013.
FIGURE 3.35 | Communications and journalism majors with graduate degrees earn less than the average
graduate degree holder.
Median annual wages of graduate degree holders with communications and journalism majors
(ages 25-59) by major subgroup (2013$)
Graduate degree holder,
all majors
$78,000
Journalism
All communications and
journalism majors
Communications and mass media
Advertising and public relations
Bachelor’s degree holder,
all major
$71,000
$68,000
$67,000
$65,000
$61,000
Source: Georgetown University Center on Education and the Workforce analysis of U.S. Census Bureau, American Community Survey
micro data, 2009-2013.
64
PART THREE | THE
THEECONOMIC
ECONOMICVALUE
VALUEOF
OFCOLLEGE
COLLEGE MAJORS
AGRICULTURE
COMMUNICATIONS
AND NATURAL
AND
JOURNALISM
RESOURCES
INTRODUCTION
FIGURE 3.36 | The top 25 percent of journalism majors with graduate degrees earn more than $95,000
annually, while the bottom 25 percent of communications and journalism majors with
graduate degrees earn less than $55,000 annually.
Interquartile range of annual wages of graduate degree holders with communications and journalism
majors (ages 25-59) by major subgroup (2013$)
Graduate degree holder, all majors
Journalism
All communications and journalism majors
Communications and mass media
Advertising and public relations
Bachelor’s degree holder, all majors
IN THOUSANDS:
25th Percentile
$0
$35
Median
$45
$55
$65
$75
$85
$95
$105
$115 $125
75th Percentile
Source: Georgetown University Center on Education and the Workforce analysis of U.S. Census Bureau, American Community Survey
micro data, 2009-2013.
65
THE ECONOMIC VALUE OF COLLEGE MAJORS MAJROS | PART THREE
MAJORS
AGRICULTURE
COMMUNICATIONS
AND NATURAL
AND JOURNALISM
RESOURCES
INTRODUCTION
TABLE 3.6 | Journalism majors receive a 27 percent wage premium from a graduate
degree, the largest among communications and journalism majors.
Major group
Median annual wages of
college-educated workers (ages
25-59) with majors (2013$)
Graduate degree wage
premium (2013$)
Bachelor’s
Graduate
$
%
All majors
61,000
78,000
17,000
28
All communications and
journalism majors
54,000
68,000
14,000
26
Journalism
56,000
71,000
15,000
27
Communications
and mass media
54,000
67,000
13,000
24
Advertising and
public relations
54,000
65,000
11,000
20
Major subgroups
Source: Georgetown University Center on Education and the Workforce analysis of U.S. Census Bureau,
American Community Survey micro data, 2009-2013.
66
PART THREE | THE
THEECONOMIC
ECONOMICVALUE
VALUEOF
OFCOLLEGE
COLLEGE MAJORS
AGRICULTURE
COMMUNICATIONS
AND NATURAL
AND
JOURNALISM
RESOURCES
INTRODUCTION
COMPUTERS, STATISTICS, AND MATHEMATICS
SHARE OF ALL MAJORS
5.6
%
GRADUATE DEGREE ATTAINMENT
33.3
%
67
THE ECONOMIC VALUE OF COLLEGE MAJORS MAJORS | PART THREE
COMPUTERS,
AGRICULTURE
STATISTICS
AND NATURAL
ANDRESOURCES
MATHEMATICS
INTRODUCTION
Prevalence of major subgroups in the fields of
computers, statistics, and mathematics
FIGURE 3.37 | Computer science majors comprise the plurality of computers, statistics, and
mathematics majors.
Share of college graduates with computers, statistics, and mathematics majors (ages 25-59)
by major subgroup, 2013
43.6%
Computer science
16.4%
Mathematics
14.9%
Computer and information systems
10.0%
Miscellaneous computer
8.8%
Computer engineering
4.3%
Information sciences
Statistics and decision science
Applied mathematics
1.1%
.9%
Source: Georgetown University Center on Education and the Workforce analysis of U.S. Census Bureau, American Community Survey
micro data, 2009-2013.
Note: Percentages may not sum to 100 percent due to rounding.
68
PART THREE | THE
THEECONOMIC
ECONOMICVALUE
VALUEOF
OFCOLLEGE
COLLEGE MAJORS
COMPUTERS,
AGRICULTURE
STATISTICS
AND NATURAL
ANDINTRODUCTION
MATHEMATICS
RESOURCES
FIGURE 3.38 | Computer engineering majors earn $87,000 annually, the highest among computers,
statistics, and mathematics majors.
Median annual wages of college-educated workers with computers, statistics, and mathematics majors
(ages 25-59) by major subgroup (2013$)
Computer engineering
$87,000
Applied mathematics
$83,000
Computer science
$83,000
Statistics and decision science
$78,000
All computers, statistics, and
mathematics majors
$76,000
Mathematics
$73,000
Information sciences
$73,000
Computer and information systems
$69,000
Bachelor’s degree holder, all majors
$61,000
Miscellaneous computer
High school graduate
$59,000
$36,000
Source: Georgetown University Center on Education and the Workforce analysis of U.S. Census Bureau, American Community Survey
micro data, 2009-2013.
69
THE ECONOMIC VALUE OF COLLEGE MAJORS MAJORS | PART THREE
COMPUTERS,
AGRICULTURE
STATISTICS
AND NATURAL
ANDRESOURCES
MATHEMATICS
INTRODUCTION
FIGURE 3.39 | The top 25 percent of computer engineering, applied mathematics, and computer science
majors earn more than $110,000 annually.
Interquartile range of annual wages of college-educated workers with computers, statistics, and
mathematics majors (ages 25-59) by major subgroup (2013$)
Computer engineering
Applied mathematics
Computer science
Statistics and decision science
All computers, statistics,
and mathematics majors
Mathematics
Information sciences
Computer and information systems
Bachelor’s degree holder, all majors
Miscellaneous computer
High school graduate
IN THOUSANDS:
25th Percentile
$0
$20
Median
$30
$40
$50
$60 $70
$80
$90 $100 $110 $120
75th Percentile
Source: Georgetown University Center on Education and the Workforce analysis of U.S. Census Bureau, American Community Survey
micro data, 2009-2013.
70
PART THREE | THE
THEECONOMIC
ECONOMICVALUE
VALUEOF
OFCOLLEGE
COLLEGE MAJORS
COMPUTERS,
AGRICULTURE
STATISTICS
AND NATURAL
ANDINTRODUCTION
MATHEMATICS
RESOURCES
FIGURE 3.40 | More than half of college graduates who major in statistics and decision science earn a
graduate degree, the highest among computers, statistics, and mathematics majors.
Graduate degree attainment of college graduates with computers, statistics, and mathematics majors
(ages 25-59) by major subgroup, 2013
Statistics and decision science
50.7%
Mathematics
48.8%
Applied mathematics
48.6%
Computer engineering
36.2%
Bachelor’s degree holder, all majors
35.1%
All computers, statistics, and
mathematics majors
33.3%
Computer science
30.9%
Information sciences
26.0%
Computer and information systems
Miscellaneous computer
22.3%
17.3%
Source: Georgetown University Center on Education and the Workforce analysis of U.S. Census Bureau, American Community Survey
micro data, 2009-2013.
71
THE ECONOMIC VALUE OF COLLEGE MAJORS MAJORS | PART THREE
COMPUTERS,
AGRICULTURE
STATISTICS
AND NATURAL
ANDRESOURCES
MATHEMATICS
INTRODUCTION
FIGURE 3.41 | Graduate degree holders who majored in applied mathematics earn $106,000 annually,
the highest among graduate degree holders who majored in computers, statistics,
or mathematics.
Median annual wages of graduate degree holders with computers, statistics, and mathematics majors
(ages 25-59) by major subgroup (2013$)
Applied mathematics
$106,000
Computer engineering
$101,000
Statistics and decision science
$100,000
Computer science
$100,000
All computers, statistics, and
mathematics majors
$96,000
$90,000
Mathematics
$88,000
Information sciences
Computer and information systems
$85,000
Miscellaneous computer
$81,000
Graduate degree holder, all majors
Bachelor’s degree holder, all majors
$78,000
$61,000
Source: Georgetown University Center on Education and the Workforce analysis of U.S. Census Bureau, American Community Survey
micro data, 2009-2013.
72
PART THREE | THE
THEECONOMIC
ECONOMICVALUE
VALUEOF
OFCOLLEGE
COLLEGE MAJORS
COMPUTERS,
AGRICULTURE
STATISTICS
AND NATURAL
ANDINTRODUCTION
MATHEMATICS
RESOURCES
FIGURE 3.42 | The top 25 percent of graduate degree holders who majored in applied mathematics earn
more than $135,000 annually.
Interquartile range of annual wages of graduate degree holders with computers, statistics, and
mathematics majors (ages 25-59) by major subgroup (2013$)
Computer engineering
Applied mathematics
Computer science
Statistics and decision science
All computers, statistics,
and mathematics majors
Mathematics
Information sciences
Computer and information systems
Bachelor’s degree holder, all majors
Miscellaneous computer
High school graduate
IN THOUSANDS:
25th Percentile
$0
$35
Median
$55
$75
$95
$115
$135
$155
75th Percentile
Source: Georgetown University Center on Education and the Workforce analysis of U.S. Census Bureau, American Community Survey
micro data, 2009-2013.
73
THE ECONOMIC VALUE OF COLLEGE MAJORS MAJORS | PART THREE
COMPUTERS,
AGRICULTURE
STATISTICS
AND NATURAL
ANDRESOURCES
MATHEMATICS
INTRODUCTION
TABLE 3.7 | Applied mathematics majors and statistics and decision science majors with
graduate degrees earn a premium of 28 percent, while computer engineering majors with
graduate degrees earn a 16 percent premium.
Major group
Median annual wages
of college-educated
workers (ages 25-59) with
computers, statistics, and
mathematics majors (2013$)
Graduate degree wage
premium (2013$)
Bachelor’s
Graduate
$
%
All majors
61,000
78,000
17,000
28
All computers, statistics,
and mathematics majors
76,000
96,000
20,000
26
Miscellaneous computer
59,000
81,000
22,000
37
Statistics and
decision science
78,000
100,000
22,000
28
Applied mathematics
83,000
106,000
23,000
28
Mathematics
73,000
90,000
17,000
23
Computer and
information systems
69,000
85,000
16,000
23
Information sciences
73,000
88,000
15,000
21
Computer science
83,000
100,000
17,000
20
Major subgroups
Source: Georgetown University Center on Education and the Workforce analysis of U.S. Census Bureau,
American Community Survey micro data, 2009-2013.
74
PART THREE | THE
THEECONOMIC
ECONOMICVALUE
VALUEOF
OFCOLLEGE
COLLEGE MAJORS
COMPUTERS,
AGRICULTURE
STATISTICS
AND NATURAL
ANDINTRODUCTION
MATHEMATICS
RESOURCES
EDUCATION
SHARE OF ALL MAJORS
9.4
%
GRADUATE DEGREE ATTAINMENT
44.6
%
75
THE ECONOMIC VALUE OF COLLEGE MAJORS MAJORS | PART THREE
AGRICULTURE
EDUCATION AND NATURAL RESOURCES
INTRODUCTION
Prevalence of major subgroups in the field of education
FIGURE 3.43 | Together, general education and elementary education majors comprise three out of every
five education majors.
Share of college graduates with education majors (ages 25-59) by major subgroup, 2013
30.6%
General education
29.8%
Elementary education
6.6%
Physical and health education teaching
5.1%
Art and music education
Early childhood education
4.5%
Miscellaneous education
4.3%
Secondary teacher education
4.1%
Special needs education
4.1%
Language and drama education
3.6%
Social sciences or
history teacher education
Teacher education: multiple levels
2.5%
2.0%
Mathematics teacher education
1.5%
Science and computer teacher education
1.2%
Source: Georgetown University Center on Education and the Workforce analysis of U.S. Census Bureau, American Community Survey
micro data, 2009-2013.
Note: Percentages may not sum to 100 percent due to rounding.
76
PART THREE | THE
THEECONOMIC
ECONOMICVALUE
VALUEOF
OFCOLLEGE
COLLEGE MAJORS
AGRICULTURE AND NATURAL
EDUCATION
RESOURCES
INTRODUCTION
FIGURE 3.44 | Early childhood education majors earn $39,000 annually, slightly more than the average
high school graduate and the lowest among education majors.
Median annual wages of college-educated workers with education majors (ages 25-59) by major
subgroup (2013$)
$61,000
Bachelor’s degree holder, all majors
$52,000
Miscellaneous education
$51,000
Physical and health education teaching
Mathematics teacher education
$49,000
Secondary teacher education
$48,000
Science and computer
teacher education
$48,000
Social sciences or history
teacher education
$47,000
General education
$46,000
Art and music education
$46,000
Special needs education
$45,000
Language and drama education
$45,000
All education majors
$45,000
Elementary education
Teacher education: multiple levels
Early childhood education
High school graduates
$43,000
$42,000
$39,000
$36,000
Source: Georgetown University Center on Education and the Workforce analysis of U.S. Census Bureau, American Community Survey
micro data, 2009-2013.
77
THE ECONOMIC VALUE OF COLLEGE MAJORS MAJORS | PART THREE
AGRICULTURE
EDUCATION AND NATURAL RESOURCES
INTRODUCTION
FIGURE 3.45 | Physical and health education majors’ earnings typically range between $40,000 and $70,000
annually.
Interquartile range of annual wages of graduate degree holders with business majors (ages 25-59)
by major subgroup (2013$)
Bachelor’s degree holder, all majors
Miscellaneous education
Physical and health education teaching
Mathematics teacher education
Secondary teacher education
Science and computer
teacher education
Social sciences or history
teacher education
General education
Art and music education
Special needs education
Language and drama education
All education majors
Elementary education
Teacher education: multiple levels
Early childhood education
High school graduate
IN THOUSANDS:
25th Percentile
$0
$20
$30
Median
$40
$50
$60
$70
$80
$90
$100
75th Percentile
Source: Georgetown University Center on Education and the Workforce analysis of U.S. Census Bureau, American Community Survey
micro data, 2009-2013.
78
PART THREE | THE
THEECONOMIC
ECONOMICVALUE
VALUEOF
OFCOLLEGE
COLLEGE MAJORS
AGRICULTURE AND NATURAL
EDUCATION
RESOURCES
INTRODUCTION
FIGURE 3.46 | Education majors are more likely than the average college graduate to complete
a graduate degree.
Graduate degree attainment of college graduates with education majors (ages 25-59) by major
subgroup, 2013
56.2%
Special needs education
52.0%
Mathematics teacher education
Miscellaneous education
51.0%
Language and drama education
50.8%
Science and computer
teacher education
50.7%
46.9%
Secondary teacher education
All education majors
44.6%
Social sciences or history
teacher education
44.2%
General education
43.7%
Elementary education
43.2%
Art and music education
42.9%
Teacher education: multiple levels
42.5%
Physical and health education teaching
38.4%
Early childhood education
35.3%
Bachelor’s degree holder, all majors
35.1%
Source: Georgetown University Center on Education and the Workforce analysis of U.S. Census Bureau, American Community Survey
micro data, 2009-2013.
79
THE ECONOMIC VALUE OF COLLEGE MAJORS MAJORS | PART THREE
AGRICULTURE
EDUCATION AND NATURAL RESOURCES
INTRODUCTION
FIGURE 3.47 | No matter their specialty, graduate degree holders who majored in education fields earn
less than the average graduate degree holder.
Median annual wages of graduate degree holders with education majors (ages 25-59) by major
subgroup (2013$)
$78,000
Graduate degree holder, all majors
$67,000
Physical and health education teaching
Secondary teacher education
$64,000
Science and computer
teacher education
$64,000
Miscellaneous education
$64,000
$63,000
Mathematics teacher education
Social sciences or history
teacher education
$62,000
Bachelor’s degree holder, all majors
$61,000
Art and music education
$61,000
Language and drama education
$61,000
Special needs education
$61,000
General education
$60,000
All education majors
$60,000
Teacher education: multiple levels
$57,000
Elementary education
$57,000
Early childhood education
$53,000
Source: Georgetown University Center on Education and the Workforce analysis of U.S. Census Bureau, American Community Survey
micro data, 2009-2013.
80
PART THREE | THE
THEECONOMIC
ECONOMICVALUE
VALUEOF
OFCOLLEGE
COLLEGE MAJORS
AGRICULTURE AND NATURAL
EDUCATION
RESOURCES
INTRODUCTION
FIGURE 3.48 | The top 25 percent of most education majors with graduate degrees earn $75,000 or more
annually; the bottom 25 percent typically earn $50,000 or less annually.
Interquartile range of annual wages of graduate degree-holders with education majors (ages 25-59)
by major subgroup (2013$)
Graduate degree holder, all majors
Physical and health education teaching
Secondary teacher education
Science and computer
teacher education
Miscellaneous education
Mathematics teacher education
Social sciences or history
teacher education
Bachelor’s degree holder, all majors
Art and music education
Language and drama education
Special needs education
General education
All education majors
Teacher education: multiple levels
Elementary education
Early childhood education
IN THOUSANDS:
25th Percentile
$10 $20
$30
$40
Median
$50
$60 $70
$80
$90 $100 $110 $120 $130
75th Percentile
Source: Georgetown University Center on Education and the Workforce analysis of U.S. Census Bureau, American Community Survey
micro data, 2009-2013.
81
THE ECONOMIC VALUE OF COLLEGE MAJORS MAJORS | PART THREE
AGRICULTURE
EDUCATION AND NATURAL RESOURCES
INTRODUCTION
TABLE 3.8 | The average wage premium received by education majors from a graduate
degree is 33 percent, an amount that does not vary much across specialties.
Major group
Median annual wages
of college-educated
workers (ages 25-59) with
education majors (2013$)
Graduate degree wage
premium (2013$)
Bachelor’s
Graduate
$
%
All majors
61,000
78,000
17,000
28
All education majors
45,000
60,000
15,000
33
Early childhood education
39,000
53,000
14,000
36
Teacher education:
multiple levels
42,000
57,000
15,000
36
Language and
drama education
45,000
61,000
16,000
36
Special needs education
45,000
61,000
16,000
36
Science and computer
teacher education
48,000
64,000
16,000
33
Secondary teacher
education
48,000
64,000
16,000
33
Art and music education
46,000
61,000
15,000
33
Elementary education
43,000
57,000
14,000
33
Social sciences or history
teacher education
47,000
62,000
15,000
32
Physical and health
education teaching
51,000
67,000
16,000
31
General education
46,000
60,000
14,000
30
Mathematics teacher
education
49,000
63,000
14,000
29
Miscellaneous education
52,000
64,000
12,000
23
Major subgroups
Source: Georgetown University Center on Education and the Workforce analysis of U.S. Census Bureau,
American Community Survey micro data, 2009-2013.
82
PART THREE | THE
THEECONOMIC
ECONOMICVALUE
VALUEOF
OFCOLLEGE
COLLEGE MAJORS
AGRICULTURE AND NATURAL
EDUCATION
RESOURCES
INTRODUCTION
HEALTH
SHARE OF ALL MAJORS
7.5
%
GRADUATE DEGREE ATTAINMENT
33.8
%
83
THETHE
ECONOMIC
ECONOMIC
VALUE
VALUE
OF COLLEGE
OF COLLEGE
MAJORS MAJORS | PART
| PART
THREE
THREE
MAJORS
AGRICULTURE
HEALTH AND NATURAL RESOURCES
INTRODUCTION
Prevalence of major subgroups in the field of health
FIGURE 3.49 | Nursing majors comprise three out of every five health majors.
Share of college graduates with health majors (ages 25-59) by major subgroup, 2013
Nursing
60.1%
Miscellaneous health and medical professions
16.0%
Treatment therapy professions
9.5%
Pharmacy, pharmaceutical sciences, and
pharmaceutical administration
Health and medical administrative services
5.1%
4.0%
Nutrition sciences
2.4%
Communication disorders
sciences and services
2.2%
Health and medical preparatory programs
.8%
Source: Georgetown University Center on Education and the Workforce analysis of U.S. Census Bureau, American Community Survey
micro data, 2009-2013.
Note: Percentages may not sum to 100 percent due to rounding.
84
PART
PARTTHREE THREE | | THE
THEECONOMIC
ECONOMICVALUE
VALUEOF
OFCOLLEGE
COLLEGE MAJORS
AGRICULTURE AND NATURAL
RESOURCES
HEALTH
INTRODUCTION
FIGURE 3.50 | Pharmacy, pharmaceutical sciences, and administration majors earn $113,000 annually, the
highest among health majors.
Median annual wages of college-educated workers with health majors (ages 25-59) by major
subgroup (2013$)
Pharmacy, pharmaceutical sciences, and
pharmaceutical administration
$113,000
Nursing
$66,000
Treatment therapy professions
$65,000
All health majors
$65,000
Bachelor’s degree holder, all majors
$61,000
Miscellaneous health and medical
professions
$56,000
Health and medical
administrative services
$55,000
Health and medical preparatory programs
$54,000
$52,000
Nutrition sciences
Communication disorders
sciences and services
High school graduate
$46,000
$36,000
Source: Georgetown University Center on Education and the Workforce analysis of U.S. Census Bureau, American Community Survey
micro data, 2009-2013.
85
THETHE
ECONOMIC
ECONOMIC
VALUE
VALUE
OF COLLEGE
OF COLLEGE
MAJORS MAJORS | PART
| PART
THREE
THREE
MAJORS
AGRICULTURE
HEALTH AND NATURAL RESOURCES
INTRODUCTION
FIGURE 3.51 | The top 25 percent of pharmacy, pharmaceutical sciences, and pharmaceutical administration
majors earn more than $120,000 annually, and the bottom 25 percent of this major still earn
more than the top earners of most other health majors.
Interquartile range of annual wages of college-educated workers with health majors (ages 25-59)
by major subgroup (2013$)
Pharmacy, pharmaceutical sciences, and
pharmaceutical administration
Nursing
Treatment therapy professions
All health majors
Bachelor’s degree holder, all majors
Miscellaneous health and medical professions
Health and medical
administrative services
Health and medical preparatory programs
Nutrition sciences
Communication disorders
sciences and services
High school graduate
IN THOUSANDS:
25th Percentile
$0
$20
Median
$40
$60
$80
$100
$120
$140
75th Percentile
Source: Georgetown University Center on Education and the Workforce analysis of U.S. Census Bureau, American Community Survey
micro data, 2009-2013.
86
PART
PARTTHREE THREE | | THE
THEECONOMIC
ECONOMICVALUE
VALUEOF
OFCOLLEGE
COLLEGE MAJORS
AGRICULTURE AND NATURAL
RESOURCES
HEALTH
INTRODUCTION
FIGURE 3.52 | Among health majors, health and medical preparatory programs and communications
disorders sciences and services majors are substantially more likely to lead to graduate
degrees than the other specialties.
Graduate degree attainment of college graduates with health majors (ages 25-59) by
major subgroup, 2013
Health and medical preparatory programs
$77.3%
Communication disorders
sciences and services
Pharmacy, pharmaceutical sciences, and
pharmaceutical administration
75.9%
51.6%
Nutrition sciences
40.8%
Treatment therapy professions
38.6%
Bachelor’s degree holder, all majors
35.1%
All health majors
33.8%
Miscellaneous health and medical
professions
33.5%
Health and medical
administrative services
Nursing
29.4%
23.8%
Source: Georgetown University Center on Education and the Workforce analysis of U.S. Census Bureau, American Community Survey
micro data, 2009-2013.
87
THETHE
ECONOMIC
ECONOMIC
VALUE
VALUE
OF COLLEGE
OF COLLEGE
MAJORS MAJORS | PART
| PART
THREE
THREE
MAJORS
AGRICULTURE
HEALTH AND NATURAL RESOURCES
INTRODUCTION
FIGURE 3.53 | Graduate degree holders with a health and medical preparatory programs major
earn $128,000 annually, the highest among graduate degree holders who majored in
health fields.
Median annual wages of graduate degree holders with health majors (ages 25-59) by
major subgroup (2013$)
$128,000
Health and medical preparatory programs
Pharmacy, pharmaceutical sciences, and
pharmaceutical administration
$118,000
$88,000
Nursing
$84,000
All health majors
Health and medical
administrative services
$80,000
Graduate degree holder, all majors
$78,000
Miscellaneous health and medical
professions
$73,000
Treatment therapy professions
$73,000
Nutrition sciences
Communication disorders sciences
and services
Bachelor’s degree holder, all majors
$70,000
$66,000
$61,000
Source: Georgetown University Center on Education and the Workforce analysis of U.S. Census Bureau, American Community Survey
micro data, 2009-2013.
88
PART
PARTTHREE THREE | | THE
THEECONOMIC
ECONOMICVALUE
VALUEOF
OFCOLLEGE
COLLEGE MAJORS
AGRICULTURE AND NATURAL
RESOURCES
HEALTH
INTRODUCTION
FIGURE 3.54 | The top 25 percent of pharmacy, pharmaceutical sciences, and pharmaceutical administration
majors earn more than $120,000 annually, and the bottom 25 percent of this major still earn
more than the top earners of most other health majors.
Interquartile range of annual wages of college-educated workers with health majors (ages 25-59)
by major subgroup (2013$)
Health and medical preparatory programs
Pharmacy, pharmaceutical sciences, and
pharmaceutical administration
Nursing
All health majors
Health and medical administrative services
Graduate degree holder, all majors
Miscellaneous health medical professions
Treatment therapy professions
Nutrition sciences
Communication disorders
sciences and services
Bachelor’s degree holder, all majors
IN THOUSANDS:
25th Percentile
$30
$80
Median
$130
$180
$230
$280
$330
75th Percentile
Source: Georgetown University Center on Education and the Workforce analysis of U.S. Census Bureau, American Community Survey
micro data, 2009-2013.
89
THETHE
ECONOMIC
ECONOMIC
VALUE
VALUE
OF COLLEGE
OF COLLEGE
MAJORS MAJORS | PART
| PART
THREE
THREE
MAJORS
AGRICULTURE
HEALTH AND NATURAL RESOURCES
INTRODUCTION
TABLE 3.9 | G
raduate degree holders with a health and medical preparatory programs
major earn a 137 percent wage premium.
Major group
Median annual wages
of college-educated
workers (ages 25-59) with
health majors (2013$)
Graduate degree wage
premium (2013$)
Bachelor’s
Graduate
$
%
All majors
61,000
78,000
17,000
28
All health majors
65,000
84,000
19,000
29
Health and medical
preparatory programs
54,000
128,000
74,000
137
Health and medical
administrative services
55,000
80,000
25,000
45
Communication disorders
sciences and services
46,000
66,000
20,000
43
Nutrition sciences
52,000
70,000
18,000
35
Nursing
66,000
88,000
22,000
33
Miscellaneous health and
medical professions
56,000
73,000
17,000
30
Treatment therapy
professions
65,000
73,000
8,000
12
Pharmacy and
pharmaceutical sciences
and administration
110,000
115,000
5,000
5
Major subgroups
Source: Georgetown University Center on Education and the Workforce analysis of U.S. Census Bureau,
American Community Survey micro data, 2009-2013.
90
PART
PARTTHREE THREE | | THE
THEECONOMIC
ECONOMICVALUE
VALUEOF
OFCOLLEGE
COLLEGE MAJORS
AGRICULTURE AND NATURAL
RESOURCES
HEALTH
INTRODUCTION
HUMANITIES AND LIBERAL ARTS
SHARE OF ALL MAJORS
8.6
%
GRADUATE DEGREE ATTAINMENT
41.4
%
91
THE ECONOMIC VALUE OF COLLEGE MAJORS MAJORS | PART THREE
HUMANITIES
AGRICULTURE
AND
ANDLIBERAL
NATURAL
ARTS
RESOURCES
INTRODUCTION
Prevalence of major subgroups in the fields
of humanities and liberal arts
FIGURE 3.55 | English majors comprise the largest share of humanities and liberal arts majors at
29 percent.
Share of college graduates with education majors (ages 25-59) by major subgroup, 2013
29.1%
English language and literature
History
19.0%
Liberal arts
18.7%
Theology and religious vocations
6.4%
French, German, Latin and other common
foreign language studies
6.0%
Philosophy and religious studies
Area ethnic and civilization studies
Art history and criticism
Linguistics and comparative
language and literature
5.6%
3.0%
2.5%
2.0%
Composition and speech
1.8%
Intercultural and international studies
1.7%
Other foreign languages
1.6%
Humanities
1.3%
Multi/interdisciplinary studies
1.3%
Source: Georgetown University Center on Education and the Workforce analysis of U.S. Census Bureau, American Community Survey
micro data, 2009-2013.
Note: Percentages may not sum to 100 percent due to rounding.
92
PART THREE | THE
THEECONOMIC
ECONOMICVALUE
VALUEOF
OFCOLLEGE
COLLEGE MAJORS
AGRICULTURE
HUMANITIES
AND NATURAL
AND
LIBERAL
RESOURCES
ARTS
INTRODUCTION
FIGURE 3.56 | Among humanities and liberal arts majors, history majors have the highest annual wage at
$54,000, while theology and religious vocations have the lowest annual wage at $43,000.
Median annual wages of college-educated workers with humanities and liberal arts majors (ages 25-59)
by major subgroup (2013$)
$61,000
Bachelor’s degree holder, all majors
$54,000
History
Liberal arts
$53,000
English language and literature
$53,000
Intercultural and international studies
$52,000
French, German, Latin and other common
foreign language studies
$52,000
All humanities and liberal arts majors
$52,000
Philosophy and religious studies
$51,000
Other foreign languages
$51,000
Area ethnic and civilization studies
$51,000
Linguistics and comparative
language and literature
$50,000
Art history and criticism
$49,000
Humanities
$49,000
Composition and speech
$47,000
Multi/interdisciplinary studies
Theology and religious vocations
High school graduate
$46,000
$43,000
$36,000
Source: Georgetown University Center on Education and the Workforce analysis of U.S. Census Bureau, American Community Survey
micro data, 2009-2013.
93
THE ECONOMIC VALUE OF COLLEGE MAJORS MAJORS | PART THREE
HUMANITIES
AGRICULTURE
AND
ANDLIBERAL
NATURAL
ARTS
RESOURCES
INTRODUCTION
FIGURE 3.57 | The top 25 percent of history majors earn $85,000 or more annually, while the bottom 25
percent of theology and religious vocations majors earn $30,000 or less annually, which is less
than the average high school graduate.
Interquartile range of annual wages of college-educated workers with humanities and liberal arts majors
(ages 25-59) by major subgroup (2013$)
Bachelor’s degree holder, all majors
History
Liberal arts
English language and literature
Intercultural and international studies
French, German, Latin and other
common foreign language studies
All humanities and liberal arts majors
Philosophy and religious studies
Other foreign languages
Area ethnic and civilization studies
Linguistics and comparative
language and literature
Art history and criticism
Humanities
Composition and speech
Multi/interdisciplinary studies
Theology and religious vocations
High school graduate
IN THOUSANDS:
25th Percentile
$10
$20
$30
Median
$40
$50
$60
$70
$80
$90
$100
75th Percentile
Source: Georgetown University Center on Education and the Workforce analysis of U.S. Census Bureau, American Community Survey
micro data, 2009-2013.
94
PART THREE | THE
THEECONOMIC
ECONOMICVALUE
VALUEOF
OFCOLLEGE
COLLEGE MAJORS
AGRICULTURE
HUMANITIES
AND NATURAL
AND
LIBERAL
RESOURCES
ARTS
INTRODUCTION
FIGURE 3.58 | Graduate degree-holders who majored in history earn $80,000 annually, the only
humanities and liberal arts major that leads to wages that are higher than the average
graduate degree-holder.
Median annual wages of graduate degree-holders with humanities and liberal arts majors (ages 25-59)
by major subgroup (2013$)
53.0%
Philosophy and religious studies
French, German, Latin and other common
foreign language studies
46.8%
Area ethnic and civilization studies
46.4%
Linguistics and comparative
language and literature
45.8%
History
45.7%
Other foreign languages
45.5%
English language and literature
43.2%
All humanities and liberal arts majors
41.4%
Intercultural and international studies
40.5%
Art history and criticism
39.3%
Theology and religious vocations
39.0%
Humanities
35.6%
Bachelor’s degree holder, all majors
Composition and speech
Multi/interdisciplinary studies
Liberal arts
35.1%
31.0%
26.5%
25.5%
Source: Georgetown University Center on Education and the Workforce analysis of U.S. Census Bureau, American Community Survey
micro data, 2009-2013.
95
THE ECONOMIC VALUE OF COLLEGE MAJORS MAJORS | PART THREE
HUMANITIES
AGRICULTURE
AND
ANDLIBERAL
NATURAL
ARTS
RESOURCES
INTRODUCTION
FIGURE 3.59 | Graduate degree-holders who majored in history earn $80,000 annually, the only
humanities and liberal arts major that leads to wages that are higher than the average
graduate degree-holder.
Median annual wages of graduate degree-holders with humanities and liberal arts majors (ages 25-59)
by major subgroup (2013$)
History
$80,000
Graduate degree holder, all majors
$78,000
Area ethnic and civilization studies
$77,000
Intercultural and international studies
$73,000
Humanities
$71,000
Liberal arts
$71,000
All humanities and liberal arts majors
$70,000
Other foreign languages
$69,000
Philosophy and religious studies
$68,000
English language and literature
$68,000
Linguistics and comparative
language and literature
French, German, Latin and other common
foreign language studies
$67,000
Art history and criticism
$66,000
$68,000
Bachelor’s degree holder, all majors
$61,000
Composition and speech
$61,000
Multi/interdisciplinary studies
Theology and religious vocations
$57,000
$51,000
Source: Georgetown University Center on Education and the Workforce analysis of U.S. Census Bureau, American Community Survey
micro data, 2009-2013.
96
PART THREE | THE
THEECONOMIC
ECONOMICVALUE
VALUEOF
OFCOLLEGE
COLLEGE MAJORS
AGRICULTURE
HUMANITIES
AND NATURAL
AND
LIBERAL
RESOURCES
ARTS
INTRODUCTION
FIGURE 3.60 | The top 25 percent of graduate degree holders who majored in history or area ethnic and
civilization studies earn more than $120,000 annually, while the bottom 25 percent of those
who majored in theology and religious vocations earn less than $35,000 annually.
Interquartile range of annual wages of graduate degree holders with humanities and liberal arts
majors (ages 25-59) by major subgroup (2013$)
History
Graduate degree holder, all majors
Area ethnic and civilization studies
Intercultural and international studies
Humanities
Liberal arts
All humanities and liberal arts majors
Other foreign languages
Philosophy and religious studies
English language and literature
Linguistics and comparative
language and literature
French, German, Latin and other
common foreign language studies
Art history and criticism
Bachelor’s degree holder, all majors
Composition and speech
Multi/interdisciplinary studies
Theology and religious vocations
IN THOUSANDS:
25th Percentile
$10
$30
$50
Median
$70
$90
$110
$130
$150
75th Percentile
Source: Georgetown University Center on Education and the Workforce analysis of U.S. Census Bureau, American Community Survey
micro data, 2009-2013.
97
THE ECONOMIC VALUE OF COLLEGE MAJORS MAJORS | PART THREE
HUMANITIES
AGRICULTURE
AND
ANDLIBERAL
NATURAL
ARTS
RESOURCES
INTRODUCTION
TABLE 3.10 | A
rea ethnic and civilization studies majors receive a 51 percent wage
premium from a graduate degree, the highest premium among humanities
and liberal arts majors.
Major group
Median annual wages of
college-educated workers (ages
25-59) with humanities and
liberal arts majors (2013$)
Graduate degree wage
premium (2013$)
Bachelor’s
Graduate
$
%
All majors
61,000
78,000
17,000
28
All humanities and
liberal arts majors
52,000
70,000
18,000
35
Area ethnic and
civilization studies
51,000
77,000
26,000
51
History
54,000
80,000
26,000
48
Humanities
49,000
71,000
22,000
45
Intercultural and
international studies
52,000
73,000
21,000
40
Linguistics and
comparative language
and literature
50,000
68,000
18,000
36
Other foreign languages
51,000
69,000
18,000
35
Art history and criticism
49,000
66,000
17,000
35
Liberal arts
53,000
71,000
18,000
34
Philosophy and
religious studies
51,000
68,000
17,000
33
Composition and speech
47,000
61,000
14,000
30
French, German, Latin,
and other common
foreign language studies
52,000
67,000
15,000
29
English language
and literature
53,000
68,000
15,000
28
Multi/interdisciplinary
studies
46,000
57,000
11,000
24
Theology and
religious vocations
41,000
50,000
9,000
22
Major subgroups
Source: Georgetown University Center on Education and the Workforce analysis of U.S. Census Bureau,
American Community Survey micro data, 2009-2013.
98
PART THREE | THE
THEECONOMIC
ECONOMICVALUE
VALUEOF
OFCOLLEGE
COLLEGE MAJORS
AGRICULTURE
HUMANITIES
AND NATURAL
AND
LIBERAL
RESOURCES
ARTS
INTRODUCTION
INDUSTRIAL ARTS, CONSUMER
SERVICES, AND RECREATION
SHARE OF ALL MAJORS
2.7
%
GRADUATE DEGREE ATTAINMENT
24.6
%
99
THE ECONOMIC VALUE OF COLLEGE MAJORS MAJORS | PART THREE
AGRICULTURE
INDUSTRIAL ARTS,
ANDCONSUMER
NATURAL RESOURCES
SERVICES, AND RECREATION
INTRODUCTION
Prevalence of major subgroups in the fields of
industrial arts, consumer services, and recreation
FIGURE 3.61 | Physical fitness, parks, recreation, and leisure majors and family and consumer sciences
majors comprise more than 70 percent of industrial arts, consumer services, and
recreation majors.
Share of college graduates with industrial arts, consumer services, and recreation majors
(ages 25-59) by major subgroup, 2013
Physical Fitness, Parks,
Recreation, and Leisure
37%
Transportation Sciences
and Technologies
13%
Family and Consumer Sciences
34%
Miscellaneous Industrial
Arts and Consumer Services
16%
Source: Georgetown University Center on Education and the Workforce analysis of U.S. Census Bureau, American Community Survey
micro data, 2009-2013.
Note: Percentages may not sum to 100 percent due to rounding.
100
PART THREE | THE
THEECONOMIC
ECONOMICVALUE
VALUEOF
OFCOLLEGE
COLLEGE MAJORS
INDUSTRIAL ARTS,
AGRICULTURE
CONSUMER SERVICES
AND NATURAL
AND
RECREATION
RESOURCES
INTRODUCTION
FIGURE 3.62 | Transportation sciences and technologies majors earn $73,000 annually, the highest among
industrial arts, consumer services, and recreation majors.
Median annual wages of college-educated workers with industrial arts, consumer services, and
recreation majors (ages 25-59) by major subgroup (2013$)
Transportation sciences and technologies
$73,000
Miscellaneous industrial arts
and consumer services
$64,000
Bachelor’s degree holder, all majors
$61,000
All industrial arts, consumer services,
and recreation majors
$52,000
Physical fitness, parks, recreation, and leisure
Family and consumer sciences
High school graduate
$49,000
$45,000
$36,000
Source: Georgetown University Center on Education and the Workforce analysis of U.S. Census Bureau, American Community Survey
micro data, 2009-2013.
Note: Percentages may not sum to 100 percent due to rounding.
101
THE ECONOMIC VALUE OF COLLEGE MAJORS MAJORS | PART THREE
AGRICULTURE
INDUSTRIAL ARTS,
ANDCONSUMER
NATURAL RESOURCES
SERVICES, AND RECREATION
INTRODUCTION
FIGURE 3.63 | The top 25 percent of transportation sciences and technologies majors earn more than
$100,000 annually, while the bottom 25 percent of family and consumer sciences majors earn
less than $35,000 annually.
Interquartile range of annual wages of college-educated workers with industrial arts, consumer
services, and recreation majors (ages 25-59) by major subgroup (2013$)
Transportation sciences and technologies
Miscellaneous industrial arts
and consumer services
Bachelor’s degree holder, all majors
All industrial arts, consumer services,
and recreation majors
Physical fitness, parks, recreation, and leisure
Family and consumer sciences
High school graduate
IN THOUSANDS:
25th Percentile
$10
$20
Median
$30
$40
$50
$60
$70
$80
$90
$100
75th Percentile
Source: Georgetown University Center on Education and the Workforce analysis of U.S. Census Bureau, American Community Survey
micro data, 2009-2013.
102
$110
PART THREE | THE
THEECONOMIC
ECONOMICVALUE
VALUEOF
OFCOLLEGE
COLLEGE MAJORS
INDUSTRIAL ARTS,
AGRICULTURE
CONSUMER SERVICES
AND NATURAL
AND
RECREATION
RESOURCES
INTRODUCTION
FIGURE 3.64 | Industrial arts, consumer services, and recreation majors are less likely to earn a graduate
degree than the average college graduate.
Graduate degree attainment of college graduates with industrial arts, consumer services, and
recreation majors (ages 25-59) by major subgroup, 2013
Bachelor’s degree holder, all majors
35.1%
Physical fitness, parks, recreation, and leisure
28.2%
Family and consumer sciences
27.4%
All industrial arts, consumer services,
and recreation majors
Transportation sciences and technologies
Miscellaneous industrial arts
and consumer services
24.2%
16.7%
11.0%
Source: Georgetown University Center on Education and the Workforce analysis of U.S. Census Bureau, American Community Survey
micro data, 2009-2013.
103
THE ECONOMIC VALUE OF COLLEGE MAJORS MAJORS | PART THREE
AGRICULTURE
INDUSTRIAL ARTS,
ANDCONSUMER
NATURAL RESOURCES
SERVICES, AND RECREATION
INTRODUCTION
FIGURE 3.65 | Graduate degree-holders who majored in transportation sciences and technologies
earn $94,000 annually, the highest among graduate degree-holders with industrial arts,
consumer services, or recreation majors.
Median annual wages of graduate degree-holders with industrial arts, consumer services, and
recreation majors (ages 25-59) by major subgroup (2013$)
Transportation sciences and technologies
$94,000
Graduate degree holder, all majors
$78,000
Miscellaneous industrial arts
and consumer services
Physical fitness, parks, recreation, and leisure
All industrial arts, consumer services,
and recreation majors
$76,000
$65,000
$65,000
Bachelor’s degree holder, all majors
$61,000
Family and consumer sciences
$60,000
Source: Georgetown University Center on Education and the Workforce analysis of U.S. Census Bureau, American Community Survey
micro data, 2009-2013.
104
PART THREE | THE
THEECONOMIC
ECONOMICVALUE
VALUEOF
OFCOLLEGE
COLLEGE MAJORS
INDUSTRIAL ARTS,
AGRICULTURE
CONSUMER SERVICES
AND NATURAL
AND
RECREATION
RESOURCES
INTRODUCTION
FIGURE 3.66 | The top 25 percent of graduate degree holders who majored in transportation sciences and
technologies earn more than $120,000 annually, while the bottom 25 percent of graduate
degree holders who majored in family or consumer sciences earn less than $45,000 annually.
Interquartile range of annual wages of graduate degree holders with industrial arts, consumer
services, and recreation majors (ages 25-59) by major subgroup (2013$)
Transportation sciences and technologies
Graduate degree holder, all majors
Miscellaneous industrial arts
and consumer services
Physical fitness, parks, recreation, and leisure
All industrial arts, consumer services,
and recreation majors
Bachelor’s degree holder, all majors
Family and consumer sciences
IN THOUSANDS:
25th Percentile
$10 $30
Median
$40
$50
$60
$70
$80
$90 $100 $110
$120 $130
75th Percentile
Source: Georgetown University Center on Education and the Workforce analysis of U.S. Census Bureau, American Community Survey
micro data, 2009-2013.
105
THE ECONOMIC VALUE OF COLLEGE MAJORS MAJORS | PART THREE
AGRICULTURE
INDUSTRIAL ARTS,
ANDCONSUMER
NATURAL RESOURCES
SERVICES, AND RECREATION
INTRODUCTION
TABLE 3.11 | Industrial arts, consumer services, and recreation majors receive, on average,
a 25 percent wage premium from a graduate degree.
Major group
Median annual wages of
college-educated workers
(ages 25-59) with industrial
arts, consumer services, and
recreation majors (2013$)
Graduate degree wage
premium (2013$)
Bachelor’s
Graduate
$
%
All majors
61,000
78,000
17,000
28
All industrial arts,
consumer services, and
recreation majors
52,000
65,000
13,000
25
Family and consumer
sciences
45,000
60,000
15,000
33
Physical fitness, parks,
recreation, and leisure
49,000
65,000
16,000
33
Transportation sciences
and technologies
73,000
94,000
21,000
29
Miscellaneous industrial
arts and consumer services
64,000
76,000
12,000
19
Major subgroups
Source: Georgetown University Center on Education and the Workforce analysis of U.S. Census Bureau,
American Community Survey micro data, 2009-2013.
106
PART THREE | THE
THEECONOMIC
ECONOMICVALUE
VALUEOF
OFCOLLEGE
COLLEGE MAJORS
INDUSTRIAL ARTS,
AGRICULTURE
CONSUMER SERVICES
AND NATURAL
AND
RECREATION
RESOURCES
INTRODUCTION
LAW AND PUBLIC POLICY
SHARE OF ALL MAJORS
2.6
%
GRADUATE DEGREE ATTAINMENT
24.2
%
107
THE ECONOMIC VALUE OF COLLEGE MAJORS MAJORS | PART THREE
AGRICULTURE
LAW AND PUBLIC
ANDPOLICY
NATURAL RESOURCES
INTRODUCTION
Prevalence of major subgroups in the
fields of law and public policy
FIGURE 3.67 | Criminal justice and fire protection majors comprise the vast majority of law and public
policy majors.
Share of college graduates with law and public policy majors (ages 25-59) by major subgroup, 2013
Pre-law and
legal studies
8%
Public administration
5%
Public policy
2%
Criminal justice and
fire protection
85%
Source: Georgetown University Center on Education and the Workforce analysis of U.S. Census Bureau, American Community Survey
micro data, 2009-2013.
Note: Percentages may not sum to 100 percent due to rounding.
108
PART THREE | THE
THEECONOMIC
ECONOMICVALUE
VALUEOF
OFCOLLEGE
COLLEGE MAJORS
AGRICULTURE AND
LAW
NATURAL
ANDINTRODUCTION
PUBLIC
RESOURCES
POLICY
FIGURE 3.68 | Public policy majors earn $65,000 annually, the highest among law and public policy majors.
Median annual wages of college-educated workers with law and public policy majors (ages 25-59)
by major subgroup (2013$)
Public policy
$65,000
Public administration
$62,000
Bachelor’s degree holder, all majors
$61,000
Criminal justice and fire protection
$54,000
All law and public policy majors
$54,000
Pre-law and legal studies
$51,000
High school graduate
$36,000
Source: Georgetown University Center on Education and the Workforce analysis of U.S. Census Bureau, American Community Survey
micro data, 2009-2013.
FIGURE 3.69 | The top 25 percent of public policy majors earn $100,000 or more annually, while the bottom
25 percent earn less than $45,000.
Interquartile range of annual wages of graduate degree holders with law and public policy majors (ages
25-59) by major subgroup (2013$)
Public policy
Public administration
Bachelor’s degree holder, all majors
Criminal justice and fire protection
All law and public policy majors
Pre-law and legal studies
High school graduate
IN THOUSANDS:
25th Percentile
$10
$20
Median
$30
$40
$50
$60
$70
$80
$90
$100
$110
75th Percentile
Source: Georgetown University Center on Education and the Workforce analysis of U.S. Census Bureau, American Community Survey
micro data, 2009-2013.
109
THE ECONOMIC VALUE OF COLLEGE MAJORS MAJORS | PART THREE
AGRICULTURE
LAW AND PUBLIC
ANDPOLICY
NATURAL RESOURCES
INTRODUCTION
FIGURE 3.70 | More than half of public policy majors earn a graduate degree, the highest attainment rate
among law and public policy majors.
Graduate degree attainment of college graduates with law and public policy majors (ages 25-59)
by major subgroup, 2013
Public policy
55.7%
Public administration
44.8%
Bachelor’s degree holder, all majors
35.1%
Pre-law and legal studies
All law and public policy majors
Criminal justice and fire protection
30.6%
24.2%
20.7%
Source: Georgetown University Center on Education and the Workforce analysis of U.S. Census Bureau, American Community Survey
micro data, 2009-2013.
FIGURE 3.71 | Graduate degree holders who majored in public policy earn $92,000 annually, the highest
among graduate degree holders who majored in law and public policy fields.
Median annual wages of graduate degree holders with law and public policy majors (ages 25-59)
by major subgroup (2013$)
Public policy
$92,000
Graduate degree holder, all majors
$78,000
Pre-law and legal studies
$78,000
Public administration
$75,000
All law and public policy majors
Criminal justice and fire protection
Bachelor’s degree holder, all majors
$73,000
$70,000
$61,000
Source: Georgetown University Center on Education and the Workforce analysis of U.S. Census Bureau, American Community Survey
micro data, 2009-2013.
110
PART THREE | THE
THEECONOMIC
ECONOMICVALUE
VALUEOF
OFCOLLEGE
COLLEGE MAJORS
AGRICULTURE AND
LAW
NATURAL
ANDINTRODUCTION
PUBLIC
RESOURCES
POLICY
FIGURE 3.72 | The top 25 percent of graduate degree holders with a public policy major earn more than
$140,000 annually, while the bottom 25 percent of graduate degree holders with a criminal
justice and fire protection major earn less than $50,000 annually.
Interquartile range of annual wages of graduate degree holders with law and public policy majors (ages 25-59) by major subgroup (2013$)
Public policy
Public administration
Bachelor’s degree holder, all majors
Criminal justice and fire protection
All law and public policy majors
Pre-law and legal studies
High school graduate
IN THOUSANDS:
25th Percentile
$10
$30
Median
$50
$70
$90
$110
$130
$150
75th Percentile
Source: Georgetown University Center on Education and the Workforce analysis of U.S. Census Bureau, American Community Survey
micro data, 2009-2013.
111
THE ECONOMIC VALUE OF COLLEGE MAJORS MAJORS | PART THREE
AGRICULTURE
LAW AND PUBLIC
ANDPOLICY
NATURAL RESOURCES
INTRODUCTION
TABLE 3.12 | Graduate degree holders with law or public policy majors, on average,
earn a 35 percent wage premium.
Major group
Median annual wages of
college-educated workers
(ages 25-59) with law or
public policy majors (2013$)
Graduate degree wage
premium (2013$)
Bachelor’s
Graduate
$
%
All majors
61,000
78,000
17,000
28
All law or public
policy majors
54,000
73,000
19,000
35
Pre-law and legal studies
51,000
78,000
27,000
53
Public policy
65,000
92,000
27,000
42
Criminal justice and
fire protection
54,000
70,000
16,000
30
Public administration
62,000
75,000
13,000
21
Major subgroups
Source: Georgetown University Center on Education and the Workforce analysis of U.S. Census Bureau,
American Community Survey micro data, 2009-2013.
112
PART THREE | THE
THEECONOMIC
ECONOMICVALUE
VALUEOF
OFCOLLEGE
COLLEGE MAJORS
AGRICULTURE AND
LAW
NATURAL
ANDINTRODUCTION
PUBLIC
RESOURCES
POLICY
PHYSICAL SCIENCES
SHARE OF ALL MAJORS
2.5
%
GRADUATE DEGREE ATTAINMENT
50
%
113
THE ECONOMIC VALUE OF COLLEGE MAJORS MAJORS | PART THREE
PHYSICAL
AGRICULTURE
SCIENCES
AND NATURAL RESOURCES
INTRODUCTION
Prevalence of major subgroups in the field of physical sciences
FIGURE 3.73 | Multi-disciplinary or general science majors comprise nearly half of all physical
sciences majors.
Share of college graduates with physical sciences majors (ages 25-59) by major subgroup, 2013
46.1%
Multi-disciplinary or general science
26.0%
Chemistry
Geology and earth science
10.7%
Physics
10.3%
Nuclear, industrial radiology, and
biological technologies
2.1%
Atmospheric sciences and meteorology
1.6%
Oceanography
1.1%
Geosciences
.9%
Physical sciences
.9%
Source: Georgetown University Center on Education and the Workforce analysis of U.S. Census Bureau, American Community Survey
micro data, 2009-2013.
Note: Percentages may not sum to 100 percent due to rounding.
114
PART THREE | THE
THEECONOMIC
ECONOMICVALUE
VALUEOF
OFCOLLEGE
COLLEGE MAJORS
AGRICULTURE AND NATURAL
PHYSICAL
RESOURCES
SCIENCES
INTRODUCTION
FIGURE 3.74 | Physics majors earn $81,000 annually, the highest among physical sciences majors.
Median annual wages of college-educated workers with physical sciences majors (ages 25-59)
by major subgroup (2013$)
$81,000
Physics
Oceanography
$69,000
Geology and earth science
$69,000
Atmospheric sciences and meteorology
$66,000
Nuclear, industrial radiology, and
biological technologies
$66,000
All physical sciences majors
$65,000
Chemistry
$64,000
Geosciences
$64,000
$62,000
Physical sciences
Bachelor’s degree holder, all majors
$61,000
Multi-disciplinary or general science
$61,000
High school graduate
$36,000
Source: Georgetown University Center on Education and the Workforce analysis of U.S. Census Bureau, American Community Survey
micro data, 2009-2013.
115
THE ECONOMIC VALUE OF COLLEGE MAJORS MAJORS | PART THREE
PHYSICAL
AGRICULTURE
SCIENCES
AND NATURAL RESOURCES
INTRODUCTION
FIGURE 3.75 | The top 25 percent of physics majors earn more than $115,000 annually.
Interquartile range of annual wages of college-educated workers with physical sciences majors
(ages 25-59) by major subgroup (2013$)
Physics
Oceanography
Geology and earth science
Atmospheric sciences and meteorology
Nuclear, industrial radiology,
and biological technologies
All physical sciences majors
Chemistry
Geosciences
Physical sciences
Bachelor’s degree holder, all majors
Multi-disciplinary or general science
High school graduate
IN THOUSANDS:
25th Percentile
$0
$20
Median
$40
$60
$80
$100
$120
$140
75th Percentile
Source: Georgetown University Center on Education and the Workforce analysis of U.S. Census Bureau, American Community Survey
micro data, 2009-2013.
116
PART THREE | THE
THEECONOMIC
ECONOMICVALUE
VALUEOF
OFCOLLEGE
COLLEGE MAJORS
AGRICULTURE AND NATURAL
PHYSICAL
RESOURCES
SCIENCES
INTRODUCTION
FIGURE 3.76 | Physics majors are nearly twice as likely to earn a graduate degree as the average
college graduate.
Graduate degree attainment of college graduates with physical sciences majors (ages 25-59)
by major subgroup, 2013
67.0%
Physics
61.7%
Chemistry
53.1%
Geosciences
50.0%
All physical sciences majors
Nuclear, industrial radiology, and
biological technologies
47.0%
45.8%
Geology and earth science
44.4%
Atmospheric sciences and meteorology
Oceanography
43.8%
Physical sciences
43.5%
Bachelor’s degree holder, all majors
Multi-disciplinary or general science
35.1%
32.0%
Source: Georgetown University Center on Education and the Workforce analysis of U.S. Census Bureau, American Community Survey
micro data, 2009-2013.
117
THE ECONOMIC VALUE OF COLLEGE MAJORS MAJORS | PART THREE
PHYSICAL
AGRICULTURE
SCIENCES
AND NATURAL RESOURCES
INTRODUCTION
FIGURE 3.78 | The top 25 percent of graduate degree holders who majored in chemistry earn more than
$150,000 annually, while the bottom 25 percent of graduate degree holders with atmospheric
sciences and meteorology majors earn less than $60,000 annually.
Interquartile range of annual wages of graduate degree holders with physical sciences majors
(ages 25-59) by major subgroup (2013$)
Chemistry
Physics
Geosciences
Nuclear, industrial radiology,
and biological technologies
All physical sciences majors
Oceanography
Geology and earth science
Multi-disciplinary or general science
Atmospheric sciences and meteorology
Physical sciences
Graduate degree holder, all majors
Bachelor’s degree holder, all majors
IN THOUSANDS:
25th Percentile
$0
$20
Median
$40
$60
$80
$100
$120
$140
$160
75th Percentile
Source: Georgetown University Center on Education and the Workforce analysis of U.S. Census Bureau, American Community Survey
micro data, 2009-2013.
118
$180
PART THREE | THE
THEECONOMIC
ECONOMICVALUE
VALUEOF
OFCOLLEGE
COLLEGE MAJORS
AGRICULTURE AND NATURAL
PHYSICAL
RESOURCES
SCIENCES
INTRODUCTION
TABLE 3.13 | Graduate degree holders with physical sciences, on average, earn a 35 percent
wage premium.
Major group
Median annual wages of
college-educated workers
(ages 25-59) with physical
sciences majors (2013$)
Graduate degree wage
premium (2013$)
Bachelor’s
Graduate
$
%
All majors
61,000
78,000
17,000
28
All physical sciences majors
65,000
97,000
32,000
49
Chemistry
64,000
104,000
40,000
63
Geosciences
64,000
98,000
34,000
53
Nuclear, industrial
radiology, and biological
technologies
66,000
97,000
31,000
47
Multi-disciplinary or
general science
61,000
87,000
26,000
43
Oceanography
69,000
91,000
22,000
32
Physical sciences
62,000
79,000
17,000
27
Atmospheric sciences
and meteorology
66,000
84,000
18,000
27
Geology and earth science
69,000
87,000
18,000
26
Physics
81,000
101,000
20,000
25
Major subgroups
Source: Georgetown University Center on Education and the Workforce analysis of U.S. Census Bureau,
American Community Survey micro data, 2009-2013.
119
THE ECONOMIC VALUE OF COLLEGE MAJORS MAJORS | PART THREE
PHYSICAL
AGRICULTURE
SCIENCES
AND NATURAL RESOURCES
INTRODUCTION
120
PART THREE | THE
THEECONOMIC
ECONOMICVALUE
VALUEOF
OFCOLLEGE
COLLEGE MAJORS
AGRICULTURE AND NATURAL
PHYSICAL
RESOURCES
SCIENCES
INTRODUCTION
PSYCHOLOGY AND SOCIAL WORK
SHARE OF ALL MAJORS
5.2
%
GRADUATE DEGREE ATTAINMENT
45.3
%
121
THE ECONOMIC VALUE OF COLLEGE MAJORS MAJORS | PART THREE
AGRICULTURE
PSYCHOLOGY AND SOCIAL
NATURAL
WORK
RESOURCES
INTRODUCTION
Prevalence of major subgroups in the fields
of psychology and social work
FIGURE 3.79 | Psychology majors comprise four out of five college graduates with psychology or
social work majors.
Share of college graduates with psychology and social work majors (ages 25-59) by major
subgroup, 2013
78.2%
Psychology
16.1%
Social work
Human services and community organization
4.3%
Industrial and organizational psychology
.9%
Social psychology
.4%
Source: Georgetown University Center on Education and the Workforce analysis of U.S. Census Bureau, American Community Survey
micro data, 2009-2013.
122
PART THREE | THE
THEECONOMIC
ECONOMICVALUE
VALUEOF
OFCOLLEGE
COLLEGE MAJORS
AGRICULTURE
PSYCHOLOGY
AND NATURAL
AND
SOCIAL
RESOURCES
WORK
INTRODUCTION
FIGURE 3.80 | Industrial and organizational psychology majors earn $66,000 annually, the highest among
psychology and social work majors.
Median annual wages of college-educated workers with psychology and social work majors
(ages 25-59) by major subgroup (2013$)
Industrial and organizational psychology
$66,000
Bachelor’s degree holder, all majors
$61,000
Social psychology
$51,000
Psychology
$49,000
All psychology and social work majors
Social work
Human services and community
organization
High school graduate
$47,000
$42,000
$41,000
$36,000
Source: Georgetown University Center on Education and the Workforce analysis of U.S. Census Bureau, American Community Survey
micro data, 2009-2013.
123
THE ECONOMIC VALUE OF COLLEGE MAJORS MAJORS | PART THREE
AGRICULTURE
PSYCHOLOGY AND SOCIAL
NATURAL
WORK
RESOURCES
INTRODUCTION
FIGURE 3.81 | The top 25 percent of industrial and organizational psychology majors earn more than
$90,000 annually, while the bottom 25 percent of human services and community
organization majors earn less than $35,000 annually.
Interquartile range of annual wages of college-educated workers with psychology and social work
majors (ages 25-59) by major subgroup (2013$)
Industrial and organizational psychology
Bachelor’s degree holder, all majors
Social psychology
Psychology
All psychology and social work majors
Social work
Human services and community organization
High school graduate
IN THOUSANDS:
25th Percentile
$10
$20
Median
$30
$40
$50
$60
$70
$80
$90
75th Percentile
Source: Georgetown University Center on Education and the Workforce analysis of U.S. Census Bureau, American Community Survey
micro data, 2009-2013.
124
$100
PART THREE | THE
THEECONOMIC
ECONOMICVALUE
VALUEOF
OFCOLLEGE
COLLEGE MAJORS
AGRICULTURE
PSYCHOLOGY
AND NATURAL
AND
SOCIAL
RESOURCES
WORK
INTRODUCTION
FIGURE 3.82 | Among psychology and social work majors, psychology majors are the most likely to earn
a graduate degree, while human services and community organization majors are the
least likely.
Graduate degree attainment of college graduates with psychology and social work majors (ages 25-59)
by major subgroup, 2013
Psychology
46.1%
All psychology and social work majors
45.3%
Social work
45.3%
Industrial and organizational psychology
42.7%
Social psychology
38.9%
Bachelor’s degree holder, all majors
Human services and
community organization
35.1%
27.0%
Source: Georgetown University Center on Education and the Workforce analysis of U.S. Census Bureau, American Community Survey
micro data, 2009-2013.
125
THE ECONOMIC VALUE OF COLLEGE MAJORS MAJORS | PART THREE
AGRICULTURE
PSYCHOLOGY AND SOCIAL
NATURAL
WORK
RESOURCES
INTRODUCTION
FIGURE 3.83 | Graduate degree holders who majored in industrial and organizational psychology earn
$83,000 annually, while those who majored in human services and community organization
earn $54,000 annually.
Median annual wages of graduate degree holders with psychology and social work majors (ages 25-59)
by major subgroup (2013$)
Industrial and organizational psychology
$83,000
Graduate degree holder, all majors
$78,000
Social psychology
$70,000
Psychology
All psychology and social work majors
Bachelor’s degree holder, all majors
Social work
Human services and community organization
$65,000
$62,000
$61,000
$55,000
$54,000
Source: Georgetown University Center on Education and the Workforce analysis of U.S. Census Bureau, American Community Survey
micro data, 2009-2013.
126
PART THREE | THE
THEECONOMIC
ECONOMICVALUE
VALUEOF
OFCOLLEGE
COLLEGE MAJORS
AGRICULTURE
PSYCHOLOGY
AND NATURAL
AND
SOCIAL
RESOURCES
WORK
INTRODUCTION
FIGURE 3.84 | The top 25 percent of graduate degree holders who majored in industrial and organizational
psychology earn $110,000 or more annually, while the bottom 25 percent of graduate degree
holders who majored in social work earn less than $45,000 annually.
Interquartile range of annual wages of graduate degree holders with psychology and social work
majors (ages 25-59) by major subgroup (2013$)
Industrial and organizational psychology
Graduate degree holder, all majors
Social psychology
Psychology
All psychology and social work majors
Bachelor’s degree holder, all majors
Social work
Human services and community organization
IN THOUSANDS:
25th Percentile
$0
$30
Median
$40
$50
$60
$70
$80
$90 $100 $110
$120 $130
75th Percentile
Source: Georgetown University Center on Education and the Workforce analysis of U.S. Census Bureau, American Community Survey
micro data, 2009-2013.
127
THE ECONOMIC VALUE OF COLLEGE MAJORS MAJORS | PART THREE
AGRICULTURE
PSYCHOLOGY AND SOCIAL
NATURAL
WORK
RESOURCES
INTRODUCTION
TABLE 3.14 | Social psychology majors receive a 37 percent wage premium from a
graduate degree, the largest among psychology and social work majors.
Major group
Median annual wages of
college-educated workers (ages
25-59) with psychology and
social work majors (2013$)
Graduate degree wage
premium (2013$)
Bachelor’s
Graduate
$
%
All majors
61,000
78,000
17,000
28
All psychology and
social work majors
47,000
62,000
15,000
32
Social psychology
51,000
70,000
19,000
37
Psychology
49,000
65,000
16,000
33
Human services and
community organization
41,000
54,000
13,000
32
Social work
42,000
55,000
13,000
31
Industrial and
organizational psychology
65,000
79,000
14,000
22
Major subgroups
Source: Georgetown University Center on Education and the Workforce analysis of U.S. Census Bureau,
American Community Survey micro data, 2009-2013.
128
PART THREE | THE
THEECONOMIC
ECONOMICVALUE
VALUEOF
OFCOLLEGE
COLLEGE MAJORS
AGRICULTURE
PSYCHOLOGY
AND NATURAL
AND
SOCIAL
RESOURCES
WORK
INTRODUCTION
SOCIAL SCIENCES
SHARE OF ALL MAJORS
6.9
%
GRADUATE DEGREE ATTAINMENT
41.2
%
129
THE ECONOMIC VALUE OF COLLEGE MAJORS MAJORS | PART THREE
AGRICULTURE
SOCIAL SCIENCE
AND NATURAL RESOURCES
INTRODUCTION
Prevalence of major subgroups in the field of social sciences
FIGURE 3.85 | Three major subgroups – political science and government, economics, and sociology–
comprise 77 percent of social sciences majors.
Share of college graduates with social sciences majors (ages 25-59) by major subgroup, 2013
27.4%
Political science and government
27.0%
Economics
22.9%
Sociology
5.3%
Anthropology and archeology
Geography
4.5%
General social sciences
4.2%
International relations
2.9%
Criminology
2.9%
Interdisciplinary social sciences
Miscellaneous social sciences
2.3%
.6%
Source: Georgetown University Center on Education and the Workforce analysis of U.S. Census Bureau, American Community Survey
micro data, 2009-2013.
Note: Percentages may not sum to 100 percent due to rounding.
130
PART THREE | THE
THEECONOMIC
ECONOMICVALUE
VALUEOF
OFCOLLEGE
COLLEGE MAJORS
AGRICULTURE AND NATURAL
SOCIAL
RESOURCES
SCIENCE
INTRODUCTION
FIGURE 3.86 | Economics majors earn $76,000 annually, the highest among social sciences majors.
Median annual wages of college-educated workers with social sciences majors (ages 25-59) by major
subgroup (2013$)
$76,000
Economics
$64,000
Political science and government
$62,000
International relations
Bachelor’s degree holder, all majors
$61,000
All social sciences majors
$60,000
$58,000
Geography
$57,000
Miscellaneous social sciences
$54,000
Criminology
$53,000
General social sciences
$51,000
Sociology
Anthropology and archeology
$49,000
Interdisciplinary social sciences
$49,000
High school graduate
$36,000
Source: Georgetown University Center on Education and the Workforce analysis of U.S. Census Bureau, American Community Survey
micro data, 2009-2013.
131
THE ECONOMIC VALUE OF COLLEGE MAJORS MAJORS | PART THREE
AGRICULTURE
SOCIAL SCIENCE
AND NATURAL RESOURCES
INTRODUCTION
FIGURE 3.87 | The top 25 percent of economics majors earn more than $115,000 annually, while the bottom
25 percent of anthropology and archaeology majors earn less than $35,000.
Interquartile range of annual wages of graduate degree holders with physical sciences majors
(ages 25-59) by major subgroup (2013$)
Economics
Political science and government
International relations
Bachelor’s degree holder, all majors
All social sciences majors
Geography
Miscellaneous social sciences
Criminology
General social sciences
Sociology
Anthropology and archeology
Interdisciplinary social sciences
High school graduate
IN THOUSANDS:
25th Percentile
$0
$20
Median
$40
$60
$80
$100
$120
$140
75th Percentile
Source: Georgetown University Center on Education and the Workforce analysis of U.S. Census Bureau, American Community Survey
micro data, 2009-2013.
132
PART THREE | THE
THEECONOMIC
ECONOMICVALUE
VALUEOF
OFCOLLEGE
COLLEGE MAJORS
AGRICULTURE AND NATURAL
SOCIAL
RESOURCES
SCIENCE
INTRODUCTION
FIGURE 3.88 | More than half of international relations majors earn a graduate degree, the highest among
social sciences majors. social sciences majors.
Graduate degree attainment of college graduates with social sciences majors (ages 25-59) by
major subgroup, 2013
50.8%
International relations
48.7%
Political science and government
47.4%
Miscellaneous social sciences
44.0%
Anthropology and archeology
Economics
41.3%
All social sciences majors
41.2%
35.1%
Bachelor’s degree holder, all majors
Interdisciplinary social sciences
33.5%
Sociology
33.5%
32.4%
General social sciences
29.5%
Geography
Criminology
21.9%
Source: Georgetown University Center on Education and the Workforce analysis of U.S. Census Bureau, American Community Survey
micro data, 2009-2013.
Outcomes for graduate degree holders in the field of social sciences
133
THE ECONOMIC VALUE OF COLLEGE MAJORS MAJORS | PART THREE
AGRICULTURE
SOCIAL SCIENCE
AND NATURAL RESOURCES
INTRODUCTION
FIGURE 3.89 | Graduate degree holders who majored in economics earn $109,000 annually, the highest
among graduate degree holders who majored in social sciences fields.
Median annual wages of graduate degree holders with social sciences majors (ages 25-59) by
major subgroup (2013$)
$109,000
Economics
$96,000
Political science and government
$90,000
International relations
$87,000
All social sciences majors
$82,000
Miscellaneous social sciences
Graduate degree holder, all majors
$78,000
Geography
$78,000
Criminology
$71,000
General social sciences
$68,000
Interdisciplinary social sciences
$68,000
Anthropology and archeology
$66,000
Sociology
$65,000
Bachelor’s degree holder, all majors
$61,000
Source: Georgetown University Center on Education and the Workforce analysis of U.S. Census Bureau, American Community Survey
micro data, 2009-2013.
134
PART THREE | THE
THEECONOMIC
ECONOMICVALUE
VALUEOF
OFCOLLEGE
COLLEGE MAJORS
AGRICULTURE AND NATURAL
SOCIAL
RESOURCES
SCIENCE
INTRODUCTION
FIGURE 3.90 | The top 25 percent of graduate-degree holders who majored in economics earn more than
$175,000 annually, while the bottom 25 percent of graduate degree holders who majored in
sociology earn less than $50,000 annually.
Interquartile range of annual wages of graduate degree holders with social sciences majors
(ages 25-59) by major subgroup (2013$)
Economics
Political science and government
International relations
All social sciences majors
Miscellaneous social sciences
Graduate degree holder, all majors
Geography
Criminology
General social sciences
Interdisciplinary social sciences
Anthropology and archeology
Sociology
Bachelor’s degree holder, all majors
IN THOUSANDS:
25th Percentile
$10
$30
Median
$50
$70
$90
$110
$130
$150
$170
$190
75th Percentile
Source: Georgetown University Center on Education and the Workforce analysis of U.S. Census Bureau, American Community Survey
micro data, 2009-2013.
135
THE ECONOMIC VALUE OF COLLEGE MAJORS MAJORS | PART THREE
AGRICULTURE
SOCIAL SCIENCE
AND NATURAL RESOURCES
INTRODUCTION
TABLE 3.15 | Graduate degree holders with social sciences majors, on average,
earn a 35 percent wage premium.
Major group
Median annual wages of
college-educated workers
(ages 25-59) with social
sciences majors (2013$)
Graduate degree wage
premium (2013$)
Bachelor’s
Graduate
$
%
All majors
61,000
78,000
17,000
28
All social sciences majors
60,000
87,000
27,000
45
Political science and
government
64,000
96,000
32,000
50
International relations
62,000
90,000
28,000
45
Miscellaneous
social sciences
57,000
82,000
25,000
44
Economics
76,000
109,000
33,000
43
Interdisciplinary
social sciences
49,000
68,000
19,000
39
Anthropology and
archeology
49,000
66,000
17,000
35
Geography
58,000
78,000
20,000
34
Criminology
54,000
71,000
17,000
31
General social sciences
53,000
68,000
15,000
28
Sociology
51,000
65,000
14,000
27
Major subgroups
Source: Georgetown University Center on Education and the Workforce analysis of U.S. Census Bureau,
American Community Survey micro data, 2009-2013.
136
PART THREE | THE
THEECONOMIC
ECONOMICVALUE
VALUEOF
OFCOLLEGE
COLLEGE MAJORS
AGRICULTURE AND NATURAL
SOCIAL
RESOURCES
SCIENCE
INTRODUCTION
APPENDIX ONE
References, Data Sources, and Methodology
137
THE
APPENDIX
ECONOMIC
ONE VALUE OF COLLEGE MAJORS MAJORS | PART THREE
AGRICULTURE
REFERENCES / AND
DATANATURAL
SOURCESRESOURCES
AND METHODOLOGY
INTRODUCTION
References
Autor, David, Lawrence Katz, and Melissa Kearney. The Polarization of the U.S. Labor Market,
NBER Working Paper No. 11986. Boston: National Bureau of Economic Research, 2006.
Carnevale, Anthony P., Nicole Smith and Jeff Strohl. Recovery: Job Growth and Education Requirements Through 2020.
Washington, D.C.: Center on Education and the Workforce, 2014, http://cew.georgetown.edu/recovery2020.
Jorgenson, Dale W. and Barbara M. Fraumeni. “The Output of the Education Sector.” Output Measurement
In the Services Sector, edited by Zvi Griliches. Chicago: University of Chicago Press, 1992.
U.S. Census Bureau, American Community Survey (ACS): [Years]: one-year person
level micro data files, available at http://www2.census.gov/
138
PART THREE | THE
THEECONOMIC
ECONOMICVALUE
VALUEOF
OFCOLLEGE
COLLEGE
APPENDIX
MAJORS
ONE
REFERENCES
AGRICULTURE
/ DATA SOURCES
AND NATURAL
AND METHODOLOGY
RESOURCES
INTRODUCTION
Data Sources and Methodology
Data source: American Community Survey (one-year files) micro data 2009-2013.9 The sample consists of fulltime full-year workers between the ages of 21 and 59. Data from four years is pooled for all analyses except
those showing yearly changes. Results on earnings are restricted to full-time full-year workers with positive
earnings. Earnings are adjusted to 2013 levels using the Consumer Price Index Research Series (CPI-U-RS).10
The data on major field of study are part of the American Community Survey long form and is coded
by the Census Bureau.11 This list can be downloaded from the Census Bureau website. The majors
that are listed in the report appear on the College Board website12 as “This major often leads to the
Bachelor’s degree.” Majors that are listed as “This program most often leads to a graduate degree“
or “This major is most often offered at the certificate and Associate’s degree levels” are collapsed
as detailed below. Majors that are not listed on the College Board website are also collapsed.
In some cases, the Census Bureau has combined majors at the data collection level, which does not allow
us separately to identify the earnings for each major. These include but are not limited to philosophy and
religious studies, pharmacy and pharmaceutical sciences and administration, and French, German, Latin and
other common foreign languages. In some cases, majors that are combined are usually offered at different
levels such as cosmetology services and culinary arts. Cosmetology is usually offered at the Associate’s
degree level while culinary arts is also available at the Bachelor’s degree level. Unfortunately, the earnings
of each major cannot be separately identified. In this report, the following aggregations are used:
ww Miscellaneous agriculture includes agriculture production and management;
ww Biomedical engineering includes biological engineering;
ww General engineering includes materials engineering and materials
science, naval architecture, and nuclear engineering;
ww Miscellaneous engineering technologies includes electrical engineering technologies;
ww Fine arts includes miscellaneous fine arts;
9 http://www.census.gov/acs/www/data_documentation/pums_data/
10 http://www.bls.gov/cpi/cpiurs.htm
11 http://www.census.gov/acs/www/data_documentation/pums_documentation/
12 https://bigfuture.collegeboard.org/explore-careers/college-majors
139
THE
APPENDIX
ECONOMIC
ONE VALUE OF COLLEGE MAJORS MAJORS | PART THREE
AGRICULTURE
REFERENCES / AND
DATANATURAL
SOURCESRESOURCES
AND METHODOLOGY
INTRODUCTION
ww Miscellaneous biology includes genetics, pharmacology, and physiology;
ww Mass media is combined with communications;
ww Communication technologies, computer administration management and security, and
computer networking and telecommunications are combined into miscellaneous computer;
ww Miscellaneous education includes educational administration and supervision, school
student counseling, and library science (these are presented for completeness) ;
ww Miscellaneous health includes community and public health, general medical and
health services, medical assisting services, and medical technologies technician;
ww History includes United States history;
ww Miscellaneous industrial arts and consumer services includes cosmetology
services and culinary arts, construction services, electrical and mechanical
repairs and technologies, precision production, and industrial arts;
ww Nuclear, industrial radiology, and biological technologies includes materials science; and
ww Educational psychology, clinical psychology, counseling psychology, cognitive
psychology, and miscellaneous psychology are included in psychology.
Sample size and representativeness
The minimum sample size to be considered for inclusion is 100. This corresponds roughly to a ratio
of the estimated standard error to the cell percentage of 15 percent. While the American Community
Survey can be considered a representative sample of individuals in the United States, the sample is not
necessarily representative of those who chose those majors in their undergraduate education.
Educational attainment for Bachelor’s degree holders is not further differentiated among those
who received a Bachelor of Science, Bachelor of Arts or other specialized Bachelor’s degrees.
140
PART THREE | THE
THEECONOMIC
ECONOMICVALUE
VALUEOF
OFCOLLEGE
COLLEGE
APPENDIX
MAJORS
ONE
REFERENCES
AGRICULTURE
/ DATA SOURCES
AND NATURAL
AND METHODOLOGY
RESOURCES
INTRODUCTION
APPENDIX TWO
Classification of Major Groups and Subgroups
141
THE
APPENDIX
ECONOMIC
ONE
TWO VALUE OF COLLEGE MAJORS MAJORS | PART THREE
AGRICULTURE
REFERENCES / AND
CLASSIFICATION
DATA
OFNATURAL
SOURCES
MAJOR GROUPS
RESOURCES
AND METHODOLOGY
AND SUBGROUPS
INTRODUCTION
Classification of Major Groups and Subgroups
15 MAJOR GROUPS
Agriculture and natural resources
137 MAJOR SUBGROUPS
Agricultural economics
Animal sciences
Food science
Forestry
General agriculture
Miscellaneous agriculture
Natural resources management
Plant science and agronomy
Architecture and engineering
Aerospace engineering
Architectural engineering
Architecture
Biomedical engineering
Chemical engineering
Civil engineering
Electrical engineering
Engineering and industrial management
Engineering mechanics, physics, and science
Engineering technologies
Environmental engineering
General engineering
Geological and geophysical engineering
Industrial and manufacturing engineering
Industrial production technologies
Mechanical engineering
Mechanical engineering-related technologies
Metallurgical engineering
Mining and mineral engineering
Miscellaneous engineering
Miscellaneous engineering technologies
Petroleum engineering
142
PART THREE | THE
THEECONOMIC
ECONOMICVALUE
VALUEOF
OFCOLLEGE
COLLEGE
APPENDIX
APPENDIX
MAJORS
TWO
ONE
CLASSIFICATION
REFERENCES
AGRICULTURE
/ OF
DATA
MAJOR
SOURCES
AND
GROUPS
NATURAL
ANDAND
METHODOLOGY
SUBGROUPS
RESOURCES
INTRODUCTION
Arts
Commercial art and graphic design
Drama and theater arts
Film, video, and photographic arts
Fine arts
Music
Studio arts
Visual and performing arts
Biology and life sciences
Biochemical sciences
Biology
Botany
Ecology
Environmental science
Microbiology
Miscellaneous biology
Molecular biology
Neuroscience
Zoology
Business
Accounting
Business economics
Business management and administration
Finance
General business
Hospitality management
Human resources and personnel management
International business
Management information systems and statistics
Marketing and marketing research
Miscellaneous business and
medical administration
Operations logistics and e-commerce
143
THE
APPENDIX
ECONOMIC
ONE
TWO VALUE OF COLLEGE MAJORS MAJORS | PART THREE
AGRICULTURE
REFERENCES / AND
CLASSIFICATION
DATA
OFNATURAL
SOURCES
MAJOR GROUPS
RESOURCES
AND METHODOLOGY
AND SUBGROUPS
INTRODUCTION
Communications and journalism
Advertising and public relations
Communications and mass media
Journalism
Computers, statistics,
and mathematics
Applied mathematics
Computer and information systems
Computer engineering
Computer science
Information sciences
Mathematics
Miscellaneous computer
Statistics and decision science
Education
Art and music education
Early childhood education
Elementary education
General education
Language and drama education
Mathematics teacher education
Miscellaneous education
Physical and health education teaching
Science and computer teacher education
Secondary teacher education
Social sciences or history teacher education
Special needs education
Teacher education: multiple levels
144
PART THREE | THE
THEECONOMIC
ECONOMICVALUE
VALUEOF
OFCOLLEGE
COLLEGE
APPENDIX
APPENDIX
MAJORS
TWO
ONE
CLASSIFICATION
REFERENCES
AGRICULTURE
/ OF
DATA
MAJOR
SOURCES
AND
GROUPS
NATURAL
ANDAND
METHODOLOGY
SUBGROUPS
RESOURCES
INTRODUCTION
Health
Communication disorders sciences and services
Health and medical administrative services
Health and medical preparatory programs
Miscellaneous health medical professions
Nursing
Nutrition sciences
Pharmacy pharmaceutical
sciences, and administration
Treatment therapy professions
Humanities and liberal arts
Area ethnic and civilization studies
Art history and criticism
Composition and speech
English language and literature
French, German, Latin, and other
common foreign language studies
History
Humanities
Intercultural and international studies
Liberal arts
Linguistics and comparative
language and literature
Multi/interdisciplinary studies
Other foreign languages
Philosophy and religious studies
Theology and religious vocations
Industrial arts, consumer
services, and recreation
Family and consumer sciences
Miscellaneous industrial arts
and consumer services
Physical fitness parks recreation and leisure
Transportation sciences and technologies
145
THE
APPENDIX
ECONOMIC
ONE
TWO VALUE OF COLLEGE MAJORS MAJORS | PART THREE
AGRICULTURE
REFERENCES / AND
CLASSIFICATION
DATA
OFNATURAL
SOURCES
MAJOR GROUPS
RESOURCES
AND METHODOLOGY
AND SUBGROUPS
INTRODUCTION
Law and public policy
Criminal justice and fire protection
Pre-law and legal studies
Public administration
Public policy
Physical sciences
Atmospheric sciences and meteorology
Chemistry
Geology and earth science
Geosciences
Multi-disciplinary or general science
Nuclear, industrial radiology, and
biological technologies
Oceanography
Physical sciences
Physics
Psychology and social work
Human services and community organization
Industrial and organizational psychology
Psychology
Social psychology
Social work
Social sciences
Anthropology and archaeology
Criminology
Economics
General social sciences
Geography
Interdisciplinary social sciences
International relations
Miscellaneous social sciences
Political science and government
Sociology
146
PART THREE | THE
THEECONOMIC
ECONOMICVALUE
VALUEOF
OFCOLLEGE
COLLEGE
APPENDIX
APPENDIX
MAJORS
TWO
ONE
CLASSIFICATION
REFERENCES
AGRICULTURE
/ OF
DATA
MAJOR
SOURCES
AND
GROUPS
NATURAL
ANDAND
METHODOLOGY
SUBGROUPS
RESOURCES
INTRODUCTION
APPENDIX THREE
Major subgroups ranked by median annual wages
147
APPENDIX
THE
ECONOMIC
THREE
ONE VALUE OF COLLEGE MAJORS MAJORS | PART THREE
MAJOR
AGRICULTURE
REFERENCES
SUBGROUPS
/ AND
DATANATURAL
SOURCES
RANKED RESOURCES
BY
AND
MEDIAN
METHODOLOGY
ANNUAL WAGES
INTRODUCTION
Major subgroups ranked by median annual wages
RANK
148
MAJOR SUBGROUP
MEDIAN ANNUAL WAGES OF
COLLEGE-EDUCATED WORKERS
(AGES 25-59) (2013$)
1
Petroleum engineering
136,000
2
Pharmacy, pharmaceutical sciences,
and pharmaceutical administration
113,000
3
Metallurgical engineering
98,000
4
Mining and mineral engineering
97,000
5
Chemical engineering
96,000
6
Electrical engineering
93,000
7
Aerospace engineering
90,000
8
Mechanical engineering
87,000
9
Computer engineering
87,000
10
Geological and geophysical engineering
87,000
11
Computer science
83,000
12
Civil engineering
83,000
13
Applied mathematics
83,000
14
Industrial and manufacturing engineering
81,000
15
Physics
81,000
16
General engineering
81,000
17
Engineering mechanics, physics, and science
81,000
18
Architectural engineering
80,000
19
Engineering and industrial management
78,000
20
Statistics and decision science
78,000
21
Management information
systems and statistics
77,000
22
Environmental engineering
76,000
23
Miscellaneous engineering
76,000
24
Economics
76,000
25
Business economics
75,000
26
Industrial production technologies
74,000
27
Information sciences
73,000
PART THREE | THE
THEECONOMIC
ECONOMICVALUE
VALUEOF
OFCOLLEGE
COLLEGE
APPENDIX
APPENDIX
MAJORS
THREE
ONE
MAJORREFERENCES
SUBGROUPS
AGRICULTURE
/ DATA
RANKED
SOURCES
BY
AND
MEDIAN
NATURAL
AND METHODOLOGY
ANNUAL
RESOURCES
WAGES
INTRODUCTION
28
Transportation sciences and technologies
73,000
29
Mathematics
73,000
30
Finance
73,000
31
Miscellaneous engineering technologies
72,000
32
Operations logistics and e-commerce
71,000
33
Biomedical engineering
70,000
34
Computer and information systems
69,000
35
Geology and earth science
69,000
36
Oceanography
69,000
37
Mechanical engineering-related technologies
69,000
38
Accounting
69,000
39
Agricultural economics
67,000
40
Food science
67,000
41
Architecture
67,000
42
Atmospheric sciences and meteorology
66,000
43
Engineering technologies
66,000
44
Nuclear, industrial radiology, and
biological technologies
66,000
45
Industrial and organizational psychology
66,000
46
Nursing
66,000
47
Public policy
65,000
48
Treatment therapy professions
65,000
49
General business
65,000
50
Chemistry
64,000
51
Geosciences
64,000
52
Political science and government
64,000
53
Miscellaneous industrial arts
and consumer services
64,000
54
Marketing and marketing research
63,000
55
Forestry
62,000
56
Microbiology
62,000
149
APPENDIX
THE
ECONOMIC
THREE
ONE VALUE OF COLLEGE MAJORS MAJORS | PART THREE
MAJOR
AGRICULTURE
REFERENCES
SUBGROUPS
/ AND
DATANATURAL
SOURCES
RANKED RESOURCES
BY
AND
MEDIAN
METHODOLOGY
ANNUAL WAGES
INTRODUCTION
150
57
Physical sciences
62,000
58
Business management and administration
62,000
59
Public administration
62,000
60
International relations
62,000
61
Multi-disciplinary or general science
61,000
62
International business
60,000
63
Miscellaneous computer
59,000
64
Biochemical sciences
59,000
65
Miscellaneous business and
medical administration
59,000
66
Human resources and personnel management
58,000
67
Geography
58,000
68
Zoology
58,000
69
Miscellaneous social sciences
57,000
70
Miscellaneous agriculture
57,000
71
Environmental science
57,000
72
Miscellaneous health medical professions
56,000
73
Journalism
56,000
74
Biology
56,000
75
Natural resources management
56,000
76
Health and medical administrative services
55,000
77
Communications and mass media
54,000
78
Advertising and public relations
54,000
79
Miscellaneous biology
54,000
80
Criminal justice and fire protection
54,000
81
Health and medical preparatory programs
54,000
82
History
54,000
83
Molecular biology
54,000
84
Criminology
54,000
85
General agriculture
53,000
86
Plant science and agronomy
53,000
PART THREE | THE
THEECONOMIC
ECONOMICVALUE
VALUEOF
OFCOLLEGE
COLLEGE
APPENDIX
APPENDIX
MAJORS
THREE
ONE
MAJORREFERENCES
SUBGROUPS
AGRICULTURE
/ DATA
RANKED
SOURCES
BY
AND
MEDIAN
NATURAL
AND METHODOLOGY
ANNUAL
RESOURCES
WAGES
INTRODUCTION
87
Liberal arts
53,000
88
General social sciences
53,000
89
English language and literature
53,000
90
Miscellaneous education
52,000
91
Hospitality management
52,000
92
French, German, Latin, and other
common foreign language studies
52,000
93
Botany
52,000
94
Intercultural and international studies
52,000
95
Nutrition sciences
52,000
96
Area ethnic and civilization studies
51,000
97
Pre-law and legal studies
51,000
98
Film, video, and photographic arts
51,000
99
Social psychology
51,000
100
Ecology
51,000
101
Physical and health education teaching
51,000
102
Other foreign languages
51,000
103
Philosophy and religious studies
51,000
104
Sociology
51,000
105
Commercial art and graphic design
51,000
106
Linguistics and comparative
language and literature
50,000
107
Animal sciences
49,000
108
Fine arts
49,000
109
Art history and criticism
49,000
110
Humanities
49,000
111
Physical fitness, parks, recreation, and leisure
49,000
112
Psychology
49,000
113
Music
49,000
114
Interdisciplinary social sciences
49,000
115
Anthropology and archeology
49,000
151
APPENDIX
THE
ECONOMIC
THREE
ONE VALUE OF COLLEGE MAJORS MAJORS | PART THREE
MAJOR
AGRICULTURE
REFERENCES
SUBGROUPS
/ AND
DATANATURAL
SOURCES
RANKED RESOURCES
BY
AND
MEDIAN
METHODOLOGY
ANNUAL WAGES
INTRODUCTION
152
116
Mathematics teacher education
49,000
117
Neuroscience
48,000
118
Secondary teacher education
48,000
119
Science and computer teacher education
48,000
120
Social sciences or history teacher education
47,000
121
Composition and speech
47,000
122
Communication disorders
sciences and services
46,000
123
Art and music education
46,000
124
Multi/interdisciplinary studies
46,000
125
General education
46,000
126
Special needs education
45,000
127
Language and drama education
45,000
128
Family and consumer sciences
45,000
129
Drama and theater arts
45,000
130
Elementary education
43,000
131
Theology and religious vocations
43,000
132
Visual and performing arts
42,000
133
Teacher education: multiple levels
42,000
134
Social work
42,000
135
Studio arts
42,000
136
Human services and community organization
41,000
137
Early childhood education
39,000
PART THREE | THE
THEECONOMIC
ECONOMICVALUE
VALUEOF
OFCOLLEGE
COLLEGE
APPENDIX
APPENDIX
MAJORS
THREE
ONE
MAJORREFERENCES
SUBGROUPS
AGRICULTURE
/ DATA
RANKED
SOURCES
BY
AND
MEDIAN
NATURAL
AND METHODOLOGY
ANNUAL
RESOURCES
WAGES
INTRODUCTION
APPENDIX FOUR
Major subgroups ranked by prevalence
153
THE
APPENDIX
ECONOMIC
ONE
FOURVALUE OF COLLEGE MAJORS MAJORS | PART THREE
AGRICULTURE
REFERENCES
MAJOR
SUBGROUPS
/ AND
DATANATURAL
SOURCES
RANKED RESOURCES
BY
AND
PREVALENCE
METHODOLOGY
INTRODUCTION
Major subgroups ranked by prevalence
RANK
154
MAJOR SUBGROUP
MAJORS PER 10,000 COLLEGE
GRADUATES (AGES 25-59)
1
Business management and administration
814
2
General business
539
3
Accounting
463
4
Nursing
448
5
Psychology
404
6
Communications and mass media
352
7
Marketing and marketing research
315
8
General education
287
9
Elementary education
279
10
English language and literature
251
11
Computer science
243
12
Finance
233
13
Criminal justice and fire protection
219
14
Biology
206
15
Political science and government
189
16
Economics
186
17
Electrical engineering
168
18
History
164
19
Liberal arts
162
20
Sociology
158
21
Fine arts
148
22
Commercial art and graphic design
144
23
General engineering
132
24
Mechanical engineering
132
25
Miscellaneous health medical professions
120
26
Multi-disciplinary or general science
114
27
Journalism
111
28
Physical fitness, parks, recreation, and leisure
98
29
Family and consumer sciences
92
PART THREE | THE
THEECONOMIC
ECONOMICVALUE
VALUEOF
OFCOLLEGE
COLLEGE
APPENDIX
APPENDIX
MAJORS
FOUR
ONE
REFERENCES
MAJOR
AGRICULTURE
/SUBGROUPS
DATA SOURCES
AND
RANKED
NATURAL
AND METHODOLOGY
BY PREVALENCE
RESOURCES
INTRODUCTION
30
Mathematics
91
31
Civil engineering
83
32
Social work
83
33
Computer and information systems
83
34
Architecture
77
35
Treatment therapy professions
71
36
Music
66
37
Chemistry
64
38
Physical and health education teaching
62
39
Hospitality management
57
40
Miscellaneous computer
56
41
Theology and religious vocations
55
42
Advertising and public relations
53
43
French, German, Latin, and other
common foreign language studies
52
44
Human resources and personnel management
50
45
Management information systems and statistics
50
46
Computer engineering
49
47
Drama and theater arts
48
48
Philosophy and religious studies
48
49
Art and music education
47
50
Miscellaneous engineering technologies
45
51
Chemical engineering
43
52
Miscellaneous industrial arts
and consumer services
42
53
Early childhood education
42
54
Miscellaneous education
40
55
Secondary teacher education
39
56
Special needs education
39
57
Pharmacy, pharmaceutical
sciences, and administration
38
155
THE
APPENDIX
ECONOMIC
ONE
FOURVALUE OF COLLEGE MAJORS MAJORS | PART THREE
AGRICULTURE
REFERENCES
MAJOR
SUBGROUPS
/ AND
DATANATURAL
SOURCES
RANKED RESOURCES
BY
AND
PREVALENCE
METHODOLOGY
INTRODUCTION
156
58
Film, video, and photographic arts
36
59
Anthropology and archeology
36
60
Transportation sciences and technologies
35
61
Language and drama education
34
62
Industrial and manufacturing engineering
34
63
Environmental science
31
64
Geography
31
65
Health and medical administrative services
30
66
General social sciences
29
67
General agriculture
28
68
Miscellaneous business and
medical administration
27
69
Geology and earth science
26
70
Miscellaneous agriculture
26
71
Area ethnic and civilization studies
26
72
Animal sciences
26
73
Physics
25
74
International business
25
75
Information sciences
24
76
Social sciences or history teacher education
24
77
Miscellaneous biology
23
78
Natural resources management
23
79
Human services and community organization
22
80
Art history and criticism
22
81
Industrial production technologies
21
82
Studio arts
21
83
Pre-law and legal studies
21
84
International relations
20
85
Criminology
20
86
Plant science and agronomy
20
87
Business economics
19
PART THREE | THE
THEECONOMIC
ECONOMICVALUE
VALUEOF
OFCOLLEGE
COLLEGE
APPENDIX
APPENDIX
MAJORS
FOUR
ONE
REFERENCES
MAJOR
AGRICULTURE
/SUBGROUPS
DATA SOURCES
AND
RANKED
NATURAL
AND METHODOLOGY
BY PREVALENCE
RESOURCES
INTRODUCTION
88
Teacher education: multiple levels
18
89
Biochemical sciences
18
90
Nutrition sciences
18
91
Linguistics and comparative
language and literature
17
92
Microbiology
17
93
Communication disorders sciences and services
16
94
Operations logistics and e-commerce
16
95
Interdisciplinary social sciences
16
96
Composition and speech
16
97
Visual and performing arts
15
98
Miscellaneous engineering
15
99
Forestry
15
100
Aerospace engineering
15
101
Intercultural and international studies
15
102
Mathematics teacher education
14
103
Public administration
14
104
Other foreign languages
13
105
Zoology
12
106
Ecology
12
107
Biomedical engineering
12
108
Science and computer teacher education
11
109
Humanities
11
110
Multi/interdisciplinary studies
11
111
Engineering technologies
10
112
Agricultural economics
9
113
Mechanical engineering-related technologies
8
114
Engineering and industrial management
8
115
Molecular biology
7
116
Food science
6
117
Statistics and decision science
6
157
THE
APPENDIX
ECONOMIC
ONE
FOURVALUE OF COLLEGE MAJORS MAJORS | PART THREE
AGRICULTURE
REFERENCES
MAJOR
SUBGROUPS
/ AND
DATANATURAL
SOURCES
RANKED RESOURCES
BY
AND
PREVALENCE
METHODOLOGY
INTRODUCTION
158
118
Health and medical preparatory programs
6
119
Applied mathematics
5
120
Nuclear, industrial radiology, and
biological technologies
5
121
Industrial and organizational psychology
5
122
Architectural engineering
5
123
Engineering mechanics, physics, and science
4
124
Petroleum engineering
4
125
Miscellaneous social sciences
4
126
Atmospheric sciences and meteorology
4
127
Public policy
4
128
Environmental engineering
3
129
Botany
3
130
Oceanography
3
131
Mining and mineral engineering
2
132
Social psychology
2
133
Neuroscience
2
134
Geosciences
2
135
Physical sciences
2
136
Metallurgical engineering
2
137
Geological and geophysical engineering
1
PART THREE | THE
THEECONOMIC
ECONOMICVALUE
VALUEOF
OFCOLLEGE
COLLEGE
APPENDIX
APPENDIX
MAJORS
FOUR
ONE
REFERENCES
MAJOR
AGRICULTURE
/SUBGROUPS
DATA SOURCES
AND
RANKED
NATURAL
AND METHODOLOGY
BY PREVALENCE
RESOURCES
INTRODUCTION
APPENDIX FIVE
Major subgroups ranked by graduate degree attainment
159
THE
APPENDIX
ECONOMIC
ONE
FIVE VALUE OF COLLEGE MAJORS MAJORS | PART THREE
AGRICULTURE
REFERENCES
MAJOR
SUBGROUPS
/ AND
DATANATURAL
SOURCES
RANKED RESOURCES
BY
AND
GRADUATE
METHODOLOGY
DEGREE ATTAINMENT
INTRODUCTION
Major subgroups ranked by graduate degree attainment
RANK
160
MAJOR SUBGROUP
GRADUATE DEGREE
ATTAINMENT OF COLLEGE
GRADUATES, (AGES 25-59) (%)
1
Health and medical preparatory programs
77.3
2
Communication disorders sciences and services
75.9
3
Biochemical sciences
68.3
4
Neuroscience
68.0
5
Physics
67.0
6
Molecular biology
64.5
7
Zoology
62.8
8
Chemistry
61.7
9
Miscellaneous biology
59.0
10
Biology
58.9
11
Botany
56.8
12
Microbiology
56.6
13
Special needs education
56.2
14
Public policy
55.7
15
Metallurgical engineering
54.4
16
Geosciences
53.1
17
Philosophy and religious studies
53.0
18
Biomedical engineering
52.5
19
Mathematics teacher education
52.0
20
Pharmacy, pharmaceutical
sciences, and administration
51.6
21
Engineering mechanics, physics, and science
51.2
22
Environmental engineering
51.0
23
Miscellaneous education
51.0
24
Language and drama education
50.8
25
International relations
50.8
26
Statistics and decision science
50.7
27
Science and computer teacher education
50.7
PART THREE | THE
THEECONOMIC
ECONOMICVALUE
VALUEOF
OFCOLLEGE
COLLEGE
APPENDIX
MAJORS
FIVE
ONE
MAJOR SUBGROUPS
REFERENCES
RANKED
AGRICULTURE
/ DATA
BY GRADUATE
SOURCES
AND NATURAL
DEGREE
AND METHODOLOGY
ATTAINMENT
RESOURCES
INTRODUCTION
28
Mathematics
48.8
29
Political science and government
48.7
30
Applied mathematics
48.6
31
Chemical engineering
48.6
32
Aerospace engineering
48.2
33
Miscellaneous social sciences
47.4
34
Nuclear, industrial radiology, and
biological technologies
47.0
35
Secondary teacher education
46.9
36
French, German, Latin, and other
common foreign language studies
46.8
37
Area ethnic and civilization studies
46.4
38
Psychology
46.1
39
Linguistics and comparative
language and literature
45.8
40
Geology and earth science
45.8
41
History
45.7
42
Other foreign languages
45.5
43
Social work
45.3
44
Public administration
44.8
45
Atmospheric sciences and meteorology
44.4
46
Social sciences or history teacher education
44.2
47
Anthropology and archeology
44.0
48
Oceanography
43.8
49
General education
43.7
50
Physical sciences
43.5
51
Elementary education
43.2
52
English language and literature
43.2
53
Music
42.9
54
Art and music education
42.9
55
Industrial and organizational psychology
42.7
161
THE
APPENDIX
ECONOMIC
ONE
FIVE VALUE OF COLLEGE MAJORS MAJORS | PART THREE
AGRICULTURE
REFERENCES
MAJOR
SUBGROUPS
/ AND
DATANATURAL
SOURCES
RANKED RESOURCES
BY
AND
GRADUATE
METHODOLOGY
DEGREE ATTAINMENT
INTRODUCTION
162
56
Electrical engineering
42.5
57
Teacher education: multiple levels
42.5
58
Economics
41.3
59
Nutrition sciences
40.8
60
Food science
40.6
61
Intercultural and international studies
40.5
62
Industrial and manufacturing engineering
40.1
63
Geological and geophysical engineering
39.9
64
Mechanical engineering
39.7
65
Art history and criticism
39.3
66
Theology and religious vocations
39.0
67
Social psychology
38.9
68
Treatment therapy professions
38.6
69
Physical and health education teaching
38.4
70
Animal sciences
36.7
71
Civil engineering
36.5
72
Computer engineering
36.2
73
General engineering
35.8
74
Mining and mineral engineering
35.6
75
Humanities
35.6
76
Ecology
35.6
77
Early childhood education
35.3
78
Architecture
33.9
79
Interdisciplinary social sciences
33.5
80
Sociology
33.5
81
Miscellaneous health medical professions
33.5
82
Miscellaneous engineering
32.6
83
General social sciences
32.4
84
Multi-disciplinary or general science
32.0
85
Engineering and industrial management
31.6
PART THREE | THE
THEECONOMIC
ECONOMICVALUE
VALUEOF
OFCOLLEGE
COLLEGE
APPENDIX
MAJORS
FIVE
ONE
MAJOR SUBGROUPS
REFERENCES
RANKED
AGRICULTURE
/ DATA
BY GRADUATE
SOURCES
AND NATURAL
DEGREE
AND METHODOLOGY
ATTAINMENT
RESOURCES
INTRODUCTION
86
Environmental science
31.3
87
Composition and speech
31.0
88
Computer science
30.9
89
Pre-law and legal studies
30.6
90
Business economics
30.1
91
Petroleum engineering
29.5
92
Geography
29.5
93
Health and medical administrative services
29.4
94
Human resources and personnel management
29.0
95
International business
28.7
96
Finance
28.2
97
Physical fitness, parks, recreation, and leisure
28.2
98
Natural resources management
27.9
99
Studio arts
27.8
100
Agricultural economics
27.8
101
Family and consumer sciences
27.4
102
Architectural engineering
27.0
103
Human services and community organization
27.0
104
Multi/interdisciplinary studies
26.5
105
Plant science and agronomy
26.2
106
Drama and theater arts
26.2
107
Information sciences
26.0
108
Forestry
26.0
109
Visual and performing arts
25.6
110
Liberal arts
25.5
111
Accounting
25.0
112
General agriculture
24.7
113
Nursing
23.8
114
Journalism
23.1
115
Operations logistics and e-commerce
23.0
163
THE
APPENDIX
ECONOMIC
ONE
FIVE VALUE OF COLLEGE MAJORS MAJORS | PART THREE
AGRICULTURE
REFERENCES
MAJOR
SUBGROUPS
/ AND
DATANATURAL
SOURCES
RANKED RESOURCES
BY
AND
GRADUATE
METHODOLOGY
DEGREE ATTAINMENT
INTRODUCTION
164
116
Engineering technologies
22.9
117
General business
22.6
118
Computer and information systems
22.3
119
Fine arts
22.2
120
Criminology
21.9
121
Miscellaneous engineering technologies
21.6
122
Management information systems and statistics
21.1
123
Communications and mass media
20.8
124
Business management and administration
20.7
125
Criminal justice and fire protection
20.7
126
Miscellaneous business and
medical administration
18.6
127
Miscellaneous agriculture
18.4
128
Industrial production technologies
18.1
129
Miscellaneous computer
17.3
130
Mechanical engineering related technologies
17.1
131
Transportation sciences and technologies
16.7
132
Advertising and public relations
16.4
133
Film, video, and photographic arts
16.0
134
Marketing and marketing research
15.2
135
Hospitality management
11.6
136
Miscellaneous industrial arts
and consumer services
11.0
137
Commercial art and graphic design
9.7
PART THREE | THE
THEECONOMIC
ECONOMICVALUE
VALUEOF
OFCOLLEGE
COLLEGE
APPENDIX
MAJORS
FIVE
ONE
MAJOR SUBGROUPS
REFERENCES
RANKED
AGRICULTURE
/ DATA
BY GRADUATE
SOURCES
AND NATURAL
DEGREE
AND METHODOLOGY
ATTAINMENT
RESOURCES
INTRODUCTION
APPENDIX FIVE
Major subgroups ranked by graduate wage premium
165
THE
APPENDIX
ECONOMIC
ONE
SIX VALUE OF COLLEGE MAJORS MAJORS | PART THREE
AGRICULTURE
REFERENCES
MAJOR
SUBGROUPS
/ AND
DATANATURAL
SOURCES
RANKED RESOURCES
BY
AND
GRADUATE
METHODOLOGY
DEGREE WAGE PREMIUM
INTRODUCTION
Major subgroups ranked by graduate degree wage premium
RANK
166
MAJOR SUBGROUP
GRADUATE DEGREE WAGE
PREMIUM FOR COLLEGEEDUCATED WORKERS
(AGES 25-59) (%)
1
Health and medical preparatory programs
137.0
2
Zoology
79.3
3
Biology
71.4
4
Biochemical sciences
64.4
5
Molecular biology
63.0
6
Chemistry
62.5
7
Animal sciences
55.1
8
Geosciences
53.1
9
Pre-law and legal studies
52.9
10
Area ethnic and civilization studies
51.0
11
Miscellaneous biology
50.0
12
Political science and government
50.0
13
History
48.1
14
Nuclear, industrial radiology, and
biological technologies
47.0
15
Health and medical administrative services
45.5
16
International relations
45.2
17
Humanities
44.9
18
Miscellaneous social sciences
43.9
19
Microbiology
43.5
20
Communication disorders sciences and services
43.5
21
Economics
43.4
22
Multi-disciplinary or general science
42.6
23
Public policy
41.5
24
Intercultural and international studies
40.4
25
Interdisciplinary social sciences
38.8
26
Engineering and industrial management
38.5
27
Finance
38.4
PART THREE | THE
THEECONOMIC
ECONOMICVALUE
VALUEOF
OFCOLLEGE
COLLEGE
APPENDIX
APPENDIX
MAJORS
ONE
SIX
MAJOR SUBGROUPS
REFERENCES
RANKED
AGRICULTURE
BY
/ DATA
GRADUATE
SOURCES
AND
DEGREE
NATURAL
AND METHODOLOGY
WAGE
RESOURCES
PREMIUM
INTRODUCTION
28
Miscellaneous computer
37.3
29
Social psychology
37.3
30
General business
36.9
31
Operations logistics and e-commerce
36.6
32
Linguistics and comparative
language and literature
36.0
33
Early childhood education
35.9
34
Teacher education: multiple levels
35.7
35
Language and drama education
35.6
36
Special needs education
35.6
37
Other foreign languages
35.3
38
Art history and criticism
34.7
39
Anthropology and archeology
34.7
40
Nutrition sciences
34.6
41
Geography
34.5
42
Liberal arts
34.0
43
Drama and theater arts
33.3
44
Visual and performing arts
33.3
45
Business economics
33.3
46
Science and computer teacher education
33.3
47
Secondary teacher education
33.3
48
Nursing
33.3
49
Philosophy and religious studies
33.3
50
Family and consumer sciences
33.3
51
Hospitality management
32.7
52
Physical fitness, parks, recreation, and leisure
32.7
53
Psychology
32.7
54
Art and music education
32.6
55
Elementary education
32.6
56
Miscellaneous business and
medical administration
32.2
167
THE
APPENDIX
ECONOMIC
ONE
SIX VALUE OF COLLEGE MAJORS MAJORS | PART THREE
AGRICULTURE
REFERENCES
MAJOR
SUBGROUPS
/ AND
DATANATURAL
SOURCES
RANKED RESOURCES
BY
AND
GRADUATE
METHODOLOGY
DEGREE WAGE PREMIUM
INTRODUCTION
168
57
Engineering mechanics, physics, and science
32.1
58
Plant science and agronomy
32.1
59
Social sciences or history teacher education
31.9
60
Accounting
31.9
61
Oceanography
31.9
62
Human services and community organization
31.7
63
International business
31.7
64
Criminology
31.5
65
Physical and health education teaching
31.4
66
Geological and geophysical engineering
31.0
67
Social work
31.0
68
Business management and administration
30.6
69
General education
30.4
70
Miscellaneous health medical professions
30.4
71
Composition and speech
29.8
72
Criminal justice and fire protection
29.6
73
Ecology
29.4
74
Human resources and personnel management
29.3
75
Forestry
29.0
76
Miscellaneous engineering
28.9
77
French, German, Latin, and other
common foreign language studies
28.8
78
Transportation sciences and technologies
28.8
79
Studio arts
28.6
80
Marketing and marketing research
28.6
81
Mathematics teacher education
28.6
82
General agriculture
28.3
83
English language and literature
28.3
84
General social sciences
28.3
85
Statistics and decision science
28.2
86
Applied mathematics
27.7
PART THREE | THE
THEECONOMIC
ECONOMICVALUE
VALUEOF
OFCOLLEGE
COLLEGE
APPENDIX
APPENDIX
MAJORS
ONE
SIX
MAJOR SUBGROUPS
REFERENCES
RANKED
AGRICULTURE
BY
/ DATA
GRADUATE
SOURCES
AND
DEGREE
NATURAL
AND METHODOLOGY
WAGE
RESOURCES
PREMIUM
INTRODUCTION
87
Mechanical engineering-related technologies
27.5
88
Sociology
27.5
89
Physical sciences
27.4
90
Atmospheric sciences and meteorology
27.3
91
General engineering
27.2
92
Neuroscience
27.1
93
Botany
26.9
94
Natural resources management
26.8
95
Journalism
26.8
96
Geology and earth science
26.1
97
Industrial and organizational psychology
25.8
98
Industrial and manufacturing engineering
24.7
99
Physics
24.7
100
Environmental science
24.6
101
Music
24.5
102
Aerospace engineering
24.4
103
Biomedical engineering
24.3
104
Communications and mass media
24.1
105
Multi/interdisciplinary studies
23.9
106
Agricultural economics
23.9
107
Commercial art and graphic design
23.5
108
Mathematics
23.3
109
Computer and information systems
23.2
110
Miscellaneous education
23.1
111
Mechanical engineering
23.0
112
Miscellaneous agriculture
22.8
113
Fine arts
22.4
114
Miscellaneous engineering technologies
22.2
115
Civil engineering
21.7
116
Public administration
21.0
169
THE
APPENDIX
ECONOMIC
ONE
SIX VALUE OF COLLEGE MAJORS MAJORS | PART THREE
AGRICULTURE
REFERENCES
MAJOR
SUBGROUPS
/ AND
DATANATURAL
SOURCES
RANKED RESOURCES
BY
AND
GRADUATE
METHODOLOGY
DEGREE WAGE PREMIUM
INTRODUCTION
170
117
Information sciences
20.5
118
Computer science
20.5
119
Electrical engineering
20.4
120
Advertising and public relations
20.4
121
Engineering technologies
19.7
122
Management information systems and statistics
19.5
123
Industrial production technologies
18.9
124
Miscellaneous industrial arts
and consumer services
18.8
125
Theology and religious vocations
18.6
126
Film, video, and photographic arts
17.6
127
Computer engineering
16.1
128
Environmental engineering
15.8
129
Food science
14.9
130
Chemical engineering
13.5
131
Architecture
13.4
132
Treatment therapy professions
12.3
133
Metallurgical engineering
11.2
134
Mining and mineral engineering
9.3
135
Pharmacy, pharmaceutical sciences,
and pharmaceutical administration
4.4
136
Architectural engineering
1.3
137
Petroleum engineering
-5.9
PART THREE | THE
THEECONOMIC
ECONOMICVALUE
VALUEOF
OFCOLLEGE
COLLEGE
APPENDIX
APPENDIX
MAJORS
ONE
SIX
MAJOR SUBGROUPS
REFERENCES
RANKED
AGRICULTURE
BY
/ DATA
GRADUATE
SOURCES
AND
DEGREE
NATURAL
AND METHODOLOGY
WAGE
RESOURCES
PREMIUM
INTRODUCTION
APPENDIX FIVE
Prevalence, wages, graduate degree attainment, and
graduate degree wage by major groups and subgroups
171
THE
APPENDIX
ECONOMIC
SEVEN
ONE VALUE OF COLLEGE MAJORS MAJORS | PART THREE
AGRICULTURE
REFERENCES /WAGES,
PREVALENCE,
AND
DATANATURAL
SOURCES
GRADUATE
RESOURCES
ANDDEGREE
METHODOLOGY
ATTAINMENT, AND GRADUATE DEGREE WAGE BY MAJOR GROUPS AND SUBGROUPS
INTRODUCTION
Prevalence, wages, graduate degree attainment, and
graduate degree wage by major groups and subgroups
MAJORS PER 10,000
COLLEGES GRADUATES
(AGES 25-59)
MEDIAN ANNUAL
WAGES OF COLLEGEEDUCATED WORKERS
(AGES 25-59) (2013$)
GRADUATE DEGREE
ATTAINMENT OF
COLLEGE GRADUATES
(AGES 25-59) (%)
GRADUATE DEGREE
WAGE PREMIUM FOR
COLLEGE-EDUCATED
WORKERS
(AGES 25-59) (%)
154
56,000
27.9
32.1
Agricultural economics
9
67,000
27.8
23.9
Animal sciences
26
49,000
36.7
55.1
Food science
6
67,000
40.6
14.9
Forestry
15
62,000
26.0
29.0
General agriculture
28
53,000
24.7
28.3
Miscellaneous agriculture
26
57,000
18.4
22.8
Natural resources management
23
56,000
27.9
26.8
Plant science and agronomy
20
53,000
26.2
32.1
Architecture and engineering
827
83,000
38.2
25.3
Aerospace engineering
15
90,000
48.2
24.4
Architectural engineering
5
80,000
27.0
1.3
Architecture
77
67,000
33.9
13.4
Biomedical engineering
12
70,000
52.5
24.3
Chemical engineering
43
96,000
48.6
13.5
Civil engineering
83
83,000
36.5
21.7
Electrical engineering
168
93,000
42.5
20.4
Engineering and
industrial management
8
78,000
31.6
38.5
Engineering mechanics,
physics, and science
4
81,000
51.2
32.1
Engineering technologies
10
66,000
22.9
19.7
Environmental engineering
3
76,000
51.0
15.8
132
81,000
35.8
27.2
Geological and
geophysical engineering
1
87,000
39.9
31.0
Industrial and manufacturing
engineering
34
81,000
40.1
24.7
MAJOR GROUP/SUBGROUP
Agriculture and natural resources
General engineering
172
PART THREE | THE
THEECONOMIC
ECONOMICVALUE
VALUEOF
OFCOLLEGE
COLLEGE
APPENDIX
APPENDIX
MAJORS
SEVEN
ONE
PREVALENCE, WAGES, GRADUATE DEGREE ATTAINMENT, AND GRADUATE DEGREE
REFERENCES
WAGE
AGRICULTURE
/ BY
DATA
MAJOR
SOURCES
AND
GROUPS
NATURAL
ANDAND
METHODOLOGY
SUBGROUPS
RESOURCES
INTRODUCTION
MAJORS PER 10,000
COLLEGES GRADUATES
(AGES 25-59)
MEDIAN ANNUAL
WAGES OF COLLEGEEDUCATED WORKERS
(AGES 25-59) (2013$)
GRADUATE DEGREE
ATTAINMENT OF
COLLEGE GRADUATES
(AGES 25-59) (%)
GRADUATE DEGREE
WAGE PREMIUM FOR
COLLEGE-EDUCATED
WORKERS
(AGES 25-59) (%)
Industrial production technologies
21
74,000
18.1
18.9
Mechanical engineering
132
87,000
39.7
23.0
Mechanical engineeringrelated technologies
8
69,000
17.1
27.5
Metallurgical engineering
2
98,000
54.4
11.2
Mining and mineral engineering
2
97,000
35.6
9.3
Miscellaneous engineering
15
76,000
32.6
28.9
Miscellaneous engineering
technologies
45
72,000
21.6
22.2
Petroleum engineering
4
136,000
29.5
-5.9
Arts
479
49,000
23.2
22.4
Commercial art and graphic design
144
51,000
9.7
23.5
Drama and theater arts
48
45,000
26.2
33.3
Film, video, and photographic arts
36
51,000
16.0
17.6
Fine arts
148
49,000
22.2
22.4
Music
66
49,000
42.9
24.5
Studio arts
21
42,000
27.8
28.6
Visual and performing arts
15
42,000
25.6
33.3
Biology and life sciences
333
56,000
57.7
64.3
Biochemical sciences
18
59,000
68.3
64.4
Biology
206
56,000
58.9
71.4
Botany
3
52,000
56.8
26.9
Ecology
12
51,000
35.6
29.4
Environmental science
31
57,000
31.3
24.6
Microbiology
17
62,000
56.6
43.5
Miscellaneous biology
23
54,000
59.0
50.0
Molecular biology
7
54,000
64.5
63.0
Neuroscience
2
48,000
68.0
27.1
Zoology
12
58,000
62.8
79.3
MAJOR GROUP/SUBGROUP
173
THE
APPENDIX
ECONOMIC
SEVEN
ONE VALUE OF COLLEGE MAJORS MAJORS | PART THREE
AGRICULTURE
REFERENCES /WAGES,
PREVALENCE,
AND
DATANATURAL
SOURCES
GRADUATE
RESOURCES
ANDDEGREE
METHODOLOGY
ATTAINMENT, AND GRADUATE DEGREE WAGE BY MAJOR GROUPS AND SUBGROUPS
INTRODUCTION
MAJORS PER 10,000
COLLEGES GRADUATES
(AGES 25-59)
MEDIAN ANNUAL
WAGES OF COLLEGEEDUCATED WORKERS
(AGES 25-59) (2013$)
GRADUATE DEGREE
ATTAINMENT OF
COLLEGE GRADUATES
(AGES 25-59) (%)
GRADUATE DEGREE
WAGE PREMIUM FOR
COLLEGE-EDUCATED
WORKERS
(AGES 25-59) (%)
2609
65,000
22.2
33.8
Accounting
463
69,000
25.0
31.9
Business economics
19
75,000
30.1
33.3
Business management
and administration
814
62,000
20.7
30.6
Finance
233
73,000
28.2
38.4
General business
539
65,000
22.6
36.9
Hospitality management
57
52,000
11.6
32.7
Human resources and
personnel management
50
58,000
29.0
29.3
International business
25
60,000
28.7
31.7
Management information
systems and statistics
50
77,000
21.1
19.5
Marketing and marketing research
315
63,000
15.2
28.6
Miscellaneous business and
medical administration
27
59,000
18.6
32.2
Operations logistics
and e-commerce
16
71,000
23.0
36.6
Communications and journalism
516
54,000
20.8
25.9
Advertising and public relations
53
54,000
16.4
20.4
Communications and mass media
352
54,000
20.8
24.1
Journalism
111
56,000
23.1
26.8
MAJOR GROUP/SUBGROUP
Business
174
PART THREE | THE
THEECONOMIC
ECONOMICVALUE
VALUEOF
OFCOLLEGE
COLLEGE
APPENDIX
APPENDIX
MAJORS
SEVEN
ONE
PREVALENCE, WAGES, GRADUATE DEGREE ATTAINMENT, AND GRADUATE DEGREE
REFERENCES
WAGE
AGRICULTURE
/ BY
DATA
MAJOR
SOURCES
AND
GROUPS
NATURAL
ANDAND
METHODOLOGY
SUBGROUPS
RESOURCES
INTRODUCTION
MAJORS PER 10,000
COLLEGES GRADUATES
(AGES 25-59)
MEDIAN ANNUAL
WAGES OF COLLEGEEDUCATED WORKERS
(AGES 25-59) (2013$)
GRADUATE DEGREE
ATTAINMENT OF
COLLEGE GRADUATES
(AGES 25-59) (%)
GRADUATE DEGREE
WAGE PREMIUM FOR
COLLEGE-EDUCATED
WORKERS
(AGES 25-59) (%)
557
76,000
33.3
26.3
Applied mathematics
5
83,000
48.6
27.7
Computer and information systems
83
69,000
22.3
23.2
Computer engineering
49
87,000
36.2
16.1
Computer science
243
83,000
30.9
20.5
Information sciences
24
73,000
26.0
20.5
Mathematics
91
73,000
48.8
23.3
Miscellaneous computer
56
59,000
17.3
37.3
Statistics and decision science
6
78,000
50.7
28.2
938
45,000
44.6
33.3
Art and music education
47
46,000
42.9
32.6
Early childhood education
42
39,000
35.3
35.9
Elementary education
279
43,000
43.2
32.6
General education
287
46,000
43.7
30.4
Language and drama education
34
45,000
50.8
35.6
Mathematics teacher education
14
49,000
52.0
28.6
Miscellaneous education
40
52,000
51.0
23.1
Physical and health
education teaching
62
51,000
38.4
31.4
Science and computer
teacher education
11
48,000
50.7
33.3
Secondary teacher education
39
48,000
46.9
33.3
Social sciences or history
teacher education
24
47,000
44.2
31.9
MAJOR GROUP/SUBGROUP
Computers, statistics,
and mathematics
Education
175
THE
APPENDIX
ECONOMIC
SEVEN
ONE VALUE OF COLLEGE MAJORS MAJORS | PART THREE
AGRICULTURE
REFERENCES /WAGES,
PREVALENCE,
AND
DATANATURAL
SOURCES
GRADUATE
RESOURCES
ANDDEGREE
METHODOLOGY
ATTAINMENT, AND GRADUATE DEGREE WAGE BY MAJOR GROUPS AND SUBGROUPS
INTRODUCTION
MAJORS PER 10,000
COLLEGES GRADUATES
(AGES 25-59)
MEDIAN ANNUAL
WAGES OF COLLEGEEDUCATED WORKERS
(AGES 25-59) (2013$)
GRADUATE DEGREE
ATTAINMENT OF
COLLEGE GRADUATES
(AGES 25-59) (%)
GRADUATE DEGREE
WAGE PREMIUM FOR
COLLEGE-EDUCATED
WORKERS
(AGES 25-59) (%)
Special needs education
39
45,000
56.2
35.6
Teacher education:
multiple levels
18
42,000
42.5
35.7
746
65,000
33.8
29.2
Communication disorders
sciences and services
16
46,000
75.9
43.5
Health and medical
administrative services
30
55,000
29.4
45.5
Health and medical
preparatory programs
6
54,000
77.3
137.0
Miscellaneous health
medical professions
120
56,000
33.5
30.4
Nursing
448
66,000
23.8
33.3
Nutrition sciences
18
52,000
40.8
34.6
Pharmacy, pharmaceutical
sciences, and pharmaceutical
administration
38
113,000
51.6
4.4
Treatment therapy professions
71
65,000
38.6
12.3
Humanities and liberal arts
864
52,000
41.4
34.6
Area ethnic and civilization studies
26
51,000
46.4
51.0
Art history and criticism
22
49,000
39.3
34.7
Composition and speech
16
47,000
31.0
29.8
English language and literature
251
53,000
43.2
28.3
French, German, Latin, and other
common foreign language studies
52
52,000
46.8
28.8
History
164
54,000
45.7
48.1
Humanities
11
49,000
35.6
44.9
Intercultural and
international studies
15
52,000
40.5
40.4
MAJOR GROUP/SUBGROUP
Health
176
PART THREE | THE
THEECONOMIC
ECONOMICVALUE
VALUEOF
OFCOLLEGE
COLLEGE
APPENDIX
APPENDIX
MAJORS
SEVEN
ONE
PREVALENCE, WAGES, GRADUATE DEGREE ATTAINMENT, AND GRADUATE DEGREE
REFERENCES
WAGE
AGRICULTURE
/ BY
DATA
MAJOR
SOURCES
AND
GROUPS
NATURAL
ANDAND
METHODOLOGY
SUBGROUPS
RESOURCES
INTRODUCTION
MAJORS PER 10,000
COLLEGES GRADUATES
(AGES 25-59)
MEDIAN ANNUAL
WAGES OF COLLEGEEDUCATED WORKERS
(AGES 25-59) (2013$)
GRADUATE DEGREE
ATTAINMENT OF
COLLEGE GRADUATES
(AGES 25-59) (%)
GRADUATE DEGREE
WAGE PREMIUM FOR
COLLEGE-EDUCATED
WORKERS
(AGES 25-59) (%)
Liberal arts
162
53,000
25.5
34.0
Linguistics and comparative
language and literature
17
50,000
45.8
36.0
Multi/interdisciplinary studies
11
46,000
26.5
23.9
Other foreign languages
13
51,000
45.5
35.3
Philosophy and religious studies
48
51,000
53.0
33.3
Theology and
religious vocations
55
43,000
39.0
18.6
267
52,000
24.2
25.0
Family and consumer sciences
92
45,000
27.4
33.3
Miscellaneous industrial
arts and consumer services
42
64,000
11.0
18.8
Physical fitness, parks,
recreation, and leisure
98
49,000
28.2
32.7
Transportation sciences
and technologies
35
73,000
16.7
28.8
Law and public policy
257
54,000
24.2
35.2
Criminal justice and fire protection
219
54,000
20.7
29.6
Pre-law and legal studies
21
51,000
30.6
52.9
Public administration
14
62,000
44.8
21.0
Public policy
4
65,000
55.7
41.5
247
65,000
50.0
49.2
Atmospheric sciences
and meteorology
4
66,000
44.4
27.3
Chemistry
64
64,000
61.7
62.5
Geology and earth science
26
69,000
45.8
26.1
MAJOR GROUP/SUBGROUP
Industrial arts, consumer
services, and recreation
Physical sciences
177
APPENDIX SEVEN
PREVALENCE, WAGES, GRADUATE DEGREE ATTAINMENT, AND GRADUATE DEGREE WAGE BY MAJOR GROUPS AND SUBGROUPS
MAJORS PER 10,000
COLLEGES GRADUATES
(AGES 25-59)
MEDIAN ANNUAL
WAGES OF COLLEGEEDUCATED WORKERS
(AGES 25-59) (2013$)
GRADUATE DEGREE
ATTAINMENT OF
COLLEGE GRADUATES
(AGES 25-59) (%)
GRADUATE DEGREE
WAGE PREMIUM FOR
COLLEGE-EDUCATED
WORKERS
(AGES 25-59) (%)
2
64,000
53.1
53.1
114
61,000
32.0
42.6
Nuclear, industrial radiology,
and biological technologies
5
66,000
47.0
47.0
Oceanography
3
69,000
43.8
31.9
Physical sciences
2
62,000
43.5
27.4
Physics
25
81,000
67.0
24.7
Psychology and social work
516
47,000
45.3
31.9
Human services and
community organization
22
41,000
27.0
31.7
Industrial and organizational
psychology
5
66,000
42.7
25.8
404
49,000
46.1
32.7
Social psychology
2
51,000
38.9
37.3
Social work
83
42,000
45.3
31.0
689
60,000
41.2
45.0
Anthropology and archeology
36
49,000
44.0
34.7
Criminology
20
54,000
21.9
31.5
Economics
186
76,000
41.3
43.4
General social sciences
29
53,000
32.4
28.3
Geography
31
58,000
29.5
34.5
Interdisciplinary social sciences
16
49,000
33.5
38.8
International relations
20
62,000
50.8
45.2
Miscellaneous social sciences
4
57,000
47.4
43.9
Political science and government
189
64,000
48.7
50.0
Sociology
158
51,000
33.5
27.5
MAJOR GROUP/SUBGROUP
Geosciences
Multi-disciplinary or
general science
Psychology
Social sciences
178
Rank
Major
Median Earnings
129
Drama and Theater Arts
108
Fine Arts
$48,871
113
Music
$48,686
135
Studio Arts
$41,762
132
Visual and Performing Arts
$42,465
117
Neuroscience
123
Art and Music Education
137
Early Childhood Education
130
Elementary Education
125
General Education
127
Language and Drama Education
116
Mathematics Teacher Education
$48,654
119
Science and Computer
Teacher Education
$47,785
118
Secondary Teacher Education
$48,078
120
Social Science or History
Teacher Education
$46,608
126
Special Needs Education
$45,440
133
Contents
Teacher Education: Multiple Levels
122
Communication Disorders
Sciences and Services
180
Earnings$45,654
at the 25th, 50th and 75th
percentiles, by Bachelor’s degree major
109
Art History and Criticism
184
121
Composition and Speech
$48,871
The graduate
advantage, earnings at
the 25th, 50th and 75th percentiles
by Bachelor’s degree major
110
Humanities
124
Multi/Interdisciplinary Studies
131
Theology and Religious Vocations
128
Family and Consumer Sciences
111
Physical Fitness Parks
Recreation and Leisure
Human Services and
Community Organization
136
$44,538
$48,190
137 Detailed Majors
$45,613
$39,097
Selective Statistics
$42,736
$45,572
Psychology
134
Social Work
115
Anthropology and Archeology
$42,194
$46,608
200
All majors by group, ranked by
earnings
and popularity
$48,686
204
Lowest- $45,613
and highest-earning majors,
Bachelor’s degree holders
206
112
$45,440
$42,736
Lowest- and highest-earning majors,
graduate degree holders
$44,743
208
Majors ranked by popularity for
$48,686
Bachelor’s
degree holders
209
Majors ranked by popularity for
graduate degree holders
$41,113
$48,686
$42,194
$48,679
179
MID-CAREER EARNINGS AT THE 25TH, 50TH AND 75TH PERCENTILES,
BY BACHELOR’S DEGREE MAJOR
0
$40,000
$80,000
$120,000
$160,000
All Bachelor’s Degree Holders
Agriculture and Natural Resources
Agricultural Economics
Food Science
Forestry
Miscellaneous Agriculture
25th
percentile
Natural Resources Management
General Agriculture
50th
percentile
75th
percentile
Plant Science and Agronomy
Animal Sciences
Architecture and Engineering
Petroleum Engineering
Metallurgical Engineering
Mining and Mineral Engineering
Petroleum
Engineering
75th percentile
earnings
$243,000
Chemical Engineering
Electrical Engineering
Aerospace Engineering
Geological and Geophysical Engineering
Mechanical Engineering
Civil Engineering
Engineering Mechanics, Physics, and Science
General Engineering
Industrial and Manufacturing Engineering
Architectural Engineering
Engineering and Industrial Management
Environmental Engineering
Miscellaneous Engineering
Industrial Production Technologies
Miscellaneous Engineering Technologies
Biomedical Engineering
Mechanical Engineering - Related Technologies
Architecture
Engineering Technologies
Arts
Commercial Art and Graphic Design
Film,Video, and Photographic Arts
Fine Arts
Music
Drama and Theater Arts
Studio Arts
Visual and Performing Arts
0
180
$40,000
$80,000
$120,000
$160,000
Earnings at the 25th, 50th and 75th percentiles,
by Bachelor’s degree major
0
$40,000
$80,000
$120,000
$160,000
0
$40,000
$80,000
$120,000
$160,000
All Bachelor’s Degree Holders
Biology and Life Sciences
Microbiology
Biochemical Sciences
Zoology
Environmental Science
Biology
Miscellaneous Biology
Molecular Biology
Botany
Ecology
Neuroscience
Business
Management Information Systems and Statistics
Business Economics
Finance
Operations Logistics and E-Commerce
Accounting
General Business
Marketing and Marketing Research
Business Management and Administration
International Business
Miscellaneous Business and
Medical Administration
Human Resources and Personnel Management
Hospitality Management
Communications and Journalism
Journalism
Advertising and Public Relations
Communications and Mass Media
Computers, Statistics, and Mathematics
Computer Engineering
Applied Mathematics
Computer Science
Statistics and Decision Science
Information Sciences
Mathematics
Computer and Information Systems
Miscellaneous Computer
181
Earnings at the 25th, 50th and 75th percentiles,
by Bachelor’s degree major
0
$40,000
$80,000
$120,000
$160,000
0
$40,000
$80,000
$120,000
$160,000
All Bachelor’s Degree Holders
Education
Miscellaneous Education
Physical and Health Education Teaching
Mathematics Teacher Education
Science and Computer Teacher Education
Secondary Teacher Education
Social Sciences or History Teacher Education
Art and Music Education
General Education
Language and Drama Education
Special Needs Education
Elementary Education
Teacher Education: Multiple Levels
Early Childhood Education
Health
Pharmacy, Pharmaceutical Sciences,
and Administration
Nursing
Treatment Therapy Professions
Miscellaneous Health Medical Professions
Health and Medical Administrative Services
Health and Medical Preparatory Programs
Nutrition Sciences
Communication Disorders Sciences and Services
Humanities and Liberal Arts
History
English Language and Literature
Liberal Arts
French, German, Latin, and Other
Common Foreign Language Studies
Intercultural and International Studies
Area Ethnic and Civilization Studies
Other Foreign Languages
Philosophy and Religious Studies
Linguistics and Comparative
Language and Literature
Art History and Criticism
Humanities
Composition and Speech
Multi/Interdisciplinary Studies
Theology and Religious Vocations
182
Earnings at the 25th, 50th and 75th percentiles,
by Bachelor’s degree major
0
$40,000
$80,000
$120,000
$160,000
0
$40,000
$80,000
$120,000
$160,000
All Bachelor’s Degree Holders
Industrial Arts, Consumer Services, & Recreation
Transportation Sciences and Technologies
Miscellaneous Industrial Arts
and Consumer Services
Physical Fitness, Parks Recreation, and Leisure
Family and Consumer Sciences
Law and Public Policy
Public Policy
Public Administration
Criminal Justice and Fire Protection
Pre-Law and Legal Studies
Physical Sciences
Physics
Geology and Earth Science
Oceanography
Atmospheric Sciences and Meteorology
Nuclear, Industrial Radiology, and
Biological Technologies
Chemistry
Geosciences
Physical Sciences
Multi-Disciplinary or General Sciences
Psychology and Social Work
Industrial and Organizational Psychology
Social Psychology
Psychology
Social Work
Human Services and Community Organization
Social Sciences
Economics
Political Science and Government
International Relations
Geography
Miscellaneous Social Sciences
Criminology
General Social Sciences
Sociology
Anthropology and Archeology
Interdisciplinary Social Sciences
Source: Georgetown University Center on Education and the Workforce analysis of U.S. Census Bureau, American Community Survey micro data, 2009-2013
pooled sample.
183
The Graduate Advantage
Earnings at the 25th, 50th and 75th percentiles by Bachelor’s degree major
THE GRADUATE ADVANTAGE
The charts displayed in this section (the graduate advantage) show the
interquartile range of annual wages for each major group and subgroup.
griculture andEach
Natural
Resources
| The
Graduate Advantage
horizontal
bar
corresponds
to a major group or subgroup.
rnings at the 25th, 50th and 75th percentile by Bachelor’s degree major
The columns on the right correspond
The leftmost point on the bar shows the 25th percentile of the wage
to the percentage and absolute
distribution. The dot in the middle of the bar shows the median
difference between the median annual
Agriculture and Natural Resources | The Graduate Advantage
or 50th percentile of the wage Earnings
distribution.
The rightmost point
wage distribution of graduate degree
at the 25th, 50th and 75th percentile by Bachelor’s degree major
50th Percentile
Change degree holders.
on the bar shows the 75th percentile of the wage distribution.
holders
and Bachelor’s
0
$40,000
$80,000
$120,000
Percent
Absolute
50th Percentile Change
Agriculture and
Natural Resources
0
$40,000
$80,000
32.9%
$120,000
Agriculture and
Natural Resources
Agricultural Economics
32.9%
Agriculture and Natural Resources | The Graduate Advantage
EarningsAgricultural
at the 25th,Economics
50th and 75th percentile by Bachelor’s degree major
Food Science
Food Science
Animal Sciences 0
Agriculture and
Natural
Resources
Natural Resources
Management
Animal Sciences
$40,000
$80,000
Plant Science and Agronomy
Animal Sciences 0
25th
50th
Natural Resources
Management
percentile
percentile
General Agriculture
$40,000
75th
percentile
$80,000
$18,000
$9,800
14.5%
50th
Percentile Change
$120,000
$9,800
Percent
54.5%
Absolute
32.9%
28.5%
$18,300
$15,800
$26,800
23.8%
31.6%
$16,000
$16,900
29.0%
23.5%
$18,000
$13,400
$15,800
$26,800
$16,900 $9,800
14.5%
27.6%
$14,700
$120,000
23.5%
Bachelor’s degree holders
Graduate degree holders
27.6%
Plant Science and Agronomy
$16,000
29.0%
$18,000
31.6%
Food
Science
General
Agriculture
Miscellaneous Agriculture
$16,000
28.5%
Forestry
Miscellaneous Agriculture
Major subgroups
14.5%
$18,300
23.8%
54.5%
Agricultural
Plant Science
and Economics
Agronomy
atural Resources Management
23.8%
29.0%
Forestry
Forestry
Major
group
Percent
Absolute
$18,300
54.5% 0
$26,800
$13,400
28.5%
$15,800
50th percentile
absolute change
$14,700
$16,900
31.6%
Source: Georgetown University Center on Education and the Workforce analysis of US Census Bureau, American Community Survey micro data, 2009-2012.
Miscellaneous Agriculture
0
25th
percentile
50th
percentile
$40,000
75th
percentile
25th percentile
$80,000
0
$120,000
$13,400
$14,700
27.6%
General Agriculture
Bachelor’s
degree $40,000
holders
0
50th percentile
75th holders
degree
25th Graduate
50th
percentile percentile
23.5%
percentile
$80,000
50th
$120,000
percentile0
absolute change
75th percentile
Bachelor’s degree holders
50th percentile
Graduate
degree
The bottom 25 percent of colHalf of college-educated
The
top
25 holders
percent of college-absolute change
rce: Georgetown University Center on Education and the Workforce analysis of US Census Bureau, American Community Survey micro data, 2009-2012.
lege-educated workers earn
workers
earnCenter
more
thanand
the
educated
earn
more
Source: Georgetown
University
on Education
the Workforce analysis
of US Census workers
Bureau, American
Community
Survey micro data, 2009-2012.
less than the 25th percentile.
median and half earn less.
than than 75th percentile.
14
184
Agriculture and Natural Resources | The Graduate Advantage
Earnings at the 25th, 50th and 75th percentiles by Bachelor’s degree major
50th Percentile Change
0
$40,000
$80,000
$120,000
Percent
Absolute
Agriculture and
Natural Resources
32.9%
Agricultural Economics
23.8%
Forestry
29.0%
Food Science
14.5%
Animal Sciences
54.5%
Natural Resources Management
28.5%
$15,800
Plant Science and Agronomy
31.6%
$16,900
Miscellaneous Agriculture
23.5%
General Agriculture
27.6%
0
25th
percentile
50th
percentile
$40,000
75th
percentile
$80,000
$120,000
Bachelor’s degree holders
Graduate degree holders
$18,300
$16,000
$18,000
$9,800
$26,800
$13,400
$14,700
0
50th percentile
absolute change
Source: Georgetown University Center on Education and the Workforce analysis of U.S. Census Bureau, American Community Survey micro data, 2009-2013
pooled sample.
185
Architecture and Engineering | The Graduate Advantage
Earnings at the 25th, 50th and 75th percentiles by Bachelor’s degree major
50th Percentile Change
0
$40,000
$80,000
$120,000
$160,000
Architecture and Engineering
Absolute
25.0%
($243,000)
Petroleum Engineering
($207,000)
Geological and Geophysical
Engineering
($182,000)
$21,000
-5.4%
(-$7,000)
31.6%
$27,000
Aerospace Engineering
24.5%
Electrical Engineering
20.0%
Chemical Engineering
12.9%
$12,000
Metallurgical Engineering
11.1%
$11,000
Engineering and Industrial
Management
39.3%
Engineering Mechanics,
Physics, and Science
32.2%
Mechanical Engineering
23.0%
Mining and Mineral Engineering
8.6%
General Engineering
27.7%
Industrial and Manufacturing
Engineering
24.6%
$20,000
Civil Engineering
21.4%
$18,000
Miscellaneous Engineering
29.4%
Miscellaneous Engineering
Technologies
23.3%
Mechanical EngineeringRelated Technologies
27.6%
Industrial Production Technologies
19.4%
Environmental Engineering
15.8%
Biomedical Engineering
24.1%
Architectural Engineering
1.7%
Engineering Technologies
18.8%
Architecture
13.3%
0
25th
percentile
50th
percentile
$40,000
75th
percentile
$80,000
$120,000
$160,000
Bachelor’s degree holders
Graduate degree holders
186
Percent
$22,000
$19,000
$31,000
$26,000
$20,000
$8,000
$22,000
$22,000
$17,000
$19,000
$14,000
$12,000
$17,000
$1,000
$12,000
$9,000
0
50th percentile
absolute change
Source: Georgetown University Center on Education and the Workforce analysis of U.S. Census Bureau, American Community Survey micro data, 2009-2013
pooled sample.
The Graduate Advantage | Arts
Earnings at the 25th, 50th and 75th percentiles by Bachelor’s degree major
50th Percentile Change
0
$20,000
$40,000
$60,000
$80,000
$100,000
Percent
Absolute
Arts
22.9%
Commercial Art and
Graphic Design
23.7%
$12,000
Music
25.0%
$12,000
Drama and Theater Arts
34.4%
Fine Arts
22.4%
Film, Video, and
Photographic Arts
16.7%
Visual and Performing Arts
31.4%
$13,000
Studio Arts
29.5%
$12,000
0
25th
percentile
50th
percentile
$20,000
75th
percentile
$40,000
$60,000
$80,000
Bachelor’s degree holders
Graduate degree holders
$100,000
$11,000
$15,000
$11,000
$9,000
0
50th percentile
absolute change
Source: Georgetown University Center on Education and the Workforce analysis of U.S. Census Bureau, American Community Survey micro data, 2009-2013
pooled sample.
187
Biology and Life Sciences | The Graduate Advantage
Earnings at the 25th, 50th and 75th percentiles by Bachelor’s degree major
50th Percentile Change
0
$40,000
$80,000
$120,000
$160,000
$200,000
Percent
Absolute
Biology and Life Sciences
63.3%
Zoology
80.7%
Biochemical Sciences
64.9%
$38,000
Biology
70.9%
$40,000
Microbiology
42.7%
Molecular Biology
62.0%
Miscellaneous Biology
49.5%
Environmental Science
24.7%
$14,000
Botany
27.4%
$14,000
Ecology
29.7%
$15,000
Neuroscience
26.3%
0
25th
percentile
50th
percentile
$40,000
75th
percentile
$80,000
$120,000
$160,000
$200,000
Bachelor’s degree holders
Graduate degree holders
$36,000
$47,000
$27,000
$34,000
$27,000
$13,000
0
50th Percentile
Absolute Change
Source: Georgetown University Center on Education and the Workforce analysis of U.S. Census Bureau, American Community Survey micro data, 2009-2013 pooled sample.
188
The Graduate Advantage | Business
Earnings at the 25th, 50th and 75th percentiles by Bachelor’s degree major
50th Percentile Change
0
$40,000
$80,000
$120,000
$160,000
Percent
Absolute
Business
33.3%
Finance
39.9%
Business Economics
33.1%
Operations Logistics
and E-Commerce
38.0%
Management Information
Systems and Statistics
20.0%
Accounting
32.2%
General Business
36.6%
Marketing and
Marketing Research
29.3%
$18,000
Business Management
and Administration
30.6%
$19,000
International Business
32.5%
$19,000
Miscellaneous Business and
Medical Administration
32.0%
$19,000
Human Resources and
Personnel Management
28.0%
$16,000
Hospitality Management
33.7%
$18,000
0
25th
percentile
50th
percentile
$40,000
75th
percentile
$80,000
$120,000
$160,000
Bachelor’s degree holders
Graduate degree holders
$22,000
$29,000
$25,000
$27,000
$15,000
$22,000
$24,000
0
50th percentile
absolute change
Source: Georgetown University Center on Education and the Workforce analysis of U.S. Census Bureau, American Community Survey micro data, 2009-2013 pooled sample.
189
Communications and Journalism | The Graduate Advantage
Earnings at the 25th, 50th and 75th percentiles by Bachelor’s degree major
50th Percentile Change
0
$20,000
$40,000
$60,000
$80,000
$100,000
Percent
Communications
and Journalism
25.5%
Journalism
27.0%
Communications and Mass Media
24.0%
Advertising and Public Relations
20.0%
25th
percentile
0
$20,000
50th
percentile
75th
percentile
$40,000
$60,000
$80,000
$100,000
Bachelor’s degree holders
Graduate degree holders
Absolute
$14,000
$15,000
$13,000
$11,000
0
50th Percentile
Absolute Change
Source: Georgetown University Center on Education and the Workforce analysis of U.S. Census Bureau, American Community Survey micro data, 2009-2013 pooled sample.
190
The Graduate Advantage | Computers, Statistics, and Mathematics
Earnings at the 25th, 50th and 75th percentiles by Bachelor’s degree major
50th Percentile Change
0
$40,000
$80,000
$120,000
Percent
Absolute
Computers, Statistics,
and Mathematics
25.6%
Applied Mathematics
27.5%
Computer Engineering
17.3%
Statistics and Decision Science
29.3%
Computer Science
20.6%
$17,000
Mathematics
24.5%
$18,000
Information Sciences
20.8%
$15,000
Computer and
Information Systems
22.3%
$15,000
Miscellaneous Computer
37.4%
0
25th
percentile
50th
percentile
$40,000
75th
percentile
$80,000
$120,000
Bachelor’s degree holders
Graduate degree holders
$19,000
$23,000
$15,000
$23,000
$22,000
0
50th percentile
absolute change
Source: Georgetown University Center on Education and the Workforce analysis of U.S. Census Bureau, American Community Survey micro data, 2009-2013 pooled sample.
191
Education | The Graduate Advantage
Earnings at the 25th, 50th and 75th percentiles by Bachelor’s degree major
50th Percentile Change
0
$20,000
$40,000
$60,000
$80,000
Percent
Absolute
Education
33.3%
Physical and Health
Education Teaching
32.2%
$16,000
Secondary Teacher Education
33.6%
$16,000
Science and Computer
Teacher Education
34.1%
$16,000
Miscellaneous Education
23.0%
Mathematics Teacher Education
29.0%
Social Sciences or History
Teacher Education
33.3%
Special Needs Education
34.0%
$15,000
Art and Music Education
33.5%
$15,000
Language and Drama Education
33.8%
$15,000
General Education
31.1%
$14,000
Elementary Education
33.3%
$14,000
Teacher Education:
Multiple Levels
34.2%
$14,000
Early Childhood Education
36.6%
0
25th
percentile
50th
percentile
$20,000
75th
percentile
$40,000
$60,000
$80,000
Bachelor’s degree holders
Graduate degree holders
$15,000
$12,000
$14,000
$16,000
$14,000
0
50th Percentile
Absolute Change
Source: Georgetown University Center on Education and the Workforce analysis of U.S. Census Bureau, American Community Survey micro data, 2009-2013 pooled sample.
192
The Graduate Advantage | Heath
Earnings at the 25th, 50th and 75th percentiles by Bachelor’s degree major
50th Percentile Change
0
$40,000
$80,000
$120,000
Percent
Health
29.2%
Health and Medical
Preparatory Programs
$19,000
136.1%
$74,000
($291,000)
Pharmacy and Pharmaceutical
Sciences and Administration
4.4%
Nursing
33.5%
Health and Medical
Administrative Services
44.7%
Miscellaneous Health and
Medical Professions
29.3%
Treatment Therapy Professions
11.7%
Nutrition Sciences
34.2%
Communication Disorders
Sciences and Services
44.4%
0
25th
percentile
Absolute
50th
percentile
$40,000
75th
percentile
$80,000
$120,000
Bachelor’s degree holders
Graduate degree holders
$5,000
$22,000
$25,000
$17,000
$8,000
$18,000
$20,000
0
50th percentile
absolute change
Source: Georgetown University Center on Education and the Workforce analysis of U.S. Census Bureau, American Community Survey micro data, 2009-2013 pooled sample.
193
Humanities and Liberal Arts | The Graduate Advantage
Earnings at the 25th, 50th and 75th percentiles by Bachelor’s degree major
50th Percentile Change
0
$40,000
$80,000
$120,000
Percent
Absolute
Humanities and Liberal Arts
34.2%
History
47.6%
$26,000
Area Ethnic and
Civilization Studies
49.8%
$26,000
Intercultural and
International Studies
40.0%
Humanities
45.9%
Liberal Arts
33.5%
$18,000
Other Foreign Languages
36.5%
$19,000
English Language and Literature
29.4%
Philosophy and Religious Studies
34.4%
$17,000
Linguistics and Comparative
Language and Literature
36.7%
$18,000
French, German, Latin and
Other Common Foreign
Language Studies
30.0%
Art History and Criticism
34.9%
Composition and Speech
30.5%
Multi/Interdisciplinary Studies
24.1%
Theology and Religious Vocations
18.7%
0
25th
percentile
50th
percentile
$40,000
75th
percentile
$80,000
$120,000
Bachelor’s degree holders
Graduate degree holders
$18,000
$21,000
$22,000
$16,000
$16,000
$17,000
$14,000
$11,000
$8,000
0
50th Percentile
Absolute Change
Source: Georgetown University Center on Education and the Workforce analysis of U.S. Census Bureau, American Community Survey micro data, 2009-2013 pooled sample.
194
The Graduate Advantage | Industrial Arts, Consumer Services & Recreation
Earnings at the 25th, 50th and 75th percentiles by Bachelor’s degree major
50th Percentile Change
0
$40,000
$80,000
$120,000
Percent
Industrial Arts, Consumer
Services, & Recreation
25.4%
Transportation Sciences
and Technologies
29.7%
Miscellaneous Industrial Arts
and Consumer Services
18.9%
Physical Fitness, Parks
Recreation, and Leisure
33.3%
Family and Consumer Sciences
33.5%
0
25th
percentile
50th
percentile
$40,000
75th
percentile
$80,000
$120,000
Bachelor’s degree holders
Graduate degree holders
Absolute
$13,000
$22,000
$12,000
$16,000
$15,000
0
50th percentile
absolute change
Source: Georgetown University Center on Education and the Workforce analysis of U.S. Census Bureau, American Community Survey micro data, 2009-2013 pooled sample.
195
Law and Public Policy | The Graduate Advantage
Earnings at the 25th, 50th and 75th percentiles by Bachelor’s degree major
50th Percentile Change
0
$40,000
$80,000
$120,000
Percent
Absolute
Law and Public Policy
33.1%
Public Policy
41.1%
$27,000
Pre-Law and Legal Studies
51.9%
$27,000
Public Administration
20.8%
Criminal Justice and
Fire Protection
29.7%
0
25th
percentile
50th
percentile
$40,000
75th
percentile
$80,000
$120,000
Bachelor’s degree holders
Graduate degree holders
$18,000
$13,000
$16,000
0
50th Percentile
Absolute Change
Source: Georgetown University Center on Education and the Workforce analysis of U.S. Census Bureau, American Community Survey micro data, 2009-2013 pooled sample.
196
The Graduate Advantage | Physical Sciences
Earnings at the 25th, 50th and 75th percentiles by Bachelor’s degree major
50th Percentile Change
0
$40,000
$80,000
$120,000
$160,000
Percent
Absolute
Physical Sciences
50.0%
Chemistry
61.6%
Physics
25.0%
Geosciences
53.5%
Nuclear, Industrial Radiology,
& Biological Technologies
47.7%
Oceanography
31.5%
Geology and Earth Science
25.1%
Multi-Disciplinary or
General Science
42.4%
Atmospheric Sciences
and Meteorology
26.6%
$18,000
Physical Sciences
27.6%
$17,000
0
25th
percentile
50th
percentile
$40,000
75th
percentile
$80,000
$120,000
$160,000
Bachelor’s degree holders
Graduate degree holders
$32,000
$39,000
$20,000
$34,000
$31,000
$22,000
$17,000
$26,000
0
50th percentile
absolute change
Source: Georgetown University Center on Education and the Workforce analysis of U.S. Census Bureau, American Community Survey micro data, 2009-2013 pooled sample.
197
Psychology and Social Work | The Graduate Advantage
Earnings at the 25th, 50th and 75th percentiles by Bachelor’s degree major
50th Percentile Change
0
$40,000
$80,000
$120,000
Percent
Absolute
Psychology and Social Work
33.3%
$16,000
Industrial and Organizational
Psychology
26.4%
$17,000
Social Psychology
37.8%
Psychology
33.3%
Social Work
30.1%
$13,000
Human Services and
Community Organization
31.0%
$13,000
0
25th
percentile
50th
percentile
$40,000
75th
percentile
$80,000
$120,000
Bachelor’s degree holders
Graduate degree holders
$19,000
$16,000
0
50th Percentile
Absolute Change
Source: Georgetown University Center on Education and the Workforce analysis of U.S. Census Bureau, American Community Survey micro data, 2009-2013 pooled sample.
198
The Graduate Advantage | Social Sciences
Earnings at the 25th, 50th and 75th percentiles by Bachelor’s degree major
50th Percentile Change
0
$40,000
$80,000
$120,000
$160,000
Percent
Absolute
Social Sciences
44.6%
Economics
43.6%
$33,000
Political Science and Government
49.1%
$31,000
International Relations
46.4%
Miscellaneous Social Sciences
42.7%
Geography
33.9%
Criminology
31.2%
$17,000
General Social Sciences
29.3%
$15,000
Interdisciplinary Social Sciences
40.0%
Anthropology and Archeology
35.5%
Sociology
28.0%
0
25th
percentile
50th
percentile
$40,000
75th
percentile
$80,000
$120,000
$160,000
Bachelor’s degree holders
Graduate degree holders
$27,000
$29,000
$24,000
$20,000
$19,000
$17,000
$14,000
0
50th percentile
absolute change
Source: Georgetown University Center on Education and the Workforce analysis of U.S. Census Bureau, American Community Survey micro data, 2009-2013 pooled sample.
199
ALL MAJORS BY GROUP
RANKED BY EARNINGS AND POPULARITY
Bachelor’s Degree Ranking
By earnings
Graduate Degree Ranking
By popularity
By earnings
By popularity
Agriculture and Natural Resources
39
112
Agricultural Economics
54
125
107
72
Animal Sciences
73
67
40
116
Food Science
71
119
55
99
Forestry
62
108
85
67
General Agriculture
96
89
70
70
Miscellaneous Agriculture
89
106
75
78
Natural Resources Management
82
90
86
86
Plant Science and Agronomy
88
98
7
100
Aerospace Engineering
5
72
18
122
Architectural Engineering
57
133
41
34
Architecture
75
40
33
107
Biomedical Engineering
49
75
5
51
Chemical Engineering
7
38
12
31
Civil Engineering
22
33
Architecture and Engineering
6
17
Electrical Engineering
6
13
19
114
Engineering and Industrial Management
10
122
17
123
Engineering Mechanics, Physics, and Science
11
116
43
111
Engineering Technologies
67
127
22
128
Environmental Engineering
44
123
16
23
General Engineering
17
21
10
137
Geological and Geophysical Engineering
4
137
14
62
Industrial and Manufacturing Engineering
19
56
26
81
Industrial Production Technologies
45
115
8
24
Mechanical Engineering
12
18
37
113
Mechanical Engineering - Related Technologies
46
132
3
136
Metallurgical Engineering
8
128
4
131
Mining and Mineral Engineering
13
136
23
98
Miscellaneous Engineering
26
97
31
50
Miscellaneous Engineering Technologies
43
78
1
124
Petroleum Engineering
1
131
Arts
200
105
22
Commercial Art and Graphic Design
116
65
129
47
Drama and Theater Arts
124
64
98
58
Film, Video, and Photographic Arts
126
101
108
21
Fine Arts
125
36
113
36
Music
121
31
135
82
Studio Arts
134
93
132
97
Visual and Performing Arts
132
109
All Majors by Group
Ranked by Earnings and Popularity
Bachelor’s Degree Ranking
By earnings
Graduate Degree Ranking
By popularity
By earnings
By popularity
Biology and Life Sciences
64
89
Biochemical Sciences
30
41
74
14
Biology
31
2
93
129
Botany
103
118
100
106
Ecology
104
102
71
63
Environmental Science
83
69
56
92
Microbiology
40
58
79
77
Miscellaneous Biology
59
50
83
115
Molecular Biology
48
80
117
133
Neuroscience
120
112
68
105
Zoology
15
59
Accounting
37
9
Business
38
3
25
87
Business Economics
25
95
58
1
Business Management and Administration
61
5
30
12
Finance
21
17
49
2
General Business
41
8
91
39
Hospitality Management
92
96
66
44
Human Resources and Personnel Management
77
61
62
74
International Business
66
86
21
45
Management Information Systems and Statistics
34
74
54
7
Marketing and Marketing Research
58
25
65
68
Miscellaneous Business and Medical Administration
70
105
32
94
Operations Logistics and E-Commerce
29
113
78
42
Advertising and Public Relations
108
85
77
6
Communications and Mass Media
101
16
73
27
Journalism
81
49
Communications and Journalism
Computers, Statistics, and Mathematics
13
119
Applied Mathematics
14
111
34
33
Computer and Information Systems
52
53
9
46
Computer Engineering
18
52
11
11
Computer Science
24
14
27
75
Information Sciences
42
91
29
30
Mathematics
38
19
63
40
Miscellaneous Computer
60
82
20
117
Statistics and Decision Science
23
104
201
All Majors by Group
Ranked by Earnings and Popularity
Bachelor’s Degree Ranking
By earnings
Graduate Degree Ranking
By popularity
By earnings
By popularity
Education
123
49
Art and Music Education
119
44
137
53
Early Childhood Education
136
54
130
9
Elementary Education
129
4
125
8
General Education
127
3
127
61
Language and Drama Education
122
45
116
102
Mathematics Teacher Education
115
66
90
54
Miscellaneous Education
114
37
101
38
Physical and Health Education Teaching
102
42
119
108
Science and Computer Teacher Education
113
81
118
55
Secondary Teacher Education
112
48
120
76
Social Sciences or History Teacher Education
117
63
126
56
Special Needs Education
118
32
133
88
Teacher Education: Multiple Levels
130
73
122
93
Communication Disorders Sciences and Services
107
30
76
65
Health and Medical Administrative Services
63
77
81
118
Health and Medical Preparatory Programs
2
62
72
25
Miscellaneous Health Medical Professions
78
23
46
4
Nursing
47
10
95
90
Nutrition Sciences
91
79
2
57
Pharmacy and Pharmaceutical Sciences and Administration
3
39
48
35
Treatment Therapy Professions
79
35
Area Ethnic and Civilization Studies
72
55
Health
Humanities and Liberal Arts
202
96
71
109
80
Art History and Criticism
106
70
121
96
Composition and Speech
123
99
89
10
English Language and Literature
94
6
92
43
French, German, Latin, and Other Common
Foreign Language Studies
100
34
82
18
History
64
11
110
109
Humanities
84
103
94
101
Intercultural and International Studies
80
87
87
19
Liberal Arts
85
26
106
91
Linguistics and Comparative Language and Literature
99
68
124
110
Multi/Interdisciplinary Studies
131
120
102
104
Other Foreign Languages
93
83
103
48
Philosophy and Religious Studies
98
27
131
41
Theology and Religious Vocations
137
46
All Majors by Group
Ranked by Earnings and Popularity
Bachelor’s Degree Ranking
By earnings
Graduate Degree Ranking
By popularity
By earnings
By popularity
Industrial Arts, Consumer Services, and Recreation
128
29
Family and Consumer Sciences
128
47
53
52
Miscellaneous Industrial Arts and Consumer Services
74
110
111
28
Physical Fitness, Parks, Recreation, and Leisure
109
43
28
60
Transportation Sciences and Technologies
33
100
Law and Public Policy
80
13
Criminal Justice and Fire Protection
87
24
97
83
Pre-Law and Legal Studies
68
88
59
103
Public Administration
76
84
47
127
Public Policy
35
114
Atmospheric Sciences and Meteorology
53
126
Physical Sciences
42
126
50
37
Chemistry
16
15
35
69
Geology and Earth Science
50
57
51
134
Geosciences
27
129
61
26
Multidisciplinary or General Science
51
28
44
120
Nuclear, Industrial Radiology, and Biological Technologies
28
117
36
130
Oceanography
36
130
57
135
Physical Sciences
65
134
15
73
Physics
20
29
136
79
Human Services and Community Organization
135
92
45
121
Industrial and Organizational Psychology
55
124
Psychology and Social Work
112
5
Psychology
110
1
99
132
Social Psychology
90
135
134
32
Social Work
133
22
Social Sciences
115
59
Anthropology and Archeology
105
51
84
85
Criminology
86
107
24
16
Economics
9
12
88
66
General Social Sciences
95
71
67
64
Geography
69
76
114
95
Interdisciplinary Social Sciences
97
94
60
84
International Relations
39
60
69
125
Miscellaneous Social Sciences
56
121
52
15
Political Science and Government
32
7
104
20
Sociology
111
20
203
LOWEST- AND HIGHEST-EARNING MAJORS
BACHELOR’S DEGREE HOLDERS
Rank
$48,871
Median Earnings
129
Drama and Theater Arts
108
Fine Arts
$48,871
113
Music
$48,686
135
Studio Arts
$41,762
132
Visual and Performing Arts
$42,465
117
Neuroscience
123
Art and Music Education
137
Early Childhood Education
130
Elementary Education
125
General Education
$45,572
127
Language and Drama Education
$45,440
116
Mathematics Teacher Education
$48,654
119
Science and Computer
Teacher Education
$47,785
118
Secondary Teacher Education
$48,078
Communications
and Journalism
120
Social Sciences or History
Teacher Education
$46,608
Computers, Statistics,
and Mathematics
126
Special Needs Education
$45,440
133
Teacher Education: Multiple Levels
122
Communication Disorders
Sciences and Services
109
Art History and Criticism
121
Composition and Speech
$46,608
110
Humanities
$48,686
124
Multi/Interdisciplinary Studies
131
Theology and Religious Vocations
128
Family and Consumer Sciences
111
Physical Fitness Parks
Recreation and Leisure
Human Services and
Community Organization
$48,686
112
Psychology
$48,686
134
Social Work
115
Anthropology and Archeology
$48,679
114
Interdisciplinary Social Sciences
$48,679
136
204
Major
$44,538
Agriculture and
Natural Resources
Architecture and
Engineering
$48,190
$45,613
$39,097
Arts
$42,736
$42,194
Biology and Life Sciences
Business
Education
$45,654
$48,871
$45,613
Health
Humanities and
Liberal Arts
$42,736
$44,743
$41,113
$42,194
Industrial Arts, Consumer
Services & Recreation
Law and Public Policy
Physical Sciences
Psychology and Social Work
Social Sciences
Lowest- and Highest-Earning Majors
Bachelor’s Degree Holders
Median Earnings
$72,501
Major
$90,141
Rank
Aerospace Engineering
7
Architectural Engineering
18
Chemical Engineering
5
Civil Engineering
12
Electrical Engineering
6
Engineering and Industrial Management
19
Engineering Mechanics Physics and Science
17
Environmental Engineering
22
General Engineering
16
Geological and Geophysical Engineering
10
Industrial and Manufacturing Engineering
14
Industrial Production Technologies
26
Mechanical Engineering
8
$97,743
Metallurgical Engineering
3
$97,372
Mining and Mineral Engineering
4
Miscellaneous Engineering
23
Petroleum Engineering
1
Business Economics
25
Finance
30
Management Information
Systems and Statistics
21
Applied Mathematics
13
Computer Engineering
9
Computer Science
11
$73,046
Information Sciences
27
$72,501
Mathematics
29
Statistics and Decision Science
20
Pharmacy, Pharmaceutical
Sciences, and Administration
2
Transportation Sciences and Technologies
28
Physics
15
Economics
24
$80,130
$96,156
$82,858
$93,215
$77,679
$80,787
$76,022
$80,787
$86,553
$81,452
$73,719
$86,883
$76,022
$135,754
$74,788
$72,501
$76,924
$82,858
$86,553
$82,858
$77,679
$112,519
$72,764
$81,143
$75,608
Source: Georgetown University Center on Education and the Workforce analysis of U.S. Census Bureau, American Community Survey micro data, 2009-2013 pooled sample.
205
LOWEST- AND HIGHEST-EARNING MAJORS
GRADUATE DEGREE HOLDERS
Rank
$65,162
Median Earnings
116
Commercial Art and
Graphic Design
$62,751
124
Drama and Theater Arts
$59,857
126
Film Video and Photographic Arts
$59,830
125
Fine Arts
$59,830
121
Music
$60,872
134
Studio Arts
$54,096
132
Visual and Performing Arts
$55,799
120
Neuroscience
$60,872
108
Advertising and Public Relations
$65,162
119
Art and Music Education
136
Early Childhood Education
129
Elementary Education
$56,965
127
General Education
$59,732
122
Language and Drama Education
$60,818
Communications
and Journalism
116
Mathematics Teacher Education
$62,751
Computers, Statistics,
and Mathematics
114
Miscellaneous Education
$64,104
113
Science and Computer
Teacher Education
$64,104
112
Secondary Teacher Education
$64,215
117
Social Sciences or History
Teacher Education
$62,144
120
Special Needs Education
$60,872
130
Teacher Education: Multiple Levels
123
Composition and Speech
131
Multi/Interdisciplinary Studies
137
Theology and Religious Vocations
128
Family and Consumer Sciences
109
135
206
Major
Physical Fitness Parks
Recreation and Leisure
Human Services and
Community Organization
110
Psychology
133
Social Work
111
Sociology
$60,872
Agriculture and
Natural Resources
Architecture and
Engineering
Arts
Biology and Life Sciences
$53,420
$56,625
$60,818
Business
Education
Health
Humanities and
Liberal Arts
$56,625
$50,727
$59,732
$64,915
Industrial Arts, Consumer
Services & Recreation
Law and Public Policy
Physical Sciences
$53,858
$64,915
$54,893
$64,915
Psychology and Social Work
Social Sciences
Lowest- and Highest-Earning Majors
Graduate Degree Holders
Median Earnings
$97,000
Major
$112,181
Aerospace Engineering
5
Chemical Engineering
7
Civil Engineering
22
Electrical Engineering
6
Engineering and Industrial Management
10
Engineering Mechanics Physics and Science
11
General Engineering
17
Geological and Geophysical Engineering
4
Industrial and Manufacturing Engineering
19
Mechanical Engineering
12
Metallurgical Engineering
8
Mining and Mineral Engineering
13
Miscellaneous Engineering
26
$108,603
$100,618
$111,861
$108,191
$106,839
$103,173
$113,930
$101,498
Rank
$106,839
$108,603
$105,771
$98,410
$128,430
Petroleum Engineering
1
Biochemical Sciences
30
Zoology
15
Business Economics
25
$101,453
Finance
21
$97,395
Operations Logistics and E-Commerce
29
Applied Mathematics
14
Computer Engineering
18
Computer Science
24
Statistics and Decision Science
23
Health and Medical
Preparatory Programs
2
Pharmacy, Pharmaceutical Sciences, and Administration
3
Chemistry
16
Geosciences
27
Nuclear, Industrial Radiology, and Biological Technologies
28
Physics
20
Economics
9
$97,358
$104,259
$99,536
$105,644
$101,498
$99,915
$100,465
$128,207
$117,523
$103,573
$98,394
$97,395
$101,453
$108,603
Source: Georgetown University Center on Education and the Workforce analysis of U.S. Census Bureau, American Community Survey micro data, 2009-2013 pooled sample.
207
MAJORS RANKED BY POPULARITY
BACHELOR’S DEGREE HOLDERS
30 Most Popular Majors (Rank)
Electrical Engineering (17) 1.68%
30 Least Popular Majors (Rank)
Agriculture and
Natural Resources
General Engineering (23) 1.32%
Mechanical Engineering (24) 1.32%
0.06% Food Science (116)
Architecture and
Engineering
Commercial Art and
1.44%
Graphic Design (22)
Fine Arts (21) 1.48%
Biology (14) 2.06%
Accounting (3) 4.63%
Arts
0.04% Engineering Mechanics,
Physics, and Science (123)
Biology and
Life Sciences
0.10% Engineering Technologies (111)
0.08% Mechanical Engineering
Related Technologies (113)
General Business (2) 5.39%
Business
0.04% Petroleum Engineering (124)
Journalism (27) 1.11%
Elementary Education (9) 2.79%
General Education (8) 2.87%
0.03% Botany (129)
Communications
and Journalism
Computers,
Statistics, and
Mathematics
Miscellaneous Health
1.20%
Medical Professions (25)
Nursing (4) 4.48%
Education
English Language
2.51%
and Literature (10)
History (18) 1.64%
Physical Fitness Parks
0.98%
Recreation and Leisure (28)
Health
Humanities and
Liberal Arts
Industrial Arts, Consumer
Services & Recreation
Law and Public Policy
Multi-Disciplinary or
1.14%
General Science (26)
Physical Sciences
Economics (16) 1.86%
Political Science and
1.89%
Government (15)
Sociology (20) 1.58%
0.02% Neuroscience (133)
0.05% Applied Mathematics (119)
0.06% Statistics and Decision
Science (117)
0.11% Science and Computer
Teacher Education (108)
0.11% Humanities (109)
0.11% Multi/Interdisciplinary
Studies (110)
Criminal Justice and
2.19%
Fire Protection (13)
Psychology (5) 4.04%
0.07% Molecular Biology (115)
0.06% Health and Medical
Preparatory Programs (118)
Liberal Arts (19) 1.62%
Family and Consumer
0.92%
Sciences (29)
0.02% Metallurgical Engineering (136)
0.02% Mining and Mineral
Engineering (131)
Communications and
3.52%
Mass Media (6)
Mathematics (30) 0.91%
0.03% Environmental Engineering (128)
0.01% Geological and Geophysical
Engineering (137)
Finance (12) 2.33%
Computer Science (11) 2.43%
0.05% Architectural Engineering (122)
0.08% Engineering and Industrial
Management (114)
Business Management
8.14%
and Administration (1)
Marketing and Marketing
3.15%
Research (7)
0.09% Agricultural Economics (112)
0.04% Public Policy (127)
0.04% Atmospheric Sciences
and Meteorology (126)
0.02% Geosciences (134)
0.05% Nuclear, Industrial Radiology, and
Biological Technologies (120)
0.03% Oceanography (130)
Psychology and
Social Work
Social Sciences
0.02% Physical Sciences (135)
0.05% Industrial and Organizational
Psychology (121)
0.02% Social Psychology (132)
0.04% Miscellaneous Social Sciences (125)
Source: Georgetown University Center on Education and the Workforce analysis of U.S. Census Bureau, American Community Survey micro data, 2009-2013 pooled sample.
208
GRADUATE DEGREE HOLDERS
30 Most Popular Majors (Rank)
Electrical Engineering (13) 2.30%
30 Least Popular Majors (Rank)
Agriculture and
Natural Resources
0.08% Food Science (119)
General Engineering (21) 1.37%
Mechanical Engineering (18) 1.61%
Architecture and
Engineering
Business Management
3.94%
and Administration (5)
Finance (17) 1.69%
Arts
Biology and
Life Sciences
General Business (8) 2.91%
Business
Computer Science (14) 2.01%
Mathematics (19) 1.61%
Elementary Education (4) 3.94%
General Education (3) 4.13%
Communications
and Journalism
Computers,
Statistics, and
Mathematics
Communication Disorders
0.95%
Sciences and Services (30)
Miscellaneous Health
1.12%
Medical Professions (23)
Chemistry (15) 1.92%
Multi-Disciplinary or
0.99%
General Science (28)
Social Work (22) 1.28%
Health
Humanities and
Liberal Arts
Sociology (20) 1.48%
0.02%
Geological and Geophysical
Engineering (137)
0.09%
Industrial Production
Technologies (115)
0.03%
Mechanical Engineering
Related Technologies (132)
0.05% Metallurgical Engineering (128)
0.03%
Mining and Mineral
Engineering (136)
0.08% Botany (118)
Operations Logistics and
E-Commerce (113)
0.09% Applied Mathematics (111)
0.07%
Multi/Interdisciplinary
Studies (120)
0.10%
Miscellaneous Industrial Arts
and Consumer Services (110)
0.09% Public Policy (114)
Industrial Arts, Consumer
Services & Recreation
Law and Public Policy
0.06%
0.08%
Psychology and
Social Work
Nuclear, Industrial Radiology, and
Biological Technologies (117)
0.04% Oceanography (130)
0.03% Physical Sciences (134)
0.06%
Social Sciences
Atmospheric Sciences
and Meteorology (126)
0.05% Geosciences (129)
Physical Sciences
Economics (12) 2.42%
Political Science and
3.31%
Government (7)
0.06% Engineering Technologies (127)
0.09%
Physics (29) 0.96%
Psychology (1) 6.41%
Engineering Mechanics
Physics and Science (116)
0.09% Neuroscience (112)
Liberal Arts (26) 1.03%
Criminal Justice and
1.05%
Fire Protection (24)
0.09%
0.10% Visual and Performing Arts (109)
Education
English Language
3.54%
and Literature (6)
Philosophy and
1.00%
Religious Studies (27)
Engineering and Industrial
Management (122)
0.03% Petroleum Engineering (131)
Nursing (10) 2.58%
History (11) 2.57%
0.07%
0.07% Environmental Engineering (123)
Marketing and Marketing
1.04%
Research (25)
Communications and
1.71%
Mass Media (16)
0.10% Forestry (108)
0.03% Architectural Engineering (133)
Biology (2) 5.49%
Accounting (9) 2.86%
0.06% Agricultural Economics (125)
Industrial and Organizational
Psychology (124)
0.03% Social Psychology (135)
0.07% Miscellaneous Social Sciences (121)
Source: Georgetown University Center on Education and the Workforce analysis of U.S. Census Bureau, American Community Survey micro data, 2009-2013 pooled sample.
209
HELP READING OUR CHARTS
LOWEST- AND HIGHEST-EARNING MAJORS
This chart shows the 30 highest paying majors and the 30
lowest paying majors.
The leftmost column displays the rank
of the 30 lowest paying majors among
the 137 major subgroups. To the right of
that column is the median annual wages
(2013$) of that major subgroup.
The rightmost column displays the rank
of the 30 highest paying majors among
the 137 major subgroups. To the left of
that column is the median annual wages
(2013$) of that major subgroup.
The chart is sorted alphabetically
by the 15 major groups included
in the center. Each of the 15 major
groups is represented by a distinc
color. For example, architecture and
engineering majors are red.
LOWEST AND HIGHEST EARNING MAJORS
Lowest and Highest Earning Majors
Bachelor’s Degree Holders
BACHELOR’S DEGREE HOLDERS
Rank
Major
$48,871
Median Earnings
Median Earnings
Major
$90,141
Rank
Aerospace Engineering
7
Architectural Engineering
18
Drama and Theater Arts
108
Fine Arts
$48,871
113
Music
$48,686
135
Studio Arts
132
Visual and Performing Arts
117
Neuroscience
123
Art and Music Education
137
Early Childhood Education
130
Elementary Education
125
General Education
127
Language and Drama Education
116
Mathematics Teacher Education
$48,654
119
Science and Computer
Teacher Education
$47,785
118
Secondary Teacher Education
$48,078
Communications
and Journalism
$97,743
Metallurgical Engineering
3
120
Social Science or History
Teacher Education
$46,608
Computers, Statistics
and Mathematics
$97,372
Mining and Mineral Engineering
4
126
Special Needs Education
$45,440
Miscellaneous Engineering
23
133
Teacher Education: Multiple Levels
122
Communication Disorders
Sciences and Services
109
Art History and Criticism
121
Composition and Speech
$46,608
110
Humanities
$48,686
124
Multi/Interdisciplinary Studies
131
Theology and Religious Vocations
128
Family and Consumer Sciences
111
Physical Fitness Parks
Recreation and Leisure
Human Services and
Community Organization
$48,686
112
Psychology
$48,686
134
Social Work
115
Anthropology and Archeology
$48,679
114
Interdisciplinary Social Sciences
$48,679
136
$44,538
$72,501
129
$41,762
$42,465
Agriculture and
Natural Resources
$96,156
Architecture and
Engineering
Arts
$81,452
$45,440
Business
$42,194
Engineering Mechanics Physics and Science
17
Environmental Engineering
22
General Engineering
16
Geological and Geophysical Engineering
10
Industrial and Manufacturing Engineering
14
Industrial Production Technologies
26
Mechanical Engineering
8
$135,754
$74,788
$72,501
Health
$76,924
$82,858
Humanities and
Liberal Arts
$86,553
$82,858
$42,736
$41,113
6
$76,022
Education
$48,871
$44,743
$73,719
Industrial Arts, Consumer
Services & Recreation
Law and Public Policy
Physical Sciences
Social Science
Petroleum Engineering
1
Business Economics
25
Finance
30
Management Information
Systems and Statistics
21
Applied Mathematics
13
Computer Engineering
9
Computer Science
11
$73,046
Information Sciences
27
$72,501
Mathematics
29
Statistics and Decision Science
20
$77,679
$112,519
Psychology and Social Work
12
19
$86,883
$45,654
$45,613
$86,553
5
Civil Engineering
Electrical Engineering
$76,022
Biology and Life Science
Chemical Engineering
Engineering and Industrial Management
$80,787
$42,736
$42,194
$93,215
$80,787
$45,613
$45,572
$82,858
$77,679
$48,190
$39,097
$80,130
$72,764
$81,143
$75,608
Pharmacy Pharmaceutical
Sciences and Administration
2
Transportation Sciences and Technologies
28
Physics
15
Economics
24
Source: Georgetown University Center on Education and the Workforce analysis of U.S. Census Bureau, American Community Survey micro data, 2009-2013 pooled sample.
34
210
35
er
0.06% Food Science (116)
0.05% Architectural Engineering (122)
0.08% Engineering and Industrial
Management (114)
MAJORS RANKED BY POPULARITY
0.04% Engineering Mechanics,
Physics, and Science (123)
0.10% Engineering Technologies (111)
0.03% Environmental Engineering (128)
This
chart shows the 30 most common majors and 30 least common
0.01% Geological and Geophysical
(137)
majors Engineering
for Bachelor’s
degree holders and graduate degree holders.
0.08% Mechanical Engineering
Related Technologies (113)
MAJORS RANKED BY POPULARITY The majors are sorted
0.02% Metallurgical Engineering (136)
BACHELOR’S DEGREE HOLDERS
0.02% Mining and Mineral
Engineering
(131)
The
leftmost column displays
alphabetically by major group
(displayed in the center on
each page)in a stacked column.
Each of the 15 major groups is
Agriculture and
represented
by a distinct color.
Natural Resources
rank of the
0.04% Petroleumthe
Engineering
(124)30 most com30 Most Popular mon
Majors
(Rank)
majors among the 137
0.03% Botany (129)
major subgroups.
Electrical Engineering
(17) 1.68%
0.07% Molecular Biology (115)
General Engineering (23) 1.32%
MAJORS RANKED BY POPULARITY
0.02% Neuroscience (133)
Architecture and
Mechanical Engineering (24) 1.32%
BACHELOR’S DEGREE HOLDERS
Engineering
0.05% Applied Mathematics (119)
Commercial Art and
30 Most Popular Majors (Rank)
1.44%
0.06% Statistics
and
Decision
Graphic
Design
(22)
Electrical Engineering (17) 1.68%
Science (117)
General Engineering (23) 1.32%
Fine Arts (21) 1.48%
Mechanical EngineeringArts
(24) 1.32%
0.11% Science and Computer
Commercial Art and
1.44%
Graphic Design (22)
The rank ofTeacher
each major
subgroup
is
Biology
(14) 2.06%
Education
(108)
Biology and
Biology (14) 2.06%
Life Science
Fine Arts (21) 1.48%
displayed
parentheses.
(Rank)
Accounting
(3) 4.63%
0.06% in
Health
and
Medical
Accounting (3) 4.63%
Preparatory Programs (118)
Business Management
8.14%
and Administration
0.11% Humanities
(109) (1)
Finance (12)
0.11% Multi/Interdisciplinary
Studies (110)
General Business (2)
0.04% Public Policy (127)
Marketing and Marketing
Research
(7)
0.04% Atmospheric
Sciences
and Meteorology (126)
Communications and
Mass(134)
Media (6)
0.02% Geosciences
0.05% Architectural Engineering (122)
Agriculture and
Natural Resources
0.06% Food Science (116)
0.04%
Engineering
0.05% Architectural
Engineering (122) Mechanics,
Physics,
and Science (123)
0.08% Engineering
and Industrial
Arts
0.04% Engineering Mechanics,
0.10%
Technologies (111)
Physics,Engineering
and Science (123)
Management (114)
Biology and
Life Science
5.39%
Communications and
3.52%
Mass Media (6)
3.15%
Computer Science (11) 2.43%
0.01% Geological and Geophysical
Business
Business
Elementary Education (9) 2.79%
General Education (8) 2.87%
3.52%
History (18) 1.64%
Physical Fitness Parks
0.98%
Recreation and Leisure (28)
History (18) 1.64%
0.11% Science and Computer
0.04%
Engineering (124)
TeacherPetroleum
Education (108)
Science (117)
0.06% Health and Medical
Preparatory Programs (118)
0.03%
Botany (129)
Health
1.14%
Psychology (5) 4.04%
Economics (16) 1.86%
Political Science and
1.89%
Government (15)
Education
Humanities and
Liberal Arts
Physical Sciences
Psychology and
Social Work
Physical Fitness Parks
0.98%
Recreation and Leisure (28)
0.04% Public Policy (127)
0.02%
Neuroscience
(133)
0.04% Atmospheric
Sciences
and Meteorology (126)
0.02% Geosciences (134)
0.05%
Applied Mathematics (119)
0.05% Nuclear, Industrial Radiology, and
Biological Technologies (120)
0.06%
Statistics
and Decision
0.03% Oceanography
(130)
0.02% PhysicalScience
Sciences (135) (117)
0.05% Industrial and Organizational
Social Science
Sociology (20) 1.58%
Psychology (121)
0.11%
Science and Computer
0.02% Social Psychology (132)
Teacher Education (108)
0.04% Miscellaneous Social Sciences (125)
0.06% Health and Medical
Preparatory Programs (118)
Source: Georgetown University Center on Education and the Workforce analysis of U.S. Census Bureau, American Community Survey micro data, 2009-2013 pooled sample.
38
Health
Liberal Arts (19) 1.62%
Family and Consumer
0.92%
Sciences (29)
0.11% Humanities (109)
0.11% Multi/Interdisciplinary
0.07%
Biology (115)
StudiesMolecular
(110)
Arts, Consumer
Computers, Statistics Industrial
Services & Recreation
Law and Public Policy
and
Mathematics
Multi-Disciplinary or
Miscellaneous
Health
0.02% Social
Psychology
(132) 1.20%
Medical Professions (25)
0.04% Miscellaneous Social Sciences (125)
Nursing (4) 4.48%
2.51%
Education
Criminal Justice and
2.19%
Fire Protection (13)
General Science (26)
0.02% Neuroscience (133)
0.02%
and Mineral
0.05% AppliedMining
Mathematics (119)
Engineering
(131)
0.06% Statistics
and Decision
Liberal Arts (19) 1.62%
Communications
Family and Consumer
0.92%
Sciencesand
(29) Journalism
0.02%
Metallurgical Engineering (136)
0.07% Molecular Biology (115)
Computers, Statistics
and Mathematics
English Language
2.51%
and Literature (10)
0.02% Physical Sciences (135)
Elementary Education (9) 2.79%
0.05% Industrial and Organizational
General Education
Psychology
(121) (8) 2.87%
, American Community Survey micro
data, 2009-2013
pooled sample.
English
Language
0.03% Botany (129)
Communications
and Journalism
Miscellaneous Health
1.20%
Medical Professions (25)
Nursing (4) 4.48%
0.02% Metallurgical Engineering (136)
0.02% MiningMechanical
and Mineral
0.08%
Engineering
Engineering (131)
Related Technologies (113)
0.04% Petroleum Engineering (124)
Journalism (27) 1.11%
Mathematics (30) 0.91%
0.10% Engineering Technologies (111)
0.03%
Environmental
Engineering (128)
0.03% Environmental
Engineering (128)
Engineering (137)
0.01%
Geological and Geophysical
0.08% Mechanical Engineering
RelatedEngineering
Technologies (113)
(137)
General Business (2) 5.39%
Marketing and Marketing
3.15%
Research (7)
0.08%
Engineering and Industrial
30 Least Popular Majors (Rank)
Management
(114)
0.09% Agricultural
Economics (112)
Architecture and
Engineering
Finance (12) 2.33%
To the immediate left (for most
Journalism
(27) 1.11%
0.05% Nuclear,
Industrial
Radiology,
and
popular)
or right
(for least
popular),
Biological Technologies (120)
Computer
Science
(11) 2.43%
the percent
of college
graduates
with
0.03% Oceanography (130)
each respective
major
is
displayed.
Mathematics (30) 0.91%
and Literature (10)
0.06% Food Science (116)
Business Management
8.14%
and Administration (1)
2.33%
The rightmost column
displays the rank of the 30
30 Least Popular Majors (Rank)
least common majors by
0.09%
Agricultural
Economics (112)
the 137
major subgroups.
0.11% Humanities (109)
0.11% Multi/Interdisciplinary
Studies (110)
Humanities and
Liberal Arts
Criminal Justice and
2.19%
Fire Protection (13)
Industrial Arts, Consumer
Services & Recreation
Law and Public Policy
Multi-Disciplinary or
1.14%
General Science (26)
Physical Sciences
0.04% Public Policy (127)
0.04% Atmospheric Sciences
and Meteorology (126)
0.02% Geosciences (134)
0.05% Nuclear, Industrial Radiology, and
211
Biological Technologies (120)


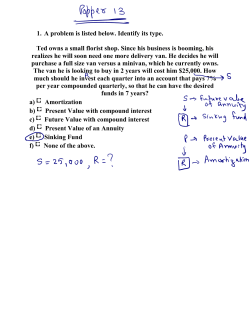
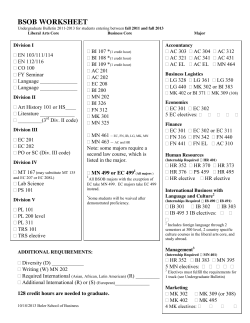


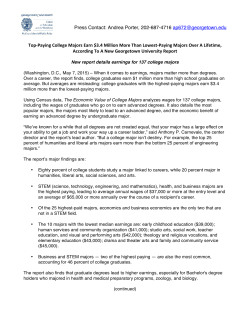


© Copyright 2026