
THE WMURGRANITE STATE POLL
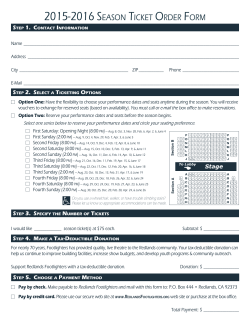
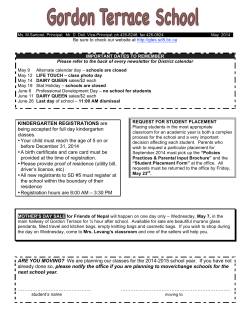
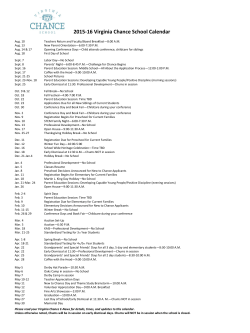
THE WMUR GRANITE STATE POLL May 27, 2015 AYOTTE AND HASSAN IN DEAD HEAT FOR 2016 NH SENATE; GUINTA FAVORABILITY HURT BY SCANDAL By: Andrew E. Smith, Ph.D. Zachary S. Azem, M.A. UNH Survey Center 603/862-2226 www.unh.edu/survey-center DURHAM, NH – New Hampshire Senator Kelly Ayotte continues to be popular in the state but is tied with Governor Maggie Hassan if Hassan decides to run for Senate in 2016. First District Congressman Frank Guinta’s favorability ratings have dropped in the wake of a Federal Election Commission fine concerning fundraising in his 2010 election. These findings are based on the latest WMUR Granite State Poll, conducted by the University of New Hampshire Survey Center. Five hundred and sixty-seven (567) randomly selected New Hampshire adults were interviewed by landline and cellular telephone between May 6 and May 22, 2015. The margin of sampling error for the survey is +/- 4.1 percent. Included were five hundred twenty-four (524) likely 2016 general election voters (MSE = +/- 4.3%). Included were 289 residents of New Hampshire’s First Congressional District (MSE = +/- 5.8%) and 278 from the Second District (MSE = +/- 5.9%). Favorability Ratings – Senator Kelly Ayotte New Hampshire junior senator Kelly Ayotte continues to be popular in the state. Currently, 48% of New Hampshire adults have a favorable opinion of Ayotte, 28% have an unfavorable opinion of her, 5% are neutral and 19% don’t know enough about her to say. Ayotte’s net favorability rating is +20%, which is up from +17% in February. She remains very popular among Republicans (net favorability rating of +51%), popular among independents (+13%) and unpopular among Democrats (-11%). Favorability Ratings – Kelly Ayotte 100% 90% 80% 70% 60% 50% 51% 49% 45% 37% 38% 38% 36% 40% 41% 53% 45% 47% 42% 43% 30% 27% 29% 20% 20% 10% 0% 8% 8% 25% 25% 24% 26% 29% 32% 25% 49% 50% 44% 43% 41% 41% 43% 28% 25% 32% 31% 30% 28% 48% 28% 25% 27% 26% 12% 13% Apr. '10 Apr. '11 Apr. '12 Favorable 51% 50% 44% Apr. '13 Apr. '14 May. '15 Unfavorable We ask that this copyrighted information be referred to as the Granite State Poll, sponsored by WMUR-TV, and conducted by the University of New Hampshire Survey Center. US Senate – Ayotte vs. Hassan Senator Ayotte has announced her intention to run for a second term in the Senate, and it is widely speculated that Governor Maggie Hassan will challenge her for the seat. If this takes place, the Senate election in New Hampshire will be one of the most closely watched races in the country. However, because the election is so far away, very few likely voters have decided on who they will support -- just 6% of likely voters say they have definitely decided, 7% are leaning toward a candidate, and 87% are still trying to decide. If the 2016 senate election was held today and Ayotte and Hassan were the candidates, 45% would of likely voters say they would vote for Ayotte, 43% would vote for Hassan, 2% would vote for someone else and 9% are undecided. Ayotte and Hassan hold wide leads among members of their party (Ayotte leads among Republicans 81%-9% and Hassan leads among Democrats 87%-6%) and Ayotte has a 46%-29% edge among Independents. Currently 32% of likely voters have a favorable opinion of both Ayotte and Hassan – among this group 48% would support Ayotte and 42% would support Hassan. US Senate - Ayotte vs. Hassan 100% 87% 81% 80% 60% 46% 45% 43% 40% 29% 20% 9% 6% 17% 9% 8% 7% 0% Ayotte Hassan All Likely Voters (May '15) Democrat Don't Know Independent Republican Favorability Ratings – Jeanne Shaheen After being reelected to a second term in 2014, senior senator Jeanne Shaheen has recovered popularity after a strong election battle with Scott Brown. Currently, 57% of New Hampshire adults say they have a favorable opinion of Shaheen, 30% have an unfavorable opinion of her, 5% are neutral and 8% don’t know enough about her to say. Shaheen’s net favorability rating, the percentage who have a favorable opinion of her minus the percentage who have an unfavorable opinion, is +27%, up from +10% in February. Shaheen is very popular among Democrats (net +78%), popular among independents (+20%) and unpopular among Republicans (-17%). Favorability Ratings –Jeanne Shaheen 100% 90% 80% 70% 60% 60% 56% 57% 56% 56% 52% 47% 50% 47% 50% 51% 48% 47% 52% 49% 48% 48% 52% 53% 53% 58% 56% 56% 59% 59% 53% 57% 57% 57% 50% 49% 50% 48% 34% 35% 36% 38% 40% 40% 30% 20% 24% 25% 23% 29% 33% 32% 37% 36% 36% 39% 39% 35% 35% 36% 36% 33% 29% 28% 28% 31% 29% 29% 30% 22% 23% 23% 22% 10% 0% Apr. '08 Apr. '09 Apr. '10 Apr. '11 Favorable Apr. '12 Unfavorable Apr. '13 Apr. '14 May '15 Favorability Ratings – Frank Guinta First District Congressman Frank Guinta, who won his second term after defeating Carol Shea-Porter last November, is not popular in his district. The Federal Election Commission (FEC) recently fined Guinta over campaign finance violations and ordered him to repay $355,000 that was loaned to his 2010 campaign. Subsequently, Senator Ayotte and other prominent st Republicans have called for his resignation. Currently, only 30% of 1 C.D. adults have a favorable opinion of Guinta, 40% have an unfavorable opinion of him, 6% are neutral and 24% don’t know enough about him to say. His net favorability rating is 10%, up from -13% in February. Guinta is only somewhat popular among Republicans (net +23%), and is unpopular among Independents (-34%) and Democrats (-32%). Favorability Ratings - Frank Guinta NH 1st District 50% 39% 37% 40% 30% 30% 28% 33% 33% 31% 30%31%30%30% 28% 38% 10% 8% 40% 36% 27% 23%22% 20% 36% 34%33%33% 32% 30% 28%28%27% 26% 24% 22% 20% 18%17% 14% 11% 30% 29% 27% 26%27%27% 24% 23% 0% Apr. June Oct. Feb. Apr. July Sept. Feb. Apr. July Oct. Feb. Apr. Aug. Oct. Feb. Apr. July Oct. Jan. Apr. July Oct. Feb. May '09 '09 '09 '10 '10 '10 ‘10 '11 '11 '11 '11 '12 '12 '12 '12 '13 '13 '13 '13 '14 '14 '14 '14 '15 '15 Favorable Unfavorable Guinta’s favorability in this poll began to slide after the FEC story came out and then dipped dramatically after Senator Ayotte and others called for his resignation from Congress. Favorability Ratings - Frank Guinta NH 1st District -May 2015 Poll 50% 49% 42% 40% 36% 34% 30% 29% 20% 20% 10% 0% Before FEC Story After FEC Story Favorable Unfavorable After Ayotte Interview Favorability Ratings – Ann Kuster Second District Congresswoman Ann Kuster, despite comfortably winning a second term in November, continues to be nd unpopular in her district. Currently, only 24% of 2 District adults have a favorable opinion of Kuster, 38% have an unfavorable opinion of her, 6% are neutral, and 32% don’t know enough about her to say. Her net favorability rating is -14%, up from -17% in February. She is only somewhat popular among Democrats (net +37%), unpopular among Independents (net -24%) and very unpopular among Republicans (net -52%). Favorability Ratings – Ann Kuster NH 2nd District 50% 38% 40% 37% 35% 34% 32% 33% 32% 29% 30% 26% 25% 20% 10% 6% 8% 8% 10% 14% 27% 28% 30% 21% 23% 39% 38% 30% 25% 27% 28% 28% 23% 24% 23% 16% 13% 0% Oct. Feb. Apr. July Sept. Feb. Apr. July Oct. Feb. Apr. Aug. Oct. Feb. Apr. July Oct. Jan. Apr. July Oct. Feb. May '09 '10 '10 '10 ‘10 '11 '11 '11 '11 '12 '12 '12 '12 '13 '13 '13 '13 '14 '14 '14 '14 '15 '15 Favorable Unfavorable Granite State Poll Methodology These findings are based on the latest WMUR Granite State Poll, conducted by the University of New Hampshire Survey Center. Five hundred and sixty-seven (567) randomly selected New Hampshire adults were interviewed by landline and cellular telephone between May 6 and May 22, 2015. The margin of sampling error for the survey is +/- 4.1 percent. Included were five hundred twenty-four (524) likely 2016 general election voters (MSE = +/- 4.3%). Included were 289 residents of New Hampshire’s First Congressional District (MSE = +/- 5.8%) and 278 from the Second District (MSE = +/- 5.9%). The data have been weighted to adjust for numbers of adults and telephone lines within households, respondent sex, age, and region of the state. In addition to potential sampling error, all surveys have other potential sources of non-sampling error including question order effects, question wording effects, and non-response. Due to rounding, percentages may not sum to 100%. The number of respondents in each demographic below may not equal the number reported in cross-tabulation tables as some respondents choose not to answer some questions. Granite State Poll, Spring 2015 Demographics Sex Male Female N 280 287 % 49% 51% 18 to 34 35 to 49 50 to 64 65 and Over N 138 164 152 99 % 25% 30% 27% 18% Highest Level of Education High School or Less Some College College Graduate Post-Graduate N 89 152 190 127 % 16% 27% 34% 23% Years Lived in NH 10 yrs. Or less 11-20 yrs. > 20 yrs. N 72 114 369 % 13% 21% 67% Age Region N 52 88 78 152 88 109 % 9% 16% 14% 27% 16% 19% Party Registration Democrat Undeclared Republican N 110 245 129 % 23% 51% 26% Party Identification Democrat Independent Republican N 206 139 210 % 37% 25% 38% North Country Central/Lakes Connecticut Valley Mass Border Seacoast Manchester Area Granite State Poll, Spring 2015 Demographics – 2016 Likely Voters Sex Male Female N 261 263 % 50% 50% 18 to 34 35 to 49 50 to 64 65 and Over N 113 161 143 94 % 22% 32% 28% 18% Highest Level of Education High School or Less Some College College Graduate Post-Graduate N 75 144 176 120 % 15% 28% 34% 23% Years Lived in NH 10 yrs. Or less 11-20 yrs. > 20 yrs. N 69 108 336 % 13% 21% 66% Age Region N 46 85 72 140 80 101 % 9% 16% 14% 27% 15% 19% Party Registration Democrat Undeclared Republican N 99 236 125 % 22% 51% 27% Party Identification Democrat Independent Republican N 188 122 203 % 37% 24% 40% North Country Central/Lakes Connecticut Valley Mass Border Seacoast Manchester Area Favorability Rating – Senator Jeanne Shaheen “Next, I’d like to get your overall opinion of some people in the news. As I read each name, please say if you have a favorable or unfavorable opinion of this person – or if you have never heard of him or her. Senator (Former Governor) Jeanne Shaheen?” Statewide May ‘15 Feb. ‘15 Oct. ‘14 July ‘14 Apr. ‘14 Jan. ‘14 Oct. ‘13 July ‘13 Apr. ‘13 Feb. ‘13 Oct. ‘12 Aug. ‘12 Apr. ‘12 Feb. ‘12 Oct. ‘11 July ‘11 Apr. ‘11 Feb. ‘11 Sept. ‘10 July ‘10 Apr. ‘10 Feb. ‘10 Oct. ‘09 Jun. ‘09 Apr. ‘09 Feb. ‘09 Sep. ‘08 July ‘08 Apr. ‘08 Feb. ‘08 Sept. ‘07 July ‘07 Favorable 57% 48% 50% 57% 49% 50% 57% 53% 59% 59% 56% 56% 58% 53% 53% 52% 48% 48% 49% 52% 47% 48% 51% 50% 47% 56% 47% 53% 56% 57% 56% 60% Neutral 5% 8% 6% 5% 7% 7% 6% 8% 6% 9% 4% 4% 6% 7% 9% 7% 7% 9% 5% 6% 6% 5% 5% 6% 7% 7% 5% 9% 10% 13% 11% 9% Unfavorable 30% 38% 36% 29% 35% 34% 22% 23% 23% 22% 29% 31% 28% 28% 29% 33% 36% 36% 35% 35% 39% 39% 36% 36% 37% 32% 40% 31% 29% 23% 25% 24% Don’t Know 8% 6% 9% 9% 9% 9% 15% 16% 12% 11% 11% 9% 8% 12% 9% 8% 9% 7% 11% 8% 8% 8% 7% 8% 9% 5% 8% 6% 5% 7% 8% 8% Net +27% +10% +14% +28% +14% +16% +35% +30% +36% +37% +27% +25% +30% +25% +24% +19% +12% +12% +14% +17% +8% +9% +15% +14% +10% +24% +7% +22% +27% +34% +31% +36% (N) (567) (509) (680) (668) (505) (581) (662) (512) (504) (580) (588) (580) (533) (527) (554) (511) (503) (519) (515) (503) (511) (496) (502) (557) (503) (617) (522) (472) (500) (555) (506) (520) Favorability Rating – Senator Kelly Ayotte “Next, I'd like to get your overall opinion of some people in the news. As I read each name, please say if you have a favorable or unfavorable opinion of this person - or if you have never heard of him or her. Senator (Former New Hampshire Attorney General) Kelly Ayotte?” Statewide May ‘15 Feb. ‘15 Oct. ‘14 July ‘14 Apr. ‘14 Jan. ‘14 Oct. ‘13 July ‘13 Apr. ‘13 Feb. ‘13 Oct. ‘12 Aug. ‘12 Apr. ‘12 Feb. ‘12 Oct. ‘11 July ‘11 Apr. ‘11 Feb. ‘11 Sept. ‘10 July ‘10 Apr. ‘10 Feb. ‘10 Oct. ‘09 Jun. ‘09 Favorable 48% 43% 44% 50% 49% 43% 41% 41% 50% 51% 44% 53% 43% 42% 47% 45% 49% 51% 41% 36% 38% 38% 37% 45% Neutral 5% 13% 7% 8% 9% 10% 8% 8% 9% 7% 5% 5% 5% 9% 10% 12% 8% 8% 11% 7% 7% 6% 6% 7% Unfavorable 28% 26% 27% 25% 28% 30% 31% 32% 25% 28% 32% 25% 29% 26% 24% 25% 25% 20% 29% 27% 13% 12% 8% 8% Don’t Know 19% 19% 22% 17% 15% 18% 21% 19% 16% 14% 19% 18% 22% 23% 18% 18% 19% 21% 19% 30% 41% 44% 49% 40% Net +20% +17% +17% +25% +21% +13% +10% +9% +25% +23% +12% +28% +14% +16% +23% +20% +24% +31% +12% +9% +25% +26% +29% +37% (N) (567) (509) (679) (668) (505) (582) (662) (512) (505) (579) (590) (577) (531) (527) (554) (514) (501) (520) (515) (504) (508) (497) (501) (556) Firmness of Choice For New Hampshire Senate – Likely Voters “I know that it is early, but have you definitely decided who you will vote for in the New Hampshire Senate election in 2016 … are you leaning toward someone … or have you considered some candidates but are still trying to decide?” May ‘15 Def. Decided 6% Leaning 7% Trying to Decide 87% (N=) (518) US Senate – Ayotte vs. Hassan "If the 2016 Senate election was being held today and the candidates were Kelly Ayotte the Republican and Maggie Hassan, the Democrat, who would you vote for?" ROTATE CANDIDATES Ayotte Hassan Other Don’t know / undecided (N=) May ‘15 45% 43% 2% 9% (501) Favorability Rating – Frank Guinta - NH 1st District "Next, I'd like to get your overall opinion of some people in the news. As I read each name, please say if you have a favorable or unfavorable opinion of this person - or if you have never heard of him or her. Congressman (Former Congressman) Frank Guinta?” 1st C.D. May ‘15 Feb. ‘15 Oct. ‘14 July ‘14 Apr. ‘14 Jan. ‘14 Oct. ‘13 July ‘13 Oct. ’12 – LVs Aug. ‘12 Apr. ‘12 Feb. ‘12 Oct. ‘11 July ‘11 Apr. ‘11 Feb. ‘11 Sept. ‘10 July ‘10 Apr. ‘10 Feb. ‘10 Oct. ‘09 April ‘09 Favorable 30% 23% 27% 32% 27% 33% 24% 27% Neutral 6% 13% 9% 8% 7% 11% 8% 6% Unfavorable 40% 36% 29% 27% 33% 26% 34% 36% Don’t Know 24% 28% 35% 33% 33% 29% 34% 31% Net -10% -13% -2% +5% -6% +7% -10% -9% (N) (289) (236) (339) (336) (255) (300) (325) (274) 38% 37% 31% 33% 30% 24% 31% 30% 33% 28% 22% 23% 28% 30% 6% 5% 9% 8% 12% 12% 10% 12% 4% 9% 7% 7% 9% 12% 39% 27% 28% 28% 30% 30% 26% 22% 20% 17% 18% 14% 11% 8% 17% 31% 33% 30% 28% 34% 33% 35% 42% 46% 52% 55% 52% 51% -1% +6% +3% +5% 0% -6% +5% +8% +13% +11% +4% +9% +17% +22% (273) (270) (253) (256) (247) (248) (243) (236) (262) (264) (257) (251) (251) (260) nd Favorability Rating – U.S. Representative Ann McLane Kuster - NH 2 District "Next, I'd like to get your overall opinion of some people in the news. As I read each name, please say if you have a favorable or unfavorable opinion of this person - or if you have never heard of him or her. Congresswoman (Attorney) Ann McLane Kuster?” nd 2 C.D. May ‘15 Feb. ‘15 Oct. ‘14 July ‘14 Apr. ‘14 Jan. ‘14 Oct. ‘13 July ‘13 Apr. ‘13 Feb. ‘13 Oct. ’12 – LVs Aug. ‘12 Apr. ‘12 Sept. ‘10 July ‘10 Apr. ‘10 Feb. ‘10 Oct. ‘09 Favorable 24% 23% 28% 34% 27% 30% 23% 27% 29% 32% 35% 21% 26% Neutral 6% 16% 10% 7% 10% 6% 9% 9% 8% 8% 7% 1% 3% Unfavorable 38% 39% 37% 28% 33% 32% 28% 25% 30% 23% 25% 16% 13% Don’t Know 32% 21% 24% 31% 29% 31% 40% 38% 34% 36% 33% 61% 58% Net -14% -16% -9% +6% -6% -2% -5% +2% -1% +9% +10% +5% +13% (N) (278) (273) (339) (325) (245) (281) (330) (232) (276) (325) (325) (311) (270) 38% 10% 8% 8% 6% 6% 3% 7% 2% 5% 14% 2% 4% 3% 2% 42% 85% 81% 87% 87% +24% +8% +4% +5% +4% (243) (226) (250) (240) (252) Favorability Rating – Senator Jeanne Shaheen Favorable 57% Neutral 5% Unfavorable 30% Don’t Know 8% (N) 567 Registered Democrat Registered Undeclared Registered Republican 84% 57% 30% 3% 4% 9% 7% 34% 51% 7% 6% 11% 110 245 129 Democrat Independent Republican 86% 49% 34% 2% 10% 5% 8% 29% 51% 4% 12% 10% 206 139 210 Liberal Moderate Conservative 83% 63% 31% 1% 5% 6% 13% 21% 57% 3% 10% 6% 130 238 157 Support Tea Party Neutral Oppose Tea Party 19% 61% 74% 8% 4% 3% 73% 22% 18% 0% 13% 5% 109 209 214 Likely 2016 Voter Non-Likely 2016 Voter 56% 64% 5% 9% 31% 21% 8% 5% 524 43 Read Union Leader Read Boston Globe Read Local Newspapers Watch WMUR Listen to NHPR 50% 73% 62% 60% 74% 3% 3% 6% 3% 4% 42% 22% 27% 32% 21% 4% 2% 5% 5% 1% 171 85 210 324 144 10 yrs or less in NH 11 to 20 years More than 20 years 49% 59% 58% 8% 2% 5% 21% 30% 32% 23% 9% 5% 72 114 369 18 to 34 35 to 49 50 to 64 65 and over 60% 52% 58% 60% 6% 7% 3% 3% 19% 35% 34% 32% 14% 7% 5% 5% 138 164 152 99 Male Female 51% 63% 5% 5% 38% 22% 6% 10% 280 287 High school or less Some college College graduate Post-graduate 66% 56% 52% 61% 7% 9% 2% 4% 20% 27% 36% 29% 7% 7% 10% 6% 89 152 190 127 Attend services 1 or more/week 1-2 times a month Less often Never 46% 45% 57% 70% 4% 5% 5% 6% 39% 41% 30% 19% 10% 9% 9% 5% 140 59 170 176 North Country Central / Lakes Connecticut Valley Mass Border Seacoast Manchester Area 77% 58% 58% 53% 52% 57% 1% 3% 2% 9% 9% 3% 19% 34% 26% 33% 29% 31% 4% 5% 14% 6% 10% 9% 52 88 78 152 88 109 First Cong. Dist Second Cong. Dist 56% 58% 6% 4% 29% 31% 9% 7% 289 278 STATEWIDE Favorability Rating – Senator Kelly Ayotte Favorable 48% Neutral 5% Don’t Know 19% (N) 567 Registered Democrat Registered Undeclared Registered Republican 36% 47% 70% 6% 5% 2% 39% 33% 15% 19% 14% 13% 110 245 129 Democrat Independent Republican 32% 42% 65% 4% 7% 5% 43% 29% 14% 21% 22% 16% 206 139 210 Liberal Moderate Conservative 29% 45% 68% 3% 4% 4% 51% 26% 13% 18% 24% 14% 130 238 158 Support Tea Party Neutral Oppose Tea Party 76% 48% 34% 7% 2% 6% 14% 20% 46% 3% 30% 14% 109 209 214 Likely 2016 Voter Non-Likely 2016 Voter 49% 30% 5% 2% 30% 10% 16% 58% 524 43 Read Union Leader Read Boston Globe Read Local Newspapers Watch WMUR Listen to NHPR 55% 32% 48% 56% 38% 4% 4% 7% 4% 5% 25% 57% 34% 29% 47% 16% 8% 11% 11% 10% 171 85 210 324 144 10 yrs or less in NH 11 to 20 years More than 20 years 38% 46% 49% 10% 2% 5% 19% 32% 29% 32% 20% 17% 72 114 369 18 to 34 35 to 49 50 to 64 65 and over 23% 52% 58% 56% 9% 3% 5% 5% 21% 32% 28% 33% 47% 13% 9% 6% 138 164 152 99 Male Female 48% 47% 6% 4% 30% 27% 16% 22% 280 287 High school or less Some college College graduate Post-graduate 46% 48% 46% 48% 7% 3% 7% 4% 19% 29% 29% 34% 28% 20% 18% 14% 89 152 190 127 Attend services 1 or more/week 1-2 times a month Less often Never 50% 45% 51% 40% 4% 7% 8% 3% 27% 23% 18% 41% 18% 25% 23% 16% 140 59 170 176 North Country Central / Lakes Connecticut Valley Mass Border Seacoast Manchester Area 42% 43% 44% 50% 53% 48% 6% 5% 2% 7% 6% 3% 28% 33% 37% 26% 24% 24% 24% 19% 17% 16% 16% 24% 52 88 78 152 88 109 First Cong. Dist Second Cong. Dist 51% 43% 4% 6% 24% 32% 20% 18% 289 278 STATEWIDE Unfavorable 28% Firmness of choice for New Hampshire Senate Definitely Decided 6% Leaning Toward Someone 7% Still Trying To Decide 87% (N=) 518 Registered Democrat Registered Undeclared Registered Republican 4% 7% 7% 10% 5% 12% 85% 88% 81% 97 232 125 Democrat Independent Republican 6% 3% 8% 8% 3% 9% 87% 93% 83% 185 120 203 Liberal Moderate Conservative 6% 5% 8% 9% 6% 8% 85% 88% 84% 119 221 141 Support Tea Party Neutral Oppose Tea Party 9% 5% 6% 11% 2% 11% 80% 93% 83% 107 183 196 Union household Non-union 7% 6% 16% 6% 77% 89% 78 427 Read Union Leader Read Boston Globe Read Local Newspapers Watch WMUR Listen to NHPR 7% 7% 6% 6% 6% 5% 6% 9% 8% 13% 88% 87% 85% 86% 82% 160 76 203 301 130 10 yrs or less in NH 11 to 20 years More than 20 years 3% 5% 7% 4% 5% 8% 93% 89% 85% 69 105 332 18 to 34 35 to 49 50 to 64 65 and over 0% 5% 8% 12% 2% 7% 10% 9% 98% 88% 81% 80% 112 160 140 92 Male Female 8% 4% 8% 6% 83% 90% 257 260 High school or less Some college College graduate Post-graduate 5% 4% 4% 12% 1% 7% 9% 9% 94% 89% 87% 79% 73 144 175 117 Attend services 1 or more/week 1-2 times a month Less often Never 7% 3% 7% 5% 6% 3% 6% 11% 87% 94% 87% 84% 136 52 161 150 North Country Central / Lakes Connecticut Valley Mass Border Seacoast Manchester Area 4% 8% 3% 4% 10% 7% 8% 9% 3% 10% 5% 5% 88% 83% 94% 85% 85% 88% 45 84 72 138 79 100 First Cong. Dist Second Cong. Dist 7% 5% 6% 8% 87% 87% 267 251 STATEWIDE US Senate – Kelly Ayotte vs. Maggie Hassan Ayotte 45% Hassan 43% Other 2% Don’t Know 9% (N) 501 Registered Democrat Registered Undeclared Registered Republican 6% 41% 91% 88% 44% 7% 0% 4% 0% 6% 11% 2% 98 220 123 Democrat Independent Republican 6% 46% 81% 87% 29% 9% 0% 9% 1% 7% 17% 8% 185 106 199 Liberal Moderate Conservative 7% 47% 75% 88% 39% 13% 0% 4% 2% 5% 9% 9% 116 218 139 Support Tea Party Neutral Oppose Tea Party 94% 49% 18% 4% 36% 69% 1% 2% 3% 0% 13% 10% 101 179 195 Favorable of Ayotte Favorable of Hassan Favorable of Both Favorable of Neither 93% 4% 48% 52% 2% 90% 42% 19% 2% 0% 0% 9% 4% 6% 9% 20% 97 141 159 104 Read Union Leader Read Boston Globe Read Local Newspapers Watch WMUR Listen to NHPR 52% 26% 43% 45% 21% 37% 64% 47% 45% 67% 3% 0% 2% 2% 1% 7% 10% 7% 8% 11% 157 71 192 300 131 10 yrs or less in NH 11 to 20 years More than 20 years 27% 38% 50% 59% 44% 40% 1% 5% 2% 13% 12% 8% 55 104 330 18 to 34 35 to 49 50 to 64 65 and over 35% 49% 45% 47% 47% 41% 42% 47% 8% 0% 2% 1% 10% 10% 10% 5% 99 155 141 94 Male Female 51% 40% 36% 50% 3% 2% 10% 8% 247 254 High school or less Some college College graduate Post-graduate 46% 47% 45% 42% 31% 44% 44% 49% 3% 3% 3% 2% 20% 7% 9% 7% 69 141 170 113 Attend services 1 or more/week 1-2 times a month Less often Never 47% 42% 53% 34% 40% 44% 37% 55% 1% 6% 2% 3% 12% 8% 8% 8% 134 45 156 148 North Country Central / Lakes Connecticut Valley Mass Border Seacoast Manchester Area 41% 46% 36% 51% 42% 48% 52% 46% 43% 40% 39% 43% 1% 0% 5% 3% 2% 2% 5% 7% 16% 6% 17% 7% 46 85 71 124 76 100 First Cong. Dist Second Cong. Dist 43% 47% 43% 42% 3% 2% 10% 8% 264 237 STATEWIDE Favorability Rating – Congressman Frank Guinta Favorable 30% Neutral 6% Unfavorable 40% Don’t Know 24% (N) 289 Registered Democrat Registered Undeclared Registered Republican 11% 32% 50% 11% 6% 4% 62% 41% 25% 16% 20% 20% 58 114 68 Democrat Independent Republican 20% 17% 46% 5% 3% 8% 52% 51% 23% 24% 29% 23% 113 56 116 Liberal Moderate Conservative 32% 21% 44% 5% 8% 3% 50% 42% 28% 13% 29% 25% 64 130 79 Support Tea Party Neutral Oppose Tea Party 54% 37% 13% 3% 5% 8% 34% 31% 54% 10% 27% 25% 46 117 114 Likely 2016 Voter Non-Likely 2016 Voter 31% 9% 6% 3% 42% 19% 21% 70% 268 21 Before FEC Story After FEC Story After Ayotte Interview 36% 34% 20% 6% 2% 8% 29% 42% 49% 29% 22% 23% 88 65 127 Union household Non-union 32% 29% 0% 7% 46% 40% 21% 25% 39 242 Read Union Leader Read Boston Globe Read Local Newspapers Watch WMUR Listen to NHPR 39% 30% 27% 34% 28% 5% 2% 10% 8% 6% 41% 49% 40% 44% 53% 16% 19% 23% 14% 13% 100 38 89 169 76 10 yrs or less in NH 11 to 20 years More than 20 years 18% 44% 26% 4% 5% 7% 34% 41% 41% 45% 11% 26% 32 69 183 18 to 34 35 to 49 50 to 64 65 and over 24% 34% 27% 33% 0% 9% 8% 4% 22% 41% 54% 45% 54% 16% 11% 18% 67 95 75 47 Male Female 32% 27% 4% 8% 43% 37% 21% 28% 150 140 High school or less Some college College graduate Post-graduate 19% 47% 26% 22% 8% 6% 3% 9% 37% 28% 39% 58% 36% 19% 32% 11% 37 73 111 64 Attend services 1 or more/week 1-2 times a month Less often Never 27% 28% 37% 27% 3% 8% 13% 2% 47% 26% 32% 45% 23% 38% 18% 27% 83 30 77 92 North Country Central / Lakes Mass Border Seacoast Manchester Area 4% 41% 36% 21% 40% 6% 14% 8% 6% 2% 55% 24% 35% 49% 35% 35% 22% 22% 25% 23% 27 19 66 88 89 FIRST CONG DIST Favorability Rating – Congresswoman Ann Kuster Favorable 24% Neutral 6% Unfavorable 38% Don’t Know 32% (N) 278 Registered Democrat Registered Undeclared Registered Republican 62% 17% 13% 7% 7% 5% 12% 40% 66% 20% 36% 16% 51 131 61 Democrat Independent Republican 50% 10% 11% 5% 6% 7% 13% 34% 63% 32% 50% 19% 94 83 94 Liberal Moderate Conservative 41% 27% 11% 7% 5% 4% 15% 34% 66% 37% 34% 19% 65 108 79 Support Tea Party Neutral Oppose Tea Party 5% 18% 45% 4% 8% 6% 67% 35% 24% 24% 40% 24% 63 93 100 Likely 2016 Voter Non-Likely 2016 Voter 25% 15% 5% 16% 41% 8% 30% 61% 256 22 Union household Non-union 29% 23% 3% 6% 48% 36% 20% 35% 43 230 Read Union Leader Read Boston Globe Read Local Newspapers Watch WMUR Listen to NHPR 15% 20% 35% 26% 44% 4% 2% 4% 3% 2% 55% 54% 39% 44% 34% 25% 24% 22% 26% 20% 71 47 121 155 69 10 yrs or less in NH 11 to 20 years More than 20 years 20% 23% 25% 10% 0% 6% 32% 46% 37% 38% 32% 32% 40 45 187 18 to 34 35 to 49 50 to 64 65 and over 8% 20% 33% 38% 9% 3% 3% 6% 30% 47% 42% 33% 53% 31% 23% 23% 71 69 76 52 Male Female 18% 29% 5% 6% 45% 32% 31% 33% 130 148 High school or less Some college College graduate Post-graduate 19% 15% 32% 29% 8% 5% 4% 7% 33% 39% 38% 40% 40% 41% 26% 25% 52 79 79 63 Attend services 1 or more/week 1-2 times a month Less often Never 26% 16% 20% 30% 3% 10% 3% 9% 53% 42% 29% 34% 19% 32% 47% 27% 57 29 93 84 North Country Central / Lakes Connecticut Valley Mass Border Manchester Area 17% 25% 25% 25% 21% 3% 4% 5% 9% 5% 23% 39% 36% 37% 68% 57% 32% 35% 28% 6% 26 69 78 86 20 SECOND CONG DIST


© Copyright 2026