
O President’s Message
President’s Message
O
ne of the greatest milestones in the history of the Golden Gate Bridge, Highway and
Transportation District (District) came on May 28, 2007, when the iconic Golden Gate
Bridge celebrated its 70th anniversary.
While there was no fanfare or public celebration for the 70th anniversary, several notable
activities did take place. In recognition of the 70th anniversary, a new technical and
historical book was released by the District—The Golden Gate Bridge, Report of the
Chief Engineer, Volume II. This volume chronicles the engineering undertakings at the
Bridge from 1940 to the present. In addition, three original Golden Gate Bridge
construction workers were brought together with members of the Board of Directors
and staff to reminisce about the construction of the now famed span (see more on
page 3). Also, the fifth annual collectible Golden Gate Bridge holiday ornament made
its debut. Both the book and the ornament are available for purchase through our
website at www.goldengate.org.
Over this rich 70-year history, tremendous achievements have been made and a
tradition of excellence established all while facing wide-ranging challenges. In 1937, it
could not have been imagined by anyone that the Golden Gate Bridge, now one of the
most recognized symbols in the world, would be visited by millions each year and crossed
by 40 million vehicles annually. The Golden Gate Bridge, once the longest suspension span
ever built, is now recognized around the world as one of the greatest engineering marvels
and construction achievements of the 20th century.
Over the last two decades, I have had the honor and privilege of serving on this Board
four different times, as a representative of San Francisco. During this time, I have seen
incredible dedication to excellence at all levels within the District. Finding solutions and
advancing initiatives for continued excellence in public service is at the heart of this
organization.
Just looking back over the last two decades, so many projects and programs have
advanced that it can be easy to overlook these significant accomplishments. To name only a
few: emergency ferry services provided after Loma Prieta in 1989, public safety patrols
added to the Bridge sidewalks in 1996, initiating the Bridge’s seismic retrofit construction
project in 1997, the launch of the FasTrak® toll collection system and the addition of ferry
service to the San Francisco Giants ballpark in 2000, the addition of the Public Safety
Railing on the Bridge in 2003, the addition of bike racks to all buses between 1999 and
2006, ongoing bus and ferry related improvements for persons with disabilities, the
purchase of 252 new buses since 1991, and the addition of two new high-speed ferries in
1998 and 2001.
I do want to recognize the one new Board member that joined us this past fiscal year—on
January 23, 2007, Marin County Supervisor Charles McGlashan joined the Board replacing
Marin County Supervisor Cynthia Murray.
The Board and staff all look forward to continuing our dedication to excellence to our
organization and our vital public services.
2006-2007 Annual Report
John Moylan
Board President
1
Board of Directors & Executive Management Team
Board of Directors
Officers of the District
John Moylan, President,
City and County of San Francisco
Albert J. Boro, 1st Vice President, Marin County
Tom Ammiano, 2nd Vice President,
City and County of San Francisco
General Manager/CEO
Celia G. Kupersmith
Auditor-Controller/CFO
Joseph M. Wire
Attorney David J. Miller
District Engineer
Denis J. Mulligan
Secretary of the District
Janet S. Tarantino
City and County
of San Francisco
Bevan Dufty
Dick Grosboll
Sabrina Hernández
Jake McGoldrick
Lynne Newhouse Segal
Janet Reilly
Gerardo Sandoval
Marin County
Harold C. Brown
Charles McGlashan
J. Dietrich Stroeh
Sonoma County
Mike Kerns
Michael F. Martini
Maureen Middlebrook
Del Norte County
Gerald D. Cochran
Napa County
Barbara L. Pahre
Mendocino County
James C. Eddie
Deputy General
Managers
Administration & Development
Teri W. Mantony
Bridge Division Kary H. Witt
Bus Division Susan C. Chiaroni
Ferry Division James P. Swindler
District Overview
The mission of the Golden Gate Bridge, Highway and Transportation District is to
provide safe and reliable operation, maintenance and enhancement of the Golden Gate
Bridge and to provide transportation services, as resources allow, for customers within the
U.S. Highway 101 Golden Gate Corridor.
828
District
Employees
Total Golden Gate
Bridge Traffic
39,516,006
Golden Gate
Transit Riders
7,213,406
Golden Gate
Ferry Riders
2,024,935
Operating
Revenues
$154.1 million1
Operating
Expenses
$129.2 million
Capital
Grant Revenues
$34.1 million
Capital
Expense
$11.3 million
1 The Board of Directors designated $10.3 million in operating revenues to fund future capital projects and
Bridge insurance; any remaining excess of revenues over expenses has been placed in Unrestricted Net Assets.
2
Golden Gate Bridge, Highway and Transportation District
Tribute to Original Bridge Workers
In celebration of the 70th anniversary of the Golden Gate Bridge on May 28, 2007, the Board invited
three of the original Bridge construction workers to a luncheon in their honor. With the vast majority
of original Bridge workers no longer with us, it was a special opportunity to share stories with three
incredible men. The legacy of all of the original workers will live on in our hearts for many, many
years to come as we continue the caretaking of this special span.
Charles H. Heinbockel was
born in San Francisco in 1911.
He is a graduate of the class of
1929 from Mission High school
and attended Saint Mary’s
College with a football scholarship, graduating in 1934.
Heinbockel worked on the
Golden Gate Bridge from the
summer of 1933 to 1935. He
worked on the construction of
the anchorages and also on the
Roebling Brothers main cable
crew. In 1936, he returned to
school at the University of
Southern California where he
earned his teaching credential.
After teaching, he began a
career in the United States
Navy and served as a
Commander of Navy
Intelligence from 1941 to 1967.
During his post-Navy years he
returned to teaching in San
Francisco, retiring in 1976. He
also served as a Director and
President of the Saint Mary’s
College Gaelsports. Heinbockel
is a veteran of World War II,
Korean War, and Vietnam.
Heinbockel was husband to
Catherine Heinbockel for 65
years. He passed away in
Burlingame, CA, on November
13, 2007.
Rolf Jensen was born in San
Francisco in 1910. Jensen
worked for Barrett & Hilp
Construction Company for 37
years. He worked for Barrett &
Hilp during the entire construction period of the Golden Gate
Bridge. He also worked in the
gold mines of the San Gabriel
Mountains, on constructing the
San Francisco-Oakland Bay
Bridge, on concrete boats destined for the South Pacific during World War II, on Napa’s
Queen of the Valley Hospital in
1954, on the BART Transbay
Tube in 1969, and on dozens of
other projects. Jensen retired in
1977 as general superintendent
of Swinerton & Walburg
Construction Company. He now
resides in Browns Valley, Napa
County, CA.
Edward Ashoff (pictured
above on the left) was born in
Sausalito in 1915. Two years
after graduating from Mill
Valley’s Tamalpais High School
he went to work on the Golden
Gate Bridge. He hauled rivets to
the top of the San Francisco
tower and helped with the spinning of the main cables. Ashoff
commuted to the job site by
boat from Sausalito. After pursuing various other jobs in the
late 1930s and serving in the
Navy in World War II, he
returned to work for the Bridge
as a toll collector. He ultimately
was promoted to Bridge
Captain in 1969 and retired
from that position in 1976. He
now resides in Mill Valley, CA,
with his wife Dorothy.
Original Golden Gate Bridge workers (pictured left to right) Charles H.
Heinbockel, Rolf Jensen and Edward Ashoff at a luncheon in their honor
May 2007.
2006-2007 Annual Report
3
General Manager’s Message
T
Celia G. Kupersmith
General Manager
4
he sense of wonder that envelops the Golden Gate Bridge began in May 1937 as it
opened to a week of celebrations. Over its 70 years, the enthusiasm for this beloved
span has only continued to grow. Both Bay Area residents and visitors have a strong
kinship with this majestic span. It is a bridge built by the people—the people that voted to
back the construction bonds and the workers that endured harsh conditions and dramatic
heights to construct what we all enjoy today as an incredible engineering marvel.
The Golden Gate Bridge is a testament to many—both the past and present:
members of the Board of Directors; managers and staff; elected officials; engineers;
consultants; geologists; seismologists; planners; contractors; bridge workers; and the
many, many hundreds of others who have contributed to creating and sustaining a
legacy of excellence.
For 70 years, the Golden Gate Bridge, Highway and Transportation District has
continued a tradition of quality based on innovation and progress. And our dedication
to the stewardship of this world-renowned icon will continue well into the future.
Most recently, we have made great strides in advancing the use of technology to
improve services while providing added customer benefits. For example, this fiscal
year, in addition to the continued advancement of our financial reporting systems, we
replaced the original FasTrak® electronic toll collection equipment installed in 2000 with a
newer, more robust system that improve auditing capabilities and customer convenience.
One very critical preservation project is set to start next year—the restoration of the
exterior of the main cables. Most importantly, we continue towards the completion of the
seismic retrofit. The retrofit of the Marin approach viaduct is compete, the retrofit of the
San Francisco approach viaduct is nearing completion now, and we will begin the retrofit of
the north anchorage housing next, followed by the main span and towers.
Our bus and ferry transit services continue to be a key ingredient to the reduction of
traffic congestion on the Golden Gate Bridge throughout the day. In fact, the investment of
toll dollars to assist in operating our transit systems reduces Golden Gate Bridge traffic by
more than 30 percent in the peak morning hour. Our transit services continue to serve the
region effectively with a variety of transit choices. In fact, this year ferry ridership climbed
to the highest ever since 1979. All buses, even our 57-passenger coaches, are now equipped
with bicycles racks.
We are proud to be one of the first Bay Area transit agencies to launch a new smart card
transit fare payment technology system—TransLink®—on all buses and ferries. This new
system offers improved convenience as customers no longer have to carry cash or purchase
ticket books.
In summary, this past year has been one of both celebration of our history and
movement forward into our future. All of our employees continue to serve their public with
our tradition of pride and excellence. Like all of you, we love this Bridge and celebrate its
unique place in the world.
Golden Gate Bridge, Highway and Transportation District
Golden Gate Bridge Program Highlights
Seismic Retrofit Construction Project Status
On April 25, 2007, the American Society of Civil Engineers (ASCE) honored the Seismic
Retrofit Phase 2, South Approach Structures Project with its Outstanding Civil Engineering
Achievement Award. This highly prized award recognizes projects for their resourcefulness in
addressing planning and design challenges, impact on the environment, pioneering uses of
materials and techniques, and construction innovations. The project team consisted of District
staff, HNTB Corporation and The Duffey Company’s personnel managing the project
construction; the project designer Jacobs-Sverdrup/Thomas Jee & Associates; and the prime
constructor Shimmick Construction/Obayashi Corporation, a Joint Venture.
The U.S. Geological Survey has recently reported that there is a 65 percent probability that
an earthquake with a magnitude of at least 6.7 will strike the San Francisco Bay Area before
the year 2030. And the Golden Gate Bridge (Bridge), as a structure vulnerable to significant
earthquake damage, is being retrofit to withstand an 8.3 Richter scale-magnitude earthquake
occurring on the San Andreas Fault.
In August 1997, after several years of extensive seismic design effort, a three-phased Seismic
Retrofit Construction Project began. The retrofit of the Marin approach viaduct (Phase 1) was
completed in 2001. The retrofit of
five San Francisco approach
structures (Phase 2) is nearing
completion now. The third and final
phase will be done in two parts—the
Marin anchorage housing and pylons
(Phase 3A), which will begin in 2008,
and the suspension bridge and
towers (Phase 3B), which is
anticipated to begin in late 2009.
The Seismic Retrofit Phase 2, San
Francisco approach structures project
included the retrofit of five
structures: the south approach
viaduct, anchorage housing, two
south pylons, and Fort Point arch.
The retrofit techniques used greatly
decreased the magnitude of
earthquake-induced forces in the
structures.
The pylons were amended so they
could dampen seismic energy
through rocking motion. Pylon
foundations were fortified by
expanding their depth and by
anchoring each pylon to the bedrock.
Pylon walls received an “armor” of
interior and exterior steel plating.
The exterior plates were covered by
concrete cast in rough lumber
replicating the original architectural
concrete finish.
The steel Fort Point arch structure
was modified into a huge energy
2006-2007 Annual Report
5
damping element by installation of the energy dissipation devices, bearing uplift guides and
impact force reducing devices. The original riveted connections of the Fort Point arch were
enlarged and transformed into modern bolted connections. Steel members were strengthened
with tons of added steel. To complete the system, “breakaway” seismic isolation joints were
constructed in the roadway deck at each end of the arch to enable the arch to move
independently from the adjacent pylons during an earthquake.
At the south approach viaduct, “breakaway” seismic isolation joints were constructed in the
roadway deck at each end, all support towers and bents were replaced with new supports, and
seismic isolation bearings were installed atop the new supports. The west wall of the south
anchorage housing was completely replaced and the east wall was strengthened.
The project also minimized construction impacts on the surrounding physical environment,
including construction operations and material deliveries staged for continuous flow of
vehicular, pedestrian and bicycle traffic; installations of platforms on the Fort Point arch,
shielding the historic Fort Point structure from damage; a shuttle to the site for workers to
minimize construction traffic impacts on local roads; and implementation of water, air and
noise pollution prevention by an on-site environmental monitor.
Suicide Deterrent Study Status
In March 2005, the Board authorized proceeding with the Environmental Studies and
Preliminary Design for a Suicide Deterrent System on the Golden Gate Bridge with the express
understanding that the funds would come from sources outside of the District. These studies,
once completed, would enable the Board to ultimately determine whether to proceed with
construction of a physical suicide deterrent system.
By June 2006, full funding for the studies was identified: the Metropolitan Transportation
Commission provided $1,850,000; the City and County of San Francisco provided $100,000;
$25,000 was contributed by the County of Marin; and public and private citizen groups
contributed $28,700.
On September 22, 2006, a $1.8 million contract was awarded to DMJM Harris, Inc.,
Oakland, CA, to undertake preliminary design and wind tunnel testing, prepare the necessary
environmental documents, and conduct public outreach. The study was divided into two
phases: Phase 1 would involve the wind tunnel testing of several conceptual designs to identify
what options could work from an aerodynamic standpoint. Phase 2 would encompass the
development of alternatives, including a “no build” alternative, as well as the preliminary
engineering and environmental analysis.
In November 2006, Phase 1 wind tunnel testing began and included a
“pass-fail” analysis of three generic concepts: (1) Horizontal nets, (2) Adding
to the existing railing, and (3) Replacement of the existing railing with new
taller railing. The wind analysis was successful in identifying design
parameters that would not negatively impact the wind response of the
Bridge.
On May 24, 2007, the wind test findings were released and included the
following highlights: (1) All potential solutions will need a wind appendage
device, either a fairing or winglet; (2) None of the generic concepts tested
prevent the addition of a moveable median barrier to the roadway, from a
wind analysis perspective; (3) Replacing the existing railing provides more
potentially workable variations; (4) Railing heights ranging from 8 to 14 feet are workable; (5)
Railing solid ratios could range from 12 percent to 23 percent.
Phase 2 began on June 14, 2007. The Phase 1 generic concepts that passed the wind test
will be used to develop potential alternatives for further engineering and environmental
analysis. A draft environmental document is targeted for public and agency circulation by mid2008, with a final environmental document following in late 2008.
A special project website was established at www.ggbsuicidebarrier.org and provides
current information on the status of the project.
6
Golden Gate Bridge, Highway and Transportation District
Suspender Rope Painting Underway
In fall 2006, the painting of the Bridge’s 250 sets of
vertical suspender ropes began with crews working
from both the east and west sidewalks. On the west
sidewalk the traditional Cable Sky Box (pictured far
right) method is being used—two painters work from
an enclosed wooden box structure where they are
protected from the elements and do the preparation
work and the painting manually. The wooden box
moves up and down the suspender ropes using air
driven hoists. On the east sidewalk, a new automated system known as the Cable Master is in
use. This system features patented devices that clean the suspender ropes and apply paint. The
devices are hauled up and down the suspender ropes by electric hoists. The hoists and system
controls are located on the Bridge sidewalk.
New Suspended Access System
In December 2006, Safway Services, Inc., Waukesha, WI, was selected to supply the Bridge
with its QuikDeck™ suspended access system. The new access system will be used by workers
to perform various ongoing maintenance tasks including painting the Marin approach viaduct.
The access system offers a safe and stable platform as well as sufficient work load capacity. It
also provides full containment for cleaning and painting, a requirement of environmental and
air quality regulations. In May 2007, Bridge crews began installation of the access system in
the Marin approach viaduct structures.
New FasTrak® Equipment Installed
On July 14, 2006, a $4.5 million contract was awarded to TRMI Systems Integration,
Accord, NY, for replacement of the FasTrak toll lane and toll plaza equipment. The contract, all
funded through Bridge tolls, included the equipment, installation and a three-year maintenance
contract. The original FasTrak toll equipment was installed in 1999 and was approaching the
end of its seven-year life cycle.
The toll lane equipment replacement included portions of the roadway treadle system
which is used to determine how many axles a vehicle has; toll collectors receipt printers, touch
screens, and card readers; driver feedback displays; overhead tag readers; violation
enforcement cameras; and lane controller hardware and software. The toll plaza equipment
was replaced with a more robust system that included hardware and software to exchange toll
transaction and violation files with the Regional FasTrak Customer Service Center, manage the
databases, support revenue audit processes and generate traffic and revenue reports. The
installation was completed in July 2007.
Safety Awareness Zone Established
On March 23, 2007, in accordance with Senate Bill (SB) 988, introduced by Senator Carole
Migden, the Board designated the Bridge as a Safety Awareness Zone (SAZ) and approved the
SAZ Plan. SB 988 was signed into law on September 29, 2006, and designated the Bridge as a
SAZ upon the passage of a resolution by the Board authorizing such designation and upon
approval by the Board of a SAZ Plan. Designation of the Bridge as a SAZ took effect
immediately upon approval by the Board and will remain valid for a period of three years and
can be extended for another three years upon future approval by the Board. In accordance
with SB 988, a SAZ Plan was developed which includes an overview of the history of efforts to
promote safe travel across the Bridge and identifies several education, enforcement and
engineering measures that should be pursued in conjunction with the new SAZ designation.
2006-2007 Annual Report
7
Merchant Road Realigned
Construction began in August 2006 to realign Merchant Road located on the southwest side
of the Bridge. Merchant Road was realigned to create a new, safer 4-way intersection with
Lincoln Boulevard and Storey Road in The Presidio. New sidewalks, bicycle lanes and
crosswalks were added; as well as a new paved parking lot on the north side of Merchant
Road. This project was undertaken cooperatively by the District, The Presidio Trust and the
Golden Gate National Recreation Area.
Golden Gate Transit and
Golden Gate Ferry Program Highlights
TransLink® Launched
Under the leadership of the
Metropolitan Transportation
Commission, a major step in the
ultimate regional rollout of the Bay
Area’s TransLink transit fare smart
card began on November 17, 2006,
with the pre-launch of TransLink on
Golden Gate Transit (GGT), Golden
Gate Ferry (GGF), and AC Transit. During pre-launch,
additional bus and ferry passengers were recruited to
use TransLink to assist in identifying any remaining
issues. During pre-launch, about 2,400 GGT passengers
and 1,680 GGF passengers were using the system during
this final round of troubleshooting.
The full system-wide launch of TransLink began on
GGT, GGF, and AC Transit on September 17, 2007. The
system will expand in phases over the next several years
to include all other Bay Area transit agencies.
The credit card-sized TransLink card stores value for the customer in the form of electronic
cash (e-cash) and transit passes. To pay a fare, customers simply “tag“ their card by touching it
to one of the card readers installed on GGT buses or at GGF terminals. In an instant, the card
reader automatically deducts the correct fare and applies any appropriate discounts, including
transfers. Customers never again have to fumble for exact change or juggle multiple passes and
transfers.
Ferry Ridership Sets Record
This fiscal year system-wide ferry ridership climbed to 2,024,935 passengers, nearly
reaching the 1979 high of 2,065,053.
GGF also broke the 1982 record for highest system-wide ridership on an individual day. On
January 6, 1982, ridership hit 16,393 during the massive flooding in Marin County. On Friday,
June 23, 2006, this was surpassed as ridership topped out at 16,817. On Friday, July 21, 2006,
this record was surpassed when ridership hit 24,899.
This year was the seventh year of operating special direct ferry service to the San Francisco
Giants ballpark in San Francisco from Larkspur. While no ridership records were set, over
72,000 fans used this service.
M.S. Marin Refurbished
On October 27, 2006, a contract was awarded to Bay Ship and Yacht Co., Alameda, CA, for
the refurbishment of the GGF vessel M.S. Marin. The $7.9 million project was funded using 76
percent Federal Transit Administration grant funds, with the remainder coming from Bridge
tolls. The M.S. Marin was the first of three Spaulding class vessels placed into service between
8
Golden Gate Bridge, Highway and Transportation District
Larkspur and San Francisco in 1976. The overhaul
included all new interior and exterior seating, paint, deck
covering and carpeting, ceilings and wall paneling,
lighting, public address system, restrooms, refreshment
sales area, security cameras, windows, bicycle racks that
can accommodate at least 70 bicycles, a modern lift for
persons with disabilities, generator and electrical system.
The refurbished M.S. Marin returned to service in July
2007 and is being used primarily on the Sausalito route
to/from San Francisco.
New Ferry Purchase
On June 23, 2006, the Board authorized the purchase of a new 499-passenger high-speed
ferry. To finance the $12 million purchase, 80 percent will come from Federal Transit
Administration grant funds, and Bridge tolls will cover 20 percent. Purchasing a new highspeed catamaran has two primary advantages: it will increase available capacity on the
Larkspur/San Francisco route as ridership continues to grow and it will also provide a “backup” high-speed vessel during times of service disruptions such as annual mandatory U.S. Coast
Guard dry-docking and unforeseen maintenance requirements. Currently during these times,
the weekday high-speed trips are replaced with a slower Spaulding vessel which adds 15
minutes to the crossings. A back-up high-speed vessel will allow for continuous high-speed
service and assist in maintaining existing strong customer satisfaction. On March 23, 2007, the
Board approved the hiring of Fast Ferry Management, Inc., Silverdale, WA, as the consultant to
provide project management and construction oversight for the new ferry. The process of
developing the vessel design and appropriate engine technology is underway.
Bus Fleet 100 percent Bike Rack Equipped
In July 1999, GGT launched its Bike Racks on Buses Program with the
installation of front-mounted bike racks that accommodate two bikes on all
40-foot-long buses. Because of their length, all of the 45-foot-long buses
could not be equipped with front-mounted bike racks under California
Vehicle Code 35400, section b.8. But, by October 16, 2006, all 45-foot-long
buses were equipped with racks in the “underbelly” luggage bays that can
accommodate two bikes. Grant funding for the project totaling $264,500 was
provided by the Transportation Fund for Clean-Air through the
Transportation Authority of Marin (20 percent) and Federal Transit
Administration (80 percent).
New Bus Service Demonstration Project
On June 11, 2007, mid-day commuters wishing to travel between the Larkspur Ferry
Terminal and the San Rafael Transit Center were offered a new alternative—Route 91. Route 91
was a demonstration project created to assist in addressing mid-day parking shortages at the
Larkspur Ferry Terminal and operated from 9:00 am to 2:30 pm. Customers can transfer to
Route 91 at the San Rafael Transit Center or they can drive to one of the convenient nearby
Park and Ride and catch the bus.
Installation of New Bus Shelters Underway
As part of GGT’s contract with CBS Outdoors for bus shelter construction, maintenance,
and advertising, 26 new shelters are being installed at GGT bus stops along Highway 101 in
Marin and Sonoma counties. The new replacement shelters are equipped with photovoltaic
“green” technology for illumination at night for additional passenger safety. The bus shelters
are enclosed, offer limited seating, and are ADA compliant. To date, 15 shelters have been
installed.
2006-2007 Annual Report
9
Information Available for PDAs
A slimmed-down version of the District’s website with navigation that focuses on mobile
users of PDA (personal digital assistant) devices was made available in August 2006. GGT and
GGF customers can now view bus and ferry schedules, bridge and transit service alerts, and
current news items when they need them the most at www.goldengate.org/pda.
Local Marin Routes Modified
The Marin County Transit District (Marin Transit) made significant modifications to local
Marin bus routes in early September 2006 in accordance with the service plan adopted on May
30, 2006. To assist local bus riders in learning about the new bus routes and schedule changes,
Marin Transit hosted several informational Open Houses and numerous “Question and
Answer” sessions at various locations throughout Marin County from August 17 through
September 7, 2006. District staff supported these outreach efforts as well—in the Bus and Ferry
Transit Guide, at the public meetings, and on the District website.
New Articulated Buses for Marin Local Service
In July 2006, GGT began the process of purchasing
ten new articulated buses for use on Marin Transit local
bus routes. The new 60-foot-long, 62-passenger buses
arrived in July 2007 and entered into service in
September 2007. The new buses cost $6.6 million and
were funded using 80 percent Federal Transit
Administration funds and 20 percent Marin Transit
funds.
Muir Woods Ridership Grows
In the summer of 2005, GGT began operating direct
bus service to Muir Woods under a contract with Marin
County using grant funds obtained by the County. Route
66 operates from southern Marin County on weekends and holidays only, Memorial Day to
Labor Day. During the first season, with no fare charged, over 10,000 passengers rode the
Route 66. In 2006, this number grew to 14,500, with an adult round trip fare of $1.00. In 2007,
the service was expanded to operate on weekends and holidays from May through September.
Another added feature in 2007 was direct connections to/from the Golden Gate Sausalito Ferry
from Memorial Day to Labor Day weekend. Total riders in 2007 reached 33,500, with an adult
round trip fare of $2.00.
District Program Highlights
On March 19, 2007, a new District-wide Management Team forum was launched to bring
both department heads and mid-level managers together to have an on-going quarterly dialogue
about challenges facing the District, both internally and externally, as well as to discuss
solutions for making the District an even better organization. At the second session on June 11,
2007, ways to improve several internal District-critical topics were the focus—procurement
process, internal communication, and developing a District “mentoring” program. The October
2007 session will allow staff to report back the ideas generated on these topics based on the
input from the smaller groups that were formed.
On May 21, 2007, to provide improved internal communications between District divisions
and provide streamlined access to a variety of District information for employees, an intranet
website was launched. The intranet site contains information on everything from District
values, mission and goals to benefit information, health and safety information, training
materials and information, and frequently asked questions.
10
Golden Gate Bridge, Highway and Transportation District
A Tribute to Our Employees of the Month
July 2006
Marvin Miller, Project Manager,
Information Systems
I’ve always taken the view that the
purpose of my job is to find ways for
others to perform their job more easily.
Almost my entire career has been in
software application development and
I’ve thoroughly enjoyed it all. Joining
the District is the icing on the cake. I’ve
never worked with as great a group of
people as my fellow employees. It is
very gratifying to me to be recognized in
this way by my peers.
October 2006
Kevin Runge,
Laborer, Bridge Division
Employed with the District for four
years, I have enjoyed working for the
Bridge because it is unique. There is
only one Golden Gate Bridge in the
world, and that alone is very special.
I enjoy working with my co-workers
and coming to work every day.
2006-2007 Annual Report
August 2006
September 2006
Fred Bauer, Bus Operator
Suzette Norris, Administrative
Assistant, Ferry Division
Before coming to Golden Gate Transit,
I worked and commuted to San Francisco daily
and enjoyed the good service and flexibility it
provided me. I have now been with the District
for 17 years and am proud to be able to
provide that same great service to others. I am
in a position where my extra efforts can make
a difference to our customers. Every day
provides slightly different challenges and
opportunities that allow me to help people
accomplish what they need to do. Getting them
where they have to go in a safe and timely
manner can help make all the difference in
what kind of a day they have.
I would like to thank my co-workers for
this recognition. My experience in the
Marketing and Communications
Department has served me well in my
current position with the Ferry Division,
which demands attention to detail while
working with customers and crew. I strive
to be efficient, knowledgeable and
courteous in our fast-paced office. The
District is fortunate to have personnel that
strive to be their best and are proud of the
jobs they perform.
November 2006
December 2006
Vicky T. Ng, Accountant
Diane Bernie, Administrative Assistant,
Bridge Division
A decade of working for the District has
taught me to appreciate all the little
things that people do that make this
such a great place to work. From the
Bridge Service person who sells gas to
distressed motorists to the Concessions
Sales Associates helping tourists find
their bearings, we are a group of fine
individuals who are willing to help
those in need.
I’ve been employed with the District for seven
years. As a third generation San Franciscan, I can’t
think of a better place to work. To this day, I still
get the chills when I see our beautiful Bridge
framed through the Waldo Tunnel. I love working
for the Bridge Division because I get to interact on
a daily basis with some of the most talented,
creative, and highly-skilled individuals I’ve ever
met. They’re always there to lend a hand or offer
a word of encouragement… and, in most cases,
keep me laughing!
11
A Tribute to Our Employees of the Month
January 2007
February 2007
March 2007
Forrest “Woody” Becker,
Ironworker, Bridge Division
Neil Hurley,
Deckhand, Ferry Division
Edward Dean,
Chief Bridge Service Operator
I have been employed with the District for 18
years. The reasons I have stayed with the
District all these years are, first of all, the
benefits of a good steady job. Next has to be
the variety of jobs I do as a metal fabricator in
the shop. Working as an Ironworker for the
District has been the best job I have ever had.
I have been with the District 9 years.
I enjoy working on the ferries and
being a part of the long tradition of
ferryboats on the San Francisco Bay.
I have been employed by the District for 26
years and enjoy the excitement of the job when
we (the Bridge Service Department) are called
to act in emergency situations. I know that my
crew and I can make the difference in saving
someone’s life or restore order to the roadway
we serve.
April 2007
Rodolfo Galang,
Senior Civil Engineer
I’ve been working for the District for
almost 8 years, and it’s a great honor
to be recognized for the work I have
done for the Bridge. I get an amazing
feeling knowing that I help
thousands of commuters pass above
the Golden Gate Strait safely while
they enjoy the spectacular view and
unique color of the Bridge.
12
May 2007
June 2007
Ron Downing, Principal Planner
Manuel Duque,
Paint Laborer, Bridge Division
Our GGT bus service has been in operation for
over 30 years in a travel market that is constantly
changing. During my 6 years with the District, I
have been able to bring forward new ideas on how
to reshape GGT service to meet new travel
markets. I’ve worked to improve access and travel
time for passengers in Sonoma County who use
the popular Route 72X service, brought our service
closer to residents of new developments such as
Hamilton with the Route 58, and developed
demonstration projects such as the successful
Route 66 Muir Woods shuttle. And there’s always
more to be done…
Even after working for the District for 24
years, I still love coming to work because of
the people and the daily challenges we face
in the Paint Department. The guidance and
leadership I have experienced have shown
me how to work as a professional and be a
better person! When the time comes, I hope
to retire after giving the District 35 years!
Golden Gate Bridge, Highway and Transportation District
The Board of Directors of the
Golden Gate Bridge, Highway
and Transportation District
San Francisco, California
INDEPENDENT AUDITOR’S REPORT
We have audited the accompanying basic financial statements of the Golden Gate Bridge, Highway and Transportation
District (District) as of and for the years ended June 30, 2007 and 2006. These financial statements are the responsibility of
the management of the District. Our responsibility is to express an opinion on these financial statements based on our
audits.
We conducted our audits in accordance with auditing standards generally accepted in the United States of America.
Those standards require that we plan and perform the audit to obtain reasonable assurance about whether the financial
statements are free of material misstatement. An audit includes consideration of internal control over financial reporting as
a basis for designing audit procedures that are appropriate in the circumstances, but not for the purpose of expressing an
opinion on the effectiveness of the District’s internal control over financial reporting. Accordingly, we express no such
opinion. An audit also includes examining, on a test basis, evidence supporting the amounts and disclosures in the financial
statements, assessing the accounting principles used and significant estimates made by management, as well as evaluating
the overall financial statement presentation. We believe that our audits provide a reasonable basis for our opinion.
In our opinion, the financial statements referred to above present fairly, in all material respects, the financial position of
the District as of June 30, 2007 and 2006, and the changes in its financial position and its cash flows for the years then
ended in conformity with accounting principles generally accepted in the United States of America.
The Management’s Discussion and Analysis and the schedule of funding progress, as listed in the table of contents, are
not a required part of the basic financial statements but are supplementary information required by accounting principles
generally accepted in the United States of America. We have applied certain limited procedures, which consisted principally
of inquiries of management regarding the methods of measurement and presentation of the required supplementary
information. However, we did not audit the information and express no opinion on it.
The accompanying supplemental schedule of revenues and expenses by division is presented for purposes of additional
analysis and is not a required part of the basic financial statements of the District. Such additional information has not been
subjected to the auditing procedures applied in the audit of the basic financial statements and, accordingly, we express no
opinion thereon.
Certified Public Accountants
Walnut Creek, California
November 6, 2007
2006-2007 Annual Report
13
Management’s Discussion and Analysis (Unaudited)
YEARS ENDED JUNE 30, 2007 AND 2006
The following Management Discussion and Analysis (MD&A) of the Golden Gate Bridge, Highway and Transportation
District’s (District) activities and financial performance provides an introduction to the financial statements of the District
for the fiscal years ended June 30, 2007 and 2006.
Following this MD&A are the basic financial statements of the District together with the notes thereto which are
essential to a full understanding of the data contained in the financial statements.
DISTRICT ACTIVITIES HIGHLIGHTS
In FY 2007, the District continued to experience similar growth trends in service levels for the fourth year in a row.
Bridge traffic remained essentially flat, Ferry patronage continued its growth trend and Bus patronage continued to fall. It is
expected that these trends will continue in the next year.
Total Southbound Vehicle Crossings
% increase (decrease)
Bus Patronage - Regional Service
% increase (decrease)
2007
________
2006
________
2005
________
19,758,003
19,476,189
19,398,353
1.4%
0.4%
3,999,623
4,936,429
(19.0%)
(7.6%)
3,213,783
2,497,258
28.7%
13.2%
7,213,406
7,433,687
(3.0%)
(1.5%)
2,024,935
1,870,169
8.3%
6.7%
5,339,842
Bus Patronage - Local Service Under
Agreement with Marin Transit
% increase (decrease)
2,205,173
Total Bus Patronage Regional and Local Service
% increase (decrease)
Ferry Patronage
% increase (decrease)
Club Bus Riders
% increase (decrease)
57,920
62,555
(7.4%)
(16.4%)
7,545,015
1,751,945
74,861
The District is based in San Francisco and consists of three operating divisions: Bridge (including Visitor Services),
Bus and Ferry, and an administrative District Division. Previously, the District oversaw a Rail Division that was closed in
FY 2006. Overseeing more than 800 employees who work together in the public interest, the General Manager coordinates
the operations of all divisions according to the policy and direction of the District Board of Directors. The District Board of
Directors consists of 19 members representing the six member counties: San Francisco, Marin, Sonoma, Del Norte, and
parts of Mendocino and Napa Counties. In FY 2007 approximately 19.8 million southbound vehicles crossed the Golden
Gate Bridge and 9.3 million customers rode Golden Gate Transit.
The District is unique among Bay Area transit operations because it provides transit services without support from direct
sales tax measures or dedicated general funds. As the District does not have the authority to levy taxes, the use of surplus
Bridge toll revenue is the only available local means the District has to support the District’s regional and transbay transit
services. Presently, Golden Gate Transit Bus and Ferry operations are funded approximately 33% by surplus Golden Gate
Bridge tolls and 25% by transit fares. The remainder is primarily met by State and local funds received from Marin and
Sonoma counties for the provision of transit services.
14
Golden Gate Bridge, Highway and Transportation District
FINANCIAL POSITION SUMMARY
Total net assets serve over time as a useful indicator of the District’s financial position. The District’s assets exceeded
liabilities by $532.1 million at June 30, 2007, a $48.9 million increase from June 30, 2006.
A condensed summary of the District’s net assets at June 30 is shown below (in thousands):
2007
________
2006
________
2005
________
Current and other assets
$180,068
$161,374
$136,042
Capital assets
459,372
________
639,440
432,701
________
594,075
444,145
________
580,187
Current liabilities
29,046
31,634
31,639
Debt outstanding
61,000
61,000
61,000
17,336
________
107,382
18,305
________
110,939
19,002
________
111,641
398,372
371,701
383,145
12,975
14,082
13,990
Assets:
Total Assets
Liabilities:
Other non-current liabilities
Total Liabilities
Net Assets:
Invested in capital assets, net of debt
Restricted by enabling legislation:
Debt service requirements
Seismic project
2,262
715
971
Transit projects
66
1,707
905
118,383
________
$532,058
________
________
94,931
________
$483,136
________
________
69,535
________
$468,546
________
________
Unrestricted
Total Net Assets
The largest portion of the District’s net assets (74.9% at June 30, 2007) represents its investment in capital assets (i.e.,
bridge, buses, ferries, buildings, improvements, and equipment), less the related debt outstanding used to acquire those
capital assets. The District uses these capital assets to provide services to its patrons and passengers, and visitors to the
Golden Gate Bridge. Although the District’s investment in its capital assets is reported net of related debt, it should be
noted that the resources required to repay this debt must be provided annually from operations, since the capital assets
themselves are unlikely to be used to liquidate liabilities.
An additional portion of the District’s net assets (2.9% at June 30, 2007) represents resources that are subject to external
restrictions imposed by creditors (debt covenants), grantors, contributors, or laws or regulations of other governments or
constraints imposed by laws through constitutional provisions or enabling legislation, that restrict the use of net assets. The
remaining unrestricted net assets (22.2% at June 30, 2007) may be used to meet the District’s capital and ongoing
obligations.
FISCAL YEAR 2007 FINANCIAL OPERATIONS HIGHLIGHTS
Ω As a result of the renegotiated contract with Marin Transit to provide local bus service within Marin County, the District
reclassified the financial statements to segregate the operating and non-operating revenue components related to that
contract for both current and prior years. The Marin Transit renegotiated contract that went into effect in April 2006
provides greater revenues from increased cost recoveries.
Ω Operating revenues increased from $121.9 million to $127.0 million, due primarily to the full year impact of the
aforementioned contract with Marin Transit. Other gains were experienced by the continuing trend of increased
ridership in the Ferry Division.
Ω Operating expenses before depreciation increased slightly from $120.6 million to $121.0 million. Inflationary increases in
labor and benefits were offset by insurance savings associated with the Bridge self-insurance status, along with increased
capitalization of labor and related benefits.
Ω As a result of the above, operating income before depreciation increased from $1.3 million in 2006 to $6.0 million in
2007. Depreciation decreased from $20.2 million in 2006 to $16.2 million in 2007 as the previous year reflected a onetime adjustment of accumulated costs due to changes in the useful life of a number of existing capital assets. Operating
loss before non-operating revenues and expenses decreased from a loss of $18.9 million in 2006 to a loss of $10.3 million
in 2007.
2006-2007 Annual Report
15
Ω Nonoperating net revenue increased to $25.0 million in 2007 from $21.3 million in 2006 due to increased interest rates
on the District’s investment portfolio.
Ω Capital contributions received in the form of grants from the Federal, State and Local governments increased from $23.6
million in 2006 to $34.1 million in 2007 as a result of the implementation of several major projects. These projects
include: (1) the purchase of ten Articulated Buses for use in Marin County local service routes; (2) the rehabilitation of
the MS Marin ferry vessel; and (3) the Larkspur Ferry Terminal Channel Dredging.
FISCAL YEAR 2006 FINANCIAL OPERATIONS HIGHLIGHTS
Ω As mentioned above, the District reclassified its 2006 financial statements to reflect the revenue components related to
the contract with Marin Transit for comparison purposes.
Ω Operating revenues increased slightly from $117.7 in 2005 to $121.9 million in 2006 due primarily to revenues from
increased cost recoveries relating to Marin Transit along with one-time insurance recoveries. Slight gains in toll and fare
revenue were offset by the continuing loss of Bus patronage in 2006.
Ω Operating expenses before depreciation increased by 2.5% from $117.7 million to $120.6 million. Increases, primarily in
pension and fuel costs, were offset by full year savings from continuous efforts to control operations expenses, medical
costs and administrative costs.
Ω Operating income before depreciation was relatively flat, at $1.3 million. Depreciation increased from $18.3 million in
2005 to $20.2 million in 2006 as the previous year reflected a one-time reduction of accumulated costs due to changes in
the useful life of a number of existing capital assets. Operating loss before non-operating revenues and expenses was
$18.9 million in 2006, compared to a loss of $18.3 million in 2005.
Ω Nonoperating net revenue experienced little change ($22.0 million in 2005 to $21.3 million in 2006).
Ω Capital contributions received in the form of grants from the Federal and State governments decreased from $34.1
million in 2005 to $23.6 million in 2006 as a result of the continued reduction in spending on the Phase II construction
and Phase III design of the seismic retrofit of the Bridge. This decrease is also the result of the completion in 2005 of
several major projects which included the installation of particulate matter traps on buses, Larkspur Ferry Terminal
berth dredging and Ferry security system improvement.
Ω In March 2006, the District transferred its Rail Division assets to Sonoma-Marin Area Rail Transit (SMART); as a result,
it recognized a special one-time decrease in net assets of $11.4 million.
SUMMARY OF CHANGES IN NET ASSETS
(In thousands)
Operating revenues
2007
________
$127,008
2006
________
$121,908
2005
________
$117,713
Operating expenses
(121,037)
________
(120,610)
________
(117,706)
________
5,971
1,298
7
(16,223)
________
(20,200)
________
(18,285)
________
(10,252)
(18,902)
(18,278)
25,033
________
21,305
________
21,954
________
Income before depreciation and other
nonoperating revenue and expenses
Depreciation
Operating Loss
Other nonoperating revenue
and expenses, net
Income before capital
contributions and special item
14,781
2,403
3,676
Capital contributions
34,141
23,590
34,132
Special Item-Transfer of assets to SMART ________Increase in net assets
$48,922
________
________
(11,403)
________
$14,590
________
________
________$37,808
________
________
16
Golden Gate Bridge, Highway and Transportation District
DISTRICT TOLLS AND FARES
Golden Gate Bridge tolls are set by Board Policy and change when determined necessary by the Board. In June of 2002,
the District Board approved a 66% increase in the auto cash Bridge toll to $5.00 and a 33% increase in the FasTrak toll to
$4.00, effective September 1, 2002. The District Board established a policy in 1999 that increased transit fares by the local
Consumer Price Index for five years. In 2006, the Board developed a second five year fare increase plan to increase transit
fares by 5% per year. The tolls and fares were as follows:
2007
______
$4.30
2006
______
$4.35
2005
______
$4.34
Average Bus Fare - Regional Service
$2.95
$2.44
$2.34
Average Bus Fare - Local Service Under
Agreement with Marin Transit
$0.94
$0.97
$0.92
Average Bridge Toll
Average Bus Fare - Regional and Local Service
$2.05
$1.95
$1.92
Average Ferry Fare
$4.53
$4.46
$4.32
REVENUES
The following chart shows the major
sources and the percentage of operating
revenues for the year ended June 30, 2007
(tolls, transit fares, visitor services and other):
Bridge Tolls 67.0%
Bus Fares 9.3%
Other 2.9%
Ferry Fares 7.2%
Visitor Services 2.5%
Marin Transit 11.1%
A summary of revenues for the years ended June 30, 2007 and 2006 and the amount and percentage of change in
relation to prior year amounts is as follows (in thousands):
2007
Amount
_________
Percent
of Total
_________
$ 85,043
45.2%
Increase/
(Decrease)
From 2006
_________
Percent
Increase/
(Decrease)
_________
2006
Amount
_________
Percent
of Total
_________
296
0.3%
$ 84,747
49.7%
Increase/
(Decrease)
From 2005
_________
Percent
Increase/
(Decrease)
_________
Operating:
Bridge Tolls
Bus Fares
$
$
534
0.6%
11,781
6.3%
(268)
(2.2%)
12,049
7.1%
(444)
(3.6%)
9,165
4.9%
823
9.9%
8,342
4.9%
772
10.2%
14,127
7.5%
4,140
41.5%
9,987
5.9%
1,845
22.7%
Visitor Services Concessions 3,154
1.7%
95
3.1%
3,059
1.8%
42
1.4%
3,738
_________
127,008
2.0%
_________
67.5%
14
_________
5,100
0.4%
_________
4.2%
19,146
10.2%
(1,656)
7,900
_________
27,046
4.2%
_________
14.4%
3,664
_________
2,008
86.5% _________
4,236 _________
2.5% _________
1,601 _________
60.8%
_________
8.0%
25,038
14.7%
2,026
8.8%
34,141
_________
$188,195
_________
_________
18.1%
_________
100.0%
_________
_________
10,551
_________
$17,659
_________
_________
44.7% _________
23,590 _________
13.8% _________
(10,542) _________
(30.9%)
_________
10.4% $170,536 _________
100.0%
$ (4,321)
(2.5%)
_________
_________ _________
_________ _________ _________
_________ _________
_________
Ferry Fares
Marin Transit
Other
Total Operating
3,724 _________
2.2% _________
1,446 _________
63.5%
_________
121,908
71.5%
4,195
3.6%
Nonoperating:
Operating Assistance
Investment Income
Total Nonoperating
Capital Contributions
Total Revenues
(8.0%)
20,802
12.2%
425
2.1%
The operating assistance decrease of 8.0% is mainly attributable to a reclass of operating assistance funding to Marin
Transit, in accordance with the contract, along with the termination of certain Federal Operating Assistance programs. Also,
investment income increased by 86.5% primarily due to rising interest rates. Capital contributions have increased by 44.7%
due to major Bus and Ferry projects.
2006-2007 Annual Report
17
The District funds its operations with Bridge tolls, transit fares, government grants and other revenues from operations
or investments. The operations of the Bridge Division produce a surplus of Bridge toll revenue that is used to subsidize
transit operations. In addition, in years where there is not sufficient Bridge toll revenue to fully subsidize transit operations,
funds are taken from District reserves to cover the shortfall. The reserves were funded with surplus Bridge toll revenues
from past years. The following table, which is derived from the unaudited supplemental schedule, records how the
divisions were funded in FY 2007. The table includes a $9.0 million transfer to reserves to be used to fund capital projects.
How Golden Gate District was funded in FY 2007 (in thousands)
Bridge
Bus
Ferry
District
Division
_______
Division
_______
Division
_______
Total
_______
Bridge Tolls
$42,500
$19,500
$8,500
$70,500
Patron Fares
-
11,800
9,200
21,000
Marin Transit
Other Revenue
Government Grants
Total
-
13,500
-
13,500
12,000
2,000
900
14,900
300
_______
$54,800
_______
_______
16,900
_______
$63,700
_______
_______
2,700
_______
$21,300
_______
_______
$139,800
_______
19,900
_______
_______
EXPENSES
The following chart shows the major cost centers
and the percentage of operating expenses (excluding
depreciation) for the year ended June 30, 2007:
Bus 51.0%
Bridge 33.2%
Ferry 15.8%
A summary of expenses for the years ended June 30, 2007 and 2006 and the amount and percentage of change in
relation to prior year amounts is as follows:
Increase/
(Decrease)
From 2006
_________
2007
Amount
_________
Percent
of Total
_________
$ 40,228
28.9%
$ (1,402)
Percent
Increase/
(Decrease)
_________
2006
Amount
_________
Percent
of Total
_________
Increase/
(Decrease)
From 2005
_________
Percent
Increase/
(Decrease)
_________
$ 41,630
26.7%
$ 1,665
4.2%
Operating:
Bridge
(3.4%)
Bus
61,744
44.3%
1,511
2.5%
60,233
38.6%
1,708
2.9%
Ferry
19,065
13.7%
524
2.8%
18,541
11.9%
(435)
(2.3%)
_________121,037
0.0%
_________
86.9%
Rail
Total Operating
Interest Expense
Depreciation
(Gain)/Loss on disposal
of assets
Special item-transfer of
assets to SMART
Total Expenses
(206) _________
(100.0%) _________
206 _________
0.1% _________
(34) _________
(14.2%)
_________
427
0.4%
120,610
77.3%
2,904
2.5%
2,162
1.6%
381
21.4%
1,781
1.1%
723
68.3%
16,223
11.6%
(3,977)
(19.7%)
20,200
13.0%
1,915
10.5%
(149)
(0.1%)
(2,101)
0.0%
1,952
1.3%
1,952
0.0%
_________$139,273
_________
_________
0.0%
_________
100.0%
_________
_________
(11,403) _________
0.0% _________
11,403 _________
7.3% _________
11,403 _________
0.0%
_________
$(16,673)
(10.7%)
$155,946
100.0%
$18,897
13.8%
_________
_________ _________
_________ _________
_________ _________
_________ _________
_________ _________
_________
The 0.4% increase in operating expenses is mainly attributable to normal inflationary cost increases associated with
steady operation levels, offset by savings from conversion of the Bridge to a self-insured status, and increased capitalization
of labor and benefits. Higher interest rates have continued to impact interest expenses associated with the commercial
paper program. The District also experienced decreased expenses due to one-time prior year charges in the Bus Division of
$2.0 million relating to the transfer of thirty-five buses to other transit agencies, and a prior year charge of $11.4 million as
a result of the transfer of assets to SMART.
18
Golden Gate Bridge, Highway and Transportation District
FINANCIAL STATEMENTS
The District’s financial statements are prepared on an accrual basis in accordance with generally accepted accounting
principles promulgated by the Governmental Accounting Standards Board. The District is structured as a single enterprise
fund with revenues recognized when earned, not when received. Expenses are recognized when incurred, not when they
are paid. Capital assets are capitalized and (except land and construction-in-progress) are depreciated over their useful lives.
Amounts are restricted for debt service and, where applicable, for construction purposes. See the notes to the financial
statements for a summary of the District’s significant accounting policies.
CAPITAL ACQUISITIONS AND CONSTRUCTION ACTIVITIES
During 2007, the District expended $42.9 million, which is an increase of $20.2 million or 89.0% over the amount
expended in 2006, on capital activities. This included major construction projects, principally the seismic retrofit projects
($14.6 million), north approach viaduct suspended maintenance scaffolding system ($1.4 million), security system build-out
at the Bridge ($2.1 million), Merchant Road improvements ($1.6 million), suicide deterrent investigation ($2.5 million), the
purchase of ten articulated buses ($5.6 million), Spaulding vessel refurbishment ($6.9 million), Larkspur Ferry Terminal
Channel Dredging ($4.0 million) and Ferry’s fuel piping system replacement ($0.5 million).
During 2007, completed projects totaling $11.3 million, which is an increase of $7.1 million or 172.4% over the amount
completed in 2006, were closed from construction-in-progress to their respective capital accounts. The major completed
projects included the purchase and installation of security equipment necessary to support Bridge security initiatives ($2.9
million), Larkspur Ferry Terminal Channel Dredging ($4.3 million), toll plaza transfer point improvement ($1.1 million) and
the installation of bike racks on 52 MCI coaches ($0.3 million).
Capital asset acquisitions are capitalized at cost. Acquisitions are funded using a variety of financing techniques, including Federal grants, with matching State grants and District reserve funds, debt issuance, and District revenues.
At June 30, 2007, the District has commitments of approximately $10.2 million for bridge-related projects and approximately $3.4 million for other projects.
During 2006, the District expended $22.7 million, which is a decrease of $17.0 million or 42.7% below the amount
expended in 2005, on capital activities. This included major construction projects, principally the seismic retrofit projects
($19.0 million), toll plaza transfer point improvement ($0.9 million), security system build-out at the Bridge ($0.8 million),
installation of bike racks on the MCI buses ($0.3 million), Spaulding vessel refurbishment ($0.4 million) and Larkspur Ferry
Terminal Channel Dredging ($0.3 million).
During 2006, completed projects totaling $4.1 million, which is a decrease of $12.6 million or 72.6% below the amount
completed in 2005, were closed from construction-in-progress to their respective capital accounts. The major completed
projects included the installation of particulate matter (PM) traps on buses ($1.0 million) and security system improvement
at the Ferry Division ($1.2 million).
At June 30, 2006, the District had commitments of approximately $16.6 million for Bridge-related projects and approximately $3.2 million for other projects. Additional information on the District’s capital assets and commitments can be found
in the notes to the financial statements.
DEBT ADMINISTRATION
On July 12, 2000, the District issued commercial paper notes in Series A and Series B in an amount of $30.5 million for
each series to provide funds for the Golden Gate Bridge (Bridge) seismic retrofit project and the renovation of main cables
of the Bridge. The commercial paper notes are secured by a pledge of the District’s revenues and two dedicated reserves,
and additionally secured by a line of credit. Under this program, the District is able to issue commercial paper notes at prevailing interest rates for period of maturity not to exceed 270 days. At June 30, 2007, $61.0 million in commercial paper
notes was outstanding and maturing within 30 to 270 days, with interest ranging from 3.48% to 3.68% (2.44% to 3.46% in
2006). Once the project is complete, the District plans to pay off the commercial paper over 22 years.
CREDIT RATINGS AND BOND ISSUANCE
Standard & Poor’s and Fitch began rating the District in 2000 when the District issued commercial paper for the first
time. The District has the highest credit rating (AA- and A+) in the nation for a single toll facility. These are implied credit
ratings as the District has no outstanding long-term debt. Currently, the District has $61.0 million in outstanding commercial paper and has no plans at this time to increase that amount.
In connection with the sale of the commercial paper, the District has secured a Line of Credit with J.P. Morgan to guarantee the payment of interest when due. As additional security, the District established both an Operating Reserve Fund
and a Debt Service Reserve Fund.
Additional information on the District’s commercial paper notes payable can be found in the notes to the financial statements.
2006-2007 Annual Report
19
ADDITIONAL FINANCIAL INFORMATION
This financial report is designed to provide the District’s customers, investors and other interested parties with an
overview of the District’s financial operations and financial condition. Should the reader have questions regarding the information included in this report or wish to request additional financial information, please contact the District’s AuditorController at Box 9000, Presidio Station, San Francisco, California 94129-0601.
20
Golden Gate Bridge, Highway and Transportation District
STATEMENTS OF NET ASSETS
JUNE 30, 2007 AND 2006 (In thousands)
2007
________
2006
________
$ 39,356
$ 64,787
ASSETS
CURRENT ASSETS:
Unrestricted assets:
Cash and cash equivalents
Investments
106,218
66,507
Capital and operating grants receivable
5,583
6,577
Accounts receivable
6,865
3,088
3,996
3,440
2,039
________
164,057
________
1,420
________
145,819
________
15,237
________
179,294
________
14,797
________
160,616
________
Maintenance inventories and supplies - average cost
Prepaid expenses
Total unrestricted assets
Restricted assets:
Cash and cash equivalents
Total current assets
NONCURRENT ASSETS:
Capital assets
Nondepreciable capital assets:
Land
6,650
6,650
209,710
________
216,360
________
178,086
________
184,736
________
Bridge, related buildings and equipment
257,838
252,730
Bus transit property and equipment
110,159
114,587
83,639
79,723
Construction in progress
Total nondepreciable capital assets
Depreciable capital assets:
Property and equipment:
Ferry transit property and equipment
Visitor services property and equipment
Accumulated depreciation
Total depreciable capital assets
Total capital assets
Other assets
Total noncurrent assets
TOTAL ASSETS
1,217
1,040
(209,841)
________
243,012
________
(200,115)
________
247,965
________
459,372
432,701
774
________
460,146
________
758
________
433,459
________
$639,440
________
$594,075
________
See accompanying notes to the financial statements.
2006-2007 Annual Report
21
STATEMENT OF NET ASSETS (continued)
JUNE 30, 2007 AND 2006 (In thousands)
2007
________
2006
________
LIABILITIES:
CURRENT LIABILITIES:
Trade accounts payable
$ 6,977
$ 8,023
Accrued liabilities
4,815
4,812
Deferred revenue
2,292
3,245
397
573
Contract retentions
7,606
7,272
Self-insurance liabilities
6,959
7,709
61,000
________
90,046
________
61,000
________
92,634
________
7,548
6,876
9,788
________
17,336
________
11,429
________
18,305
________
107,382
________
110,939
________
398,372
371,701
12,975
14,082
2,262
715
Accrued compensated absences
Commercial paper notes payable
Total current liabilities
NONCURRENT LIABILITIES:
Accrued compensated absences
Self-insurance liabilities
Total noncurrent liabilities
TOTAL LIABILITIES
NET ASSETS:
Invested in capital assets, net of related debt
Restricted
Debt service requirements
Seismic project
Transit operation
Unrestricted
TOTAL NET ASSETS
66
1,707
118,383
________
$532,058
________
________
94,931
________
$483,136
________
________
See accompanying notes to the financial statements.
22
Golden Gate Bridge, Highway and Transportation District
STATEMENTS OF REVENUES, EXPENSES AND CHANGES IN NET ASSETS
YEARS ENDED JUNE 30, 2007 AND 2006 (In thousands)
2007
________
2006
________
OPERATING REVENUES:
Bridge tolls
$ 85,043
$ 84,747
Transit fares
20,946
20,391
Marin Transit
14,127
9,987
3,154
3,059
3,738
________
127,008
________
3,724
________
121,908
________
Operations
65,324
63,148
Maintenance
27,132
26,579
General and administrative
28,581
30,883
16,223
________
137,260
________
20,200
________
140,810
________
(10,252)
________
(18,902)
________
Translink and paratransit assistance
-
862
Translink and paratransit assistance pass-through
-
(862)
15,646
14,398
707
3,811
2,793
________
19,146
2,593
________
20,802
Visitor services concessions
Other operating
Total operating revenues
OPERATING EXPENSES:
Depreciation
Total operating expenses
OPERATING LOSS
NONOPERATING REVENUES (EXPENSES):
Pass-through federal capital assistance:
Operating assistance:
State operating assistance
Federal operating assistance
Local operating assistance
Total operating assistance
Investment income
7,900
4,236
Interest expense
(2,162)
(1,781)
149
________
25,033
________
(1,952)
________
21,305
________
Gain (loss) on disposal of capital assets
Total nonoperating revenues
INCOME BEFORE CAPITAL CONTRIBUTIONS
CAPITAL CONTRIBUTIONS
INCREASE IN NET ASSETS BEFORE SPECIAL ITEM
SPECIAL ITEM - Transfer of assets to SMART
NET INCREASE IN NET ASSETS
NET ASSETS, Beginning of year
NET ASSETS, End of year
14,781
2,403
34,141
________
48,922
23,590
________
25,993
________48,922
(11,403)
________
14,590
483,136
________
$532,058
________
________
468,546
________
$483,136
________
________
See accompanying notes to the financial statements.
2006-2007 Annual Report
23
STATEMENTS OF CASH FLOWS
YEARS ENDED JUNE 30, 2007 AND 2006 (In thousands)
2007
________
2006
________
$122,421
$122,640
(65,295)
(63,556)
(62,331)
________
(5,205)
________
(59,678)
________
(594)
________
21,700
________
19,815
________
32,581
22,736
CASH FLOWS FROM OPERATING ACTIVITIES:
Cash receipts from customers
Cash payments to suppliers for goods and services
Cash payments to employees for services
Net cash used in operating activities
CASH FLOWS FROM NONCAPITAL FINANCING ACTIVITIES:
Operating grants received
CASH FLOWS FROM CAPITAL AND RELATED FINANCING ACTIVITIES:
Capital contributions received
Capital grants disbursed to other agencies
Interest paid
-
(862)
(2,162)
(1,781)
Proceeds from sale of capital assets
149
-
Increase in retention related to capital assets
334
744
(39,878)
________
(8,976)
________
(21,556)
________
(719)
________
(37,991)
3,093
5,481
________
(32,510)
________
4,281
________
7,374
________
Purchase of capital assets
Net cash used in capital and related financing activities
CASH FLOWS FROM INVESTING ACTIVITIES:
Net proceeds (purchases) of investment securities
Investment income received
Net cash (used in) provided by investing activities
NET (DECREASE) INCREASE IN CASH AND EQUIVALENTS
CASH AND EQUIVALENTS, Beginning of year
CASH AND EQUIVALENTS, End of year
RECONCILIATION OF OPERATING LOSS TO
(24,991)
25,876
79,584
________
$________
54,593
________
53,708
________
$________
79,584
________
$ (10,252)
$ (18,902)
16,223
20,200
(3,077)
121
NET CASH USED IN OPERATING ACTIVITIES:
Operating loss
Adjustments to reconcile operating loss to net cash used in operating activities:
Depreciation
Effect of changes in:
Accounts receivable
Prepaid expenses
(619)
873
Inventory and supplies
(556)
(937)
Other assets
Trade accounts payable
(16)
52
(4,063)
(3,554)
Accrued liabilities
3
383
Deferred revenue
(953)
1,548
Accrued compensated absences
Self-insurance liabilities
Net cash used in operating activities
496
616
(2,391)
________
$________
(5,205)
________
(994)
________
$________
(594)
________
$________
3,016
________
$________________
$________
1,201
________
$________
11,403
________
$________
(1,720)
________
$________
782
________
Supplemental disclosures of cash flow information:
Noncash capital and related financing and investing activities:
Acquisition of capital assets in accounts payable and contract retention
Transfer of capital assets to SMART
Noncash investing activities:
Change in fair value of investments
See accompanying notes to the financial statements.
24
Golden Gate Bridge, Highway and Transportation District
Notes to the Financial Statements
YEARS ENDED JUNE 30, 2007 AND 2006
(1) ORGANIZATION
The Golden Gate Bridge, Highway and Transportation District (the “District”) is a political subdivision of the State of
California created by the legislature in 1923 and subject to regulation under the Bridge and Highway District Act, as
amended. The District operates the Golden Gate Bridge, operates bus service primarily in Marin, San Francisco and
Sonoma counties and operates ferry service between Marin and San Francisco counties. The disbursement of funds
received by the District is controlled by statute and by provisions of various grant contracts entered into with the federal
government, the State of California and certain counties within the District. The District is based in San Francisco and
consists of three operating divisions, Bridge (bridge and visitor center operations), Bus, Ferry and an administrative District
Division. Previously the District oversaw a Rail division that was closed out in the year ended June 30, 2006. In March
2006, the District transferred its Rail Division assets to Sonoma-Marin Area Rail Transit District and recognized a loss of
$11,403,000 during the year ended June 30, 2006. The District Division has no revenues and all its expenses are allocated to
general and administrative expenses of the other Divisions (see Note 12).
(2) SIGNIFICANT ACCOUNTING POLICIES
Reporting Entity - The District’s reporting entity includes all activities of the District.
Basis of Accounting - The District is a single enterprise fund and maintains its records on the accrual basis of
accounting. Under this method, revenues are recorded when earned and expenses are recorded when the related liability is
incurred.
The District has elected under Governmental Accounting Standards Board (GASB) Statement No. 20, Accounting and
Financial Reporting for Proprietary Funds and Other Governmental Entities That Use Proprietary Fund Accounting, to apply all
applicable GASB pronouncements, as well as any applicable pronouncements of the Financial Accounting Standards Board,
the Accounting Principles Board, or any Accounting Research Bulletins issued on or before November 30, 1989, unless
those pronouncements conflict with or contradict GASB pronouncements.
Cash Equivalents - The District considers all highly liquid investments with a maturity of three months or less when
purchased to be cash equivalents (see Note 3).
Investments - are stated at fair value in accordance with GASB Statement No. 31, Accounting and Financial Reporting for
Certain Investments and for External Investment Pools (see Note 3). Statutes authorize the District to invest in obligations of the
U.S. Treasury, its agencies and instrumentalities; certificates of deposit; commercial paper rated A-1 by Standard and Poor’s
Corporation or P-1 by Moody’s Commercial Paper Record; bankers’ acceptances; repurchase agreements; reverse
repurchase agreements; and the State Treasurer’s investment pool.
Restricted Assets – consist of monies and other resources which are restricted legally as described below:
Special Operating Fund – These assets are restricted for the Bridge Division operating expenses and principal of and
interest on the 2000 commercial paper notes which must be at least equal to the lesser of $12,000,000 or 12% of the
principal amount of all notes then outstanding.
Debt Reserve Fund – These assets represent the 2000 commercial paper notes proceeds held in Debt Reserve Account
which must be at least equal to the lesser of 125% of average annual debt service on all notes then outstanding or 10% of
the principal amount of all notes then outstanding.
Capital Assets - The District defines capital assets as assets with an initial, individual cost of more than $5,000 and an
estimated useful life in excess of one year. Major additions and replacements are capitalized. Maintenance, repairs and
additions of a minor nature are expensed as incurred. The costs of acquisition and construction of equipment and facilities
are recorded in construction in progress until such assets are completed and placed in service, at which time the District
commences recording depreciation expense.
Depreciation - is calculated on the straight-line method over the estimated useful lives of the assets, as follows:
Bridge structural components
100 years
Bridge buildings, toll plaza structure, deck and
approach roadways and sidewalks
20 - 50 years
Buses
12 - 16 years
Ferry boats
25 - 30 years
Visitor services and other transit properties
5 – 50 years
2006-2007 Annual Report
25
Effective July 1, 2005, the District changed its estimates of FasTrak transponder useful lives from a maximum of 8 years
to 5 years. The District made this change to better reflect the estimated periods during which the District maintained its
own FasTrak customer service center. This change had the effect of increasing depreciation expense and operating loss by
$1,760,000 in fiscal year 2006.
Capitalization of interest – Interest costs incurred that relate to the acquisition or construction of property and
equipment acquired with tax-exempt debt is capitalized. The amount of interest to be capitalized is calculated by offsetting
interest expense incurred from the date of the borrowing until completion of the project, with interest earned on invested
debt proceeds over the same period. Capitalized interest cost is prorated to completed projects based on the completion date
of each project. No interest was capitalized for the years ended June 30, 2007 and 2006.
Operating assistance grants – are recorded as revenue when earned.
Capital contributions - The District has grant contracts with the U.S. Department of Transportation through the Federal
Transit Administration for certain capital improvements. Federal Transit Administration funds are used to replace and
improve the District’s buses, ferries and transit facilities. The District also has contracts with CalTrans for State Transit
Assistance funds, which are used either to match Federal Transit Administration grants or to fund transit improvement
projects. Capital funding provided under government grants is considered earned as the related allowable expenditures are
incurred.
Grants for property and equipment acquisition and facility development and rehabilitation are reported in the statement
of revenues, expenses and changes in net assets, after nonoperating revenues and expenses as capital contributions.
The District’s capital contributions for the years ended June 30, 2007 and 2006 are as follows (in thousands):
Bridge
Bus
Ferry
Division
_______
Division
_______
Division
_______
Total
_______
$21,796
$ 361
$ 656
$22,813
Capital contributions in fiscal 2006:
U.S. Department of Transportation
U.S. Department of Homeland Security
Local Assistance
Total capital contributions
602
-
-
602
10
_______
$22,408
_______
_______
156
_______
$ 517
_______
_______
9
_______
$ 665
_______
_______
175
_______
$23,590
_______
_______
$ 16,589
$5,352
$8,634
$30,575
1,534
-
8
1,542
851
_______
$18,974
_______
_______
1,112
_______
$6,464
_______
_______
61
_______
$8,703
_______
_______
2,024
_______
$34,141
_______
_______
Capital contributions in fiscal 2007:
U.S. Department of Transportation
U.S. Department of Homeland Security
Local Assistance
Total capital contributions
Compensated Absences – Accumulated vacation and sick leave are recorded as an expense and liability as the benefits
accrue to employees.
Operating Revenues and Expenses - consists of those revenues that result from the ongoing principal operations of the
District. Operating revenues consist primarily of bridge tolls, transit fares and gift center sales. Effective with the
renegotiated contract entered into in April 2006 with Marin County, the transit fare revenue for the Marin local service
lines ($2,986,000 in 2006) is shown separately and the related revenues from Marin County’s state and local funding
sources ($7,001,000 in 2006) are reclassified from nonoperating revenues to operating revenues. Nonoperating revenues and
expenses consist of those revenues and expenses that are related to financing and investing type of activities and result from
nonexchange transactions or ancillary activities. When an expense is incurred for purposes for which there are both
restricted and unrestricted net assets available, it is the District’s policy to apply those expenses to restricted net assets to
the extent such are available and then to unrestricted net assets.
Special Items – Significant transactions or other events within the control of management that are either unusual in
nature or infrequent in occurrence. In March 2006, the District transferred its Rail Division assets to SMART and
recognized a loss of $11,403,000.
Net Assets - comprise the various net earnings from operating income, nonoperating revenues, expenses and capital
contributions. Net assets are classified in the following three components:
Invested in capital assets, net of related debt – This component of net assets consists of capital assets, net of accumulated
depreciation and reduced by the outstanding balances of any bonds, mortgages, notes or other borrowings that are
attributable to the acquisition, construction or improvement of those assets. If there are significant unspent related debt
proceeds at year-end, the portion of the debt attributable to the unspent proceeds is not included in the calculation of
invested in capital assets, net of related debt. Rather, that portion of the debt is included in the same net assets component
as the unspent proceeds.
26
Golden Gate Bridge, Highway and Transportation District
Restricted - This component of net assets consists of external constraints imposed by creditors (such as through debt
covenants), grantors, contributors, or laws or regulations of other governments or constraints imposed by law through
constitutional provisions or enabling legislation, that restrict the use of net assets.
Unrestricted - This component of net assets consists of net assets that do not meet the definition of “restricted” or
“invested in capital assets, net of related debt.”
Pension Plans - The District participates in several pension plans covering all employees. Certain union members are
covered under single employer or multi-employer plans while other union and nonunion employees participate in the State
of California’s Public Employees’ Retirement System. Pension contributions are based on rates established by negotiated
labor contracts or by the actual plans. The District’s policy is to fund pension costs as accrued (see Note 8).
Postemployment Health Care Benefits - The District provides postemployment health care benefits to certain
employees and their dependents. The District recognizes the expenses for such costs on a pay-as-you-go basis (see Note 9).
Effects of New Pronouncements Not Adopted - The District anticipates adopting GASB 45 in fiscal year ending June 30,
2008 when it become effective. In June 2004, GASB issued Statement No. 45, Accounting and Financial Reporting by
Employers for Postemployment Benefits Other Than Pensions, which addresses how state and local governments should account
for and report their costs and obligations related to postemployment healthcare and other nonpension benefits. Collectively,
these benefits are commonly referred to as other postemployment benefits, or OPEB. The statement generally requires that
employers account for and report the annual cost of OPEB and the outstanding obligations and commitments related to
OPEB in essentially the same manner as they currently do for pensions. Annual OPEB cost for most employers will be
based on actuarially determined amounts that, if paid on an ongoing basis, generally would provide sufficient resources to
pay benefits as they come due. This statement’s provisions may be applied prospectively and do not require governments to
fund their OPEB plans. An employer may establish its OPEB liability at zero as of the beginning of the initial year of
implementation; however, the unfunded actuarial liability is required to be amortized over future periods. This statement
also establishes disclosure requirements for information about the plans in which an employer participates, the funding
policy followed, the actuarial valuation process and assumptions, and, for certain employers, the extent to which the plan
has been funded over time.
In December 2006, GASB issued Statement No. 49, Accounting for Remediation Obligations. This statement requires state
and local governments to provide the public with better information about the financial impact of environment cleanups.
This statement is effective for the District’s fiscal year ending June 30, 2009.
In May 2007, GASB issued Statement No. 50. Disclosure Requirements for Governmental Pensions and Retiree Healthcare.
The statement requires agencies to more closely align current pension disclosure requirements with retiree health insurance
and other post-employment benefits (OPEB). The District will implement GASB Statement No. 45 (Accounting and Financial
Reporting by Employers for Postemployment Benefits Other Than Pensions) in fiscal year ending June 30, 2008 and will
implement Statement No. 50 at the same time.
In July 2007, GASB issued Statement No. 51, Accounting and Financial Reporting for Intangible Assets, providing additional
guidance on the accounting of intangible assets. Although the statement is effective for fiscal years beginning after June 15,
2009, the District expects to be in compliance by fiscal year ending June 30, 2008.
Use of Estimates – The preparation of basic financial statements in conformity with accounting principles generally
accepted in the United States of America requires management to make estimates and assumptions that affect certain
reported amounts and disclosures. Accordingly, actual results could differ from those estimates.
Reclassifications - Certain 2006 amounts have been reclassified to conform to the 2007 presentation.
(3) CASH AND INVESTMENTS
The District maintains cash and investments that are available for general use subject to prior Board designations and
debt covenant restrictions. At June 30, cash and investments are comprised of the following (in thousands):
2007
_________
2006
_________
$ 39,356
$ 64,787
106,218
_________
145,574
66,507
_________
131,294
15,237
_________
$160,811
_________
_________
14,797
_________
$146,091
_________
_________
Reported as:
Unrestricted:
Cash and cash equivalents
Investments
Total unrestricted cash and investments
Restricted:
Cash and cash equivalents
Total cash and investments
2006-2007 Annual Report
27
Deposits - Custodial Credit Risk – Custodial credit risk is the risk that in the event of a bank failure, the District’s
deposits may not be returned to it. The California Government Code requires California banks and savings and loan
associations to secure governmental deposits by pledging government securities as collateral. The market value of pledged
securities must equal at least 110% of the District’s deposits. California law also allows financial institutions to secure
governmental deposits by pledging first trust deed mortgage notes having a value of 150% of the District’s total deposits.
Such collateral is considered to be held in the District’s name. As of June 30, 2007 (and 2006), of the District’s bank balance
of $7,079,000 (2006, $6,712,000), approximately $6,879,000 (2006, $6,536,000) held in contract retention escrow accounts is
uninsured and uncollateralized.
Investments
At June 30, 2007 and 2006 cash and investments were comprised of the following (in thousands):
June 30, 2007
_____________________________________
Fair
Investments
Federal Agency Notes
Federal Agency Notes (Callable)
Certificate of Deposits
Municipal Bonds
June 30, 2006
______________________________________
Investment
(Maturities in Years)
________________________
Investment
(Maturities in Years)
________________________
Fair
Value
_________
Less
than 1
_________
1-5
_________
Value
_________
Less
than 1
_________
1-5
_________
$ 37,470
$ 22,595
$ 14,875
$ 28,609
$ 6,525
$ 22,084
29,540
-
29,540
23,655
-
23,655
-
-
-
25,973
25,973
-
3,639
-
3,639
-
-
-
Medium-term Corporate Notes
35,568
4,958
30,610
17,916
-
17,916
Commercial Paper
23,761
23,761
-
31,822
31,822
-
22,490
22,490
-
9,583
9,583
-
873
________
873
________
________-
826
________
826
________
________-
153,341
$ 74,677
________
________
$ 78,664
________
________
138,384
$ 74,729
________
________
$ 63,655
________
________
Investment in State Treasurer’s
Investment Pool
Federal Obligation Mutual Funds
Cash and deposits
Demand deposits
Cash on hand
7,441
7,678
29
________
29
________
$ 146,091
________
________
$ 160,811
________
________
Interest Rate Risk – Interest rate risk is the risk that changes in market rates will adversely affect the fair market value
of an investment. State law limits investment maturities to five years as a means of managing entities’ exposure to fair value
losses arising from increasing interest rates. In addition, the District limits eligible commercial paper to have a maximum
maturity of 270 days or less. The District invests in callable Federal Agency notes as noted above. These issues are sensitive
to interest rate changes and are callable at par prior to maturity based on these rate changes.
Credit Risk – The District’s investment policy limits corporate commercial paper and medium-term corporate notes
investments as follows:
Corporate commercial paper rated in the highest short-term category, as rated A-1 by Standard and Poor’s Corporation or
P-1 by Moody’s Commercial Paper Record; provided that the issuing corporation is organized and operating within the
United States, has total assets of $500 million and has an “A” or higher rating for its long-term debt.
Medium-term corporate notes issued by corporations organized and operating within the United States or by depository
institutions licensed by the United States or any State and operating within the United States may be purchased. These
notes are to be rated at a level of “A” its equivalent or better by a nationally recognized rating service.
28
Golden Gate Bridge, Highway and Transportation District
As of June 30, 2007 and 2006, the District held investments in corporate commercial paper and medium corporate notes
with the following Standard and Poor’s Corporation ratings and amounts (in thousands):
Investment
__________
Rating
_______
2007
_______
2006
_______
Corporate commercial paper
A-1+
$ 13,974
$ 16,792
Corporate commercial paper
A-1
15,030
_______
$_______
31,822
_______
$ 4,752
-
Medium-term corporate notes
AAA
9,787
_______
$_______
23,761
_______
$ 9,646
Medium-term corporate notes
AA+
8,124
Medium-term corporate notes
AA
10,013
-
Medium-term corporate notes
AA-
7,785
_______
$_______
35,568
_______
$
-
13,164
_______
$_______
17,916
_______
$ 21,053
_______$______________
4,920
_______
$_______
25,973
_______
Total corporate commercial paper
Total medium corporate notes
Certificate of deposit
A-1+
Certificate of deposit
A-1
Total certificate of deposit
In addition, the District’s investments in Municipal Bonds, Federal Agency Notes and Federal Obligation mutual funds
have a credit rating of AAA from Standard and Poor’s Corporation as of June 30, 2007 and 2006.
As of June 30, 2007 and 2006, the District’s investment in the State Treasurer’s investment pool (LAIF) is $22,490,000
and $9,583,000, respectively. The total amount invested by all public agencies in LAIF at those dates is $19,736,253,000 and
$16,392,047,000, respectively. LAIF is part of the State of California Pooled Money Investment Account (PMIA). Of the total
invested in PMIA, 96.53% and 97.43% is invested in non-derivative financial products and 3.47% and 2.57% in structured
notes and asset-backed securities as of June 30, 2007 and 2006, respectively. The Local Investment Advisory Board (Board)
has oversight responsibility for LAIF. The Board consists of five members as designated by State Statute. The value of the
pool shares in LAIF, which may be withdrawn, is determined on an amortized cost basis, which is different than the fair
value of the District’s position in the pool. The District’s investment in LAIF is unrated.
Concentration of Credit Risk – The District limits the purchase of medium-term corporate notes to not exceed 30% of
the District’s surplus money. At June 30, 2007 and 2006, these investments are 23% and 13%, respectively, of the District’s
total investments. At June 30, 2007 and 2006, the District holds more than 5% of the District’s investments in the following
issuers:
Investment
__________
Merrill Lynch & Co Note
2007
_______
2006
______
5.11%
-
Dexia Delaware LLC Commercial Paper
5.25%
-
Wells Fargo Global Notes
5.33%
-
Dresdner Corp Commercial Paper
6.42%
-
-
5.13%
Morgan Stanley DW Commercial Paper
Bear Stearns Co. Inc. Commercial Paper
-
5.80%
USB Finance Delaware LLC
-
8.09%
Citizens Bank
Federal Home Loan Board
Federal Home Loan Mortgage Corporation
Federal National Mortgage Association
2006-2007 Annual Report
-
7.27%
19.84%
21.34%
-
4.82%
17.68%
8.38%
29
(4) CAPITAL ASSETS
Capital asset activity for the years ended June 30, 2007 and 2006 was as follows (in thousands):
Balance
July 1,
2006
_________
Additions
_________
Reductions/
Adjustments
_________
Transfers
_________
Balance
June 30,
2007
_________
Capital assets, not being depreciated:
Land
$
Construction in progress
178,086
_________
42,897
_________
_________-
(11,273) _________
209,710
_________
184,736
_________
42,897
_________
_________-
(11,273) _________
216,360
_________
Bridge, related buildings and equipment
252,730
-
(295)
5,403
257,838
Bus transit property and equipment
114,587
-
(5,864)
1,436
110,159
79,723
-
(341)
4,257
83,639
1,040
_________
448,080
_________
__________________-
177
_________- _________
(6,500) _________
11,273
_________
1,217
_________
452,853
_________
Bridge, related buildings and equipment
(87,590)
(5,793)
295
19
(93,069)
Bus transit property and equipment
(62,209)
(7,289)
5,865
(19)
(63,652)
Ferry transit property and equipment
(49,831)
(3,102)
338
-
(52,595)
(485) _________
(40) __________________
(200,115) _________
(16,224) _________
6,498
_________
247,965
(16,224)
(2)
_________ _________ _________
$ 432,701
$ 26,673
$
(2)
_________
_________ _________
_________ _________
_________
__________________-
(525)
_________
(209,841)
_________
11,273
_________
$
_________
_________
243,012
_________
$ 459,372
_________
_________
Transfers
_________
Balance
June 30,
2006
_________
Total capital assets, not being depreciated
6,650
$
-
$
-
$
-
$
6,650
Capital assets, being depreciated:
Ferry transit property and equipment
Visitor services property and equipment
Total capital assets, being depreciated
Accumulated depreciation
Visitor services property and equipment
Less accumulated depreciation
Total capital assets, being depreciated, net
Total capital assets, net
Balance
July 1,
2005
_________
Additions
_________
Reductions/
Adjustments
_________
Capital assets, not being depreciated:
Land
$ 18,026
Construction in progress
160,181
_________
178,207
_________
22,111
_________
22,111
_________
Bridge, related buildings and equipment
255,912
-
(3,947)
Bus transit property and equipment
126,215
-
77,886
-
Total capital assets, not being depreciated
$
-
$ (11,376)
$
-
$
6,650
(67) _________
(4,139) _________
178,086
_________
(11,443)
(4,139)
184,736
_________ _________ _________
Capital assets, being depreciated:
Ferry transit property and equipment
Visitor services property and equipment
765
252,730
(13,145)
1,517
114,587
(20)
1,857
79,723
-
-
1,040
(438) __________________
(17,550) _________
4,139
_________
_________448,080
_________
1,040
-
438
_________
461,491
_________
__________________-
Bridge, related buildings and equipment
(84,307)
(7,848)
4,565
-
(87,590)
Bus transit property and equipment
(65,196)
(7,656)
10,643
-
(62,209)
Ferry transit property and equipment
(45,214)
(4,637)
20
-
(49,831)
(450)
(35)
-
-
(485)
(388) _________
(24) _________
412
_________
(195,555)
(20,200)
15,640
_________ _________ _________
265,936 _________
(20,200) _________
(1,910)
_________
$ 444,143 _________
$ 1,911 _________
$ (13,353)
_________
_________
_________ _________
__________________-
_________(200,115)
_________
4,139
_________
$
_________
_________
247,965
_________
$ 432,701
_________
_________
Rail transit property and equipment
Total capital assets, being depreciated
Accumulated depreciation
Visitor services property and equipment
Rail transit property and equipment
Less accumulated depreciation
Total capital assets, being depreciated, net
Total capital assets, net
30
Golden Gate Bridge, Highway and Transportation District
Construction in progress consists of the following projects at June 30, 2007 and 2006 (in thousands):
Bridge Seismic South Viaduct Phase II
2007
_________
2006
_________
$ 180,265
$ 166,769
4,781
3,690
Bridge Seismic Design Review Phase III
Bridge Security System Improvement
-
266
Bridge Security System
437
871
Bridge Main Cable Restoration
802
802
10
921
Bridge Access Platforms
1,470
54
Bridge Fastrak System Upgrade
2,608
75
Bridge Merchant Road Improvement
1,672
12
982
27
Bridge Toll Plaza Transfer Point/Pavement
Bridge Suicide Deterrent Study
District MIS-Financial
110
905
7,514
634
Ferry LFT Channel Dredging
141
281
Ferry Fuel Piping System Replacement
476
-
Ferry Spaulding Refurbishment
Bus Replacement
Other
Total construction in progress
5,568
-
2,874
_________
$ 209,710
_________
_________
2,779
_________
$ 178,086
_________
_________
At June 30, 2007 and 2006, the District had commitments of approximately $10,247,000 and $16,624,000, respectively,
for bridge-related projects and approximately $3,364,000 and $3,216,000 for other projects.
(5) COMMERCIAL PAPER NOTES PAYABLE
On July 12, 2000, the District issued commercial paper notes Series A and Series B in an amount of $30,500,000 for each
series to provide funds for the Golden Gate Bridge (Bridge) seismic retrofit project and the renovation of main cables of the
Bridge. The commercial paper notes are secured by a pledge of the District’s revenues and additionally secured by a line of
credit. Under this program, the District is able to issue commercial paper notes at prevailing interest rates for periods of
maturity not to exceed 270 days. At June 30, 2007, $61,000,000 in commercial paper notes was outstanding and maturing
within 30 to 270 days, with interest ranging from 3.48% to 3.68%.
(6) CAPITAL GRANTS PASSED-THROUGH TO MTC
The District passed-through its federal capital assistance allocation of $862,000 for the year ended June 30, 2006, of
which $388,000 was passed through to the Metropolitan Transportation Commission (MTC) for the Translink Project and
$474,000 was passed through to Marin County Transit District for the purchase of paratransit vans. This amount was
recognized as nonoperating revenue and expense in the financial statements.
2006-2007 Annual Report
31
(7) OPERATING ASSISTANCE
The District receives operating assistance from various federal, state and local sources. Transportation Development Act
funds are received from the state through Marin and Sonoma Counties to meet, in part, the District’s operating
requirements based on annual claims filed by the District and approved by the MTC. Federal funds are distributed to the
District by the Federal Transit Administration after approval by MTC. The District also receives Marin County Transit local
funds and other amounts of assistance from other state agencies.
Operating assistance is summarized as follows for the years ended June 30, 2007 and 2006 (in thousands):
Transportation Development Act
less Marin Transit portion
Federal Transit Administration
State Transit Assistance
less Marin Transit portion
Regional Measure 2
CalTrans
Other
Total
2007
_________
2006
_________
$ 15,056
$ 14,628
(3,515)
(2,796)
707
3,811
5,537
2,749
(1,612)
(362)
2,363
2,341
180
180
430
_________
$
19,146
_________
_________
251
_________
$
20,802
_________
_________
(8) PENSION PLANS
CALIFORNIA PUBLIC EMPLOYEES’ RETIREMENT FUND
Plan Description - All permanent District employees (except bus and ferry operators and deckhands) are eligible to
participate in the Public Employees’ Retirement Fund (the “Fund”) of the State of California’s Public Employees’ Retirement
System (“CalPERS”). The Fund is an agent multi-employer defined benefit retirement plan that acts as a common
investment and administrative agent for various local and state governmental agencies within the State of California. The
Fund provides retirement, disability, and death benefits based on employees’ age, years of service, and the highest year’s
compensation. Employees vest after five years of service and may receive retirement benefits commencing at age 50. These
benefit provisions and all other requirements are established by state statute. A stand-alone report for the District’s plan is
not available; however, copies of the Fund’s annual financial report may be obtained from CalPERS’ executive office: 400 Q
Street, Sacramento, CA 95811.
Funding Policy – In May 2007, the District amended the plan from 2% at 55 to 2.5% at 55. As a result, active plan
members in the CalPERS are now required to contribute 8.0% of their annual covered salary. In addition, the District is
required to contribute at an actuarially determined rate. Based on the actuarial valuation, the contribution rate was
14.024%, 15.544%, and 8.48% for fiscal years 2007, 2006, and 2005, respectively. With the onset of the amended contract,
the contribution rate increased from 14.024% to 16.813% in May 2007. The contribution requirements of plan members
and the District are established by State statute and the employer contribution rate is established and may be amended by
CalPERS.
Annual Pension Cost - For fiscal years ended June 30, 2007, 2006, and 2005, the District’s annual pension costs for
CalPERS is $7,439,000, $7,711,000, and $4,963,000, respectively. The required contribution for the year ended June 30,
2007 was determined as part of the June 30, 2004 actuarial valuations, using the entry age normal actuarial cost method.
The actuarial assumptions included (a) 7.75% investment rate of return (net of administrative expenses), (b) projected
annual salary increases that vary by duration of service and (c) 3.25% per year cost-of-living adjustments. Both (a) and (b)
included an inflation component of 3.00%. The actuarial value of CalPERS assets was determined using techniques that
smooth the effects of short-term volatility in the market value of investments over a 3-year period. CalPERS unfunded
actuarial accrued liability is being amortized as a percentage of projected payroll on a closed basis. The amortization period
as of June 30, 2004 is 30 years.
GOLDEN GATE TRANSIT - AMALGAMATED RETIREMENT PLAN
Plan Description - The District’s bus operators participate in the Golden Gate Transit - Amalgamated Retirement Plan
(“GGT-ARP”), a single employer defined benefit pension plan funded by the District and administered by a Board of
Trustees consisting of District and union representatives. This plan provides retirement, disability and death benefits based
on employees’ age, years of service, and average compensation. Employees may receive normal retirement benefits based
on a predetermined formula. Copies of the GGT-ARP’s annual financial report may be obtained from the District.
Funding Policy - The District’s contribution to the GGT-ARP is a result of collective bargaining. As of January 1, 2003,
32
Golden Gate Bridge, Highway and Transportation District
the District was required to make contributions to GGT-ARP. Prior to this time, the previous contribution was made
through July 22, 1999. The contribution rate was 15.165% of eligible earnings. There is no provision for employee
contributions.
Annual Pension Cost - For the fiscal years ended June 30, 2007, 2006, and 2005, the District’s annual pension cost for
the GGT-ARP was equal to the negotiated contribution amount and actuarially required contribution. The actuarial cost
method for determining the annual pension cost was the entry age normal cost method. The actuarial assumptions included
(a) 8.0% investment rate of return (net of investment expenses), (b) projected 5.0% of annual salary increases that includes a
12.0% increase for seniority wage increases.
The actuarial value of assets was determined using a method that smoothes the effects of short-term volatility in the
market value of investments by recognizing one-third of the difference between the expected actuarial value of assets and
the market value of assets.
Actuarially Determined Contributions Required and Contributions Made - The District’s contributions to GGT-ARP
for the years ended June 30, 2007, 2006, and 2005, are the result of collective bargaining. The total annual pension cost and
funded contributions were $2,773,000, $2,720,000, and $2,730,000 for the years ended June 30, 2007, 2006, and 2005,
respectively (15.2%, 15.2%, and 15.2% of current covered payroll of $18,285,000, $17,936,000, and $18,007,000, for 2007,
2006, and 2005 respectively).
OTHER RETIREMENT PLANS
The District’s ferry operators and deckhands participate in the Inlandboatmen’s Union of the Pacific National Pension
Plan (“Inlandboatmen’s”) or the MEBA Towboat Operators Pension Trust (“MEBA”). Inlandboatmen’s and MEBA are unionadministered cost-sharing multiple-employer defined benefit pension plans in which the District is a participant. Annual
pension cost for the Inlandboatmen’s plan was $199,000, $160,000, and $181,000 for the years ended June 30, 2007, 2006,
and 2005, respectively. The District contributed to Inlandboatmen’s 11.7%, 8.5%, and 8.4% of payroll for covered
employees for the years ended June 30, 2007, 2006, and 2005, respectively. The District’s covered payroll for employees
participating in this plan was $1,710,000, $1,889,000, and $2,160,000 for the years ended June 30, 2007, 2006, and 2005,
respectively. Annual pension cost for the MEBA plan was $96,000, $95,000, and $96,000 for the years ended June 30, 2007,
2006, and 2005, respectively. The District contributed to MEBA 7.9%, 8.3%, and 9.8% of payroll for covered employees for
the years ended June 30, 2007, 2006, and 2005, respectively. The District’s covered payroll for employees participating in
this plan was $1,219,000, $1,140,000, and $991,000 for the years ended June 30, 2007, 2006, and 2005, respectively.
(9) POSTEMPLOYMENT HEALTH CARE BENEFITS
In addition to the pension benefits described in Note 8, the District provides postemployment health care benefits. For
all employees hired on or after August 9, 1991, the benefits are provided to retiree and dependent coverage based on age
plus years of services as follow: 1) the District does not contribute toward the cost of postemployment health benefits for
retirees whose combination of age and number of years of service amounts to less than 70 points; 2) the retiree contributes
the normal contribution paid by all retirees plus 30% of the COBRA rates for the coverage they select if their combination
of age and number of years of service falls within 70-74 points; 3) the retiree contributes the normal contribution paid by all
retirees plus 20% of the COBRA rates for the coverage if their combination of age and number of years of service falls
within 75 – 79 points; and 4) the retiree contributes the normal contribution paid by all retirees if their combination of age
and number of years of service is equal to or over 80 points.
The benefits are also provided to all employees, hired between July 1, 1983 through August 8, 1991, who retire from the
District on or after attaining age 55 with at least 10 years of service. For those employees age 55 with at least 15 years of
service, survivor and dependent care benefits are also received. If the employee began employment at the District prior to
January 1, 1983, the benefits are provided on or after attaining age 50 with at least 5 years of service. Currently 669 retirees
meet the eligibility requirements. For single coverage, the premium is $93.50 per month until Medicare eligible. Coverage
for a spouse/domestic partner is an additional $93.50 per month until Medicare eligible. Expenses for postretirement health
care benefits are recognized on a pay-as-you-go basis. Postretirement health care benefits expense was $6,375,000 and
$5,980,000 for the years ended June 30, 2007 and 2006, respectively.
(10) SELF-INSURANCE
The District is exposed to various risks of loss related to torts; theft of, damage to, and destruction of assets; errors and
omissions; injuries to employees and patrons; natural disasters; employee, retiree and dependent health benefits. The
District is self-insured for its general liability, workers’ compensation, Bridge physical use and occupancy, auto liability and
public transportation liabilities. The District has set aside assets for claim settlements associated with the above risks of loss
up to certain limits. In April 2006, the District did not renew its Bridge Physical Use and Occupancy policy and became
self-insured. The District also adjusted the Property (earthquake/flood) and Marine coverage to better represent its risks. As
a result, the District designated net assets for self-insured losses in the amount of $1,630,000 at June 30, 2007.
2006-2007 Annual Report
33
Self-insurance and limits are as follows:
Type of Coverage
__________________
Self-Insurance
__________________
Excess
Coverage
__________________
General /Vehicle Liability
Workers Compensation
Health Benefits
Railroad Liability
Boiler and Machinery
Bus Fleet
Property (earthquake/flood)
Ferry Hull, Machinery
Marine
Crime and Dishonesty
$3,000,000 per occurrence
$1,000,000 per claim
$100,000 per individual
$10,000 per accident
$1,000 per accident
$3,000,000 per occurrence
$250,000 (5% per structure)
$350,000 annual aggregate
$100,000 annual aggregate
$25,000 per occurrence
(faithful performance)
$1,000 per occurrence forgery
$5,000 all other
$100,000,000
$10,000,000 (statutory limits)
$175,000 stop loss/ w carve outs
$1,000,000 accident/$2mil aggregate
$1,000,000 per occurrence
$30,000,000 per occurrence
$20,000,000 per occurrence/aggregate
$1,000,000 per occurrence
$100,000,000 per occurrence
$1,000,000 Faithful
Public Officials Liability
$100,000 Each Wrongful Act
$100,000 Each Employment
Practices
$500,000 Forgery/Alteration
$500,000 Theft Inside/Toll
$15,000 All other locations
$1,000,000 Computer Fraud
$5,000,000 per Occurrence/ aggregate
All property is insured at full replacement value. To date, no settlement amounts have exceeded commercial insurance
coverage for the last three years.
The District’s estimated self-insurance liability is based on requirements of GASB Statements No. 10 and 30. These
statements require a liability for claims to be reported if information prior to issuance of the financial statements indicates
that it is probable that a liability has been incurred and the amount of loss can be reasonably estimated. The actuarially
determined liability includes allocated expenses and a provision for incurred but not reported claims.
Changes in the balances of claims liabilities for the years ended June 30, 2007 and 2006 are as follows (in thousands):
Self-insurance liabilities, beginning of fiscal year
2007
_________
$ 19,138
Incurred claims and changes in estimates
Claim payments and related costs
Total self-insured claims liabilities
Less current portion
Non-current portion
2006
_________
$ 20,132
(554)
1,197
(1,837)
_________
16,747
(2,191)
_________
19,138
(6,959)
_________
$ 9,788
_________
_________
(7,709)
_________
$ 11,429
_________
_________
(11) DESIGNATION OF DISTRICT FUNDS
The Board of Directors has designated available funds for seismic retrofit of the Bridge, other Bridge maintenance and
transit capital projects. In addition, the Board has restricted funds due to the legal requirements of the commercial paper
program, possible operational emergencies, and self insured losses.
(12) ALLOCATION OF DISTRICT DIVISION EXPENSE
For the years ended June 30, 2007 and 2006, District Division expense has been allocated to the operating divisions
(included in general and administrative expenses) by resolution of the Board of Directors as follows (in thousands):
2007
_________
$ 9,379
2006
_________
$ 9,970
Bus
7,607
8,140
Ferry
3,663
3,984
504
-
_________$ 21,153
_________
_________
168
_________
$
22,262
_________
_________
Bridge
Visitors Services
Rail
Total
34
Golden Gate Bridge, Highway and Transportation District
(13) ENVIRONMENTAL REMEDIATION
During 1992, the District discovered lead contamination in the soil beneath the north and south approaches to the
Bridge. The District entered into a Voluntary Cleanup Agreement (VCA) with the State of California Department of Toxic
Substances Control to affect a Remedial Action Plan for the first phase of a two-phased cleanup program and a Remedial
Investigation (RI) for the second phase. The District has completed the Phase I cleanup under the VCA and has expensed
approximately $6.5 million for that work. The VCA requires that the District complete an RI of the Phase II areas, but does
not require the District to actually complete the remediation. It is likely that remediation will be required under Phase II;
however, the VCA identifies two other Potential Responsible Parties, the National Park Service and the U.S. Army, who may
be required to share in any costs associated with the Phase II remediation. Because the RI has not been completed in these
areas, it is not possible at this time to determine any potential cleanup costs for Phase II, and what the District’s share of
those costs might be.
REQUIRED SUPPLEMENTARY INFORMATION
SCHEDULE OF FUNDING PROGRESS
YEARS ENDED JUNE 30, 2007 AND 2006
(UNAUDITED)
CALIFORNIA PUBLIC EMPLOYEE’S RETIREMENT FUND
Funding progress information for the District for 2006 is unavailable as of the date of this report.
SCHEDULE OF FUNDING PROGRESS (in thousands)
Valuation
Date
_________
6/30/2003
6/30/2004
6/30/2005
Actuarial
Value of
Assets
_________
$ 169,923
177,512
185,728
Actuarial
Accrued
Liability
Unfunded
Funded
_________
$ 195,259
204,776
219,556
AAL
_________
$ (25,336)
(27,264)
(33,828)
Ratio
_________
87.0%
86.7%
84.6%
Annual
Covered
Payroll
_________
Unfunded
AAL as a %
of Covered
Payroll
_________
$ 34,343
32,986
32,253
(73.8%)
(82.7%)
(104.9%)
GOLDEN GATE TRANSIT – AMALGAMATED RETIREMENT PLAN
Funding progress information for the District for January 1, 2007 is available as of the date of this report.
The District’s funding progress information as of January 1, 2006 is illustrated as follows:
SCHEDULE OF FUNDING PROGRESS (in thousands)
Valuation
Date
_________
1/1/2004
1/1/2005
1/1/2006
Actuarial
Value of
Assets
_________
$ 112,137
115,857
117,796
2006-2007 Annual Report
Actuarial
Accrued
Liability
Unfunded
Funded
_________
$ 118,371
120,251
122,198
AAL
_________
$ (6,234)
(4,394)
(4,402)
Ratio
_________
94.7%
96.3%
96.4%
Annual
Covered
Payroll
_________
Unfunded
AAL as a %
of Covered
Payroll
_________
$ 22,952
20,249
18,175
(27.2%)
(21.7%)
(24.2%)
35
36
Golden Gate Bridge, Highway and Transportation District
14,127
Marin Transit
(9,000)
-
(13,355)
(1,781)
4,236
2,593
_________
20,802
3,811
14,398
20,200
_________
140,810
_________
(7,029)
-
1
(2,162)
7,900
127
_________
307
-
180
5,536
_________
45,764
_________
11,454
14,632
14,142
909
_________
89,106
_________
3,154
-
-
$85,043
$
-
14,127
11,781
-
$
-
9,987
12,049
-
$
-
-
9,165
-
$
-
-
8,342
-
12,941
14,005
11,677
9,918
12,049
10,053
5,450
2,582
5,697
2,511
388 _________
1,958 _________
1,432 _________
871 _________
1,679
_________
88,194 _________
27,866 _________
23,468 _________
10,036 _________
10,021
_________
14,684
40,149
38,131
11,033
10,333
3,059
-
-
$84,747
-
-
-
-
$
-
-
-
-
-
-
196
10
225
_________- _________
225
_________- _________
-
$
680
12,832
3,061
11,831
27
2,634
750
2,387
(7,019)
(231)
-
(1,781)
4,236
(603)
-
123
-
-
(585)
(213)
(2,029)
-
-
(1,368)
-
25
-
-
(1,396)
(101)
77
-
-
127 _________
2,666 _________
2,466 _________- __________________
307
16,178
17,358
2,661
3,137
-
180
-
-
-
-
-
-
-
-
545
(11,403)
-
-
_________- _________-
-
-
EXCESS REVENUES (LOSS)
$14,536
_________
_________
ASSETS ACQUIRED WITH CAPITAL GRANTS_________
10,090
DEPRECIATION AND GAIN/LOSS ON CAPITAL
24,422 _________
1,510 _________
1,410 _________
6,175 _________
8,639 _________
2,405 _________
3,472 _________- _________
10,901
_________
$
6,122
$42,534
$35,529
$(19,498)
$(21,402)
$(8,500)
$(8,040)
$
$
35
_________
_________ _________
_________ _________
_________ _________
_________ _________
_________ _________
_________ _________
_________ _________
_________ _________
_________
(1,335) _________
(300) _________
(1,335) _________
(300) _________- _________- _________- _________- _________- __________________
Total nonoperating revenues (expenses) _________
14,698 _________
602 _________
(2,318) _________
(4,788) _________
15,698 _________
14,531 _________
1,318 _________
1,717 _________- _________
(10,858)
NET INCOME (LOSS)
4,446
(18,300)
41,024
34,119
(25,673)
(30,041)
(10,905)
(11,512)
(10,866)
Contribution to capital
Bridge self insurance
(9,000)
Interdivision transfers
149
(2,162)
Interest expense
Gain (Loss) on disposal of assets
7,900
2,793
_________
19,146
707
15,646
Investment income
Total operating assistance
Local operating assistance
Federal operating assistance
State operating assistance
Operating assistance:
NONOPERATING REVENUES (EXPENSES):
OPERATING INCOME (LOSS)
Total operating expenses
30,883
26,579
63,148
3,724
_________
121,908
_________
3,059
9,987
20,391
$84,747
7,657 _________
7,493 _________
7,807 _________
3,194 _________
4,709 _________- _________
27
_________
49,287
69,237
68,040
22,259
23,250
233
_________ _________ _________ _________ _________ _________ _________
(10,252) _________
(18,902) _________
43,342 _________
38,907 _________
(41,371) _________
(44,572) _________
(12,223) _________
(13,229) _________- _________
(8)
_________
28,581
General and administrative
16,223
_________
137,260
_________
27,132
Maintenance
Depreciation
65,324
3,738
_________
127,008
_________
Operations
Total operating revenues
Other operating
3,154
20,946
Transit fares
Visitor services concessions
$85,043
Bridge tolls
OPERATING REVENUES:
Bridge Division
Total
(Bridge & Visitor Services) _____________________
Bus Division
Ferry Division
Rail Division
_____________________
_____________________
_____________________
_____________________
2007
2006
2007
2006
2007
2006
2007
2006
2007
2006
_________ _________ _________ _________ _________ _________ _________ _________ _________ _________
YEARS ENDED JUNE 30, 2007 AND 2006 (In thousands)
SUPPLEMENTAL SCHEDULE OF REVENUES AND EXPENSES BY DIVISION (NON-GAAP BASIS)
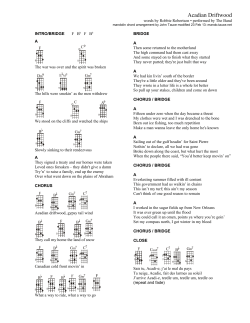


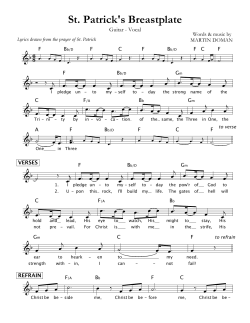


© Copyright 2026