
Interspecific social networks promote information transmission in
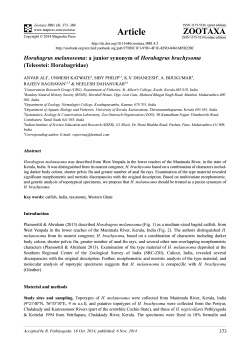
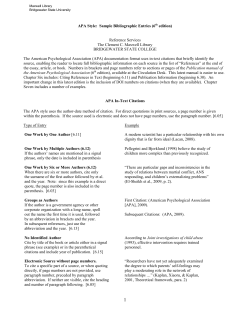
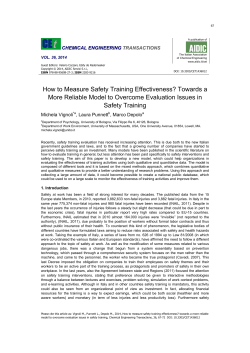
Downloaded from http://rspb.royalsocietypublishing.org/ on March 29, 2015
rspb.royalsocietypublishing.org
Research
Cite this article: Farine DR, Aplin LM,
Sheldon BC, Hoppitt W. 2015 Interspecific
social networks promote information
transmission in wild songbirds. Proc. R. Soc. B
282: 20142804.
http://dx.doi.org/10.1098/rspb.2014.2804
Received: 15 November 2014
Accepted: 13 January 2015
Subject Areas:
behaviour, ecology, evolution
Keywords:
mixed-species flocking, network-based
diffusion analysis, public information,
social information, social networks,
transmission networks
Interspecific social networks promote
information transmission in wild
songbirds
Damien R. Farine1, Lucy M. Aplin1,2, Ben C. Sheldon1 and William Hoppitt3
1
Department of Zoology, Edward Grey Institute of Field Ornithology, University of Oxford, Oxford OX1 3PS, UK
Research School of Biology, Australian National University, Acton, Australian Capital Territory 2000, Australia
3
Animal and Environment Research Group, Anglia Ruskin University, Cambridge CB1 1PT, UK
2
DRF, 0000-0003-2208-7613
Understanding the functional links between social structure and population
processes is a central aim of evolutionary ecology. Multiple types of interactions can be represented by networks drawn for the same population,
such as kinship, dominance or affiliative networks, but the relative importance
of alternative networks in modulating population processes may not be clear.
We illustrate this problem, and a solution, by developing a framework for
testing the importance of different types of association in facilitating the transmission of information. We apply this framework to experimental data from
wild songbirds that form mixed-species flocks, recording the arrival ( patch
discovery) of individuals to novel foraging sites. We tested whether intraspecific and interspecific social networks predicted the spread of information
about novel food sites, and found that both contributed to transmission. The
likelihood of acquiring information per unit of connection to knowledgeable
individuals increased 22-fold for conspecifics, and 12-fold for heterospecifics.
We also found that species varied in how much information they produced,
suggesting that some species play a keystone role in winter foraging flocks.
More generally, these analyses demonstrate that this method provides a
powerful approach, using social networks to quantify the relative transmission
rates across different social relationships.
1. Introduction
Author for correspondence:
Damien R. Farine
e-mail: [email protected]
Electronic supplementary material is available
at http://dx.doi.org/10.1098/rspb.2014.2804 or
via http://rspb.royalsocietypublishing.org.
Social information is important for the ecology of many animal species. Observing others can provide naive individuals with diverse information, ranging
from habitat quality and predator presence, to mate choice [1–3]. If individuals
vary in their access to information, or if information spreads non-randomly
between dyads, then population structure may play a crucial role in mediating
the spread of information [4]. However, individuals will often have a choice of
information sources, for example they can choose to observe conspecifics and/
or heterospecifics. While social information from conspecifics may be the most
relevant, relying solely on information from conspecifics can also lead to
increased competition for limited resources, such as food or territories [3]. An
alternative, or complementary, strategy might be to acquire information from heterospecifics. For example, many species eavesdrop on heterospecific alarm calls
[5], and migrating birds preferentially copy the habitat choices of resident heterospecifics [6]. Here, we address the general problem of identifying the contribution
of different types of associations to population processes, where different types of
relationships form different social networks within the same set of individuals.
In a recent study [7], we experimentally tested whether information was
transferred through social networks of wild songbirds. In that study, we used
automated techniques to map association patterns in wild mixed-species flocks
of tits (Paridae). We then experimentally deployed novel foraging patches and
& 2015 The Authors. Published by the Royal Society under the terms of the Creative Commons Attribution
License http://creativecommons.org/licenses/by/4.0/, which permits unrestricted use, provided the original
author and source are credited.
Downloaded from http://rspb.royalsocietypublishing.org/ on March 29, 2015
2. Methods
(a) Study area and population
The data for this study [7] were collected from two small areas of
broadleaf deciduous woodland near Wytham Woods, Oxfordshire
(518460 N, 18200 W) that form part of an on-going study on social behaviour in birds [25,26]. Here, blue tits C. caeruleus, great tits
Pa. major and marsh tits Po. palustris form mixed-species flocks in
the non-breeding season. Individuals were caught using mist-nets
and fitted with passive integrated transponder (PIT) tags, allowing
them to be detected by radiofrequency identification (RFID) antennae fitted to standard bird feeders (Francis Instruments Ltd.,
Cambridge). The field data were then collected in two phases.
The first measured the association patterns of individuals to construct a social network for each site. The second deployed
randomly placed novel food patches around the study site to
record each individual’s first arrival at the resource.
(b) Inferring social networks
The social network was inferred from the co-observations of individuals visiting feeders at two fixed sites in each area. Feeders
were filled with food for 3 days and left empty for 3 days. This
cycle was repeated continuously from December 2010 to January
2011 at Cammoor/Stimpsons Copse, and during January 2011 at
Higgins Copse. Data loggers recorded the 15 s time block of each
individual’s visit along with its unique PIT-tag code. Using the R
package asnipe [27], we then inferred dyadic association strengths
from the spatio-temporal co-occurrences between individuals.
We defined a network edge as the proportion of time two individuals are observed together (calculated using the simple ratio
index, SRI), where an absent edge (weight ¼ 0) indicates that
they were never co-observed, and an edge weight of 0.5 indicates
that in half of the observations of the two birds, they were seen
together. This provides an estimate of the proportion of time
any two individuals A and B spend under the conditions defined
to constitute ‘association’. As such this is likely to provide a good
measure of the opportunities A has to learn things from B, and
vice versa, so long as the definition of ‘association’ does so (see
the definition of s in the NBDA model below). Simulations of
these types of networks suggest that the SRI provides a robust
estimate of the underlying association patterns if the individuals
are sampled numerous times (on average, we detected each individual 139 times, well in excess of the guidelines provided by
Franks et al. [28]). However, because the SRI can result in large
edge weights for rarely observed individuals, we also include
2
Proc. R. Soc. B 282: 20142804
types of relationships. In our case, this enables us to explicitly
determine whether information concerning novel food patches
was transmitted through both intra- and interspecific social
networks in the data from Aplin et al. [7], and if the rate of transmission (or the propensity to use information) differed. This
allows us to quantify the benefit of associating with heterospecifics in terms of information access, which is considered
a fundamental driver of mixed-species communities [24].
Given the extensive niche overlap between blue tits, great tits
and marsh tits, we predicted that individuals should be
using at least some social information indiscriminately. That
is, information about novel food patches should spread to
heterospecifics without requiring independent (non-social)
discovery events to happen in each of the species. The ability
to determine the relative rates of transmission across a
number of potential pathways is therefore a powerful analytical approach for investigating the contribution of social
relationships in population processes.
rspb.royalsocietypublishing.org
tracked the diffusion of information about these ephemeral
food sources, finding that tits used social information from
their associates (represented by edges in the social network)
to locate new foraging resources. However, our study included
individuals from three species that form mixed-species flocks:
blue tits (Cyanistes caeruleus), great tits (Parus major) and marsh
tits (Poecile palustris) [8,9]. Existing analytical tools cannot discriminate between the potentially different pathways of
information flow between and within species. That is, while
we found that birds used social information to find food (the
order and time of discovery was predicted by the presence
of edges in the social network), we could not test whether
individuals used information from both conspecific and heterospecific associates when searching for food. If individuals
in mixed-species foraging groups did use information from
heterospecifics, then it is also important to determine how
much they weighed information from heterospecifics and
whether this differed from conspecifics.
Studies of social learning and the diffusion of information
have generally also assumed that each link in an individual’s
social network can provide information at an equal rate. Yet,
animal groups may be structured by multiple types of social
relationships [10,11], each representing a different set of
network edges. While these are often combined into a
single network, such relationships may differentially promote
or restrict population processes. For example, VanderWaal
et al. [12] compared a network of genetic subtype similarity
of the microbe Escherichia coli between giraffes (Giraffa camelopardalis) with networks describing giraffe social associations
and habitat use overlap. They found that the association network (co-occurrence in social groups) best matched the
similarity in pathogens between individuals. By contrast, networks created based on how much each pair of individuals
shared water resources or overlapped in their home-range
did not reflect the pathogens that individuals shared. This
suggests that population processes, in this case pathogen
transmission, can be mediated by different components of
social structure or types of relationships. However, their
study, and similar studies of transmission networks [13–16],
only estimate the correlation in the structural similarities
between the pathogen and social networks. A powerful
approach for understanding how population structure facilitates information (or pathogen) transfer is to experimentally
seed a behavioural innovation and track its spread (or ‘diffusion’) through the social network. This approach can then be
combined with statistical tests that can control for heterogeneity
in ecological-, individual- and population-level factors.
Network-based diffusion analysis (NBDA) has become
a widely used method for investigating information transmission dynamics in animal groups [7,17–21]. NBDA infers
the rate of social transmission of information by comparing the
diffusion of information with patterns of association in
the social network [22]. It assumes that the rate at which social
transmission occurs is proportional to the strength of association
between naive and informed individuals. NBDA has thus far, to
our knowledge, been applied on only two wild animal populations: our study [7,23], and once to track the spread of lobtail
feeding behaviour in a population of humpback whales over
30 years [18]. In these cases, the studies took potential confounds
into account, but only tested the spread of information on a
single association network.
In this study, we extend the NBDA analytical framework to
test whether the rate of information transfer differs for different
Downloaded from http://rspb.royalsocietypublishing.org/ on March 29, 2015
(a)
G
G
G
B
G
G
B
B
B
B
B
G
B
B
B
M
M
B
B
B
G
B
B
(c)
G
G
B
G
B
B
G
G
G
B
G
B
G
B
B
G
M
G
B
B
B
G
B
B
B
M
B
B B
G
G
M
B
B B
B
G
B
B
B
G
G
B
B
B
B
G
B
G
G
B
B
B
G
B
B
B
B
B
B
G
G
G
B
G
B
B
G
G
B
B B
B
G
B
B
G
B
B
B
B
B
B
G
B
G
B
B
B
B
B
B
B
G
G
B
B
B
B
G
B B B
B
B B B
B
B
B
B
G
B
B
G
B
B
B
G
G
G
B
B
G
B
B
B
B
B
M
(d)
B
B
B
M
G
B
B
M
B
B
B
B
G
B
B
G
B
B
B
G
M
B
G
G
B
B
B
B
B
M
B
B
G
B
M
G
B
B
G
G
B
B
B
B
B
B
B
B
B
G
B
G
B
B
B M
B
B
B
B
B M
G
B
B
B
B
B
G
Figure 1. For each of the two areas in the study ((a,b) Cammoor/Simpsons Copse; (c,d) Higgins Copse) we formed two candidate social networks. One network
contained all of the associations between conspecifics (a,c), with all the edges that were observed between nodes of the same species. The other network contained
all of the associations between heterospecifics (b,d), with all the edges that were observed between nodes of different species. Node colour and label represents
species (blue, B: blue tits; yellow, G: great tits; grey, M: marsh tits). Similarly, edge colour is the combination of the connecting nodes (e.g. green are edges between
great tits and blue tits). Node size represents eigenvector centrality, which was calculated in the original study [7]. (Online version in colour.)
the number of observations to account for this potential confound
(see below).
In the original study, we generated one mixed-species social
network for each of the areas. In this study, we use the same edge
definition, but split the network from each area into two subnetworks: one containing all edges that represent the association
strengths between conspecifics, and a second network containing
all edges between heterospecifics. Although the conspecific
network contains three separate components (one for each
species), it was retained as a single network (i.e. one association
matrix) in our analysis (social networks do not need to be one
fully connected component). This resulted in a total of four
networks as shown in figure 1.
(c) Patch discovery experiment
The patch discovery experiment began 14 days after the end of
the network data collection, during which time no feeders were
present and no supplementary food available. To record the
order and time of arrival at new feeding locations, we placed a
single feeder, equipped with RFID antennae in a random
location in each area. Each feeder was removed after 3 days,
and no food provided for 7 days between trials. This was
repeated four times at Cammoor/Stimpsons Copse and three
times at Higgins Copse. Previous analyses of the discovery
events found that different individuals initially located each
food patch, but that information was then socially transmitted,
with the order of subsequent discoveries matching the patterns
of association in the social network for each area (in which
conspecific and heterospecific associations were combined) [7].
(d) Multi-network network-based diffusion analysis
In the previous study, we used a single multi-species network
from each site. This did not allow us to test whether social
information was transmitted between heterospecifics, and if individuals relied more heavily on information from conspecifics.
Information could have spread entirely between conspecifics
(i.e. along conspecific network edges), requiring only three independent acquisitions (one individual per species discovering the
food sources). The standard model of NBDA cannot determine
whether transmission rates vary between links given observed
social networks. Here, we extend the NBDA framework to include
multiple candidate networks for each diffusion event, which in this
case are the conspecific and heterospecific social networks
described above (figure 1).
In the standard NBDA model, the rate at which individual i
acquires information or adopts a novel behaviour at time t is
given by [20,22]
0
1
N
X
li (t) ¼ l0 (t)@s
aij zj (t) þ 1A(1 zi (t)),
j¼1
where l0(t) is the baseline, or asocial, rate of acquisition (how fast
individuals discover the information for themselves). In this
study, we used the continuous time of acquisition diffusion
analysis (continuous TADA) variant of NBDA [29]. This allows
l0(t) to be either constant (i.e. l0(t) ¼ l0), or to increase or
decrease systematically over the course of a diffusion. The rate
of social transmission is given by parameter s. This parameter dictates the contribution of the weighted network edges (aij ) that
connect i to informed individuals, given that zj (t) is the state of
Proc. R. Soc. B 282: 20142804
B
B
B
G
M
B
B
B
G
B
B
B
G
B
B
M
B
B
B
B
B
G
G
B
G
B
B
B
G
B
B
B
B
B
B
B
B
B
G
B
B
B
G
B
B
B
B
G
G
B
G
B
B
G
G
B
B
G
B
G
B
B
B
B
B
rspb.royalsocietypublishing.org
B
B
B
B
G
B
G
G
3
G
(b)
B
B
G
B
Downloaded from http://rspb.royalsocietypublishing.org/ on March 29, 2015
where aijk is the network connection from j to i in network k and
sk gives the rate of social transmission in network k. This same
approach can be applied to any variant of NBDA (such as
order of acquisition diffusion analysis), and further details are
provided in the electronic supplementary material.
Because flocks of birds typically forage in groups, we wanted
to isolate information transfer from co-discoveries by groups of
birds. That is, our definition of information transfer should
only include direct or indirect recruitment to the resource by
knowledgeable birds. The simultaneous discovery by individuals
in a flock should be considered more similar to food being found
by individuals alone (defined by the asocial parameter l0(t)).
We did this by including an additional term in our model Tij
to capture ties in the discoveries. We defined individuals (say
A and B) that discovered food within 10 min of each other to
be tied (Tij ¼ 0), and ties are no longer included in the estimate
of social information transfer (i.e. by setting aijkzj (t)Tij ¼ 0). However, if A and B did not discover the feeder together, and are
connected in the social network, then social transmission may
have occurred between them (Tij ¼ 1). We consider this to be a
conservative estimate of broader social information use, given
that individuals may also be responding to social queues at a
much finer scale [9].
The multi-network NBDA will work most effectively when
the networks are independent. When they are highly dependent
(e.g. correlated), it will require a lot of data to distinguish the
effects of each network. This will be reflected in wide confidence
intervals (CIs) for each s parameter, and for the estimated
difference between them.
To infer the rates of transmission through the intraspecific
and the interspecific social networks, we thus used
0
1
N
N
X
X
@
li (t) ¼ l0 (t) sintra
aij,intra zj (t)Tij þ sinter
aijk,inter zj (t)Tij þ 1A
j¼1
j¼1
(1 zi (t)),
where aij,intra are the edge weights (association strengths) in the
conspecific network, and aij,inter are the edge weights in the heterospecific network. Thus, if there is no transmission between
heterospecifics (via the links in the relevant heterospecific network), then sinter will equal 0. Finally, as with the standard
NBDA model, it is also possible to incorporate linear predictors
for each individual given by V variables in either a multiplicative
or additive model. These are analogous to fixed effects in generalized linear models, and details are provided in the electronic
supplementary material.
The best-fitting value of each parameter from the experimental diffusion data is then calculated by finding the maximum of
(e) Estimating rates of social and asocial acquisition
of information
Our framework enabled us to estimate separate parameters sintra
and sinter for the conspecific and heterospecific networks, giving
the rate of social transmission per unit association in each of these
networks independently. Our analysis included species as a
factor (to allow for differences in discovery rate among species),
and the number of observations of each bird from the social network data (to control for residency, per [7]). We fitted models
with social transmission occurring: (i) at different rates within
and between species (sintra = sinter); (ii) at the same rate (sintra ¼
sinter); (iii) only within species (sinter ¼ 0); (iv) only between species
(sintra ¼ 0); (v) homogeneously between all individuals in a diffusion (aij,intra ¼ aij,inter ¼ 1) , i.e. not following a specific social
network; and (vi) with no social transmission (sintra ¼ sinter ¼ 0).
Because diffusions occurred at two different sites, an indicator variable was included in all the models to allow the relative rate of
discovery to differ at each site.
For each combination of variables, both additive and multiplicative models were fitted. In the additive model, each
variable (fixed effect) is assumed to affect only the rate of asocial
learning, with social transmission operating as an independent
process by which patches could be discovered. In the multiplicative model, variables affect both the rate of asocial learning and
social transmission. For example, if individual A is twice as fast
to learn asocially as individual B, individual A will remain twice
as fast as individual B if they have the same connection to
informed individuals (see the electronic supplementary material
for specifications). We used an information theoretic approach
with corrected Akaike’s information criterion (AICc) to allow
for model selection uncertainty, summing Akaike weights to
get the level of support for hypotheses (i – vi), and obtaining
model-averaged estimates for each parameter [31]. We obtained
95% CIs using the profile likelihood technique, conditional on
the best model in which that parameter was present (full details
are provided in the electronic supplementary material).
3. Results
We recorded a total of 11 866 and 7790 feeding visits by 93
and 81 individuals, respectively, at Cammoor/Stimpsons
Copse and Higgins Copse, respectively. From these data,
we generated an intraspecific and an interspecific network
for each area (figure 1). Blue tits were the most common
species present, followed by great tits, whereas marsh tits
were relatively uncommon (table 1). In total, 64% of birds
in the network discovered at least one food patch (table 1),
and only 11 birds (7%) were detected in both areas. We
found that patterns of individual discoveries varied between
diffusions, and exhibited isolated bursts of activity that are
consistent with social information spread (figure 2). In our
analysis, these individuals moving as a group and discovering patches together were considered to represent single
cases of information transfer.
4
Proc. R. Soc. B 282: 20142804
j¼1
k¼1
the log-likelihood function ( provided in [30]) using the optim
function in R. This was done by calculating the log-likelihood
for each of our seven diffusions independently, with the association strengths aij,intra and aij,inter taken from the social
networks of the area where the diffusion took place (four in
Cammoor/Stimpsons Copse and three in Higgins Copse). The
total log-likelihood was the sum of the log-likelihoods over
the seven diffusions, and parameter values that resulted in the
largest sum were those that best fit our data.
rspb.royalsocietypublishing.org
i’s social associates (0 ¼ naive, 1 ¼ informed). Because the s parameters give the rate of transmission per unit connection, when
the SRI is used the s parameters effectively estimate the rate that
social transmission occurs between two individuals when
they are in association. Finally, the overall rate of acquisition
li (t) is set to 0 once individual i changes to an informed state
(1 2 zi (t) ¼ 0). Thus, if the social network has no predictive
power, then s ¼ 0 and the overall rate of acquisition will be
given by the asocial rate of acquisition li (t) ¼ l0(t). Non-zero
values of s suggest that individuals are associated with other
informed individuals when they are observed to acquire the
information or adopt the novel behaviour themselves.
To create a multi-network NBDA model, we expanded the
standard NBDA model to include the effects of M different
networks as follows:
0 2
3
1
M
N
X
X
li (t) ¼ l0 (t)@ 4sk
aijk zj (t)5 þ 1A(1 zi (t)),
Downloaded from http://rspb.royalsocietypublishing.org/ on March 29, 2015
8
Cammoor diffusion 1
5
Higgins diffusion 1
7
8
9
10 11 12 13 14 15 16 17 18
10
6
7
8
9
6 8 10 12 14 16 18
10 11
Cammoor diffusion 2
1
6 8 10 12 14 16 18
6 8 10 12 14 16 18
16
6 8 10 12 14
Higgins diffusion 2
1
6 7 8 9 11 13 15 17
6 7 8 9 11 13 15 17
4
6 7 8 9 11 13 15 17
1
7 8 9 10
12
14
16
18
6 7 8 9 10
12
14
6
16
18
6 7 8
Higgins diffusion 3
Proc. R. Soc. B 282: 20142804
Cammoor diffusion 3
1
6 8 10 13 16
6 8 10 13 16
6 8 10 13 16
7
6 8 10 13 16
6 8 10
6 8 10 12 14 16 18
6 8 10 12 14 16 18
6 8 10 12 14 16 18
6 8 10 12 14 16 18
Cammoor diffusion 4
1
5 7 9 12 15 18 6 8 11 14 17 6 8 11 14 17 6 8 11 14 17
time since deployment (time of day)
6 8 11 14 17
Figure 2. Arrival time and order for each experimental diffusion. Each diffusion was tested against the networks from that area (Cammoor/Stimpsons Copse with figure
1a,b and Higgins Copse with figure 1c,d) to estimate social and asocial rates of information acquisition. Each newly arrived individual is shown by a coloured point (blue:
blue tit, yellow: great tit, grey: marsh tit). Arrival times were binned by hour, but the order of arrivals was maintained (from bottom to top). (Online version in colour.)
Table 1. Summary of individuals for each network and diffusion trial by area and by species. (Numbers represent how many individuals found the feeder in
each diffusion (individuals discovering) and how many individuals were included in the social networks (individuals in network) of each area.)
area
diffusion
blue tits
great tits
marsh tits
total
Cammoor/Stimpsons
1
2
16
12
6
4
2
3
24
19
3
4
6
14
8
7
3
3
17
24
28
11
4
43
1
51
25
25
11
5
2
81
37
2
3
20
12
12
7
1
2
33
21
individuals discovering
individuals in network
38
66
15
25
2
2
55
93
total individuals discovering
68
30
5
103
total individuals in networks
106
49
7
162
individuals discovering
individuals in network
Higgins
The addition of interspecific links in the social networks significantly changed the structure of the social network. Across
the two combined areas, edges between individuals (nodes)
of different species accounted for 42% of the total weight,
but 55% of all links (mean intraspecific degree ¼ 0.42, mean
interspecific degree ¼ 0.30). Thus, heterospecifics disproportionately increased the edge density of the network (the number of
links), increasing the connections between otherwise disconnected conspecifics. However, the average association
strength between heterospecifics was weaker than the average
association strength between conspecifics, suggesting that heterospecific associations are less temporally stable. Finally,
rspb.royalsocietypublishing.org
1
1
order of arrival (hourly bins)
7
assortment by degree (where assortment indicates disproportionately strong connections between nodes with similar
degrees [32]) was higher in the network combining both
types of associations (rw
c ¼ 0:29 + 0:01) than in the network
with only intraspecific links (rw
c ¼ 0:24 + 0:01).
(a) Multi-network network-based diffusion analysis
Using a full model-fitting procedure that incorporated both
intraspecific and interspecific social networks for each diffusion event, we found that the best-fitting models all included
information transfer between conspecifics and heterospecifics
Downloaded from http://rspb.royalsocietypublishing.org/ on March 29, 2015
individual-level variables
d.f.
AICc
Akaike weight (%)
sintra = sinter
species
7
4788.77
56.6
sintra ¼ sinter
sintra ¼ sinter
species
residency
6
5
4789.69
4793.57
35.7
5.1
sintra = sinter
residency
6
4794.98
2.5
sintra ¼ sinter
none
4
4804.35
,0.1
Table 3. Summary of the total Akaike weight for all models of social transmission and for asocial leaning. (We found strong support models with both
intraspecific and interspecific information transfer (sintra = 0 and sinter = 0). Most of the support was for models where sintra = sinter, but we could not rule
out that these might not differ. Further, we found little support for homogeneous spread of information, suggesting that our observed network were a good
predictor of information transmission.)
model
same (%)
different (%)
intraspecific only (%)
interspecific only (%)
additive
association
40.9
59.1
0
0
multiplicative
homogeneous
association
0
0
0
0
0
0
0
0
homogeneous
0
0a
0
0
0
asocial
a
network
The total Akaike weight for asocial learning was 2.4 10227.
(table 2). Over all models, we found that the Akaike weight of
models where sintra ¼ sinter (equal rates of transmission within
and between species) accounted for 40.9% of the total weight
(table 3). The majority of the support was for different rates of
transmission within and between species (total Akaike
weight ¼ 59.1%; table 3). Models that included only asocial
information acquisition (individual discovery), models with
transmission on only one network (either between conspecifics
only, or heterospecifics only), and models fitted with homogeneous networks (where all possible network edges ¼ 1)
had less than 0.001% of the total combined weight (despite
accounting for more than three quarters of all the models tested).
When the rates of social transmission were constrained to
be equal between and within species, they were estimated
at s ¼ 22.2 (95% CI ¼ 6.0–33.9) times the baseline (great tit)
rate of asocial learning per unit of network connection, corresponding to an estimated 71% of discoveries being by social
transmission. However, in the best-supported model, rates
were allowed to differ within and between species. The resulting
estimates were sintra ¼ 22.2 (95% confidence range 7.5–36.8) and
sinter ¼ 12.5 (95% confidence range 1.7–25.9), corresponding to
61% of all discoveries being via social transmission (figure 3).
The difference sinter – sintra is therefore estimated to be 9.7
(95% confidence range 26.1 to 23.8), indicating that we have
strong evidence of transmission occurring both within and
between species. Because individual arrivals were constrained
to only count as discovery events if they occurred more than
10 min since the prior arrival, these estimates are also likely to
be conservative. Running the best-supported model without
this constraint estimates that 73% of all discoveries were social
(42% occurring as a result of within-species, and 31% from
between-species, social transmission). Full details relating
to the estimation of CIs are given in the electronic
supplementary material.
The best-supported model estimated that 39% of individuals that first arrived on a food source did so independently
of the social network (but see caveat above). An asocial discovery is defined as occurring when a bird discovers a
feeder without that location having been transmitted by
social transmission from another bird. We found strong support that the rate of asocial discoveries differed between
species (total Akaike weight ¼ 92.3%), with marsh tits estimated to be 5.2 times (95% CI: 1.92 –10.07) more likely than
great tits to find food sources independently of others. Blue
tits were estimated to be only 0.8 times as likely as great
tits to find food alone (95% CI: 0.27–1.09). At the individual
level, each individual marsh tit was estimated to be responsible for 2.6% of all the individual discovery events, much
higher than the estimate for individual great tits (0.7%) and
blue tits (0.4%; figure 3).
4. Discussion
Understanding the relative contribution of different components of social structure is important for the interplay
between population structure and population processes. To
date, studies of animal groups have often, implicitly or not,
assumed that each of the observed links in a social network
are formed for the same purpose. Yet different types of
associations may be important for different social processes
[10]. In this study, we developed a framework that enabled
us to quantify how important different relationships, represented as different social networks, are in the diffusion of
Proc. R. Soc. B 282: 20142804
social transmission within/between species
6
rspb.royalsocietypublishing.org
Table 2. The top five models ordered by AICc. (All include both the within-species and between-species association networks, and none included the
homogeneous network. These models are all additive (i.e. assuming asocial and social learning occur independently) and include a non-constant baseline (i.e.
allowing asocial learning rate to increase or decrease over time).)
Downloaded from http://rspb.royalsocietypublishing.org/ on March 29, 2015
(a) estimated breakdown of discovery events
asocial discovery
within species
marsh tits (×7)
marsh tit
7%
38%
great tits (×49)
2.6%
14%
great tit
0.7%
23%
18%
blue tit
0.4%
Figure 3. (a) Breakdown of discovery events corresponding to the estimated network-based diffusion analysis parameters. The area of each box represents the
estimated proportion of individual patch discoveries events (independent arrivals to the patch by each individual) that were a result of transmission within species
(38%), transmission between species (23%), or asocial learning (39%). The latter is further broken down by species, with numbers in parentheses giving the
observed number of individuals (see table 1). For example, 7% of all arrivals were by marsh tits who discovered the patch without having access to social information. We also calculated the estimated rate of asocial discovery per capita (b). Each individual marsh tit accounted for 2.6% of all asocial discoveries (totalling 18%
of all asocial discoveries by just seven individuals), and thus produced on average 3.7 times more new information than individual great tits and 6.5 times more
information than individual blue tits. The size of each boxes represents the estimated percentage of total discoveries (a) and asocial discoveries (b).
information. We then tested whether the rates of transmission of social information varied between conspecifics and
heterospecifics in a replicated experiment.
After the initial discovery of a food patch, approximately 61%
of all individuals that then found the patch were connected to the
discoverers through network edges (figure 3). The s parameters
in our models estimate the rate of transmission per unit of connection for each of the two networks. Because individuals
typically had a higher weighted degree (or strength) with conspecifics than heterospecifics, information about food patches
is likely to have travelled significantly faster between conspecifics
than between species. We found that the rate of information
transmission between heterospecifics was generally lower than
that between conspecifics, with an estimated transmission rate
per unit of connection of 22.2 for intraspecific edges and 12.5
for interspecific edges. However, these results still revealed an
important role for interspecific transmission of information in
the discovery of new food patches. If individuals did not use
heterospecific information, then they would depend on a conspecific having first discovered the resource independently,
potentially slowing down the spread of new information
through the social network. Interestingly, these results reflect a
recent study quantifying local interaction rules for conspecific
and heterospecific information-use in the collective behaviour
of mixed-species flocks [33].
Associating with, and acquiring information from, different types of individuals may have benefits such as increasing
the pool of local knowledge [34,35]. Associations with heterospecifics can also impact the structure of the social network
[36], which may positively influence the rate of information
spread. For example, the addition of interspecific associations
increases network density (connectivity), by adding more
edges relative to the total number of nodes, which increases
the speed of information flow in networks. However, this
increase is dependent on the structure that additional edges
produce [37]. The combined mixed-species social network
in our study showed a higher level of assortment in network
degree than the intraspecific network alone. Assortment by
degree occurs when more gregarious individuals are associated more strongly with other gregarious individuals,
regardless of species. This type of connectivity creates networks that are robust to fragmentation and promote rapid
transmission across the population [38]. Thus, associations
between heterospecifics may have a profound influence on
the structural properties of the network, with potential fitness
consequences (in this case, they influence the spread of information about the location of food resources). Therefore, when
estimating consequences of social organization in species that
also associate with heterospecifics, it may be important to
consider individuals in the context of their entire network,
rather than individual species-level networks independently.
There are few studies that have investigated whether
removing the opportunity for mixed-species associations influences within-species social processes. The most convincing
study to date showed that white-breasted nuthatches (Sitta
carolinensis) avoided high-risk food resources when tufted
titmice (Baeolophus bicolor) were removed from flocks [39].
Over time, this led to reduced body condition and an
increased rate of over-winter mortality [40]. Similarly, two
independent observational studies found that the composition
of species on different islands [41] and in different rainforest
patches [42] predicted the presence or absence of mixedspecies flocking behaviour. Our study highlights the potential
importance of heterospecifics in the socioecological landscape of wintering songbirds, by showing that heterospecific
associations can lead to an increase in information spread.
Although information moved between heterospecifics,
we also found that not all species generated information
equally: marsh tits tended to be disproportionately more
likely to discover a new patch independently of the network
(i.e. asocially). If most individuals learn by social transmission,
then the identity of those that make independent discoveries
Proc. R. Soc. B 282: 20142804
blue tits (×106)
between species
7
rspb.royalsocietypublishing.org
social transmission
(b) per capita
asocial
discovery
Downloaded from http://rspb.royalsocietypublishing.org/ on March 29, 2015
Ethics statement. All work was subject to review by the Department of
Zoology (University of Oxford) ethical committee and adhered to UK
standard requirements. Birds were caught using mist nets and ringed
under BTO licence C5714.
Data accessibility. Supporting data are available from Dryad at http://
dx.doi.org/10.5061/dryad.416sp.
Acknowledgements. We are grateful to the many fieldworkers who
helped with individual marking of tits. We thank Stefan Krause
and one anonymous reviewer for their insightful comments on this
manuscript.
Funding statement. D.R.F., L.M.A. and B.C.S. were supported by grants
from the ERC (AdG 250164) and BBSRC (BB/L006081/1) to B.C.S.
W.H. was supported by a BBSRC grant (BB/I007997/1). D.R.F.
received additional funding from the NSF (NSF-IOS 1250895) to
Margaret C. Crofoot.
References
1.
2.
3.
4.
5.
6.
7.
Dall SRX, Giraldeau LA, Olsson O, McNamara JM,
Stephens DW. 2005 Information and its use
by animals in evolutionary ecology. Trends
Ecol. Evol. 20, 187– 193. (doi:10.1016/j.tree.2005.
01.010)
Hoppitt W, Laland KN. 2008 Social processes
influencing learning in animals: a review of the
evidence. Adv. Stud. Behav. 38, 105 –165. (doi:10.
1016/S0065-3454(08)00003-X)
Seppanen JT, Forsman JT, Monkkonen M, Thomson
RL. 2007 Social information use is a process
across time, space, and ecology, reaching
heterospecifics. Ecology 88, 1622–1633. (doi:10.
1890/06-1757.1)
Krause J, Croft DP, James R. 2007 Social network
theory in the behavioural sciences: potential
applications. Behav. Ecol. Sociobiol. 62, 15 –27.
(doi:10.1007/S00265-007-0445-8)
Magrath RD, Bennett TH. 2012 A micro-geography
of fear: learning to eavesdrop on alarm calls of
neighbouring heterospecifics. Proc. R. Soc. B 279,
902–909. (doi:10.1098/rspb.2011.1362)
Seppanen JT, Forsman JT. 2007 Interspecific social
learning: novel preference can be acquired from a
competing species. Curr. Biol. 17, 1248 –1252.
(doi:10.1016/j.cub.2007.06.034)
Aplin LM, Farine DR, Morand-Ferron J,
Sheldon BC. 2012 Social networks predict patch
discovery in a wild population of songbirds.
Proc. R. Soc. B 279, 4199 –4205. (doi:10.1098/
rspb.2012.1591)
8.
9.
10.
11.
12.
13.
Farine DR, Garroway CJ, Sheldon BC. 2012 Social
network analysis of mixed-species flocks: exploring
the structure and evolution of interspecific social
behaviour. Anim. Behav. 84, 1271 –1277. (doi:10.
1016/j.anbehav.2012.08.008)
Farine DR, Aplin LM, Garroway CJ, Mann RP,
Sheldon BC. 2014 Collective decision-making and
social interaction rules in mixed-species flocks of
songbirds. Anim. Behav. 95, 173 –182. (doi:10.
1016/j.anbehav.2014.07.008)
Barrett L, Henzi SP, Lusseau D. 2012 Taking sociality
seriously: the structure of multi-dimensional social
networks as a source of information for individuals.
Phil. Trans. R. Soc. B 367, 2108 –2118. (doi:10.
1098/rstb.2012.0113)
King AJ, Clark FE, Cowlishaw G. 2011 The dining
etiquette of desert baboons: the roles of social
bonds, kinship, and dominance in co-feeding
networks. Am. J. Primatol. 73, 768–774. (doi:10.
1002/ajp.20918)
VanderWaal KL, Atwill ER, Isbell LA, McCowan B.
2013 Linking social and pathogen transmission
networks using microbial genetics in giraffe (Giraffa
camelopardalis). J. Anim. Ecol. 83, 406–414.
(doi:10.1111/1365-2656.12137)
Godfrey SS, Bull CM, James R, Murray K.
2009 Network structure and parasite
transmission in a group living lizard, the
gidgee skink, Egernia stokesii. Behav. Ecol.
Sociobiol. 63, 1045–1056. (doi:10.1007/S00265009-0730-9)
14. Perkins SE, Ferrari MF, Hudson PJ. 2008 The effects
of social structure and sex-biased transmission on
macroparasite infection. Parasitology 135,
1561– 1569. (doi:10.1017/S0031182008000449)
15. VanderWaal KL, Atwill ER, Hooper S, Buckle K,
McCowan B. 2013 Network structure and prevalence
of Cryptosporidium in Belding’s ground squirrels.
Behav. Ecol. Sociobiol. 67, 1951– 1959. (doi:10.
1007/S00265-013-1602-X)
16. Drewe JA. 2010 Who infects whom? Social networks
and tuberculosis transmission in wild meerkats.
Proc. R. Soc. B 277, 633–642. (doi:10.1098/rspb.
2009.1775)
17. Kendal RL, Custance DM, Kendal JR, Vale G, Stoinski
TS, Rakotomalala NL, Rasamimanana H. 2010
Evidence for social learning in wild lemurs (Lemur
catta). Learn. Behav. 38, 220 –234. (doi:10.3758/lb.
38.3.220)
18. Allen J, Weinrich M, Hoppitt W, Rendell L. 2013
Network-based diffusion analysis reveals cultural
transmission of lobtail feeding in humpback whales.
Science 340, 485–488. (doi:10.1126/science.1231976)
19. Atton N, Hoppitt W, Webster MM, Galef BG, Laland
KN. 2012 Information flow through threespine
stickleback networks without social transmission.
Proc. R. Soc. B 279, 4272– 4278. (doi:10.1098/rspb.
2012.1462)
20. Hoppitt W, Boogert NJ, Laland KN. 2010
Detecting social transmission in networks.
J. Theor. Biol. 263, 544–555. (doi:10.1016/j.jtbi.
2010.01.004)
8
Proc. R. Soc. B 282: 20142804
tool for testing competing hypotheses about how information
is transferred in multi-dimensional social landscapes. It enables
the relative contribution of different potential pathways of social
transmission to be quantified. For example, animals form and
maintain bonds that may be determined by grooming [45], kinship [46], familiarity [47] or mating networks [48], and these may
vary in their importance for different social processes. We then
combined this method with a field experiment to show that heterospecifics form an important part of the social landscape in a
temperate mixed-species community. We conclude that information was transmitted between those heterospecifics that
form mixed-species flocks of birds, and that individuals of different species varied in how much information they produced.
rspb.royalsocietypublishing.org
becomes important, since they determine where the information is ‘seeded’ in the group and the subsequent pathway
of diffusion. Taken with the evidence that information spreads
between species as well as within species, this suggests that
marsh tits were the original source of a large amount of
social information in our experiments (in total, approx. onethird of discoveries were not the result of information transfer).
This may be because marsh tits are more motivated to discover
new food sources earlier in the day in order to cache food [26]
and, once they discover a new food source, other species parasitize the information they produce [43]. As we control for
co-discoveries, our data do not suggest that marsh tits were
simply in one mixed-species flock, visited together and
simply accessed the feeder first (figure 2). Instead, it is possible
that marsh tits may be more likely to find food on their
own and actively recruit heterospecifics to new food sites.
A recent study of the closely related willow tit (Poecile montanus) found that individuals actively recruited heterospecifics
to new food sources by making loud contact calls [44]. Similarly marsh tits, which are relatively uncommon, might
benefit from dilution of risk or shared vigilance when associating with more numerous heterospecifics. Whether they are
parasitized or actively recruit, our study suggests that marsh
tits may be a ‘keystone’ species within this mixed-species
community during the winter months.
Finally, we have extended the NBDA framework to incorporate multiple candidate networks. This provides a powerful
Downloaded from http://rspb.royalsocietypublishing.org/ on March 29, 2015
40. Dolby AS, Grubb TC. 1998 Benefits to satellite
members in mixed-species foraging groups: an
experimental analysis. Anim. Behav. 56, 501–509.
(doi:10.1006/anbe.1998.0808)
41. Diamond JM. 1975 Assembly of species
communities. In Ecology and evolution of
communities (eds ML Cody, JM Diamond), pp. 342 –
444. Cambridge, MA: Harvard University Press.
42. Maldonado-Coelho M, Marini MA. 2000 Effects of
forest fragment size and successional stage on
mixed-species bird flocks in southeastern Brazil.
Condor 102, 585 –594. (doi:10.2307/1369789)
43. Sasvari L. 1992 Great tits benefit from feeding in
mixed-species flocks: a field experiment. Anim.
Behav. 43, 289–296. (doi:10.1016/S00033472(05)80224-6)
44. Suzuki TN. 2012 Long-distance calling by the willow
tit, Poecile montanus, facilitates formation of mixedspecies foraging flocks. Ethology 118, 10 –16.
(doi:10.1111/J.1439-0310.2011.01982.X)
45. King AJ, Sueur C, Huchard E, Cowlishaw G. 2011 A
rule-of-thumb based on social affiliation explains
collective movements in desert baboons. Anim.
Behav. 82, 1337– 1345. (doi:10.1016/j.anbehav.
2011.09.017)
46. Godfrey SS, Anasri TH, Gardner MG, Farine DR, Bull
CM. 2014 A contact based social network of lizards
is defined by low genetic relatedness among
strongly-connected individuals. Anim. Behav. 97,
35– 43. (doi:10.1016/j.anbehav.2014.08.019)
47. Kurvers RHJM et al. 2013 Context-dependence of
familiarity and kinship in animal social networks.
Anim. Behav. 86, 993– 1001. (doi:10.1016/j.
anbehav.2013.09.001)
48. McDonald GC, James R, Krause J, Pizzari T. 2013
Sexual networks: measuring sexual selection in
structured, polyandrous populations. Phil.
Trans. R. Soc. B 368, 20120356. (doi:10.1098/rstb.
2012.0356)
9
Proc. R. Soc. B 282: 20142804
30. Hoppitt W, Laland KN. 2013 Social learning: an
introduction to mechanisms, methods and models.
Princeton, USA: Princeton University Press.
31. Burnham KP, Anderson DR. 2002 Model selection
and multimodel inference: a practical informationtheoretic approach. New York, NY: Springer.
32. Farine DR. 2014 Measuring phenotypic assortment
in animal social networks: weighted associations
are more robust than binary edges. Anim.
Behav. 89, 141 –153. (doi:10.1016/j.anbehav.
2014.01.001)
33. Farine DR. 2013 Emergent social structure and
collective behaviour from individual decisionmaking in wild birds. DPhil thesis, University of
Oxford, Oxford, UK.
34. Aplin LM, Farine DR, Mann RP, Sheldon BC. 2014
Individual-level personality influences social
foraging and collective behaviour in wild birds.
Proc. R. Soc. B 281, 20141016. (doi:10.1098/rspb.
2014.1016)
35. Morand-Ferron J, Quinn JL. 2011 Larger groups of
passerines are more efficient problem solvers in the
wild. Proc. Natl Acad. Sci. USA 108, 15 898 –15 903.
(doi:10.1073/pnas.1111560108)
36. Farine DR, Milburn PJ. 2013 Social organisation
of thornbill-dominated mixed-species flocks
using social network analysis. Behav. Ecol.
Sociobiol. 67, 321–330. (doi:10.1007/s00265012-1452-y)
37. Shirley MDF, Rushton SP. 2005 The impacts of
network topology on disease spread. Ecol. Complex.
2, 287– 299. (doi:10.1016/J.Ecocom.2005.04.005)
38. Newman MEJ. 2002 Assortative mixing in networks.
Phys. Rev. Lett. 89, 208701. (doi:10.1103/phys
RevLett.89.208701)
39. Dolby AS, Grubb TC. 2000 Social context affects risk
taking by a satellite species in a mixed-species
foraging group. Behav. Ecol. 11, 110– 114. (doi:10.
1093/beheco/11.1.110)
rspb.royalsocietypublishing.org
21. Hoppitt W, Laland KN. 2011 Detecting social
learning using networks: a users guide. Am. J.
Primatol. 73, 834–844. (doi:10.1002/ajp.20920)
22. Franz M, Nunn CL. 2009 Network-based diffusion
analysis: a new method for detecting social
learning. Proc. R. Soc. B 276, 1829 –1836.
(doi:10.1098/rspb.2008.1824)
23. Aplin LM, Farine DR, Morand-Ferron J, Cockburn A,
Thornton A, Sheldon BC. In press. Experimentally
induced innovations lead to persistent culture via
conformity in wild birds. Nature. (doi:10.1038/
nature13998)
24. Goodale E, Beauchamp G, Magrath RD, Nieh JC,
Ruxton GD. 2010 Interspecific information transfer
influences animal community structure. Trends
Ecol. Evol. 25, 354– 361. (doi:10.1016/j.tree.2010.
01.002)
25. Aplin LM, Farine DR, Morand-Ferron J, Cole EF,
Cockburn A, Sheldon BC. 2013 Individual
personalities predict social behaviour in wild
networks of great tits (Parus major). Ecol. Lett. 16,
1365–1372. (doi:10.1111/ele.12181)
26. Farine DR, Lang SDJ. 2013 The early bird gets the
worm: foraging strategies of wild songbirds lead to
the early discovery of food sources. Biol. Lett. 9,
20130578. (doi:10.1098/rsbl.2013.0578)
27. Farine DR. 2013 Animal social network inference
and permutations for ecologists in R using asnipe.
Methods Ecol. Evol. 4, 1187 –1194. (doi:10.1111/
2041-210X.12121)
28. Franks DW, Ruxton GD, James R. 2010 Sampling
animal association networks with the gambit of the
group. Behav. Ecol. Sociobiol. 64, 493–503. (doi:10.
1007/s00265-009-0865-8)
29. Hoppitt W, Kandler A, Kendal JR, Laland KN. 2010
The effect of task structure on diffusion dynamics:
implications for diffusion curve and network-based
analyses. Learn. Behav. 38, 243–251. (doi:10.3758/
Lb.38.3.243)


© Copyright 2026