
1 Genome-Wide Association Study of Agronomic Traits in Common
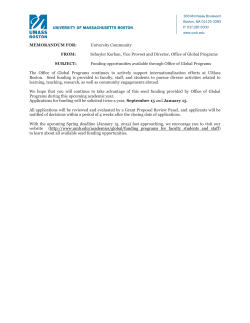
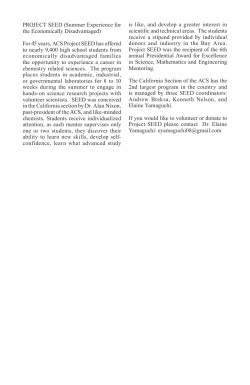
Page 1 of 43
The Plant Genome Accepted paper, posted 03/16/2015. doi:10.3835/plantgenome2014.09.0059
Genome-Wide Association Study of Agronomic Traits in Common Bean
Kelvin Kamfwa, Karen A. Cichy, and James D. Kelly*
K. Kamfwa and J.D. Kelly, Dep. of Plant, Soil and Microbial Sciences, Michigan State Univ.,
1066 Bogue St., East Lansing, MI 48824; K.A Cichy, USDA-ARS, Sugarbeet and Bean
Research Unit, Michigan State Univ., 1066 Bogue St., East Lansing, MI 48824. Received 30
Sept. 2014. *Corresponding author ([email protected]).
Abbreviations: ADP, Andean diversity panel; BLAST, Basic local alignment search tool for
nucleotide; Bp, base pair; DTF, days to flowering; DTM, days to maturity; GWAS, Genomewide association studies; HI, harvest index; SW, 100 seed weight; Kbp, Kilo base pair; LD,
linkage disequilibrium; MAF, minor allele frequency; MLM, mixed linear model; PCA, principal
component analysis; PHI, pod harvest index; PN, pod number; Pv, Phaseolus vulgaris; PW, pod
weight; QTL, quantitative trait loci; RIL, recombinant inbred line; SN, seed number per plant;
SNP, single nucleotide polymorphism.
Abstract
A genome-wide association study (GWAS) using a global Andean diversity panel (ADP) of 237
genotypes of common bean Phaseolus vulgaris, was conducted to gain insight into the genetic
architecture of phenology, biomass, yield components and seed yield traits. The panel was
evaluated for two years in field trials in Michigan and genotyped with 5398 single nucleotide
polymorphism (SNP) markers. After correcting for population structure and cryptic relatedness,
significant SNP markers associated with several agronomic traits were identified. Positional
1
The Plant Genome Accepted paper, posted 03/16/2015. doi:10.3835/plantgenome2014.09.0059
candidate genes, including Phvul.001G221100 on Phaseolus vulgaris (Pv) chromosome 01,
associated with days to flowering and maturity were identified. Significant SNPs for seed yield
were identified on Pv03 and Pv09, and co-localized with quantitative trait loci (QTL) for yield
from previous studies conducted in several environments and contrasting genetic backgrounds.
The majority of germplasm carrying the alleles with positive effects on seed yield were of
African origin, and largely underutilized in U. S. breeding programs.
The study provided
insights into the genetic architecture of agronomic traits in Andean beans.
Introduction
By 2050, the projected 9.6 billion people will require 70% more food than the current demand
and most of this increased demand will be from developing countries mainly in Africa
(Alexandratos and Bruinsma, 2012). Climate change will also likely exacerbate food security
challenges especially in tropical and subtropical regions of Africa (Sassi, 2013). To meet this
increased global food demand, the productivity of most food crops must increase especially in
Africa where the yields are far below their potential (Beebe, 2012; Mueller et al., 2012).
Common bean (Phaseolus vulgaris) is a key commodity for improving food security as it is an
inexpensive and major source of protein and nutrients in many African and Latin American
countries. It is widely grown and fits well in the low input agricultural systems practiced in these
two regions where most resource-limited farmers cannot afford inputs such as fertilizers and
irrigation (Beebe et al., 2012; Broughton et al., 2003).
Improving seed yield is a major objective of most bean breeding programs (Beaver and Osorno,
2009; Kelly et al., 1998; Vandemark et al., 2014). Steady yield gains have been made in
2
Page 2 of 43
Page 3 of 43
The Plant Genome Accepted paper, posted 03/16/2015. doi:10.3835/plantgenome2014.09.0059
Mesoamerican bean types over the last decades resulting from both genetic and improved crop
management, whereas yield gains in large-seeded Andean beans have been modest (Singh et al.,
2007; Vandemark et al., 2014). Seed yield is a quantitative trait in common bean and is
conditioned primarily by three yield components: number of pods per plant, number of seeds per
pod and seed weight (Adams, 1967). All three yield components are quantitative in nature and
are based on the interaction of physiological and morphological features of the plant (Wallace et
al., 1993a). The number of pods per plant and seeds per pod exhibit low heritability, whereas
seed size exhibits moderate heritability levels (Coyne, 1968). Understanding the genetic
architecture of yield and its interaction with individual yield components forms a basis for the
genetic improvement of seed yield in Andean beans. Identifying genomic regions contributing to
yield and its components is essential for marker-assisted selection that could accelerate gains in
breeding for yield in Andean beans.
Numerous mapping studies in common bean have reported QTL for yield and yield components
on several chromosomes. Koinange et al. (1996) reported QTL for pods per plant on Pv01 and
Pv08 in a population of 65 F8 RILs from inter gene pool cross of Midas x G12873 (wild
Mesoamerican accession). Tar’an et al. (2002) reported QTL for seed yield on Pv05, Pv09 and
Pv11, for pod number per plant on Pv02 in 145 F4:5 RILs from OAC Seaforth x OAC 95-4 navy
bean cross. Beattie et al. (2003) reported QTL for seed yield on Pv03 and Pv05 in a population of
110 F5:7 RILs from a cross WO3391 × OAC Speedvale. They also reported QTL for pod number
per plant on Pv02, Pv03 and Pv05 (Beattie et al., 2003). Blair et al. (2006) reported QTL for
seed yield on Pv02, Pv03, Pv04 and Pv09 in an inbred backcross population of 157 BC2F3:5 from
a cross between ICA Cerinza (cultivated recurrent parent) and G24404 (wild donor parent). In
3
The Plant Genome Accepted paper, posted 03/16/2015. doi:10.3835/plantgenome2014.09.0059
the same population, QTL for pods per plant were identified on Pv07, Pv09 and Pv11 (Blair et al.,
2006). Wright and Kelly (2011) reported QTL for yield on Pv03, Pv05, Pv10 and Pv11 in a
population of 96 F4:5 RILs from a black bean cross between Jaguar and 115M. Checa and Blair
(2012) identified QTL for seed yield on Pv03, Pv04 and Pv10 in F5:8 RILs from an inter gene
pool cross of G2333 and G19839. Recently, Mukeshimana et al. (2014) reported QTL for seed
yield on Pv03 and Pv09 in a population of 125 F5:7 RILs from inter gene pool cross of SEA5 x
CAL96. The limited number of markers and small population sizes that were used in these
studies resulted in QTL with low resolution. As a result inferences on positional candidate genes
associated with the identified QTL were difficult to make.
Advances in common bean genomics such as the sequenced genome (Schmutz et al., 2014) have
resulted in the development of high throughput and efficient genotyping platforms including the
BARCBean6K_3 BeadChip with nearly 6000 SNP markers (Hyten et al., 2010). The availability
of SNP BeadChip has created an opportunity to conduct genome-wide association studies
(GWAS) to dissect the genetic architecture of yield and yield components. The analysis allow for
the identification of QTL with enhanced resolution because of the smaller linkage disequilibrium
(LD) blocks in an association panel than in bi-parental mapping populations (Nordborg and
Weigel, 2008). Enhanced resolution is critical for making inferences on positional candidate
genes. The smaller LD blocks result from historical recombinations of genotypes from a
genetically diverse panel as opposed to bi-parental mapping populations where the LD blocks are
longer because of short-lived recombinations resulting from the few generations of
recombination (Myles et al., 2009; Zhu et al., 2008). At each locus there are potentially several
alleles being studied in GWAS (Yu and Buckler, 2006) whereas in bi-parental mapping only two
4
Page 4 of 43
Page 5 of 43
The Plant Genome Accepted paper, posted 03/16/2015. doi:10.3835/plantgenome2014.09.0059
parental alleles that are segregating will be captured. From an applied perspective, GWAS is
more efficient to investigate simultaneously, the genomic potential and genetic variability in a
large collection of germplasm for potential use in breeding programs (Zhao et al., 2011).
Two gene pools, the Andean and Middle American have been described in common bean (Gepts,
1998; Koenig and Gepts, 1989). Greater genetic variability exists in the Middle American than
the Andean gene pool (Bitocchi et al., 2013). As a result more progress in the genetic
improvement of several traits including yield has been documented in the Middle American gene
pool than the Andean gene pool (Beebe, 2012; Beebe et al., 2001; Kornegay et al., 1992; White
et al., 1992; Vandemark et al., 2014). However, moving favorable genes for several agronomic
traits from the Mesoamerican into the Andean gene pool has been challenging especially due to
incompatibility and linkage drag (Gepts and Bliss, 1985; Singh and Gutiérrez, 1984). Largeseeded Andean beans are the most popular beans in Africa (Beebe, 2012; Wortmann, 1998) but
their yields are lower than Middle American beans. In this study a global diversity panel of 237
Andean genotypes from several geographic regions where common bean is grown including
Africa, North America, Central America and South America was studied. A genome-wide
association study was conducted to enhance our understanding of the genetic architecture of
agronomic traits including phenological traits, yield components and seed yield in common bean
using the diversity present in the Andean Diversity Panel (ADP).
Materials and Methods
Plant Material
5
The Plant Genome Accepted paper, posted 03/16/2015. doi:10.3835/plantgenome2014.09.0059
The ADP comprised of 237 genotypes from mainly Africa, North America, Central America,
South America and a few from Europe and Asia was assembled (Cichy et al., 2015). The panel
contains varieties from public and private breeding programs, elite lines and landraces. These
materials were collected from dry bean repositories in the U.S., from CIAT collection and some
were collected during country visits to African countries. The panel represents the major Andean
seed types and varieties important in Africa and North America.
Field Phenotyping
The ADP was field planted at the Montcalm Research Farm near Entrican, MI, USA in 2012 and
2013 growing seasons. The farm is located in central Michigan where Andean beans are
commercially produced. The soil type is a combination of Eutric Glossoboralfs (coarse-loamy,
mixed) and Alfic Fragiorthods (coarse-loamy, mixed, frigid) and rainfall was supplemented with
overhead irrigation as needed. No fertilizer was applied to the plots and recommended practices
were followed for weed and insect control. Soil samples collected from the trial site before
planting showed that in 2012 season the nitrate level in the soil was on average 36 ppm whereas
in 2013 it was 2.4 ppm. Before planting, seed was inoculated with commercial Rhizobium
‘Nodulator’ (Becker Underwood, Ames IA) with an undisclosed strain at the rate suggested on
the package. However, common bean has been grown on this site for many years and there is
also adequate native Rhizobium. In both seasons, the panel was planted in a randomized
complete block design with two replications. Each genotype was planted in two row plots of 4.75
M long each and inter-row spacing of 0.50 M. Phenological traits for days to flowering (DTF)
and days to maturity (DTM) were collected on all entries in both years. In 2012, three plants
were sampled per plot at maturity and in 2013 six plants were sampled per plot at maturity. The
6
Page 6 of 43
Page 7 of 43
The Plant Genome Accepted paper, posted 03/16/2015. doi:10.3835/plantgenome2014.09.0059
aboveground biomass (BM) of these plants was recorded and all pods were removed, counted,
weighed and threshed. Total seed weight and 100-seed weight (SW) was measured on threshed
seed. Biomass (BM), pod number (PN), pod weight (PW), seed number (SN) and seed yield per
plant were an average of three (2012 season) or six (2013 season) plants. Pod harvest index
(PHI) was calculated by dividing seed weight by weight of pods that possessed seed (Beebe et al.,
2008). Harvest index (HI) was computed as the ratio of seed weight to total biomass. In both
years, seed yield per hectare was calculated from yield measured for each plot and seed weight
was adjusted to 16% moisture content.
Genotyping
DNA samples were genotyped using an Illumina BARCBean6K_3 BeadChip with 5398 SNPs
(Hyten et al., 2010) as described by Cichy et al. (2015).
Phenotypic Data analyses
Statistical analyses for field data were conducted using mixed models in SAS 9.3(SAS Institute,
2011). Assumption for normally distributed data required for analysis of variance (ANOVA) and
SNP-trait association test was checked for all traits measured. This was done on the combined
residuals of all treatments for each trait using the normality tests in PROC UNIVARIATE. Based
on normality test results that showed non-normal data for all traits measured in this study, data
for all traits were transformed. All the trait means are reported in their original values. An
ANOVA using PROC MIXED was conducted on all the traits based on the following statistical
model:
= + + + () + () + ℰ
7
The Plant Genome Accepted paper, posted 03/16/2015. doi:10.3835/plantgenome2014.09.0059
Where: Yijk is the response variable (such as yield), with genotype i in the environment j,
repetition k; αi is the fixed effect of the genotype i; βj is the random effect of the year j; αβ is the
random effect of the interaction between genotype i and year j; γ is the random effect of a
replication with year j; ε is the random error term, which is assumed to be normally distributed
with mean =0 and variance δ2e. Pearson correlation analysis using PROC CORR was conducted
on the average values for 2012 and 2013 growing seasons.
Population Structure analysis and Marker-Trait Association Tests
To assess the population genetic structure in the panel, the software program STRUCTURE
(Pritchard et al., 2000) and Principal Component Analysis (PCA) was implemented in the
software program EIGENSTRAT (Price et al., 2006). A subset of 89 SNPs not in LD and
distributed across 11 chromosomes were employed for analysis with STRUCTURE. Length of
Burnin periods was set to 50000 while number of Markov Chain Monte Carlo (MCMC)
repetitions after Burnin was also set to 50000. An assumption of the presence of admixtures in
the population was made. The K range was set to 1-10 and the number of reps for each
simulation to five. The ideal number of sub-populations was determined using the Delta K (∆K)
method (Evanno et al., 2005) implemented in the software STRUCTURE HARVESTER (Earl
and von Holdt, 2012).
After filtering for low quality and monomorphic SNPs, 5326 SNPs were retained. These were
filtered further for minor allele frequency (MAF>0.02) (Stanton-Geddes et al., 2013) and a final
total of 4850 SNPs were used in PCA and association analyses. To correct for cryptic relatedness
8
Page 8 of 43
Page 9 of 43
The Plant Genome Accepted paper, posted 03/16/2015. doi:10.3835/plantgenome2014.09.0059
in the panel the Kinship matrix (K) was included in our association analyses. The kinship matrix
was calculated using Scaled Identity by Descent method in TASSEL 5.0 (Bradbury et. al., 2007).
To determine the SNP-trait associations, a Mixed Linear Model (MLM) (Yu et al., 2005; Zhang
et al., 2010) was implemented in software program TASSEL. The following MLM equation was
used:
= + + + ℰ
where: Y the phenotype of a genotype; X is the fixed effect of the SNP; P is the fixed effect of
population structure (from PCA matrix); K is the random effect of relative kinship i.e., cryptic
relatedness among genotypes (from kinship matrix); ε is the error term, which is assumed to be
normally distributed with mean = 0 and variance δ2e. We used Bonferonni corrected p=1.0 x 10⁻⁵
(for α = 0.05 and 4850 SNPs) (which is the most conservative) was used to determine the
significance threshold for SNPs. This was used for all traits except DTF and DTM, which was
set to p=1.0 x 10⁻⁴ to retain SNPs associated with candidate genes.
To gain insights into the positional candidate genes associated with significant SNPs, Jbrowse on
Phytozome v10 (Goodstein et al., 2012) was used to browse the common bean genome version
1.0 (Schmutz et al., 2014). Positional candidate genes where identified by conducting LD
analysis in TASSEL 5.0 for the genomic region surrounding significant SNPs. A gene was
considered a positional candidate if: the gene contained a significant SNP or the gene contained a
SNP that was in LD with a significant SNP. The functional annotation on Phytozome v10
(Goodstein et al., 2012) for the gene was then checked to make inferences about the plausible
role of the gene in the control of a trait. For the gene with inadequate functional annotation data,
9
The Plant Genome Accepted paper, posted 03/16/2015. doi:10.3835/plantgenome2014.09.0059
Page 10 of 43
genomic sequence data from Phytozome v10 was used in a search against NCBI and TAIR
(Rhee et al., 2003) databases using BLASTN (Zhang et al., 2000).
Results
Phenotypic Traits
Highly significant (P<0.0001) differences existed among the 237 genotypes for all the traits
measured in both 2012 and 2013. The means and ranges for the traits measured are presented in
Table 1. The means for BM, PW and SN were higher in 2012 than 2013. As expected, there were
several significant correlations among traits measured (Table 2). Seed weight was negatively
correlated with PN and SN (Table 2). Yield per plant was negatively correlated with DTF and
DTM and was positively correlated with all other traits. Approximately 26 genotypes out of 237
genotypes in the ADP flowered later than 50 days after planting and were considered
photoperiod sensitive. Of these 23 were from Africa, two from South America and one was from
North America. The negative correlation between DTF and seed yield could be attributed to the
presence of these photoperiod sensitive and late maturing genotypes in the panel whose seed
filling duration was reduced because of the short growing season in Michigan. Falling
temperatures towards end of the season could have reduced photo-assimilates accumulated
before the end of seed filling. However, these genotypes did reach harvest maturity and samples
were collected and plots harvested for data analysis.
Population Structure
The STRUCTURE (Pritchard et al., 2000) analysis and Evano test (∆K) indicated a two subpopulation structure within the 237 ADP genotypes. These two sub-populations are consistent
10
Page 11 of 43
The Plant Genome Accepted paper, posted 03/16/2015. doi:10.3835/plantgenome2014.09.0059
with the Andean or Middle American gene pools. Among the 237 genotypes, 228 were from the
Andean gene pool and the remaining nine genotypes were from Middle American gene pool.
Interestingly sixteen Andean lines displayed between 10-40% of their genome as introgressions
from Middle American gene pool.
Analysis of population structure with PCA, revealed that the first, second and third principal
component (PC) accounted for 36.3%, 12.1% and 5.0% of the genotypic variability in the ADP,
respectively. A plot of PC1 against PC2 clearly showed three clusters of genotypes (Figure 1).
One of these clusters was comprised of seven Middle American genotypes in the STRUCTURE
analysis. The results of PCA and STRUCTURE are comparable though the bigger subpopulation of Andean genotypes in STRUCTURE analysis was split into two clusters in PCA.
The smallest cluster of these two comprised of 19 Andean genotypes of which 14 were landraces
from East Africa, four were varieties from North America and two were from the Caribbean. The
other bigger Andean cluster comprised of genotypes from many geographic regions. The
preliminary GWAS analyses showed comparable results when STRUCTURE or PCA results
were used as a covariate to account for population structure in the panel. The first three PC’s that
together explained 53.4% of the genotypic variability in the ADP were used as covariates to
correct for population structure.
Trait-SNP Associations
Phenological traits
Significant (P<1.0 x 10⁻⁴) SNPs were identified for DTF on Pv01 and Pv08 in 2012 (Figure 2).
The most significant (P=6.9 x 10⁻⁶) SNP for DTF in 2012 that explained 9% of the variability in
11
The Plant Genome Accepted paper, posted 03/16/2015. doi:10.3835/plantgenome2014.09.0059
Page 12 of 43
DTF was located on Pv08 (Table 3). One of the SNPs identified in 2012, ss715646578 on Pv01,
was just below the significance threshold (P=5.6 x 10⁻⁴) in 2013. One significant (P=7.4 x 10⁻⁵)
SNP was identified on Pv01 in 2013 for DTM. This SNP also explained about 9% of the
variation in DTM and was the same SNP associated with DTF (Table 3). No significant
associations for DTM were identified in 2012.
Plant Biomass at Maturity
Significant (P<1.0 x 10⁻⁵) SNPs for BM were identified in 2012 season. SNPs were detected on
Pv02 and Pv08 (Figure 3) with the most significant (P=5.2 x 10⁻⁷) SNP on Pv08 that explained
12% of the variation in BM (Table 3). No significant associations for BM were identified in
2013.
Pod Number
Significant (P<1.0 x 10⁻⁵) SNPs for PN were identified in 2013 on Pv05 and Pv07 (Figure 3).
The most significant (P=2.2 x 10⁻⁶) SNP on Pv05 explained about 10% of variation in PN (Table
3). No significant associations for PN were identified in 2012.
Harvest Index and Pod Harvest Index
Significant SNPs for HI were identified in 2012. The most significant (P=2.9 x 10⁻⁶) SNP was
located on Pv03 and explained 12% of variability for HI in the ADP in 2012. No significant
associations were identified in 2013. Significant association for PHI was identified n Pv04 in
2013 (Figure 3). The most significant SNP (P=4.5 x 10⁻⁶) that accounted for 10% of the
12
Page 13 of 43
The Plant Genome Accepted paper, posted 03/16/2015. doi:10.3835/plantgenome2014.09.0059
variability for PHI was located on Pv04. No significant associations were detected for PHI in
2012.
Pod Weight
Significant SNPs for PW were identified on Pv08 in 2012. The most significant SNP (P=4.3 x
10-8) accounted for about 14% of the variability in PW (Table 3). In 2013 season, significant
associations for PW were identified on Pv08. The most significant (P=8.8 x 10⁻⁶) SNP explained
about 9% of the variability in PW in 2013 (Table 3).
Seed Number
Significant SNPs for SN were identified in 2013 on Pv03 and Pv05 (Figure 4). The most
significant SNP (P=6.7 x 10⁻⁷) was located on Pv03 and accounted for about 13% of the
phenotypic variation in SN (Table 3). No significant SNPs for SN were identified in 2012.
Seed Yield
Significant (P<1.0 x 10⁻⁵) SNPs for seed yield were identified on both per hectare and per plant
basis in 2012. Several significant associations were identified for yield on a per plant basis on
Pv08 in 2012. The most significant SNP (P=1.0 x 10⁻⁷) explained about 13% variation in seed
yield per plant in the panel (Table 3). SNPs significantly associated with seed yield per hectare
were identified on Pv03 and Pv09 (Figure 4) in 2012. The most significant (P=4.5 x 10⁻⁷) SNP
was located on Pv03 and accounted for 14% variability in seed yield per hectare (Table 3). No
significant associations were identified for yield on per plant and per hectare basis in 2013
season.
13
The Plant Genome Accepted paper, posted 03/16/2015. doi:10.3835/plantgenome2014.09.0059
Page 14 of 43
The larger positive effect on seed yield for significant SNP ss715646178 with alleles G and T on
Pv09 came from minor allele G (MAF=0.09). The average yield for genotypic class GG on
ss715646178 was 1690 kg ha-1 while for TT it was 1561 kg ha-1. For SNP ss715649410 on Pv03
with alleles A and G, the larger positive effect on seed yield was from the minor G allele
(MAF=0.12). The averages for seed yield of genotypic classes GG and AA were 1672 kg ha-1
and 1559 kg ha-1, respectively for SNP ss715649410. Among 237 genotypes in the ADP, only 28
and 21 genotypes carried the minor allele for ss715649410 and ss715646178, respectively (Table
4). The geographic distributions of genotypes that carried these alleles with larger positive effect
are presented in Table 4. Twenty-one genotypes carried alleles with larger effect at both
ss715646178 and ss715649410. The average yield for these 21 genotypes was 1824 kg ha-1. A
group of 216 genotypes that did not carry the larger effect allele at both ss715646178 and
ss715649410 averaged about 1627 kg ha-1. Clearly, there is a beneficial yield effect of having
both alleles with larger effect in a single genotype. Of these 21 genotypes carrying the larger
effect allele at both ss715646178 and ss715649410, 12 were from Africa, eight from North
America and one from South America. Not all 12 genotypes from Africa were photoperiod
sensitive in Michigan. These materials could serve as sources of germplasm in breeding for yield
in North American bean breeding programs.
Discussion
Previous QTL studies using bi-parental populations have provided limited insights into the
genetic architecture of a number of important agronomic traits of common bean. In this study we
used a genome-wide association study approach to expand the genetic information on traits
14
Page 15 of 43
The Plant Genome Accepted paper, posted 03/16/2015. doi:10.3835/plantgenome2014.09.0059
controlling phenology, biomass, yield components and seed yield in order to support breeding
efforts directed at improving common beans from the Andean gene pool. Flowering is an
important agronomic trait that is strongly influenced by the environment and is key in the
adaptation of common bean genotypes to different geographic locations (Wallace et al., 1993a).
In this study, we identified SNPs significantly associated with DTF on Pv01 and Pv08. The QTL
on Pv08 was reported previously (Koinange et al., 1996; Pérez-Vega et al., 2010) and the QTL
on Pv01 has been widely reported (Blair et al., 2006; Koinange et al., 1996; Mukeshimana et al.,
2014; Pérez-Vega et al., 2010). Since previous studies have consistently reported QTL for
flowering on Pv01, it is likely to be stable across several environment and genetic backgrounds.
Potential positional candidate genes for flowering in the region around significant SNP
ss715646578 on Pv01 were investigated. Four genes in LD with ss715646578 were detected.
Among these genes Phvul.001G221100 (Figure 2) was approximately 4.5 Kbp downstream of
ss715646578 and in LD. The functional annotation on Phytozome indicated that
Phvul.001G221100 is a two-component sensor histidine kinase. BASTN search of
Phvul.001G221100 genomic sequence against TAIR database resulted in the best hit to the
Arabidopsis thaliana gene phyA that codes for phytochrome A. Phytochrome A is a
photoreceptor pigment reported to control photoperiod sensitivity in Arabidopsis (Reed et al.,
1994). A BLASTN search against of Phvul.001G221100 genomic sequence against NCBI data
resulted in a best hit to a gene GmPhyA3 in Glycine max. GmPhyA3 has been cloned and
characterized as contributing to the complex flowering response and maturity systems in soybean
(Watanabe et al., 2009). Apparently, this gene is conserved in P. vulgaris, G. max and A.
thaliana and appears to retain similar functions in photoperiod sensitivity, flowering and
maturity in these three species. Based on GWAS results and comparative genomics,
15
The Plant Genome Accepted paper, posted 03/16/2015. doi:10.3835/plantgenome2014.09.0059
Page 16 of 43
Phvul.001G221100 is a strong candidate as the gene on Pv01 controlling photoperiod sensitivity
and flowering in common bean.
In P. vulgaris the locus for photoperiod sensitivity (Ppd; Wallace et al., 1993b) was previously
mapped to Pv01 (Koinange et al., 1996; Gu et al., 1998). Due to differences in the marker
technologies used and the large confidence intervals for the QTL reported in previous studies, it
is difficult to ascertain whether previously identified Ppd QTL co-localizes with candidate gene
Phvul.001G221100. However, the ss715646578 SNP on Pv01 is polymorphic between the
original photoperiod sensitive Redkote (A allele) and photoperiod neutral Redkloud (G allele)
cultivars where the Ppd gene was first identified by Wallace et al. (1993b). Photoperiod sensitive
genotypes (Ppd) flower later in extended day light environments and the phenomenon is more
common in the Andean gene pool (Kornegay et al., 1993). A significant number of genotypes
(26 out of 237 genotypes) in the ADP were photoperiod sensitive in Michigan due to the
expression of the Ppd gene under the long day conditions during the growing season.
Days to maturity is critical for the adaption to geographic areas with shorter growing seasons and
short rainy seasons in tropical regions. We identified significant SNPs for maturity on Pv01.
Previous studies have also reported a QTL for maturity on Pv01 (Koinange et al., 1996;
Mukeshimana et al., 2014; Pérez-Vega et al., 2010). In this study the significant SNP
ss715646578 on Pv01 for DTF in 2012 was the same significant SNP for maturity in 2013
(Figure 3). Co-localization of DTF and DTM QTL in common bean has been reported previously
(Koinange et al., 1996). This may suggest that SNP ss715646578 is associated with a gene that
has a pleiotropic effect on flowering and maturity. This may also suggest that this SNP may be in
LD with two different genes controlling these two traits.
16
Page 17 of 43
The Plant Genome Accepted paper, posted 03/16/2015. doi:10.3835/plantgenome2014.09.0059
To gain insights into how selection for flowering and maturity in different geographic regions
has affected the allele frequencies of the ss715646578 SNP that is in LD with
Phvul.001G221100, we investigated allele frequencies of all significant SNPs. The MAF for
SNP ss48340819 that is significantly associated with flowering and maturity was the highest
(MAF=0.36) among all significant SNPs for all traits measured (Table 3). The higher MAF for
flowering and maturity than for other traits measured in this study including seed yield is due to
differences in selection mode. Most materials from Africa flowered and matured later than
materials from North America. This could be a reflection of emphasis placed on breeding for
earliness in North America due to the shorter growing season when compared to the longer
growing season in Africa (Beebe, 2012). The higher MAF could have resulted in spatial variation
in flowering fitness optimum and the frequency of alleles carried on the SNP ss48340819.
Because of the significant representation of both late and early flowering genotypes carrying
contrasting alleles at SNP ss48340819, the MAF is expected to be larger. During selection for
maturity, breeders rarely select phenotypes with extremes in maturity, in contrast to selecting for
yield where phenotypes with extreme high yield potential are sought. Extreme phenotypes are
always few and are caused by rare alleles. As a result the frequency of minor alleles at loci for
yield would be lower as compared to DTF and DTM loci. Though the QTL for flowering on
Pv01 has been widely reported, this is the first report where a QTL for flowering was resolved to
a much smaller genomic region that could facilitate the identification of candidate gene(s). A
candidate gene for flowering and maturity was identified through GWAS and comparative
genomics enabled by the newly released genome for common bean. We have demonstrated how
useful the sequenced P. vulgaris genome will be in advancing the knowledge of the candidate
genes underlying important QTL.
17
The Plant Genome Accepted paper, posted 03/16/2015. doi:10.3835/plantgenome2014.09.0059
Page 18 of 43
Means for BM, PN and seed yield per plant were higher in 2012 than 2013. This could be
attributed to higher soil nitrogen available at the 2012 site (Nitrate=36 ppm) than the 2013 site
(Nitrate=2.4 ppm) at the time of planting. This higher soil nitrogen could have benefited the
plants in 2012 especially in early growth stages when there was little nitrogen fixation by the
plant. Significant correlations were observed for most of the traits measured with seed yield
among the 237 genotypes in the ADP. This was expected as most of these traits are inter-related
and are determinants of seed yield. All the traits measured in this study can essentially be
categorized into three groups: aerial biomass (BM, PW, and PN), phenology (DTF and DTM)
and seed yield (seeds per plant, yield per hectare) and HI and PHI are computed based on these
factors. Seed weight was negatively correlated with PN and SN. This could indicate
compensation among yield components, which has been previously reported (Adams, 1967).
Significant correlations between phenological traits, yield components, aerial biomass at
flowering and seed yield have been reported previously (Scully et al., 1991). Both DTF and
DTM were negatively correlated with yield (Table 2). This could be attributed to the photoperiod
sensitivity of a significant number of genotypes in the ADP, due to the long day length in
Michigan. Photoperiod sensitive genotypes flowered and matured later. Therefore, they had an
extended vegetative growth stage and accumulated more biomass than the photoperiod
insensitive genotypes. In addition, many of these genotypes were inefficient in partitioning
assimilates to the seeds resulting in lower yields. It is probable that if the panel was evaluated in
a tropical environment in East Africa where most of the photoperiod sensitive materials are
adapted and grown, the correlation between yield and DTF, and DTM would be positive.
18
Page 19 of 43
The Plant Genome Accepted paper, posted 03/16/2015. doi:10.3835/plantgenome2014.09.0059
In 2012, highly significant SNPs on Pv08 were identified that were associated BM, PW and yield
per plant. Plant biomass was significantly correlated with PW and yield per plant in the
correlation analyses (Table 2). These SNPs associated with more than one trait could be due to
pleiotropy or due to linked genes that reside in the same LD block and are associated with the
same SNPs. Since pods were part of BM in our measurements, pleiotropy between BM and PW,
cannot be considered. However, pleiotropy is plausible between yield and the two aerial biomass
components (BM and PW). Whereas linkage can be proven if a population can be used that
captures more recombinations in the genomic region where significant SNPs for more than two
traits reside, pleiotropy is difficult to prove. From a plant breeding perspective whether
pleiotropy or linkage is the underlying basis for same SNPs to be associated with BM, PW and
yield per plant has little effect because of the positive effects of these SNPs on BM, PW and
yield per plant. Looking at significant associations for BM and yield on Pv08 helps to reinforce
prior research that selecting for three major physiological components of yield i.e., BM, HI and
DTF (in adapted genotypes) should result in an increase in seed yield in common bean (Wallace
et al., 1993a).
Significant SNPs for HI were identified on Pv03 in 2012 (Figure 4). The two most significant
SNPs ss715639243 and ss715648538 for HI and seed yield per hectare (Table 3), respectively,
on Pv03 were in strong LD (r2=1; D’=1). This may suggest that these SNPs were in LD with a
pleiotropic gene for HI and seed yield (Wallace et al. 1993a). The other possible scenario was
that ss715639243 and ss715648538 could have been in LD with linked genes for HI and seed
yield.
19
The Plant Genome Accepted paper, posted 03/16/2015. doi:10.3835/plantgenome2014.09.0059
Page 20 of 43
Pod number is a major yield component with a significant contribution to seed yield per plant
(Adams, 1967). In this study, significant SNPs were identified for PN on Pv05 and Pv07 in 2013
seasons. QTL for PN have been reported previously on Pv05 (Beattie et al., 2003) and Pv07
(Blair et al., 2006). Two significant SNPs ss715649615 and ss715650235 in 2013 for PN and SN,
respectively, on Pv05 were in LD (r2=0.2; D’=1). This may suggest that these SNPs could be in
LD with a pleiotropic gene or genes in linkage for these two traits.
Significant SNPs for SN were identified on Pv03 and Pv05 (Table 3). Significant SNPs for both
SN in 2013 and seed yield in 2012 were identified on Pv03. Results of LD analysis for the entire
Pv03 indicated that the two most significant SNPs ss715639901 and ss715648538 for SN and
seed yield (Table 3), respectively, were in strong LD (r2=1; D’=1). Numbers of seeds per plant
and seed yield are closely inter-related and as noted earlier could be collapsed into a single
category of yield. This could explain the significant associations on the same chromosome and
the strong LD of significant SNPs for these two traits.
Several significant SNPs were identified on Pv03 and Pv09 for seed yield per hectare and on
Pv08 for yield per plant in 2012 season. There are several reports of QTL for seed yield and
some of these are consistent with our results. Seed yield QTL were identified on Pv03 (Blair et
al., 2006; Checa and Blair, 2012; Mukeshimana et al., 2014; Wright and Kelly, 2011) and on
Pv09 (Blair et al., 2006; Mukeshimana et al., 2014; Tar'an et al., 2002). The QTL, SY3.3SC for
seed yield identified by Mukeshimana et al. (2014) had a marker interval of ss715640477ss715649325 that contained three SNPs. LD analysis between these SNPs and the significant
(7.8 x 10⁻⁶) SNP ss715649410 for seed yield in the current study, indicated two of three SNPs
20
Page 21 of 43
The Plant Genome Accepted paper, posted 03/16/2015. doi:10.3835/plantgenome2014.09.0059
were in LD (r2>0.6; D’>0.9) with ss715649410. One of these three SNPs in SY3.3SC interval was
in strong LD (r2=0.9; D’=1) with the most significant (4.5 x 10⁻⁷) SNP ss715648538 for seed
yield in the current study. Another QTL for seed yield identified by Mukeshimana et al. (2014)
on Pv03 was in the marker interval ss715646941-ss715648035 containing 19 SNPs. Eight of
these 19 SNPs were in LD (r2>0.5; D’>0.8) with the significant SNP ss715649410 in the current
study. These results suggest that the gene(s) underlying the QTL for seed yield identified by
Mukeshimana et al. (2014) are the same ones in LD with significant SNP ss715649410. Five
different studies with very diverse populations including the current study have consistently
reported seed yield QTL on Pv03 and four studies have reported seed yield QTL on Pv09. If
these QTL are stable and expressed in diverse genetic backgrounds they could be used as
potential candidates for marker-assisted breeding for seed yield. The geographic distribution of
minor alleles with a larger positive effect on seed yield for two significant SNPs ss715949410
(P=7.6 x 10⁻⁶) and ss715646178 (P=1.9 x 10⁻⁶) on Pv03 and Pv09 was widespread. This may
indicate the potential of this ADP as a source of germplasm from different countries with
favorable rare alleles that could be used to breed for increased seed yield. Genotypes from other
countries carrying alleles with positive effect on seed yield could also be used to introduce new
genetic variability into the breeding programs. This could play a significant role in increasing
gains in breeding for yield in Andean beans where gains have only been modest when compared
to other market classes because of lack of depth in genetic variability (Vandemark et al., 2014).
Since yield is a cumulative and complex trait (Kelly et al., 1998), many genes each with small
but cumulative effects that are strongly influenced by environmental factors including weather
and management contribute to yield. The fact that we only identified a few SNPs associated with
yield does not mean that these were the only genetic determinants of yield in respective years but
21
The Plant Genome Accepted paper, posted 03/16/2015. doi:10.3835/plantgenome2014.09.0059
Page 22 of 43
this indicates that we may have missed several loci with smaller contributions to yield. The
current study had only sufficient power to identify polymorphic loci with large effects on seed
yield due to the limited size of the ADP. Based on simulations to identify genes with effects as
low as 5% in GWAS, over 1,000 genotypes would be needed to detect a greater number for
genes with smaller effects (Yan et al., 2011).
Most of the traits measured in this study had few significant SNPs. In addition, most SNPs were
significant in one year only. There are two plausible reasons for this. First, the stringent
significance level used following the conservative Bonferonni correction cut-off several SNPs
that could be significant if the significance threshold was lowered. Second, most of the
agronomic traits measured in this study tend to be significantly affected by the environment,
resulting in a significant genotype by environment interaction that could have confounded the
identification of same significant SNPs in both years. Given the genetic complexity of seed yield
and its strong interaction with the environment, further evaluation of the ADP in several
environments would help in validating the QTL identified in the current study and their stability
across environments. The proportion of the phenotypic variation explained by our significant
SNPs is lower than previously reported values. It is plausible that in some previously reported
QTL, the
R2 values for yield and yield components were inflated because of the small
population sizes and limited marker density (Bernardo, 2008). The R2 values reported in this
study that ranged from 9% to 14% are consistent with genetic complexity of traits such as yield
that are controlled by several genes with small but cumulative effect.
Conclusions
22
Page 23 of 43
The Plant Genome Accepted paper, posted 03/16/2015. doi:10.3835/plantgenome2014.09.0059
This study has demonstrated the effectiveness of GWAS to identify QTL with enhanced
resolution of important agronomic traits of common bean. A substantial number of QTL for the
agronomic traits that were identified in this study are consistent with the QTL identified in
previous studies that used diverse populations for bi-parental linkage mapping with low marker
resolution. Furthermore, we identified novel QTL for several agronomic traits which resulted in
the identification of candidate genes for days to flowering and maturity. Given the size of the
panel this study is insufficient to identify QTL with smaller effect for the traits measured. We
identified QTL some of which could potentially be used as candidates for marker-assisted
selection to accelerate gains in breeding for seed yield.
Future studies, using segregating
populations at the significant SNP loci may be necessary to validate the QTL identified for yield
and determine their usefulness in breeding. Our study provides more insights into the genetic
architecture of important agronomic traits contributing to yield of common bean.
Acknowledgements
Research was supported by the Borlaug LEAP program, USDA-ARS, and was also made
possible through support provided by the Feed the Future Innovation Lab for Collaborative
Research on Grain Legumes by the Bureau for Economic Growth, Agriculture, and Trade, U.S.
Agency for International Development, under the terms of Cooperative Agreement No. EDH-A00-07-00005-00, and this work was supported in part by funding from the Norman Borlaug
Commemorative Research Initiative (US Agency for International Development). The opinions
expressed in this publication are those of the authors and do not necessarily reflect the views of
the U.S. Agency for International Development or the U.S. Government. We also thank Dr.
Zixang Wen for his helpful comments on some aspects of data analyses.
23
The Plant Genome Accepted paper, posted 03/16/2015. doi:10.3835/plantgenome2014.09.0059
References
Adams, M.W. 1967. Basis of yield component compensation in crop plants with special
reference to the field bean, Phaseolus vulgaris. Crop Sci. 7: 505-510.
Alexandratos, N., and J. Bruinsma. 2012. World agriculture towards 2030/2050: the 2012
revision. ESA Working paper No. 12-03. Rome, FAO.
Beattie, A.D., J. Larsen, T.E. Michaels, and K.P. Pauls. 2003. Mapping quantitative trait loci for
a common bean (Phaseolus vulgaris L.) ideotype. Genome 46: 411-422.
Beaver, J.S., and J.M. Osorno. 2009. Achievements and limitations of contemporary common
bean breeding using conventional and molecular approaches. Euphytica 168: 145-175.
Beebe, S. 2012. Common bean breeding in the tropics. Plant Breed. Rev. 36: 357-426.
Beebe, S., J. Rengifo, E. Gaitan, M.C. Duque, and J. Tohme. 2001. Diversity and origin of
Andean landraces of common bean. Crop Sci. 41: 854-862.
Beebe, S., I.M. Rao, C. Cajiao, and M. Grajales. 2008. Selection for drought resistance in
common bean also improves yield in phosphorus limited and favorable environments.
Crop Sci. 48: 582-592.
Beebe, S., I. M. Rao, C. Mukankusi, and R. Buruchara. 2012. Improving resource use efficiency
and reducing risk of common bean production in Africa, Latin America and the
Caribbean. Eco-efficiency: From vision to reality. CIAT, Cali, Colombia.
24
Page 24 of 43
Page 25 of 43
The Plant Genome Accepted paper, posted 03/16/2015. doi:10.3835/plantgenome2014.09.0059
Bernardo, R. 2008. Molecular markers and selection for complex traits in plants: learning from
the last 20 years. Crop Sci. 48: 1649-1664.
Bitocchi, E., E. Bellucci, A. Giardini, D. Rau, M. Rodriguez, E. Biagetti, R. Santilocchi, P. S.
Zeuli, T. Gioia, G. Logozzo, G. Attene, L. Nanni and R. Papa. 2013. Molecular analysis
of the parallel domestication of the common bean (Phaseolus vulgaris) in Mesoamerica
and the Andes. New Phytologist 197: 300-313.
Blair, M.W., G. Iriarte, and S. Beebe. 2006. QTL analysis of yield traits in an advanced
backcross population derived from a cultivated Andean× wild common bean (Phaseolus
vulgaris L.) cross. Theor. Appl. Genet. 112: 1149-1163.
Bradbury, P.J., Z. Zhang, D. E. Kroon, T. M. Casstevens, Y. Ramdoss, and E. S. Buckler. 2007.
TASSEL: software for association mapping of complex traits in diverse samples.
Bioinformatics 23: 2633-2635.
Broughton, W.J., G. Hernandez, M.W. Blair, S. Beebe, P. Gepts, and J. Vanderleyden. 2003.
Beans (Phaseolus spp.) - model food legumes. Plant and Soil 252: 55-128.
Checa, O.E., and W.M. Blair. 2012. Inheritance of yield-related traits in climbing beans
(Phaseolus vulgaris L.). Crop Sci. 52: 1998-2013.
Cichy, K.A., T. Porch, J.S. Beaver, P. B. Cregan, D. Fourie, R. Glahn, M. Grusak, K. Kamfwa,
D. Katuuramu, P. McClean, E. Mndolwa, S. Nchimbi-Msolla, M.A. Pastor-Corrales, and
P.N. Miklas. 2015. A Phaseolus vulgaris diversity panel for Andean bean improvement
Crop Sci. 55: (on line).
25
The Plant Genome Accepted paper, posted 03/16/2015. doi:10.3835/plantgenome2014.09.0059
Coyne, D.P. 1968. Correlation, heritability and selection of yield components in field beans,
Phaseolus vulgaris L. Proc. Amer. Soc. Hort. Sci. 93: 388-396.
Earl, D., and B. vonHoldt. 2012. STRUCTURE HARVESTER: a website and program for
visualizing STRUCTURE output and implementing the Evanno method. Conservation
Genet Resour 4: 359-361.
Evanno, G., S. Regnaut, and J. Goudet. 2005. Detecting the number of clusters of individuals
using the software STRUCTURE: a simulation study. Mol. Ecology 14: 2611-2620.
Gepts, P. 1998. Origin and evolution of common bean: past events and recent trends.
HortScience 33: 1124-1130.
Gepts, P., and F.A. Bliss. 1985. F1 hybrid weakness in the common bean. Differential
geographic origin suggest two gene pools in cultivated bean germplasm. J. Hered. 76:
447-450.
Goodstein, D.M., S. Shu, R. Howson, R. Neupane, R.D. Hayes, J. Fazo, T. Mitros, W. Dirks, U.
Hellsten, N. Putnam, and D. S. Rokhsar. 2012. Phytozome: a comparative platform for
green plant genomics. Nucleic Acids Res. 40: 1178-1186.
Gu, W.K., J. Q. Zhu, D. H. Wallace, S.P. Singh, and N.F. Weeden. 1998. Analysis of genes
controlling photoperiod sensitivity in common bean using DNA markers. Euphytica 102:
125-132.
26
Page 26 of 43
Page 27 of 43
The Plant Genome Accepted paper, posted 03/16/2015. doi:10.3835/plantgenome2014.09.0059
Hyten, D.L., Q. Song, E.W. Fickus, C.V. Quigley, J.S. Lim, I.Y. Choi, E.Y. Hwang, M.A.
Pastor-Corrales, and P.B. Cregan. 2010. High throughput SNP discovery and assay
development in common bean. BMC Genomics 11:475.
Kelly, J.D., J.M. Kolkman, and K. Schneider. 1998. Breeding for yield in dry bean (Phaseolus
vulgaris L.). Euphytica 102: 343-356.
Koenig, R., and P. Gepts. 1989. Allozyme diversity in wild Phaseolus vulgaris: further evidence
for two major centers of genetic diversity. Theor. Appl. Genet. 78: 809-817.
Koinange, E.M., S.P. Singh, and P. Gepts. 1996. Genetic control of the domestication syndrome
in common bean. Crop Sci. 36: 1037-1045.
Kornegay, J., J.W. White, and O.O. de la Cruz. 1992. Growth habit and gene pool effects on
inheritance of yield in common bean. Euphytica 62: 171-180.
Kornegay, J., J.W. White, J.R. Dominguez, G. Tejado, and C. Cajiao. 1993. Inheritance of
photoperiod response in Andean and Mesoamerican common bean. Crop Sci. 33: 977984.
Mueller, N.D., J.S. Gerber, M. Johnston, D.K. Ray, N. Ramankutty, and J.A. Foley. 2012.
Closing yield gaps through nutrient and water management. Nature 490: 254-257.
Mukeshimana, G., L. Butare, P.B. Cregan, M.W. Blair, and J.D. Kelly. 2014. Quantitative trait
loci associated with drought tolerance in common bean. Crop Sci. 54: 923-938.
27
The Plant Genome Accepted paper, posted 03/16/2015. doi:10.3835/plantgenome2014.09.0059
Myles, S., J. Peiffer, P. Brown, E. Ersoz, Z. Zhang, D. Costich, and E. S. Buckler. 2009.
Association mapping: critical considerations shift from genotyping to experimental
design. Plant Cell 21: 2194-2202.
Nordborg, M., and D. Weigel. 2008. Next-generation genetics in plants. Nature 456: 720-723.
Pérez-Vega, E., A. Pañeda, C. Rodríguez-Suárez, A. Campa, R. Giraldez, and J.J. Ferreira. 2010.
Mapping of QTLs for morpho-agronomic and seed quality traits in a RIL population of
common bean (Phaseolus vulgaris L.). Theor. Appl. Genet. 120: 1367-1380.
Price, A., N. Patterson, R. Plenge, M. Weinblatt, N. Shadick, and D. Reich. 2006. Principal
components analysis corrects for stratification in genome-wide association studies. Nat.
Genet. 38: 904 - 909.
Pritchard, J., M. Stephens, and P. Donnelly. 2000. Inference of population structure using
multilocus genotype data. Genetics 155: 945-959.
Reed, J.W., A. Nagatani, T.D. Elich, M. Fagan, and J. Chory. 1994. Phytochrome A and
phytochrome B have overlapping but distinct functions in Arabidopsis development.
Plant Physiol. 104: 1139-1149.
Rhee, S.Y., W. Beavis, T.Z. Berardini, G. Chen, D. Dixon, A. Doyle, et al. 2003. The
Arabidopsis Information Resource (TAIR): a model organism database providing a
centralized, curated gateway to Arabidopsis biology, research materials and community.
Nucleic Acids Res. 31: 224-228.
SAS Institute. 2011. SAS version 9.3. SAS Institute Inc., Cary, NC.
28
Page 28 of 43
Page 29 of 43
The Plant Genome Accepted paper, posted 03/16/2015. doi:10.3835/plantgenome2014.09.0059
Sassi, M. 2013. Impact of climate change and international prices uncertainty on the Sudanese
sorghum market: A stochastic approach. Intern. Adv. Econ. Res. 19: 19-32.
Schmutz, J., P. McClean, S. Mamidi, G. A. Wu, S. B. Cannon, J. Grimwood, J. Jenkins, S. Shu,
Q. Song, C. Chavarro, M. Torres-Torres, V. Geffroy, S. M. Moghaddam, D. Gao, B.
Abernathy, K. Barry, M. Blair, M. A. Brick, M. Chovatia, P. Gepts, D. M. Goodstein, M.
Gonzales, U. Hellsten, D. L. Hyten, G. Jia, J. D. Kelly, D. Kudrna, R. Lee, M.M.S.
Richard, P. N. Miklas , J. M. Osorno, J. Rodrigues, V. Thareau, C. A. Urrea, M. Wan, Y.
Yu, M. Zhang, R. A. Wing, P. B. Cregan, D. S. Rokhsar, S.A. Jackson. 2014. A reference
genome for common bean and genome-wide analysis of dual domestications. Nat. Genet.
46: 707-713.
Scully, B., D.H. Wallace, and D. Viands. 1991. Heritability and correlation of biomass, growth
rates, harvest index, and phenology to the yield of common beans. J. Amer. Soc. Hort.
Sci. 116: 127-130.
Singh, S.P., and J.A. Gutiérrez. 1984. Geographical distribution of the DL1 and DL2 genes
causing hybrid dwarfism in Phaseolus vulgaris L., their association with seed size, and
their significance to breeding. Euphytica 33: 337-345.
Singh, S.P., H. Terán, M. Lema, D.M. Webster, C.A. Strausbaugh, P.N. Miklas, H.F. Schwartz,
and M.A. Brick. 2007. Seventy-five years of breeding dry bean of the Western USA.
Crop Sci. 47: 981-989.
Stanton-Geddes, J., T. Paape, B. Epstein, R. Briskine, J. Yoder, J. Mudge, A. K. Bharti, A. D.
Farmer, P. Zhou, R. Denny, G. D. May, S. Erlandson,.M. Yakub, M. Sugawara, M. J.
29
The Plant Genome Accepted paper, posted 03/16/2015. doi:10.3835/plantgenome2014.09.0059
Page 30 of 43
Sadowsky, N. D. Young, and P. Tiffin. 2013. Candidate genes and genetic architecture of
symbiotic and agronomic traits revealed by whole-genome, sequence-based association
genetics in Medicago truncatula. PLoS ONE 8(5): e65688.
Tar'an, B., T.E. Michaels, and K.P. Pauls. 2002. Genetic mapping of agronomic traits in common
bean. Crop Sci. 42: 544-556.
Vandemark, G.J., M.A. Brick, J.M. Osorno, J.D. Kelly, and C.A. Urrea. 2014. Edible Grain
Legumes. In: S. Smith, B. Diers, J. Specht , and B. Carver, editors, Yield Gains in Major
U.S. Field Crops. American Society of Agronomy, Inc., Crop Science Society of America,
Inc., and Soil Science Society of America, Inc. p. 87-124.
Wallace, D.H., J. P. Baudoin, J. S. Beaver, D. P. Coyne, D. E. Halseth, P. N. Masaya, H.M.
Munger, J.R. Myers, M. Silbernagel, K.S. Yourstone, and R.W. Zobel. 1993a. Improving
efficiency of breeding for higher crop yield. Theor. Appl. Genet. 86: 27-40.
Wallace, D.H., K.S. Yourstone, P. N. Masaya, and R.W. Zobel. 1993b. Photoperiod gene control
over partitioning between reproductive and vegetative growth. Theor. Appl. Genet. 86: 616.
Watanabe, S., R. Hideshima, Z. Xia, Y. Tsubokura, S. Sato, Y. Nakamoto, N. Yamanaka, R.
Takahashi, M. Ishimoto, T. Anai, S. Tabata, and K. Harada. 2009. Map-based cloning of
the gene associated with the soybean maturity locus E3. Genetics 182: 1251-1262.
White, W.J., J. Kornegay, J. Castillo, C. Molano, C. Cajiao, and G. Tejada. 1992. Effect of
growth habit on yield of large-seeded bush cultivars of common bean. Field Crops Res.
29: 151-161.
30
Page 31 of 43
The Plant Genome Accepted paper, posted 03/16/2015. doi:10.3835/plantgenome2014.09.0059
Wortmann, C.S. 1998. Atlas of common bean (Phaseolus vulgaris L.) production in Africa.
CIAT, Cali, Colombia.
Wright, E.M., and J.D. Kelly. 2011. Mapping QTL for seed yield and canning quality following
processing of black bean (Phaseolus vulgaris L.). Euphytica 179: 471-484.
Yan, J., M. Warburton, and J. Crouch. 2011. Association mapping for enhancing maize (Zea
mays L.) genetic improvement. Crop Sci. 51: 433-449.
Yu, J., and E.S. Buckler. 2006. Genetic association mapping and genome organization of maize.
Curr. Opin. Biotechnol. 17: 155 - 160.
Yu, J., G. Pressoir, W.H. Briggs, I.V. Bi, M. Yamasaki, J.F. Doebley, M. D. McMullen, B. S.
Gaut, D. M. Nielsen, J. B Holland, S. Kresovich, and E. S. Buckler. 2005. A unified
mixed-model method for association mapping that accounts for multiple levels of
relatedness. Nat. Genet. 38: 203-208.
Zhang, Z., S. Schwartz, L. Wagner, and W. Miller. 2000. A greedy algorithm for aligning DNA
sequences. J. Comput. Biol. 7: 203-214.
Zhang, Z., E. Ersoz, C.-Q. Lai, R. J. Todhunter, H. K. Tiwari, M. A. Gore, P. J. Bradbury, J. Yu,
D. K. Arnett, , J. M. Ordovas, and E. S. Buckler. 2010. Mixed linear model approach
adapted for genome-wide association studies. Nat. Genet. 42: 355-360.
Zhao, K., C.-W. Tung, G.C. Eizenga, M.H. Wright, M.L. Ali, A.H. Price, G. J. Norton, , M. R.
Islam, A. Reynolds, J. Mezey, A. M. Mc Clung, C. D. Bustamante, and S. R. McCouch.
31
The Plant Genome Accepted paper, posted 03/16/2015. doi:10.3835/plantgenome2014.09.0059
2011. Genome-wide association mapping reveals a rich genetic architecture of complex
traits in Oryza sativa. Nat. Commun. 2: 467.
Zhu, C., M. Gore, E.S. Buckler, and J. Yu. 2008. Status and prospects of association mapping in
plants. The Plant Genome 1: 5-20.
32
Page 32 of 43
Page 33 of 43
The Plant Genome Accepted paper, posted 03/16/2015. doi:10.3835/plantgenome2014.09.0059
Captions for the Figures
Figure 1. Principle Component Analysis (PCA) plot of PC1 against PC2 illustrating the
population structure in the ADP. The cluster of blue triangles represents the seven Middle
American bean genotypes while the red represent the 237 Andean genotypes in two separate
clusters
Figure 2. Manhattan plots showing the same candidate SNP for both flowering in 2012 and
maturity in 2013. The model of candidate gene Phvul.001G221100 associated with significant
SNP on Pv01 is shown below.
Figure 3. Manhattan plots showing candidate SNPs and their P-values from GWAS using MLM
for Pod Harvest Index (PHI_13) on Pv03 in 2013, pod number (PN_13) on Pv05 and Pv07 in
2013, biomass (BM_12) on Pv02 and Pv08 in 2012 and pod weight (PW_12) on Pv08 in 2012
and number of pods per plant for 2013 season. Red line is the significance threshold of P=1.03 x
10-5 after Bonferonni correction of α = 0.05
Figure 4. Manhattan plots showing candidate SNPs and their P-values from GWAS using MLM
for seed yield (kg ha-1) on Pv03 and Pv09, and HI on Pv03 in 2012. Red line is the significance
threshold of P=1.03 x 10⁻⁵ after Bonferonni correction of α = 0.05
33
Page 34 of 43
The Plant Genome Accepted paper, posted 03/16/2015. doi:10.3835/plantgenome2014.09.0059
Table 1. Means and ranges for ten agronomic traits measured on 237 common bean genotypes in
the Andean Diversity Panel (ADP) grown at the Montcalm Research Farm, Entrican, MI in 2012
and 2013.
ADP (n=237 genotypes)
Trait
Year
Mean †
Min. ‡
Max. ‡
Days to Flowering
2012
43.4±0.3
28.0
69.0
2013
44.7±0.3
34.0
60.0
2012
91.1±0.4
75.0
115.0
2013
89.2±0.3
73.0
113.0
2012
32.8±0.6
10.8
96.7
2013
25.5±0.3
12.3
48.1
2012
44.2±0.4
17.4
68.8
2013
45.2±0.5
16.1
70.3
2012
11.0±0.2
3.3
28.0
2013
9.2±0.1
4.0
20.7
2012
0.45±0
0.18
0.65
2013
0.50±0
0.26
0.76
2012
0.70±0
0.23
0.84
2013
0.73±0
0.40
0.83
2012
21.1±0.5
5.0
59.8
2013
17.8±0.2
4.9
64.3
2012
32.8±0.2
9.5
92.0
2013
29.4±0.4
11.5
69.2
Days to Maturity
Biomass per Plant (g)
Hundred Seed Weight (g)
Pod Number per Plant
Harvest Index
Pod Harvest Index
Pod Weight per Plant (g)
Seeds per Plant
34
Page 35 of 43
The Plant Genome Accepted paper, posted 03/16/2015. doi:10.3835/plantgenome2014.09.0059
Seed Yield per Plant (g)
Seed Yield (kg ha-1)
2012
14.8±0.3
3.7
38.5
2013
12.9±0.2.
3.4
25.8
2012
1599±26.0
485
3689
2013
1647±31.5
136
3845
† Mean ± Standard Error of the Mean; ‡Max and Min represent the maximum and minimum
range for a trait
35
Page 36 of 43
The Plant Genome Accepted paper, posted 03/16/2015. doi:10.3835/plantgenome2014.09.0059
Table 2. Pearson correlation coefficients among ten agronomic traits measured on 237 common bean genotypes in the Andean
Diversity Panel (ADP) grown at the Montcalm Research Farm, Entrican, MI in 2012 and 2013.
Pod
Pod
Seed
Seed
Seed Yield/
Pod Harvest
Harvest
Days to
Days to
Seed
Traits
Weight
Number
Number
Weight
Plant
Index
Index
Flowering
Maturity
Yield
Biomass
0.87***
0.68***
0.62***
0.24***
0.87***
0.12**
-0.26***
0.17**
0.19***
0.25***
0.72***
0.61***
0.39***
0.96***
0.07ns
0.61***
-0.27***
-0.22***
0.37***
0.81***
-0.17**
0.62***
0.15**
0.39***
-0.1*
-0.13**
0.17**
-0.38***
0.65***
0.29***
0.36***
0.14**
0.04ns
0.07ns
0.34***
-0.13**
0.32***
-0.44***
-0.27***
0.36***
0.31***
0.68***
-0.21***
-0.12*
0.36***
0.41***
0.15**
0.18**
0.06ns
-0.37***
-0.39***
0.46***
0.70***
-0.33***
Pod Weight
Pod Number
Seed Number
Seed Weight
Seed Yield/Plant
Pod Harvest Index
Harvest Index
Days to Flowering
Days to Maturity
-0.37***
* Significant at α=0.05; **Significant at α=0.01; ***Significant at α=0.001
36
Page 37 of 43
The Plant Genome Accepted paper, posted 03/16/2015. doi:10.3835/plantgenome2014.09.0059
Table 3. Chromosome, position, p-values, proportion of phenotypic variation explained (R2) and minor allele frequency of two most
significant SNPs for ten agronomic traits measured on 237 common bean genotypes in the Andean Diversity Panel (ADP) grown at
the Montcalm Research Farm, Entrican, MI in 2012 and 2013.
Minor Allele
Trait
Year
SNP†
Chromosome
SNP Position
P-value‡
R2 §
Frequency
Days to Flowering
2012
ss715646088
Pv08
57734680
6.9E-06
0.09
0.15
2012
ss715646578
Pv01
48340819
1.1E-05
0.10
0.37
Days to Maturity
2013
ss715646578
Pv01
48340819
7.4E-05
0.09
0.37
Biomass
2012
ss715639408
Pv08
5150618
5.2E-07
0.12
0.13
2012
ss715647433
Pv02
38769141
2.1E-06
0.10
0.10
2012
ss715639243
Pv03
45577363
2.9E-06
0.12
0.13
2012
ss715641141
Pv03
46054672
2.9E-06
0.12
0.13
Pod Harvest Index
2013
ss715648677
Pv04
297638
4.5E-06
0.10
0.29
Number of Pods
2013
ss715649615
Pv05
27957387
2.2E-06
0.10
0.03
2013
ss715647649
Pv07
40059490
3.8E-06
0.11
0.03
Harvest Index
37
Page 38 of 43
The Plant Genome Accepted paper, posted 03/16/2015. doi:10.3835/plantgenome2014.09.0059
Pod Weight
Seed Number
Yield per Plant
Seed Yield
2012
ss715639408
Pv08
5150618
4.3E-08
0.14
0.13
2012
ss715649359
Pv08
4743573
1.9E-07
0.14
0.13
2013
ss715647392
Pv08
59337110
8.8E-06
0.09
0.13
2013
ss715639901
Pv03
25241093
6.7E-07
0.13
0.09
2013
ss715650235
Pv05
27277193
4.5E-06
0.10
0.13
2012
ss715639408
Pv08
5150618
1.0E-07
0.13
0.13
2012
ss715649359
Pv08
4743573
2.8E-07
0.14
0.13
2013
ss715647002
Pv09
20618286
8.0E-06
0.09
0.12
2012
ss715648538
Pv03
38268568
4.5E-07
0.14
0.09
2012
ss715646178
Pv09
10005643
1.9E-06
0.11
0.09
†SNP=Single Nucleotide Polymorphic code; ‡P=significance level and E=exponential; § R2 is phenotypic variation explained by the
SNP
38
Page 39 of 43
The Plant Genome Accepted paper, posted 03/16/2015. doi:10.3835/plantgenome2014.09.0059
Table 4. Geographic distributions of the alleles of two significant SNPs with larger positive effect on seed yield measured on 237 bean
genotypes in the Andean Diversity Panel (ADP) grown at the Montcalm Research Farm, Entrican, MI in 2012 and 2013.
Allele and SNP
G (ss715649410) †
Country
G (ss715646178) †
Number of Genotypes
Angola
2
1
Canada
1
1
Georgia
1
0
Kenya
2
2
Malawi
1
1
Puerto Rico
5
2
Tanzania
10
8
Uganda
1
1
USA
5
5
† G was the minor allele with a frequency of 0.12 and 0.09 for both ss715649410 (on Pv03) and ss715646178 (on Pv09), respectively.
39
The Plant Genome Accepted paper, posted 03/16/2015. doi:10.3835/plantgenome2014.09.0059
Figure 1. Principle Component Analysis (PCA) plot of PC1 against PC2 illustrating the population structure in
the ADP. The cluster of blue triangles represents the 7 Middle American genotypes while the red represent
the 237 Andean genotypes in 2 separate clusters
254x190mm (150 x 150 DPI)
Page 40 of 43
Page 41 of 43
The Plant Genome Accepted paper, posted 03/16/2015. doi:10.3835/plantgenome2014.09.0059
Figure 2. Manhattan plots showing the same candidate SNP for both flowering in 2012 and maturity in 2013.
The model of candidate gene Phvul.001G221100 associated with significant SNP on Pv01 is shown below.
254x190mm (150 x 150 DPI)
The Plant Genome Accepted paper, posted 03/16/2015. doi:10.3835/plantgenome2014.09.0059
Figure 3. Manhattan Plots showing candidate SNPs and their P-values from GWAS using MLM for Pod Harvest
Index (PHI_13) on Pv03 in 2013, pod number (PN_13) on Pv05 and Pv07 in 2013, biomass (BM_12) on
Pv02 and Pv08 in 2012 and pod weight (PW_12) on Pv08 in 2012 and number of pods per plant for 2013
season. Red line is the significance threshold of P=1.03 x 10⁻⁵ after Bonferonni correction of α = 0.05
254x190mm (150 x 150 DPI)
Page 42 of 43
Page 43 of 43
The Plant Genome Accepted paper, posted 03/16/2015. doi:10.3835/plantgenome2014.09.0059
Figure 4. Manhattan Plots showing candidate SNPs and their P-values from GWAS using MLM for seed yield
(Kg ha-1) on Pv03 and Pv09, and HI on Pv03 in 2012. Red line is the significance threshold of P=1.03 x 10⁵ after Bonferonni correction of α = 0.05
254x190mm (150 x 150 DPI)


© Copyright 2026