
Adverse Childhood Experiences: Robert Anda, MD, MS Connecting a Developmental Lens
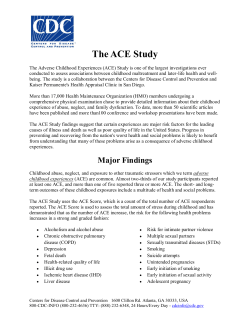
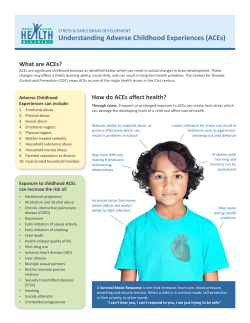
Adverse Childhood Experiences:
Connecting a Developmental Lens
to the Health of Society
Robert Anda, MD, MS
ACE Study Concepts
www.RobertAndaMD.com
www.acestudy.org
www.cdc.gov/ace
The Walk to
Paradise Garden
W. Eugene Smith
Stress
(adrenaline, cortisol)
Unpredictable
Severe
Predictable
Moderate
Number of Episodes
Chronicity*
Vulnerability
(Poly)genetics
Epigenetics
Intrauterine
exposures*
Resilience
Barriers to Educational Achievement Emerge
at a Very Young Age
Cumulative Vocabulary (Words)
1200
1000
College Educated
Parents
800
600
Working Class
Parents
Welfare
Parents
400
200
16 mos.
24 mos.
36 mos.
Child’s Age (Months)
Source: Hart & Risley (1995)
“The Creation of Adam”
Michelangelo 1508-1512
The Adverse Childhood Experiences (ACE) Study
Examines the health and social effects of ACEs
throughout the lifespan among 17,421 members
of the Kaiser Health Plan in San Diego County
A Primary Care Setting…
Educated…
Middle Class..
Predominantly White…
ACE Study Design
Survey Wave I
(N=9,508)
Survey Wave II
(N=8,667)
Mortality
National Death Index
Follow-up
Morbidity
Hospital Discharge
N = 17,421
Outpatient Visits
Emergency room
visits
Pharmacy Utilization
Comprehensive medical
Evaluations abstracted
Adverse Childhood Experiences Are Common
Household dysfunction:
Substance abuse
Parental sep/divorce
Mental illness
Battered mother
Criminal behavior
27%
23%
17%
13%
6%
Abuse:
Psychological
Physical
Sexual
11%
28%
21%
Neglect:
Emotional
Physical
15%
10%
Adverse Childhood Experiences Rarely
Occur in Isolation…
They come in groups.
Alcohol Abuse in the Home
and the Risk of Other ACEs...
Alcohol Abuse in the Home
and the Risk of Childhood Abuse
50
45
Number of alcohol abusers:
0
Percent Abused (%)
40
1
2 or more
35
30
25
20
15
10
5
0
Emotional
Physical
Type of Abuse
Sexual
Domestic Violence in the Home
and the Risk of Other ACEs...
Prevalence of Childhood Abuse by Frequency
of Witnessing Domestic Violence
100
Frequency of witnessing
domestic violence
Never
Once,Twice
Sometimes
Often
Very often
Percent (%)
80
60
40
20
0
Emotional
Physical
Childhood Abuse
Sexual
ACEs tend to come in groups…
Additional ACEs (%)
1
2
3
4
>5
If you had:
A battered mother
95
82
64
48
52
Adverse Childhood Experiences Score
Biologic Stress “Dose”
ACE Score
0
1
2
3
4 or more
Prevalence
33%
26%
16%
10%
16%
ACEs, Smoking, and Lung Disease
Percent With Health Problem (%)
20
ACE Score
18
0
1
2
3
4 or more
16
14
12
10
8
6
4
2
0
Early smoking
initiation
Current smoking
COPD
The ACE Score…
Alcohol Use and Abuse
40
ACE Score
Percent with alcohol related
problem
35
0
1
2
3
4 or more
30
25
20
15
10
5
0
Ever heavy
drinker
Problem with
alcohol use
Alcoholic
Married an
Alcoholic
ACE Score and HIV Risks
20
Percent With Health Problem (%)
18
16
14
ACE Score
0
1
2
3
4 or more
12
10
8
6
4
2
0
Ever Injected
Drugs
Had 50 or More
Intercourse Partners
Ever Had an
STD
The ACE Score and the Prevalence of Liver
Disease (Hepatitis/Jaundice)
12
Percent (%)
10
8
6
4
2
0
0
1
2
ACE Score
3
>=4
The ACE Score and the Prevalence of
Coronary Heart Disease
6
Percent (%)
5
4
3
2
1
0
0
1
2
ACE Score
3
>=4
A Focus on Mental Health…
The ACE Score and a Lifetime History of
Depression
Percent depressed (%)
70
Women
Men
60
50
40
30
20
10
0
0
1
2
ACE Score
3
>=4
Percent atempted (%)
The ACE Score and the Prevalence of
Attempted Suicide
20
15
10
5
0
0
1
2
ACE Score
3
>=4
Cumulative ACEs Increase
the Number of Lifetime DSM-IV Diagnoses*
National Comorbidity Survey – Replication Sample
9
N=5692
Number of Lifetime
DSM-IV Diagnoses
8
7
6
5
4
3
2
1
0
*Putnam, Harris, Putnam
unpublished data, 2011
CCAP0
CCAP1
CCAP2
Increasing ACEs
CCAP3
CCAP4
Art of: Hieronymous Bosch
“The Kiss”
Constantin Brancusi
1909
ACE Score and the
Risk of Being a Victim of Domestic Violence
Women
15
Men
10
5
0
0
1
2
3
4
>5
0
ACE Score
1
2
3
4 >5
ACE Score and the
Risk of Being Sexually Assaulted as an Adult
40
Women
Men
30
20
10
0
0
>5
1
2
3
0
4
ACE Score
1
2
3
4
>5
ACEs and Reproductive Behavior
…. Are they self replicating??
ACE Score
and Teen Sexual Behaviors
Percent With Health Problem (%)
45
40
0
ACE Score
1 2 3 4 or more
35
30
25
20
15
10
5
0
Intercourse by
Age 14
Teen Pregnancy
Teen Paternity
Relationship Between Number of Adverse Childhood
Experiences and Adolescent Pregnancy
60
50
40
30
20
10
0
0
1
2
3
4
ACE Score
5
6
7-8
Percent of Women Who Ever Had an Unintended
Pregnancy by ACE Score
80
70
Percent
60
50
40
30
20
10
0
0
1
2
ACE Score
3
4 or more
Relationship Between Number of Adverse Childhood
Experiences and Fetal Death—First or Second
Pregnancy
18
16
14
12
10
8
6
4
2
0
0
1-2
ACE Score
3-4
5+
Watercolor
By Tennessee Dixon
@ 1978
Estimates of the Population Attributable Risk* (PAR)
of ACEs for Selected Outcomes in Women
Mental Health:
Current depression
Depressed affect
Suicide attempt
Drug Abuse:
Alcoholism
Drug abuse
IV drug abuse
PAR
54%
41%
58%
Promiscuity
48%
Crime Victim:
Sexual assault
Domestic violence
62%
52%
65%
50%
78%
*Based upon the prevalence of one or more ACEs (62%) and the adjusted odds ratio >1 ACE.
ACEs Changed the Landscape
• Provided a compelling tabulation of childhood
adversity that directly related to easily
understood costly outcomes
• Largely responsible for increased awareness of
policy makers of the role of childhood trauma in
costly medical, psychiatric and social problems
• Legitimized and stimulated interest in childhood
adversities for researchers in a range of fields
ACEs Changed the Landscape
• Pervasiveness of ACEs
– Huge number of major public health problems that were
ACE-related (e.g., Depression, Substance Abuse, STDs,
Cancer, Heart Disease, Chronic Lung Disease, Diabetes)
– Significant number of middle-class Americans had ACEs
• Perniciousness of ACEs
– Major contributors to the leading causes of death and
disability
– Life-shortening (~20 years for people with 6+ ACEs)
• Persistence of ACEs
– Life-time effects
– Likelihood of intergenerational transmission
Beyond ACEs
• Link ACEs to existing and future programs
seeking to prevent mental illness, medical
diseases, substance abuse, health risk
behaviors, and social dysfunction
• Prevent ACEs
– Zero ACEs is protective
– Prevent further ACEs in maltreatment victims
• Identify and treat ACEs early in life
• Identify mechanisms (behavioral and
biological) through which ACEs negatively
impact life trajectories
The Walk to
Paradise Garden
W. Eugene Smith
The Costs of the Status Quo..
Reflect the Costs of
Ignoring and Impairing
Early Childhood Development
ACEs and High School Sophomores and Seniors
Population
Average
Spokane Washington
Students with 3 or more ACEs:
·Are 2 ½ times more likely to fail a grade
·Score lower on standardized tests
·Have language difficulties
·Are suspended or expelled more
·Are designated to special education more frequently
-Have poorer health
Courtesy of Chris Blodgett, PhD
Washington State University
Costs of the Status Quo
Criminal Justice
..the prison pipeline
ACEs Among Youth on Probation
Pierce County, Washington
Tacoma
Urban
Network
ACE Exposure and
Youth Outcomes
History of Alcohol & Drug Use and ACE Score
100%
80%
60%
63% 68%
71%
77%
74%
80%
72% 74%
81% 84%
50% 54%
40%
20%
0%
0
1
2
Alcohol
3
Drug
4
≥5
ACE Score and Repeated Suspension/Expulsion
Youth on Probation, Pierce County, WA
History of > 7 expulsions or suspensions since the first grade
50
10
30
1
20
10
16.9%
(n=11)
25.5%
(n=69)
35.3%
(n=158)
35.7%
(n=148)
38.6%
(n=124)
39.4%
(n=148)
0
0.1
0
1
2
3
ACE Score
4
5+
aOR (95% CI)
Prevalence (%)
40
ACE Score and Poor Academic Performance
Youth on Probation, Pierce County, WA
Poor academic performance during most recent school term
50
10
30
1
20
10
16.9%
(n=11)
25.0%
(n=68)
29.1%
(n=132)
28.1%
(n=117)
32.3%
(n=105)
35.7%
(n=135)
0
0.1
0
1
2
3
ACE Score
4
5+
aOR (95% CI)
Prevalence (%)
40
Tacoma
Urban
Network
ACE Score and Felony
Re-offense
Felony Re-offense Post Probation and ACE Score
40%
31%
30%
25%
25%
20%
18%
16%
12%
20%
16%
23%
19%
11%
10%
10%
0%
0
1
2
Within One Year
3
4
Within Two Years
≥5
Costs of the Status Quo
Health Care
Prescription Drugs in the United States (2003)
-nearly $180 billion spent
-11% of total national health expenditures
-more than four times the amount spent in 1990
Prescription rate
(per 100 person-years)
ACE Score and Rates of Antidepressant
Prescriptions
100
90
80
70
60
50
40
30
20
10
0
0
1
2
3
ACE Score
4
>=5
Costs of the Status Quo
Corporations and the Workforce
Drains on Profitability..
Depression and its work related outcomes,
absenteeism, reduced productivity, and medical
expenses:
$44 billion per year
Back pain in the workforce: $28 billion per year
Chemical dependency:
$246 billion per year
These massive losses occur despite the existence of
workplace safety programs and the most expensive
system of medical care in the world.
[
ACE Score and Indicators of
Impaired Worker Performance
25
ACE Score
20
0
1
2
3
4 or more
15
10
5
0
Absenteeism
(>2 days/month)
Serious
Financial
Problems
Serious
Job
Problems
4 Areas of Health and Well-Being
as Mediators
Adverse
Childhood
Experiences
Relationship Problems
-marital
-family
-sexual
Emotional Distress
-depressed mood
-panic reactions
-difficulty with anger
Somatic Symptoms
-back pain
-headaches
-joint problems
Substance Abuse
-alcoholism
-smoking
-illicit drug use
Poor
Worker
Performance
―In the brain, as in the economy, getting it right
the first time is ultimately more effective and
less costly than trying to fix it later. ―
James Heckman
Nobel Laureate Economist
National Scientific Council
on the Developing Child, Perspectives:
The Cradle of Prosperity. (2006).
http://www.developingchild.net
ACEs Effect An Array of Brain Functions
Affect Regulation
Panic reactions, depression, anxiety, hallucinations
Somatic Issues
Sleep disturbances, severe obesity, pain
Substance Use
Smoking, alcoholism, illicit drug use, IV drug use
Sexuality
Early intercourse, promiscuity, sexual dissatisfaction
Memory
Amnesia (childhood)
Arousal
High stress, problems with anger, perpetrating
domestic violence
Neurobiology and Epidemiology Converge
Complex Trauma—Trauma Spectrum Disorders
and the mean number of a variety of problems
Mean Number of
Co-occurring Outcomes
6
5
4
3
2
1
0
0
1
2
3
4
5
ACE Score
*
6
7-8
ACEs appear to affect multiple brain
systems and functions. This leads
to multiple problems in different health
and social domains.
Developmental Trauma Disorder
Adverse Childhood Experiences
As a National Health Issue
ACEs have a strong influence on:
-adolescent health
-reproductive health
-smoking
-obesity
-alcohol abuse
-illicit drug abuse
-sexual behavior
-mental health
- risk of violence and revictimization
-stability of relationships
-performance in the workforce
Adverse Childhood Experiences
As a National Health Issue
ACEs increase the risk of:
-Early death
-Heart disease
- Chronic Lung disease
-Lung cancer
- Liver disease
-Autoimmune disease
- Suicide
- Injuries
-HIV and STDs
- other risks for leading
causes of death
Beham, (Hans) Sebald (1500-1550): Hercules slaying the Hydra, 1545 from The
Labours of Hercules (1542-1548).
A Public Health Framework
For Change
Treatment
Education
Prevention
All must consider
Intergenerational transmission
Bridging The Chasm
Child
health
as it
stands
today
Intergenerational
Care
Consolidation and
Coordination
Child
and
adult
health
as it
could
be
Bridging The Chasm
Child
health
as it
stands
today
Breakthroughs
in molecular genetics
and neurobiology:
Mental illness
Substance abuse
Violence
Improved recognition
and treatment of:
Mental illness
Substance abuse
Domestic violence
Child abuse
Child
health
as it
could
be
Bridging The Chasm
Child
health
as it
stands
today
Mass education
about child
development &
parenting:
Media
Schools
Promoting Healthy
Neurodevelopment
through better early
childhood development
(Promoting Resilience)
Child
health
as it
could
be
Bridging The Chasm
Child
health
as it
stands
today
Harnessing Brain Plasticity
To Overcome the Effects
of Adversity
(Resilience or Recovery)
Documenting the
societal burden of
child health as it
stands today
New directions
in prevention,
treatment, and
policy
Child
health
as it
could
be
Limits of
Understanding
by Paul Klee
(1879-1940)
..the prison pipeline
extends into adulthood
ACE Scores
Kaiser Health Plan
35
30
Percent (%)
25
20
15
10
5
0
0
1
2
3
ACE Score
4
>=5
Messina and Greila
Am J Pub Health
October, 2006
ACE Scores
Kaiser vs Adult Women In Prison
35
30
Percent (%)
25
20
15
10
5
0
0
1
2
3
ACE Score
4
>=5
Messina and Greila
Am J Pub Health
October, 2006
These Mediators Account for Most of the
Effect of ACEs on Worker Performance
Indicators of
Worker Performance
% Mediation by 4 Areas
of Health and Well-Being
Absenteeism
50-67%
Serious Financial Problems
50-83%
Serious Job Problems
79-100%
Public Health Surveillance
Information for Program Applications
Data
Interpretation
Data
Analysis
Program
Evaluation
Information
Dissemination
Data
Collection
Source: Remington and Goodman 1998
Program
Implementation
Program
Planning
States With ACE Studies
in 2008
No data
Source: Behavioral Risk Factor Surveillance System, CDC.
States With ACE Studies
in 2009
6 States
No data
2009
Source: Behavioral Risk Factor Surveillance System, CDC.
States With ACE Studies
in 2009-2010
13 States
No data
2009
2010
Source: Behavioral Risk Factor Surveillance System, CDC.
States With ACE Studies
in 2009-2011
18 States
No data
2009
2010
2011
Source: Behavioral Risk Factor Surveillance System, CDC.
ACEs: A Global Challenge
Costs of the Status Quo
Health Care
Corporations and the Workforce
Criminal Justice
ADVERSE CHILDHOOD EXPERIENCE
• Slowed language &
reading
• Lateralization
• Diminished IQ
• Poor decision
making skills
• Attention problems
• ADD
• ADHD
• Aggressive behavior
• Social isolation
among peers
• Poor understanding
of social cues =
conflict
Significant risk of early use/abuse of:
Alcohol, tobacco, illicit & prescription drugs
Predictable patterns of brain
development, traits & behaviors
EARLY TRAUMA & STRESS
THE FAST TRACK TO POVERTY
• Special
education
• School failure
• Dropping out
• Low-wage
jobs
• Unemployment
• Public
Assistance
• Prison
• Suspension
• Expulsion
• Delinquency
• Dropping out
• Chronic health
problems
• Debilitating
mental health
The brain’s activity can be measured in electrical impulses—here, ―hot‖ colors like red or
orange indicate more activity, and each column shows a different kind of brain activity.
Young children institutionalized in poor conditions show much less than the expected
activity.
Preventive Intervention is More Efficient and Produces
Higher Returns than Later Remediation
Programs targeting
the earliest years
Rates of
return to
human capital
investment
Preschool
programs
K-12
interventions
Job training
0-3
4-5
6-18
Age
19+
Heckman, J. (2007)


© Copyright 2026