
H E I C
ERIA Research Project Report 2010, No. 9 HOW TO ENHANCE INNOVATION CAPABILITY WITH INTERNAL AND EXTERNAL SOURCES EDITED BY PATARAPONG INTARAKUMNERD June 2011 TABLE OF CONTENTS Table of Contents i List of Project Members ii Executive Summary iii Patarapong Intarakumnerd Chapter 1. Chapter 2. Chapter 3. Chapter 4. The Indian Automotive Industry: Enhancing Innovation Capability with External and Internal Resources Sunil Mani Technological Capability of Indonesia’s Automotive Industry Haryo Aswicahyono, Pratiwi Kartika, Yan Rianto, Chichi Shintia Internal and External Resources for Enhancing Innovation Capabilities – An Exploratory Study based on Cases from Malaysian Automotive Sector Avvari V. Mohan Innovation in the Automotive Sector of the Philippines 1 41 105 151 Francis Mark A. Quimba, Maureen Ane D. Rosellon Chapter 5. Innovation Capability of Thailand’s Automotive Industrial Network Somrote Komolavanij, Chawalit Jeenanunta, Veeris Ammarapala 219 Chapter 6. Development of Automotive Industries in Vietnam with Improving the Network Capability Truong Thi Chi Binh, Nguyen Manh Linh 273 Chapter 7. Empirical Study of the Formation of Internal Innovation Capability and External Linkages in ASEAN Economies Masatsugu Tsuji, Kazunori Minetaki, Yuji Akematsu 309 Chapter 8. The Innovation Impact of Knowledge Exchanges within and across Connected Firms Tomohiro Machikita, Yasushi Ueki 357 i LIST OF PROJECT MEMBERS DR. PATARAPONG INTARAKUMNERD (PROJECT LEADER): College of Innovation, Thammasat University, Thailand DR. YASUSHI UEKI (PROJECT COORDINATOR): Bangkok Research Center, IDE, Thailand DR. SUNIL MANI: Centre for Development Studies, Trivandrum, Kerala, India DR. HARYO ASWICHAYONO: Centre for Strategic and International Studies, Indonesia DR. TOMOHIRO MACHIKITA: Institute of Developing Economies (IDE-JETRO), Japan DR. KAZUNORI MINETAKI: Tokyo Medical University, Japan DR. MASATSUGU TSUJI: Graduate School of Applied Informatics, University of Hyogo, Japan DR. AVVARI V. MOHAN: Nottingham University Business School, University of Nottingham - Malaysia Campus Malaysia DR. FRANCIS M. A. QUIMBA: Philippine Institute for Development Studies, Philippines DR. SOMROTE KOMOLAVANIJ: Sirindhorn International Institute of Technology, Thammasat University, Thailand DR. TRUONG CHI BINH: Institute for Industry Policy and Strategy, Vietnam ii EXECUTIVE SUMMARY PATARAPONG INTARAKUMNERD 1. Rationale and Objectives of the Project The developing economies in the Association of Asian Nations (ASEAN) and East Asia have undergone a distinguished transformation over the past three decades. Foreign direct investment has grown, while aggregate output and market size have increased across the countries. Despite huge urban congestions, it appears that agglomerations of industry have grown. These changes in spatial economy have been accompanied by large declines in transport and service link costs within and across agglomerations, leading to economic integration. As an economy integrates, firms and plants may extend their channels to markets or sources globally. At the same time, economic integration has had a pro-competitive effect on middle-income countries in ASEAN, such as Indonesia, the Philippines, Thailand, and Vietnam that compete with lower price and large home market countries like China and India. As competition grows within an integrated economy, firms and plants with less productivity are forced to exit and upgrade to maintain profits. Previous research, for example, Machikita and Ueki (2010) and Machikita, Miyahara, Tsuji, and Ueki (2010), shows that firms and plants in these countries combine internal with external resources to achieve innovation (introduce new goods and new production processes); this includes Indonesia, the Philippines, Thailand, and Vietnam. As a result, firms with more external resources achieve greater innovation. More specifically, the last phase (FY2009) of the ERIA project entitled “Fostering iii Production and Science & Technology Linkages to Stimulate Innovation in ASEAN” elucidated that agglomeration does matter for production linkages and technological upgrading, especially for less capable firms. However, in some cases, it is less important than linkages outside of an agglomeration. In these cases, production and knowledge linkages with capable and better-managed multinationals (MNCs) located in other places are more important for the upgrading of local firms. The study also found that linkages with universities and public laboratories are less important. However, such linkages are more important for higher-capability firms like, for example, those with research and development (R&D) capabilities since the interests and activities in said firms and universities are more similar at that level. Based on that last fiscal-year study and the aforementioned research, this year’s (FY2010) research project entitled “How to Enhance Innovation Capability with Internal and External Resources” focuses on the interaction between external and internal resources leading to building up and/or enhancing the innovation capabilities of firms. The automotive sector has been selected as a case study, since it is very economically important to the ASEAN region and a country like India. The sector is undergoing major technological changes and many countries would like to move up the technological ladder from being simply a production base to being a base for more sophisticated activities like advanced engineering, design and research development. By doing so, firms in the sector might need increased interaction with local knowledge-producing agencies such as public research institutes and universities. It is therefore timely for a comparative study on such a sector. iv 2. Research Methodologies The research used Schumpeter’s definition of innovation, such as: (1) product innovation; (2) application of new technology; (3) organizational change; (4) securing of new suppliers; and (5) securing of new markets. Both questionnaire surveys and in-depth interviews were conducted. The questionnaire survey covers an agglomeration of manufacturing firms (and other actors) in five geographical areas in four ASEAN countries, namely, the Greater Jakarta Area (JABODETABEK) in Indonesia, the CALABARZON Area in the Philippines, the Greater Bangkok Area in Thailand, and the Hanoi and Ho Chi Minh Areas in Vietnam. Firms were asked about their business profile, innovation and upgrading activities in the past three years, sources of new technologies and information for upgrading and innovation in the past 3 years, business linkages with main customers and suppliers, capabilities and strategies for technological upgrading and innovation, and geographical distribution of production and distribution networks. For better insights, in-depth interviews of 10 firms in the automotive industry in the aforementioned countries plus India and Malaysia were also conducted. Based on the Innovation Audit Tool developed by Professor Mike Hobday of CENTRIM, University of Brighton, the following nine dimensions of technological/innovative capability of these selected firms have been evaluated: 1. Awareness of the need to improve, 2. Search ability in relation to external threats and opportunities, 3. The building of distinctive core capabilities, 4. The development of a technology strategy to support the business, v 5. The ability to assess and select the appropriate technological solutions, 6. The acquisition and absorption of the technologies in question, 7. The implementation and effective use of the technologies, 8. The ability to learn from experience to improve technological change capabilities, 9. The ability to form and exploit linkages with a network of suppliers and collaborating firms. The results of the evaluation are used to rank firms into the following four categories according to their technological and innovative capabilities. Type A Firms: Unaware/Passive These firms can be characterized as being “unconscious” or unaware of the need for technological improvement. They do not realize or recognize the need for technological change in what may be a hostile environment and where technological know-how and ability may be vital to survival. They do not know where or what they might improve, or how to go about the process of technology upgrading. As such, they are highly vulnerable to competitive forces. These companies are weak and ill- prepared in all major areas of technology acquisition, use, development, strategy and so on. Type B Firms: Reactive These firms recognize the challenge of change and the need for continuous improvements in manufacturing and other technological capabilities. However, they are unclear about how to go about the process in the most effective fashion. Because their internal resources are limited - and they often lack key skills and experience in vi technology – they tend to react to technological threats and possibilities, but are unable to shape and exploit events to their advantage. Their external networks are usually poorly developed. Most technological know-how comes from their suppliers and from observing the behavior of other firms in their sector. They may well be “keeping up” with other firms which may have similar weaknesses and limitations in technological capability. Typically, this group treats symptoms rather than root causes of problems – for example, dealing with bottleneck operations by replacing machinery only to find that the problem gets worse because the root cause is, in fact, in production scheduling. Overall, these companies have poorly developed capabilities in most areas of technology strategy, search, acquisition and capability building. However, there are some strengths upon which to build. Type C Firms: Strategic These firms have a well-developed sense of the need for technological change. They are highly capable in implementing new projects and take a strategic approach to the process of continuous innovation. They have a clear idea of priorities as to what has to be done, when and by whom, and also have strong internal capabilities in both technical and managerial areas and can implement changes with skill and speed. These firms benefit from a consciously developed strategic framework in terms of search, acquisition, implementation and improvement of technology. However, they tend to lack the capabilities to re-define markets through new technology, or to create new market opportunities. They tend to compete within the boundaries of an existing industry and may become “trapped” in a mature or slow growth sector, despite having exploited technology efficiently within the boundaries of the industry. Sometimes, vii they are limited in knowing where and how to acquire new technologies beyond the boundaries of their traditional business. Overall, these companies have strong in-house capabilities and think strategically about technology in the medium and long term. In some areas, these firms may be behind the international technology frontier but they have much important strength upon which to build. Type D Firms: Creative Type D firms have fully developed sets of technological capabilities and are able to help define the international technology frontier. In many areas, they take a creative and pro-active approach to exploiting technology for competitive advantage. They are at ease with modern strategic frameworks for innovation and take it upon themselves to “re-write” the rules of the competitive game with respect to technology, markets and organization. Strong internal resources are coupled with a high degree of absorptive capacity which can enable diversification into other sectors, where their own skills and capabilities bring new advantages and re-define the ways in which firms traditionally compete, or wish to compete. Their technology and market networks are extensive so that they are kept informed about new technological opportunities and remain in touch with suppliers of equipment and ideas. There are only a few firms in this category and they are generally seen as “risk takers” although, like most businesses, they tend to avoid unnecessary or uncalculated risks. Some creative firms emerge from traditional and mature sectors to challenge the way in which business is conducted. viii 3. Key Findings from the Questionnaire Surveys A total of 794 firms participated in the survey: (1) 142 firms in Indonesia; (2) 235 firms in the Philippines; (3) 104 firms in Thailand; and (4) 155 firms in Hanoi; and (5) 152 firms in Ho Chi Minh City. The analysis can be divided into two parts: descriptive statistics and inferential statistics. Key Findings from Descriptive Statistical Analysis The average age of a firm is 16.4 years, with a standard deviation of 13.4 years. Approximately 63 percent are local firms; 13 percent, joint venture firms; and 13 percent, MNCs. Four percent of the firms produce raw materials, 16 percent process raw materials, 30 percent produce components and parts, and 49 percent produce final goods. For the characteristics of top management, 27.9 percent hold master’s degrees or higher. Almost 60.8 percent have experience as engineers during their careers while 40 percent have had work experience in MNCs or joint-venture companies. Ninety eight percent (98) of blue-collar workers finished high school while 91.2 percent of engineers have technical college degrees. Forty eight percent (42) of firms do have R&D activities. Among these companies, thirty eight (38) percent started R&D activities in 2005 or later. Regarding product innovation, 41 percent were able to change the design of existing products. More than 58 percent of firms improved their own existing products. Forty two percent (42) of firms developed new products based on existing technologies while only 25 percent developed new products based on new technologies. This suggests that it is more difficult to achieve product innovation ix combined with new technologies. Eighty-nine (89) percent of firms succeeded to sell new products to existing markets while only 61 percent of firms were able to sell new products to new markets. This also implies that the creation of new markets is more difficult and costly. As for technological activities, major activities are technological acquisition and production process improvement, such as improving existing machines, equipment, or facilities (81 percent); buying new machines or facilities with new functions (62 percent); decreased production of defective products (82 percent); reducing workers’ injuries or plant accidents (88 percent); reducing raw materials and energy usage (69 percent) More than 90 percent of firms considered external sources of new technologies and information are useful. Final customers, competitors, buyers and trading firms are considered as important external sources for upgrading and innovation, while universities and public research institutes are least important. More than 70 percent consider pubic financial support and tax breaks somewhat useful or definitely useful for innovation and upgrading Key Findings from Inferential Statistical Analysis By the Analytical Hierarchical Process, we have constructed the Technological Capability/Achievement Index comprising three factors which are supposed to contribute towards innovation. (i) Technological Factor: R&D activity indicated by ratio of R&D expenditures to sales at present, owning an intellectual property right, and technical and management systems. x (ii) Organizational Factor: managerial organization to encourage the exchange of information among employees, indicated by practicing QC circles, crossfunctional teams, and sharing information (iii) Human Resources Factor: human resources engaging in innovation activities, indicated by the educational degree of the top management, attitudes toward the communication of the top management, and the educational degree of the employees. The constructed technological capability/achievement index is found to enhance both product and process innovation. In particular, the technological factor is significant for product innovation. The organizational factor is significant for process innovation. The human resource factor is significant for both. Another econometrics study also found a positive relationship between internal and external resources leading to innovation. Adopting cross-functional teams within a firm can stimulate the product innovation impacts of knowledge exchanges through engineers with upstream and downstream firms. These product innovations range from very simple product upgrading i.e., changing package designs to more advanced ones i.e., development of a totally new product based on new technologies. 4. Key Findings from Case Studies The key findings from each country will be summarized. Then we will indicate crucial factors affecting the enhancement of the innovative capability of firms with internal and external resources. xi India India’s automotive industry has a relatively longer history, since the late 1940s, early 1950s. The domestic market size is big enough (and expanding rapidly) to provide sufficient incentive for the technological capability development of Indian firms. Policy-wise, the market was heavily protected from foreign competition and investment until the 1970s. This helped India to build up an indigenous automotive industry, though achievement in terms of technological capability development is not so satisfactory. Foreign technology licensing was liberalized in the 1980s, followed by major liberalization with regard to foreign investment in the 1990s. Recently, the automotive industry has come to be considered both important and strategic. The allocation of a cess (education) fund for R&D for the sector has increased. Also, the government has announced very ambitious plans to set up a world-class automotive testing and R&D infrastructure. At present, several companies which are now world-class in terms of production and sales also gave at their inception the issue of development of indigenous technological capability as a main technological strategy. This can be seen by increasing R&D intensity, i.e., the ratio of R&D expenditure to total sales. Nonetheless, they also rely a lot on external resources both in terms of embodied technology (import of capital goods) and disembodied technology (licensing). Domestic firms relied more on internal sources (in-house R&D), while subsidiaries of transnational corporations relied more on external sources. Interestingly, several domestic firms recently acquired technology and knowledge from leading firms in developed countries through merger and acquisition and with partnership agreements. They also gained technological capability by attempting to meet international xii standards. With the combination of developing in-house capability, especially R&D, and leveraging external resources, especially from leading foreign companies, several Indian firms have product innovations, not only for the Indian market, but for the global one (like Tata’s Nano). Thailand Thailand’s automotive industry has expanded rapidly since the 1960s. Unlike Malaysia and, to a lesser extent, Indonesia, Thailand has not had national car programs. Its strategy depends extensively on encouraging foreign direct investment first for the purpose of substitution and, since the 1980s, for export promotion. Thailand was the world’s 12th-largest automobile producer in 2008 (up from 15th in 2007) and the largest producer in Southeast Asia. One strength of the Thai automotive industry is the extensiveness of networks of automotive parts suppliers. There are more than 600 first-tier suppliers (almost half being foreign companies) and more than 1,600 secondand third-tier suppliers. Nonetheless, the high value-added “functional” parts have to be imported. Regarding capability development, transnational corporations like Toyota and Nissan have changed their investment decisions on Thailand. They started “development” activities in the early 2000s by setting up “technical centers” separately from existing production facilities. Their activities include product design, validation, testing, and market assessment of new products. These technical centers also cover products for the ASEAN market. As for parts makers, since they face a very high level of competition and rapid changes in demand, they have to upgrade their capabilities. Thai-own suppliers seem to be more active in this regard as they have to survive by their own ability. A few Thai-owned first-tier suppliers have already set up their own xiii “technical centers.” However, innovation, if any, is still limited to “process innovation”. They have also made significant improvement in modifying production processes to meet customer demand. As for external resources, the relationship with customers is most important in terms of knowing market trends and knowledge transfer. They have also received knowledge by hiring foreign “technical assistants” and retired engineers. They also tried to help their suppliers (second-tier parts makers) by sending their engineers to train and work with them. Relationships to local universities seem to be insignificant and limited to testing activities. Interestingly, private industrial associations and government sector-specific development agencies were considered as important in assimilating market information and human resource development. As for second-tier and third-tier suppliers, they are still struggling on increasing the efficiency of their production processes. Malaysia The Malaysian automotive sector is anchored by large national vehicle-making firms which are protected by several policy measures. More recently, the market has become more liberalized with more choices for customers on the one hand and on the other more competition for the national vehicle makers and also the automotive parts and components industry in general. Overall findings indicate the sector is dominated by supplier firms that are mostly involved in not so high-tech parts like plastic or metal parts and there is little by the way of product innovation, and most innovation is aimed at changes in processes (this is with the exception of the two national car manufacturing firms Proton and Perodua, which have the full set of value chain activities involved in automobile product design and manufacturing). The foreign xiv players have been mostly assemblers and while they are well linked in terms of intrafirm networks with access to technological resources, this does not seem to have spilled over to the supplier firms. While there are indications that several of these firms are passive (Type A) in terms of innovation activities/capabilities and could be in danger of not being competitive if they lose their anchor customer – there is anecdotal evidence where firms (small and large) have become competitive and gone into export markets by developing external linkages and internal resource developments, thus overcoming barriers to limited resources or market size for innovation (Type C). For SMEs, transnational corporations were seen as the key drivers of innovation as they are perceived to be the “lead” organizations in the market. Contradicting conventional criticism, the policy of national car projects seems to have helped in developing a sector of automotive parts and components firms. There appears to be very little linkage with external actors for enhancing innovation capabilities. A major barrier identified in some of the other firms is a low volume of business in the local market and also a slow product life cycle leading to a lower requirement for design work. Indonesia The Indonesian automotive industry seriously started during the 1970s. Like other countries, a policy of import substitution and building up of local industry was the main objective. Content requirements were in place to encourage the production of local automotive parts. The government also attempted to introduce national car projects. However, unlike Malaysia, they were not successful due to the inability to develop indigenous technological capabilities, and inefficiencies. Since the Asian economic crisis in 1997, the market has been liberalized. Now, Indonesia is a major xv investment destination for several global automotive makers and their suppliers. As a result, production and sales (domestic market and export) have gone up considerably. In terms of technological capability, the case studies show that most firms are still passive learners. Joint-venture companies rely considerably on their foreign partners in terms of technological capability development. Therefore, capability in terms of awareness, technology search and acquisition, developing core competence and leveraging external sources of knowledge (beyond foreign partners) can be categorized as passive and reactive (Type A and B). Nonetheless, in terms of project implementation and production capability, they can learn from their partners, especially in project and risk management and continuous and incremental improvement (Kaizen). On the other hand, Indonesian-owned firms are much more active in terms of enhancing awareness and in search and technology acquisition capabilities as they have to rely on themselves to survive in the competitive market. A few local companies are very active in modifying and constructing their own machines by imitating Japanese ones and learning from outside sources such as the Internet, academic journals and competitors. However, their project implementation capability is not as strong as joint-venture firms. Above all, the most important technological issue facing both groups of firms is not about innovation, but the ability to meet quality, cost and delivery standards posted by transnational companies. University and industry linkages happened in some cases but they were on a “personal” rather than an “institutional” basis, for example, professors were invited to provide training at companies. xvi Vietnam Vietnam is a latecomer as its automobile industry started just 20 years ago. Although the country has made great efforts to promote the industry, the general size of investment projects is relatively small, with only 5,000-7,000 units per year. More than 90% of automobile parts and components, especially functional ones, are imported from parent companies or foreign suppliers. The linkage of local businesses to large manufacturers is very limited. Technological spillovers from transnational corporations to local firms in this sector are rather small. Though in general subsidiaries of transnational corporations have higher capabilities, especially in developing core technological competence and implementing and absorbing technology, there are some active local companies. Nonetheless, the key issue facing these local firms at present is getting basic “production technology” right. It is not so much about innovation. In addition, it was found that the small market size and the weak production network are the main obstacles to the technological capability development of firms in Vietnam. The Philippines The Philippine automotive industry has steadily improved since the Asian crisis. However, relative to other countries, the sector has languished. Despite having an “awareness” of the importance of technology and upgrading, some firms are not able to translate this awareness into other technology activities such as formulating and implementing technology strategies and building up core technological competence. Interestingly, subsidiaries of transnational corporations, reliant on their mother companies for the technology to be used in the firm, tend to have less technology activity than Filipino-owned firms. Filipino-owned firms also tend to have utilized xvii external linkages more than foreign-owned firms or joint ventures. Assemblers tend to have more innovative activity than first-tier or second-tier firms. Similar to other cases, the low volume of the domestic market impedes the chances of enhancing the technological capability of firms, as they are not incentivized to carry out such activities locally. Crucial Factors Affecting Enhancement of Innovative Capabilities of Firms with Internal and External Resources in the Automotive Industries of ASEAN Plus India. From the case studies, we can divide the crucial factors affecting the enhancement of the innovative capabilities of firms with internal and external resources into two groups: internal factors of firms and environmental factors. Internal Factors of Firms Firms’ technology strategy and strategic intent. Several foreign subsidiaries of these countries have strategies confined to the overall strategy of their headquarters. They have limited room to formulate an “independent” strategy, select technologies, and build up core competence. As a result, they are quite “passive” in developing internal technological capabilities. Local firms from the studies can be divided into two types. Those in the first group rely extensively on “senior” foreign and local partners and customers. They are concentrated on making parts according to orders and the instructions of those firms. On the contrary, firms in the other group try to develop their own strategies and actively search and select technology and equipment by themselves. xviii Learning process. Again, firms can be divided into two types. “Passive learners” (usually falling into Type A and B categories) have limited awareness of what is going on in the industry. Or they might have a high level of awareness but fail to turn it into a technology strategy, as in the case with several Filipino firms. On the other hand, “active learners” struggling to survive in a competitive environment, make a big effort to capture “learning” processes. Over time, through formal documentation (such as following international organizational management standards like TS 16949), knowledge-sharing and capacity building, they develop “core” competence, which gives them distinctive advantages over their competitors. This is the case with Type C firms in Vietnam, Malaysia and India. Absorptive capacity. This is a key for leveraging external resources, even for firms relying on senior partners and customers. There are cases of transnational corporations’ subsidiaries in Vietnam and Thailand with a very strong absorptive capacity, even though they are less independent in developing their own strategies. As a result, they can gain considerably from parent companies. It should be noted that it takes time and serious effort to build absorptive capacity. Environmental Factors Demand and product life cycle. In countries like the Philippines, Vietnam, and, to some extent, Malaysia, the local market is too small and product life cycle is too long. Therefore, firms are not incentivized and cost effective in enhancing internal capabilities. Nonetheless, there are Thai and Malaysian local firms that circumvent these difficulties by targeting export markets. They have painstakingly developed capabilities to meet the quality, cost and delivery requirements of xix export markets. In turn, large volumes and demanding customers in the export markets induced these firms to further enhance their technological capability. Regulatory and policy environment. It is interesting to see that local content requirements imposed by the government and national car policies (as in Malaysia) helped in establishing linkages and technological spillovers between transnational corporations and local firms. At present, these policies have been phased out and markets have been liberalized. Nonetheless, the impacts of these policies at the beginning and learning phase are important. In addition, the policy to induce competition, especially foreign competition, helped to pressure local firms to be more active in building up their capabilities, as illustrated in the cases of India after 1991 and Indonesia after the 1997 crisis. 5. Policy Recommendations The study draws up certain policy recommendations on the basis of the key findings both at the levels of national governments (ASEAN members) and of the ASEAN Plus Six. At both levels, there are three sets of policy recommendations which relate to each other: a) policy to stimulate “demand” for the enhancement of technological and innovative capabilities; b) policy to upgrade the technological and innovative capabilities of firms; c) policy to strengthen linkages between internal and external resources. xx Figure 1: Three Sets of Policy Recommendations Stimulating Demand for Capability Development Upgrading Technological & Innovative Capability Strengthening Linkages between Internal & External Resources Policy Recommendations for National Governments (ASEAN Members) A) Policy to stimulate “demand” for the enhancement of technological and innovative capabilities Country studies, especially Vietnam, Malaysia and the Philippines, illustrate that the limitations of domestic markets in terms of size and availability of demanding customers (leading to short product life cycles) is one of the mains obstacles to technology capability upgrading and innovation. To rectify these shortcomings, a set of policy recommendations has been developed as follows: Business matching programs between local SMEs on the one hand, and large local companies and transnational corporations on the other, should be given much higher priority. At present, there are such programs in several countries in the region, but their activities are rather small and not too effective. Many SMEs do not have information on potential customers, especially in developed countries. Governments should make a greater effort, for example, to set up information centers to disseminate this valuable information. SMEs should be encouraged and partially funded to become members of international industrial associations and networks. As a result, they will have more xxi international exposure and a better possibility of finding new foreign customers. B) Policy to upgrade the technological and innovative capabilities of firms Country studies point out that there are two main groups of firms: Type A/B and Type C. The policy recommendations to upgrade the technological and innovative capabilities of the two groups are different. For the first group of firms (Type A/B), the largest in the studies, the issue is to change from being passive/reactive players in responding to changing competitive environments to be able to leverage their opportunities into strategic ones (Type C), that is, having a well-developed sense of the need for change and being capable in taking a strategic approach to the process of continuous innovation. In order to achieve this target, these Type A/B firms need to enhance three main sets of capabilities: design and engineering, technology search and acquisition, and project management. The set of policy recommendations is as follows: Tax and financial incentives targeting the enhancement of said capabilities. Government consultancy services and/or subsidized consultancy services from universities and knowledge-intensive service (KIS) firms for the enhancement of said capabilities and to help them attain international organizational management certification (i.e., TS 16949). Government procurement and/or government-initiated projects providing “learning opportunities” for participating firms to enhance said capabilities. Technical and information centers/facilities providing quality and timely services and information necessary for upgrading of said capabilities of firms. For the second group of firms (Type C), the issue is to enable these firms to be xxii more creative and pro-active in exploiting technology for competitive advantage. These firms need to fully develop sets of technological capabilities enabling them to define the international technology frontier (the qualification of Type D firms). The set of policy recommendations is as follows: Tax and financial incentives (e.g. grants, soft loans, equity participation) targeting innovations in product, process, organization and business models. Workshops to demonstrate the positive impact of certain types of internal factors, for example, cross-functional teams, and the advantages of cross-sectoral firms in terms of spillover impacts from business units in other industrial sectors (for example, Malaysian automotive part makers benefited from their earlier businesses in the electronic industry). Government-supported R&D consortium between active and high-potential local firms, and leading universities and/or R&D institutes and, if necessary, transnational corporations, on pre-competitive issues leading to new product developments and/or creation of new businesses. C) Policy to strengthen linkages between internal and external resources From the country studies, it is obvious that external linkages with leading firms, both large assemblers and transnational corporations, are important for firms’ technological upgrading processes. At the same time, universities and R&D institutes played a rather limited role in such processes. To promote linkages between internal and external resources, a set of policy recommendations is as follows: Government financial assistance should be extended for the hiring of external experts from transnational corporations, consultancy firms, and university/public xxiii research institutes to help local firms upgrade. Governments can help by partially funding the salaries of these experts for a limited period at the beginning. Personnel exchange programs between local firms and transnational corporations, and between firms and universities and public research institutes should be encouraged. Tax incentives should be given for training courses and consultancy services provided by transnational corporations, aimed at upgrading said capabilities of local firms from Type A/B to Type C. The regulatory environment and incentive structures (in terms of financial compensation, recognition and career advancement) should be improved to encourage university professors and researchers from public research institutes to work with the industry. Policy Recommendations for ASEAN Plus Six At the level of the ASEAN Plus Six, several joint activities can be carried out, especially in terms of creating common institutional arrangements and policy platforms. A) Policy to stimulate “demand” for the enhancement of technological and innovative capabilities Complementary to the ASEAN Free Trade Area and trade and investment agreements among ASEAN Plus Six, a joint database of parts suppliers in the automotive sector of these countries should be developed. It should be classified according to firm size and specialization. An ASEAN Plus Six automotive assemblers and parts association should be xxiv initiated as a platform for business, information and knowledge exchanges. B) Policy to upgrade the technological and innovative capabilities of firms Joint training programs targeting Type A/B firms to upgrade their capabilities on design and engineering, technology search and acquisition, and project management should be supported. Cross-country consultancy services should be promoted and subsidized, especially taking advantage of industrial experts in more developed countries. Establishment of a cross-country R&D consortium between active and highpotential firms, and leading universities and/or R&D institutes of member countries on pre-competitive issues leading to new product development and/or creation of new businesses. A study on “ASEAN Plus Six Joint Development Fund for Automotive Industry” should be carried out. A form of a cess tax or another kind of financial contribution from member countries might be necessary as sources of a fund to finance aforementioned activities ranging from training, consultancy, expert exchanges and a R&D consortium. Studies on regional foresight on future technologies and the required competencies of the automotive industry in ASEAN Plus Six should be carried out to provide shared visions, goals, and missions among member countries. C) Policy to strengthen linkages between internal and external resources Taking advantage of existing mutual recognition agreements, regional certification and accreditation of specific skills, knowledge and professional standards should be carried out. This will be a very useful basis for exchange programs of crossxxv country experts. A database of ASEAN Plus Six automotive experts, both in the private sector and academia, classified by type of knowledge and skills, should be created and updated annually. Different national immigration procedures for professional experts should be streamlined. Region-wide exchange programs for automotive experts should be initiated. xxvi CHAPTER 1 The Indian Automotive Industry: Enhancing Innovation Capability with External and Internal Resources SUNIL MANI Centre for Development Studies, Trivandrum, Kerala, India India’s automobile market is one of the fastest growing auto markets in the world. It is one of those manufacturing industries which have grown significantly since the liberalization of India’s economy which began in a haphazard fashion way back in the 1980s. The industry is also known for many innovations. The paper undertakes a detailed survey of the differential performance of domestic and MNCs within the industry with respect to innovations. It then analyses the sources of these innovations in terms of internal and external sources. The resulting analysis shows that while the domestic firms have relied on internal sources, the MNCs have relied far more heavily on external sources. The study also contains case studies of seven of the leading domestic firms. 1 1. Introduction India’s automotive industry is one of the successful cases of India’s economic liberalization strategy set into motion since 1991. The industry which was dominated by a few domestic manufacturers was hardly known for any innovations before 1991, but is now one of the fastest growing manufacturing industries not just in India but globally as well. In 2010, India has emerged as the second fastest growing car market in the world next only to China. Sales of two wheelers crossed 10 million units during the year, a first, with all major two-wheeler manufacturers registering high double digit growth. India in 2010 is the largest tractor manufacturer, second largest two-wheeler manufacturer, fifth largest commercial vehicle manufacturer and the eleventh largest car manufacturer in the world. There are many instances of innovations in the industry, the Tata’s Nano car being one of the celebrated examples of these innovation efforts. All told, it is an industry that is truly successful in introducing a range of new products not just in the domestic market but in the international market as well. In the context, the purpose of this study is to understand the internal and external sources of information on innovation to the firms within this industry some of which are domestic while others are affiliates of well-known automotive MNCs. The study is structured into two parts. The first part maps out the insights that may be drawn from the case studies provided in the second part. The second part discusses seven case studies based on eight domestic firms in the Indian automotive industry. The first part, in turn is, structured into four sections. Section 2.1 outlines some basic facts about the industry in terms of the number of and size distribution of firms, the geographic distribution, phases in its historical evolution and recent trends in production and exports of vehicles from India. This is followed by Section 2.2, where we analyze the recent trends in innovative efforts in the industry. Section 2.3 decomposes the sources of information on innovation to internal and external sources. Finally Section 2.4 and concluding section marshals the poly conclusions emanating from the study. 2 2. PART I: The Macro Picture 2.1. Development and Structure of the Industry The auto industry consists of two separate industries: (i) The automobile industry; and (ii) The auto components or parts industry. The automobile industry in turn has three sub sectors: (a) two-wheelers; (b) three-wheelers; and (c) four-wheelers (passenger vehicles and commercial vehicles). Researchers have found it convenient to map out the history of the Indian auto industry from 1947 until now into three phases. See Table 1 for a summary of the three phases: Table 1: Three phases in the evolution of India’s Automotive Industry Phases Phase 1: 1947-1983 Main features Closed market Growth of market limited by domestic supply Very few innovations, outdated model, fuel inefficient Number of firms: 5 Phase 2: 1983-1993 Joint Venture between Government of India and Suzuki to form Maruti Udyog Number of firms: 6 Phase 3: 1993Industry delicensed in 1993 Major MNC Original Equipment Manufacturers (OEMS) commenced assembly in India Implementation of the Value Added Tax (VAT) Imports allowed from April 2001 Number of firms: >35 Source: India Brand Equity Fund (2010). 2.1.1. Trends in Production Production of automobile (in numbers) has doubled itself (Table 2) during the period under consideration. Although the rates of growth of output had plummeted, due essentially to the financial crisis, in 2008-09, it has picked up in all categories the very following year and indications are that this high growth rate will be maintained during 2010-11 as well. There are two important findings. First, is that two wheelers account for the lion’s share of production (in numbers) followed by passenger vehicles (cars). So the driving force behind the spectacular growth of the industry is the output of two-wheelers (motor 3 cycles and scooters) and cars. Second, is that, over time, India has become a base for exports of automobiles. Again most of the exports are accounted for by cars. In fact India has become a base for the manufacture of compact cars. 2.1.2. Trends in Exports Exports too have registered some appreciable increases (Figure 1). Overall about 11 per cent of the total out is exported although the export intensity varies across the various categories ranging from as high as 24 per cent in the case of three-wheelers to as low as 9 per cent in the case of commercial vehicles. Much of the exports, in quantitative terms, is accounted for by cars and motorcycles reflecting their proportinate share in domestic production. What is interesting is that India has now become base for the manufacture and exports of compact cars. 4 1209,876 1309,300 1545,223 1777,583 1838,593 2351,240 2004-05 2005-06 2006-07 2007-08 2008-09 2009-10 27.88 3.43 15.04 18.02 8.22 22.26 Growth Rate (%) 566,608 416,870 549,006 519,982 391,083 353,703 275,040 Commercial Vehicles 35.92 -24.07 5.58 32.96 10.57 28.60 Growth Rate (%) 619,093 497,020 500,660 556,126 434,423 374,445 356,223 Three Wheelers 24.56 -0.73 -9.97 28.01 16.02 5.12 Growth Rate (%) 10,512,889 8,419,792 8,026,681 8,466,666 7,608,697 6,529,829 5,622,741 Two Wheelers 5 Source: Compiled from the website of Society of Indian Automobile Manufacturers (http://www.siamindia.com/). 989,560 2003-04 Passenger Vehicles Table 2: Trends in Production of India’s Automobile Industry (in numbers) 24.86 4.90 -5.20 11.28 16.52 16.13 Growth Rate (%) 14,049,830 11,172,275 10,853,930 11,087,997 9,743,503 8,467,853 7,243,564 Grand Total 25.76 2.93 -2.11 13.80 15.06 16.90 Growth Rate (%) 68144 265052 479919 Three Wheelers Two Wheelers Gra nd Total 629544 366407 66795 29940 166402 2004-05 806222 513169 76881 40600 175572 2005-06 6 Source: Society of Indian Automobile Manufacturers (http://www.siamindia.com/). 17432 Commercia l Vehicles 2003-04 129291 0 200,000 400,000 600,000 800,000 1,000,000 Pa ssenger Vehicles Number of Vehicles 1,200,000 1,400,000 1,600,000 1,800,000 2,000,000 Figure 1: Trends in Exports of Automotive from India, 2004-2010 1011529 619644 143896 49537 198452 2006-07 1238333 819713 141225 58994 218401 2007-08 1530594 1004174 148066 42625 335729 2008-09 1804619 1140184 173282 45007 446146 2009-10 2.1.3. Structure of the Industry Here we focus only on the vehicle producing sector. This consists of two sets of firms, domestic and affiliates of a large number of MNCs. Although the industry was largely domestic for a long time, MNCs entry to the industry started with the joint venture Maruti Suzuki’s plans to build small compact cars. Gradually over time, a number of MNCs have established their manufacturing activities in the country. Maruti itself has diluted its domestic equity held by the union government in favour of a larger shareholding by its parent firm. Over time and especially since 1991, there has been entry to the industry by a large number of MNCs. MNCs are focusing much more on passenger cars and motorcycles, while the domestic firms have their presence across the entire spectrum of vehicles. In terms of total sales the industry is roughly divided between the two the segments although on an average over the last decade or so, the domestic firms have a slightly higher share (Table 3), as the two large commercial vehicle firms are in the domestic sector. Table 3: Sales and Exports of Automobiles: Domestic Vs MNCs (Rs in Crores) Year Exports of Goods (Rs Crores) Domestic MNC Sales (Rs Crores) Domestic MNC Exports of Goods to Sales (%) Domestic MNC Ratio of Domestic to MNC Exports Sales 2000 1,077.46 2,433.72 22,298.37 19,519.52 4.83 12.47 0.44 1.14 2001 1,197.82 2,501.76 21,883.20 20,993.81 5.47 11.92 0.48 1.04 2002 1,001.55 2,157.87 22,122.72 19,789.59 4.53 10.90 0.46 1.12 2003 1,001.57 3,229.19 26,227.74 21,440.01 3.82 15.06 0.31 1.22 2004 1,699.89 2,428.32 34,330.25 30,308.19 4.95 8.01 0.70 1.13 2005 2,535.77 3,512.20 40,455.42 39,256.10 6.27 8.95 0.72 1.03 2006 3,483.47 3,726.40 47,276.37 44,637.80 7.37 8.35 0.93 1.06 2007 4,540.04 4,192.76 61,429.95 53,514.79 7.39 7.83 1.08 1.15 2008 7,426.48 4,891.48 75,810.47 55,992.37 9.80 8.74 1.52 1.35 2009 7,593.78 27,610.06 70,464.44 63,379.07 10.78 43.56 0.28 1.11 2010 7,389.76 17,246.04 89,928.63 55,402.27 8.22 31.13 0.43 1.62 0.67 1.18 Average 6.67 15.17 Source: Compiled from Centre for Monitoring Indian Economy (CMIE) Prowess Dataset. 7 But on the export front, the foreign firms have not only a higher level but also higher export intensity as well (on an average two times). This shows that the MNCs are actually using India as a base for their exports. 2.2. Innovations in the Automotive Industry There have been many instances of new product development in the Indian automotive industry. To name a few: The development of the Nano, the innovative US$2,250 car, has showcased India’s ability to innovate and design; Reva, India’s first electric car, is also an example in this case; Companies like M&M and the Hero Group are planning to develop electric vehicles; In the commercial vehicles space, Tata Daewoo, a subsidiary of Tata Motors, has recently developed an LPG-based MCV (4.5 ton), the Novus, which conforms to Euro V emission norm; Ashok Leyland has developed India’s first six-cylinder CNG engine for buses, which uses the multipoint fuel injection system and conforms to Euro IV emission standards ; and Two-wheeler manufacturers Bajaj Auto, Hero Honda and Mahindra are in discussions with Energtek, a provider of absorbed natural gas products, for technology that will enable two-wheelers to run on natural gas instead of gasoline. 8 The auto industry is one of the largest R&D spenders within India’s industrial establishment closely following the leader in this sphere, namely the pharmaceutical industry (Table 4). Table 4: Relative share of India’s Automotive Industry in Total Private Sector in-house R&D Expenditures (Rs in Crores) In-House R&D Expenditure R&D Intensity Total Private Sector Industry Auto Industry as a Share of Private Sector Industry 0.87 2,177 19.32 2.56 0.73 2,178 19.80 Rate of Growth (%) 1998-99 420.62 1999-00 431.37 2000-01 451.96 4.77 0.77 2,411 18.74 2001-02 528.61 16.96 0.81 2,787 18.96 2002-03 434.27 -17.85 0.77 2,785 15.60 2003-04 546.50 25.84 0.80 3,643 15.00 2004-05 862.80 57.88 0.99 5,076 17.00 2005-06 1,047.20 21.37 1.07 6,268 16.71 Note: Rs 1 crore = Rs 10 million. Source: Department of Science and Technology (2009). Although the industry consists of domestic and MNCs, most of the new product development has come from the domestic companies. In order to examine this further, we analysed the two major costs of developing new technologies: in-house R&D expenditures and cost of purchasing technology from abroad. The source of data for this exercise is the Centre for Monitoring Indian Economy (CMIE) Prowess Dataset. Two indicators are developed: (i) R&D to sales ratio signifying the research intensity of the sector (Table 5); (ii) Ratio of R&D expenditure to cost of purchasing technology from abroad signifying relate importance of domestic technology generating efforts (Table 6). These ratios are presented separately for domestic and MNCs. 9 Table 5: Research Intensity: Domestic vs. Foreign Firms (Values are in Rs Crores) Year R&D Expense (Rs Crores) Domestic MNC Sales (Rs Crores) Domestic R&D to Sales (%) MNC Ratio of Domestic to MNC Domestic MNC R&D Sales 2000 146.83 164.56 22,298.37 19,519.52 0.66 0.84 0.89 1.14 2001 159.31 77.45 21,883.20 20,993.81 0.73 0.37 2.06 1.04 2002 292.18 62.84 22,122.72 19,789.59 1.32 0.32 4.65 1.12 2003 364.79 51.47 26,227.74 21,440.01 1.39 0.24 7.09 1.22 2004 439.92 102.96 34,330.25 30,308.19 1.28 0.34 4.27 1.13 2005 751.54 123.24 40,455.42 39,256.10 1.86 0.31 6.10 1.03 2006 900.35 106.00 47,276.37 44,637.80 1.90 0.24 8.49 1.06 2007 1,301.71 103.39 61,429.95 53,514.79 2.12 0.19 12.59 1.15 2008 1,939.72 120.60 75,810.47 55,992.37 2.56 0.22 16.08 1.35 2009 2,663.34 154.60 70,464.44 63,379.07 3.78 0.24 17.23 1.11 2010 2,401.38 210.87 89,928.63 55,402.27 2.67 0.38 11.39 1.62 1.84 0.34 8.26 1.18 Average Source: Compiled from the Prowess Database. Although the R&D expenditures for both the sets of firms have increased, it is the domestic firms that have registered faster growth rates in the absolute levels of intramural R&D investments, but also in its intensity. In contrast the R&D intensity of MNCs has hardly shown an increase but just inter-year fluctuations. Consequently the main source of technology to the foreign firms is the technical knowhow that they import from their respective parent firms and as such their ratio of in-house R&D to technology purchase from abroad (referred to as the average propensity to adapt) is significantly less than unity in all the years and is also significantly less than that for domestic firms (Table 6). 10 Table 6: Average Propensity to Adapt: Foreign vs. Domestic Firms Year 2000 2001 2002 2003 2004 2005 2006 2007 2008 2009 2010 Average R&D Expenses (Rs Crores) Domestic 146.83 159.31 292.18 364.79 439.92 751.54 900.35 1301.71 1939.72 2663.34 2401.38 MNC 164.56 77.45 62.84 51.47 102.96 123.24 106 103.39 120.6 154.6 210.87 Forex Spending Royalty/Technical Know-How (Rs Crores) Domestic MNC 53.95 164.7 51.66 208.11 63.25 224.68 51.26 330.29 44.69 377.08 114.34 657.86 111.77 879.73 227.03 1134.65 247.89 1258.95 313.61 1554.52 278.75 1488.66 Average Propensity to Adapt, R&D to Tech Know-How (%) Domestic MNC 2.72 1.00 3.08 0.37 4.62 0.28 7.12 0.16 9.84 0.27 6.57 0.19 8.06 0.12 5.73 0.09 7.82 0.10 8.49 0.10 8.61 0.14 6.61 0.26 Source: Compiled from the Prowess Database. 2.3. Source of Innovation: Internal vs. External Factors In other words, while domestic firms have relied much more on internal sources of technology the MNCs have relied more on external sources. We now proceed to elaborate on these internal and external sources. 2.3.1. Internal-In-House R&D Efforts In Tables 4 and 5, it is already seen that the firms and especially the domestic firms have invested rather robustly in in-house R&D. These investments have been increasing over time. India’s auto policy announced in 2002had a number of fiscal incentives for domestic R&D. The main provisions of this policy dealing with R&D in the auto industry are summarized in the following Box. 11 Box 1: Incentives for R&D as Proposed in the Auto Policy of 2002 The Government shall promote Research & Development in automotive industry by strengthening the efforts of industry in this direction by providing suitable fiscal and financial incentives. The current policy allows Weighted Tax Deduction under I.T. Act, 1961 for sponsored research and in-house R&D expenditure. This will be improved further for research and development activities of vehicle and component manufacturers from the current level of 125%. In addition, vehicle manufacturers will also be considered for a rebate on the applicable excise duty for every 1% of the gross turnover of the company expended during the year on Research and Development carried either in-house under a distinct dedicated entity, faculty or division within the company assessed as competent and qualified for the purpose or in any other R&D institution in the country. This would include R&D leading to adoption of low emission technologies and energy saving devices. Government will encourage setting up of independent auto design firms by providing them tax breaks, concessional duty on plant/equipment imports and granting automatic approval. Allocations to automotive cess fund created for R&D of automotive industry shall be increased and the scope of activities covered under it enlarged. Source: Department of Heavy Industry, Ministry of Heavy Industries and Public Enterprises (http://dhi.nic.in/autopolicy.htm, accessed January 27, 2011). This policy was further elaborated in the Indian Auto Mission Plan (AMP). AMP (2006-16) is a ten year vision document launched by Government of India in January, 2007 with the vision to make India emerge as a destination of choice in the world for design and manufacture of automobiles and auto components with output reaching a level of US$145 billion and providing additional employment to 25 million people by 2016. The most critical intervention of the government thus far in the automotive sector has come in the form of an ambitious project on setting up world-class 12 automotive testing and R&D infrastructure in the country in the form of National Automotive Testing and R&D Infrastructure Project (NATRIP). NATRIP1 envisages setting up of world-class automotive testing and homologation facilities in India with a total investment of Rs 17 billion by 2011. The principal facilities will come up in the three automotive hubs of the country, in the south, the north and the west (Figure 2). Figure 2: Geographic Distribution of the NATRIP Centers within the Country Source: India Brand Equity Fund (2010), p. 48. The project aims at (i) creating critically needed automotive testing infrastructure to enable the Government in ushering in global vehicular safety, emission and performance standards, (ii) deepening manufacturing in India, promoting larger value addition leading to significant enhancement of employment potential and facilitating convergence of India’s strengths in IT and electronics with automotive engineering, 1 The source of information on the NATRIP project is based on Department of Heavy Industry (2010). 13 (iii) enhancing India’s considerably low global outreach in this sector by debottlenecking exports; and (iv) removing the crippling absence of basic product testing, validation and development infrastructure for automotive industry. The project envisages setting up of the following facilities: (i) A full-fledged testing and homologation centre within the northern hub of automotive industry at Manesar, Haryana; (ii) A full-fledged testing and homologation centre within the southern hub of automotive industry a location near Chennai, Tamil Nadu; and (iii) Up-gradation of existing testing and homologation facilities at Automotive Research Association of India (ARAI), Pune and at Vehicle Research and Development Establishment (VRDE), Ahmednagar, Maharashtra. The investment of Rs 17 billion is proposed to be funded jointly by the Government and the industry based on the following manner: A. Plan Support by the Government: Rs. 16 billion By way of grant: Rs. 8.17 billion By way of Cess Funds2: Rs. 5.10 billion By way of loan: Rs. 2.73 billion B. User Charges to be Paid by Auto Industry: Rs. 1.18 billion Total Project Cost (A+B): Rs. 17 billion 2.3.2. External Sources Regarding external sources, I could identify at least five sources. These are: (i) Licensing of technologies; (ii) Joint Ventures; (iii) Spillovers from MNCs; (iv) Merger and acquisition deals; and (v) Certification schemes. Of these five, it is the MNCs that have been relying, relatively speaking, more on licensing of technologies and on joint 2 Under the R&D Cess Act of 1986, every company importing technology from abroad has to pay to the government a cess to the tune of 5 per cent of the total payments for technology. The funds thus accumulated are returned to the industry in the form of grants for financing indigenous R&D projects. 14 ventures. The domestic firms, on the contrary, have been using mergers and acquisition as a way of securing state-of-the art technologies. Some of the major acquisitions are listed in Table 7. Further the completion from MNCs has been an important source of technological improvements for the domestic manufacturers. Finally conformity with various international certification schemes have been an important source of information on innovation for the auto parts firms especially. Table 7: Major Acquisitions in the Indian Auto Industry Recent outbound deals primarily driven by acquisition of technological know-how Acquirer Target Company Rationale Amtek Auto UK-based Triplex Ketlon Group for The acquisition will provide Amtek with access US$39.9 million to superior technology and expand its precision machining operations (Nov 2007) Bajaj Auto Increased its stake to 30% in Austria The acquisition will give the company access to based KTM Power Sports KTM’s technology and distribution network across Europe (Feb 2009) Italy-based motor cycle design The acquisition will provide M&M with access developing company, Engines to technological expertise to widen its Engineering, for EUR 8.5 million engineering and design services and an exposure to the international markets (June 2008) Mahindra and Mahindra Tata Motors 50.3% stake in Norway-based Miljo The acquisition is in line with the company’s Grenland for INR 94 million strategy of developing convenient, affordable and sustainable mobility solutions through electric and hybrid vehicles (Oct 2008) Source: Ernst and Young (2010), p. 24. 2.4. Conclusions The Indian automotive industry has now emerged as one of the most innovative industries in India. There are many instances of new product development not just in the auto industry but also in the auto parts industry. The sales of the industry are almost equally divided between the domestic and foreign firms. Our analysis of the innovative behavior of the industry showed that it is the domestic firms that have been more innovative and the main route they have adopted for improving their respective 15 innovative activities can be divided into internal and external sources. Of the internal sources, the most important one is investments in R&D. These investments have registered some sharp increases during the period under consideration. Government too has encouraged this by offering a number of fiscal incentives. 3. Part II: Case Studies 3.1. Case Study 1: Ashok Leyland 3.1.1. Brief History In 1948, Ashok Motors was set up in what was then Madras (now known as Chennai), for the assembly of Austin Cars. The Company’s name changed soon with equity participation by British Leyland and Ashok Leyland commenced manufacture of commercial vehicles in 1955. Since then Ashok Leyland has been a major presence in India’s commercial vehicle industry with a tradition of technological leadership, achieved through tie-ups with international technology leaders and through systematic investments in-house R&D. Its ownership underwent a major change in 1987 when the overseas holding by Land Rover Leyland International Holdings Limited (LRLIH) was taken over by a joint venture between the Hinduja Group, the Non-Resident Indian transnational group and IVECO. Since July 2006, the Hinduja Group is 100% holder of LRLIH. In the initial period, access to international technology enabled the firm to set a tradition to be first with a number of innovations whether it is full air brakes, power steering or rear engine busses, the firm was the first one to introduce these in the Indian market. Responding to the operating conditions and practices in the country, the Company made its vehicles well designed often enough over-engineering them. 16 “Designing durable products that make economic sense to the consumer, using appropriate technology,” became the design philosophy of the Company. Hitherto the company has manufactured and sold over 500,000 commercial vehicles. The company has a very high share of the buses owned and operated by State Transport Undertakings. Ashok Leyland reached a major milestone in 1993 when it became the first in India’s automobile history to win the ISO 9002 certification. The more comprehensive ISO 9001 certification came in 1994, QS 9000 in 1998 and ISO 14001 certification for all vehicle manufacturing units in 2002. It has also become the first Indian auto company to receive the latest ISO/TS 16949 Corporate Certification (in July 2006) which is specific to the auto industry. The product mix of the company includes: Trucks, Busses and Light Commercial Vehicles, Defence and Special Vehicles and Engines. Table 8: Domestic Production, Sales and Exports (Values are in Rs Cores) Year Mar-00 Mar-01 Mar-02 Mar-03 Mar-04 Mar-05 Mar-06 Mar-07 Mar-08 Mar-09 Mar-10 Average Sales Exports 2,691.68 2,684.50 2,712.00 3,140.02 3,995.34 4,908.03 6,200.54 8,513.93 9,192.27 6,826.96 8,071.75 151.18 163.12 159.13 203.42 294.16 522.88 451.31 629.22 756.05 863.08 604.11 Source: Compiled from CMIE Prowess Dataset. 17 Export Intensity (%) 5.62 6.08 5.87 6.48 7.36 10.65 7.28 7.39 8.22 12.64 7.48 7.73 3.1.2. Sources of Technology to the Firm The firm has essentially used two sources of external technology. Embodied technology, through the importation of capital goods and disembodied through licensing agreements with a number of MNCs such as those with: Nissan Motor Company; John Deere & Company; Automotive Infotronics; and Ashley Alteams. The relative importance of these two is given below. Table 9: Embodied vs. Disembodied External Sources of Technology (Values are in Rs Cores) Year Embodied Technology Imports Disembodied Technology Imports Total Technology Import Sales Import Intensity Ratio of Embodied to Disembodied Mar-00 6.29 2.53 8.82 2691.68 0.33 2.49 Mar-01 28.12 2.92 31.04 2684.5 1.16 9.63 Mar-02 21.6 1.66 23.26 2712 0.86 13.01 Mar-03 23.5 6.27 29.77 3140.02 0.95 3.75 Mar-04 14.94 4.94 19.88 3995.34 0.50 3.02 Mar-05 42.69 19.47 62.16 4908.03 1.27 2.19 Mar-06 71.87 10.54 82.41 6200.54 1.33 6.82 Mar-07 243.52 27.37 270.89 8513.93 3.18 8.9 Mar-08 136.17 41.14 177.31 9192.27 1.93 3.31 Mar-09 293.82 123.73 417.55 6826.96 6.12 2.37 Mar-10 271.15 44.02 315.17 8071.75 3.90 6.16 1.96 5.60 Average Source: Compiled from CMIE Prowess Dataset. 18 Table 10: Internal Source of Technology (Values are in RS Cores) Year Mar-00 Mar-01 Mar-02 Mar-03 Mar-04 Mar-05 Mar-06 Mar-07 Mar-08 Mar-09 Mar-10 Average R&D Expense 0 23.12 25.27 30.60 48.84 92.38 104.95 156.40 202.32 265.39 234.08 Research Intensity Sales 2,691.68 2,684.50 2,712.00 3,140.02 3,995.34 4,908.03 6,200.54 8,513.93 9,192.27 6,826.96 8,071.75 0.86 0.93 0.97 1.22 1.88 1.69 1.84 2.20 3.89 2.90 1.84 Import Intensity 0.33 1.16 0.86 0.95 0.50 1.27 1.33 3.18 1.93 6.12 3.90 1.96 Average Propensity to Adapt 7.92 15.22 4.88 9.89 4.74 9.96 5.71 4.92 2.14 5.32 7.07 Source: Compiled from CMIE Prowess Dataset. 3.2. Case Study 2: Tata Motors 3.2.1. Brief History Tata Motors Limited is India’s largest automobile company, with consolidated revenues of Rs. 92,519 crores (US$20 billion) in 2009-10. It is the leader in commercial vehicles in each segment, and among the top three in passenger vehicles with winning products in the compact, midsize car and utility vehicle segments. The company is the world’s fourth largest truck manufacturer, and the world’s second largest bus manufacturer. The company’s 24,000 employees are guided by the vision to be “best in the manner in which we operate, best in the products we deliver, and best in our value system and ethics.” Established in 1945, Tata Motors’ presence indeed cuts across the length and breadth of India. Over 5.9 million Tata vehicles ply on Indian roads, since the first rolled out in 1954. The company’s manufacturing base in India is spread across 19 Jamshedpur (Jharkhand), Pune (Maharashtra), Lucknow (Uttar Pradesh), Pantnagar (Uttarakhand) and Dharwad (Karnataka). Following a strategic alliance with Fiat in 2005, it has set up an industrial joint venture with Fiat Group Automobiles at Ranjangaon (Maharashtra) to produce both Fiat and Tata cars and Fiat powertrains. The company is establishing a new plant at Sanand (Gujarat). The company’s dealership, sales, services and spare parts network comprises over 3,500 touch points; Tata Motors also distributes and markets Fiat branded cars in India. Tata Motors, the first company from India’s engineering sector to be listed in the New York Stock Exchange (September 2004), has also emerged as an international automobile company. Through subsidiaries and associate companies, Tata Motors has operations in the UK, South Korea, Thailand and Spain. Among them is Jaguar Land Rover, a business comprising the two iconic British brands that was acquired in 2008. In 2004, it acquired the Daewoo Commercial Vehicles Company, South Korea’s second largest truck maker. The rechristened Tata Daewoo Commercial Vehicles Company has launched several new products in the Korean market, while also exporting these products to several international markets. Today two-thirds of heavy commercial vehicle exports out of South Korea are from Tata Daewoo. In 2005, Tata Motors acquired a 21% stake in Hispano Carrocera, a reputed Spanish bus and coach manufacturer, and subsequently the remaining stake in 2009. Hispano’s presence is being expanded in other markets. In 2006, Tata Motors formed a joint venture with the Brazil-based Marcopolo, a global leader in body-building for buses and coaches to manufacture fully-built buses and coaches for India and select international markets. In 2006, Tata Motors entered into joint venture with Thonburi Automotive Assembly Plant Company of Thailand to manufacture and market the company’s pickup vehicles 20 in Thailand. The new plant of Tata Motors (Thailand) has begun production of the Xenon pickup truck, with the Xenon having been launched in Thailand in 2008. Tata Motors is also expanding its international footprint, established through exports since 1961. The company’s commercial and passenger vehicles are already being marketed in several countries in Europe, Africa, the Middle East, South East Asia, South Asia and South America. It has franchisee/joint venture assembly operations in Kenya, Bangladesh, Ukraine, Russia, Senegal and South Africa. The foundation of the company’s growth over the last 50 years is a deep understanding of economic stimuli and customer needs, and the ability to translate them into customer-desired offerings through leading edge R&D. With over 3,000 engineers and scientists, the company’s Engineering Research Centre, established in 1966, has enabled pioneering technologies and products. The company today has R&D centres in Pune, Jamshedpur, Lucknow, Dharwad in India, and in South Korea, Spain, and the UK. It was Tata Motors, which developed the first indigenously developed Light Commercial Vehicle, India’s first Sports Utility Vehicle and, in 1998, the Tata Indica, India’s first fully indigenous passenger car. Within two years of launch, Tata Indica became India’s largest selling car in its segment. In 2005, Tata Motors created a new segment by launching the Tata Ace, India’s first indigenously developed mini-truck. In January 2008, Tata Motors unveiled its People’s Car, the Tata Nano, which India and the world have been looking forward to. The Tata Nano has been subsequently launched, as planned, in India in March 2009. A development, which signifies a first for the global automobile industry, the Nano brings the comfort and safety of a car within the reach of thousands of families. The standard version has 21 been priced at Rs.100,000 (excluding VAT and transportation cost). However as the figure shows, the sales of Nano cars after reaching a maximum sales of 9,000 cars in July 2010 has since been plummeting down to just 500 cars or so in November, 2010. Several reasons have been advanced for this lackluster performance of the Nano, lack of proper advertisements being one such factor. See also Box. Of late Tata’s have started a serious advertisement campaign to regain lost numbers. Box 2: Plummeting Sales of Nano: Possible Reasons “One reason is that the new car is tricky to find: it is being marketed only in a few parts of India, as Tata struggles to get a new factory up to speed, which in time should churn out 100,000 cars a year. More troubling, dealers report a lack of demand. Some drivers have been put off by price rises: including tax, it is now more like a one-and-ahalf-lakh car. Others were deterred by a few early cases of Nanos billowing smoke and flames: Tata is offering to fix this with a free “upgrade.” It is also said to be easier to find spares for already ubiquitous Suzukis.” Source: Economist (http://www.economist.com/node/17465427?story_id=17465427) (accessed February 14, 2011) In May 2009, Tata Motors introduced ushered in a new era in the Indian automobile industry, in keeping with its pioneering tradition, by unveiling its new range of world standard trucks called Prima. In their power, speed, carrying capacity, operating economy and trims, they will introduce new benchmarks in India and match the best in the world in performance at a lower life-cycle cost. Tata Motors is equally focused on environment-friendly technologies in emissions and alternative fuels. It has developed electric and hybrid vehicles both for personal and public transportation. It has also been implementing several 22 environment-friendly technologies in manufacturing processes, significantly enhancing resource conservation. Figure 3: Number of Nano Cars Sold Source: Press Reports. Through its subsidiaries, the company is engaged in engineering and automotive solutions, construction equipment manufacturing, automotive vehicle components manufacturing and supply chain activities, machine tools and factory automation solutions, high-precision tooling and plastic and electronic components for automotive and computer applications, and automotive retailing and service operations. Tata Motors is committed to improving the quality of life of communities by working on four thrust areas – employability, education, health and environment. The activities touch the lives of more than a million citizens. The company’s support on education and employability is focused on youth and women. They range from schools to technical education institutes to actual facilitation of income generation. In health, our intervention is in both preventive and curative health care. The goal of 23 environment protection is achieved through tree plantation, conserving water and creating new water bodies and, last but not the least, by introducing appropriate technologies in our vehicles and operations for constantly enhancing environment care. The Product Mix of the company includes: Passenger cars, Utility Vehicles, Trucks, Commercial passenger carriers, Defence vehicles. Table 11: Domestic Production, Sales and Exports (Values are in Rs Crores) Year Sales Mar-00 Mar-01 Mar-02 Mar-03 Mar-04 Mar-05 Mar-06 Mar-07 Mar-08 Mar-09 Mar-10 Average 8,616.21 7,912.36 8,641.81 10,607.73 15,208.74 20,217.42 23,439.41 31,000.71 32,434.78 28,513.28 NA Exports Export Intensity (%) 609.03 722.75 620.21 476.43 1,006.32 1,452.69 2,196.69 2,687.30 2,754.05 2,206.43 1,921.48 7.07 9.13 7.18 4.49 6.62 7.19 9.37 8.67 8.49 7.74 7.59 Source: Compiled from CMIE Prowess Dataset. 3.2.2. Sources of Technology to the Firm The firm has essentially used two sources of external technology. Embodied technology, through the importation of capital goods and disembodied through licensing agreements with a number of MNCs such as those with: Jaguar Land Rover; Telco Construction Equipment Co. Ltd. (Telcon); Tata Daewoo Commercial Vehicle Company Ltd (TDCV); Tata Hispano Motors Carrocera S. A.; Tata Motors European Technical Centre plc. (TMETC); Tata Motors (Thailand) Limited (TMTL); Tata Marcopolo Motors Ltd (TMML); Tata Motors(SA) Proprietary Ltd (TMSA); and TML Holdings Pte. Ltd. 24 Table 12: Embodied vs. Disembodied External Sources of Technology (Values are in Rs Crores) Year Mar-00 Mar-01 Mar-02 Mar-03 Mar-04 Mar-05 Mar-06 Mar-07 Mar-08 Mar-09 Mar-10 Average Embodied Technology Imports 161.73 7.91 25.19 69.17 43.22 226.84 264.88 472.76 1,314.31 861.55 374.16 Disembodied Technology Imports 9.73 9.15 16.68 29.9 16.77 76.89 91.56 188.88 172.21 160.6 217.59 Total Technology Import 171.46 17.06 41.87 99.07 59.99 303.73 356.44 661.64 1,486.52 1,022.15 591.75 Sales Import Intensity 8,616.21 7,912.36 8,641.81 10,607.73 15,208.74 20,217.42 23,439.41 31,000.71 32,434.78 28,513.28 1.99 0.22 0.48 0.93 0.39 1.50 1.52 2.13 4.58 3.58 1.73 Ratio of Embodied to Disembodied 16.62 0.86 1.51 2.31 2.58 2.95 2.89 2.50 7.63 5.36 1.72 4.27 Source: Compiled from Prowess Dataset. Table 13: Internal Source of Technology (Values are in Rs Crores) Year Mar-00 Mar-01 Mar-02 Mar-03 Mar-04 Mar-05 Mar-06 Mar-07 Mar-08 Mar-09 Mar-10 Average R&D Expense 106.73 90.45 92.37 143 151.88 393.34 476.12 796.86 1,195.97 1,476.61 1,170.97 Sales 8,616.21 7,912.36 8,641.81 10,607.73 15,208.74 20,217.42 23,439.41 31,000.71 32,434.78 28,513.28 Research Intensity 1.24 1.14 1.07 1.35 1.00 1.95 2.03 2.57 3.69 5.18 2.12 Average Propensity to Adapt 10.97 9.89 5.54 4.78 9.06 5.12 5.20 4.22 6.94 9.19 5.38 6.94 Source: Compiled from Prowess Dataset. 3.3. Case Study 3: Force Motors 3.3.1. Brief History Late Shri N.K.Firodia, a dedicated Gandhian was the Founder-Managing Director of Force Motors. Having participated in the freedom struggle for India in 1932 and 1942 he was determined to achieve industrial modernization for India. He established, starting in 1950, in collaboration with Vidal & Sohn, Hamburg, Germany the import 25 and later progressive manufacture in India of the Tempo 3-Wheeler. On 15th August 1957, the 10th anniversary of Indian independence, Mr. N.K.Firodia signed a collaboration with Vidal & Sohn Tempo Werke GmbH for phased manufacturing of TEMPO 3-wheeler and manufacturing was started in a small plant at Goregaon, Bombay. The initial licensed capacity granted by the government was 1000 vehicles per year and 80 vehicles per month. The production was transferred to Pune by the end of 1964. Ambitious plans for producing Light Commercial Vehicles for the growing industrial economy of India were drawn up. The manufacture of TEMPO VIKING 4-Wheeled Trucks & Vans commenced in November 1964. The licensed capacity was increased to 6000 vehicles per year. The VIKING vehicle subsequently was upgraded with a diesel engine and the MATADOR was born. The production of Matador commenced in 1969. In 1975, the manufacturing capacity of the company was increased to 12,000 vehicles per year, in addition to 6,000 diesel engines for other purposes. The collaborator company in Germany, in the wave of mergers during the 70s merged eventually with Daimler-Benz. In July 1982, the company in a new collaboration - with the then Daimler Benz - produced the Mercedes Benz OM 616 engine under license for fitting on its line of vehicles. The TRAX Vehicle, specifically designed for the rough roads of rural India was developed by the Company’s R&D department, to cater to the growing mechanization of passenger transport in rural India. To further modernize its LCV product range, the Company took up the production of the TRAVELLER, under license from Daimler-Benz. A new plant was set up in 1987, on a greenfield site in Central India at Pithampur in Madhya Pradesh. This 26 modern facility was developed in close co-operation with Daimler-Benz. The plant is equipped with a modern conveyorized body welding and Electrophoretic dip painting shop. The Plant has been expanded to house a new Press Shop in 1997. The product mix of the company includes: Traveller, Trumph, Trax, Tractor. Table 14: Domestic Production, Sales and Exports (Values are in Rs Crores) Year Sales Exports Export Intensity (%) Mar-00 Mar-01 Mar-02 Mar-03 Mar-04 Mar-05 Mar-06 Mar-07 Mar-08 Mar-09 Mar-10 Average 678.83 615.11 630.73 826.6 1,111.73 999.96 1,087.13 1,143.84 1,092.70 890.72 NA 8.36 4.69 4.24 12.33 11.70 10.96 16.12 28.56 38.59 30.08 26.96 1.23 0.76 0.67 1.49 1.05 1.10 1.48 2.50 3.53 3.38 1.72 Source: Compiled from CMIE Prowess Dataset. 3.3.2. Sources of Technology to the Firm The firm has essentially used two sources of external technology. Embodied technology, through the importation of capital goods and disembodied through licensing agreements with a number of MNCs such as those with leading global automotive names like Daimler, ZF, Ricardo, Bosch and MAN and through these associations developed necessary expertise in house for design / development / manufacture of automobiles, sub - systems, components and aggregates. 27 Table 15: Embodied vs. Disembodied External Sources of Technology (Values are in Rs Crores) Year Mar-00 Mar-01 Mar-02 Mar-03 Mar-04 Mar-05 Mar-06 Mar-07 Mar-08 Mar-09 Mar-10 Average Embodied Technology Imports Disembodied Technology Imports Total Technology Import 8.58 0.27 9.76 1.16 3.84 4.14 39.91 26.53 3.74 0.02 0.31 0.01 0.01 8.59 1.92 11.16 12.89 7.52 0 1.61 0 0 8.59 0.28 18.35 3.08 15 17.03 47.43 26.53 5.35 0.02 0.31 Import Intensity Sales 678.83 615.11 630.73 826.60 1,111.73 999.96 1,087.13 1,143.84 1,092.70 890.72 NA Ratio of Embodied to Disembodied 1.27 0.05 2.91 0.37 1.35 1.70 4.36 2.32 0.49 0.00 858 27 1.14 0.60 0.34 0.32 5.31 1.48 111.88 2.32 Source: Compiled from CMIE Prowess Dataset. Table 16: Internal Source of Technology (Values are in Rs Crores) Year Mar-00 Mar-01 Mar-02 Mar-03 Mar-04 Mar-05 Mar-06 Mar-07 Mar-08 Mar-09 Mar-10 Average R&D Expense 6.88 0 13.78 18.81 25.77 27.97 56.49 40.10 28.43 22.10 30.12 Sales Research Intensity 678.83 615.11 630.73 826.60 1,111.73 999.96 1,087.13 1,143.84 1,092.70 890.72 NA 1.01 0.00 2.18 2.28 2.32 2.80 5.20 3.51 2.60 2.48 2.44 Average Propensity to Adapt 688 0 1.60 9.80 2.31 2.17 7.51 17.66 91.13 Source: Compiled from CMIE Prowess Dataset. 3.4. Case Study 4: Bajaj Auto 3.4.1. Brief History The Bajaj is amongst the top 10 business houses in India. Its footprint stretches over a wide range of industries, spanning automobiles (two-wheelers and threewheelers), home appliances, lighting, iron and steel, insurance, travel and finance. 28 Bajaj Auto is ranked as the world’s fourth largest two- and three- wheeler manufacturer and the Bajaj brand is well-known across several countries in Latin America, Africa, Middle East, South and South East Asia. Founded in 1926, at the height of India’s movement for independence from the British, the company has an illustrious history. The present Chairman of the group, Rahul Bajaj, took charge of the business in 1965. Under his leadership, the turnover of the Bajaj Auto the flagship company has gone up from Rs. 72 million to Rs. 120 billion, its product portfolio has expanded and the brand has found a global market. The Product Mix of the Company includes: Two wheelers, Goods Carriers (Three wheeler), Passenger Carriers (Three wheeler). Table 17: Domestic Production, Sales and Exports (Values are in Rs Crores) Year Mar-00 Mar-01 Mar-02 Mar-03 Mar-04 Mar-05 Mar-06 Mar-07 Mar-08 Mar-09 Mar-10 Average Sales NA NA NA NA NA NA NA NA 9803.39 9590.25 1,2399.92 Exports NA NA NA NA NA NA NA NA 2,047.81 2,640.40 3,245.82 Export Intensity (%) NA NA NA NA NA NA NA NA 20.89 27.53 26.18 24.87 Source: Compiled from CMIE Prowess Dataset. 3.4.2. Sources of Technology to the Firm The firm has essentially used two sources of external technology. Embodied technology, through the importation of capital goods and disembodied through licensing agreements with a number of MNCs such as those with Kawasaki. 29 Table 18: Embodied vs. Disembodied External Sources of Technology (Values are in Rs Crores) Year Mar-00 Mar-01 Mar-02 Mar-03 Mar-04 Mar-05 Mar-06 Mar-07 Mar-08 Mar-09 Mar-10 Average Embodied Technology Imports Disembodied Technology Imports Total Technology Import NA NA NA NA NA NA NA NA 49.28 300.67 32.11 NA NA NA NA NA NA NA NA 15.14 11.27 10.56 NA NA NA NA NA NA NA NA 64.42 311.94 42.67 Import Intensity Sales NA NA NA NA NA NA NA NA 9803.39 9590.25 1,2399.92 NA NA NA NA NA NA NA NA 0.66 3.25 0.34 1.42 Ratio of Embodied to Disembodied NA NA NA NA NA NA NA NA 3.25 26.68 3.04 10.99 Source: Compiled from CMIE Prowess Dataset. Table 19: Internal Source of Technology (Values are in Rs Crores) Year R&D Expense Sales Research Intensity Mar-00 Mar-01 Mar-02 Mar-03 Mar-04 Mar-05 Mar-06 Mar-07 Mar-08 Mar-09 Mar-10 Average NA NA NA NA NA NA NA NA 118.74 114.87 134.76 NA NA NA NA NA NA NA NA 9803.39 9590.25 12399.92 NA NA NA NA NA NA NA NA 1.21 1.20 1.09 Average Propensity to Adapt NA NA NA NA NA NA NA NA 7.84 10.19 12.76 10.27 Source: Compiled from CMIE Prowess Dataset. Bajaj is present in over 50 countries all over the globe. The firm has dominant presences in Africa, Latin America and South Asia with increasing market share every year. Bajaj is a market leader in motorcycles in Colombia, Central America, Sri Lanka, Bangladesh, Philippines, Nigeria, Uganda and Kenya. 30 3.5. Case Study 5: Mahindra and Mahindra 3.5.1. Brief History Founded in 1945 as a steel trading company, Mahindra entered automotive manufacturing in 1947 to bring the iconic Willys Jeep onto Indian roads. Over the years, the company has diversified into many new businesses. It is now a US$7.1 billion multinational group with more than 112,000 employees in 79 countries across the globe. At present the company’s portfolio comprises a wide spectrum of vehicles from two wheelers to heavy trucks, SUVs to schoolbuses. The Product Mix of the Company includes: Aftermarket, Automotive & Farm Equipment, Defense Systems, Financial Services, Hospitality, Information Technology, Real Estate & Infrastructure, Systech, Two Wheelers and Mahindra Partners. Table 20: Domestic Production, Sales and Exports (Values in Rs Crores) Year Mar-00 Mar-01 Mar-02 Mar-03 Mar-04 Mar-05 Mar-06 Mar-07 Mar-08 Mar-09 Mar-10 Average Sales 4,320.79 4,277.87 3,936.05 4,499.71 5,888.84 7,654.77 9,362.26 11,651.16 13,552.47 15,186.15 20,323.63 Exports 74.13 92.22 114.72 203.05 217.46 312.42 465.10 614.96 795.38 639.13 736.68 Export Intensity (%) 1.72 2.16 2.91 4.51 3.69 4.08 4.97 5.28 5.87 4.21 3.62 3.91 Source: Compiled from CMIE Prowess Dataset 3.5.2. Sources of Technology to the Firm The firm has essentially used two sources of external technology. Embodied technology, through the importation of capital goods and disembodied through 31 licensing agreements with a number of MNCs such as those with Kawasaki. From our founding in 1945, we’ve been connected internationally by business partnerships, a multinational workforce, and the boundless ambition to integrate ourselves with global communities and bring opportunity to customers across the world. Table 21: Embodied vs. Disembodied External Sources of Technology (Values are in Rs Crores) Year Mar-00 Mar-01 Mar-02 Mar-03 Mar-04 Mar-05 Mar-06 Mar-07 Mar-08 Mar-09 Mar-10 Average Embodied Technology Imports Disembodied Technology Imports 74.67 79.67 27.06 24.96 3.11 42.06 29.07 82.72 144.88 84.49 246.72 Total Technology Import 0.81 0.42 0.56 0.98 0.18 0.13 0.01 0.07 0.06 0.73 5.27 75.48 80.09 27.62 25.94 3.29 42.19 29.08 82.79 144.94 85.22 251.99 Sales Import Intensity Ratio of Embodied to Disembodied 1.75 1.87 0.70 0.58 0.06 0.55 0.31 0.71 1.07 0.56 1.24 0.85 92.19 189.69 48.32 25.47 17.28 323.54 2,907.00 1,181.71 2,414.67 115.74 46.82 669.31 4,320.79 4,277.87 3,936.05 4,499.71 5,888.84 7,654.77 9,362.26 11,651.16 13,552.47 15,186.15 20,323.63 Source: Compiled from CMIE Prowess Dataset. Table 22: Internal Source of Technology (Values are in Rs Crores) Year Mar-00 Mar-01 Mar-02 Mar-03 Mar-04 Mar-05 Mar-06 Mar-07 Mar-08 Mar-09 Mar-10 Average R&D Expense 0 0 68.96 74.4 86.76 110.58 139.64 166.85 248.3 594.43 678.72 Sales 4,320.79 4,277.87 3,936.05 4,499.71 5,888.84 7,654.77 9,362.26 11,651.16 13,552.47 15,186.15 20,323.63 Source: Compiled from CMIE Prowess Dataset. 32 Research Intensity 0 0 1.75 1.65 1.47 1.44 1.49 1.43 1.83 3.91 3.34 1.67 Average Propensity to Adapt 0 0 123.14 75.92 482.00 850.62 13,964.00 2,383.57 4,138.33 814.29 128.79 2,087.33 3.6. Case Study 6: TVS Motors TVS Motor Company (TMC) is the third largest two-wheeler manufacturer in India and one among the top ten in the world, with annual turnover of more than US$1 billion in 2008-2009, and is the flagship company of the US$4 billion TVS Group. TVS Motor currently manufactures a wide range of two-wheelers from mopeds to racing inspired motorcycles. Motorcycles(Apache RTR 180, Flame DS 125, Flame, TVS Jive, StaR City, Sports)Variomatic Scooters(TVS Wego, Scooty Streak, Scooty Pep+, Scooty Teenz) Mopeds(TVS XL Super, TVS XL Heavy Duty). The company has 4 plants - located at Hosur and Mysore in South India, in Himachal Pradesh, North India and one at Indonesia. The company has a production capacity of 2.5 million units a year. TMCs strength lies in design and development of new products - the latest launch of 7 products on the same day seen as a first in automotive history. TMC has combined both internal external sources of technology. Some of the major technological milestones achieved by the company are summarized in Table 23. The Product mix of the company includes: Two Wheeler and Three Wheeler. Table 23: Major Technological Milestones Achieved by TVS Motors 1980 Launched TVS 50, India’s first 2 seater 50 cc moped 1984 First Indian company to introduce 100 cc Indo - Japanese motorcycles 1994 Launched India’s First indigenous scooterette (sub - 100 cc variomatic) - TVS Scooty 1996 Introduced India’s first catalytic converter enabled motorcycle, the 110 cc Shogun 1997 Introduced India’s first 5 speed motorcycle, Shaolin 2000 Launched India’s first 150 cc, 4 stroke motorcycle - The Fiero 2001 Launched India’s first fully indigenously designed and manufactured motorcycle. 2004 Launched the revolutionary VT-I engine for the best in class mileage in TVS Centra 2006 Launched TVS Apache - first bike to win 6 awards in a row 2007 Apache RTR - first two wheeler in India to have racing inspired engine and features. 2008 TVS Flame, TVS Scooty Electric Vehicle and Three wheeler TVS King launched. 2009 TVS Apache RTR 180 and TVS Streak launched. Source: TVS Motor Company. 33 Table 24: Domestic Production, Sales and Exports (Values are in Rs Crores) Year Sales Mar-00 Mar-01 Mar-02 Mar-03 Mar-04 Mar-05 Mar-06 Mar-07 Mar-08 Mar-09 Mar-10 Average Exports 1,541.77 1,820.98 2,213.59 3,111.28 3,260.01 3,321.25 3,731.75 4,472.01 3,683.53 4,008.91 NA Export Intensity (%) 16.07 15.56 16.75 24.43 68.24 120.32 176.66 250.29 308.14 499.03 517.18 1.04 0.85 0.76 0.79 2.09 3.62 4.73 5.60 8.37 12.45 4.03 Source: Compiled from CMIE Prowess Dataset. Table 25: Embodied vs. Disembodied External Sources of Technology (Values are in Rs Crores) Year Mar-00 Mar-01 Mar-02 Mar-03 Mar-04 Mar-05 Mar-06 Mar-07 Mar-08 Mar-09 Mar-10 Average Embodied Technology Imports Disembodied Technology Imports Total Technology Import 31.84 10.06 21.33 71.32 51.25 60.51 17.99 42.67 14.19 3.17 8.13 18.7 17.24 15.76 2.88 0 0 0 0 0 0 0 50.54 27.3 37.09 74.2 51.25 60.51 17.99 42.67 14.19 3.17 8.13 Source: Compiled from CMIE Prowess Dataset. 34 Ratio of Embodied to Disembodied Sales Import Intensity 1,541.77 1,820.98 2,213.59 3,111.28 3,260.01 3,321.25 3,731.75 4,472.01 3,683.53 4,008.91 3.28 1.50 1.68 2.38 1.57 1.82 0.48 0.95 0.39 0.08 1.70 0.58 1.35 24.76 1.41 7.10 Table 26: Internal source of technology (Values are in Rs Crores) Year R&D Expense Mar-00 Mar-01 Mar-02 Mar-03 Mar-04 Mar-05 Mar-06 Mar-07 Mar-08 Mar-09 Mar-10 Average 15.01 16.13 29.88 58.65 75.63 71.74 67.69 85.03 70.35 77.71 83.55 Sales Research Intensity 1,541.77 1,820.98 2,213.59 3,111.28 3,260.01 3,321.25 3,731.75 4,472.01 3,683.53 4,008.91 NA Average Propensity to Adapt 0.97 0.89 1.35 1.89 2.32 2.16 1.81 1.90 1.91 1.94 0.80 0.94 1.90 20.36 1.71 6.00 Source: Compiled from CMIE Prowess Dataset. 3.7. Case study 7: Asia Motor Works Asia Motor Works is a manufacturer of off-the-road vehicles. It was established in 2005 and has its plant at Bhuj in the north western state of Gujarat. The company has a number of foreign collaborations. The Product mix of the company includes: Tippers, Tractors, Fully Built Vehicles, Haulage, Concrete Pumps and Transit Mixers. Table 27: Domestic Production, Sales and Exports (Values are in Rs Crores) Year Mar-00 Mar-01 Mar-02 Mar-03 Mar-04 Mar-05 Mar-06 Mar-07 Mar-08 Mar-09 Mar-10 Average Sales NA NA NA NA NA NA 5.82 117.6 615.92 765.69 NA Source: Compiled from CMIE Prowess Dataset. 35 Exports Export Intensity (%) NA NA NA NA NA NA NA NA NA NA NA NA NA NA NA NA NA NA NA NA NA NA NA Table 28: Embodied vs. Disembodied External Sources of Technology (Values in Rs Crores) Year Embodied Technology Imports Disembodied Technology Imports Total Technology Import Sales Import Intensity Ratio of Embodied to Disembodied Mar-00 NA NA NA NA NA NA Mar-01 NA NA NA NA NA NA Mar-02 NA NA NA NA NA NA Mar-03 NA NA NA NA NA NA Mar-04 NA NA NA NA NA NA Mar-05 NA NA NA NA NA NA Mar-06 NA NA NA 5.82 NA NA Mar-07 NA NA NA 117.60 NA NA Mar-08 NA NA NA 615.92 NA NA Mar-09 NA NA NA 765.69 NA NA Mar-10 NA NA NA NA NA NA NA NA Average Source: Compiled from CMIE Prowess Dataset. Table 29: Internal Source of Technology (Values are in Rs Crores) Year R&D Expense Sales Research Intensity Average propensity to adapt Mar-00 NA NA NA NA Mar-01 NA NA NA NA Mar-02 NA NA NA NA Mar-03 NA NA NA NA Mar-04 NA NA NA NA Mar-05 NA NA NA NA 5.82 0 NA Mar-06 0 Mar-07 0.14 117.6 0.12 NA Mar-08 0 615.92 0 NA Mar-09 7.87 765.69 1.03 NA Mar-10 NA NA NA Average 0.29 Source: Compiled from CMIE Prowess Dataset. 36 NA NA REFERENCES Department of Heavy Industry (2010) Annual Report 2009-10, Ministry of Heavy Industries and Public Enterprises, New Delhi: Government of India. Ernst and Young (2010) “Revving Up! Indian Automotive Industry - A Perspective,” http://www.ibef.org/artdisplay.aspx?cat_id=137&art_id=24063, (Accessed on January 30 2011). India Brand Equity Fund (2010) Automotives- A Presentation, http://www.ibef.org/download/Automotives_270111.pdf (Accessed March 8, 2011). 37 APPENDIX Table A1: List of Automobile Firms in India Company Name Andhra Pradesh Scooters Ltd. Ashok Leyland Ltd. Asia Motor Works Ltd. Atul Auto Ltd. Bajaj Auto Ltd. Defence Land Systems India Pvt. Ltd. Eicher Motors Ltd. Electromags Automotive Products Pvt. Ltd. Force Motors Ltd. Gujarat Narmada Auto Ltd. Hindustan Motors Ltd. International Cars & Motors Pvt. Ltd. Kabirdass Motor Co. Ltd. Kerala Automobiles Ltd. Kinetic Engineering Ltd. Kinetic Motor Co. Ltd. Kranti Automobiles Ltd. L M L Ltd. Maestro Motors Ltd. Maharashtra Scooters Ltd. Mahindra & Mahindra Ltd. Mahindra Navistar Automotives Ltd. Mahindra Nissan Allwyn Ltd. [Merged] Mahindra Two Wheelers Ltd. Majestic Auto Ltd. Man Force Trucks Pvt. Ltd. Monto Motors Ltd. New Holland Fiat (India) Pvt. Ltd. Pal-Peugeot Ltd. Scooters India Ltd. Shree Chamundi Mopeds Ltd. Shriram Automall India Ltd. Sooraj Automobiles Ltd. Standard Motor Products Of India Ltd. Sunku Auto Ltd. T V S Motor Co. Ltd. Tata Motors Ltd. V C C L Ltd. V E Commercial Vehicles Ltd. Yamaha Motor India Pvt. Ltd. Daewoo Motors India Ltd. Ford India Pvt. Ltd. General Motors India Pvt. Ltd. Hero Honda Motors Ltd. Honda Motorcycle & Scooter India (Pvt.) Ltd. Honda Siel Cars India Ltd. Hyundai Motor India Ltd. Maruti Suzuki India Ltd. Mercedes-Benz India Pvt. Ltd. Swaraj Mazda Ltd. T V S-Suzuki Ltd. [Merged] Yamaha Motor Escorts Pvt. Ltd. Owner Hinduja (Ashok Leyland) Group Private (Indian) Private (Indian) Bajaj Group Mahindra & Mahindra Group Eicher Group Wadia (Bombay Dyeing) Group Firodia Group Birla C.K. Group Private (Indian) Private (Indian) Firodia Group Firodia Group Private (Indian) LML Group Private (Indian) Bajaj Group Mahindra & Mahindra Group Mahindra & Mahindra Group Mahindra & Mahindra Group Mahindra & Mahindra Group Hero (Munjals) Group Firodia Group Private (Indian) Vinod Doshi Group Vinod Doshi Group Private (Indian) Shriram Transport Group Private (Indian) Private (Indian) Private (Indian) T.V.S. Iyengar Group Tata Group LML Group Eicher Group Private (Indian) Private (Foreign) Private (Foreign) Private (Foreign) Hero (Munjals) Group Private (Foreign) Private (Foreign) Private (Foreign) Private (Foreign) Private (Foreign) T.V.S. Iyengar Group Private (Foreign) Source: Centre for Monitoring Indian Economy, Prowess Dataset. 38 Product Ownership Scooters Heavy commercial vehicles Heavy commercial vehicles Three wheelers Motorcycles Commercial vehicles Motorcycles Automobiles Light commercial vehicles Scooters Passenger cars Utility Vehicles incl. jeeps Automobiles Three wheelers Mopeds Scooters Three wheelers Scooters Passenger cars Scooters Utility Vehicles incl. jeeps Light commercial vehicles Light commercial vehicles Two wheelers Mopeds Commercial vehicles Two wheelers Passenger cars Passenger cars Three wheelers Mopeds Commercial vehicles Motorcycles Light commercial vehicles Three wheelers Two wheelers Heavy commercial vehicles Scooters Commercial vehicles Motorcycles Passenger cars Passenger cars Passenger cars Motorcycles Scooters Passenger cars Passenger cars Passenger cars Passenger cars Light commercial vehicles Two wheelers Motorcycles Domestic Domestic Domestic Domestic Domestic Domestic Domestic Domestic Domestic Domestic Domestic Domestic Domestic Domestic Domestic Domestic Domestic Domestic Domestic Domestic Domestic Domestic Domestic Domestic Domestic Domestic Domestic Domestic Domestic Domestic Domestic Domestic Domestic Domestic Domestic Domestic Domestic Domestic Domestic Domestic MNC MNC MNC MNC MNC MNC MNC MNC MNC MNC MNC MNC TVS Motors Research Intensity 0.97 0.89 1.35 1.89 2.32 2.16 1.81 1.90 1.91 1.94 1.71 4.03 1.41 Import Intensity 3.28 1.50 1.68 2.38 1.57 1.82 0.48 0.95 0.39 0.08 Ashok Leyland Research Import Intensity Intensity 0.33 0.86 1.16 0.93 0.86 0.97 0.95 1.22 0.50 1.88 1.27 1.69 1.33 1.84 3.18 2.20 1.93 3.89 6.12 2.90 3.90 1.84 1.96 Export Intensity 1.04 0.85 0.76 0.79 2.09 3.62 4.73 5.60 8.37 12.45 Export Intensity 5.62 6.08 5.87 6.48 7.36 10.65 7.28 7.39 8.22 12.64 7.48 7.73 20.89 27.53 26.18 24.87 1.21 1.20 1.09 1.17 Bajaj Auto Research Intensity 2.12 7.59 Export Intensity Tata Motors Research Intensity 1.24 1.14 1.07 1.35 1.00 1.95 2.03 2.57 3.69 5.18 Export Intensity 7.07 9.13 7.18 4.49 6.62 7.19 9.37 8.67 8.49 7.74 Source: Centre for Monitoring Indian Economy, Prowess Dataset. Mar-00 Mar-01 Mar-02 Mar-03 Mar-04 Mar-05 Mar-06 Mar-07 Mar-08 Mar-09 Mar-10 Average Year Mar-00 Mar-01 Mar-02 Mar-03 Mar-04 Mar-05 Mar-06 Mar-07 Mar-08 Mar-09 Mar-10 Average Year 39 0.66 3.25 0.34 1.42 Import Intensity 1.73 Import Intensity 1.99 0.22 0.48 0.93 0.39 1.50 1.52 2.13 4.58 3.58 Export Intensity 1.72 Export Intensity 1.23 0.76 0.67 1.49 1.05 1.10 1.48 2.50 3.53 3.38 Table A2: Summary Data on Export, Research and Import Intensity, 2000-2009 1.48 Import Intensity 1.27 0.05 2.91 0.37 1.35 1.70 4.36 2.32 0.49 0.00 0.29 0 0.12 0 1.03 Asia Motor Works Research Import Intensity Intensity 2.44 Force Motors Research Intensity 1.01 0.00 2.18 2.28 2.32 2.80 5.20 3.51 2.60 2.48 Export Intensity 1.72 2.16 2.91 4.51 3.69 4.08 4.97 5.28 5.87 4.21 3.62 3.91 Mahindra Research Intensity 0 0 1.75 1.65 1.47 1.44 1.49 1.43 1.83 3.91 3.34 1.67 Import Intensity 1.75 1.87 0.70 0.58 0.06 0.55 0.31 0.71 1.07 0.56 1.24 0.85 CHAPTER 2 Technological Capability of Indonesia’s Automotive Industry HARYO ASWICAHYONO PRATIWI KARTIKA* Centre for Strategic and International Studies YAN RIANTO† Ministry of Communication and Information Technology CHICHI SHINTIA‡ The Indonesian Institute of Sciences The importance of the automotive industry to the Indonesian economy has heightened in recent years. The role of foreign investors in the development of the industry, as well as in the industry’s level of technology, is unavoidable. This paper attempts to identify the strengths and weaknesses of the technological capability of Indonesia’s automotive firms by interviewing ten companies in the industry. The results show that they seem to focus on short-term gains in their business as they excel in meeting demands with QCD criteria, managing the assigned projects well, and often learning from the experience. However, they seem not to have a long-term technology strategy, as most of them have not started research and development and do not place technological learning as a priority when selecting technology or other activities. * † ‡ Centre for Strategic and International Studies, Indonesia. Ministry of Communication and Information Technology, Republic of Indonesia. The Indonesian Institute of Sciences (LIPI), Indonesia. 41 1. Introduction The relationship between global-local linkage and innovation has been studied by many authors. Aswicahyono and Kartika (2010) find the significance of Japanese investors in the development of Indonesia’s automotive industry and in the technological learning of Indonesian engineers. Although considerable research has been done on this area, much less is known about the depth of technological capability of Indonesia’s automotive firms. The purpose of this research is to gain knowledge on the strengths and weaknesses of the technological capability of Indonesia’s automotive companies. The results suggest that the core competencies of Indonesia’s automotive firms are good management skill in implementing the technology-based projects, meeting customers’ demand in QCD (quality, cost, and delivery) terms, and drawing lessons from past technology-based projects. Nevertheless, the limitation of the Indonesian automotive companies is the fact that they do not invest in research and development nor make attempts in building their own technology for the benefit of their future technological competence. Furthermore, some manufacturing firms which are heavily foreign-owned and have a sole customer/supplier, i.e. their own principals, usually have relatively low technological capability, since their technology is provided by their principals and they have neither responsibility nor incentive to upgrade their technology. Despite the limitations of the technological capability of Indonesian automotive manufacturing firms, the importance of the industry to the country’s economy is increasing recently, and the labor productivity of the industry also shows upward movement. This paper is structured as follows. Section 2 gives the development of the 42 industry, utilizing secondary data of the GDP (gross domestic product), exports, domestic sales, number of laborers, and labor productivity. Section 3 describes the excerpts from interviews with 10 automotive firms, preceded by the theoretical framework of the interviews. After presenting the stylized findings from the interviews, the last section attempts to draw policy implications. 2. Structure of Indonesia’s Automotive Industry The significance of the automotive industry to the nation’s economy has heightened during the past decade. This is reflected in its rising share of the country’s GDP, the larger value added the industry produces, the rapid growth of local automotive sales, and the increasing productivity of laborers in that industry. The contribution of the transport equipment industry to total GDP has increased recently. It was 5% in 2000 and enlarged to almost 9% in 2010. Likewise, the portion of value added created by the transport equipment industry in the total value created by all manufacturing industries expanded from 18% in 2000 to almost 32% in 2010. These indicate the heightened significance of the industry to the economy. 43 Figure 1: Share of Value Added of Transport Equipment Industry in GDP 35% 10% 9% 30% 8% 25% 7% 6% 20% 5% 15% 4% 3% 10% 2% 5% 1% 0% 0% 2000 2005 Share in manufacturing GDP (LHS) 2009 2010 Share in total GDP (RHS) Source: Calculated by authors, CEIC Database. Although the share of the industry’s value added to total GDP rose, the growth of the industry’s value added declined slightly. However, the figures still indicate strong growth over time: 68% during 1995-2000; 33% during 2000-05; 26% during 2005-08. Furthermore, there seems to be a shift of the largest contributor of value added from domestic firms to foreign firms. As for the years 1995 and 2000, the largest value added creators were, in order, domestic motorcycle parts and components firms, domestic motorcycle parts firms, and motor vehicle firms with >10-50% foreign ownership. Nevertheless, in 2005 and 2008, the main contributors of the industry’s value added were, by rank, majority foreign-owned motor vehicle firms, majority foreign-owned motorcycle parts and components firms, and minority foreign-owned motorcycle firms. 44 Figure 2: Value Added of Automotive Industry, by Ownership (in Thousand Rupiah) 2008 2005 2000 1995 0 5,000,000,000 10,000,000,000 15,000,000,000 20,000,000,000 MV MV parts MC MC parts MV * MV parts * MC * MC parts * MV ** MV parts ** MC ** MC parts ** Source: Calculated by authors, Central Bureau of Statistics. Notes: MV = Motor vehicle firms with <=10% foreign ownership MV* = Motor vehicle firms with >10 – 50% foreign ownership MV** = Motor vehicle firms with >50% foreign ownership MV parts = Motor vehicle’s parts & components firms with <=10% foreign ownership MV parts* = Motor vehicle’s parts & components firms with >10 – 50% foreign ownership MV parts ** = Motor vehicle’s parts & components firms with >50% foreign ownership MC = Motorcycle firms with <=10% foreign ownership MC* = Motorcycle firms with >10 – 50% foreign ownership MC** = Motorcycle firms with >50% foreign ownership MC parts = Motorcycle’s parts & components firms with <=10% foreign ownership MV parts* = Motorcycle’s parts & components firms with >10 – 50% foreign ownership MV parts ** = Motorcycle’s parts & components firms with >50% foreign ownership. Motorcycle and car domestic sales have increased greatly since 1998. After being hit by the 1998 economic crisis, sales in 2001 were back to a level similar to that before the crisis. Afterwards, the motorcycle sales quadrupled to around 7.4 million units sold in 2010. Similarly, the car domestic sales grew by 2.5 times to approximately 760,000 units in 2010. This reflects the booming of the Indonesian economy in the 2000s. There were decreases in both types of vehicles in 2006, perhaps due to the rise in domestic fuel prices in 2005. There were also slight 45 decreases in 2009, probably because of the 2008 global financial crisis. Figure 3: Local Sales of Motorcycles and Motor Vehicles (unit) 8,000,000 900,000 7,000,000 800,000 700,000 6,000,000 600,000 5,000,000 500,000 4,000,000 400,000 3,000,000 300,000 2,000,000 200,000 1,000,000 100,000 0 0 Motorcycle Sales (LHS) Motor Vehicle Sales (RHS) Source: Central Bureau of Statistics. Indonesian exports of automotive products surged after the economy recovered from the crisis in 2002. Exports of cars increased by about 600% and 400% during the periods of 2002-05 and 2005-08. This is in line with the policy development at that time, when in 2006 the government abolished the import duty on parts of cars for the export market. As for auto parts exports, they also experienced strong growth in the periods under observation (Table 1). 46 Table 1: Export Growth of Automotive Industry MV MV parts 1996-99 94.50% 152.47% 1999-2002 -47.62% 89.86% 2002-05 599.47% 153.64% 2005-08 407.04% 43.79% Source: Calculated by authors, WITS World Bank. Notes: MV = Motor vehicle MV parts = Motor vehicle’s parts & components MC = Motorcycle MC parts = Motorcycle’s parts & components. MC 17.22% -10.60% -5.50% 140.33% MC parts -2.83% 6.56% 62.63% 11.57% For the four years under observation (1995, 2000, 2005, and 2008), domestic auto parts and components firms (i.e. MV parts and MC parts) were the firms which absorbed the most laborers (Figure 4). In contrast, labor absorption in the domestic motor vehicle and motorcycle firms as finished goods producers was not much. This might indicate a large amount of local SMEs (small and medium enterprises) in the auto parts and components industry in Indonesia. However, despite the large number of laborers, the labor productivity of the local motor vehicle parts and components companies was relatively low (Figure 5). Moreover, there was a substantial increase in the number of laborers for majority foreign-owned motor vehicle firms in 2005 and majority foreign-owned motorcycle parts and components firms in 2008. This may be due to the opening of Indonesia’s automotive industry in 1999. Around that time, as part of Indonesia’s commitments with IMF, the sector started to be liberalized. Local content requirements and nontariff barriers were removed. Import tariffs on CKD (completely knocked down) and CBU (completely built up) parts were slashed. Furthermore, many domestic shares of automotive companies were acquired by foreign investors after the 1998 Asian economic crisis (Aswicahyono and Kartika, 2010). 47 Thereby, foreign-ownership became larger in the automotive firms. This is shown in Figure 5, which depicts that in 1995 and 2000 domestic firms absorbed more laborers than foreign firms did, whereas in 2005 and 2008 foreign firms employed more laborers than domestic firms did. Figure 4: Number of Workers in the Automotive Industry 70,000 60,000 50,000 40,000 30,000 20,000 10,000 0 MV MV parts MC MC parts Total MV * 1995 MV MC * MC Total * MV ** MV MC ** MC Total ** parts * parts * parts ** parts ** 2000 2005 2008 Source: Central Bureau of Statistics. Notes: MV = Motor vehicle firms with <=10% foreign ownership MV* = Motor vehicle firms with >10 – 50% foreign ownership MV** = Motor vehicle firms with >50% foreign ownership MV parts = Motor vehicle’s parts & components firms with <=10% foreign ownership MV parts* = Motor vehicle’s parts & components firms with >10 – 50% foreign ownership MV parts ** = Motor vehicle’s parts & components firms with >50% foreign ownership MC = Motorcycle firms with <=10% foreign ownership MC* = Motorcycle firms with >10 – 50% foreign ownership MC** = Motorcycle firms with >50% foreign ownership MC parts = Motorcycle’s parts & components firms with <=10% foreign ownership MV parts* = Motorcycle’s parts & components firms with >10 – 50% foreign ownership MV parts ** = Motorcycle’s parts & components firms with >50% foreign ownership. 48 Figure 5: Labor Absorption in Domestic Firms and Foreign Firms in the Automotive Industry 100% 90% 80% 70% 60% 50% 40% 30% 20% 10% 0% 1995 2000 domestic 2005 2008 foreign Source: Central Bureau of Statistics. Regarding productivity, the highest labor productivity is in the foreign-owned motor vehicle firms, i.e. MV* and MV** (Figure 6). The figure also demonstrates that domestic firms seemed to experience a decrease in labor productivity from 1995 to 2008, except for the domestic motor vehicle firms. Nevertheless, many foreign firms seemed to experience an increase in labor productivity in 2005 and 2008, compared to their levels of labor productivity in 1995 and 2000. This phenomenon is more obvious in the minority foreign-owned motor vehicle and motorcycle firms, majority foreignowned motor vehicle firms, and majority foreign-owned motorcycle parts and components firms (i.e. MV*, MC*, MV** and MC parts** firms). 49 Figure 6: Labor Productivity in the Automotive Industry (in Thousand Rupiah) 1,600,000 1,400,000 1,200,000 1,000,000 800,000 600,000 400,000 200,000 0 MV MV MC MC parts parts MV * MV MC * MC parts * parts * 1995 2000 2005 MV MV MC ** MC ** parts parts ** ** 2008 Source: Calculated by authors, Central Bureau of Statistics. Notes: MV = Motor vehicle firms with <=10% foreign ownership MV* = Motor vehicle firms with >10 – 50% foreign ownership MV** = Motor vehicle firms with >50% foreign ownership MV parts = Motor vehicle’s parts & components firms with <=10% foreign ownership MV parts* = Motor vehicle’s parts & components firms with >10 – 50% foreign ownership MV parts ** = Motor vehicle’s parts & components firms with >50% foreign ownership MC = Motorcycle firms with <=10% foreign ownership MC* = Motorcycle firms with >10 – 50% foreign ownership MC** = Motorcycle firms with >50% foreign ownership MC parts = Motorcycle’s parts & components firms with <=10% foreign ownership MV parts* = Motorcycle’s parts & components firms with >10 – 50% foreign ownership MV parts ** = Motorcycle’s parts & components firms with >50% foreign ownership. 3. Innovation 3.1. Theoretical Framework Jong and Brouwer (1999) defined innovation as development and success of the application of a product, service, technology, work process or new market condition, or 50 the upgrading of those things mentioned in order to achieve the goal of competitive superiority. This is similar to the innovation definition by Cozijnsen and Vrakking in Jong et al. (2001), as well, who stated that innovation is related to some objectives, for a new product, new market, new technology, or new work process, etc. Innovation itself is a chain of activities built and implemented in a continuous process and involving several stages. Buijs in Jong et al. (2001) constructed a simple model which illustrates how the process of innovation happens. Buijs divided the innovation process into two stages, which are the Search Stage and the Implementation Stage. Through the two-stage model, Buijs explained the relation between innovation and the innovation capability in a company or organization. In the Search Stage, the component of the human resources of an organization does the searching and building of the ideas, and also the determining of the objective of the performed development. In this stage, the capability to perform innovation becomes the key concept. The innovation capability becomes the most crucial factor for an organization. If the company is weak in innovation capability, then it will also be weak in performing the innovation project and in its resultant product. In the Implementation Stage, the idea or the concept is developed into the actual innovation, in form of a product innovation such as a new product, or as a process innovation such as a new technology that makes the production process shorter and more efficient. From those two stages explained above, it is clear that innovation capability is a very important factor. Romijn and Albaladejo (2000) define the capability of innovation as the capability to make modification and major upgrading to the existing technology, and to create the new technology. Innovation capability applies to process technology, product technology, and also the way to organize and arrange the production. Meanwhile, the 51 World Bank defines innovation capability as activities which enable a firm to choose and use technology to create strategic competitive advantage. In other words, technological capability is what firms need to be able to use technology for strategic competitive advantage. The better a firm’s technological capability, the greater its gain of competitive capability. There are nine indicators of the extent to which a firm has developed capability in this area, including: 1. Awareness – this refers to the ability of a company to recognize the role of technology in competitiveness and the dangers of ‘standing still’ in today’s highly competitive environment. 2. Searching – the ability of the company to scan or monitor external technology events and trends which might affect the company or provide opportunities for growth or competitiveness. Large advanced companies often have a group of individuals permanently working on this task. 3. Building core technological competence – this category refers to the success of a company in defining its individual technological strengths and building up a unique advantage in specific areas. A company with strong technological competence will understand how its distinctive technological strengths differ from its competitors and how to further develop its skills and knowledge to remain competitive. 4. Technology strategy – formulating a technology strategy is a key part of the overall business strategy of any leading firm. This is the process by which visions, objectives, and priorities are set and communicated within the company. 5. Assessing and selecting technology – leading companies are able to gather information on the range of technological options available, choose quickly among 52 competing solutions (e.g. different machines, approaches or suppliers) and identify the most appropriate source which fits with their needs. A leading firm is able to make a comparison between (or ‘benchmark’) the various options available and can reliably select the most appropriate option, based upon this comparison. 6. Technology acquisition – once a new technology option is decided upon, a firm needs to deploy the resources to exploit it (e.g. by creating technology via inhouse R&D, or by acquiring it through a joint venture or technology licensing). In some cases, this may be a simple matter of buying off-the-shelf, or it may involve exploiting the results of research already carried out. In other cases, it might require extensive search and research to acquire the technology. 7. Implementing and absorbing technology – having acquired technology, a firm needs to implement the technology within the organization, which may involve various stages of further development to final launch, as in the case of a new product or service in the external market place, or a new manufacturing process or method within the organization. 8. Learning – an important part of building technological competence involves reflecting upon and reviewing technology projects and processes within the firm, in order to learn from both successes and failures. In order to learn how to manage the technology processes better, a firm needs to systematically capture relevant knowledge from its own (and other firms’) experience and act on this knowledge. 9. Exploiting external linkages – in each of the eight key technology activities above, firms can and, in some cases, should make use of external suppliers of technology and related services. These next questions concern the different kinds 53 of organizations which might supply the firm with services (e.g. consultancy companies, government research institutes, or universities). Based on those nine factors, the innovation capability of the automotive companies in Indonesia is identified. The identification of innovation capability is carried out by doing in-depth interviews with 10 automotive companies in Indonesia. The level of innovation capability is identified by scoring from 1 to 4 for each factor determining the innovation capability. One indicates a low capability while four indicates a high capability. The in-depth interviews and scores are carried out based on the interview guide developed by the World Bank. 3.2. Innovation Capability of Automotive Industry: Case Studies of 10 Firms 3.2.1. PT. AGI AGI is a joint venture between Japanese and Indonesian investors, with its shares for Asano Gear Co. Ltd at 73.77% and for PT. Inti Ganda Perdana at 26.23%. The main product of the company, which was established in 2006, is the differential gear for automobiles, along with parts machining. Sales of the product are all for PT. Astra Daihatsu Motor (including exports through PT. TMMIN). The production process of the company is supported by 73 workers. Awareness AGI’s score for the factor of awareness is 3. AGI has realized the importance of technology for its competitiveness. Although AGI tends to have no competitor, it is possible that this company’s customers will find another supplier outside of Indonesia if AGI is not capable of creating the product at a lower price. Customers also require QCD which needs to be fulfilled by their supplier. 54 In order to maintain its competitiveness and to meet the customer requirements (QCD), AGI performs a variety of improvements (the production process, safety, and cost) that are gradual and continuous (the concept of Kaizen) and are leap-frogging. By using the machines or new manufacturing processes resulting from the improvements, AGI can produce higher-quality products faster and cheaper. This will definitely have a positive impact on the competitiveness of products. Searching In the factor of technology searching, AGI’s score is 2. AGI has an understanding of how the company should compete. The company also knows what factors are affecting the competitiveness of enterprises. AGI recognizes that the key factor that determines its competitiveness is its ability to meet the QCD requirements of customers. Therefore, AGI does various improvements to meet these customer requirements. The improvements by AGI include the manufacturing process, safety, and cost. Of these three types, the company is more focused on doing a lot of improvement in cost, which is aimed at efficiency improvement that can reduce production costs. In order to make continuous improvements, AGI always tries to follow the technological developments in the field of the differential carrier for automobiles and parts machining. In this case, AGI has been actively searching technology from various sources, such as by training and by searching the Internet. Building Core Competence AGI’s score for the factor of building core competence is 3. AGI recognizes that the advantages of the company compared to its competitors are its ability to provide products with better quality and efficiency in the production process, its clean factory 55 environment, and its good working control. In order to maintain its core competence, AGI tries to be consistent in making improvements, especially in producing higher quality and cheaper products. Unfortunately, AGI does not have a clear mechanism to protect and develop its competence. The company has no R&D units that can be used to create particular knowledge. Technology Strategy For the technology strategy factor, AGI’s score is 4. The firm has developed a strategic framework to guide change, and has deployed its business strategy to specific frameworks for product and process (manufacturing) improvement. To increase its competitiveness, AGI always makes improvements that are intended to produce better quality and cheaper products. In this regard, efforts to increase competitiveness by improvement are based on the 4C concept (Clean, Compact, Challenge, and Creative). The Clean concept means that the company has to be clean. Clean in this way involves two things. First, it means a clean working environment. The second meaning is to be clean in the production process. All production processes running at AGI must follow the SOP (standard operating procedure) which had been predetermined. The Compact concept implies that in working out production processes, it should not be done in vain. All of its business activities, starting from production costs to product delivery, should be as efficient as possible. The third “C” is Challenge. It means that every person in the company must dare to fight and accept the challenges. The last “C” is Creative, which means that AGI should always be able to make improvements, aligned with the concept of Kaizen improvement. To that end, the company routinely conducts a program review system to discuss ideas and QCD to be achieved. The company has a special program to improve its ability significantly in terms of QCD. 56 Assessing and Selecting For the assessment and selection of technology factor, AGI’s score is 2. AGI has established a special mechanism in conducting assessment and technology selection. However, the process still depends on the Japanese side. In terms of assessment and technology selection, AGI involves Asano Gear Co. of Japan as the largest shareholder. Improvement in the use of machinery depends on the decision of the Japanese side. The quality team in Indonesia only has the responsibility to collect claims data of the market, to analyze it, and to propose the improvement. Then, further analysis is conducted by the R&D unit in Japan. Thus, the improvements which would be done depend on the Japanese side’s decision. It is similar when AGI carries out projects that require a new machine. The process of setting up the use of new machines to run the project is mostly done through a series of compromises with the Japanese side. Acquiring Technology For acquiring technology factor, AGI’s score is 2. The company has used various mechanisms in the acquisition of technology. However, most of the technology that the company acquired has been through the purchase of new machines. There are no machines independently developed by AGI because the company does not have its own R&D unit to conduct research to develop its own machines. AGI’s R&D unit is still affiliated with the R&D unit in Asano Gear Japan. The technological capability of AGI is still at the stage of making improvements to the efficiency of the process and cost of production. AGI also makes efforts to enhance its technological capability through searching technology information from external sources such as the Internet, attending training both locally and abroad, and inviting lecturers from universities (ITB) to provide training. 57 Implementing For the implementing of technology factor, AGI’s score is 4. AGI has sufficient expertise in technology-based project management and risk management. AGI has a fairly good mechanism for managing the project. When there are new projects, especially those using new machines, AGI will prepare its employees in advance. Before implementing the new machine, the company sends its employees to suppliers of machinery (such as in Taiwan and Japan) to learn about how the machine works. AGI also has good risk management, conducted by the company throughout the routine every day from 8 until 9 o’clock or 9:30. Learning For the factor of learning technology, AGI’s score is 3. AGI has a fairly good mechanism for learning, which is conducted through benchmarking and internal learning. Although the company has not conducted learning through benchmarking against competitors yet, it has done so to parties who are deemed to have a higher technological capability. To obtain the technological learning, AGI also actively engages its employees in training activities conducted by both internal and external parties. In addition, the company has made efforts to control the progress of a project regularly, benefiting from lessons on what to do in the future to obtain better results. Exploiting External Linkages In the factor of exploiting external linkages, AGI’s score is 3. The company has known external sources that can support technological capability. This is proven by the company’s efforts to access them. AGI actively seeks parties that can provide training for its employees. This company is no longer reluctant to actively explore technology both locally and abroad, such as with the Dana Bhakti Astra Foundation 58 (YDBA), Astra Polytechnic, ITB, and the suppliers of machinery from Japan and Taiwan. In addition, the company has established cooperation with the government. Unfortunately, AGI is limited to the use of new testing facilities owned by government agencies. 3.2.2. PT. NKP This business was established in 1985, starting as CV. Hadi Karya. In 1996, along with its development, the company changed the name to PT. NKP as a specialist in the manufacturing of metal stamping parts and dies. This company has 780 workers with one Japanese foreigner. NKP’s products are all supplied to the domestic market. NKP has been a subcontractor of PT. Astra Honda Motor (AHM) since 1997. Therefore, almost all of NKP’s products (95%) are supplied to its main customer, AHM, while the rest (5%) goes to other customers. Awareness For the awareness of technology factor, NKP’s score is 2. NKP is aware of the need for change and improvement in mastering technology. Therefore, the company implements the Kaizen system which applies continuous improvement in all divisions. Even until now, there is no major improvement in the company, but small improvements continue to occur in every department. Unfortunately, the awareness of this company is oriented only to its internal matters. NKP does not give great attention to its external environment, especially its competitors. Related to that, NKP has a paradigm that owning sophisticated technology is not its priority. The most important thing for the company is the resultant product with particular specification, without owning sophisticated technology. The technology development in this company is 59 only based on its need to make products with particular specifications and not on ‘fighting’ its competitors. Searching For the factor of searching, NKP’s score is 1. NKP has a good understanding of factors required by its customers to be their subcontractor. The company knows that in the automotive parts industry, customers require quality, cost, delivery, productivity, safety, and morale (QCDPSM). To obtain and keep its customers, NKP has the principle to always preserve these QCDPSM requirements. Besides implementing the Kaizen system, NKP also created a business plan with specific targets that must be achieved by each department, and which are reviewed every month. The business plan also defines the next improvement. Even so, in preserving customers’ requirements, NKP is not oriented on competitors. The company is not concerned with what its competitors have done. The most important thing for this company is to focus on conducting internal improvement which then may result in appropriate products with particular specifications, even if it only uses available technology which is not as sophisticated as that of its competitors. Building Core Technological Competence For the factor of building core technology competence, NKP’s score is 3. The company does not pay much attention to its position in the market compared with its competitors. Lack of information on its competitors’ positions makes the company unaware of its competence compared with them. To maintain its customers, this company only attempts to fulfill its customer requirements. In order to satisfy QCDPSM, NKP emphasizes activities to increase human resources quality and always 60 makes improvements in all lines of the company’s business. Development of human resources is conducted by the company through a training scheme both domestically and overseas. Improvement is oriented on achievement of production efficiency with the target of workforce replenishment. Efficiency is achieved through its activities to continue improving and to achieve perfection through Kaizen. Technology Strategy For the factor of technology strategy, NKP’s score is 2. NKP has no particular strategy to develop its technology. Technology development occurs incrementally through the improvement process. The key strategy chosen by NKP to increase its business performance involves increasing the quality of its human resources, which is conducted through various training and activity schemes. The training program is conducted either through sending the workers abroad or through in-house training. This human resource competence is regularly controlled by the company every six months. From the quality system, NKP has the target to obtain ISO TS, which is an ISO certification for automotive companies. Therefore, this company always improves all of its production line in order to achieve the target. Even so, improvements in this company are not major ones, as incremental improvements occur continuously in all divisions. Assessing and Selecting Technology For the assessing and selecting of technology factor, NKP’s score is 2. NKP already has a clear mechanism, although it is still oriented on needs and the availability of resources. The company has not yet had orientation to anticipate long-term conditions and competitiveness by technology. As explained earlier, the technological 61 development of NKP is only oriented on the needs toward fulfilling customer requirements. This is conducted through a technology evaluation process by the engineering department. Then, based on the results of these evaluations, the decision to change the use of the machinery is made on the management level after coordinating with many divisions of the company. Even when replacing a machine, it still does not buy the most sophisticated one, basing the purchase on the needs of the company. The most important thing for the company is not mastering and owning the most sophisticated technology but making products that fulfill customers’ requirements with technology that is appropriate to the mechanical, electrical, and human resources capability of the company. Technology Acquisition For the technology acquisition factor, NKP’s score is 2. NKP’s technology acquisition is conducted by buying new machines. This company does not attempt to develop its own technology through R&D activities. Meanwhile, other technology development is in the form of simple improvement in the production process to achieve higher efficiency. In building innovation capability, the company also needs to have a mechanism to obtain external sources of knowledge. Related to this, NKP has one foreign worker from Japan. To obtain external knowledge, this company also joins many seminars and sends its workers for training outside of the company, even abroad. Although there are many schemes for obtaining external knowledge or technology, the technology development of NKP is still oriented to the needs and still based on the targets of workforce replenishment. Technology development is not yet directed to place the company in a higher position compared with its competitors. 62 Implementing and Absorbing Technology For the factor of implementing and absorbing technology, NKP’s score is 3. The company has clear methods in conducting its projects. As explained earlier, the company has a business plan as guidance for all divisions in conducting activities. To obtain good cooperation and coordination among divisions, this company has particular methods. Every morning, this company has an Asakai or a meeting for coordination, conducted to synergize tasks and targets which must be achieved that day. Every day, each division in the company has a P5M or “Pertemuan 5 Menit” (5minute meeting) before work is started. After that, at 9.00 a.m., all of the department heads have a coordination meeting as well. This meeting is also conducted as one of the activities required for implementation of ISO related to risk management. In implementing ISO, risks such as lateness and accidents have been anticipated because this audits what affects risks. Project management of the company is also accommodated through an activity plan containing a plan for work which will be conducted. Every month, this activity plan is reviewed to see the activities done and targets achieved. This plan also becomes a type of risk management for the company because it is created to avoid potential problems. Learning For the factor of learning, NKP’s score is 2. In technological learning, NKP does not learn much through its competitors. This is due to the lack of attention to competitors’ conditions. Learning activities conducted by NKP are still oriented to internal problem solving. One example is giving training to the workers to increase their capability in mastering technology. Training is conducted by sending workers to learn about a technology and obtain a certificate. After that, the workers undergo 63 internal training in order to train other workers. Learning at NKP also occurs through the company’s participation in seminars, either domestically or abroad. Technological learning in NKP also occurs in the review mechanism of its activity plan. Review on activities which have already been conducted or are target achievements provides indirect learning for the company. Through the review, the company may know weaknesses and barriers in its business activities. As the result, the company must try to make improvements so that the barriers no longer occur. Exploiting External Linkages In this factor, NKP’s score is 1. NKP’s networking with external parties is particularly directed to develop its weak technology. The company convinces that at present it does not use technology either from a university or an R&D institution. NKP’s relationship with other companies also occurs when there are visits by consultants from Japan. The company convinces that it is often the object of research by foreign consultants. Generally, they analyze the company to identify what it still needs to improve. Unfortunately, NKP said that the analysis is not deep enough and has not yet provided real solutions for the company. 3.2.3. PT. GKD GKD is a private domestic investment company and at the moment it occupies 45,353 m2 of land within the IGP Group area, employing 572 people. GKD’s mainstay products are the frame chassis category II (medium-sized truck) and category III (heavy-duty truck). To maintain product quality, GKD has been technically supported by its main customers, including PT Krama Yudha Berlian Motor – Mitsubishi; PT Toyota Motor Manufacturing Indonesia – Toyota; and PT Astra Nissan Diesel 64 Indonesia – Nissan UD. GKD is committed to consistently improving the quality of the company and its products. This is reflected by the acquirement of ISO 14001, OHSAS 18001 and ISO/TS 16949 certification. Awareness For the factor of awareness, GKD’s score is 2. GKD realizes the importance of technology for the company’s competitiveness. Even so, awareness of the importance of technology is restricted to the local issues and is reactive based on customers’ demands. GKD always tries to fulfill the requirement of technological change from its customers. GKD is aware of this and knows that if it cannot follow technological change demanded by its customers, then the company will lose orders. GKD also has a strong commitment to striving to satisfy customers by increasing competence in designing, developing, and maintaining dies and by increasing capability in the production process. Searching For the technology searching factor, GKD’s score is 2. GKD knows how to maintain its competitiveness. Even so, the understanding is still limited because the company has cost reduction as a key factor in maintaining competitiveness. GKD believes that the company’s growth and competitiveness depend on its ability to fulfill customers’ demands, including QCDS (quality, cost, delivery, and safety), and continuous improvement. These principles are always maintained by this company in performing its business activities. Nevertheless, GKD convinces that a key factor in winning orders from customers is to produce products with low prices. Other factors at GKD such as quality, delivery, and safety are not much different or are even the 65 same as at its competitors, including those in Korea. Even so, GKD is able to produce products at lower price levels. Therefore, GKD has to focus more on making cost reductions, which may be conducted by improvement in the production process. Building Core Competence In the factor of building core competence, GKD’s score is 3. This means GKD knows its core competence. Therefore, this company knows how it can compete. Even though this company has not tried to scan new ways to strengthen core competence, GKD always tries to make improvements, especially in the production process, to keep its advantage as a single player in ASEAN. At present, GKD plans to have improvement in the concept of its production process. For the long term, GKD intends to make low-cost cars by changing its driving system from back-wheel drive to front-wheel drive. With that, fuel consumption can be more efficient. Technology Strategy For technology strategy, GKD’s score is 2. The company has not yet had a real strategy or idea on how it must develop technology to increase competitiveness. This is shown by the absence of a company vision on developing its technology, so there is no clear target on technology that it wants to achieve. As a result, this company also has no main priority in developing technology. From the four technologies used in the production process (stamping, welding, drilling, and painting), the company cannot define which one should be prioritized for development. To survive in the market, this company only focuses on doing minor improvements (and these are not improvements to the main technology) aimed at fulfilling the requirements of product quality and cost efficiency. 66 Assessing and Selecting For the assessing and selecting factor, GKD’s score is 2. The company already has a framework for assessing and selecting new technology. Nevertheless, the selection of technology is still based on economic factors such as the financial ability of the company to implement new technology. The use of new technology by GKD generally is driven by customer requirements. Support to use new technology also comes from competitors. In addition, GKD tries to find out what technology is being used by its competitors. If competitors are using different technology, then this company will find information about the advantages and disadvantages of the technology compared with its own technology. After learning about the requirements of new technology, either from customers or competitors, the next step is to find information about the technology, such as specifications, advantages, disadvantages, and prices. Then, GKD makes a decision on whether it will use the new technology. The criteria used in deciding about the technology are the requirements from customers, prices, and sustainability of the order and model. Acquiring Technology For the acquiring technology factor, GKD’s score is 2. GKD has a mechanism for obtaining external technology. Nevertheless, the mechanism is still dependent on the tried-and-true approach such as buying machinery. The main technologies at GKD are all obtained through buying machines from the foreign market. Until now, this company is not yet capable of developing that kind of machine because it does not have its own R&D unit to conduct research. Development or improvement capable of being conducted by this company is only in the production process. Even so, to define 67 what technology and how to obtain it, GKD has a clear mechanism. As explained earlier, choosing new technology that is going to be implemented and the source from which to obtain it is based on the information and requirements of customers and competitors. Implementing and Absorbing Technology For the factor of implementing and absorbing technology, GKD’s score is 2. The company has a quite good mechanism for project management. To meet customer requirements in the form of a project or new technology, GKD has various routine meetings. In the meetings, all departments join to discuss the projects and new technologies which will be implemented, look at customer requirements which need further discussion to be fulfilled, review orders and prices, and identify problems and best solutions. Each department in the company also does a regular meeting each week. Every morning at 9.00 o’clock, each department also has an Asakai to identify critical points from yesterday’s problems and what must be done today. Although there is a quite good coordination mechanism on projects, GKD is still weak in risk management. This company has not yet created a special division for risk management. Last year, the company just built a team for focusing on financial risk management, consisting of four persons. Learning For the factor of learning, GKD’s score is 3. Technological learning at GKD is often done through IGP group coordination. The IGP group builds its competence in product development through many learning activities for its workers. Through cooperation with a design house in Europe, the IGP group sends its engineers 68 (including engineers from GKD) to learn product design at the design house. The IGP group has also constructed a Learning Center institution which is used to develop human resources intensively by in-house training. Technology learning also takes place through a coordination mechanism when implementing a project or new technology, like what has been explained earlier. Coordination among departments also becomes a media for evaluating ongoing projects and finding solutions when problems occur. Through this media, the company may learn many things related to what can be done better by the company in the future. Linking to External Sources For the linking to external sources factor, GKD’s score is 3. GKD is aware of external sources which can be used to drive the company’s development. The external sources include the government and universities. Nevertheless, the two sources have not been maximized by this company to develop its technology. Cooperation with government institutions is only at a testing facility for analyzing product performance as required by customers. As for the universities, the IGP group invites lecturers from universities (ITB) to provide training for GKD’s employers. 3.2.4. PT. NL NL is a local investment company established in 2004 to fulfill the demand of components of motorcycle spare parts. The company, which has 35 employers, occupies a building of 1,000 m2 and land of 3,400 m2 in Jababeka Industrial Park. The main customers of NL are PT. Astra Otopart Tbk, PT. Dynaplast Tbk, PT. Yasunli Abadi Utama Plastik, PT. Citra Plastindo, and PT. Indospray. 69 Awareness For the factor of awareness, NL’s score is 3. NL really has awareness of the importance of technology for the company’s competitiveness. From that awareness, the company tries to develop technology and innovation so it can survive in the market. NL really understands that technology and innovation can increase efficiency, in the production process as well as the use of resources such as laborers. This condition will surely have positive implications on production costs so that the product price will become cheaper. NL is also aware that technology and innovation play important roles in achieving the QCD assigned by the customer. NL’s awareness of the importance of technology to competitiveness is implemented by the company through efforts to develop technology and innovation by itself. The financial limitations of the company for buying some high-tech machinery forces it to innovate in developing its own machinery. NL also always observes the technology position of competitors. The company actively finds out what technology is used by its competitors, and it follows through in buying new machines or developing its own. Searching For the technology searching factor, NL’s score is 3. In the business area that NL explores, QCD is the key factor that determines the company’s competitiveness. That condition is deeply understood by NL. Meanwhile, as explained before, NL always attempts to create innovation and update the technology used. For that objective, NL actively searches the technology related to its business area through following some exhibitions and training abroad, digging out information from competitors, and attending some discussions held by the YDBA, a foundation of the Astra business 70 group for its automotive companies, or the government. Based on the technology searching, the company then attempts to self-develop the technology. Unfortunately, the search and development of technology has not been included systematically in the company’s framework for building competitiveness. Building Core Competence For the building core technology competence factor, NL’s score is 3. This means that NL knows of its core competence and also has made some effort to maintain and improve it. However, the company has not done the scanning of the new ways for building its competence and developing that into new products and processes. NL admits that its own competencies are the company’s consistency in delivering products according to the QCD assigned by customer, and its capability to innovate in selfdeveloping the technology. Therefore, the company always attempts to stay consistent in its capability of delivering products according to customer requirements, as conducted by NL through technology development and improvement of the quality of human resources. Technology Strategy For the factor of technology strategy, NL’s score is 2. NL has not had a real strategy for developing technology. The company only has a simple strategy in technology searching, but it has not determined the priority of which technology is to be developed by the company in the future. The technology development efforts by the company are encouraged more by the need to fulfill costumers’ specification demands. These demands are then combined with the results of the technology search done by the company. In other words, technology development at the company is still 71 sporadic without any definite, written strategic plan. Assessing and Selecting Technology For assessing and selecting technology, NL’s score is 2. The company does have a framework for selecting between some technology options which would be adopted or developed. However, the framework is still too simple and excludes the long-term issues. To identify which technologies are required to be developed by NL, the company actively monitors technology development through participation in exhibitions, discussions, technology training, and browsing the Internet, and by finding out the technologies its competitors are using. After doing the technology searching, the company determines which technology is to be bought and which it should selfdevelop. The consideration used by NL to decide those selections is the matter of the precision of the resultant product. Then, the decision on whether to purchase or develop the technology is taken by the management through some discussion processes. If the management decides to develop the technology required, then the next step is to start finding ideas and attempting to create the design. Because NL does not have an R&D department, the activity is fully conducted by the engineering department. Acquiring Technology For the acquiring technology factor, NL’s score is 3. The company has used various mechanisms to acquire technology. The technology implemented in the company is not only acquired from external sources but also from efforts to selfdevelop technology. The sources of NL’s technology indirectly stimulate the improvement of the company’s technological capability. When the company decides 72 to self-develop the technology, then it will seek out, study and build the technology on its own from what has been studied. This situation will surely boost technological capability because the company has the new knowledge about the technology that it built. Implementing and Absorbing Technology For the factor of implementing and absorbing technology, NL’s score is 2. The company has project and risk management but it is still limited. The company does not have a proper framework for risk management nor the continuous review of project progress. The project management that NL has done can be seen from the mechanism for routine coordination and inter-departmental communication. On the employee level, coordination is done every morning with the 5-minute meeting (P5M – Pertemuan 5 menit) that discusses yesterday’s work results and what will be done today. For the coordination in the management level, it is done twice a week. Meanwhile, for risk management, the company handles it with the implementation of quality management. And for the risk of work accidents, the government applies the Occupational Health and Safety Training (LK3 – Latihan Keselamatan dan Kesehatan Kerja). Learning For the factor of learning, NL’s score is 2. The company has carried out a mechanism to obtain technology learning from external and internal sources. However, the learning mechanism is still simple. Technological learning at NL is done by referring to competitors or by doing internal study. If competitors use higher technology, then the company will learn about the technology’s strength and 73 weaknesses compared to its machinery and will consider the possibility of applying that technology in the company. From those activities, the employees’ knowledge will indirectly increase, improving the company’s overall technological capability. Meanwhile, technological learning conducted by internal study can be obtained through training that the employees participate in. The mechanism of coordination and inter-departmental routine discussions can also be an important learning media for the company. From this media, some issues and problems are usually found, along with the solutions to take in order to solve problems in the future. Exploiting External Linkages For the factor of exploiting external linkages, NL’s score is 3. This means that NL has an awareness of the existence of the external sources. NL also knows how it can access those technology sources, so that it can encourage the company’s technological capability. This is done by some cooperation with external parties such as the YDBA, Balai Besar Logam, and foreign parties. However, the company admits to the minimal role of the government and colleges in supporting the improvement of its technological capability. 3.2.5. PT. SRM SRM is a local investment company established in 2002. SRM was appointed as an Authorized Distributor of GRACO Fluid Handling Equipment to serve various industries and application in Indonesia. With continuous support from principals, SRM expanded the business into design, installation, and commissioning of the paint circulation system, sealant and adhesive system, lubrication system and others, besides sales and service. The industries served by SRM are automotive manufacturers, auto 74 parts manufacturers, and motorcycle manufacturers, among others. The main customers of SRM are Astra Daihatsu Motor and Indomobil Suzuki International. Awareness For the technology awareness factor, SRM’s score is 2. SRM is not aware of the importance of technology development in improving the competitiveness of enterprises. This is revealed by the latest technological developments in the field of automotive painting. In addition, the main technologies used at SRM are fully supplied by its principal. Thus, the company until now has not been forced to make technological development, especially in the main machines. SRM’s awareness of technology importance has been seen only from the improvement efforts undertaken when there is a demand from customers. Technological development undertaken by SRM can be seen in the company’s efforts to make improvements to fulfill customers’ needs. The company itself is committed to continuous improvement, particularly improvement in system design painting. Ideas for improvement also are usually driven by customers, who likewise want to make improvements in their own painting processes. Searching For the factor of technology searching, SRM’s score is 2. This means that the company only has a limited understanding of how to compete with price as a determinant of competitiveness. According to SRM, the key factors determining the competitiveness of a company are price and after-sales service. This is well understood and implemented at SRM. The company still searches for new knowledge through its participation in technology exhibitions and visits to other countries such as 75 Korea. Through these activities, developments in the company’s technologies are accomplished. However, because the main technology that is owned by SRM comes from its principal, the searching of technology is not intended for the development of technology in the company. It becomes an effort to increase knowledge that will be needed to make improvements when there is a demand from customers. 76 Building Core Competence For the building core competence factor, SRM’s score is 2. The company has an understanding of the advantages that it has over competitors. However, the understanding of the company about how to compete is still modest because it is based on the price factor. SRM acknowledges that its technological capability is similar to that of competitors which are Japanese companies. However, SRM has the advantage in price. Meanwhile, a non-price factor that affects competitiveness is considered to be after-sales service. This shows that technology development has not been taken into account as a factor that can increase the competitiveness of the company. Technology Strategy For the factor of technology strategy, SRM’s score is 2. The company has a strategy for creating competitive advantage. However, the strategy is simple and as yet there is no real idea of how technology can help the company improve its competitiveness. SRM admits that the main strategy of the company for maintaining competitiveness in the future is to continue developing its human resource capabilities through various training programs. Besides that, a strategy undertaken by the company is to implement ISO. SRM has ISO 9001/2008 certification. Implementation of ISO shows that the company has good operational standards in conducting its business activities. Through ISO certification, the company hopes that it can grow its business in countries such as Thailand and Malaysia. Assessing and Selecting For assessing and selecting technology, SRM’s score is 1. Leading companies are able to gather information on the range of technological options available, choose 77 quickly among competing solutions (different machines, approaches, or suppliers) and identify the most appropriate source that fits their needs. A leading company is able to make a comparison between (or ‘benchmark’) the various options available and can reliably select the most appropriate option, based on this comparison. Unfortunately, these conditions do not occur in SRM. The company is not active in conducting the assessment and selection of classified technology. This is caused by the fact that the major technologies of the company are fully supplied by its principal. Technology Acquisition For the technology acquisition factor, SRM’s score is 2. SRM realizes the importance of sources of knowledge from the outside and utilizes them. The mechanism used by SRM to gain knowledge from outside is to send employees to attend training. The company is active in regularly sending employees for training in Japan. The company also absorbs much knowledge from its principal that is a worldclass company. Another mechanism at the company is to use the service advisor from Japan who is an expert in the field of automotive painting. Implementing and Absorbing Technology For the implementing and absorbing technology factor, SRM’s score is 1. This means that because the company has little experience in project management, it is easy to lose control of a project. SRM was not able to show clearly how the company managed the absorption of technology. The company only makes innovations in the design of the painting system based on its creativity. Communication within the company is accomplished through several routine meetings. The company conducts weekly meetings between departments. In addition, each month the company also 78 conducts management review. In those meetings, there is cross-functional communication among departments. In the weekly meetings of each department, the problems faced by the department are discussed and solutions are proposed. Learning For the learning factor, SRM’s score is 2. This means that the company runs some basic reviews of projects in progress, but these tend to be irregular and informal. SRM regularly sends employees for training in Japan. Learning in the company is also accomplished through guidance provided by senior employees to junior employees. Guidance is certainly related to knowledge of the production processes that take place in the company. In addition, the company also learns knowledge from its principal. Exploiting External Linkages For the exploiting external linkages factor, SRM’s score is 3. This means that the company knows external sources of knowledge but its awareness is limited to a narrower field and is used temporarily. SRM has been using an external source that is derived from the government, rather than the Ministry of Cooperatives, and SMEs in the form of opportunities for benchmarking with other automotive companies. Another external source utilized by the company is the university through an internship program. Students from the university are given an opportunity to intern at the company. 3.2.6. PT. SC SC was established on April 21, 2010, and is located in Industrial Town Cibitung, Bekasi. The company obtains its capital from its principal, Toyota Auto Body Co., Ltd 79 Japan. In November 2010, the number of workers at SC was 1,357. SC produces various automobile parts from plastic/resin. Awareness For the awareness of technology factor, SC’s score is 2. The company argues that there is no radical technological change in automobile technology, so technology is not its main concern. SC’s main source of technology is its principal company. Therefore, SC does not develop its own technology whereas the principle does. Procurement of new machines comes under the authority of the principal through the Toyota trading company. SC has already achieved customer loyalty because of its good project references, and this is also a source of its competitiveness. Searching For the searching technology factor, SC’s score is 2. Safety is customers’ main concern in terms of receiving orders. There are two kinds of safety. The first one refers to the safety in production process in factory and the second one refers to the safety in using their product (components of car). SC also considers QCD as a factor affecting customers’ decisions on buying products. SC considers that different customers have different requirements, especially on product quality. For example, a customer in Malaysia has a tropical climate requirement on the quality of material while a customer in the Middle East has a desert climate. Desert climates have more extreme weather changes than tropical climates, so the specifications on materials are different. Building Core Technological Competence For the factor of building core technological competence, SC’s score is 3. Safety, 80 quality, cost and delivery are factors that affect customers in placing orders. To create future advantage, SC implements continuous improvement based on Kaizen concepts. The improvement is not only on the production process but also on the management process. SC also improves employees’ capability through training, such as Asakai time. In choosing and implementing new technologies, SC has full support from its principal company. Technology Strategy For the technology strategy factor, SC’s score is 2. SC has full support from its principal. The principal company develops technologies in its own R&D unit. SC also has its own R&D unit, although it is still limited in design development and turns out only small improvements to the production process. Improvement in the production process such as development of robotic devices can increase productivity. Assessing and Selecting Technology For the assessing and selecting technology factor, SC’s score is 2. Its principal plays a great role in assessing the requirement of a new technology in SC. New technology is selected by the principal through several feasibility tests. In this assessment process, the company will inform the principal about the condition and the requirement of the production process. The principal develops the technologies in its R&D unit. Technology Acquisition For the technology acquisition factor, SC’s score is 2. The proportion of SC’s technology from external parties is almost 100% because the company gets its technology from its principal. The R&D unit in SC only develops simple 81 improvements in the production process and product design. Management of new technology implementation is by training the company’s employees to operate the new machine. Technically, the operator for the new machine will be trained by the trainer from the principal company, until the operator acquires the skill to handle the new machine properly. Implementing and Absorbing Technology For the implementing and absorbing technology factor, SC’s score is 3. The company manages production risk through Asakai. In the Asakai activity, each employee should evaluate all risks that may occur when doing his job. In every employee’s work place, there are some notes about the risks that may occur and how often these could occur. SC usually implements new technology when it gets a new project by instruction from its principal and the customer through intensive communication. Management of the implementation of new technology is by training an employee to operate the new machine until that operator is ready to handle the machine properly. Every employee also has an activity sheet that will remind them about what they should do. Cooperation and communication between different functions in the company is managed by arranging several meetings. Learning For the learning factor, SC’s score is 3. The performance of SC is always evaluated by its customer. Safety is evaluated from the frequency of accidents that happen in a certain period. Quality is evaluated from the parts per million (ppm) defects of production. Delivery is evaluated by the frequency of shipment delays that happened in a certain period. Cost is evaluated from the company’s productivity. 82 Mechanisms of continuous improvement (Kaizen concepts) are in place to enable learning by continuous employee training. In addition, the company usually sends its employees to join training at the principal. SC also learns from the state-of-the-art that has been chosen by the principal company. Exploiting External Linkages For the exploiting external linkages factor, SC’s score is 1. SC did not obtain any benefit from external sources of technology except from its principal. This situation limits the opportunity for SC to capture sources of technology externally. 3.2.7. PT. IGP IGP was established as a private domestic investment company and at the moment has an area of 63,300 m2 and 671 employees. IGP mainly manufactures rear axle and propeller shafts. It has decided on a mission to become a reliable drive shaft and drive axle manufacturer, with a vision to become a company with competitive advantages in the global market. In Indonesia, IGP is the only company working in the rear axle and propeller shaft manufacturing sector. But in Southeast Asia, it has to compete with companies from Thailand. Awareness For the awareness of technology factor, IGP’s score is 3. IGP has proven that technology is one of the factors that influence a firm in obtaining clients. This experience shows that a company would lose opportunities if it did not improve its technological capability. The importance of technological capability, specifically in designing, has become the main focus of the company. Quality is one of the factors 83 which determines the competitiveness of a company. Actually, IGP has been aware of the technological breakthroughs in rear axle and propeller shaft manufacturing carried out by Thailand companies. Searching For the searching of technology factor, IGP’s score is 2. IGP understands factors that determine its competitiveness. These consist of price and non-price factors. The non-price factors are quality and the reputation of the company gained from past transactions with customers. The company’s reputation has been achieved from the track record of its previous works. IGP has yet to place technology as its main strategy in competing with other companies. Because IGP is the sole rear axle and propeller shaft manufacturer in Indonesia, the company argues that without being innovative, it can still gain customers. Building Core Technological Competence For the factor of building core technological competence, IGP’s score is 2. The company has no local competitor because of the high difficulty in manufacturing those products. The manufacturing operation needs particular knowledge in applying the welding process. This welding technology is IGP’s core competence. Besides, the company is attempting to maintain its competitive advantage by implementing the Kaizen principle, namely gradual and continuous improvement. IGP is undertaking improvement in propeller shaft and rear axle designs to create more advantages in the future. The company advances the designs to fulfill customers’ demands and to boost its competitiveness. Customers’ demands of their suppliers will keep rising, and one of their concerns is companies’ capabilities in designing products. 84 The main basis of IGP in choosing technology is the customer’s needs and requirements. Technology Strategy For the factor of technology strategy, IGP’s score is 2. In Indonesia, IGP is the single player, while in Southeast Asia it has competitors from Thailand. The position as a single player has discouraged IGP from becoming an innovative company, which is shown by the absence of an innovation unit in its R&D department. As long as the company still gains customers’ loyalty, its attention will focus on how to meet customers’ demands, not on how to improve technology. The advancements done by IGP are still simple. Although the company has not advanced its technology yet, IGP has made improvements in product design. Customers’ demands always increase and they request the company to always develop the product design. Assessing and Selecting Technology For the assessing and selecting technology factor, IGP’s score is 2. The company obtains technology through a stock release mechanism and the purchasing of production machines. As the new machines stock release has a strong relationship with investment, a fit-and-proper test for the investment is required before purchasing. In purchasing new machines, the company has various choices of machines. There are two factors considered by IGP in choosing machines: appropriateness with customers’ demands and proper economic investment. Technology Acquisition For the technology acquisition factor, IGP’s score is 2. The company has a mechanism for obtaining knowledge from external sources, such as customers, 85 suppliers, and the Internet. IGP utilizes information from customers which is mainly related to improvement in the production process. Information from suppliers is usually about the trends of new machines and materials used by the company. Information from competitors is obtained by comparing the technology utilized by IGP with the technology of competitors. The company also has an awareness of the importance of up-to-date information, so it is able to follow market demands. Implementing and Absorbing Technology For the factor of implementing and absorbing technology, IGP’s score is 3. The company has good management in finishing clients’ orders, as revealed by various awards received from customers as symbols of satisfaction. In terms of risk management, IGP does not have a special department for this yet. The company conducts risk management in the production plant through the General Affairs department. This department manages risks that include environment, health, and safety issues. The company organizes a work meeting every year to discuss the annual planning cycle. Cross-communication in the company is built through numerous regular coordination meetings, including order reviews and price reviews, which entail all functions in the company. Learning For the learning factor, IGP’s score is 3. The learning mechanism implemented by the company is for gradual and continuous improvement based on the Kaizen principle. IGP also regularly sends employees to many kinds of training, both in Indonesia and Japan. Since 2009, IGP and other companies under the IGP group have organized in-house training and invited professors from Bandung Institute of 86 Technology (ITB) for seminars and workshops about the latest automotive technology improved by ITB. Exploiting External Linkages For the factor of exploiting external linkages, IGP’s score is 3. IGP utilizes information sources and external knowledge coming from customers, competitors, vendors, and the Internet. Information is usually obtained in the form of production process improvements compared to other customers’ suppliers, and as technology expansion in the form of the latest machines. The company also searches for information about the technologies and processes of propeller shaft and rear axle manufacturing through the Internet. In addition, IGP regularly invites professors from ITB to join the in-house seminars and workshops. 3.2.8. PT. AWI AWI, founded in 2006, is located in Kelapa Gading, Jakarta. AWI is a jointventure company with 49% of shares held by IGP and 51% by the company’s principal from Japan. AWI is engaged in the assembly of automotive transmission components. This company has only one customer, Daihatsu Motor Japan, because it is a subsidiary of Daihatsu Motor Japan. Awareness For the factor of technology awareness, AWI’s score is 2. AWI believes that the mastery of technology plays an important role in corporate competitiveness. But today, AWI is only conducting the assembling process, and it does not manufacture transmission components. Therefore, this company believes that so far it does not need 87 to develop technology because assembling does not require high technology. Searching For the searching technology factor, AWI’s score is 2. AWI is a joint-venture company established to meet the demands of Daihatsu. The company is bound by an agreement with its principal, so it only has one customer, which is Daihatsu. Daihatsu Japan as AWI’s customer has a requirement in choosing AWI as its localization. The customer controls the priorities of the company, especially in terms of quality and technology. Building Technological Core Competence For the factor of building technology core competence, AWI’s score is 2. The company has advantages compared to its competitors, including lower prices. Another company strategy is to develop a general assembly line that could be used for assembling various types of components. The company creates some innovations that serve as improvements to the production process, reducing the cycle time. The company does not have an R&D division, and there is only the localization unit. This localization unit provides recommendations to Daihatsu Japan when there is a local component or material that may be used. But the final decision remains in the hands of the principal. Technology Strategy For the factor of technology strategy, AWI’s score is 2. To develop its technological capability in the future, this company plans to absorb technology from Daihatsu when Daihatsu is localized in Indonesia. AWI will learn about the manufacturing processes of transmissions, ways of measurement, and the factors 88 involved in the eligibility standards of the product. After successfully learning these things, the company will carry out product re-engineering in order to produce the components itself. The company’s concern is product testing. Procedures for testing and the quality-testing technology are not yet available in Indonesia, so it will be difficult to convince customers because the company has not proven the quality of its own designs. Assessing and Selecting Technology For the factor of assessing and selecting technology, AWI’s score is 1. AWI is a company engaged in the assembly of automotive components, so the technology used is not high technology. As the assembly process involves assembling some components, the value added of this process is also low. The company is obtaining all the technology of its principal in Japan. The decision to bring in and change technology is strictly by the authority of the principal. Technology Acquisition For the technology acquisition factor, AWI’s score is 1. The proportion of the technologies used in the company is 100% from its principal in Japan. The company stated that there has been no transfer of technology by its principal. So far, the principal only provides information about the check point or control point to ensure the quality of products assembled by the company. Implementing and Absorbing Technology For the implementing and absorbing technology factor, AWI’s score is 2. The company is doing risk management on work orders by setting a buffer stock for a particular component to prevent any delivery delays. The company does not have 89 accident risk management because it assumes that assembling is a safe process with a low risk of accidents. Communication in the company takes place through interdepartmental meetings conducted once a week. Besides the mechanism of meetings, communication is also established through the joint core activity which is conducted every morning. In this activity, every section will provide information about issues still pending from the day before, for discussion on what should be done today and what would be the next target. Learning For the learning factor, AWI’s score is 3. AWI has a series of training packages for each level in the company, such as training for the supervisor’s level and a training package for the operator and manager level. In addition, the company provides additional training materials in the form of organizational culture and the type of product. Learning in the company is also carried out by applying the concept of Kaizen for gradual and continuous improvement. In addition, the company does benchmarking with other Daihatsu suppliers to follow the development of methods and processes that may be applied in AWI. Exploiting External Linkages For the exploiting external linkages factor, AWI’s score is 3. External sources used by the company are still very limited and only from Daihatsu principals and other suppliers. The company uses the principal as its sole source of technology. In addition, the company is capitalizing on Daihatsu’s other suppliers with a benchmarking mechanism. 90 3.2.9. PT. TKM TKM is an SME engaged in manufacturing parts for machining and the manufacture of jigs. It was established in 2002 and is located in the JABABEKA Industrial Area is a private domestic investment company. Currently, it has45 workers. It serves 90% of which are in the automotive industry. Awareness For the awareness of technology factor, TKM’s score is 2. TKM acknowledges that technology may affect the competitiveness of the firm. The influence of technology at the company is primarily in the production process. The company is also aware that the needs of customers in the market are increasing. The company needs to develop the technology to be able to keep up with customers’ needs and market demands. It develops technologies especially for application to the repairing process. Searching For the factor of searching technology, TKM’s score is 3. The company has a lot of competitors and the majority of them are SMEs. TKM has been able to identify the factors that affect receiving orders from customers. These consist of price and nonprice factors. The quality factor is the focus of the company for getting orders from customers. This company already has ISO TS as a guarantee of product quality. In addition, delivery accuracy is a factor considered in customer orders. Building of Technological Core Competence For the building technological core competence factor, TKM’s score is 3. TKM has two divisions, which are the division that manufactures the spare parts and the division that develops production machinery. The development of this production 91 machinery becomes a competitive advantage for TKM. The company’s basic principle in the development and production of machines is to customize and modify the principles that already exist in production machines on the market. The main technologies used are the same as the existing engine, and then the company makes some modifications and customizations as additional functions of the machine to meet the customer’s needs. The company does not attempt to patent the machines that it developed, because the patents would be difficult to obtain. It does not use patents of machines that it develops to boost its competitiveness. However, competitiveness is supported through other efforts. The efforts are always aimed at providing added value to customers, one of which is to give good after-sales service. Another attempt is to establish standard operating procedures and evaluate the extent of implementation. Production machinery maintenance is also a concern of the company. Technology Strategy For the factor of technology strategy, TKM’s score is 3. The company believes that technological developments in the automotive industry, especially in manufacturing, are evolving gradually and over a relatively long time. The company has not set a specific technology strategy that it will use to build core competence. The limited technology development of the company is a reaction to meeting customers’ needs in the market. The company’s core competence is in the development, modification and customization of production machinery in accordance with customer requirements. The experience and creativity of human resources in TKM are driving the emergence of the company’s ability to create its own machines. In the long term, the company 92 will not only develop machines but will also attempt to expand its business through the development of after-market products. In terms of quality, the company will also make improvements to maintain ISO TS. Assessing and Selecting Technology For the factor of assessing and selecting technology, TKM’s score is 2. In technology development, TKM has two options, namely to develop its own technology or to buy from outside vendors. There are two things considered as a basis for choosing, which are the company’s technological capabilities and the ability of corporate investment. So far, the company is able to build the machines that were ordered by the customer through the customization and modification of existing machines on the market. The second option is that the company would buy the machines from external parties to obtain the required technology. This option usually comes up when the company has to manufacture certain products that require new technologies which it does not own. Absorption of foreign technology in the form of purchases of machinery is a corporate investment decision. Technology Acquisition For the technology acquisition factor, TKM’s score is 2. TKM uses knowledge resources from outside and employs the knowledge to make improvements in the company. This company has two divisions, namely a job order division and a mass production division for automotive components. The first division is absorbing knowledge by doing some imitations of production machinery made in Japan. The division of mass production is utilizing external sources of knowledge in the form of books/journals and information from its competitors. The mass production division 93 also benefits from the mass production knowledge of competitors. In addition, TKM utilizes external sources of knowledge through various exhibitions and training. The proportion of technology that the company sources from outside is as much as 95%, while technology it owns makes up 5%. Implementing and Absorbing Technology For the factor of implementing and absorbing technology, TKM’s score is 3. The execution of the project is initiated by the engineer who translates customer requirements in the form of design drawings. Once the design is approved by the customer, the engine will be produced. The company conducts risk management in construction projects, part of which involves quality risk management. The buffer stock function anticipates when production might suddenly stop so as to maintain schedules and avoid delivery delays. The company also conducts management of the risk of work accidents. All employees are covered by company insurance and the standard use of personal protective equipment during their work. The company does not have a scheduled communication mechanism. Meetings are held only when there are some problems with production, and these meetings do not involve all the divisions in the company but are only a part of engineering and production. Learning For the learning factor, TKM’s score is 2. TKM uses information from competitors, especially as relates to their methods or processes. The company usually compares the methods or processes used by competitors to the methods used in TKM. If there are differences in the process, the company will seek more information about 94 the process. Then it will experiment with the process, and if proven that it could increase production efficiency, then the process will be incorporated by the company. TKM does not have an internal learning mechanism because the company is focused on production orders. Learning from the outside is done by sending TKM employees for training facilitated by private parties or by the government. Exploiting External Linkages For the factor of exploiting external linkages, TKM’s score is 3. The company exploits knowledge from external sources such as competitors, the private sector, and the government. The company gains knowledge about the methods and processes from its competitors. It also receives training in both managerial and technical fields from the private sector and the government. In addition, the company utilizes knowledge from machinery developers in Japan and modeling technology used in the machines. 3.2.10. PT. GT GT was established in 1998 as an SME and started operations in 2000. This company is capitalized by 100% domestic direct investment and is currently serving domestic and foreign customers. GT is located in Cikarang, Bekasi. The company is specialized in dies manufacturing, jigs, checking fixture, and parts stamping. The majority of components made by the company are for two-wheel vehicles (90%), with the rest for four-wheel vehicles (10%). Awareness For the factor of awareness, GT’s score is 2. GT acknowledges that technology affects the company’s competitiveness. Improvement in production machines which 95 have been done by GT itself can save on production costs because the improvement cost is much smaller than the price of new machines. Machine development also provides the benefit of technology mastery because the company has the ability to expand its capacity not only as a technology user but also as a technology designer. Continuous improvement in the production process is expected to boost the company’s competitiveness, especially in production costs and processing time. Searching For the factor of searching technology, GT’s score is 3. The factors influencing customers to make transaction deals with GT are quality, price, and delivery service. Price is the customers’ main consideration. GT is currently in the process of requesting ISO 2001. The company also keeps improving the production process to shorten cycle time so that it can finish orders faster. Besides that, GT also has to build close relationships with customers. Visiting the customers is one type of after-sales service from the company. Building Core Technological Competence For building core technological competence, GT’s score is 3. GT has not had special or unique competency compared to its competitors. In terms of technology, GT and other companies utilize the same level of technology. GT realizes that there are other factors besides price that influence customers’ decisions on whether to place purchase orders. The non-price factors are quality, delivery service, and close relationships with customers. The company improves its production process, for example, by modifying production machines to advance efficiency, and by making production supporting tools in some processes. 96 Technology Strategy For the factor of technology strategy, GT’s score is 2. In its technology strategy, GT attempts to improve technology through equipment and production machines advancement. However, this equipment advancement is still limited to modifying the machines and making its own production machines. The company does not yet have enough knowledge about technology, and improvement of this should be a priority. Thus, the company still considers the market condition in improving technology, meaning that it is concerned about the technology utilized by competitors. The company does not yet have a clear idea of technology improvement in the future. Assessing and Selecting For the factor of assessing and selecting technology, GT’s score is 2. The company has two sources of technology improvement, which are external and internal. But mostly, it comes from outside. Technology obtained externally is from buying production machinery. But there are some technologies that the company improves by itself. The chosen technology has to be able to provide concrete improvement results on the production process. Examples are technology which can reduce the number of rejected products and technology which may shorten the product time cycle. Decisions on choosing technology from external parties have a strong relation with investment. Technology Acquisition For the technology acquisition factor, GT’s score is 2. Generally, the company does not have a clear and programmed technology absorption mechanism. The process of technology absorption is applied only if there is a need for additional new machines. The mechanism used by the company to gain knowledge from external sources is 97 undertaken through, for example, regular monthly meetings facilitated by the YDBA. GT gains information about the technologies and processes used by competitors which may be relevant and applicable for the company. It also obtains information from outside by participating in exhibitions related to technology advancement in the automotive industry. Furthermore, the company actively searches the Internet for the latest information about various methods of production process improvement. The proportion of technology used in GT is 90% from external sources and only 10% from the company’s own development. Implementing and Absorbing Technology For the factor of implementing and absorbing technology, GT’s score is 2. When the company has a new purchasing order, it forms a team consisting of people from management, the engineering department, and the production department. The team will discuss needs such as materials and production machines, and it arranges the schedule of the production process. Production scheduling is also important because the company has to consider its capability in meeting customers’ requirements regarding delivery service. The company applies risk management through the buffer stock mechanism that is used to anticipate particular circumstances such as a sudden interruption in the production process. GT does not have a continuous communication mechanism yet. Communication is not regularly arranged in meeting activities, but only when there is a problem in the production process. Learning For the learning factor, GT’s score is 1. The company searches for information about competitors’ technologies and production processes. 98 This information is obtained from monthly meetings facilitated by the YDBA. In these meetings, the participants share their knowledge with each other. They discuss the technology and production processes used in their companies. Exploiting External Linkages For the factor of exploiting external linkages, GT’s score is 3. One of the external incentives utilized by GT comes from the government, or the Ministry of Industry to be specific, in the form of guidance cost and ISO certification cost. GT is currently in the process of requesting ISO 2001 as facilitated by the Ministry of Industry. Furthermore, the ministry often invites SMEs to participate in seminars or workshops. 3.3. Stylized Findings from the Interviews From the 10 firms interviewed, their weaknesses in technological capability seem to be in the areas of assessing/selecting technology and acquiring technology. In the area of assessing/selecting technology, they do not have sufficient information on the technological options available or a clear framework for assessing the options or choosing the most appropriate one to suit their needs. Respondents with the lowest score in this area are SRM and AWI since their technology is fully supplied by their principals. The other respondents are also weak in assessing and selecting technology since they select technology exclusively on the basis of price. In assessing the technological options, they do not consider other factors such as the effective use of the opted technology with the firm’s needs and the possibility of extending the utilization of the selected technology. Therefore, choosing technology with price as the only consideration is a risky activity since the chosen technology may not be properly in accordance with the company’s technology needs and long-term vision. 99 Another weakness of the respondents is in the area of technology acquisition. Most respondents acquire technology from outside sources. Purchasing machines is the most common method. They do not combine this with trying to develop the machine in-house. This may indicate that the learning process of the firms’ personnel does not occur in the technology acquisition process. Even more, AWI reported that it does not have a process of adopting new technology since the technology it uses is the responsibility of its foreign principal. There is only one company, NL, which reported usage of both internal and external sources in acquiring technology. This firm asserts that its technological capability is improved through the self-development of technology. As for the strengths of all respondents, building core technological competence, implementing technology, and learning seem to be the strong areas of their technological capability. As for core competence, most firms mentioned that their competitive edge is not only cheap products but also good quality and in-time delivery because many buyers require QCD for their purchasing. However, they are not actively seeking and developing new technology for their future competitive edge. Four firms revealed that their competitiveness is only in price as competitors have the same technology as they do. Regarding technology implementation, five out of 10 respondents are skilled in project management and have risk management frameworks. Before implementing new technology such as operating the machine, AGI usually sends its engineers abroad to learn how to operate the machine. In addition, the company also has daily routine control as its risk management mechanism. Four respondents are skilled in project management as they also have cross-functional communication in the progress of the project, but they do not have a clear framework 100 in risk management. One firm has little project management experience and no risk management. This may cause implementation of technology-based projects to go over budget or over schedule. With regard to the learning process, most respondents learn from the past technology-based projects either formally or informally. Six respondents always formally review the projects which have been completed and take lessons from that experience. Respondents also benefit from meetings conducted by the YDBA, where companies exchange knowledge and information in the meetings. In brief, the technological capability of automotive companies in this survey may provide signs about the capability of all automotive companies in Indonesia. They seem to focus on short-term gains in their business as they excel in meeting demands with QCD criteria, managing the assigned projects well, and learning from the experience. However, they seem to not have long-term technology strategies, as most of them have not started research and development and do not put technological learning as a priority when selecting technology or other activities. 4. Policy Implications According to Tsuji and Miyahara (2010), the innovation capability of firms is related to the patent rights, the top management having experience in MNCs (multinational companies), engineers being college-level graduates, and the granting of licensing technologies from MNCs. Therefore, the shortcomings of the Indonesian automotive manufacturing firms in technological competence may relate to these factors. On the other hand, the possibility of a company being substituted by other companies to be the supplier of the regular buyer would enhance the awareness of the 101 company to maintain or improve its technological capacity. Since few respondents pointed out that they are sole suppliers to certain buyers, they do not upgrade their capacity due to the constant demands from customers. Therefore, some factors require attention in order to boost the technological capacity of Indonesian automotive firms. Human resources should be developed in order to strengthen firms’ capability to absorb technology spillover from linkages with other companies/institutions. Experiencing job assignments in MNCs and having at least college-level education for engineers may assist the development of human resource and, thus, promote innovation capability. Moreover, a pro-competition policy environment is needed to induce firms to raise their technological capacity. Improving the ease of doing business is also a policy measure that would encourage entry into the industry, which would then produce more competitive establishments. 102 REFERENCES Aswicahyono, H. and P. Kartika (2010) “Production Linkages and Industrial Upgrading: Case Study of Indonesia’s Automotive Industry” In Fostering Production and Science & Technology Linkages to Stimulate Innovation in ASEAN ed. Patarapong Intarakumnerd and Yasushi Ueki. ERIA Research Project 2009, No 7-4. Jong, J.P.J. de, and E. Brouwer (1999) “Determinants of the Innovative Ability of SMEs: Literature Review,” Zoetermeer: EIM. Jong, J.P.J. de, R. Kemp, and C. Snel (2001) “Determinants of Innovative Ability,” Research Report 0010/A, Zoetermeer. Romijn, H. and M. Albaladejo (2000) “Determinants of Innovation Capability in Small UK Firms: An Empirical Analysis,” QEH Working Paper Series-QEHWPS40. Tsuji, M. and S. Miyahara (2010) “Empirical Analysis of Information Linkages and Capability in ASEAN Economies: Case of Indonesia, the Philippines, Thailand, and Vietnam” In Fostering Production and Science & Technology Linkages to Stimulate Innovation in ASEAN ed. Patarapong Intarakumnerd and Yasushi Ueki. ERIA Research Project 2009, No 7-4. World Bank “Audit Tool for Measuring Innovation Capability,” http://info.worldbank.org/etools/docs/library/86442/ses1.2_innovationcaptool.p df. 103 CHAPTER 3 Internal and External Resources for Enhancing Innovation Capabilities – An Exploratory Study based on Cases from Malaysian Automotive Sector Avvari V. Mohan Nottingham University Business School University of Nottingham - Malaysia Campus The Malaysian automotive sector is an interesting case in the region, given that it is anchored by large national vehicle manufacturing firms which have been protected by several policy measures along with foreign assemblers. More recently the market is getting liberalized with more choices for customers on one hand and more competition for the national vehicle makers and also for the automotive parts and components industry in general. This offers the backdrop to this exploratory study on innovation capabilities in the Malaysian automotive sector based on cases developed through interviews in the field. Overall findings indicate the sector itself is dominated by supplier firms that are mostly involved in not so high tech parts like plastic or metal parts and there is little by the way of product innovations and most innovations would be towards changes in processes (this is with the exception of the two national car manufacturing firms Proton and Perodua which have the full set of the value chain activities involved in automobile product design and manufacturing). The foreign players have been mostly assemblers and while are well linked in terms of intra-firm networks with access to technological resources this does not seem to have spilled over to the supplier firms – offering an option for policy to leverage this resource as done in the electronics sector. While there are indications that several of these firms are passive in terms of innovation activities / capabilities and could be in the danger of not being competitive if they lose their anchor customer – there is anecdotal evidence where firms (small and large) have become competitive and gone into export markets by developing external linkages and internal resource developments thus overcome barriers to limited resources or markets size for innovation. 105 1. Introduction 1.1. Introduction to Malaysian Automotive Industry and Report Outline The Malaysian automotive industry is considered to be one of the important and strategic industries in the nation’s manufacturing sector. The industry started with humble beginnings in the 1960’s assembling cars for European and Japanese car making companies, prior to which cars were imported in the CBU form. Today it has grown to having four manufacturers of whom two are car manufacturers, several assemblers and a fairly large component manufacturing sector. This report presents findings from exploratory case studies regarding how firms in Malaysian automotive sector attempt to enhance their innovation capabilities. In the first section an overview of the Malaysian automotive sector is presented followed by the aim and approach of the study. In the next section the (mini) cases developed from interviews conducted in the field are presented. Following the cases section, findings gleaned from the cases are presented and policy implications are drawn. 1.2. A Brief History of the Malaysian Automotive Sector The Government of Malaysia through the recommendation of Colombo plan experts began to develop and encourage the automotive industry in its country. Since the implementation of the National Economic Policy (NEP) of 1971, the government had played an important role in shaping the Malaysian automobile industry. It had drawn up policies and had set up a regulatory framework according to which interested players in this industry were expected to start production of cars and automotive 106 components locally. In addition to this the government also imposed certain taxes and a tariff system on the import of cars, through which it hoped to discourage people from patronizing cars that were produced and assembled outside Malaysia. The assembly plants that were set up were mainly joint venture projects between European auto manufacturers and partners. But it was the establishment of Proton in 1985 and Perodua in 1993 that acted as the main catalysts to the development of an indigenous automotive sector in Malaysia, and that helped to spawn a sector of components and parts making firms across the value chain. The Proton project was a joint venture enterprise with Mitsubishi enterprises, corporation of Japan, began production of its first car ‘SAGA’ in 1985. It was given a preferential treatment with respect to taxes and duty rates as it was not only promoting industrial linkages but also having a national identity / brand. The second local automobile manufacturer PERODUA, established in 1993 which launched their first car, the Perodua Kancil in late 1994. It mainly produces superminis and therefore does not actually compete with Proton for the same market niche. Together they dominate the passenger car market in the Malaysia. 1.3. Current Status of the Automotive Sector in Malaysia Malaysia’s automotive sector’s development over the last 30 years has been dependent on the protection policies by the government. Liberalization of the industry is considered to be slow. Several regulatory measures are there to promote the national car producers, Proton and Perodua. Having said that, under the ASEAN Free-Trade Area (AFTA) agreement, there has been a reduction in import tariffs, after having secured a two-year deferral from ASEAN. 107 Import tariffs on completely built-up (CBU) units have been were reduced from a band of 70-190% to 20% at the start of 2005. For completely knocked-down (CKD) kits, the import tariff has been cut from 25% to zero. Import duty on CBUs was cut further, to just 5%, in March 2006. All this has resulted in new dynamics in the automotive market particularly the cars market. As of today there are four passenger and commercial vehicle manufacturers (including Proton and Perodua) and one motorcycle manufacturer, Modenas. There are also 9 motor vehicle assemblers and 9 motorcycle assemblers. To support the manufacturers and assemblers, there are 500 + motor vehicle components and parts manufacturers, of which 23 are Tier 1 status. In turn, there are 100 motorcycle components and parts manufacturers (Source - Malaysian Automotive Association). Table 1: Summary of Passenger & Commercial Vehicles Produced and Assembled in Malaysia for the Year 1980 to December 2010 Year Passenger Cars Commercial Vehicles 4x4 Vehicles Total Vehicles 1980 80,422 23,805 - 104,227 1985 69,769 37,261 - 107,030 1990 116,526 63,181 11,873 191,580 1995 231,280 45,805 11,253 288,338 2000 295,318 36,642 27,235 359,195 2005 422,225 95,662 45,623 563,510 2006 377,952 96,545 28,551 503,048 2007 403,245 38,433 - 441,678 2008 484,512 46,298 - 530,810 2009 447,002 42,267 - 489,269 2010 522,568 45,147 - 567,715 Note: (i) Passenger Vehicle industry reclassified in January 2007 and includes all passenger carrying vehicles, i.e. Passenger Cars, 4WD/SUV, Window Van and MPV models. (ii) Commercial Vehicles also reclassified on 1 January 2007 and include Trucks, Prime Movers, Pick-up, Panel Vans, Bus and Others. Source: Malaysian Automotive Association (MAA) (http://www.maa.org.my/info_summary.htm). 108 After the fall in sales due to the 2008 financial crisis, sales of motor vehicles for the first three months of 2010 increased by 22.4% to 147,415 units compared to the same period last year. Correspondingly production of vehicles is also supposed to have increased. While the manufacturing sector in Malaysia contributes about 29% to the nation’s GDP, and the automotive industry’s contribution to the GDP has increased from 20% in the 1970’s to about 29% currently. The sector employs almost 200,000 people. Malaysia has the highest level of passenger-car sales in the Association of South-East Asian Nations (ASEAN). Passenger car registrations in Thailand, its closest rival in the region, totalled 191,400 in 2006, compared with 367,000 for Malaysia (Sourced from - http://www.ssig.gov.my/ssig/kcent/material/Speech_by_minister_of_MITI_Jun_9.pdf and the Economic Intelligence Unit website). 1.4. Key Players in Malaysian Automotive Sector The automotive market is dominated by the four manufactures and in the cars market it is essentially a duopoly controlled by the two national manufacturers, Proton and Perodua. These two firms, along with two other "national" manufacturers, Hicom MTB and Industry Otomotif Komersial (Inokom), account for over 70% of car sales. Proton, the first indigenous carmaker, when it was set up in 1983, was a collaboration between the Malaysian government and Mitsubishi corporation. Today the government holds a majority stake in the company (through Khazanah Nasional). In 1996, Proton acquired a stake in Lotus engineering and increasing it in 2003 giving it engine making and other capabilities. Despite these moves Proton has lost its market 109 share. In 2005 Perodua overtook Proton as the largest market share holder in the in the commercial-vehicle market. Another important development was in 2002 when Perodua sold a 41% stake to Daihatsu Motor of Japan to gain access to production and management skills from Daihatsu (which is itself a subsidiary of Toyota). In 2002 a third national car manufacturer, Inokom, was established by the local Berjaya Group and Hyundai Motor of South Korea (Renault of France also has a stake). Inokom manufactures subcompact cars. The fourth national manufacturer, Malaysian Truck and Bus (MTB), is owned by Isuzu Motor of Japan and DRB-Hicom, a Malaysian conglomerate. Naza, a privately owned Malaysian company is the fifth manufacturer when in April 2006 it launched its own compact car for sale in the domestic and overseas market. Automotive assemblers are estimated to have a total capacity of around 600,000 units a year. Assemblers include Asia Automobile Industries (assembling Mercedes, Mazda and Kia vehicles), Toyota Assembly Services, Associated Motor Industries (BMW, Ford and others) and Volvo Car Malaysia. The domestic automotive-parts industry includes around 550 companies, manufacturing for both domestic vehicle manufacturers and assemblers of foreign cars. Around 70% of production is for the original-equipment market, with the remainder dedicated to the part-replacement market or to exports. While local content is around 80% for the national car makers Proton and Perodua; for cars assembled (but not manufactured) in Malaysia it is around 35-40%. But this still consists of relatively low-value parts, such as body panels, electrical components, drive transmissions, trim and upholstery. The manufacture of engines is confined to a few types, leaving Malaysia dependent on overseas supply for a more comprehensive range of engines. 110 Malaysia also has to import electronic components for vehicles. But the full abolition in 2004 of the Mandatory Deleted Item Policy, which prohibited car assemblers from importing certain components, has gone some way towards enhancing the competitiveness of some of the component makers. Overall the Malaysian market for automobiles, particularly cars, is considered a fairly attractive enough one for several global players to be part off. There are several Japanese, European and more recently Korean players have also made inroads into the market. But the major concern for the government is Malaysian automotive exports are small compared with those from other ASEAN countries – around 95% of car production is sold domestically, with only a few successful niche markets abroad (for example for some models in the UK and Australia). There has been some growth recorded in the exports of parts and components (EIU website). Also there has not been much development of indigenous innovation capabilities in product development or even manufacturing design among the auto parts / component makers – most of them rely on designs to be supplied by the main vendor / customer and they develop abilities to deliver to these specifications (interview with Chief Procurement officer or large German Assembler) All this sets a backdrop for this study – which is gain an initial understanding of innovation related capabilities development in Malaysian automotive sector. 2. Main and Approach to the Study The main aim of the study is to understand what are the internal and external sources developed and linkages between firms and other actors / institutions for 111 enhancing innovation capabilities of firms in Malaysia’s automotive sector? The report is based on interviews of key executives from seven firms/cases supplemented with information from website sources. The details of the case firms are as below: Table 2: Details of Firms in which Interview were Conducted Name Type of Firm Type of Products Activity 1 Y& Metals Local SME Car Seat Brackets 2 ABC Manufacturers Proreka Local SME Car Seat Parts Large Local parts Supplier Plastic Interiors and Exteriors Large Foreign Parts Supplier (Tier 1) MNC Car Seats Design, Manufacturing & Sales Assembly & Sales Car Parts – Air Conditioner, Wipers etc Cars Manufacturing, Application Design & Sales. Assembly & Sales Design, Manufacturing & Sales Manufacturing & Sales Manufacturing & Sales 3 4 Company A American MNC 5 Company B Japanese Supplier 6 European Assembler MNC 7 Malaysian Manufacturer Large Manufacturer Cars 8-9 Suppliers Local SMEs Metal Parts 10 Supplier Local SME Wipers Process Design, Manufacturing & Sales Manufacturing Main Customer Perodua European Luxury Car Assembler Proton, Exports and Replacement Market Proton, Honda and others Local Car Manufacturers and Japanese Assemblers Malaysian Market Malaysian and Export Local Car Manufacturer Foreign Assemblers The respondents for the study were varied – but care was taken in selecting the person who has been involved in decision making related to design and manufacturing / innovation capacity building and would be able to provide the information needed for the study. In the case of small and medium firms – they were the Managing Directors of the firms, in the case of the large supplier firms they were the equivalent of the heads or directors of R&D /manufacturing or corporate division. In the case of the foreign car assembler it was the chief procurement officer. The interviews lasted between one to two hours. The questions schedule is based on the Innovation audit 112 tool developed by Hobday (2001) were centered around the following key dimensions identified – Initial awareness and searching out triggers for change, then looking at core competencies and development of a technology strategy, followed by assessment and selection, and acquisition, implementation and absorption of the technology within the firm. This if followed the issue of operation of the technology and learning about how best to use it. Finally the questions ask about the external linkages the firm developed to enhance their innovation capabilities. A simple content analysis is done to glean out issues emerging from the interviews. Findings are presented based on the key issues identified and some cross case analysis is attempted. A summary of interview of each firm is presented as mini cases and then findings are gleaned out and presented at the end. 3. The Cases from Malaysian Automotive Sector 3.1. Case of Y&L Metals 3.1.1. Profile of the firm Y&L Metals started off as a supplier in the electronics sector. The Owner / Executive director had experience in a European consumer electronics firm and then decided to go out on his own as a supplier. They have been in the metal stamping and tool and die supporting industries in Malaysia for more than 20 years. They apply the Toyota Production System in their operations. The firm is categorized as an SME with about 120 workers and RM 25 million turnover and for the automotive parts the main customer is one of the local car manufacturing firms. 113 3.1.2. Innovation capabilities building Awareness and Search – Scanning and Monitoring External Technology Events and Trends The first issue that affects all aspects of decision making, particularly technology related, is the low volume of Malaysian automotive market. This respondent of the firm feels that this aspect determines the investments and developments in technology or any investment related aspect in this sector. Quality, price and delivery are the 3 key factors for customers buying from them. In addition the service they provide. Product quality, customizations are more important factors followed by price / low costs and delivery. These issues are the same in both local and export markets. They scan regularly for developments in the industry though internet and trade publications. They plan to focus on the automotive sector and develop their competencies in the future and keep open to collaborative opportunities – with MNC customers for developing product design capabilities Generally in terms of manufacturing technology needed to produce the metal stampings products – the respondent indicated that they are aware of the latest technologies available for manufacturing. The executives in Y&L are regular visitors to firms (with high levels of automation) particularly in Japan, that use cutting edge manufacturing technologies. They seem aware even about the different materials used in their products and use high tensile materials that are similar if not superior to their competitors. They consider themselves not at the technology frontier – but more at appropriate levels – given the low volumes of demand in the market. 114 Competencies Developed, Technology Strategy and Assessing & Selecting Technology Their main capability is in Tool / Jigg design to support manufacturing of multiple products and be able to do this with low volume production at competitive prices while maintaining quality similar to competitors. In addition safety factor is the competitive advantage. For the future the focus will be developing capabilities in terms of “safety” aspects in their products. The technology strategy is essentially in process developments – focusing on reduction of time and increase quality consistency while eliminating waste and through this achieves price competitiveness. In terms of assessing and selecting technology (in this case manufacturing related) – the key customers are Japanese automobile firms and this has an influence in the assessment and selection of machines and related technology decisions. The assessment decisions and selection decisions are done in-house – the key executives in design, engineering and manufacturing are involved and occasionally they get assistance from an independent industry consultant. They attend international automotive shows and also visit firms in the industry in other countries to keep abreast of the technological developments. Acquiring + Implementing & Absorbing Technology Being a small firm – technology acquisition decisions are made internally. Key design and manufacturing executives and the executive director are involved. For the move to automotive sector – it can be said to be internal acquisition from the E&E operations and also for customization – their links with MNCs like Philips, Sony and Panasonic has helped them. Visits to other firms in the industry and some linkages to design 115 firms in other countries also help acquisition decisions of technology. The TS 16949 system where a lot of documentation is involved guides implantation and abortion – the feasibility study forms as part of the TS system takes care with 4 levels of risk assessments (stage gate approach) and also offers a project management approach. The small size of the firm ensures co-operation from the different relevant departments (in addition the TS system has a KPI that needs to reflect links between different units). Learning for Building Technological Competencies + Exploiting External Linkage and Incentives (like Tax Breaks, Grants etc) The TS 16949 system where a lot of documentation is involved and also the process and control system of TS 16949 helps in learning and documenting of the issues related to technological competencies. They also do some informal benchmarking within the industry. There is some linkage with other firms in the industry eg. Design firms in India, Japan and Germany. They hire / interact with international technical consultants in the industry. 3.1.3. Summary Overall this firm is interesting as it can classified as in the border of Type B and Type C firms – despite limited resources they have managed to identify their competencies and diversify from electronics sector to the automobile sector where they sensed opportunity (which the larger Japanese competitors were not able to fulfill) – low volume, high quality and low cost components to the local manufacturer of cars. The firm may be ‘trapped’ in a mature or slow growth sector, despite having exploited technology efficiently but they are considering the next diversification. Another constraint is also being considered – currently the key technical / engineering 116 personnel are all personal friends and have managed to attract a few younger staff – but they need to compete with changing behaviors in terms of aspirations of among new university leavers to add on to the technical team – as the MNCs attract most of the talent. In summary have good awareness and scanning abilities – exploit some external actors for information on technology. But limited to process related developments and are planning to develop product related design capabilities and open to collaborations. 3.2. Case of ABC Manufacturers 3.2.1. Profile of the Firm ABC Manufacturers is a Malaysian manufacturing firm producing seat related parts (including the covers) for a European luxury car maker. The firm is sole proprietorship and can be categorized as an SME with about 80 workers and RM 35 million turnover. 3.2.2. Innovation Capabilities Building While all other respondents in interviewed had unanimously mentioned ‘low volume’ as a critical constraint for technology related decisions – this firm had low-volume as a benefit or conducive to its competency development and performance. Awareness and Search – Scanning and Monitoring External Technology Events and Trends Quality and reliability are of critical importance as this is for the high-end / luxury sector. While they supply mostly for the Malaysian market, the factors that affect the business or in terms of technology choice is the same for local or export markets. Role of technology as such is considered minimum and all scanning or monitoring of technology related issues is done by the main customer (large European car 117 manufacturer) and passed on to the firm. Competencies Developed, Technology Strategy and Assessing & Selecting Technology The Managing director who was the respondent says that the whole firm culture is centered on developing workers with specialized skills ad invests heavily in training. The competencies are in producing high quality products with ‘precision and reliability.’ The firm is said to have developed strong process controls, quality processes and special skills groups for high quality production. For the future or any technology related priorities they look to the main customer to lead. Acquiring + Implementing & Absorbing Technology The main customer provides the specifications and the firm acquires the required process related technologies – the process / production technologies are modular and some reverse engineering type learning takes place for learning about absorbing technology. Learning – for Building Technological Competencies + Exploiting External Linkage and Incentives (like Tax Breaks, Grants etc) There is no technology transfer and hence no specific learning in the context of process of product related technologies e.g. Jiggs and tools needed are all purchased. There is only monitoring and inspection work for faulty management and investments are made in documentation and process mapping but this is more in production and quality management related issues. 118 3.2.3. Summary This is a typical type A firm where the large MNC type customer leads in all aspects and design and development and suppliers designs – directly or through the tier one supplier (in this case a firm called Lear) for the low technology inputs (in this case car seats related parts). Figure 1: ABCs Manufactures Links for Design Resources ABC Manufacturers Main Customer – Luxury Car Maker Tier 1 Supplier (Provides Design) The SME has competencies in quality assurance and management and capabilities to produce parts for luxury / high end product producing customer with long terms contracts. The biggest fear is that the design firm (tier 1 supplier) could take over the manufacturing business. 3.3. Case of Proreka Sdn Bhd 3.3.1. Profile of the firm Proreka is a tier 1 vendor of OEM manufacturers and components to major car manufacturers and assemblers in Malaysia. It’s been in the business for nearly 10 years now and also operates in the replacement market. Proreka mainly deals with modification and styling, prototype making, engineering design and data, testing and mass production. It also does interior designing, customized modification and styling 119 for cars. Proreka has the necessary expertise to look at newer ways to design and process engineering. It has achieved a number of awards that stand to fact its longstanding leadership in this field. ISO/TS 16949 was also awarded to Proreka. The firm has nearly 140 employees of whom 25 engineers are directly involved in design related work (product and process). The turnover in 2010 was between Ringgit Malaysia 60-70 million. There were three respondents for this case – the GM – Operations, Senior Manager – Manufacturing and Head of Sales. 3.3.2. Innovation Capabilities Building One of the critical issue of building up capabilities for innovation that all the respondents mentioned is the ‘low volume market’ and also the slow product life cycle – i.e. Changes required in design are usually once in 2-3 years only in the local market. The lack of facilities in their lead customer (local car manufacturer) for design of car interiors and some exterior parts – has led to the development of this company. Awareness and Search – Scanning and Monitoring External Technology Events and Trends The firm is highly active in scanning and monitoring external technology events and trends related to its area (plastics molding). Green technologies are the trend they see and they are not yet in the frontier of this technology. They visit and participate regularly in several trade shows and exhibitions, attend training programs sponsored by industry related development organizations to help in awareness building and scanning for new developments in related technologies. Key factors that affect the firm are lead times, cost and then quality issues. A critical factor for the firm involved in product design is tooling capability which they 120 say is lacking in Malaysia and they rely on Korean or Taiwanese tool makers. Firm Competencies, Technology Strategy + Assessing and Selecting Technology They core competency is described as being a ‘one stop shop’ offering design to manufacture capabilities for car interiors and some exteriors. They have all the competencies in this value chain expect for building tools (for manufacturing) which they outsource to suppliers in Taiwan or Korea. Capabilities for building tools in Malaysia are constrained by lack of volumes (low volumes to support such skills). The key technical personnel attend training programs regularly sponsored by the firm or industry related development organizations to help in development of the competencies. A key factor they consider in the technology strategy is the ‘tooling costs’ as this is scarce in Malaysia and can’t be done yet ‘in house.’ Their business strategy is to develop into a ‘modular supplier of safety related parts’ and the ‘technology strategy’ is to support this business. Business practices like ‘vendor pay upfront’ peculiar to Malaysian market is considered as an impediment to make investments in product design and also in further manufacturing process design capabilities. Technological priorities include to have a lean production system including such processes as waste management, Kamban systems, etc with a 3-5 year business plan. Being part of the Proton Vendor Association they get support in terms of assessing and selecting the appropriate technology (manufacturing / process related). There is a joint venture with a firm in Indonesia and they attend trade exhibitions regularly to bring in outside knowledge. In addition subscribe to key academic and trade journal to help them judge/assess and select proper technologies. 121 Implementing & Absorbing Technology and Learning to Build Tech Competencies Proreka is also a TS 16949 accredited firm – and they also mention that the TS systems requires them to follow standardized project and risk management procedures in all aspect of manufacturing or new product development. The system involves detailed documentation and process and control system of TS 16949 helps in learning and documenting of the issues related to technological competencies. The APOP – Advanced Product Quality Planning system as part of the TS process also help in cross functional coordination. They have a manufacturing feasibility study system to manage risks in new projects. They also do some informal benchmarking within the industry and the Kaizen systems help in capturing learning and understanding their level against competitors in the industry. Learning + Exploiting External Linkage and Incentives (like Tax Breaks, Grants etc) In addition to being part of the Proton Vendor Association, they are also linked to MyJaCo and the SME Corp of Malaysia – this gives them knowledge of and access to training programmes, trade related seminars and other such events giving knowledge of technology and management related aspect of their business. They have also links with end users like the Waja Users Clubs. 3.3.3. Summary Overall this firm is interesting Type C firms – they have managed to identify a gap in the market (lack of a one-stop shop from design – manufacturing of interior and exterior plastic parts) and develop the firm with these competencies. The challenge of low volumes in the market remains and hence the firms are planning to export. The 122 firm has the danger of getting ‘trapped’ in a mature or slow growth sector, despite having exploited technology efficiently. Similar to Y&L have the challenge of maintaining a strong technical team in future – as the MNCs attract most of the talent. In summary have good awareness and scanning abilities – this firm exploits a few external actors for information on technology. But limited linkages even with a technical university in the neighbourhood. Another challenge is also if new firms are allowed to enter the protected market. 3.4. Company A - Case of an American Diversified MNC Parts Supplier 3.4.1. Profile of the Firm Company A is a Fortune 100 diversified, multi-industrial company with nearly 140,000 employees in 1,300 locations across six continents. The Malaysian unit is part of the automotive business unit of Company A and assemblers and supplies car seats to European luxury car assembler and also to the prominent local car manufacturer and some Japanese assemblers in Malaysia. The Malaysian manufacturing unit has about 700 employees of which about 30 are involved in manufacturing process design (some of whom may be involved in product design also). The firm’s annual turnover is about Ringgit 350 million. 3.4.2. Innovation Capabilities Building Awareness and Search – Scanning and Monitoring External Technology Events and Trends The firm does not have formal functions for scanning and monitoring technology related events and trends in the Malaysian operations. The operation in Malaysia is to assemble high tech / high end auto-seats for the luxury segment cars and also for other 123 seats. For the local car manufacturing firm some design work has been undertaken – but for which help is taken from the firm’s main R&D unit or from other subsidiary’s design or R&D units – requisite technical personnel are deputed to the Malaysian unit for the project and then sent back to their home unit. So the firm itself can be said to have high levels of awareness and scanning (based on its global operations) but not in the Malaysian operations. Competencies Developed, Technology Strategy + Assessing and Selecting Technology Whether is information regarding the range of technology options (different machines, suppliers, approaches, etc) or assessing technology options to know that they have chosen the best sources of technology – they depend purely on the firm’s head quarters. The competencies here are purely related to assembly of the car seats – with quality testing. Figure 2: American MNC Parts Supplier Links for Resources Major Customer (2-3 Year Cycle) Main R&D Unit Subs R&D American Parts Engg Supplier’s Malaysian Unit – Assembly and some Process Design Other Customer Other Customer Subs R&D Acquiring + Implementing & Absorbing Technology All decided by the head quarters – the engineering unit here assists in this matter. Project Management and Risk management capabilities in terms of adopting any 124 frameworks or systems all come from the headquarters. The TS16949 accreditation is considered to play an important role in acquiring and absorbing technologies. Exploiting External Linkage and Incentives (like Tax Breaks, Grants etc) Within Malaysia they do not have any specific links to external source of knowledge for technology development (Universities or other industry related organizations) but all these links are there at the head quarters or probably at other subsidiaries. 3.4.3. Summary On the surface it appears as a type A firm – or the Malaysian unit is a Type A firm. But if one considers the global operations of the firm it’s a much more sophisticated. The links for and investments in technology related activities in the Malaysian unit are weak due to the following reasons (based on the interview) – local market limitations in terms of low volumes and slow product life cycles (design changes in cars are slow as in once in 3 years). 3.5. Company B - Case of a Large Japanese Parts Manufacturer 3.5.1. Profile of the Firm This company (founded in 1949, is a leading supplier of advanced automotive systems, technologies and components. The headquarters of the firm is based in Japan and it employs more than a hundred thousand people in more than 31 countries all over the globe. This large Japanese parts manufacturer started as a joint venture between the Japanese corporation and its local partners. Today it is the largest automotive components manufacturer in Malaysia, and a major automotive components supplier to national car projects. The Malaysian unit is also an ISO/TS 16949, ISO 9002, and ISO 14001 certified firm from SIRIM (Standards and Industrial Research Institute of 125 Malaysia). The products manufactured and services offered include, voltage regulators, starter motors, Windshield wiper motors and washer radiators, air conditioners for cars and buses. The firm has about 1,200 employs of which 30 are directly involved in the design function – which is involved predominantly in manufacturing process related work. But there is some application design work that is done at times. 50% of their products are for export markets. 3.5.2. Innovation Capabilities Building Awareness and Search – Scanning and Monitoring External Technology Events and Trends Technological is seen as critical for manufacturing / process design development in order to have high quality and high productivity. JIT systems are critical for their business. QCD factors – quality, customization and delivery affect whether customer firms buy from them. Quality is the order winning factor in their business. The firm’s head-quarters which has larger volume business has a larger in-house R&D division that has more formal processes for scanning and monitoring of external technology events. They consider themselves at the frontier in their business. Competencies Developed, Technology Strategy + Assessing and Selecting Technology The competencies of this firm are in producing high quality auto parts with lowest possible cost – due to the use of JIT systems. In addition focus is on development of products that are environmental friendly. The technology strategy is developed based on supporting these competencies. But the decisions related to technology strategy and also in assessing and selection of technologies are done at the headquarters. In the Malaysia operations the focus is on manufacturing, testing and quality management. 126 The technological priorities are towards development of JIT manufacturing systems for all products – to enable highest possible quality with minimum costs. Figure 3: Hub and Spoke Relationship between HQ and Malaysia Japanese HQ – Tech Strategy and Selection Malaysian Organization Other Regional Other Regional The assessment and selection of technologies – is essential done at the headquarters – and this is usually done in a stage-gate approach. All relevant functions are involved in assessment and selection of technologies and the role of the Malaysian organization is seen in the analogy or hub and spoke – where the headquarters is the hub and Malaysian organization is the spoke. Acquiring + Implementing & Absorbing Technology All decisions or systems for acquisition, implementing and absorption of technologies are essentially done at the headquarters or in some of the subsidiaries where there is a significant R&D unit – the role of the Malaysian organization is minimal – in term of the hub and spoke model – the inputs from this organization are considered for acquisition of technologies. 127 Learning to Build Technological Competencies and Exploiting External Linkage and Incentives (like Tax Breaks, Grants etc) Learning to build technological competencies are done through formal reports developments, e-mail sharing amongst the subsidiaries and also a periodical conference organized by region. There is an also periodic audit (technical audits) that helps in terms of identifying and capturing learning/knowledge from projects undertaken. There appears to be very little linkage with external actors for enhancing innovation capabilities. A major barrier as identified in some of the other firms – is low volume of business in the local market and also the slow product life cycle leading to a very less requirement for design work for example – a comment was that the ASEAN market is seen to have a 10 years cycle for cars and hence major changes in product design and related process changes are low. 3.5.3. Summary As with the other foreign parts/component supplier this firm also identifies the low volume issue and also the slow design change cycle in the market as an issue for developing or setting up of product design capabilities in the Malaysian operations. There is some investment in terms of an engineering division for absorption of technology from the parent/headquarters and to do some developments related to local markets (an example given is that in Malaysian market sometimes design changes are asked to be one on a faster time cycle than the usual 24 month cycles). Several key decisions related to technology strategy and also assessment and selection of technologies etc are not done in this organization – although there is some involvement in the hub-spoke model practiced. The firm sees no need at all for any external 128 linkages as it (1) the base research is that parent / headquarters and also (2) they see no major research institute / research and development resources in the region to link with. 3.6. Company C - Case of a large Local Car Manufacturer 3.6.1. Profile of the Firm This is one of the four manufacturing firms in the automobile sector of Malaysia. It was established in early 90’s (1993), as a result of a joint venture between Malaysian and Japanese partners. The managing corporation was established in late 2001. Two other joint venture partners of the firm are from the Japanese automotive sector. The manufacturing operations of the Group are managed by XYZ and their plant currently has the capacity to produces 250,000 units per annum on 2-shift cycle. The firm has a few export markets which some Asian countries and UK. The firm has a large domestic market with an extensive sales and service network. The firm employs nearly 10,000 people and the research and development department which started in late 1990s with just a handful of engineers and a manager now has five departments with more than 350 employees. 3.6.2. Innovation Capabilities Building Awareness and Search – Scanning and Monitoring External Technology Events and Trends The firm is seen to be highly active in scanning and monitoring external technology events and trends related to small car manufacturing. They key personnel are involved in visiting and participate regularly in several trade shows and exhibitions, attending training programs to help in awareness building and scanning for new developments in 129 related technologies. Key factors that affect the firm are lead times, cost and then quality issues. Cost related issues seem critical for the firm. Competencies Developed, Technology Strategy + Assessing and Selecting Technology The R&D activities have focused on developing capabilities from basic testing, to design and styling and also process design related developments manufacturing engineering skills. The competencies developed include styling / modeling, concept car development and the ability to undertake major facelifts. There is a separate division called the Perodua Engine Manufacturing Sdn Bhd (PEMSB) which undertakes the assembly of the vehicle engines and also manufacturing of selected engine component parts. The technology strategy has been more towards ‘localization’ of components of their cars – similar to what is known as the import-substitution strategies in industries in other developing counties. Acquiring + Implementing & Absorbing Technology There are five departments within the R&D and they are Product Planning, Styling, Engineering Design, Testing & Experiment and Technical Admin. Within these departments are sections which are assigned specific tasks. The firm has invested some RM97 million in the last 13 years on facilities alone and more than RM1.5 billion on model development. This is to indicate the firm’s commitment to the localization policy and in-house development capabilities, as well as the government’s aspiration to see local companies enhance their R&D expertise. Also the large R&D division is not only involved in new product design but also plays a role in implementing and absorbing technology transferred from the JV partner and thus helping to further innovation capabilities in the company. 130 Learning to Build Technological Competencies and Exploiting External Linkage and Incentives (like Tax Breaks, Grants etc) The firm started with a Japanese link (producing their vehicles) and now is a joint venture with the Japanese manufacturer and several Japanese management practices help in the learning to build technological competencies. The joint venture organization and the large investment in the R&D division is supposed to be critical in learning for building up technological competencies. External linkages are there with universities, but this is more for some small peripheral developments or not for innovation related activities (and not the core engine or related parts development). The main links is with a Japanese car maker through the joint venture and related links that emerge through the partner that help in the learning and development of technological competencies. 3.6.3. Summary As a national car company, this firm has the responsibility not just to manufacture cars in the Malaysia, but also to develop local capabilities. It’s felt by many (including the respondent) that the decision to go into a joint venture with partner was a very good decision made by management from the point of developing innovation capabilities. The R&D division of the firm had to “prove” itself to the JV partner leading to more technology transfer. The firm has emerged as a ‘quality’ player in the small market segment and also has the largest market share holder. It can be seen as a Type C firm that has exploited technology for its business but need to be more dynamic in terms of a vision for technology for future and also in developing linkages / exploiting external sources for enhancing its innovation capabilities. 131 3.7. Company D - Case of German Luxury Car Assembler 3.7.1. Profile of the Firm The luxury car assembler is part of a large German group which is one of the largest producers of premium cars and the world's largest manufacturer of commercial vehicles. In addition the group also has a financial services division with a full range of automotive financial services including financing, leasing, insurance and fleet management. 3.7.2. Innovation Capabilities Building Awareness and Search – Scanning and Monitoring External Technology Events and Trends The firm does not have formal functions for scanning and monitoring technology related events and trends in the Malaysian operations. The operation in Malaysia is to assemble high tech / high end cars which arrive from the headquarters in CKD kits but for which help is taken from the firm’s main R&D unit or from other subsidiary’s design or R&D units – requisite technical personnel are deputed to the Malaysian unit for the project and then sent back to their home unit. So the firm itself can be said to have high levels of awareness and scanning (based on its global operations). Competencies Developed, Technology Strategy + Assessing and Selecting Technology Whether is information regarding the range of technology options (different machines, suppliers, approaches, etc) or assessing technology options to know that they have chosen the best sources of technology – they also depend purely on the firm’s head quarters. 132 Figure 4: European Car Assembler – Links for Resources Head Quarters Regional Operations Engg European Car Assembly Regional Operations Acquiring + Implementing & Absorbing Technology When a new car model need to be manufactured – the headquarters decides on all the manufacturing and transfers information regarding the process design and personnel to train and implemented in the Malaysian unit. The main skills in the Malaysian operations are testing and quality management. The manufacturing and other process related issues are more or less the same in all places – the only exception in Malaysia is some operations are manual due to low volumes. All technology related decisions are at the headquarters. Project management and risk management capabilities in terms of adopting any frameworks or systems all come from the headquarters. In terms of links with other regional operations – it’s more of information sharing of problem solving for particular issues faced in the local plants. Exploiting External Linkage and Incentives (like Tax Breaks, Grants etc) Within Malaysia they do not have any specific links to external source of knowledge for technology development (universities or other industry related organizations) but all these links are there at the headquarters or probably at other subsidiaries. 133 3.7.3. Summary Again similar to the American MNC, this European car assembly firm appears as a Type A firm – for the Malaysian unit. But if one considers the global operations of the firm it’s a much more sophisticated. The links for and investments in technology related activities in the Malaysian unit are weak due to the following reasons (based on the interview) – there is no strong resource base to set up a process or product related design unit in this place – the local market is the reason for the manufacturing / assembly operations here. 3.8. Summary of the Cases 8-10 Two respondents from SMEs that supply parts to the national cars and one to foreign assemblers were interviewed initially. But the common results / findings that emerged from the interview were as follows – all the three could be categorized as Type A firms with no particular technology strategy. They depend on fully on the customer firms that these firms supply to – either on the national car makers and the foreign car assemblers). The product designs are supplied by the ‘customer’ and they manufacture to specifications – these are classic Type A firms with manufacturing facilities and some amount of quality testing facilities/capabilities 4. Conclusions and Policy Implications Overall from the discussions with the respondents – the sector itself is dominated by supplier firms that are mostly involved in not so high tech parts like plastic or metal parts and there is little by the way of product innovations and most innovations would 134 be towards changes in processes. The relatively better innovation capacities are with supplier firms that work with the two national car manufacturing firms Proton and Perodua (which have the full set of the value chain activities involved in automobile manufacturing) – whose mandate includes developing and utilizing parts and components from local firms or made locally. Also the automotive sector has a very large number of firms that are more trading firms – although registered as an auto part or component supplier – they import the products and supply to the consumer/replacement market or even to the OEMs. While the mandate to ‘localize’ parts and components is considered helpful to enhance local firm’s motivations for developing innovation capacities - an interesting comment from one of the respondents of a part supplier company, is worth mentioning at this point “… it is very difficult to keep costs low in Malaysia due to several factors –dependence on foreign labor and uncertainties in labor policy, lack of a support industries like tools and dies – need to depend on Korea or Taiwan (Malaysian one too expensive and not up to the same quality).” Similar comments were made by another parts supplier also. Based on the interviews the following has been gleaned – Awareness: The firms that have been studies seem highly aware of what affects their products and processes – and this seems because of the close link with the ‘customer’ firm which is usually one of the two main local manufacturers or the locally located assembly firms of foreign cars. Most firms interviewed can be classified as Type B or Type C – interestingly there are both local and foreign firms in Type C category. The 2 cases that were interviewed (but discarded) and also one of the cases presented (the Auto Seats SME) exemplify Type A firms. 135 According to several executives a majority of the firms in the industry would be in this category. They are reactive and depend completely on the customer firm (usually a vehicle manufacturer or a tier 1 supplier) to plan their business operations. Search – Scanning and Monitoring External Technology Events and Trends: The key factors that are considered critical by the respondents in these firms are quality, customization and speed (all this eventually leads to low costs is the view). And the most important aspect is reliability and while currently technology (as in high technology) does not seem extremely crucial (as labor costs are low in the country) but in future there is thought being given to ‘technology’ playing a role in gaining competitiveness. These firms are regular visitors to exhibitions regionally and more recently locally. They also are heavy users of internet and attend seminars. Here it needs to be mentioned that while labor costs are considered low – there is what the respondents call ‘hidden costs’ of depending on foreign labor. Building Core Technological Competencies: In general only three of the seven firms can be said to have a distinctive competitive edge based on technology – developed inhouse but benchmarked against internationally competitors – while currently they are focused on cost related or reliability related innovations – for the future they see a bigger role for R&D and internal R&D. Others seem to be more reactive in building these competencies based on the needs of the customer firms. Technology Strategy: The technology strategy, again, seems to be more reactive and specifically linked to the developments of large “global” automobile manufacturers. The small and medium local firms try to have their business strategy very closely linked to the larger customers and the technology strategy is also developed in these 136 lines. The foreign players are more sophisticated in this matter but the activity itself is in their parent firms or the head-quarters. Assessing and Selecting Technology: Information on range of technology options like different machines, suppliers, approaches, etc – is sought from either the large global automotive firms (customer firms) or the national car manufacturer. One of the SME firms sough this information through independent/external consultants. Acquiring Technology: With the exception of the foreign supplier firm the local SME inputs supplier firms did not have any specific formal processes or mechanisms for acquiring technology from outside not really in terms of a portfolio or approaches while one respondents from an SME firms stated that the crucial role in technology acquisition and capturing knowledge is heavily influenced by a certain automobile related “standards” organizations (important as they aim to supply to large global players). Implementing and Absorbing Technology: One of the three SME firms seems quite adept in (a) Project Management Capabilities – from getting a technology to actual product coming out (b) Risk Management Capabilities – is claimed to be vital and is inherent in the project management due to the accreditation by the automotive standards organizations. This adherence to the standards organization also helps to ensure co-operation and communication between R&D engineering, production and marketing and other functions – cross functional expertise is based on the documentation that needs to record the communications between the different units. 137 Learning – For Building Technological Competencies: While the foreign companies seemed more adept at “learning” aspects as the HQ has systems in place and locally they have a lean engineering team to help in technology transfer from the headquarters – one local SME supplier firm – which can be seen as an “outlier” – seemed to be quite active in terms of having systems in place for learning about technologies and developing competencies (evidenced by their ability to plan and diversity based on such competency development). Exploiting External Linkage and Incentives: Overall this aspect is extremely weak among the firms studies – there is very little linkages within these firms and also overall the awareness of external options to leverage and improve products or processes appears very limited – be it in the form of linkages with universities, research institutes etc. To conclude – while many firms can be classified as Type A or Type B some of the local SMEs – particularly those that supply to the national car manufacturers can be classified as TYPE A-B (as in Appendix 1) – this is to indicate that they very aware of the need to change but not yet able to do so – in terms of technological / innovation. While they have secured orders from the national car companies – they are aware of the need to be innovative (in terms of product and/or process developments) to be competitive in the wake of liberalization. These firms seem to be developing capacities in process innovation be it to lower prices and for quality and also for product development in order to be able to supply to other customers locally and in overseas markets. 138 4.1. Internal and External Factors for Enhancing Innovation Internal Factors In general the internal factors that help in enhancing innovation can be seen as the firm’s ability and resources committed to gaining awareness of technological developments, specific departments / groups for developing process innovations and/or design functions for being able make improvements in products or even developing new products. In the case of the large (foreign) supplier firms the internal factors that help in innovation are engineering divisions – which have some role in developing applications developments and in more importantly these divisions are for absorbing new technological innovations from parent/HQ). The other ‘internal factor’ among the large foreign supplier firms can be the links to the head quarters and units/subsidiaries of the company located in other regions. External Factors From the interviews/ case studies, factors that help to enhance innovation are as follows – in the case of SMEs they are external consultants hired by the firms and strong links to customer firms or demands from customer firms. In the case of large supplier firms the strongest links are with the customer firms i.e. car manufacturers or assemblers. In the case of supplies to assemblers there is very little innovation related activity – its more production to specifications but in the case of links to local car manufacturer’s (as customers) there is some impetus for doing design and developments. There is very little evidence of external factors such as joint ventures, collaborations or linkages with organizations – like academic institutes / universities, research institutes, community organizations / NGOs or for that matter other firms in 139 the sector – is generally weak. The only exception is one of the large manufacturing firms which has a joint venture for enhancing innovation – product and / or process related. The links between internal and external factors are fairly clear – the firms (small or large) which have specific engineering / design (R&D) divisions or groups are usually ones which have higher levels of awareness of the need for technological innovations for being competitive – these divisions also help in terms of developing competencies and in the case of one large manufacturer this type of a division has helped to enhance the relationship with the joint-venture partner to transfer technologies and also in developing innovations. 4.2. Overall Conclusions Support for Innovation: Internal Factors, External Factors and their relationship All the respondents in firms interviewed unanimously mentioned that although called R&D activities – there was not much real research and development in the firms – there was some product design and development but predominantly it was process design and development activities that were taking place. In the case of the SME firms – the innovation was in processes as the product specifications was a given. The MNCs were seen as the key drivers of innovation as they are perceived to be the “lead” organizations in the market. The larger foreign players have extensive internal sources of data – databases of key publications in their area of interest, participating in key conferences, intra-group meetings, links to universities at the HQ. Among the local SME firms – while all did use the internet in general – also checked out information on competitors’ as a source 140 of information for innovation. One of them sought more information from a competing Japanese firm against whom they benchmark their processes. Local firms talk about cooperation with suppliers or customers as they main collaborative activities. There is some evidence of joint ventures (between Malaysian owned firms) in the automobile sector – but only in the case of one large manufacturing firm, that have been interviewed till now. Overall respondents seem not to have considered joint venture (JV) type organization for technological developments so specific policy to support JV form of organizations seem warranted in this sector also. An interesting point is how the SMEs see the role of large foreign players – their planning and development is based on these large foreign manufacturing firms (whose cars are assembled in Malaysia) and the trends set by companies – for example one of the SMEs sees the movement towards ‘green techs’ by the larger Auto players – and hence is planning to go into that area of business. All these have implications and recommendation for policy will have to be developed. 4.3. Some Initial Ideas for Policy Recommendations Policy Recommendation 1 Keeping costs low is a critical aspect for the survival of the small and medium firms and as a factor in getting them customers. But the SMEs mention about hidden costs not just in terms of the uncertainties in labor policy but also in the availabilities of supporting industry for innovation activities – e.g. As one of the Type C firms which does design work for interiors mentioned – there is no proper set of suppliers of tools and dies in the country and they have to rely on imports – this adds to their costs. So there seems to be a need to develop support institutions for such needs. A factor that 141 hinders innovation constantly mentioned is the low volumes and couples with too many players or too much competition in the market – this could be addressed with policy to encourage industry consolidation (Malaysia has had experience with such policy in the services sector). Policy Recommendation 2 - Sector Specific Support System There are indications that there are several Type A firms which are SMEs and run as a one man show or by family concerns in the automotive sectors. These firms rely heavily either on the national car makers or on the large MNC customers (usually assemblers) for support in information and also for technical designs (product and process). The case of Type B-C firms in the study show clearly that linkages with outside organizations increases information flow and motivates them to invest in inhouse design and engineering functions making them more independent. Unlike the Electronics or Palm Oil sectors – the Automobile sector visibly lacks a support system specific to the sector or even a regional innovation system (a good example is the Continental setting up R&D centre in Penang given the region’s electronic industry base with human resource availability, infrastructure and specialized players in the value chain). This leads to the next recommendation. Policy Recommendation 3 - Investment in Automobile Related Research Centres Two of the three respondents from the foreign firms (one parts supplier and one car assembler) mentioned that the research and development activities take place either at the “HQ” or on other subsidiaries of the company. The reasons for this was that (1) the volumes in the Malaysian market were not large enough and (2) the changes in product design were also too slow (2-3 years for parts ) to warrant a design centre – in the case of the Japanese firm – since they supply to the global market had invested in 142 manufacturing process design – but they estimate the specific product design changes for the ASEAN automobile market change over a 10 year cycle and hence the does not warrant a product innovation investment. They also mention that there is no strong research centre or university with which they could work with on any specific area also. While Malaysia has been open to FDI it has managed only to get in manufacturing and not in product or process research. So government investments in the existing universities for some dedicated research – or encourage cross sector linkages between electronics and rubber sectors and the firms in the automobile sectors can be considered. Overall the much criticized policy of national car projects by the Malaysian government, seem to have helped in developing a sector of automotive parts and components firms. While there are indications that several of these firms are passive in terms of innovation activities / capabilities and could be in the danger of not being competitive if they lose their anchor customer – there is anecdotal evidence where firms (small and large) have become competitive and gone into export markets by developing external linkages and internal resource developments thus overcome barriers to limited resources or markets size for innovation. 143 REFERENCES John Bessant, J., H. Rush and M. Hobday (2001) “Assessing Technological Capability: An Audit Tool,” Firm-Level Innovation in the Korean Economy by Hobday et al. Report for World Bank. Website References Media Release - Review of National Automotive Policy (2009). http://www.maa.org.my/pdf/MEDIA_RELEASE_NAP_Media_281009.pdf (accessed on Jan. 23, 2011). Summary of Passenger & Commercial Vehicles Produced and Assembled In Malaysia for the Year 1980 to YTD December 2010. http://www.maa.org.my/info_summary.htm (accessed on 25th January 2011). Malaysia: Automotive profile (2007). Economic Intelligence Unit http://www.eiu.com/index.asp?layout=ib3Article&article_id=602719845&pubtypeid=1 112462496&category_id=775133077&country_id=1600000160&page_title=F orecast&rf=0 (accessed between December 2010 – January 2011). 144 APPENDICES Appendix A: Firm-Level Innovation in the Korean Economy, Report for World Bank, Hobday et al. (2001) SECTION - Not all firms are the same Research has consistently shown that firms, and particularly small and mediumsized enterprises (SMEs) differ widely in terms of their technological capabilities and absorptive capacity. We can represent them on the diagram below which differentiates between: The degree to which firms are aware of overall need to change (sensitive to competitive forces, etc.); The degree to which they are aware of what to change and how to go about the process. Figure A1 provides a simple model which views firms in terms of these two dimensions. Figure A1: Groups of Firms according to Technological Capability High Type D Firms: Creative How far firm is aware of need Type C Firms: Strategic to change threats and opportunities Type A-B Aware and Reactive posed by Type B Firms: Reactive technology Type A Firms: Unaware /Passive Low How far is the firm prepared and able to change in practice High 145 Type A Firms: Unaware/Passive These firms can be characterized as being ‘unconscious’ or unaware about the need for technological improvement. They do not realize or recognize the need for technological change in what may be a hostile environment and where technological know-how and ability may be vital to survival. They do not know where or what they might improve, or how to go about the process of technology upgrading. As such, they are highly vulnerable to competitive forces. For example, if low cost competitors enter - or the market demands faster delivery or higher quality - they are often not able to pick up the relevant signals or respond quickly. Even if they do, they may waste scarce resources by targeting the wrong kinds of improvement. These companies are weak and ill-prepared in all major areas of technology acquisition, use, development, strategy and so on. A thoroughgoing basic improvement program is probably urgently needed. Help is needed in: enabling these firms to recognizing the need for change (the ‘wake-up call’); developing a strategic framework for manufacturing and other activities; identifying relevant and appropriate changes; and acquiring and implementing necessary technologies. They also require assistance in sustaining this process of change over the long-term. Type B Firms: Reactive These firms recognize the challenge of change and the need for continuous improvements in manufacturing and other technological capabilities. However, they are unclear about how to go about the process in the most effective fashion. Because their internal resources are limited - and they often lack key skills and experience in technology – they tend to react to technological threats and possibilities, but are unable to shape and exploit events to their advantage. Their external networks are usually poorly developed. Most technological know-how comes from their suppliers and from observing the behavior of other firms in their sector. They may well be ‘keeping up’ with other firms which may have similar weaknesses and limitations in technological capability. Typically, this group treats symptoms rather than root causes of problems for example, dealing with bottleneck operations by replacing machinery only to find that the problem gets worse because the root cause is, in fact, in production scheduling. Overall, these companies have poorly developed capabilities in most areas of technology strategy, search, acquisition and capability building. However, there are some strengths upon which to build. The needs of this group centre first on the development of a strategic framework for technological change, so that key priority areas can be addressed. Allied to this, are 146 needs in searching wider for solutions, in exploring new concepts (for example changing production layout rather than simply acquiring new machinery), and in acquiring and implementing new product and process capabilities. In the longer-term, such firms could be expected to develop an internal capability for strategic upgrading and require less and less support. Type C Firms: Strategic These firms have a well-developed sense of the need for technological change. They are highly capable in implementing new projects and take a strategic approach to the process of continuous innovation. They have a clear idea of priorities as to what has to be done, when and by whom, and also have strong internal capabilities in both technical and managerial areas and can implement changes with skill and speed. These firms benefit from a consciously developed strategic framework in terms of search, acquisition, implementation and improvement of technology. However, they tend to lack the capabilities to re-define markets through new technology, or to create new market opportunities. They tend to compete within the boundaries of an existing industry and may become ‘trapped’ in a mature or slow growth sector, despite having exploited technology efficiently within the boundaries of the industry. Sometimes, they are limited in knowing where and how to acquire new technologies beyond the boundaries of their traditional business. Overall these companies have strong in-house capabilities and think strategically about technology in the medium and long term. In some areas, these firms may be behind the international technology frontier but they have many important strengths upon which to build. The needs of this group are essentially around providing complementary support to internal capabilities and challenging existing business models. Improving access to specialist technical and marketing expertise, enabling access to new networks of technology providers (for example, overseas sources) can assist these firms to think ‘outside’ of the industrial box they find themselves in, should the need arise. Such firms may also benefit from occasional, project-based support from consultancy companies or from specialist research and technology organizations, locally or internationally. These firms may benefit from improved access to graduates and from linking up with universities which offer new ideas, access to advanced technology and new skills. 147 Type D Firms: Creative Type D firms have fully developed sets of technological capabilities and are able to help define the international technology frontier. In many areas, they take a creative and pro-active approach to exploiting technology for competitive advantage. They are at ease with modern strategic frameworks for innovation and take it upon themselves to ‘re-write’ the rules of the competitive game with respect to technology, markets and organization. Strong internal resources are coupled with a high degree of absorptive capacity which can enable diversification into other sectors, where their own skills and capabilities bring new advantages and re-define the ways in which firms traditionally compete, or wish to compete. Their technology and market networks are extensive so that they are kept informed about new technological opportunities and remain in touch with suppliers of equipment and ideas. There are only a few firms in this category and they are generally seen as ‘risk takers’ although, like most businesses, they tend to avoid unnecessary or uncalculated risks. Some creative firms emerge from traditional and mature sectors to challenge the way business is conducted. For example, Nokia, the Finnish company, moved from pulp and paper into electronics and eventually became a world leader in mobile telecommunications, showing that it was possible to make very high margins in the production of handsets within the developed countries, when most competitors believed it was impossible to achieve this goal (e.g. Ericsson and Motorola viewed handsets as low margin commodity products). Another example is IBM, which transformed itself from being a ‘dinosaur’ of the computer industry, to one of the fastest growing, most highly profitable information technology companies in the world, capable of leading the advance of ‘e-commerce’ technology in the late-1990s. The needs of this group are mainly around complementing existing internal capabilities with outside sources, assessing risks and uncertainties and sustaining their position as a ‘rule breaker.’ They tend to be open companies which collaborate and learn from partners in the external environment and invest in developing new technologies and resources, for example in leading universities around the world. From time to time projects emerge with threaten to disrupt their existing businesses and they are often in a strong position to convert such threats into new market opportunities. Such firms may need to develop new contacts with specialist groups (domestic and overseas) in order to resolve complex technical problems and generate new opportunities. These companies can be useful contributors to governments as they try to position and develop their national systems of innovation for the future (e.g. the 148 Singapore and UK Governments often discuss policy with leading industrialists from such firms). 149 CHAPTER 4 Innovation in the Automotive Sector of the Philippines FRANCIS MARK A. QUIMBA Philippine Institute for Development Studies MAUREEN ANE D. ROSELLON* Philippine Institute for Development Studies (PIDS) The performance of the Philippine automotive industry has steadily improved after the Asian Crisis. However, relative to the performance of the automotive industry in other countries, the automotive sector in the country has languished. To understand the challenges being faced by the automotive assemblers, as well as parts and components manufacturers, the innovation capability and activities of selected establishments are analyzed following the framework developed by Bessant. This paper finds that despite having an awareness of the importance of technology and upgrading, some of the automotive firms are not able to translate this awareness into other technology activities. * Philippine Institute for Development Studies (PIDS), the Philippines. 151 1. Introduction The Philippine automotive sector is relatively small, in terms of share in value added in manufacturing, size (number of players), and production especially if compared to its ASEAN neighbors such as Thailand, Malaysia and Indonesia. But recognizing the backward and forward linkages of the sector, the government continues to promote its expansion and improve its competitiveness. A major policy on the sector is the Motor Vehicle Development Program which aims to provide the automotive sector with comprehensive industrial policy and development direction. This law is adequate on promoting competitiveness and taking advantage of the tariff reduction schemes but seems to lack in supporting innovation in the automotive industry. And it does not help that, in the Philippine industries in general, the low R&D expenditure and the failing R&D indicators indicate how innovation is not getting enough attention in the country. Nonetheless, a recent case of innovation in the Philippines is the electric jeepney. [Jeepney is a uniquely Filipino public transport]. This can be considered an innovation for local public utility vehicles in view of improving the fuel economy and reducing environmental impact. But other than this, innovation particularly in the automotive sector is not very active. Innovation can be defined in terms of improvement or development of product, process, operations or systems, as well as formulation of technology strategies, to name a few. Innovation can be sourced within a company (internal), such as from its pool of engineers to R&D activities; or be acquired through linkages outside the company (external), through expertise coming from research institutes, universities or 152 other networks. It would be interesting to look closely into the innovation situation in automotive firms and to assess how these firms fare in terms of innovation capability. This case study aims to provide a background of the automotive sector of the Philippines and to understand the challenges being faced by the automotive firms (assemblers and parts manufacturers) in terms of innovation. The paper uses the framework by Bessant, which classifies firms into different types depending on their innovation capability level. Specifically, a simple survey tool and an interview tool are used as audit tool for measuring innovation capability. Nine (9) firms from the automotive sector are selected and interviewed for the case study. Innovation activities and capabilities are analyzed in terms of patterns, similarities and differences among the 9 firms. The paper is organized as follows: Section 2 gives a background on the Philippine automotive sector, including policies implemented by the government. It is followed by a section that presents the Philippine technology and innovation policy. The methodology and specific tools used in the analysis is explained next followed by Section 5 which presents the results of the audit tool. Section 6 discusses the analysis and findings while Section 7 presents implications for policy. 2. Background on the Automotive Industry of The Philippines Before the 1950s, all motor vehicles in the Philippines were imported mainly from the US. It was in the early 1950s when importation of completely-built-up (CBU) vehicles in commercial scale was prohibited and importation of completely-knocked- 153 down (CKD) components was allowed. This paved the way for parts manufacturing and car assembly in the Philippine automotive industry. Programs to develop the industry were implemented starting in early 1970s. Examples of this program include: increasing local content requirement to promote the domestic manufacture of automotive components, and promoting manufacturing activities with small and medium enterprises. From 12 vehicle assemblers in 1960, there are now 52 of them in this subsector, and there are 256 parts and components manufacturers. From an annual demand of about 10,000 units in 1960, the automotive industry was able to produce more than 160,000 vehicles in 1996 (an all time high). From an economy’s perspective, the transport sector - on average - accounts for only about 1 percent of total manufacturing gross value added.1 Despite this small share to manufacturing GVA, the machinery and transport equipment industry has - on the average - accounted for 4 percent of total Philippine exports from 2000 to 2009. In 2008, the total value of exports by the machinery and transport sector has amounted to US$2.1 billion (F.O.B) beating out the garments sector as the second largest value of manufacturing export (Table 1). 1 Food manufactures, Products of petroleum and coal and Manufacture of electrical machinery have the largest share to total manufacturing gross value added with 37 percent, 16 and 6 percent respectively. 154 Table 1:Philippine Exports by Major Commodity Group (Million US Dollars FOB) Commodity Group 2004 2005 2006 2007 2008 Agro-based Products 1,235 1,562 1,574 1,781 2,162 206 442 458 521 612 34 33 28 34 34 Mineral Products 757 819 2,103 2,605 2,498 Petroleum Products 381 586 918 1,109 1,240 33,604 36,955 39,722 41,769 40,999 1,603 1,835 1,715 1,854 2,113 217 2,309 2,646 2,300 1,949 27,871 28,499 29,683 31,085 29,927 37,326 41,255 47,410 50,433 49,078 Other Agro-based Products Forest Products Manufactures Of which machinery and transport Of which garments Of which electronics Total Exports Source: Philippine Statistical Yearbook. Still, in terms of number of players, the sector is considered small. Currently, there are only about 308 industry players in the automotive sector (excluding authorized dealers). Figure 1 presents the distribution of the industry players according to subindustries. As can be gleaned in figure 1, the automotive industry in the Philippines is composed of two sub-sectors: 1. the vehicle assemblers (passenger cars, commercial vehicles2 and motorcycles) accounting for about 17 percent of the total industry players; and 2. the parts and components manufacturers which accounts for more than 80 percent of the firms in the automotive sector. Aldaba (2007) recognizes this dichotomy of the industry in terms of access to technology. Aldaba mentions that a small number of assemblers have access to the best industry practices and state-of-theart equipment and technology, while a large group of parts manufacturers are mostly small and medium enterprises that have low technology levels and face problems of limited capital, low productivity and lack of skilled workers. 2 Refer to utility vehicles; sports utility vehicles; Asian utility vehicles; Philippine utility vehicles; pick-ups; commuter vans; light, medium and heavy trucks and buses; and special purpose vehicles. 155 Figure 1:Distribution of Industry Players, 2007 Source: Philauto, The Philippine Automotive Industry Profile. Despite the relatively small size and lackluster performance of the automotive industry, the Philippine government has consistently issued policies aimed at improving the performance and increasing the size of the sector.3 The most recent of these policies would be the New Motor Vehicle Development Plan which provides incentives like tax breaks offered in free trade zone areas, income tax holidays, duty drawback arrangements and other benefits in order to encourage them to continue business in the Philippines. The Philippine government has recognized the importance of the sector because of its deep forward and backward linkages. The backward linkages are composed of the first tier industries that directly supply the needs of the local automotive industry, and the second and third tier industries that are the subcontractors of the first tier as well as providers of the raw materials that are needed by the first tier. The forward linkages include shippers, forwarders, dealers and other upstream services. 3 Aldaba (2008) has listed a number of policies dating back from 1970s all focusing on improving the sector. 156 2.1. Automotive Assemblers There are 52 manufacturers of passenger cars, commercial vehicles and motorcycles in the industry, 14 of which are car assemblers. Major vehicle assemblers are composed of five Japanese companies – Toyota, Mitsubishi, Honda, Isuzu, and Nissan; one American company – Ford Motors; and one Korean company – Hyundai, which has been increasing its market share in recent years. The Philippine automotive industry experienced its highest vehicle sales in 1996, with over 160,000 units sold, 55 percent of which were passenger cars while the remaining 45 percent were commercial vehicles. Sales declined during the 1997 Asian crisis, but have been showing gradual improvement in recent years. From 1998 to 2010, sales increased by 76 percent. Units sold reached over 100,000 in 2007 and has since been increasing annually by 6 percent on average. Sales increased by 7 percent from 132,444 units in 2009 to 141,218 units in October 2010. In addition, sales in 2010 (October) is 20,000 units shy of the 162,087 high sales in 1996. Statistics also indicate that commercial vehicle sales dominated over passenger car sales starting 1998. Aldaba (2007) recounts that preference for commercial vehicles, such as AUVs, is due to their affordability, sturdy built and capacity to accommodate members of large Filipino households. Moreover, with its make, utility vehicles can withstand the poor condition of some road networks in the Philippines. 157 Figure 2: Vehicle Sales in the Philippines Source: CAMPI Website. Looking closely at the production side, domestically assembled vehicles (CKD) decreased since after 1997. Production picked up towards 2003 with 92 percent of total sales, but again declined to 49 percent towards 2009. Meanwhile, importation by domestic firms increased from 4 percent to 51 percent of total sales in the recent decade. This importation was facilitated by the implementation of tariff schemes in the ASEAN, such as the Common Effective Preferential Treatment (CEPT) under the ASEAN Free Trade Agreements (AFTA). 158 Table 2: Production and Importation of Vehicles Year 1991 1992 1993 1994 1995 1996 1997 1998 1999 2000 2001 2002 2003 2004 2005 2006 2007 2008 2009 Sales 47,949 60,360 83,811 103,471 128,162 162,095 144,435 80,231 74,414 74,000 76,670 85,587 92,336 88,068 97,063 99,541 117,903 124,449 132,444 Production/CKD Sales New CBU Imports 47,008 58,899 82,202 99,346 127,016 137,365 120,488 67,903 64,635 70,851 65,202 74,734 85,388 58,822 58,566 56,050 61,128 61,513 64,498 941 1,461 1,609 4,125 1,146 24,730 23,947 12,328 9,779 3,149 11,468 10,853 6,948 29,246 38,497 43,491 56,775 62,936 67,946 CBU Imports as % of total Sales CKD Sales as% of total Sales 2 2 2 4 1 15 17 15 13 4 15 13 8 33 40 44 48 51 51 98 98 98 96 99 85 83 85 87 96 85 87 92 67 60 56 52 49 49 Source: Table 1 in Aldaba (2008) update by the same author. From a regional view, vehicle sales in the Philippines have been lagging behind its neighbors in ASEAN. Even if sales around the region declined sharply during the 1997 Asian financial crisis, Indonesia, Malaysia and Thailand showed strong recovery, with Singapore catching up in recent years. Sales in the Philippines, however, have been slow to recover. While in Viet Nam, sales increased by 92 percent from 2006 to 2007. It was assessed that after the Asian financial crisis in 1997, the Philippine automotive industry operated below its total capacity and suffered from a weakened demand. 159 Figure 3: Vehicle Sales in Selected ASEAN Countries Source: Various country websites. The Philippines exports passenger cars – mostly those with spark ignition combustion engine exceeding 1500 cc but not more than 3000 cc – sent to Thailand and Indonesia, under the ASEAN Industrial Cooperation Scheme or AICO.4Aldaba (2008) reports that the sector experienced an increase in exports from 12,367 units in 2003 to 14,417 units in 2005, then a drop to 6,730 units in 2006. There is one firm, Ford Motors, which exports volume CBU. Major automotive players have expressed that, even with incentives, it is difficult for them to export locally-assembled CBUs. Apparently, the exports market has become difficult to enter because of AFTA as well as JPEPA. This suggests that at this point, improving competitiveness needs further attention than provision of incentives.5 2.2. Auto Parts and Components 4 5 The AICO scheme is an industrial cooperation program of ASEAN to promote joint manufacturing industrial activities between ASEAN-based companies. The major privilege of this scheme is that approved AICO products, output of an AICO arrangement, shall enjoy preferential tariff rates of 0-5%. (www.aseansec.org) Cahiles-Magkilat, B.(2011) “PH assemblers find exporting CBUs hard,” Manila Bulletin Newspaper Online, January 1, 2011. <http://www.mb.com.ph/articles/295936/ph-assemblersfind-exporting-CBUs-hard>, accessed January 5, 2011. 160 The Philippine automotive industry is composed of 256 firms that manufacture auto parts and components. Among this number, 124 are first-tier suppliers (of the domestic automotive assemblers), while 132 are second- and third-tier suppliers (of the first-tier manufacturers), mostly small and medium enterprises (Aldaba 2008). These firms are engaged in metalworking, rubber, seats and trims, plastics, electrical systems for automotives. The products they manufacture include:6 suspension: tires, steel rims, aluminum wheels, leaf and coil springs interior: carpets and seats electrical system: wiring harnesses, batteries, lamps and relays pressed components: mufflers, radiators, seats, frames, seat adjusters, oil and air filters, pedals rubber and plastic components: fan belts, rubber hoses and small plastic parts mechanical parts: transmission, engine parts, etc. cast and forged components: gear blanks, brake disks, brake drums. These firms can be further subdivided in terms of ownership. Some of them are 100 percent Filipino owned firms - such as the SMEs, and there are firms that are affiliated with multinational companies - for instance, firms from Japan that were brought in to supply parts and components to the mother firm (e.g. car assembler) in the country or abroad, as part of vertical integration. Major auto parts and components manufacturers include: Yazaki-Torres Manufacturing Corp. (wiring harness), United Technologies Automotive Phils. (wiring harness), Temic Automotive (Phils.) Inc. (antibrake lock system), Honda Engine Manufacturing Phils., Inc. (engines), Asian Transmission Corp. (automotive transmissions), Toyota AutopartsPhils. (automotive 6 Aldaba (2007); Raymundo (2004). 161 transmission), Fujitsu Ten Corp. of the Phils. (car stereos) and Aichi Forging Co., Inc. (forged parts) (Aldaba 2007). Auto parts and components are exported to ASEAN countries such as Thailand, Singapore, Viet Nam, and to Taiwan, the US, Japan and Europe. Figure 4 illustrates that the values of exports have been steadily increasing from 1991 to 2009, with an average annual increase of 17 percent. The bulk of exports are wiring harnesses and brakes, registering 26 percent and 21 percent of total exports in 2008, respectively (details on the products exported are in Appendix A1). Value of total exports of automotive parts and components in 2008 was US$3.5 billion. Figure 4: Value of Exports and Imports of Automotive Parts and Components (in million USD) Source: CAMPI. In terms of imports, the sector saw a drop in level of importation in 1997 (by 16%), which continued until 1998 (by 51%). Clearly, the Asian financial crisis in 1997 impacted on the importation of motor parts and components. But importation levels are slowly picking up with an average annual increase of about 12 percent (except for a 14% decrease in 2003-2004). In 2008, almost US$2 billion value of imports of auto 162 parts and components was recorded. Passenger motor vehicle parts and components, and other motor vehicle parts form bulk of imports (both almost 63% of total value) in 2008 (details on the products exported are in Appendix A2). 2.3. Policies in the Philippine Automotive Industry7 From 1916 to 1950, automobiles in the Philippines were imported mainly from the US. There was no production activity in the sector, and distributors and dealers of imported CBU units existed. However, the government had to eventually prohibit the commercial scale importation of CBU vehicles due to the depletion of foreign reserves. The Import Control Law of 1950 was then amended to prioritize the allocation of foreign currency for imports. For the automotive sctor in particular, importation of CKD car components was only allowed for automotive assemblers that were given foreign currency allocation. Subsequently, formal policies and legislations that helped shape the Philippine automotive industry were implemented (Table 3). The first formal programs were implemented in 1973: the Progressive Car Manufacturing Program (PCMP), Progressing Truck Manufacturing Program (PTMP), and the Progressive Motorcycle Manufacturing Program (PMMP). These programs prohibited the importation of CBU vehicles and allowed the government to address the need to rationalize the industry by limiting the number of car assemblers (to 5 firms) by way of requiring local content for domestically assembled cars. 7 This section draws heavily from Aldaba (2007) and Raymundo (2004). 163 Table 3: Policies in the Philippine Automotive Industry Year 1973 Program/ Policy • Progressive Car Manufacturing Program (PCMP) 1987 • Progressive Truck Manufacturing Program (PTMP) • Car Development Program (CDP) 1990 • Commercial Vehicle Development Program (CVDP) • People’s Car Program (PCP) 1992 • Luxury Car Program 1994 • ASEAN Industrial Joint Venture (AIJV) Scheme 1996 • Memorandum Order Number 346 Objectives - increase local assemblers domestic content from 10 percent in1973 to 60 percent in 1976 - promote horizontal integration in the industry by the creation of new manufacturing activities among small and medium scale enterprises through subcontracting and transfer of technology - build up exports of manufactured products in a regional (ASEAN) automotive complementation program - increase local assemblers domestic content from 32.26 percent in 1988 to 40 percent in 1990 - develop a viable automotive parts manufacturing industry - facilitate technology transfer and development - generate employment, make available reasonably priced passenger cars, and earn and save foreign exchange for the country - include the assembly of smaller cars, named as people’s car, or passenger cars with gasoline engine displacement of not more than 1200 cc - meet the minimum local content usage from 35% in 1991 to 51% in 1993 - allow the entry of high end passenger cars defined as passenger cars with engine displacement greater than 2800 cc - allow the entry of new assemblers under the ASEAN Industrial Joint Venture (AIJV) Scheme - open up the closed vehicle categories to new participants and removed restrictions on the number of models and variants - terminate the foreign exchange and local content requirements under the CDP and CVDP in the year 2003 • Car Development Program 2002 • Commercial Vehicle Development Program • New Motor Vehicle Development Program (EO 156) 2003 2004 • EO 262 • EO 244 • EO 312 - ban the importation of all types of used motor vehicles and parts and components, except those that may be allowed under certain conditions - restructure the Most Favored Nation (MFN) tariff rates for motor vehicles and their raw materials and parts and components at such rates that will encourage the development of the Philippine motor vehicle industry. - restructure the current excise tax system for motor vehicles with the end view of creating a simple, fair and stable tax structure - continue the application of AICO scheme as maybe adopted by the Association of Southeast Asian Nations (ASEAN) - give incentives to assemblers and parts and components makers for the export of CBUs and parts and components - modify the tariff rates on motor vehicle parts and components - provide special incentives to certain CBU exports - modify EO 244 to expand coverage of CBU exports and provide special incentives for the export of certain CBUs The country consequently saw an expansion in the automotive manufacturing industry with the implementation of these programs, and the government recognized the industry’s potential to stimulate growth. However, in the mid 1980s, political crisis hit the country and eventually affected the economy. To revitalize the industry, the government replaced the PCMP program with the Car Development Program (CDP) 164 and the PTMP with the Commercial Vehicle Development Program (CVDP) in 1987. The government had more pronouncedly aimed to increase local content of assembled vehicles, earn and save foreign exchange, generate employment, and develop a viable automotive parts manufacturing industry. The programs that followed were basically amendments that provided for inclusion of new car categories, as well entry of new assemblers which allowed Malaysia’s Proton to come in with a joint-venture with a Filipino firm (Autocorp Group), under the ASEAN Industrial Joint Venture (AIJV) Scheme. In 1996, MO 346 was issued and this liberated the motor vehicle development programs. This memorandum order removed restrictions on the number of models and variants. In addition, with the Philippines’ commitment to the Trade-related Investment Measures (TRIMs) in the WTO, the government terminated the foreign exchange and local content requirement in 2003. In 2002, the government legislated EO 156 or the Motor Vehicle Development Program (MVDP) to provide the automotive industry with a comprehensive industrial policy and development direction. Under this executive order, the production and/or assembly of motor vehicles and other vehicle assemblies covered under the MVDP shall be in knocked down condition only. And, only brand-new Original Equipment Manufacturer (OEM) of knocked down parts and components for assembly purposes shall be eligible for importation under the program. The EO likewise expounded on requirements for new participants and declared relaxing of limitations on the number of models and variants. And, recognizing the continuing trade liberalization and intensifying competitive environment, the government enhanced EO 156 with the issuance of EO 877-A of 2010 or the Comprehensive Motor Vehicle Development 165 Program. This Program aims to address the need to strengthen the used vehicle importation prohibition under EO 156; to take advantage of tariff reduction schemes in ASEAN; to promote maximum scale integration of the production of motor vehicles, parts and components; and enhance privileges and benefits for the industry, among others. Moreover, with the country’s trade building up, the motor vehicle development programs that started under EO 156 incorporated provisions related to tariff rates (Table 3). The government initially imposed very high tariffs combined with import restrictions8 in order to promote manufacturing of parts and components, and to protect local assemblers. Since then, with the country’s trade commitments in WTO and AFTA-CEPT, tariff rates have gone down. For instance, MFN tariff rate for motor vehicles was reduced from 50 percent in 1990 to 40 percent at present, while the AFTA-CEPT rate is 5 percent. Meanwhile, CKD parts for motor vehicles had a big drop in MFN rate from 30 percent to 3 percent in 1996-1997. However, this meant that imported parts became cheaper than locallyprocured parts, thereby alarming domestic parts manufacturers, especially the SMEs. The government then increased the tariff rate to 7 percent in 1998, then 10 percent in 2000-2003, but later on had to be reduced to 3 percent in 2004 (the AFTA-CEPT rate is also 3%). This shows that at some point, the government had to postpone or reschedule reduction in tariffs for reasons such as clamor from the affected industry or changes in industrial policies. As for other vehicles, such as CKD buses and trucks, tariffs were likewise reduced 8 There are currently no existing import quotas on CBU and CKD vehicles. There is, however, prohibition on the importation of used cars, except if for returning residents or diplomats. Importation of used trucks, buses and special purpose vehicles is also allowed but is subject to approval by the Bureau of Import Services. 166 to a range of 3-20 percent; while for parts and components, tariffs were reduced from 20 percent in 1990 to 1 percent in 2004. For tariffs on locally manufactured auto parts under EO 262, MFN rates range from 10 percent to 30 percent. Wiring harness, seat belts, air conditioning machines, radiator and transmission assembly are some of the products with 30 percent MFN tariff rate and 5 percent AFTA-CEPT rate. This puts the AFTA-CEPT rate of locally manufactured parts from 3-5 percent in general. At home, taxes imposed on motor vehicles increased from 10 percent to 12 percent in 2006. Excise taxes9 are levied on imported and domestically assembles vehicles. In 2003, another law to rationalize the excise tax scheme was enacted. This law imposed an ad valorem tax on automobiles based on the manufacturer’s/importer’s selling price, net of excise and value-added taxes. 3. The Philippine Technology and Innovation Policy Innovation has been receiving increasing attention in many developing countries as it has been recognized as an important factor in the process of modernization and industrialization. The experience of many developing countries like China and India has shown that the process of industrialization could be achieved faster through the paradigm shift from technology adoption to one of domestic knowledge production. Aside from the goal of rapid economic development through decentralization, there is the challenge of increasing globalization and competition. This challenge is more critical for firms which not only have more opportunities brought about by the access 9 Internal tax imposed on the manufacture, sale or consumption of a commodity within the country. 167 to wider regional and global markets, but also face stiffer competitions from these same markets. In order for local industries to survive and maximize the opportunities brought about by these broader markets, they must be able to adopt measures to modify production processes, introduce new products, initiate improved organizational systems and apply new marketing methods. These would entail a level of awareness in the firm of the need to improve their current capacities. Such awareness should then translate to an ability to identify external threats and opportunities, further strengthening of the firms potential to develop, acquire, effectively use and learn from technologies. Sources of technologies like network of suppliers, the academe and other research institutions should also be maximized. In the Philippines, the status of innovation has been depressing. Table 4 presents some indicators of Research and Development in the country. From 1992, the trend for the number of research and development (R&D) personnel per million population has been decreasing. It has decreased sharply from 1996 to 2002 but has improved slightly in 2003 and 2005. This improvement, however, has been unable to restore the level of R&D personnel per million population to the 1990s level. The similar trend can be observed for the number of scientists and engineers per million population. In 1992, there were about 152 scientists and engineers per million population. This figure has decreased sharply to 90 scientists and engineers per million population in the span of 10 years. The most recent available estimate reflects some improvement to the 2002 figure, but it still far from the 1990s figure. A report by the World Economic Forum compared the performance of the Philippine with those of its neighbors in Asia in terms of innovation as a component of 168 competitiveness. Their findings are in accord with the sad picture presented in the preceding paragraphs. The Global Competitiveness report of the World Economic Forum conducts a perception survey of industry organizations of different countries to evaluate the status of competitiveness within the country. Innovation is one element of their measure of competitiveness and has a number of dimensions. Table 5 presents a comparative ranking of the Philippines relative to other ASEAN and East Asian countries across all these dimensions. Among the 7 dimensions for innovation, the Philippines has been the farthest from number 1 in 6 dimensions, and one notch below the farthest in the remaining dimension. Table 4: R&D Indicators Total R&D Personnel (headcount) No. of Scientists and Engineers (headcount) Population Size (in million people) 1992 1996 2003 2005 15,610 15,837 2002 9,325 14,388 14,087 9,960 11,215 7,203 8,866 10,690 65 72 80 82 85 No. of R&D Personnel per million population 239 220 116 176 165 No. of Scientists and Engineers per million population 152 156 90 108 125 GDP (current prices/ in million pesos) 1,351,559 2,171,922 3,963,873 4,316,402 5,444,039 GNP (current prices/ in million pesos) 1,375,838 2,261,339 4,218,883 4,631,479 5,248,064 Total R&D Expenditures (current prices/ in million pesos) 2,940.5 4,144.9 5,769.8 5,909.7 6,326.7 R&D Expenditures as % of GDP 0.22 0.19 0.15 0.14 0.12 R&D Expenditures as % of GNP 0.21 0.18 0.14 0.13 0.12 Source: Philippine Statistical Yearbook. 169 Table 5:Ranking of Selected Asian Countries (out of 139 countries) on Innovation Capability, 2010-2011 Capacity for Innovation Quality of Scientific Research Institutions Company University- Government spending industry procurement on R&D collaboration of advanced in R&D technology products Availability of scientists and engineers Utility patents per million population China Japan Korea Taiwan, China Indonesia Malaysia 21 2 18 14 30 25 39 15 25 17 44 32 22 3 12 9 26 16 25 19 23 12 38 22 12 41 39 7 30 8 35 2 23 8 31 33 51 2 5 1 89 29 Philippines 80 108 85 85 129 96 71 Singapore Thailand Vietnam 17 56 32 11 59 63 8 48 33 6 42 62 2 59 18 10 40 66 11 65 87 Source: The Global Competitiveness Report Section XII Innovation, 2010-2011. Although all the dimensions are critical and should be given appropriate attention, one should give extra notice to the Quality of Scientific Research Institutions and Government procurement of advanced technology products. Out of 139 countries in the list, the Philippines has ranked 108 and 129 respectively. This means that business leaders and heads of industries perceive the quality of research institutions in the Philippines to be really poor. It is no surprise therefore, that the linkages between research and development institutions and businesses and manufacturing firms are weak and limited. Paderanga (2009) explains that this points to the problem of lack of coordination among various stakeholders. In terms of government procurement decisions, the business leaders perceive that the procurement decisions of government do not foster technical innovation in the country. This occurred despite the introduction of a number of Science and Technology Master Plans by the Department of Science and Technology.10 10 “In terms of a policy framework that sets the S&T objectives and detailed guidelines for attaining these, the country has had four major ones so far since 1986. Currently, the long-term National 170 Zeroing on programs and policies promoting innovation in the automotive industry, the 2004-2010 Medium Term Philippine Development Plan (MTPDP) recognized the automotive sector as one of the major industrial sectors where investment should be promoted because of its forward and backward linkages. The strategy adopted by the Philippines to improve its automotive sector was unlike that of Malaysia and Indonesia which attempted to institute their own car programs. For the Philippines, the strategy would be to attract multinational car companies to invest and set up production in the country. Examples of policies that allowed the entry of new assemblers in the market were The Car Development Program (CDP), CDP Category III, ASEAN Industrial Joint Venture (AIJV). The Car Development Program (CDP) allowed the entry of Honda, Daewoo, Daihatsu, Fiat and Kia. Under the CDP Category III, Mercedez-Benz, BMW and Volvo entered the market while Proton of Malaysia entered the AIJV. The entry of these new assemblers meant the influx of technology. This is because part of the agreement under the CDP was the utilization of an existing assembly facility or establishment of a new assembly facility (Lee U 2005). Recently, the issue of climate change and sustainable energy has encouraged the automotive industry to innovate. The 2008 Forum of FilipINNOVATION recognized the need to innovate the local public utility vehicles in order to improve fuel economy and reduce environmental impact. A number of cities have initiated the use of Electric Jeeps in their routes as part of this initiative. On the part of the assemblers, one of the major issues for the manufacture of the electric jeep is the electric battery that they have to import. The challenge now for the automotive parts manufacturers is to design S&T Master Plan, 2002 to 2020 serves as the guiding framework for technology policy in the country.” (Macasaquit 2010) 171 and manufacture a similar or better type of battery for the use of local assemblers. Another issue is also the high cost of manufacturing an electric jeep which is about 500,000 to 630,000. 4. Methodology The study adopted the instrument for measuring innovation capability developed by Bessant et al. (2001) and applied by Hobday, Rush and Bessant (2002) in their analysis of the innovation capability of selected industries in Korea. With the use of three tools: the simple survey tool, interview tool and case study tool, the instrument, which is based on the framework presented in Figure 5, classifies firms into 4 different types depending on their innovation capability level. Figure 5: Groups of Firms according to Technological Capability High Degree of Awareness of Technology Type D Firm: Creative Type C Firm: Strategic Type B Firm: Reactive Type A Firm: Unaware/ Passive Low Degree of Effective Practice High Source: Bessant et al. (2001). Type A firms are identified as Unaware/Passive firms because these firms have low degrees of awareness of technology and of effective practice of technology 172 development. These firms are less likely to survive against hostile, competitive and technology-driven environments because these firms are unaware of the need for technological development, or because these firms do not realize or recognize the need for technological development which is necessary for them to effectively compete. For Unaware or passive firms, there is an urgent need for a basic improvement program, the goal of which is to enable firms to recognize the need for change. These changes include the development of a strategic framework for manufacturing; and identifying, acquiring and implementing necessary technologies. Long term assistance should be provided in order to improve assembly capabilities and develop engineering skills. An environment where opportunities for progressing to product development should also be provided (Hobday et al. 2002). Unlike Type A firms which are unaware of the need for technology development, Type B firms have a good comprehension of the need for technology development. Unfortunately, their understanding of the need for technology development does not translate into practice because of internal resource limitations. Type B firms are described as Reactive because they would normally face technological threats and possibilities with knee-jerk reactions and slight procedural adjustments without fully understanding the possibility of taking advantage of these events and situations for their own benefit. These firms are characterized by limited resources which include poor human capital (skills), lack of background and experience in technology, and underdeveloped external networks. Because Reactive firms have limited resources to develop a strategic framework for technology, they should be given assistance in terms of crafting such a framework. This framework would guide them in facing technological threats and possibilities. 173 More than that, assistance should also be provided to strengthen their resources, technology experience and networks. In the long term, the assistance provided is expected to decrease as these firms will eventually develop an internal capability for technology development and innovation. Type C firms not only have a deep awareness of the need for technological change but also have the ability to institutionalize the development and implementation of new projects and innovation systems. These firms have a strong ability to search, acquire, implement and improve technology because of their internally developed strategic technological framework. Type C firms are weak in terms of the ability to create new opportunities with the use of technology. Despite having a strategic technological framework, type C firms may have difficulty in finding and acquiring technology that is beyond their traditional line of business. However, they can easily build on their strengths to move beyond their comfort zones and expand into other markets. Similar to Type B firms, Type C firms also need support in terms of developing internal capabilities, but the focus would be in terms of technical expertise and networks in order to strengthen R&D capabilities. Hobdayet al. (2002) suggests access to technical and marketing expertise; link up with universities which have innovative ideas; network with specialist research and technology organizations on certain projects, be the kinds of assistance provided to these firms. Type D firms are at the forefront of technology development, having technological capabilities that have been cultivated and well-developed. Because of this, they have a more pro-active approach in terms of changing the industrial environment through new and modern technology. Their strength lies in strong internal resources, high degree of absorptive capacity and extensive technology and market networks. 174 For Type D firms, the needed support focuses on strengthening their internal capabilities and ensuring that an enabling environment would sustain their position as market leaders in terms of innovation. These firms can also provide assistance to the government in terms of which strategic areas should be focused on and which policies should be implemented in order to develop the national innovation system. Hobday et al. (2002) cites the case of Singapore and UK as examples where the governments discuss programs and policies with leading industrialists from such firms. The instrument isdesigned to focus on the innovation capability within firms. It is based on the understanding that firms operating in the same economic and political environment may have different levels of innovation due to a number of firm-level factors like firm policies, priorities and resources. By using the three tools, the instrument aims to obtain information on innovation capabilities within firms to generate insights into the development process. Because of limitations in time and resources, only the simple survey tool and the interview tool were used in the conduct of this study. The simple survey tool is a perception survey administered to middle and top management personnel of the firm in order to gather their perception on a number of innovation related statements pertaining to their firm. Their responses are translated into numerical quantities in order to classify them according to the 4 types. In order to better understand the dimensions where automotive firms need support and what type of policies are needed to enable them to improve in these dimensions, their degree of technological capability and innovativeness is further analyzed. This is accomplished by looking at the nine activities of technological capability which enable firms to choose and use technology to create competitive advantage. These activities 175 are categorized as follows: 1. Awareness of the need to improve 2. Search ability in relation to external threats and opportunities 3. The building of distinctive core capabilities 4. The development of a technology strategy to support the business 5. The ability to assess and select the appropriate technological solutions 6. The acquisition and absorption of the technologies in question 7. The implementation and effective use of the technologies 8. The ability to learn from experience in order to improve technological change capabilities 9. The ability to form and exploit linkages with a network of suppliers and collaborating firms. The first of these activities is awareness. This refers to the importance of technology in maintaining a firm’s level of competitiveness. Being aware of the need to improve also recognizes the fast-paced world of technology development and implies that a competitive firm keeps itself informed of important technological developments. Related to awareness is the second activity, searching for technology trends or events which might challenge the competitiveness of the firm or provide opportunities for the firm to be more competitive. The firm takes a pro-active stance when it comes to technology development by assigning personnel to be responsible for seeking out technology events and trends. Building a core technological competence implies that the firm has identified, protected and maximized its strengths in terms of technology. Through these technological strengths, the firm has developed a comparative 176 advantage in certain areas of the business process. Associated with developing a core technological competence is the firm’s development of a technology strategy. A firm leading in business and innovation would have a technology strategy incorporated in its business strategy. The technology strategy states the visions, objectives and priorities in terms of technology. It would also include which technology to out-source and which to develop in-house. A strong capacity to assess and select technology among the range of technological options available is one of the characteristics of a highly innovative firm. They are able to make comparisons among various options, and based on these, it would be able to identify which technology best suits their needs. The next category of technology activity is about how a firm uses its resources to acquire the technology it has evaluated as best suited for its needs. Various techniques may be adopted: from as simple as purchasing the technology to as complicated as developing the technology through in-house research and development. A highly innovative firm is able to employ the various techniques in order to bring in technology from external resources or develop technology in-house. Following the acquisition of technology would be implementation and absorption of the acquired technology in the firm. For the firm that has acquired the technology, implementation in the firm may involve different phases like further fine-tuning of the technology to meet the company’s needs or various trainings to familiarize the entire organization. This process may be viewed as a big project that requires strong project management capability of the firm. Apart from searching, acquiring and implementing technology, another important activity for the firm would be to learn from its (and other firms’) experiences in 177 implementing technology-related projects. Highly innovative firms have a recognized and institutionalized system which allows them to further improve their business processes and strategy. External sources of technology like consultancy companies, government research institutions and the academe may be sources of technology for the firm. A highly innovative firm has a well-developed network of these external sources of technology which it regularly consults. It has achieved a level of openness with these organizations that it shares knowledge in order to contribute to the further development of technology. The following section presents the results of the application of the instrument to 9 automobile assemblers or parts and components manufacturers. 4.1. The Sample and Its Characteristics For the purpose of this case study, 9 firms were selected and interviewed using the audit tool for measuring technological capability. The characteristics of these selected firms can be seen in Table 6. Despite the small number of firms in the sample, the coverage of the selected firms was designed to provide different perspectives on innovation capability. For instance, Firms B and I are assemblers which have different characteristics and levels of innovation capability. The questionnaires were sent to a number of large automobile assemblers in the country. But because of some policy being implemented in their respective firms regarding participating in innovation surveys, the said firms have declined to participate in the study despite assurances that the names and certain details about their establishment shall be withheld in the final report. Thus, the case of 178 assemblers for this study has been limited to one local assembler and one large automobile assembler. Also included in the 9 firms are parts and components manufacturers (Firm C, Firm E, Firm F, and Firm G) which supply the needs of the assemblers. Other firms (Firms A, Firm D, and Firm H) could be classified as second or third tier firms or those that the parts and components manufacturers consider as suppliers. Interesting insights can be derived by comparing the different levels of innovation within and across these groupings. Other possible groupings that could provide interesting insight would include ownership (Joint Venture, Filipino, Foreign owned), and employment size (Small, Medium, Large). Table 6: Characteristics of Interviewed Firms Key General products Questions Firm A Molded rubber parts for the automotive and electronic industries Firm B Firm C Firm D Electronic version of local public transport Automatic wires and parts manufacturing Wireharness manufacturing Products Grommets and covers for automotive wiring and harness, Boots, covers and seals for engine and transmission parts, O-rings and packings for filter systems, O-rings and packings for gas and water meters, Dampers, bush, caps and step rubbers for motorcycles, Packings, o-rings, cap breather, seals, base pad and grommets for power windows and antenna assemblies. Assmebles E-jeep No. of Employees 203 50 Type of Ownership Joint-venture Filipino-owned Tier 2 Assembler Brake hose, power steering hose 410 Joint-venture 1 Wireharness manufacturing 309 Filipino-owned 2 Firm E Plastic molded parts Plastic molded parts 260 Joint-venture 1 Firm F Automotive parts Fans; motors 112 Foreign-owned 1 Firm G Automotive parts Electronic horn and other electronic products 1686 Foreign-owned 1 Firm H Automotive parts Manufacturing of wire harness Firm I Automotive vehicles Assembler 93 Joint-venture 2 2164 Joint-venture Assembler Admittedly, the limited number of firms would not allow for conclusions about the general automotive industry of the country. However, the contribution of this analysis would be able to provide a snapshot of the automotive industry of the Philippines, and 179 to raise issues pertaining to innovation and technological capability that have been long over-looked and neglected. 5. Results of the Audit Tool The selected establishments were asked to complete the Simple survey tool in order to be able to get an initial understanding of the firm’s perception on technology and innovation capability. To further elaborate on the answers on the simple survey tool, interviews with the firm were conducted using the questions outlined in the interview tool. The following section summarizes the results of the audit tool. For each firm, diagrams of innovation capability shall be presented based on the simple survey and the interview tools. 5.1. Firm A Firm A manufactures rubber products for the automotive and electronics industry like boots, covers and seals for engine and transmission parts. The establishment is a joint-venture between Japanese and Filipino stockholders. Based on the number of employees, Firm A can be classified as a large firm (more than 200 employees). In terms of self-evaluation of innovation capability (as reflected by the results of the simple survey tool), Firm A is a Type C Strategic firm. However, its score (54) is on the lower end of the range (49-72) for a strategic firm. This implies that there may be a number of weaknesses in the different categories of technology activity. Thus, a detailed analysis is necessary. Table 7 presents the 9 different categories of technology activity and the score of Firm A for each of these categories. 180 Table 7: Results of Simple Survey Tool for Firm A Best Practice 8 8 8 12 8 8 8 12 24 Awareness Search Building a core technological competence Technology strategy Assessing and selecting technology Technology acquisition Implementing and absorbing technology Learning Exploiting external linkages and objectives Firm A Score 6 4 5 8 4 4 4 6 13 Percentage 0.75 0.5 0.63 0.67 0.5 0.5 0.5 0.5 0.54 As can be seen from Table 7, Firm A has performed strongest in terms of awareness (75 percent of best practice score) followed by technology strategy (67 percent) and building a core technological competence (63 percent). Firm A has scored 50 percent for all the remaining five categories of technology activity, except for Exploiting external linkages and objectives which is the activity where Firm A has scored 54 percent. To probe deeper into the meaning of these scores, the interview tool was used. The interview tool was structured in a way that for each of the category of technology activity, an interviewer’s assessment should be provided by the interviewer. Based on the responses to the key questions, the author’s evaluation of the innovation capability of Firm A is presented as Figure 6. Figure 6 shows that the strengths of Firm A are on Awareness (rating of 4), Searching (rating of 3), Building a core technological competence (rating of 3) while in all the other areas, the firm was given the rating of 2. 181 Figure 6: Results of Simple Survey Tool and Interview Tool for Firm A Exploiting external linkages Awareness 4 3 Searching 2 Building a Core Tech Competence 1 Learning 0 Implementing and absorbing technology Technology acquisition Technology Strategy Assessing and selecting technology Interview tool Simple Survey From figure 6, it can be seen that there is very little discrepancy between the results of the simple survey tool and the interview tool. One interesting point that should be observed is that the interview tool has pointed out the strengths of Firm A. The firm is aware of the importance of technology and is aware how far it is from the technological frontier. Admittedly, the firm has placed itself below the technological frontier for their type of business conceding the fact that some of their production processes have not been fully automated. This level of awareness gives Firm A an advantage against its competitors. Firm A is cognizant that there is some level of technology that it needs to target or implement in order for them to not be left behind. The interview tool has allowed Firm A to mention some of the activities it has conducted in order to search for new or existing technologies that may be applicable to their company. The responses of Firm A have also indicated that it is aware of how technology allows the firm to meet the different designs and specifications required for 182 different products and markets. Apart from the usual sources of technology like forums and exhibits (locally and abroad), Firm A also uses linkages with customers and suppliers as sources of new technology. The limitation, perhaps, that Firm A is experiencing in terms of searching for the appropriate technology is evaluating the technology’s applicability. This has been evident in its response on the simple survey tool on the items pertaining to search. Another dimension of innovation capability where firm A has shown relative strength is in terms of building a core technological competence. The “ideal” firm which rates 4 in this dimension is able to offer something better (more efficient, cheaper, better quality) goods or services which other manufacturers cannot. Firm A has recognized that it is able to offer highly specialized production designs particular to the requirements of its customers because they utilize some technologies that other local firms in the same industry have not yet acquired. They are aware that in time, the other firms would be able to obtain these technologies. So, they periodically endeavor to update their machineries and existing technology. They have also incorporated technology development as one of the key areas in their business plan in order to emphasize the importance of technology in affecting their production, efficiency and competitiveness. Unfortunately, in all the remaining areas, the rating of Firm A has somehow been unremarkable. This means that Firm A should focus in translating the awareness of the need for improvements in technology and the desire to improve technology into operational action plans. Taking the dimension of Learning as an example, the firm got a rating of 2. The reason being that although it mentions the conduct of project feasibility studies in order to capture learning from projects, the firm provided no other 183 process or structure in place that would enable knowledge gained from the conduct of a project to be stored and disseminated. The project feasibility study at the beginning would only allow limited transfer of learning because it is done at the beginning of the project and no project evaluation is conducted after. 5.2. Firm B Firm B is a small (less than 100 employees), Filipino-owned assembler of the electronic version of the jeepney (local public utility vehicle). Based on its answer on the simple survey tool (Table 8), Firm B is ranked as Type CStrategic with a score of, the score of Firm B (69). From Table 8, Firm B has achieved a perfect score for Awareness, Assessing and selecting technology and technology acquisition. It has also garnered high scores (greater than 75 percent) for all the other categories of technology activity except for exploiting external linkages and objectives. For this category, the firm only scored 25 percent of the maximum possible score. 184 Table 8: Results of Simple Survey Tool for Firm B Categories of Technology Activity Awareness Search Building a core technological competence Technology strategy Assessing and selecting technology Technology acquisition Implementing and absorbing technology Learning Exploiting external linkages and objectives Best Practice Firm B Scores Percentage 8 8 8 12 8 8 8 12 24 8 6 7 10 8 8 6 10 6 1 0.75 0.88 0.83 1 1 0.75 0.83 0.25 A detailed analysis of the categories of technology activity using the interview tool may provide a better assessment of the innovation capability of Firm B. Figure 7 presents the results of the Simple survey tool juxtaposed with the results of the interview tool. Comparing the results of the interview tool with that of the simple survey tool, it can be seen that there have been discrepancies between the ratings of the two tools. There have been dimensions of innovation capability where the simple survey tool is lower than the interview tool (i.e. Building a core competence, exploiting external linkages). In contrast, the interview tool results for assessing and selecting technology, technology acquisition, implementing and absorbing technology and learning has ratings lower than the simple survey tool. To reconcile the discrepancy, it would be beneficial to look at the explanations and the responses in the interview tool and also the questions in the simple survey tool. This strategy shall be applied to all cases where the ratings between the two tools do not coincide. In terms of Assessing and selecting technology, there has been apprehension in giving the full rating of 4. The reason behind this rating is the fact that the decision to acquire the technology rests only on the owners of the firm with no clear criteria used for assessing the applicability of the technology except that in the long term, the 185 technology should not be bad for the environment. For technology acquisition, the interview tool rating is one degree lower than the simple survey tool because the firm has been limited to acquiring technology from external sources. This implies that Firm B tends to rely on “tried and true” approaches, particularly for equipment purchases. Firm B has mechanisms in place to enable learning and continuous improvement within the firm. Among these are allowing the participation of management in industry trade shows, exhibits or forums and engaging employees to undergo training. In terms of project reviews, the firm undertakes some basic reviews but these seem irregular and informal. In terms of implementing and absorbing technology, although the respondent agrees (based on the simple survey tool) that they have a “good system for assessing technology projects,” the response from the interview tool fails to elaborate on the framework for risk management. This explains the lower rating of the interview tool relative to the simple survey tool. Regarding the external sources of technology, Firm B is aware of external sources of technology (i.e. their participation in numerous forums brought to their attention a type of fast-charging battery being manufactured in Taiwan). But this awareness of external sources is confined to a narrow field and occasional use. The simple survey tool actually indicates that Firm B has collaborations with universities and government research institutes regarding important technology projects. There is also a slight discrepancy between the ratings for Building a core technological competence. The rating for the interview tool is based on the capability of Firm B to provide a product or service that its competitors are not able to provide. 186 The respondents relate that they were able to service electric jeeps produced by other manufacturers because of their capability to provide after-sales services. Finally, the two tools agreed on the ratings for awareness and searching. The firm realizes the importance of technology in order to rise above its competitors. Technology upgrading would also allow the firm to expand to the production of electric tricycles. This level of awareness and appreciation of technology reflects the maximum rating on awareness. Figure 7: Results of Simple Survey Tool and Interview Tool for Firm B Exploiting external linkages Awareness 4 3 Searching 2 Building a Core Tech Competence 1 Learning 0 Implementing and absorbing technology Technology Strategy Technology acquisition Assessing and selecting technology Interview tool Simple Survey 5.3. Firm C Firm C is a large firm (more than 200 employees) which manufactures automotive parts and components, specifically, brake and power steering hoses. Similar to Firm A, it is a joint venture between Filipino and Japanese stockholders. 187 Table 9: Results of Simple Survey Tool for Firm C Best Practice Awareness Search Building a core technological competence Technology strategy Assessing and selecting technology Technology acquisition Implementing and absorbing technology Learning Exploiting external linkages and objectives Firm C Scores 8 8 8 12 8 8 8 12 24 8 7 6 11 8 8 4 12 17 Percentage 1 0.88 0.75 0.92 1 1 0.5 1 0.71 Based on the results of the simple survey tool, Firm C can be classified as a Type D Creative firm. It scored a perfect score in the following indicators: awareness, assessing and selecting technology, technology acquisition and learning. On the other hand, Firm C scored lowest on implementing and absorbing technology (50 percent) and on exploiting external linkages and objectives (71 percent). However, similar to Firm B, there have been discrepancies on the results of the Simple survey tool and the interview tool. Figure 8 presents a comparison of the results of the two tools. From Figure 8, the two tools agree on the degree of awareness (having a rating of 4 for both tools). The discrepancy between the two tools is relatively small for implementing and absorbing technology. The discrepancy has been largest for assessing and selecting technology and technology acquisition. Firm C obtained a perfect score for awareness because it has displayed an appreciation of the contribution of technology to its competitiveness. The firm was also aware of its location in the technology frontier for its business, describing itself as a leading local firm in terms of technology. Relative to other foreign countries, however, the firm is still lagging behind in terms of the use of more modern technology. 188 Figure 8: Results of Simple Survey Tool and Interview Tool for Firm C Exploiting external linkages Awareness 4 3 Searching 2 Building a Core Tech Competence 1 Learning 0 Implementing and absorbing technology Technology Strategy Technology acquisition Assessing and selecting technology Interview Tool Simple Survey Because Firm C manufactures highly specialized rubber products specific to the demands and specifications of the customers, it faces limited competition in terms of the manufacture of these products. The firm also relies on its mother company (in Japan) for information and the supply of technology. These factors have resulted in some sense of complacency and dependence on the mother company on the part of the firm. This has reduced its activities on searching for new and modern technology, building a core technological competence, technology strategy, assessing and selecting technology and technology acquisition. This is the reason why the interviewer’s rating for these innovation activities of the firm has been relatively lower than the results of the simple survey tool. The reliance on the mother company has also contributed to the weak linkages with other sources of technology. The firm disagreed with statements 23 and 24 on the 189 simple survey tool pertaining to working with universities and governments research institutions respectively. One bright spot for Firm C would be the activities it has undertaken to learn from the adoption of projects. They have a review and documentation system for each technology (machinery, equipment or process) in order to ensure that the knowledge derived from these would be available for the next projects, thus building upon the knowledge of derived from previous projects. To ensure continuous learning, the firm has also committed itself to frequent review of international standards and analyzes the applicability of these to the company. 5.4. Firm D Similar to Firm C, Firm D is an automotive components and parts manufacturer, specifically manufacturing wire harnesses. With about 300 employees, it can be classified as a large firm. However, unlike Firm C, Firm D is a 100 percent Filipino firm. The responses for Firm D show that it can be classified as a Type D Creative firm because of its perfect scores on Awareness, Building a core technological competence, Assessing and selecting technology, Technology acquisition and Implementing and absorbing technology. In terms of areas where it may need some improvement, Firm D has a relatively low score on Learning, and Exploiting external linkages and objectives. 190 Table 10: Results of Simple Survey Tool for Firm D Best Practice Firm D Scores Percentage 8 8 8 12 8 8 8 12 24 8 7 8 10 8 8 8 8 17 1 0.88 1 0.83 1 1 1 0.67 0.71 Awareness Search Building a core technological competence Technology strategy Assessing and selecting technology Technology acquisition Implementing and absorbing technology Learning Exploiting external linkages and objectives Figure 9: Results of Simple Survey Tool and Interview Tool for Firm D Exploiting external linkages Awareness 4 Searching 3 2 Building a Core Tech Competence 1 Learning 0 Implementing and absorbing technology Technology acquisition Technology Strategy Assessing and selecting technology Interview Tool Simple Survey The results of the simple survey and interview tool have been relatively consistent for awareness, building a core technological competence (rating of 4 for both tools) and exploiting external linkages (rating of 3 for both tools). It also has relatively close ratings for searching, technology strategy and learning. The discrepancy is largest for implementing and absorbing technology. In terms of awareness, the firm ranked high because similar to firm C, Firm D is aware of the technological frontier for its industry. This level of awareness of the types 191 of technology available locally and internationally provides the firm a point of reference from which it can compare itself. The firm understands that it is able to meet the demands of the customers because of technology. Thus, they take a pro-active stance in the search for new and applicable technology. To accomplish this, the firm sends its managers abroad to attend exhibits and to keep track of the changes in technology. The high ranking for building a core technological competence is due to the fact that the firm is aware that its distinctive competitive edge is not just about providing a low price. A large part of it is meeting the highly technical and specific demands of the customer. To protect their technological edge, the firm has sought to acquire ISO certifications. The firm also provides trainings (locally and abroad) to the technical staff, and they are required to attend these trainings in order for them to update their knowledge and sharpen their competitive edge. The firm has perfect scores for assessing and selecting technology, technology acquisition and implementing and absorbing technology. Despite these glowing scores, the interviewer has apprehensions in providing such a ranking to Firm D because the description for a perfect score implies that the Firm leads the market in terms of technology and defines the technology frontier. This clearly does not apply to Firm D as it is still below the technology frontier. Still, one can consider Firm D as a highly innovative firm because it has a well-developed framework (taking into consideration not only price but also support service, applicability and long-term use) in terms of assessing and selecting technology; it acquires technology by purchasing equipment, it has familiarized itself with the technology of the machines and equipment so that it is able to implement in-house modifications on these technologies 192 in order to suit their needs for the production of other products. Firm D has been aware of external sources of technology, but it has been confined to a narrow field of use. This observation calls for the need to improve the linkages between universities, government research institutions and other stakeholders to ensure that the technologies that are produced and developed are in line with the needs of the firms. Learning activities is one weakness of Firm D as reflected in the irregular and informal project reviews it conducts. 5.5. Firm E Firm E manufactures plastic molded parts as inputs for automotive parts. Firm E is a large firm with more than 200 employees. It is a joint venture between Filipino and Japanese stockholders. Table 11: Results of Simple Survey Tool for Firm E Awareness Search Building a core technological competence Technology strategy Assessing and selecting technology Technology acquisition Implementing and absorbing technology Learning Exploiting external linkages and objectives Best Practice Firm E Scores Percentage 8 8 8 12 8 8 8 12 24 6 6 6 11 6 6 6 9 18 0.75 0.75 0.75 0.92 0.75 0.75 0.75 0.75 0.75 Garnering a total self-perception rating of 74, Firm E can be classified as type D Creative. But like the first few firms, it would be at the lower end of the spectrum for Creative firms. It has perceived Technology strategy as its area of strength. In terms of all the other areas, Firm E has scored about 75 percent (Table 11). Further analysis using the interview tool shows that among the 9 activities of 193 innovation activity, Firm E is strongest in terms of awareness. It would be interesting to note, though, that it has not translated this awareness into innovation and technology development activities (Figure 10). The main issue with Firm E is that its research and development is mainly dependent on its mother company (much like Firm C). Similarly, Firm E manufactures highly specific products which make competition limited. It seems that Firm E has more intense dependence on its mother company than Firm C. The processes for innovation and upgrading of the Firm lie solely on the mother company with very minimal input. This can be seen in the process by which they assess, select and acquire technology, which is mainly resting on the tried and true methods without exploring other new methods. The discrepancy can then be explained by the fact that the respondent sees the mother company and the local company as just one entity. In contrast, the interviewer sees the local company as a separate entity that should be engaging in upgrading and innovation with the support and leadership by the mother company. For instance, in terms of using technology, the respondent mentioned that the local firm has limited linkages with university and government research institutions, but the mother company is more likely to interact with these research and development bodies. With the perception that the Mother Company and local company are just one entity, the responses in the simple survey tool reflect a higher score than the responses in the interview tool which views the identities of the two companies separately. 194 Figure 10: Results of Simple Survey Tool and Interview Tool for Firm E Exploiting external linkages Awareness 4 3 Searching 2 Building a Core Tech Competence 1 Learning 0 Implementing and absorbing technology Technology acquisition Technology Strategy Assessing and selecting technology Interview Tool Simple Survey 5.6. Firm F Firm F is a foreign-owned firm with more than 100 employees. Firm F manufactures fans which are used as inputs for the manufacture of automotive engines. Based on the results of the simple survey tool, Firm F can be classified as a type D Creative firm. Table 12 shows that the strengths of Firm F are in terms of Awareness, Assessing and selecting technology and learning. Search, Building a core technological competence, implementing and absorbing technology and exploiting external linkages and objectives are among the weaker dimensions of Firm F. The result of the interview tool is presented as Figure 11. Firm F is very much similar with Firm E (highly Mother Company reliant) and this can be seen in its performance in terms of assessing and selecting technology, technology acquisition, implementing and absorbing technology, learning and exploiting external linkages. Firm F however has relatively high ratings in terms of awareness, searching and 195 building a core technology competence. Because the ratings of the interview tool and simple survey tool are consistent for these three dimensions, these activities may indeed be the strong points of Firm F upon which they can build on to improve the ratings in the other innovation and technology activities. Table 12: Results of Simple Survey Tool for Firm F Best Practice Firm F Scores Percentage 8 8 8 12 8 8 8 12 24 8 6 6 11 8 7 6 12 18 1 0.75 0.75 0.92 1 0.88 0.75 1 0.75 Awareness Search Building a core technological competence Technology strategy Assessing and selecting technology Technology acquisition Implementing and absorbing technology Learning Exploiting external linkages and objectives Figure 11: Results of Simple Survey Tool and Interview Tool for Firm F Exploiting external linkages Awareness 4 3 Searching 2 Building a Core Tech Competence 1 Learning 0 Implementing and absorbing technology Technology acquisition Technology Strategy Assessing and selecting technology Interview Tool Simple Survey Similar to all the earlier firms, Firm F acknowledges the importance of technology especially since they export their products to other countries. 196 They face tough competition so they rely on modern technology to be very competitive and maximize production with minimal rejects and other costs. The firm is confident that the technology that they have in their plants are comparable to the ones in other foreign companies because the source of these technology is their mother company who has a strong research and development team. The respondent has expressed openness to technology changes and development. Despite relying on the research and development of the mother company for technology assessment, acquisition and adoption, Firm F still has its own research and development division that is in charge of searching for the appropriate technology that may be applicable to the firm. Apart from technology, the research and development division also develops some internal processes that may improve the efficiency of the company. Still, these processes and technology have to be forwarded to the Mother Company for evaluation and approval. Apart from price, the firm understands that there are other important factors in maintaining its competitive advantage (like maintaining high quality in terms of production and ensuring on-time delivery). This implies that the firm understands the need to develop a competitive edge that can be protected. The firm is aware how technology helps (and they have an idea where and how to get it) but they have made limited moves on protecting their advantage. 5.7. Firm G Firm G is a large, foreign-owned firm (more than 200 employees) producing electronic horns as automotive parts. The results of the simple survey tool show that Firm G is a type D Creative firm. It has garnered a score of 84 with Awareness, 197 Technology Strategy and Assessing and selecting technology as the areas receiving a perfect score. The weakest (75 percent) areas for Firm G is Building a core technological competence and implementing and absorbing technology. Learning and Exploiting external linkages have also achieved a relatively low score (83 percent) (Table 13). Table 13: Results of Simple Survey Tool for Firm G Awareness Search Building a core technological competence Technology strategy Assessing and selecting technology Technology acquisition Implementing and absorbing technology Learning Exploiting external linkages and objectives Best Practice Firm G Scores Percentage 8 8 8 12 8 8 8 12 24 8 7 6 12 8 7 6 10 20 1 0.88 0.75 1 1 0.88 0.75 0.83 0.83 Based on the interview tool, the level of awareness of the importance of technology for Firm G is high (rating of 4). This indicates that Firm G greatly appreciates technology in terms of improving the efficiency of its production process. Unfortunately, it would seem that this awareness is not translated into other innovation activities mainly because of the limitations imposed by the mother company. 198 Figure 12: Results of Simple Survey Tool and Interview Tool for Firm G Exploiting external linkages Awareness 4 3 Searching 2 Building a Core Tech Competence 1 Learning 0 Implementing and absorbing technology Technology acquisition Technology Strategy Assessing and selecting technology Interview Tool Simple Survey In fact, one of the major weaknesses of Firm G is in terms of exploiting external linkages. Firm G responded to questions pertaining to the use of external sources of technology by saying that that technology is “closed to mother company’s approval” indicating some limitations on the part of Firm G to make use of external sources of technology. This weakness can also be seen in the low rating given to assessing and selecting technology. Being highly dependent on the mother company’s inputs on which technology to use, Firm G has not developed mechanisms to assess and select technology.11 5.8. Firm H Firm H is a small automotive parts manufacturer producing wire harnesses. It is a joint venture between Japanese and Filipino stock holders. 11 The discrepancy of the ratings of the Simple Survey tool and interview tool follows the explanation used for Firms C and D. 199 The results of the simple survey tool have classified Firm H as a Type C Strategic firm. Firm H strengths are Awareness (100 percent) and Technology strategy (83 percent) while exploiting external linkages and objectives is the dimension of innovation activity where it scored lowest (25 percent). However, according to the results of the interview tool, the weak points of Firm H are in terms of technology strategy and assessing and selecting technology. The reason for a low rating in technology strategy is that Firm H has not incorporated its main technology strategy in its key strategic targets. The impression made by the respondent of Firm H is that they are not aware of a technology strategy in the first place. Table 14: Results of Simple Survey Tool for Firm H Best Practice Awareness Search Building a core technological competence Technology strategy Assessing and selecting technology Technology acquisition Implementing and absorbing technology Learning Exploiting external linkages and objectives 8 8 8 12 8 8 8 12 24 200 Firm H Scores Percentage 8 6 6 10 6 6 6 9 6 1 0.75 0.75 0.83 0.75 0.75 0.75 0.75 0.25 Figure 13: Results of Simple Survey Tool and Interview Tool for Firm H Exploiting external linkages Awareness 4 3 Searching 2 Building a Core Tech Competence 1 Learning 0 Implementing and absorbing technology Technology acquisition Technology Strategy Assessing and selecting technology Interview Tool Simple survey In terms of assessing and selecting technology, Firm H was given a low rating because the head of the firm assesses the technology that the firm would use. According to the respondent, it is the Japanese head who is more familiar with technology however the basis for assessing the technology is arbitrary and it is not communicated to the rest of the firm. Firm H received relatively better ratings for technology acquisition, implementing and absorbing technology, learning and exploiting external linkages, despite that, Firm H is still relatively weak in terms of these activities. Firm H is able to bring in new technology into the company by allowing their managers and technical personnel to undergo training. The firm has relied on tried and true methods of bringing in external technology, and has not expanded their list of methods to consulting external experts. In terms of learning, Firm H undergoes basic reviews of its projects, but they follow no specific framework for risk management. Thus, most of the reviews are irregular and 201 informal. Firm H is aware of external sources of technology but are constrained by the impression that these technology are difficult to access and unsuitable for the firm. 5.9. Firm I Firm I is a large (more than 200 employees) automotive assembler that is a jointventure between Japanese and Filipino stockholders. The results of the simple survey tool indicate that Firm I is a Type D creative firm with a rating of 89 (Table 15). Table 15: Results of Simple Survey Tool for Firm I Best Practice Firm I Scores Percentage 8 8 8 12 8 8 8 12 24 7 7 7 11 8 8 7 11 23 0.88 0.88 0.88 0.92 1 1 0.88 0.92 0.96 Awareness Search Building a core technological competence Technology strategy Assessing and selecting technology Technology acquisition Implementing and absorbing technology Learning Exploiting external linkages and objectives The strength of Firm I is Assessing and selecting technology (100 percent), technology (100 percent) acquisition, exploiting external linkages (96 percent), technology strategy and learning (92 percent). For the remaining dimensions of technology activity, Firm I still has a relatively high score of 88 percent. The results of the interview tool are consistent with the results of the simple survey tool. Firm I’s knowledge about technology being used in other international automotive assemblers indicates a strong degree of awareness of the importance of technology. The respondent was able to identify the technology frontier and indicated that the Firm is still lagging behind other international assemblers about the use of technology. Searching for technology implies an understanding of the firm’s customers and 202 meeting their needs. For Firm I, they believe that the customers choose to purchase their products not only because of the competitive price that they offer, but also because of other factors like advanced design and features, high quality of goods, availability of service parts and reliable after-sales service. This knowledge of the customer’s needs influences the searching for the needed technology activity of the firm. One of the approaches that Firm I uses to search for technology is benchmarking with the technology being used by the Mother Company and other affiliates. Among the examples of Firm I’s competitive edge are its paint application system and its waste water technology. Because it has a number of affiliates around Asia, Firm I understands that there is a need to search continuously and constantly for other ways to improve. To create future advantage, they maintain benchmarking activities with the Mother Company and they are also currently rehabilitating their plants to improve their production processes. This implies that Firm I is building a strong core technological competence. In terms of technology strategy, Firm I was able to relate the technological requirements of the firm to its strategic business targets. Thus, their process of assessing and selecting technology does not only depend on the availability and applicability of the technology, but also on the volume of production that is required of them to put out. Apart from these factors, Firm I also takes into account safety, equipment efficiency, return of investment (ROI), and even labor issues in assessing and selecting technology. 203 Figure 14: Results of Simple Survey Tool and Interview Tool for Firm I Exploiting external linkages Awareness 4 Searching 3 2 Building a Core Tech Competence 1 Learning 0 Implementing and absorbing technology Technology Strategy Assessing and selecting technology Technology acquisition Interview Tool Simple survey Firm I manages the process of bringing in outside technology by involving its purchasing department in handling costs and its Project leaders in handling the technical evaluation and production compliance. To ensure that knowledge is captured from their projects, the project leaders are involved in technical consultations with the Mother Company and Affiliates and even with its network of suppliers. Firm I does not only rely on purchasing of equipment as its method of bringing in technology. It also relies on local research and development that is capable of adopting the technology to its specific needs. 6. Analysis and Findings The following section lists the findings about technology activities of automotive firms in the Philippines. These observations are made by looking at patterns, similarities and differences of the 9 firms included in the study. 204 All the surveyed firms in general have relatively high awareness of the importance of technology but some firms have not been able to translate this awareness into technological competence or innovation (Figure 15). Because of increasing competition and the rapid pace of technological development, firms cannot help to be drawn to technology as a means of improving their production process. However, as can be seen in the previous section, a number of firms have not converted their awareness into other activities like searching for technology, building a core technological competence, technology strategy, assessing and selecting technology and others. Figure 15: Distribution of Firms by Awareness Score and Level of Production This observation gives impetus to the Department of Science and Technology (DOST) to continue pursuing its Technology Transfer Programs namely, Small Enterprises Technology Upgrading Program (SET-UP), Technological Innovation Commercialization Program (TECHNICOM) and Technology Support Program for E- 205 Governance (SUPRE-GOV) to assist firms in undertaking technology activities. Firms reliant on its mother company for the technology to be used in the firm tended to have less technology activities. This observation is particularly evident in terms of assessing and selecting technology (Figure 16). The five firms (Firms C, E, F, G, and H) that have expressed some reliance on the mother company for their research and development and technology assessment have all received low ratings on assessing and selecting technology. Figure 16: Distribution of Firms by Assessing and Selecting Technology Score and Ownership The fact that a number of firms in the automotive sector are reliant on its mother company has been observed in earlier studies. Aldaba (1997) observed that for a number of Joint-venture firms, the technology is transferred by the mother company through direct infusion of production system. She also found that some firms would have an existing technical assistance agreement program in order to bring in outside technology. The problem with relying too much on the mother company for research 206 and development and even innovation is that the firm tends to pass up opportunities for locally-occurring technology development and innovation. Some technology, machineries and equipment developed locally may be ignored because these have not caught the attention of the mother company of the firm. There might also be some reluctance in the mother companies to share the technologies that they have developed especially if these technologies have been the result of years of research and investment (Aldaba 2007). Related to the previously discussion is the observation that Filipino-owned firms tend to have utilized external linkages more than foreign-owned firms or joint ventures (Figure 17). Perhaps this is because the Filipino-owned firms are not restricted by a Mother Company that would dictate or control the technology for the firm. The similarity between Firms B, D and I in terms of external linkages is that all three firms have strong connections with local research institutions and other government agencies. They were able to use their connections in order to improve the level of technology and expertise in their company but these were confined to selected fields. Assemblers tend to have more innovative activities than first-tier or secondtier firms. Figures 18, 19 and 20 show that the two assemblers included in the survey, Firm B and Firm I have relatively better ratings in technology strategy, assessing and selecting technology and exploiting external linkages. Firm D which is a second-tier firm may be considered as an outlier among the second-tier firms. The other first-tier firms and second-tier firms are all ranked lower than Firm D or the assemblers. 207 Figure 17: Distribution of Firms by Exploiting External Linkages Score and Ownership Figure 18: Distribution of Firms by Technology Strategy Score and Level of Production 208 Figure 19: Distribution of Firms by Assessing and Selecting Technology Score and Level of Production Figure 20: Distribution of Firms by Exploiting External Linkages Score and Level of Production This observation then implies that assemblers should take the lead role in pushing for innovation of the first-tier and second-tier firms. The local automotive parts and components manufacturers recognize this leadership role of the assemblers when they 209 called for the revival of the People’s Car Program (Go 2006). When the local assemblers incorporate as many locally manufactured parts that meet the quality, cost and delivery requirements as they can into the People’s Car, this would encourage innovation to the first-tier and second-tier firms. There is no observable pattern relating firm size with innovation activities. Figures 21 and 22 show that there are large firms like Firms I and Firms D that engage in innovation activities, while at the same time there are large firms that have limited innovation activities (Firms C, G and E) especially in terms of building a core technological competence, technology strategy, assessing and selecting technology and technology acquisition. Similarly, a small company (like Firm B) rates relatively high in terms of building a core technology strategy and assessing technology while another small firm (Firm H) rates comparatively lower. This observation is consistent with the empirical findings of Shin (2002) in analyzing the determinants of innovation activity of firms in South Korea. Using data from a number of innovation surveys covering the period of 1997 to 1999, Shin showed that firm size is not a significant determinant of innovation activity. The results of the interview tool have also pointed to a number of internal and external factors that affect innovation activity of automotive firms. summarizes these factors according to selected innovation activities. 210 Table 16 Figure 21: Distribution of Firms by Building a Core Technical Competence Score and Firm Size Figure 22: Distribution of Firms by Assessing and Selecting Technology and Firm Size 211 Table 16: Internal and External Factors by Selected Innovation Activity Innovation Activity Internal Factors Awareness A management that recognizes the importance of technology Searching Participation in conferences, trainings Building a Core Tech Competence Assessing and selecting technology A plan that has a technology development component Degree of Independence from Mother Company in terms of innovation/ technology activities Availability of resources (financial, human capital) for in-house R&D Receptiveness to training Openness to cooperate with external sources of technology Technology acquisition Learning Exploiting external linkages External Factors Availability of information on the technology on which firms can benchmark their innovation capability A competitive environment that fosters innovation Mother company dictates the technology that would be used by firms An environment that enables working together between firms and external sources of technology Management characteristics comprise the bulk of the different internal factors affecting the innovation capability of firms. For instance a firm’s level of awareness is affected by the degree of the management’s appreciation of technology. A firm that appreciates technology because it is a means of improving its performance tends to have a higher degree of awareness. Similarly, learning and assessing technology is highly dependent on the management style of the firm in terms of asserting its independence especially with regard to relating with the mother company. Management characteristics like receptiveness to training and openness to cooperate with other sources of technology also affect different innovation activities. Availability of resources has always been one factor that has affected innovation activities of firms. External factors also affect innovation capability of firms pertain mostly to market, information and policy environment. A competitive market fosters innovation by motivating firms to innovate or else they would be left behind by other firms. The information environment across firms in the same type of product would 212 affect awareness of a firm because a firm needs to benchmark itself relative to the technology frontier which it can only perceive through knowledge of the types of technology that are available to it and its competitors. The policy environment affects the use of external sources of technology because it provides a policy direction that would guide all the players towards cooperation among firms and other sources of technology like the academe and other science and technology institutions in the country. The policy environment would also have to provide incentives for research, technology development and the transfer of these results to firms. Apart from market, information and policy environment factors, another external factor that has been a recurring theme throughout the discussion of the survey results would be the presence of a mother company. A mother company that dictates the technology strategy and even the technology/machines that the firm will utilize affects the firm’s innovation capability. If this is the case, a firm would become highly reliant on the mother company for almost every innovation and R&D activity. 6.1. Policy Implications Based on the observations presented in the earlier section, the following policy recommendations are made to address the policy gaps. The observations and descriptions of the selected automotive firms indicate that there is a weakness in the automotive sector in terms of undertaking technology activities. To persuade these firms to innovate, they should be given incentives for innovating. Strengthen the innovation system in the country is of paramount importance, and this can be accomplished by first undertaking a nationwide assessment of the country’s 213 level of innovation. The results of this study will only provide a snapshot of the automotive sector’s innovation capability and technology activity. A better assessment is necessary in order to fully understand the sectors. The experience of the authors shows that firms are generally not receptive to surveys relating to innovation because of company policies aimed at protecting their competitive advantage. It is important to make these firms understand that their participation in innovation surveys is important, and the information that they would provide would be kept in strictest confidence. As a number of automotive firms rely on their mother company for the technology that they will use, it is important for the country to strengthen its policies on intellectual property rights (IPR). Information campaigns on IPR protection should also be bolstered to allay the concerns of mother companies that their technology would be stolen or copied in the country. It is also important for the country to strengthen the research and development institutions and universities by establishing better linkages with the industries. It has been recognized that one of the weaknesses of the innovation system of the country is the weak technology transfer process which limits the flow of knowledge and technology from RDI and Universities to industry. Related to this would be the need for the country to also improve the number of R&D personnel and scientists and public R&D spending. 214 REFERENCES Aldaba, R.M. (1997) “Micro Studies: Philippine Car Assembly Sector” PIDS Discussion Paper Series No. 1997-21. Philippine Institute for Development Studies, Makati City, Philippines. Aldaba, R.M. (2007) “Assessing the Competitiveness of the Philippine Auto Parts Industry,” PIDS Discussion Paper Series No. 2007-14. Philippine Institute for Development Studies, Makati City, Philippines. Aldaba, R.M. (2008) “Globalization and the need for strategic Government-industry Cooperation in the Philippine Automotive Industry” PIDS Discussion Paper Series No. 2008-21. Philippine Institute for Development Studies, Makati City, Philippines. Bessant, J., H. Rush,M. Hobday (2001)“Assessing Technological Capability: An Audit Tool.” Go, M.V. (2006)“Auto parts makers push for revival of People’s Car Program,” The Philippine Star Online. Manila, Philippines. http://www.philstar.com Accessed last December 22, 2010. Hobday, M., H. Rush, J. Bessant(2002) “Firm Level Innovation in the Korean Economy.” Lee U. P. (2005) “A Tale of Two (Philippine) Industries,” Economic Research Center Discussion Paper No. 152. Nagoya, Japan. Official Gazette (2010) “Executive Order No. 877-A, The Comprehensive Motor Vehicle Development Program,”June. Posadas, R. D. (2009) “Scientific and Technological Capabilities and Economic CatchUp.”Philippine Management Review, 16: 131-153. Raymundo, R.B. (2004) “Establishing the role of the Philippine Automotive Industry in the East Asian Production Network: Identifying Industrial Adjustment Policies that will Further Enhance Participation in the Network and Responding to the Challenges Posed by China’s Emerging Automotive Industry,” Paper presented in a roundtable discussion on “Production Networks, Industrial 215 Adjustments, Institutions, Policies and Regional Cooperation,” 12 October 2004, Manila. Shin, T.Y. (2002)“Korean Innovation Survey 2002: Manufacturing Sector,” downloadable from www.stepi.re.kr accessed last January 30, 2011. APPENDIX Table A1: Exports of Auto Parts and Components (in thousand USD) Tyres new for motor car Tyres,new,bus or lorry Piston eng fuel/wtr pump Transmission shafts Gears and gearing Flywheels/pulleys/etc Clutches/sh coupling/etc Gear/flywheel/cltch part Pass motor vehexc buses Motor vehchassis+engine Uh rubber tube no fittng Uh rubber tube + fitting Tyresnes,herring-bone Tyresnes,other Inner tubes Asbestos manuf-friction Tempered safety glass Laminated safety glass Vehicle rear-view mirror Locks/keys/clasps/parts Iron,steelsprings,etc Recip piston engs>1000cc Diesel etc engines Spark-ign piston engnes Diesel engines nes Parts nes spark-ignengs Parts nes diesel engines Gen sets with pistnengs Air-conditioners nes Gas heat exchange units Pumps/etcnes Engine oil/petrol filter Engine air filters Ball/roll bearing housng Bearing housings nes Vehicle etc ignition wir Veh elect light/etcequ. Veh elect light/etc part Electro-magnets/devices Buses etcnes Motor car bodies Motor vehicle bodies nes Motor vehicle bumpers Motor veh body parts nes Motor vehicle brake/part Motor vehicle gear boxes 2007 205,814.7 7,290.8 24,628.1 3,278.0 380.2 14.6 418.5 8,543.4 63,181.5 20.6 1,623.3 4.0 556.9 2,441.8 272.5 0.9 24,771.6 844.1 1,064.7 284.8 456.4 41.8 15.2 1,258.5 805.4 40.5 2.3 4,487.0 76.6 10,402.5 64.4 153.5 891,577.2 29,644.8 4,678.7 12,553.3 2.2 283.9 129.6 193.3 81,079.1 529,948.9 167,699.4 216 2008 257,715.0 1,182.6 19,956.2 7,018.8 219.0 48.6 239.7 7,768.2 95,395.3 13.7 102.5 1,127.4 2009 195,465.4 376.2 20,944.5 3,418.3 139.0 12.3 37.0 2,673.7 94,354.2 4.5 124.2 466.9 7,256.5 0.9 3.6 5.4 578.9 16,963.3 34.1 28,374.2 120.5 7.9 2.7 230.8 30,402.4 10.2 81.7 2,675.0 1,176.7 27.3 979.4 96.8 13.2 1,184.2 4.8 226.0 217.3 765.9 27.1 12,521.8 57.3 65.2 901,884.5 33,282.4 505.6 18,543.9 16.4 752,051.4 4,346.8 279.9 11,920.9 144.9 593.6 229.5 102,626.9 724,950.7 240,705.1 65.8 206.9 78,911.7 473,228.2 211,545.7 1,401.1 14.1 10,944.0 Motor veh drive axle etc Mot veh non-drive axles Other motor vehcl parts Parts/access motorcycles Motor vehicle seats Pressure gauges etc Fluid instrum parts/acc Grand Total 892,764.4 27,599.6 16.2 1,501.7 3,352.5 3,006,263.8 12.0 43.5 983,500.9 31,773.7 14.0 2,490.6 1,397.6 3,487,620.0 658,761.1 25,480.8 344.5 1,497.3 950.4 2,599,960.7 Table A2:Imports of Auto Parts and Components (in thousand USD) Row Labels Tyres new for motor car Tyres,new,bus or lorry Piston eng fuel/wtr pump Transmission shafts Gears and gearing Flywheels/pulleys/etc Clutches/sh coupling/etc Gear/flywheel/cltch part Pass motor vehexc buses Motor vehchassis+engine Uh rubber tube no fittng Uh rubber tube + fitting Tyresnes,herring-bone Tyresnes,other Inner tubes Asbestos manuf-friction Tempered safety glass Laminated safety glass Vehicle rear-view mirror Locks/keys/clasps/parts Iron,steelsprings,etc Recip piston engs>1000cc Diesel etc engines Spark-ign piston engnes Diesel engines nes Parts nes spark-ignengs Parts nes diesel engines Gen sets with pistnengs Air-conditioners nes Gas heat exchange units Pumps/etcnes Engine oil/petrol filter Engine air filters Ball/roll bearing housng Bearing housings nes Vehicle etc ignition wir Veh elect light/etcequ. Veh elect light/etc part Electro-magnets/devices Buses etcnes Motor car bodies Motor vehicle bodies nes Motor vehicle bumpers Motor veh body parts nes Motor vehicle brake/part Motor vehicle gear boxes 2007 12,741.9 56,044.0 3,149.1 5,100.3 8,885.4 650.0 2,446.0 6,120.1 699,293.5 10,389.6 474.0 3,382.8 2,024.6 7,191.2 2,536.6 614.1 5,841.4 1,325.6 592.7 7,861.5 3,663.2 9,195.1 14,578.7 11,939.6 19,569.2 18,407.6 32,908.9 56,556.1 21,584.3 12,314.6 23,898.2 5,589.0 1,079.6 2,375.8 3,312.2 33,060.4 6,327.5 951.6 48,510.6 78,515.1 164.6 4,803.6 5,620.9 13,246.3 9,161.9 26,048.1 217 2008 15,617.4 48,325.2 1,595.3 5,187.6 11,890.9 1,107.6 2,737.0 7,121.0 982,533.2 7,506.1 747.4 5,272.1 1,703.1 8,470.0 2,507.5 740.8 12,645.7 3,146.2 343.8 9,291.8 3,461.9 8,835.0 15,621.4 8,676.1 13,324.5 15,171.2 36,744.0 49,578.2 24,832.0 13,012.8 16,446.7 5,391.5 1,450.4 3,190.0 3,773.5 38,369.8 6,678.2 2,435.4 40,781.7 53,738.3 161.7 6,592.1 4,414.5 18,954.1 20,876.0 23,952.7 2009 27,054.8 54,280.5 2,252.8 6,197.3 13,247.5 994.4 2,263.0 5,903.8 955,442.3 6,516.1 465.0 3,327.8 1,086.3 14,393.6 2,041.8 1,011.8 9,499.9 3,977.0 411.2 8,261.4 2,653.8 7,813.9 19,273.8 4,239.8 9,911.1 11,071.9 36,251.5 49,581.7 9,065.8 12,548.9 20,481.3 5,205.0 1,715.1 3,891.1 3,229.4 13,501.0 5,636.8 2,893.0 19,658.8 63,486.8 272.1 13,054.3 3,540.9 13,848.4 13,566.8 17,635.2 Motor veh drive axle etc Mot veh non-drive axles Other motor vehcl parts Parts/access motorcycles Motor vehicle seats Pressure gauges etc Fluid instrum parts/acc Grand Total 8,477.0 165.0 237,310.0 90,044.9 511.9 3,305.1 2,868.0 1,642,728.8 218 6,712.7 50.4 242,032.9 131,847.3 355.1 3,507.9 3,205.7 1,952,665.7 13,373.6 37.4 207,467.5 152,883.8 599.7 2,868.2 2,915.8 1,862,802.4 CHAPTER 5 Innovation Capability of Thailand’s Automotive Industrial Network SOMROTE KOMOLAVANIJ CHAWALIT JEENANUNTA VEERIS AMMARAPALA* Sirindhorn International Institute of Technology, Thammasat University Due to its long history of development, the Thai automotive industry is now one of the most important industrial sectors of the country. This can be seen from statistical data, showing that Thailand has become more important in the automotive world market due to the high volume of exported automotive products and vehicles, especially during 2001-2010 (after the economic crisis). This success did not come by chance but from many factors of interest. One of the major factors is the role of the local suppliers. In this study, it is important to understand the relationship between the automotive manufactures and the local suppliers, especially in the technology transferred and innovation capability in the automotive industrial network. Therefore, seven case studies were selected for the interviews, and the focus of the interviews was on their innovation capability. Based on the interview results, the firms in the automotive industry can be classified into four types in terms of their technological capability. Therefore, to be able to support the automotive industry effectively, the government should provide different policies for the different groups of firms based on their particular needs. * Sirindhorn International Institute of Technology, Thammasat University, Thailand. 219 1. Introduction: Thai Industry Overview Thailand used to be a traditional economy with the major export being agricultural products, especially rice. In 1960, agriculture accounted for 32% of the total GDP of the country, while the share of manufacturing was only 14%. The proportion of agricultural products in the total GDP has been decreasing continuously in the past 40 years. In 2009, agricultural products provided only 12% of total products, while manufactures took up a 43% share, as shown in Figure 1. Thailand now has a GDP worth US$584 billion (on a purchasing power parity or PPP basis) to rank 24th in the world, and its GDP growth of 8.0% in 2010 was among the highest in Asia. This classifies Thailand as the second largest economy in Southeast Asia after Indonesia. Moreover, the structure of exported goods has substantially changed. In the early 1980s, 45% of total exported goods were food products. However, the share of food products in exports has now given way to machinery products. In 2010, exports of manufacturing products accounted for a 76.5% share of total exports, while food products made up only 11.02%, as shown in Table 1. Figure 1: Percentage of GDP by Industry from 2000 to 2009 Source: World Bank (http://www.worldbank.or.th/). 220 Table 1: Export Structure of Thailand Industrial sector Value (US$ million) 2007 2008 2009 2010 1. Agricultural products 15,167.7 20,139.4 16,429.9 21,526.1 9.86 11.33 10.78 11.02 9,489.5 11,714.0 11,264.5 13,222.8 6.17 6.59 7.39 6.77 120,559.6 133,826.4 116,405.8 150,090.2 78.35 75.28 76.37 76.85 2. Agro-industrial products 3. Principle manufacturing products 4. Mining and fuel products 5. Others Total Share (%) 2007 2008 2009 2010 7,510.9 12,095.1 8,326.0 10,472.2 4.88 6.80 5.46 5.36 1,137.4 0.3 0.0 0.2 0.74 - - - 153,865.0 177,775.2 152,426.3 195,311.6 100.00 100.00 100.00 100.00 Source: Thailand Trading Report (http://www2.ops3.moc.go.th/), Information and Communication Technology Center with cooperation from the Customs Department. Table 2 shows Thailand’s top six export products by value, as classified by the Harmonized System (HS) groupings. In 2010, the automotive products share was about 9.52% of all export value from Thailand. Based on HS, the top three export products were Group 84 (Machinery), Group 85 (Electronics) and Group 87 (Vehicles). Figures 2 and 3 show the yearly export and import value of these groups. It is noticeable that the import and export value dropped in 2009 due to the economic crisis but grew back in 2010. Table 3 shows the trade balance for Thailand, where the positive value indicates that there are more exports than imports. From this table, the indication is that the automotive industry (Group 87) gradually increased in trade, becoming the largest gainer in 2010, more than the two other large groups (84 and 85). Based on the mentioned data, it can be seen that the automotive industry has become one of the most important industries of the country. This industry not only has a large share of the total exports each year but also shows a significant increase of its imports year by year. 221 Table 2: Top Six Exported Products by Thailand (Unit: Thousand US Dollars) % Product label 2010 Machinery, nuclear reactors, boilers, etc (Group 84) 33,770,400 17.19 Electrical, electronic equipment (Group 85) 29,111,072 14.82 Vehicles other than railway, tramway (Group 87) 18,692,864 9.52 Rubber and articles thereof 14,735,608 7.50 Pearls, precious stones, metals, coins, etc 11,714,161 5.96 Mineral fuels, oils, distillation products, etc 9,714,099 4.95 All products 196,422,624 100.00 Source: International Trade Centre calculation based on Thai Customs Department statistics since January 2010. Rank 1 2 3 4 5 6 Figure 2: Products Exported by Thailand (Unit: Thousand US Dollars) Source: International Trade Centre calculation based on Thai Customs Department statistics since January 2010. Figure 3: Products Imported by Thailand (Unit: Thousand US Dollars) Source: International Trade Centre calculation based on Thai Customs Department statistics since January 2010. 222 Table 3: Thailand Trade Balance by Product Group (Unit: Thousand US Dollars) Group 2003 2004 2005 2006 2007 84 424,642 1,296,364 2,325,380 5,851,280 9,514,606 85 643,545 846,100 -2,729,448 -1,992,868 -1,952,296 87 2008 2009 2010 8,537,664 7,300,638 8,965,112 -3,423,772 -4,400,424 -2,776,340 975,625 2,101,020 4,116,546 6,176,169 8,349,866 10,754,395 7,303,924 10,738,843 Source: International Trade Centre calculation based on Thai Customs Department statistics since January 2010. 2. Statistics of Automotive Industry The automobile and auto parts industry is one of the most important industries that impacts the economic development of Thailand. The auto sector accounted for 10.5% of GDP in 2008. At present, Thailand is a production center of large manufacturers from all over the world. Thailand emerged as the world’s 12th largest automobile producer in 2008 (up from 15th in 2007). As for the future, the automotive industry will be supported by the Thai government to become a large production base of eco cars in Asia, and the target has been set for the “Detroit of Asia” to become the world’s 10th largest automotive manufacturer in 2011 (Hart-rawung, 2008). Thailand is already the biggest producer in Southeast Asia. Thailand is becoming the center of large automotive manufacturers from all over the world, examples being Toyota, Honda, Nissan, Isuzu, and Ford. The country is a production base and exporter in the Asian region. It is also a production base of exporting motorcycles for large manufacturers in the Japan group. Moreover, the Thai government is planning to support the automobile industry in order to develop it as a production base. The automotive industry is considered a target industry that the 223 government is supporting due to its important role as one of the large production bases of the world. A report by the International Trade Centre in 2010 found that the automobile and auto parts industry had total exports of US$17,150 million, a dramatic increase from 2001, as shown in Table 4. Note that while the car exports value from 2001 to 2008 was less than that of trucks, the car exports value for 2009 and 2010 was more than that of trucks. The export value of parts and accessories of motor vehicles follows the trend of the export value of cars closely. Compared with other ASEAN countries, Japan and India, Thailand’s car exports rank No. 2 after Japan’s and are followed by India’s, as shown in Table 5. It is noted that the Thai car exports value gradually increased from 2001 to 2008, dropping in 2009. Then it increased again in 2010. Compared with other ASEAN countries, Japan and India, Thailand’s truck exports also rank second after Japan’s and are followed by India’s, as shown in Table 6. It is noted that the Thai truck exports value gradually increased from 2001 to 2008 and dropped in 2009. Then it increased again in 2010. Table 4: Thailand Automotive Product Exports (Unit: Thousand US Dollars) Product Group 2001 2002 2003 2004 2005 2006 2007 2008 2009 2010 Cars 674,184 527,959 780,803 1,128,565 2,160,709 2,921,663 3,853,716 5,228,187 4,090,824 7,070,154 Trucks 1,234,841 1,425,334 1,851,339 2,516,162 2,997,432 3,682,673 4,297,864 5,451,594 3,538,739 5,879,787 Chassi 4,074 135 152 40 18 21 216 95 109 150 Bodies 6,258 5,691 11,006 10,658 10,390 11,632 14,795 16,255 11,531 21,441 490,158 628,366 957,106 1,412,020 2,120,010 2,500,165 3,397,759 4,094,798 3,003,376 4,178,709 2,409,515 2,587,485 3,600,406 5,067,445 7,288,559 9,116,154 11,564,350 14,790,929 10,644,579 17,150,241 Parts Total Source: International Trade Centre calculation based on Thai Customs Department statistics since January 2010. 224 Table 5: Car Exporters (Unit: Thousand US Dollars) Exporters 2001 2002 2003 2004 2005 2006 2007 2008 2009 52,991,700 62,699,896 68,390,664 74,822,896 79,769,272 94,485,248 108,147,200 115,440,408 62,268,308 Japan 2010 N/A Thailand 674,184 527,959 780,803 1,128,565 2,160,709 2,921,663 3,853,716 5,228,187 Indonesia 6,165 19,756 30,140 140,625 245,790 365,971 839,201 1,234,371 628,864 N/A Malaysia 49,146 87,910 51,270 99,759 103,684 151,389 174,083 197,536 145,422 N/A 1,709 25,026 155,728 154,443 169,894 89,678 63,183 95,395 94,354 N/A 174 2,604 12,570 31,883 44,563 994 349 1,018 5,367 N/A 88,665 184,501 554,088 736,341 954,334 1,048,332 1,283,439 2,219,825 2,940,806 N/A Philippines Viet Nam India 4,090,824 7,070,154 Source: International Trade Centre statistics since January 2010. Table 6: Truck Exporters (Unit: Thousand US Dollars) Exporters 2001 2002 2003 2004 2005 2006 2007 2008 2009 Japan 5,113,765 5,927,081 6,679,833 8,071,499 7,578,306 8,293,843 9,985,414 12,053,741 6,558,696 N/A Thailand 1,234,841 1,425,334 1,851,339 2,516,162 2,997,432 3,682,673 4,297,864 5,451,594 3,538,739 5,879,787 Indonesia 10,569 4,835 6,007 5,062 9,045 45,138 30,036 81,847 49,274 N/A Malaysia 5,283 3,070 17,858 13,090 24,480 29,025 29,580 24,194 16,987 N/A 121 4,206 6,478 6,400 2,804 2,138 708 553 1,080 N/A 26 79 195 465 672 2,944 1,368 2,198 357 N/A 51,045 26,221 57,297 120,041 204,596 200,687 218,909 361,736 250,926 N/A Philippines Viet Nam India 2010 Source: International Trade Centre statistics since January 2010. Although Thailand has car and truck manufacturers, there are some other car and truck models that are not yet produced or assembled in the country. Tables 7 and 8 list the countries and import values for cars and trucks from ASEAN, Japan and India. The car import values from Japan, Indonesia, and the Philippines have increased steadily. However, it is worth noting that in 2010 the car import value from Indonesia was almost the same as that from Japan. There is a similar observation for the Philippines where the car import value was close to that of Japan’s. 225 Table 7: Supply Markets for Cars Imported by Thailand (Unit: Thousand US Dollars) Exporters 2001 2002 2003 2004 2005 2006 2007 2008 2009 2010 World 192,133 183,826 392,181 377,065 341,022 254,906 258,633 478,691 465,735 818,482 Japan 87,294 56,125 73,695 111,442 55,099 70,121 88,440 151,777 173,876 195,019 4,117 10,527 33,172 82,923 90,318 29,143 31,914 51,861 28,057 191,936 243 0 96 0 8 25 624 24,081 15,003 52,181 4,459 25,910 175,269 116,707 115,873 82,935 40,076 79,074 77,179 119,900 Viet Nam 0 0 0 0 0 71 9 29 81 0 India 0 0 8 0 1 0 97 79 78 750 Indonesia Malaysia Philippines Source: International Trade Centre statistics since January 2010. Table 8: Supply Markets for Trucks Imported by Thailand (Unit: Thousand US Dollars) Exporters 2001 2002 2003 2004 2005 2006 2007 2008 2009 2010 World 57,083 60,726 41,525 47,216 42,957 41,367 73,453 190,891 86,090 183,088 Japan 33,313 38,949 28,135 28,036 12,017 23,563 20,691 39,171 41,617 116,001 Indonesia 0 0 0 0 0 892 9,559 57,411 10,201 18,019 Malaysia 57 0 0 23 0 12 208 287 143 0 0 25 265 0 0 0 0 0 0 14 127 0 0 0 0 0 69 2 30 0 0 0 7 0 0 0 10,288 26,713 922 5,518 Philippines Viet Nam India Source: International Trade Centre statistics since January 2010. However, this observation does not go to the truck imports value, as shown in Table 8. Japan exports trucks to Thailand but not as much as cars. Indonesia started to export trucks to Thailand in 2006 and India began in 2007. However, the truck imports value from these countries is still very low compared to the car imports value. Tables 9 and 10 provide Thailand’s trade balance for cars and trucks with other countries. It is observed that although Japan is the biggest car exporter and it gained 226 market share in Thailand during 2004-2009, Thailand gained in the 2010 trade balance. However, Thailand lost in the car trade balance with India for the first year in 2010. On the other hand, even though Thailand aims to be the biggest base for truck manufacturers, the country still lost in the truck trade with Japan from 2002 to 2010, and it began losing in the truck trade balance with India as of 2010. Table 9: Thai Trade Balance for Cars with Other Countries (Unit: Thousand US Dollars) Partners 2002 2003 2004 World 344,133 388,622 Japan 19,236 Indonesia Malaysia Philippines Viet Nam India 2005 2006 2007 2008 2009 2010 751,500 1,819,687 2,666,757 3,595,083 4,749,496 3,625,089 6,251,672 82,518 -41,798 -2,723 -12,552 -37,587 -131,193 -167,319 201,233 9,064 145,728 289,601 325,308 281,196 380,354 551,455 364,967 749,807 2,210 18,663 64,674 56,552 83,277 205,441 305,040 223,813 373,530 -24,981 -77,161 30,012 129,511 217,066 309,393 337,585 352,691 585,278 19 49 0 89 127 26 1,296 18,244 21,764 146 98 44 158 273 824 822 329 -578 Source: International Trade Centre calculation based on Thai Customs Department statistics since January 2010. Table 10: Thai Trade Balance for Trucks with Other Countries (Unit: Thousand US Dollars) Partners 2002 2003 2004 2005 2006 2007 2008 2009 2010 World 1,364,608 1,809,814 2,468,946 2,954,475 3,641,306 4,224,411 5,260,703 3,452,649 5,696,699 Japan -36,086 -26,906 -23,863 -6,964 -11,718 -13,371 -32,400 -36,956 -110,211 Indonesia 30,935 40,949 68,004 98,728 81,700 109,605 227,757 116,160 234,584 Malaysia 26,350 330 171 22,011 13,600 37,730 92,320 128,043 232,363 Philippines 6,343 23,898 32,736 15,376 30,239 48,722 85,070 92,448 132,725 Viet Nam 4,227 0 141 130 46 171 2,608 33,722 22,983 99 254 30 1 98 -9,989 -26,422 6,528 -1,491 India Source: International Trade Centre calculation based on Thai Customs Department statistics since January 2010. 227 Figure 4: Thailand Export Value of Cars and Trucks (Unit: Thousand US Dollars) Source: International Trade Centre calculation based on Thai Customs Department statistics since January 2010. Figure 5: Number of Cars and Trucks Produced and Sold in Thailand (Unit: Number) Source: Thailand Automotive Institute (http://www.thaiauto.or.th). Car and truck production increased during 1998-2008. In 2009, production dropped due to the economic crisis. Afterwards, production was continuously increasing (see Figures 4 and 5). Highlighting 10 years of rapid growth, production more than doubled between 2001 and 2005. 228 Thai automotive growth can be divided into three sections, as shown in Figure 5. In the first section, during the Tom Yam Kung crisis of 1997-1998, the economy decelerated all over the world and the value of the Thai baht fluctuated, which had the effect of reducing automotive production by 30% (Amano 2009). From 1999 to 2005, which is the second section, the economy started to recover. In addition, the large automotive manufacturer Toyota selected Thailand to be its biggest production base in Asia (Amano 2009). In 2006, which is in the third section, there was the so-called Hamburger crisis, as high prices for gasoline, high inflation rates, and the fluctuation of the economy caused total automotive sales to decline (Automotive Industry Analysis Division, 2009). In 2008, the Thai government announced the policy to promote automobiles that use substitute energy by tax reductions, but this increased growth to only 6.96% (Asawachintachit, 2009). Figure 6: Vehicle Parts Exports 1996-2010 (Unit: Million US Dollars) Note: The currency is based on the yearly average rate. Source: Thailand Automotive Institute (http://www.thaiauto.or.th). 229 Figure 6 shows the parts exports from 1996 to 2010, and it indicates that the total volume increased every year. Especially from 2004 to 2005, it grew tremendously by 74.04%. OEM (original equipment manufacturer) parts are the major export, and they increased continuously from 2002 to 2008. Spare parts, engines, and others had lower proportions of exports. Figure 7 and Table 11 show that most parts and accessories of motor vehicles are exported to Japan, Indonesia, Malaysia, and the United States because the main automobile manufacturers are located in these countries. Table 12 shows Thailand’s trade balance for automotive products. Although the trade balances for cars and trucks are positive, other automotive parts are still negative. This implies there are still many expensive imported automotive parts being used to assemble both cars and trucks. Figure 7: Markets for Automotive Products Exported by Thailand (Unit: Thousand US Dollars) Note: Product: 87 Vehicles other than railway, tramway. Source: International Trade Centre calculation based on Thai Customs Department statistics since January 2010. 230 Table 11: Markets for Automotive Products Exported by Thailand (Unit: Thousand US Dollars) Importers 2001 2002 2003 2004 2005 2006 2007 2008 Japan 270,005 267,813 445,113 423,161 418,718 505,014 665,313 814,047 459,076 1,097,787 Malaysia 109,290 124,583 177,465 274,743 436,161 480,258 671,811 982,962 861,485 1,253,205 Indonesia 71,912 151,698 359,318 684,207 914,826 685,210 1,090,105 1,692,899 1,003,148 1,938,073 Philippines 53,967 70,209 195,944 271,128 400,104 495,865 590,569 692,004 715,872 1,086,577 Viet Nam 87,054 78,181 66,683 91,211 125,565 122,813 199,020 309,404 385,971 381,309 USA 87,028 112,761 114,687 162,905 242,287 310,473 305,082 361,038 295,561 290,844 India 8,271 6,539 33,300 64,495 85,323 126,800 146,614 181,045 167,845 265,957 Other 2,079,195 2,191,409 2,742,826 3,803,846 5,529,304 7,366,562 Total 2,766,723 3,003,189 4,135,335 5,775,704 8,152,289 10,093,004 12,821,227 16,494,710 11,994,653 18,692,864 9,152,715 11,461,311 2009 2010 8,105,699 12,379,115 Note: Product: 87 Vehicles other than railway, tramway. Source: International Trade Centre calculation based on Thai Customs Department statistics since January 2010. Table 12: Thailand Trade Balance for Automotive Products (Unit: Thousand US Dollars) Product Group Cars Trucks 2001 2002 2003 2004 2005 2006 2007 2008 2009 2010 482,051 344,133 388,622 751,500 1,819,687 2,666,757 3,595,083 4,749,496 3,625,089 6,251,672 1,177,758 1,364,608 1,809,814 2,468,946 2,954,475 3,641,306 4,224,411 5,260,703 3,452,649 5,696,699 Chassi -86,029 -165,831 -268,630 -323,646 -267,309 -244,296 -266,817 -287,741 -241,022 -389,167 Bodies 2,969 -437 -4,160 -9,470 -5,487 -4,966 -2,130 -744 -5,150 -11,025 -995,914 -1,170,331 -1,082,259 -617,399 -88,414 588,390 682,732 146,050 -976,994 Parts -953,850 Source: International Trade Centre calculation based on Thai Customs Department statistics since January 2010. 231 3. Thai Automotive Value Chain In 1961, Thailand had only one automotive assembly plant. Currently, however, Ford, General Motors, BMW, DaimlerChrysler, Mitsubishi, Mazda, Toyota, Isuzu, Honda and Nissan all have an established presence in the country, together accounting for about 1.4 million vehicles produced annually. Thailand has an advantage over other countries in terms of its complete chain in the automotive industry, consisting of upstream raw materials providers and downstream automotive assemblers. All supply chain processes can be done domestically, and most suppliers are located near the assemblers, which can reduce production costs. In the Thai automotive industry’s supply chain, the 3rd tier and 2nd tier suppliers are indirect suppliers who provide or produce raw materials and small auto parts for 1st tier suppliers, who are direct suppliers or OEM suppliers who produce large auto parts for assemblers. Then, the 1st tier sends auto parts to assembling areas. After the assembly process, all cars are sent to either dealers or exported to other countries. The structure of the automotive clusters in Thailand consists of three levels, which are assemblers, 1st tier suppliers, and 2nd and 3rd tier suppliers. In the structure of the Thai automotive industry, the number of auto parts suppliers is about 2,312, which can be classified as shown in Figure 8. 232 Figure 8: Structure of Thai Automotive Industry LSEs Assembler (12 Car assemblers, 6 Motorcycle assemblers) Foreign J/V J/V 47% Thai Majority 30% Local 23% Tier 1 Supplier (635 Companies) SMEs Local Suppliers Tier 2 & 3 Suppliers (1,700 Companies) Source: Tiasiri (2010). The Automobile Assembler is an auto maker which receives the automobile parts from Tier 1 in order to assemble a vehicle as a manufactured finished product. Currently, there are approximately 16 auto assemblers and seven motorcycle assemblers, which are foreign and joint-venture enterprises. The Automobile Parts Manufacturer Tier 1 is an OEM supplier and the producer of automobile parts directly provided to the factory. This group of auto parts is considered to be high-quality auto parts. The standard for auto parts is determined by the automobile manufacturers. At this moment, there are about 648 manufacturers in Tier 1, of which 287 are foreign entrepreneurs, with about 41% of that number being Japanese enterprises. Joint ventures total 38 manufacturers, while Thai enterprises account for 354 manufacturers. Of the 648 manufacturers, there are 386 automobile parts manufacturers and 201 motorcycle parts manufacturers, with the rest being producers of both automobile and motorcycle parts. 233 The Automobile Parts Manufacturer Tier 2 and Tier 3 is in the raw materials section or in parts for REM (replacement equipment manufacturers) who are responsible for providing raw materials to Tier 1 manufacturers or manufacturers of automobile parts, in order to sell in the spare parts markets or be a manufacturer who supports the production processes (or equipment supplier). Thus, the manufacturers in this group might be considered as Tier 1 in some products. The number of enterprises of this type is about 1,641, and most of them are Thai enterprises. Table A1 in the Appendix shows the classification of the Thai automotive parts manufacturers by product groups. In total, there are 528 Thai automotive parts manufacturers listed as members of the Thai Auto Parts Manufacturers Association as of February 2011. The automotive industry is located around industrial estates in Bangkok and the surrounding provinces, especially Samutprakarn, Chachaoengsao, Chonburi, Rayong, and Pathumthani. Most of the automotive assemblers are located in Samutprakarn Province, including Toyota, Isuzu, Nissan, and Hino. Many auto firms are located on Thailand’s Eastern Seaboard, while most suppliers are in Bangkok, the next being Samutprakarn, Chonburi, and Rayong. The suppliers located in Bangkok, Chonburi, and Rayong are there mostly by design in order to serve the automotive industry through considerations of the infrastructure for accessing the industry. This includes shipping the finished goods through the ports located in those three regions, as shown in Figure 9 (Praisuwan, 2006). 234 Automobile Associations and Organizations in Thailand One of the factors that helps in the development of the automotive industry is the private associations and organizations. The role of such organizations is to coordinate among members and support the members by providing updated information on government policies, laws, and technologies. There are four main associations and organizations in Thailand that support and cooperate with the automotive industry, as follows. Figure 9: Principal Auto Parts Production Sites in Thailand Source: Praisuwan (2006). Thai Automotive Industry Association (TAIA) Established in 1981, TAIA is a center for automobile assemblers, motorcycle assemblers, and auto parts and automobile engine companies. The association’s objective is to gather news and information among members. It is central to the exchange of information in the industry, and it cooperates with other associations both 235 within and outside of the country. Moreover, TAIA coordinates with the government to help in providing advice related to the automobile industry. Thai Auto Parts Manufacturers Association (TAPMA) TAPMA was created in 1987 as a union of auto parts manufacturing companies from the private sector. It serves as a center for automobile parts industrialists in the country in order to protect, support, and develop Thai industries. The association has 528 member companies. TAPMA’s role is to cooperate with the government in drafting and implementing policies for the automobile parts industry. It represents the private sector and presents problems and obstacles facing the industry to the government. As such, it also represents Thailand’s private auto parts sector in negotiations on the international stage. Moreover, TAPMA defends the legal rights of members and serves as a venue for members to exchange views. Furthermore, it serves as an auto industry information and news clearinghouse for both domestic and international members. Thailand Automotive Institute (TAI) TAI was established in 1998 to coordinate between the government and private organizations. The institute is responsible for researching and proposing suitable policies to the government. It acts as a center for coordinating among Thai automotive industries. It also determines and controls the standards of auto parts. Moreover, the institute provides testing services for auto parts certification. TAI gathers information in business areas and disseminates automotive news to its members. For international capacity building, it facilitates the development of human resources in the automobile industry. The institute strives to maintain the research and development (R&D) of 236 technology in the Thai automotive industry at the international standard. The institute has 652 member companies. Automotive Industry Club (AIC) Established in 1976 under the Federation of Thai Industries (FTI), AIC is a center for member companies in the automotive industry, consisting of manufacturers, distributors, importers, and exporters of cars and motorcycles. Acting as a focal point between members and agencies, including the government and other private agencies, the club's activities are aimed at promoting information sharing as well as facilitating joint solutions to various problems and concerns to strengthen the competitiveness of members and promote sustainable growth of the Thai automotive industry. 4. Innovation Capability This part is a summary of the interviews of seven companies in the automotive industry, presented as case studies. These case studies involve three automotive assemblers, two of which are MNCs, three Thai-owned Tier 1 suppliers and one Thaiowned Tier 2 supplier. In the case studies, the instrument for measuring technological capability developed by Rush et al. (2007) was also used. The measurement covers nine areas, including Awareness, Search, Building Core Competence, Technology Strategy, Assessing and Selecting, Acquiring Technology, Implementing, Learning, and Linking to External Sources. The results of the measurement of each firm will be presented in each case 237 along with the discussion. With the use of this simple survey tool, firms are classified into four different types depending on their technological capability level. Type A (Unaware/Passive) firms have low degrees of awareness of technology and of the effective practice of technology development. Type B (Reactive) firms recognize the need to keep up with technology but lack the skills and capabilities, and are slow in responding to the technology. Type C (Strategic) firms are highly capable, have a clear view of technology priorities, and have forward thinking. Type D (Creative) firms are knowledge-intensive, with fully developed capabilities and are able to redefine the technology frontier, challenge existing business models and create new markets. 4.1. Cases Studies CASE 1: Toyota Motor Corporation Toyota Motor Corporation was established in 1937 by Mr. Kiichiro Toyoda. Toyota first came to Thailand in 1956 as an agent for selling automobiles in the name of Toyota Motor Sales. Afterwards, Toyota established its first automobile assembly factory in Thailand at North Samrong in 1964, at a capital of 7,250 million baht, and changed the name from Toyota Motor Sales to Toyota Motor Thailand. Toyota now has four plants in Thailand, which are the Samrong plant, Thai Auto Works, the Gateway plant, and the Ban Pho plant (the plants are located in Chacherngsao and the head office is in Samutprakarn). There are currently 135,000 associates, 119 dealers, and 312 showrooms in Thailand. There are a total of 151 suppliers (Tier 1) in auto parts manufacture. Approximately 70% of Toyota suppliers are joint ventures with Japanese firms and the 238 rest are Thai companies. As for total production, 40% is sold domestically and the rest is exported. The current share of the Thai market is 44%. Figure 10 shows the time phase in the development of Toyota automobiles assembled in Thailand from 1964 until the present. In the earlier stage, Toyota assembled automobiles in the CKD (complete knocked-down) method where each auto part is imported and assembled in Thailand. Afterwards, Toyota set up an assembly plant in Thailand which now is the most modern and most efficient automobile assembly plant in ASEAN. Figure 10: Development of Each Automobile Generation of Toyota (Thailand) Source: TMAP-EM. Toyota Technical Center Asia Pacific (Thailand) Company Limited (TTCAP-TH) TTCAP-TH is a research and development base for Toyota in the Asia-Pacific region. It was established in 2005 at a cost of 2.7 billion baht. The center was set up to 239 meet the increasingly complicated needs of the region’s automotive market. This R&D center plays an important role in supporting the Toyota Motor Corporation in the designing and modifying of vehicles and component parts that have been developed in Japan to meet the demands of the Asian market. The center, built on an area of 320,000 square meters, is located on Bang-na Trad Road Km. 29.5, in Samutprakan Province. Currently, it has a total of 290 employees. The responsibility of TTCAP-TH is to provide design, research and development works as well as producing prototype vehicles and component parts for the region. Toyota Motor Asia Pacific Engineering and Manufacturing (TMAP-EM) TMAP-EM was established in Thailand in 2007. Its core function is to generate world-class research and development to support manufacturing and engineering expertise in all Toyota production plants in the Asia-Pacific region, enhancing production and service capacity in order to meet customer demand. Development in Toyota Development in Toyota can be classified in three categories, as development in products, manufacturing process, and supply chain management. These can be further divided into three phases: before 2004, 2004-2009, and 2010. It can be said that the development of the products is a result of the changes in customer preference. Since products have been developed continuously, this affects the way of production and the supply chain as well. Toyota also develops the production process with higher technologies that help to reduce the cost of production, enable flexibility, and improve supply chain management, as summarized in Tables 13, 14, and 15. 240 Table13: Overview of Product Development Phase1: Original Model (Before 2004) Classify market as global market therefore the product is almost same all over the world just the small minor change occur. Phase2: Innovation Multipurpose Vehicle (In 2004) Increase changes or innovation for product but focus in region base of market therefore the product design is differences between region for example; Asia, Europe and USA. (Adapt product according to the region preference) Source: Authors, based on interview with TMAP-EM. Phase3: Small Speedy Project (In 2010) The customer market is divided into each country depending on the demand from local customer. And the production time is decreasing. (Adapt product according to the local country preference) Table14: Overview of Production Process Development Phase1: Original Model (Before 2004) Using individual line of production which means different product model is produced in different production line. The disadvantage: High cost No flexibility Phase2: Innovation Multipurpose Vehicle (In 2004) Using mix models or mix lines method which means one line can produce several models. The number of car to produce for each model depends on the ratio that set in the system. The advantage: Increase line efficiency Decrease number of line Increase flexibilities when the demand change Source: Authors, based on interview with TMAP-EM. Phase3: Small Speedy Project (In 2010) Using the same mix models or mix lines in phase2 but the technologies capacity is much higher than phase2 so, the production time required is shorter. The advantage: High speed for production Table15: Overview of Supply Chain Development Phase1: Original Model (Before 2004) Local Supplier has low skill, know-how and efficiency therefore, Almost all of material parts need to import from Japan. The ratio for supplier; 90% import and 10% local. Phase2: Innovation Multipurpose Vehicle (In 2004) Local Supplier has higher skill, know-how and efficiency therefore, The ratio for supplier; 20% import and 80% local. Start to apply the following strategies to mange good level of inventory milk-run strategy Just-In-Time Source: Authors, based on interview with TMAP-EM. 241 Phase3: Small Speedy Project (In 2010) The purchasing system already in electronic format so, the transaction is always up to date. The advantage: Reduce lead time Appropriate level of Inventory Reduce production cost Reduce shortage External Factors Toyota believes that customer preference is different from country to country, and as such the customers’ needs are one of the important factors in creating new and innovative products that can satisfy customers in different area. For example, the Asia region has a greater interest in hybrid cars than does Europe, while European customers prefer a car’s luxury design over the engine inside. Toyota believes that if it can gain a high level of corroboration from its suppliers, then it can achieve a win-win situation. Toyota always sets up a team to train and share knowledge with suppliers, suggesting that the suppliers use Toyota Production System which focuses not on producing in big lots and keeping high levels of inventory but on producing only what is needed, so as to reduce the cost of production for both Toyota and the suppliers. The criteria for recruiting suppliers are to always look at their innovation and improvement, key factors in comparing between choices of suppliers. Internal Factors Toyota has internal research and development called TMAP-EM as the key factor to create innovation. With good research planning, Toyota can develop new products and processes to satisfy customers with better production technology. It has a good policy called the “Toyota way” to encourage employees to continually improve and respect people such as through the following activities: mornings to talk and discuss about work, brainstorming, solutions solving and idea generation. Those activities lead employees to keep developing themselves to enhance skills and know-how in order to think outside the box and create innovations. 242 Figure 11: Toyota Technological Capability CASE 2: Nissan Motor (Thailand) Co., Ltd. In 1960, the first assembly plant was established under the name of Siam Motors & Nissan Co., Ltd. On April 21, 2009, Siam Nissan Automobile Co., Ltd. changed its name to Nissan Motor (Thailand) Co., Ltd. The ratio of major shareholders is Nissan Motor (Thailand) Co., Ltd. with a 75% share and Nissan (Japan) with 25%. Nissan invested 1,900 million baht of capital. It has 92 dealers and 164 service centers in Thailand. In 2009, Nissan Motor Thailand had a 5.6% market share. It has a total of 4,200 employees. The parts ratio is 20% imported and 80% purchased domestically. Nissan has 248 suppliers which are 1st tier that provide automobile parts to the company. The domestic suppliers can be divided into three groups, which are Japanese companies who have settled in Thailand comprising 90%, Thai suppliers at 3%, and European suppliers at 2%. Nissan has good relationships with its domestic suppliers of more than 30 years. 243 After Nissan Motor became the main shareholder, the company could do more in collaborating with its suppliers. As a result, Nissan has a new model and innovation from collaborating with suppliers. The suppliers can develop the products and offer them to Nissan in the early phase of development sourcing. Nissan allows the suppliers to present and offer their products to the company, which helps to motivate suppliers to introduce new products and technology to Nissan. The suppliers have to develop their products in order to compete with other suppliers. Moreover, Nissan also sends an engineer in order to develop products together with suppliers. Nissan has also established a research and development base for the company in ASEAN, which is called Nissan Technical Center South East Asia Co., Ltd (NTCSEA). It was established in 2003 at a cost of 224.5 million baht. The center is located on Bangna-Trad Highway Km. 22 in Samuthprakarn Province. The total employees at NTCSEA is 114 persons. Nissan Motor (Thailand) Co., Ltd. holds 100% of the shares in NTCSEA. The center’s responsibility is to develop vehicles for ASEAN and other countries to ensure that all specifications meet the local market requirements of each country and the standards of Nissan. The main activity of NTCSEA is to create performance innovations. Of the external factors, the innovations at Nissan are motivated by the global trends that always change, for example, the green environment movement which is the main impetus behind creating the eco car. The rapid technological changes force the company to develop new technologies to compete against other auto makers. The economic downturn also pushed the company to introduce the eco car and the EV or electric vehicle. 244 Of the internal factors, Nissan has its NTCSEA, a research and development base for the company in ASEAN and other counties. The job scope of NTCSEA is to collaborate and develop products with suppliers by sharing information and know-how. NTCSEA has to respond by developing vehicles for ASEAN and other countries in order to met the local market requirements and Nissan’s standards. Moreover, the R&D team has the task of evaluating the market competition, customers, and customer feedback. Human resources are one of the internal factors that the company also focuses on. Nissan always motivates employees in the organization to come up with new ideas and solve problems in order to develop processes and products continuously. The company has the “Nissan way” policy for employees to follow as cross-functional teams in order to learn and undergo experiences from work in different departments. Nissan always pushes employees in the organization to learn and develop to their potential to have innovations. Figure 12: Development of Each Automobile Generation of Nissan (Thailand) Source: NTCSEA. 245 Figure 12 show the time phase of the development of Nissan automobiles which are assembled in Thailand from 1985 to the present. All models of Nissan cars have been created by Nissan in Japan. Nissan launches a new model every four years and has minor changes to products every two years in order to support market needs. Figure 13: Nissan Technological Capability CASE 3: The company in this case study and its corporate group constitute one of the major parts manufacturers in Thailand for cars and motorcycles. With leadership from top management growing up continuously since its establishment on March 16, 1977, the group today comprises 30 companies, which are 60% local and 40% joint venture. Companies are located in Samutprakarn, Laem Chabang, Rayong, Ayutthaya, Nakornnayok, Malaysia, and India. The products of the firm are well-accepted among the industries. Customers include all famous OEM manufacturers in Thailand, both 246 local and foreign companies, from Japan, Europe, the United States and other countries. These include Toyota, Nissan, Mitsubishi, Ford, Isuzu and Honda. Innovation The firm has raised its production capability continuously in producing better quality and new parts with higher technology. This continuous improvement ambition is an on-going process aimed at offering the customer highest satisfaction. The company’s policies focus on how to create innovation. Most of the innovation in this company involves process innovation. Since top management realizes the importance of developing the organization, the management team performs the following activities in order to upgrade the organization to be a leader in automotive manufacture. External Factors The major motivation for innovation is the change in demands on products or production styles from customers, forcing the company to generate new ideas and production methods that match with design changes and also reduce the cost of production. For example, if a customer changes software, that encourages the firm to learn how to implement the new software to run the business. The company believes that it needs to develop in order to grow with customers. Sometimes the manufacturer does not wait for the customer’s order but instead tries to develop an innovation and proposes it to the customer first, showing that the company has ability to co-design with customers. Even if the proposal is not accepted, at least employees can develop themselves to create something new and gain better capabilities. 247 Trends in technology lead the firm to pursue opportunities in visits to overseas companies, observing their operations and developments in order to learn from those successful companies, with the objective of enabling employees to see the benefits of the developments. In one example, Japan Technology Assistant (Japan TA) helps the firm by sending an advisor to explain how to develop and implement new technologies. Automotive industry competition is intensifying and most companies are concerned about having competitive advantages. Firms should continuously provide unique products and services, that is, they must constantly be innovative in order to keep a step ahead of competitors. Growth of an organization needs to be supported in two perspectives: the organization itself and its human resources. The criterion to select suppliers is focused on the potential to develop performance to support production in terms of quality and cost. Since the company needs to develop with customers, the firm will choose only the suppliers that have the capability to grow with them, thus influencing suppliers to be innovative as well. Sometimes the human resources department works with universities, such as Thammasat University and the National Institute of Development Administration, to develop a curriculum for all levels of employees in the study of management. The R&D department cooperates with the Thailand Automotive Institute and the government for assistance on technology projects such as training programs, process development, software, and testing. Internal Factors Table 16 summarizes the milestones in the internal innovation development. This company continually improves itself by developing internal R&D and implementing the 248 SAP program. It promoted a “TSCIC” campaign as the organization’s culture. “T” stands for teamwork, “S” is for social responsibility, “C” means continuous improvement, “I” is for initiative/leadership, and “C” means commitment. The company also developed the new Thai Summit Production System and the so-called lean supply chain. Table 16: Innovation Development Year Innovation Development 1977-2003 2004 2006 2007 2008 2009 2010 Visit Over-sea Company to develop organization Develop internal R&D and Implement SAP program Develop TSCIC strategy Develop new Thai Summit Production System (TSPS) Develop Lean supply chain Develop Knowledge Management System (KM) Encourage Competition such as “Engineering Day” Source: Authors, based on interview with Case 3. The firm developed the Knowledge Management system to store the organization’s existing knowledge and to improve the organization’s performance by attempting to encourage and facilitate knowledge sharing among employees. For example, employees who have retired or are leaving the organization are interviewed to keep their skill and knowledge within the organization, and then all knowledge is centralized at a single place. It promoted many activities to encourage employees to be innovative, such as the internal competition called “Engineering Day” that allows all employees to present their own project. The most innovative group wins and receives some reward. This activity can develop employees’ knowledge and skills, as well as increasing knowledge sharing 249 among them. Therefore, the direction of the innovation process has changed from topdown to bottom-up. From all activities mentioned above, we can conclude that the major external factors for innovation are customer demand, technology, competition, and some outsiders. On the other hand, the internal factors are management’s support of change and the human resources management, which follows the slogan “Before we build parts we build people.” Finally, the overall assessment of the firm’s capability level in technology and innovation can conclude that this company has fully developed a set of capabilities. It takes a creative and pro-active approach to exploiting technology and innovation for competitive advantage. The following figure shows the relative strengths and weakness in technological capability of the firm. Figure 14: Case 3 Technological Capability 250 CASE 4: The company in the fourth case study was established in 1975, with a vision to be a leader in automotive parts manufacturing in ASEAN by providing end-to-end services, and to grow together with customers. Sales volume in 2007 was almost 6 billion baht, and sales volume has been growing by more than 10% every year since 2003. The company group consists of four firms. Among the main customers are Auto Alliance, Dana, GM, Hino, Honda, Isuzu, Kubota, Mitsubishi Motors, Nissan, Toyota, and Yongkee. As of 2007, the firm had more than 2000 employees. There are many products that this company produces, including rear axle shafts, brake drums, brake discs, flywheels, leaf springs and coil springs. For more than 60 years, the company has been the market leader in the manufacturing and sale of automobile parts. From decades of experience and expertise, it is the leading company in automobile parts, with the efficient manufacturing process contributing to product quality that is of an internationally accepted standard. It is QS 9000 and ISO 140001 certified (both are quality assurance certificates for the automobile parts industry). Innovation in this company is focused on how it manages cost effectively, with an emphasis on research and development to reduce production costs and create new products to meet customer’s needs. Most of the company’s customers are OEMs, Mitsubishi and Toyota in Thailand. External Factors Since the level of technological capacity for this company was still low, how to develop products or processes needed highly technical expertise and skill. Therefore, it 251 came up with the solution of acquiring a Technology Assistant (TA) from abroad. Its customer, Mitsubishi, helped the company by recommending and sending a TA from Japan to support technology and equipment. The TA was very important in helping the company to grow continually because the established internal R&D was not successful. One more reason why it needed a TA was that the customer demanded a reliable TA to guarantee the company’s efficiency. The customer also helped in terms of employee training by sending engineers to transfer knowledge. Sometimes it works with universities, such as King Mongkut's Institute of Technology Ladkrabang, to consult on product testing and development. The company has to run the business to achieve development without help from the government or associations. The growth in technological development supports the customer in the changing or development of cars with a new style, and it reduces cost. For example, nowadays the eco car is more popular than other types. This affects the company’s production process in order to change to match with that new model. Internal Factors The management team established an internal Technical Learning Center (Training Center) to train employees to achieve higher skill and expertise. Then it tries to set KPI values and intensively encourage employees to be innovative. Besides employee development, the company tries to implement technology programs such as SAP to help in running the business. Finally, the overall assessment of the capability level for technology and innovation can conclude that the company has strong in-house capabilities and takes a strategic approach to technology. In some areas, the firm is in the technology frontier, but it still 252 has many important strengths. The following figure shows the relative strengths and weakness in technological capability of the firm. Figure 15: Case 4 Technological Capability CASE 5: In the fifth case study, the firm is a 2nd tier company in Samutprakan who provides stamping of automotive parts and metal parts for making car seats for the major 1st tier companies. As the mother company obtained new customers in the Rayong area, it decided to establish this firm in 1999 at Chachoengsao to serve new customers. In the beginning, it was a small company with main production process involving only welding for making metal parts for car seats. Starting with fewer than 20 workers and 20 welding machines, it was considered a 3rd tier company who received the orders from its mother company. Three years later, the company was able to spin off from its mother company and have its own customers. By gaining more and more customers, the company has expanded its own production process and gained more experience and manufacturing skill. During the economic crisis in 2009, the company faced the same 253 problem as other firms in the same industry. It had to slow or even stop production temporarily due to the low number of cars being produced by the car manufacturers. However, after the crisis, the company recovered and expanded. Today, it has about 700 workers, with assets of US$6 million to serve 12 customers in the 1st tier. Even with great success today, it can be said that this firm has almost no innovation at all in product design. Being at the 2nd tier, it makes the metal car-seat structure based on the design given by the 1st tier. Although there is no innovation in product design, the company owns innovative manufacturing processes. With 10 years of production experience, its engineers and workers are keen on the design process or even to modify a machine to be able to produce the part with low cost and high quality. Some of the design parts cannot be produced by a standard machine. Its engineers have to modify the machine or design a new machine. The company has a long relationship with its major customers and its major supplier. However, there is less cooperation between the company and its major supplier since the company usually buys standard products from the supplier. The standard products come with a certificate guaranteeing quality. Therefore, there is no need to assess the major supplier, which is a world-class company for quality control. Even so, quality assessment is needed for the small suppliers (about 20 companies) who provide a variety of raw materials. The relationship between this firm and its major customer is more important in terms of quality improvement, understanding the design, and machine selection. This relationship makes the firm more able to develop its own experience and skill. More than that, two Japanese engineers who retired from the customer company were recruited to be managers in this firm. 254 External Factors For external factors, customers may be the main factor driving the success of process innovation. Another factor is a private organization. This company is a member of the TAIA. As a member, it can obtain updated information from the association in terms of industry trends, technology, sources of raw materials, and government policies. With this information, the firm can plan and forecast for a better management plan. Finally, the overall assessment of this company’s capability level for technology and innovation can conclude that it is now in a state of gaining its own production experience. However, it is hard for the firm to step up to development of its own innovations due to the limit of its human resources. The following figure shows the relative strengths and weakness in technological capability of this company. Internal Factors It can be said that the major internal factors for supporting the innovation of the manufacturing process is the skill and experience of the manufacturing team, especially engineers and foremen. However, it seems to be very hard for this enterprise to upgrade itself to do products innovation since there are only seven engineers (including managers) out of the total of about 700 workers. 255 Figure 16: Case 5 Technological Capability CASE 6: The company in this case study is a Thai automotive parts manufacturer which is 1st and 2nd tier. The company was established in 1988 with an investment cost of US$0.4 million. It supplies auto parts and motorcycle parts to many companies, including Toyota, Nissan, Isuzu, and Honda. The company is certified to the manufacturing standards of TS16949 and ISO 9001. The firm had a manufacturing base at Bangbon in its first year and in 1989 moved to Bangpakong. Innovation As the automotive industry rose continuously in Thailand, the company had to expand the plant and located near the seaboard and its customers. The firm receives innovation from its customers through know-how and information sharing. It always improves the products to satisfy customer demand and order requirements. The evaluation of customer enhancements motivates the firm to have new developments in both products and processes. 256 External Factors This firm is a Thai supplier that is growing with its customers, such as Nissan (Thailand). These two companies have a good business relationship. The firm has received know-how from Nissan, which has sent a training team to the supplier to teach about work processes and suggest new technologies. Moreover, both companies have collaborated in product development. This firm learns new technologies and methods which can help it reduce lead time and respond to customer needs such as through Kaizen, Milk-run, and Just-in-time. The evaluations of the customers help the firm improve products and processes to meet customer requirements. Internal Factors The top management aims to support and develop the company to enhance business. This supplier always sends an engineering team to learn new technologies from other companies both in Thailand and overseas, and then incorporates the knowledge to develop the company in order to meet the local market requirements. It emphasizes learning from customer companies and solving problems together. In this case study, we can see that the innovation which occurs in this company comes from know-how and information shared by its customers. Moreover, the support from the director is also a factor driving the company to further development. 257 Figure 17: Case 6 Technological Capability The overall assessment, as shown in Figure 17, is that there are relative strengths and weaknesses in technological capability in this case. It can be concluded that the company intends for its core competencies, technology strategy, implementation and learning to drive innovation for a competitive advantage. CASE 7: This case study features a Thai-owned company which was established in 1967 with US$15.9 million in registered capital. It is a 1st tier auto maker. The company was listed on the Stock Exchange of Thailand in 1994. The firm’s activities are the design and development of motor vehicles and automotive parts, the design and manufacture of dies and jigs, the manufacture of automotive parts, and vehicle assembly. There are three main areas in the group’s business, which are manufacturing, trading (vehicle dealerships) and property (real estate). Table 17 shows the recognized excellence award which can guarantee performance and product innovation. 258 Table 17: Recognized Excellence Year Awards 2005 2004 2003 2002 2002-2001 2000 1999 1998 1997 1991 1990 1988-1986 1987 1986 Car of the Year award, for TR Adventure Master, in the ‘Thai Automotive Innovation’’ category, for the third consecutive year. Named by Forbes Asia as one of the 200 best ‘smaller’ (annual revenue less than US$ 1 billion) public companies in the Asia-Pacific Region. Car of the Year award, for TR Adventure Master, in the ‘Thai Automotive Innovation’ category, for the second consecutive year. Car of the Year award, for TR Adventure Master, in the ‘Thai Automotive Innovation category. Prime Minister's Export Award in three categories: Best Exporter; Distinguished Brand; Distinguished Design Granted ISO 14001 International environmental standards certification, from BVQI Car of the Year award, for TR Xciter, from Grand Prix Magazine, for two consecutive years. Authorized to use the ‘Thailand's Brand’ symbol for Thai products. Received ISO 9001 international standard certification for vehicle design and assembly, and QS 9000 certification for auto body parts, from BVQI. Received ISO 9002 international standard certification for auto body parts, from BVQI. World Economic Forum, Geneva: named one of the top performing companies from East Asia. Outstanding Entrepreneur and Designer of Industrial Products Award, from Ministry of Industry Leading Factory of the Year Award. Environmentally and Hygienically Safe Industrial Factory Award, three consecutive years, from Bangkok Metropolitan Administration. Outstanding Product, Category Vehicles and Parts; International Asia Award. Outstanding Product, Category Modified Pick-up Truck Source: Authors, based on interview with Case 7. The innovation that the company focuses on involves producing automobiles that are created by Thai engineers for Thai users and enhancing the product to meet international standards. The enterprise always develops and improves the product to build customer satisfaction through world-class service. It makes the product at a lower price than foreign companies. External Factors In accordance with the rapidly changing automotive market in Thailand, the company develops and improves the products in order to respond to customer needs and market trends. Engineers gain knowledge from other companies in Japan and China. 259 The company has made innovations on the bodies and interior designs of limousines, military utility cars, ambulance vans, and buses. Moreover, the firm collaborates with universities, such as MTEC (National Metal and Materials Technology Center, Thailand), for consultation on product testing and development. Automotive parts production accounts for about 50% of the company’s revenue from all products. Thus, the enterprise has changed its strategy to focus on producing these parts. Besides, as the automotive market in Thailand is seeing higher demand for eco cars, this encouraged the company to be the first supplier of parts to many makers, including Nissan. Furthermore, the plant is interested in forming a joint venture with the Toyota Motor Group to develop products and fit special accessories for special purpose vehicles, which could encourage the firm to enhance innovation. The company suggests that the Thai government and the automotive association should help Thai-owned companies compete with the multinational companies. Internal Factors The enterprise emphasizes human resources. The top management supports workers to have innovation and initiative in order to enhance employee skills and performance. It uses in-house R&D in order to develop the processes and products. Thus, all the products of the firm are produced and developed by Thai engineers. Moreover, the company transfers technological knowledge with its alliance. The overall assessment, shown in Figure 18, is that the company has relative strengths and weakness in technological capability. It can be concluded that the company intends for its core competencies, technology strategy, and assessing and selecting to drive innovation for a competitive advantage. 260 Figure 18: Case 7 Technological Capability 4.2. Technological Capability Levels The following table summarizes the characteristics of all firms in the case studies that we conducted from the interviews. 261 4,200 employees 5 companies 13,500 employees 10 companies - Policy (Nissan way) - Human Resource - Employee motivation management by internal competition - Policy (Toyota way) - Employee Motivation - Technical learning center - Human resource management 262 - Policy (TSCIS,TSPS, - Employee KM strategies) motivation - R&D - R&D - R&D - Technology development - Management support - Management support - Management support - Management support Source: Authors. Internal factors - Work with university - Competition - Technology assistant - Work with university - Knowledge transfer to supplier - Technology assistant - Customer need 4 companies 2,000 employees 1975 - Technology development - Customer demand 30 companies 1977 Case 3 Case 4 1st/2nd Tier Thai-owned 1st Tier Thaicompany owned company - Relationship with - Technology supplier trends - Global trends 1960 Case 2: Nissan Assembler 1964 Case 1: Toyota Assembler Innovation Factors External factors - Customer need Year of established Number of employee Number of company group Firm characteristics Table 18: Summary of Case Studies - Customer need - 1988 Case 6 1st Tier Thai-owned company - Customer need and market trend 6 subsidiaries and 2 joint venture companies 1967 Case 7 Thai-owned Assemble and 1st Tier company - Skill and experience of technical team - Management support - Management support - Skill and experience of workers - Learning capability - R&D - Management support - Private organization (Thai - Relationship with - Collaborate with Automotive Industry customer and supplier university Association) - Learn from other companies - Customer need 700 employees 1999 Case 5 2nd Tier company Figure 19: Technological Capability Comparison for 7 Cases The above figure presents the technological capability levels for all of the interviewed firms. The circles represent the different types of assemblers and suppliers by firm size. As we can see from the previous tables, the interviewed firms have characteristics that differentiate them. These include whether they are large or small, foreign or local, and assembler or supplier. All cases are spread from Type B (Reactive) to Type D (Creative). The foreign assemblers, which are Toyota (case 1) and Nissan (case 2), have the highest level of capability, and accordingly the highest investment on R&D and technological development. Next in line for technological capability is a purely Thai assembler (case 7) but the company is small compared to foreign firms and its market share is also smaller than that of foreign firms. The 1st tier suppliers are rated as firm Type C (case 4 and case 6), which is lower than all of the assemblers and case 3. Although case 4 has started to establish R&D, it is for the improvement of the production process. Case 6 only receives technology transfers from its customers (assemblers), which forces it to only follow the design. It also gains technology transfers from its machine suppliers. However, case 3, which is also a 1st tier supplier, could be categorized as Type D. The reason why case 3 could be rated better than the other 1st tier suppliers is not only due to size and capital but also 263 because its management team encourages continuous development and technological and employee innovation. The 2nd tier supplier (case 5) gets the lowest level because it did not have enough human resources capability to motivate innovation. Moreover, as its production method for making small automotive parts is not complicated, the firm does not need to force any innovations. 4.3. Factors Affecting the Technological Capability Levels It is observed that cases 1 and 2 are the MNCs and they have been well established in Thailand for decades. Thus, the technological capabilities of these companies are high as their mother firms had already set the policy for them to be able to absorb technology and be ready for innovation. They both have already set up product R&D centers in Thailand for local design to suit the local market. It is quite common that the assembler companies are those who create the product design in the automotive industry. Thus, the customer or market trend is the major factor stimulating each of cases 1, 2 and 7 to be innovative. However, the major barriers for case 7 to be more innovative are the local technological availability, the local human capacity and advanced automotive R&D, especially in engines. The TA is the key for local companies to achieve rapid technology transfers that would help them improve their quality and production processes, as clearly seen from cases 3 and 4. Case 6 does not have a TA but receives technology transfers from its customers or machine suppliers. The growth and innovation of case 6 are clearly slower and less than for cases 3 and 4. The major internal factor is the human resources management that stimulates all employees to be creative and express their ideas. The style of management is called “bottom up.” This can be observed in case 3, which is the 1st tier supplier, but it can have Type D (Creative), different from cases 4 and 6. In addition, the top management attitude is also the key to making case 3 more innovative than cases 4 and 6. The top management of case 3 aggressively seeks out technology from the partners, while case 6 only relies on the customers and case 4 was forced to have the TA. 264 5. Government Impact and Policy Based on Kaosa-ard, M.S. (1993), government policies on the automotive industry from the 1960s to 1993 can be divided into four phases: “Initial Protection” (19621969), “Industrial Rationalization” (1972-1977), “Localization” (1978-1986), and “Transition Toward Low Protected Industry” (1987-1993). The first policy phase was to stimulate the automotive industry via investment incentives from the Board of Investment. The policies in the second and third phases focused on building the local producers. During the last phase, government policy seemed to be in the role of supporting rather than protecting this industry. Along with the four phases of government policy, the development of the automotive industry seems to be quite successful, as can be seen in the automotive sector’s significant increase in economic value and its large number of local producers. Today, Thailand is not only able to produce cars for the domestic market but is also one of the world’s automotive exporters. Credit should be given more or less to past policy. In terms of quantity (the large number of local producers), it is impressive. However, in terms of quality (the performance of local producers), it is hard to say whether government policy has been successful. Based on the previous section, most of the local producers are in the 2nd and 3rd tier, with only a few in the 1st tier. It can be said that the past policy was able to accelerate only the number of local companies, with technology transferring still quite slow. Due to globalization and trade liberalization via several agreements within the international community, competition in the world market will grow even stronger. To survive, Thai producers must become sufficiently capable. Own innovation is what can make them capable. However, innovation needs a strong technology background. Therefore, the government has to ensure that new policies can strengthen local producers’ capability by increasing the technology transfers from major automotive assemblers to the local producers. At the last stage, after absorbing enough technology, the local producers will be able to start their own innovation and they can survive in the competitive world. 265 Policy Recommendations In the past, government policy aimed to support the automotive industry as a whole. It seems to have been successful, and after many decades the automotive sector has grown stronger. Many local producers participate on different levels as part of the automotive supply chain. As mentioned earlier, the policy of the government should focus more on increasing firms’ capabilities. However, based on the surveys and the interviews in the previous section, local producers have different technological capability. This can be classified into four levels: Type A (Unaware/Passive), Type B (Reactive), Type C (Strategic), and Type D (Creative). Looking at the structure of the Thai automotive industry, Type D are those who are the assemblers, and Types C, B and A are those who are in the 1st, 2nd and 3rd tiers, respectively. Therefore, government policy should not be designed generally for the automotive industry as a whole but for meeting the needs of the different levels of firms, as follows. Policy for Type D firms: The policy for this group should motivate them for transferring technology. Establishing R&D units for high-technology automotive components of the Type D firms is an excellent starting point for technology transfers. However, besides a large amount of investment, establishing a high-tech R&D unit involves many more factors, including sufficient and capable human resources, intellectual property protection, and large local demand. Therefore, the government should assist Type D firms in the establishment of R&D units. Policy for Type C firms: The firms in this group have a good chance at gaining the most benefit from technology transfers. They have management people who are aware of the importance of technology, sufficient and capable human resources for absorbing the technology, and even some innovations of their own. Many of them can do well in process innovation as they know how to make the product and can develop efficient ways to improve their production, even though they have less product innovation. They do not know how to design the product to suit customer needs since they lack a high level of technology and do not understand customers very well. Therefore, government policy 266 for this group should aim to enhance their ability to create product innovations. Government policy should support them in setting up R&D budgets and R&D units for product innovation. This can be done via the strong incentive of tax reduction. Also, a stronger link should be developed between the national research centers, universities and the firms of Type C for developing product innovation. Policy for Type A and B firms: The strength of the firms in these groups is their large number of skilled workers who can do the precise design jobs. However, the limited number of engineers inhibits them from absorbing technology transfers. It may be difficult for them to pay very high salaries for recruiting more engineers. Therefore, government policy for these groups should help them to develop and enhance the capability of their own people. The government may provide grants for universities or private organizations to set up technology incubator centers for developing the technological capability of workers in the automotive industry, especially for the firms in the 2nd and 3rd tiers (or Type A and B firms). Finally, in short summary, the proposed policy is for the government to tailor-make policies that support the different types of firms in the automotive industry. This should create linkage between technology transfers and more self-innovation by the local firms. 267 REFERENCES Amano, Tomofumi (2009) “Learning the Way of Capability Building from the Case of Toyota Motor Thailand.” http://www.jbic.go.jp/en/about/topics/2009/042302/3amano.pdf (accessed January 10, 2011). Asawachintachit, Duangjai (2009) “Opportunity Thailand.” http://www.boi.go.th/english/download/news/1426/DJ_seminars_in_Brisbane_2 9%20April%202009_final.pdf (accessed January 10, 2011). Automotive Industry Analysis Division (2009) “Summary Report and Analysis,” Thailand Automotive Institute, http://www.thaiauto.or.th/research/document/status09/status0910.pdf (accessed November 10, 2009). Hart-rawung, C. (2008) “Building Competitiveness with Manufacturing Automation, Automotive Parts Manufacturing.”http://www.tgi.or.th/content/filemanager/files/Automotive%20P arts%20Manufacturing.pdf (accessed January 10, 2011). Kaosa-ard, Mingsarn (1993) “TNC Involvement in the Thai Auto Industry,” TDRI Quarterly Review, 8(1): 9-16. Praisuwan, Vittaya (2006) “Investment Opportunities in Thailand: Automotives.” http://www.boi.go.th/english/download/business_speeches/282/Automotive%20 Sector%20presentation%20India%20mission.pdf (accessed January 10, 2011). Rush, H., Bessant, J. and Hobday, M. (2007) “Assessing the Technological Capabilities of Firms: Developing a Policy Tool,” R&D Management, 37: 221–236. Tiasiri, Vallop, (2010) “Automotive Industry in Thailand,” Thailand Automotive Institute (TAI), http://www.thaiembassy.jp/rte2/boidoc/20100917%20TAI%20President%20[Co mpatibility%20Mode].pdf (accessed March 1, 2011). 268 APPENDIX Table A1: Automotive Parts Classified by Product Group Produced by Thai Manufacturers Automotive Parts Classified by Product Group Number of Thai Manufacturers 1 Agricultural & Farm Machines, Trucks, Tractor 30 2 Air Bags 8 3 Air Compressors, Air Conditioners 22 4 Air Filters 14 5 Air Fresheners, Polishing Waxes, Coolants, Break Fluids 2 6 Alternators 6 7 Aluminum Die-Castings 10 8 Axles 13 9 Balance Weight Leads 2 10 Batteries, Battery Chargers, Battery Terminals 10 11 Bearings 17 12 Bedliners 3 13 Blanking Parts 10 14 Body Modification, Busers, Trailers, Others 3 15 Body Parts 35 16 Bolts & Nuts, Fasteners, Stud & Screws 15 17 Break Cylinders 8 18 Brake Hoses 8 19 Brake Linings 14 20 Brake Pads 18 21 Brake Parts 26 22 Brake Pipes 6 23 Bumpers 24 24 Bushing 28 25 Cam Shafts & Crank Shafts, Crank Cases 16 26 Car Alarm, Car Clock, Anti-Theft Devices 1 27 Car Radios, Car Antennas, Speakers 3 28 Carbon Brushes 3 29 Carburetors 4 30 Carpets, Floor Mat 8 31 Catalytic Converters 5 32 Chasses 10 33 Chassis Frames 14 34 Chemicals 11 35 Clutch Covers 2 36 Clutch Cylinders 7 37 Clutch Disc, Clutch Plates 13 38 Clutch Facings 2 39 Coil Springs 10 40 Condensers 4 269 Table A1 (Continued) Automotive Parts Classified by Product Group Number of Thai Manufacturers 41 Conduit Tubes, Wire Protection Products 3 42 Control Cables 8 43 Cooler / Air Conditioners, Heater / Air Conditioners 9 44 Cross Pins 2 45 CV Joints 6 46 Cylinder Heads, Block 9 47 Cylinder Liners 10 48 Dashboard & panels 10 49 Decals, Emblems 2 50 Differential Gear 5 51 Disc Break Assembly 20 52 Disc Pads 12 53 Distributors 11 54 Door Handles & Locks, Door Hinges & Checks 18 55 Drive Shafts 8 56 Drive Transmission & Steering Parts 4 57 Drum Brake Assembly 13 58 Electrical Parts, Components 24 59 Electro Plating 8 60 Engines 10 61 Engine Mountings 19 62 Engine Parts 37 63 Engine Valves 6 64 Excavators, Forklifts 1 65 Exhaust Pipes & Mufflers 19 66 Exhaust Systems 11 67 Fan Shrouds, Fan & Fan Clutches 10 68 Fiber Glass Parts 6 69 Flashers, Relays & Solenoids 7 70 Fly Wheels, Pulleys 16 71 Fog Lamps 6 72 Fuel Filters 12 73 Fuel Level Gauges 4 74 Fuel Pumps 4 75 Fuel Tanks 11 76 Fuses & Fuse Boxes 5 77 Gaskets 11 78 Gear Wheels 6 79 Glass Lenses 3 80 Glow Plugs 1 270 Table A1 (Continued) Automotive Parts Classified by Product Group Number of Thai Manufacturers 81 Grillers 10 82 Head Lamps 8 83 Heat Exchangers 4 84 Heat Treatment 9 85 Horns & Buzzers 6 86 Hoses 15 87 Hubs 11 88 Hydraulic System 4 89 Ignition Coils 2 90 Instruments and Gauges 2 91 Interior Parts 23 92 Iron & Steel Casting & Forging 22 93 Jack & Tool Kits 5 94 Jigs & Fixtures 25 95 Lamps & Lights 16 96 Lamps, Bulbs, Accessories 10 97 Leaf Springs 9 98 Leathers 3 Lubricants, Oils & Petroleum 5 100 99 Machines, Machine Tools 25 101 Machining Center Parts 23 102 Magnetos 3 103 Manifolds 2 104 Metal, Steel, Steel Pipes 14 105 Mirrors 13 106 Moulds & Dies 62 107 Moulded Forms 8 108 Mud Guard 17 109 Oil Coolers 5 110 Oil Filters 19 111 Oil Pumps 7 112 O-Rings, Oil Seals, Seals 20 113 Other Accessories and Parts 47 114 Paints 16 115 Panels-Body, Door 18 116 Pedals 7 117 Piston Rings, Piston Pins 18 118 Plastic Injection Moulds 26 119 Plastic Parts 19 120 Pressed Parts 37 271 Table A1 (Continued) Automotive Parts Classified by Product Group Number of Thai Manufacturers 121 Radiators, Radiator Caps 13 122 Rubber Hoses 12 123 Rubber Parts 35 124 Seat & Seat Spring, Seat Parts 25 125 Seat Belts 11 126 Shock Absorbers, Shock Absorbers Parts 23 127 Spring Plugs 7 128 Speedometers 6 129 Springs 15 130 Stabilizer Bars 7 131 Stamping Parts 53 132 Starters 11 133 Steering Locks 2 134 Steering Sheft Columns & Gear, Pump's Assy 6 135 Steering Wheels 5 136 Sun Visors 6 137 Suspension Parts 16 138 Switches 7 139 Thermosetting Parts (Insulator) 2 140 Torsion Bars & Stabilizers 8 141 Trading, Import, Export 15 142 Transmission Belts & V-Belts 5 143 Trucks, Trailers, Parts 16 144 Tuk Tuks 1 145 Turbo Chargers & Super Chargers, Components 3 146 Tires, Tubes, Valves 6 147 Universal Joint, Ball Joints, Yokes 6 148 Vehicle Assembly 6 149 Water Pump 8 150 Weather Stripping & Insulating Tubes 4 151 Wheel Caps 4 152 Wheels, Light Alloy 7 153 Wheel, Steel 3 154 Windshields & Glass 7 155 Window Glass 8 156 Window Regulators 6 157 Window Washers 2 158 Wiper Arm & Blade, Wiper Motors & Linkage Parts 7 159 Wiring Harnesses 8 160 Others 24 Source: Thai Auto Parts Manufacturers Association (http://www.thaiautoparts.or.th/). 272 Chapter 6 Development of Automotive Industries in Vietnam with Improving the Network Capability TRUONG THI CHI BINH NGUYEN MANH LINH* Institute for Industry Policy and Strategy As a latecomer, the automobile industry started in Vietnam just 20 years ago. Although the country has made great efforts to promote the industry, the production scale is relatively small, with only 5,000-7,000 units per year by introducing backward and simple production, painting and welding technologies. The localization rate of the automobile industry remains low, currently only reaching about 5-10%. More than 90% of automobile parts and components are imported from parent companies or foreign suppliers. While bulky seats and some labor-intensive parts have been localized, the most valuable parts are imported. Compared with the motorcycle industry, the market size of the automobile industry in Vietnam is smaller and the growth rate is lower, which limits the strategic options to overcome obstacles. Trucks and buses have a higher localization rate than passenger cars since local firms can supply parts for passenger cabins and storage cabins. The linkage of local businesses to large manufacturers is very limited. Although MNCs in the automotive sector entered the Vietnam market nearly two decades ago, most of the important parts still are imported from other branches of parent companies or from foreign suppliers. This report seeks to understand the innovative activities, internal and external factors and the obstacles for firms to lay a foundation for the automotive industry in Vietnam. * Institute for Industry Policy and Strategy, Vietnam. 273 1. Introduction After 20 years of Doi moi, Vietnam’s industry has had strong stages of development and it has contributed in a large part to the rapid speed of economic growth. However, the industry is engaged primarily in processing and assembling. The growth rate in production volume is always higher than the added value. Industrial goods are less competitive than in other ASEAN countries. Competitive advantages of Vietnamese industrial goods are mainly basing on cheap labor resources and available natural resources. The actual structure of the industry is relatively backward. The most important contribution to the total social product comes from food processing and other laborintensive industries, such as footwear, textiles, furniture and so on. The automotive industry, with greater value added and high technology content, still makes a limited contribution. In 2009, three industries, including textile and apparel, footwear and furniture, contributed about 30% of total exports of the country (excluding oil). Besides these traditional sectors, in recent years, several new high-tech industries such as the electric and electronics industries have begun to participate in export activities. The electronic industry exported 2.7 billion dollars in 2009, up to about 6% of total exports. Industrial machinery and equipment also exported 2.0 billion dollars in 2009 – approximately 4% of total exports. Although industries with high technological content participate, labor-intensive industries are the major export activity and they are internationally integrated. Vietnam, which is in the early stages of industrialization, should develop its automotive industries as a top national priority in order to improve industrial capability 274 and competitiveness. Further progress in development and industrialization requires concentrated internal efforts in such areas as upgrading skills and technology, creating efficient logistics, and broadening the industrial base and linkages. The promotion of the automotive industry touches on all these areas and is therefore the key to accelerating Vietnam’s industrialization. Without building internal capability, there are serious risks of an exodus of foreign direct investment (FDI), de-industrialization, and economic slowdown and even stagnation – phenomena which can be collectively called the “middle income trap.” This survey focuses on the automotive industry, especially its manufacturing network and technological capabilities. The research will also identify the internal and external factors of motivation and hindering, and that firms need to implement regular innovation and upgrading. 2. Automotive Industry in Viet Nam 2.1. Automotive Industry Among the achievements in 20 years to promote the automotive industry, the motorcycle industry is considered the most successful in the formation of a system of domestic suppliers. This is due to industry characteristics, regulations relating to localization and an extremely large domestic market. Because of the market size, foreign assemblers have appealed to foreign suppliers in this industry to follow them. According to the Ministry of Industry and Trade (MOIT), by 2009, the rate of localization had reached 95% in the motorcycle industry. In the process of cooperation, there is technology transfer from foreign companies to Vietnamese suppliers. 275 Development steps have also been made at the technology level, and in management and labor skills. In general, the manufacturing industry in Vietnam is still young. Despite the active participation of FDI, the basic technology level of the manufacturing industry is relatively backward, making it difficult for indigenous firms to participate in international manufacturing networks. Vietnam’s automobile industry began in 1991 with two FDI companies - Mekong Auto and Vietnam Motors Corporation (VMC). After 20 years, there are only about 100 enterprises, including 17 assemblers and nearly 80 suppliers. Although there are a number of domestic firms, a relatively large market share is dominated by FDI enterprises such as Toyota, Honda, Daewoo, Suzuki Domestic enterprises include familiar brands such as Truong Hai and Xuan Kien. The country has made great efforts to promote the automobile industry. Import tariffs on completely built up (CBU) cars fell from 90% to 80%, to 70% and then 60% to meet domestic demand, and then gradually increased until the current 83% “out of room” (the highest import tariffs in the World Trade Organization’s accession commitments). Despite such protection, domestic automakers cannot meet targets. Production is relatively small, only 5,000-7,000 units per year, backward and simple, with technology such as painting and welding. The automobile industry has a low localization rate, currently only about 5-10%. More than 90% of automobile parts and components are imported from parent companies or foreign suppliers. While bulky seats and some labor-intensive parts have been localized, the most valuable parts are imported. Compared with the motorcycle industry, the market size and growth rate of the automobile industry in Vietnam are lower, which limits strategic options to develop 276 the industry. Trucks and buses have a higher localization rate than passenger cars. It is easier for a local firm to supply parts for passenger cabins of buses and storage cabins for trucks than to supply parts and components for passenger cars. The linkage between local businesses and large manufacturers is very limited. Although MNCs in the automotive sector entered the market nearly two decades ago, the most important parts, such as engines and gearboxes, are imported from branches of parent companies or from foreign suppliers. 2.2. Supporting Industry Parts and component suppliers in Vietnam, both FDI and local, are few and scattered in comparison with Malaysia and Thailand. Moreover, there is no comprehensive data on supporting industries. The underdevelopment of supporting industries has much to do with demand size. According to data from the Industry Policy and Strategy Institute (IPSI) of MOIT, one Japanese motorcycle assembler had a localization ratio of 86% in 2009 because domestic demand for motorcycle is sufficiently large. In the same year, one Japanese automotive assembler had a localization ratio of only 9% because domestic demand for automobiles is too small for efficient operation. Another IPSI survey on the capability of local suppliers conducted in 2008 revealed that foreign assemblers and local suppliers shared similar views. For example, they agreed that: (i) A large number of relatively “easy” parts and components made of cast iron, steel or plastic continue to be imported because no local company can supply them. (ii) Engineering and technical capabilities of domestic suppliers are generally low and 277 lack the ability to perform required QCD (quality, cost and delivery). (iii) Capacity to supply large quantities with stable quality is low. (iv) Too much attention is placed on the cost of materials while far less attention is paid to costs associated with waste, defects, inventories and uneven quality of inputs. (v) Local producers under cost-cutting pressure are unable to invest in necessary human and physical capital to become viable parts manufacturers. Of the various sectors, the supplier system for motorcycle assembly is the most developed in Vietnam. This is due to the large domestic demand as well as to previous government policies. The large volume allows assemblers to invite foreign suppliers to Vietnam and to also cooperate with local firms to improve skills. In the process of cooperation, technology and know-how are transferred from foreign assemblers to Vietnamese suppliers. Examples of successful cooperation leading to the emergence of local suppliers include F3, Dong Anh and Hanoi Plastic Company. 3. The Case Studies 3.1. Firm Sample Twelve automotive enterprises were selected for interviews for this study, including 5 assemblers (2 FDI and 3 domestic) and 7 suppliers (3 FDI and 4 domestic). Some suppliers of motorcycle parts and components have high potential or the expectation to manufacture automotive components. The main objective of the study is to assess the internal and external factors needed to develop the technological 278 capabilities of enterprises and to identify hindering factors in the automobile industry. The term “technological capability” refers to those activities which enable firms to choose and use technology to create competitive advantage. Nine activities are used as an audit tool for Hobday (2004). Figure 1 presents the sample of the 12 firms which were analyzed during the research. As noted in the introduction, the sample focused on high-performing firms in the context of Vietnam. Most of them are innovative in a radical manner. Figure 1: List of Firms and the Evaluation of Technological Capabilities 35 Exploiting external linkages and incentives 30 3 Learning 25 3 4 3 1 20 3 3 15 10 5 0 1 2 2 2 1 1 2 3 3 3 3 4 4 4 4 3 3 3 2 2 3 3 2 1 2 1 1 1 2 3 2 2 2 3 1 2 1 1 1 2 2 1 2 1 2 3 3 2 1 1 F1 F2 F3 F4 F5 1 1 1 1 1 1 1 2 2 F6 3 3 3 3 1 2 1 1 1 2 3 3 2 2 1 2 2 2 2 3 2 Implementing and absorbing technology 2 Technology acquisition 3 Assessing and selecting technology 2 2 2 3 Technology strategy Building a core technological competence Searching 2 3 2 3 2 2 2 4 2 1 1 3 3 3 3 F7 F8 F9 F10 F11 F12 Awareness (1) F1 F1, 100% foreign capital operating in Vietnam since 2003, is a subsidiary of a company, a tier 1 supplier of Toyota. F1 mainly produces air flow meters, that is, sensors to measure air flow, exhaust gas recirculation (ERG) valves, and tumble generator valves (TGV). F1’s products are exported to Toyota for world-wide use. 279 F1’s machinery and equipment are highly advanced and modern and satisfy the standards of the parent company as well as meeting customer demand in the global market. In addition, the company has a design center with modern equipment and staff trained in using specialized tools. With domestic purchasing only about 13%, F1 focuses on increasing local content in order to reduce the cost of raw materials and components (current mainly imported from Japan and Thailand). F1 has attracted a number of sub-suppliers to invest in Vietnam. Figure 2: Technological Profile of F1 Awareness 4 Exploiting external linkages and incentives Searching 3 2 Learning 1 Building a core technological competence 0 Implementing and absorbing technology Technology strategy Assessing and selecting technology Technology acquisition Although it is an anchor of automobile suppliers in Vietnam, the firm does not have a clear strategy or specific plans. It depends on the strategy of the parent company and on Toyota Vietnam. 280 (2) F2 F2 began in Vietnam in 1998 with a total investment of US$ 102 million. F2 contributes 75% and Diesel Song Cong Vietnam has 25% of the capital. This is the largest project in the automobile industry in Vietnam. F2 has introduced world-class technology into Vietnam to ensure the highest international standards. Since production began, F2 has invested in an electrostatic painting system using the most modern technology. In 2008, F2 invested nearly US$10 million to build an advanced plasma welding line. The company has also invested in a system for checking vehicles carrying high-tech products to ensure they meet all the technical requirements of the industry in the country. Having a high level of awareness and a clear technology strategy, F2 evaluates its capabilities annually and provides strategic innovation and upgrading in specific technologies. The company is particularly interested in training management resources. According to the chief executive officer (CEO), apart from him, all staff are Vietnamese. The figure below shows the research team’s assessment of the firm. 281 Figure 3: Technological Profile of F2 Awareness 4 Exploiting external linkages and incentives Searching 3 2 Learning 1 Core technological competence 0 Implementing and absorbing technology Technology strategy Assessing and selecting technology Technology acquisition The localization ratio is still difficult to improve, due to the small production scale (over 1,000 vehicles per year per model). The company’s localization strategy is neither clear nor transparent. (3) F3 Having been manufacturing since the late 1970s and expanding under the name F3 in 2004, the company specialized in manufacturing all kinds of motorcycle spare parts and assembly parts for large corporations in Vietnam such as Piaggio, SYM, VAP (a Honda subsidiary in Vietnam), and Honda. From a small scale of production, F3 has invested sufficiently to grow and become a powerful company. In 2004, with the construction of new factories, F3 invested in new equipment with modern synchronous technology and increased its production capacity. Advanced and highly automated punching, welding, plating and processing machines meet strict assembly 282 requirements. Figure 4: Technological Profile of F3 Awareness 4 Exploiting external linkages and incentives Searching 3 2 1 Learning Core technological competence 0 Implementing and absorbing technology Technology strategy Assessing and selecting technology Technology acquisition The firm focuses on human resource development, to constantly develop and improve individual skills. Weekly training sessions at the factory help improve management capacity as well as specialized professional skills for engineers and workers. In the process of the formation and development of quality management systems, the company received support and assistance from many organizations, such as the Japan International Cooperation Agency (JICA), the Japan External Trade Organization (JETRO) and the Technical Assistance Center in Hanoi (TAC Hanoi). In 2009, the company became a partner of Toyota Vietnam and introduced a training course named “Monozukuri Show Case” to gradually produce automotive components for Toyota. In 2010, F3 also cooperated with CBI, a Dutch organization that promotes 283 exports from developing countries to the European Union. F3 has no difficulty in meeting the requirements of automobile assemblers, but the firm does not produce molds for automobile parts because of product scales and profit margins. Moreover, each foreign automobile assembler has a specific strategy on supply chains, which makes it very difficult for any newcomer Vietnamese firm. (4) F4 Founded in 1981 as a small mechanical workshop, F4 has become a strong company in producing motorcycle parts. Unlike other such producers, F4 provides not only products for motorcycle assemblers in Vietnam but it also sells replacement parts and components through agents across Vietnam. The company has spacious facilities, and modern staging with synchronous high automation machines. In 2007, the company upgraded its testing equipment with machinery imported from Germany and Japan. Besides upgrading machinery and technology, F4 focuses on strengthening quality control systems, and applying advanced management standards such as ISO and 5S. It also focuses on improving research and development (R&D) activities with the aim of providing high quality products and the best designs. 284 Figure 5: Technological Profile of F4 Awareness 4 Exploiting external linkages and incentives Searching 3 2 Learning 1 Building a core technological competence 0 Implementing and absorbing technology Technology strategy Assessing and selecting technology Technology acquisition The CEO has confidence in the company’s facilities and machinery and in upgrading technology. But as a private enterprise, finding the capital to reinvestment is a big problem; this influences upgrade strategy and technology supplies. (5) F5 F5 Industries Co., Ltd. is an export-processing enterprise with 100% Japanese capital, a 2nd-tier supplier of Toyota, specializing in manufacturing automotive components to F1 and India, which provide 20-25% of the total production of F1. Established in 2002, F5 invested US$15 million to produce mainly plastic injection molds and plastic parts. The company now has 70 injection molding machines. All equipment embraces modern production technology and meets the most advanced Japanese standards. Although located in an export processing zone where imported raw materials are easily available, the company is eager to develop domestic 285 suppliers to cut costs. However, it is difficult to find qualified suppliers. Although production is solely reliant on existing customer demand, the firm always has to manufacture at full capacity. However, under the father company, F5 has no plans to increase plant capacity or to expand into other areas such as motorcycle and electronic parts. However, the firm always focuses on upgrading production technology and management to produce the best products and to meet the requirements of customers in Vietnam and world-wide. Figure 6: Technological Profile of F5 Awareness 4 Exploiting external linkages and incentives Searching 3 2 Learning 1 Building a core technological competence 0 Implementing and absorbing technology Technology strategy Assessing and selecting technology Technology acquisition (6) F6 Starting from a small business manufacturing farm trucks at a rudimentary level, F6 is a private enterprise with 100% domestic capital specialized in assembling trucks. The company mainly produces cheap trucks suitable to the road conditions in Vietnam, 286 serving the rural market. With a focus on this market, F6 has gradually invested in machinery and equipment for the production of the components needed to increase the localization rate. Currently, the company produces cabins and frame bodies using electrolyte painting lines, assembly engine lines, assembly transmission lines, and other production facilities. The localization rate is up to 52%, one of the highest in the sector in Vietnam. However, machinery and equipment are still rudimentary with a low level of automation. The domestic molds industry is underdeveloped, yet the firm cannot afford to invest in expensive imported molds, thus its products are less attractive. Without a specific strategy to incrementally upgrade existing technology, the firm needs support from external institutions. Figure 6 is the technological profile of the firm, which is the lowest of the interviewed firms. Figure 7: Technological Profile of F6 Awareness 4 Exploiting external linkages and incentives Searching 3 2 Learning 1 Building a core technological competence 0 Implementing and absorbing technology Technology strategy Assessing and selecting technology Technology acquisition 287 (7) F7 F7 was established in 1997. In 2001, the first F7 automobile assembly plant was built in Bien Hoa 2 Industrial Zone, Dong Nai province with a main product line of KIA light trucks. In 2003, the company changed strategy and invested in factories specializing in trucks and passenger cars at the Chu Lai Open Economic Zone. In 2007, the company started producing the F7-KIA bus, the first of its kind in the country and its modern equipment and technology make it one of the best in the region. In 2008, F7 began building factories for parts and components for buses and cars in an effort to continuously raise its localization ratio. F7 is the only company in Vietnam producing three vehicle types: trucks, buses and passenger cars. Its production scale is 50,000 units per year. The firm deals with the problem of small market size by diversifying. F7 has four assembly plants, 8 workshops and a center for mechanical development. Its sales market share is the second-best in Vietnam, at about 23%. The firm has its own college in the central region to train engineers and workers. Based on the interview, F7’s technological capability is ranked in group C. As a partner of corporations such as Kia, Hyundai and Foton, its products must meet the standards of the group, so the company fully appreciates the importance of science and technology. The assembly plant, the manufacturing processes, the testing of components and the finished products always apply the most advanced technology. The company also uses strategic investments to expand and upgrade technological innovation. Along with its development strategy and the formation of the automotive mechanical industry Chu Lai-Truong Hai scheduled for completion in 2012, F7 aims for 40% local content by 2018. 288 Figure 8: Technological Profile of F7 Awareness 4 Exploiting external linkages and incentives Searching 3 2 Learning 1 Core technological competence 0 Implementing and absorbing technology Technology strategy Assessing and selecting technology Technology acquisition With a long-term development strategy and heavy investment, the CEO expressed concern about policy changes, especially the car import tax on CBUs. F7 strongly recommended an incentivized car strategy and preferential localization for the development of Vietnam's automobile industry. (8) F8 F8 is a joint venture between three major partners: Toyota Motor Corporation of Japan (70%), Vietnam Engine and Agricultural Machinery Corporation (20%) and Kuo Singapore Ltd (10%). As the first FDI automobile firm in Vietnam established in 1995, the company has shown strong growth and it has continuously cornered the largest market share in Vietnam. With an initial investment of over US$49 million, F8 undertook four main production stages - stamping, welding, painting and fitting. F8 also manufactures various components and spare parts at other plants, such as oil 289 pipes, exhaust pipes, car carpets, sun shields, body parts and stamping factory tires. Since 2008, F8 has used its chassis workshop to strengthen its localization rate (of the Innova brand) and improve competitiveness. Instead of importing all chassis, F8 imports small disassembled details (including chassis, vertical, horizontal bars and racks) then completes the chassis using modern automatic welding and powder-coating machines. With this new factory, F8 has improved the localization ratio of Innova from 33% to 37%. In our evaluation, F8’s technological capability is the highest and it plays an important role in the country’s industry. Nevertheless, F8 Vietnam depends much on the parent, such as for its strategy on localization and the selection of brand names. Thus, in our evaluation, the company is at the C level of technological capability, as in the figure below. Figure 9: Technological Profile of F8 Awareness 4 Exploiting external linkages and incentives Searching 3 2 Learning 1 Core technological competence 0 Implementing and absorbing technology Technology strategy Assessing and selecting technology Technology acquisition 290 In the spirit of Toyota, Kaizen (continuous improvement of processes in manufacturing) is instilled in all research and production, with much success, particularly in improving welding fitting systems to significantly reduce the number of fixtures, and to increase productivity and safety. F8’s adaptation and improvement in efficiency allowed it to satisfy Toyota globally. F8 has also attracted suppliers to produce in Vietnam and to provide for Toyota worldwide, such us Denso, Toyota Boshoko, Toyoda Gosei. Currently, these products are exported to 10 countries in the global IMV (Innovative International Multi-purpose Vehicle) project. In order to promote supporting industries, F8 established a center of localization in 2009 and an exhibition of automobile parts and components; this attracts domestic investors to invest in the manufacturing of automotive components. F8 also has programs to support small suppliers in production management, quality management, all in the spirit of Toyota, to enhance the ability of suppliers to provide components for F8. Table 1: Exported Parts and Components of F8 FIRMS Harada Industries Vietnam Yazaki Haiphong Vietnam Co., Ltd Toyota Boshoku Hanoi Toyota Boshoku Hai Phong Toyota Gosei Haiphong F1 Sumi-Hanel Wiring Systems Co., Ltd Source: F8. EXPORTED PRODUCTS Antennae Electric Wire Systems Seat Sets Airbags Airbags, Steering wheels Accelerator Pedal Modules, Exhaust Gases, Recirculation Valves, Duty Control Valves Electric Wire Systems 291 Table 2: List of 1st Tier Supplier of F8 NO FIRMS 1 F1 2 3 4 GS Battery Viet Nam Harada Industries Vietnam Sumi-Hanel Wiring Systems Co., Ltd 5 Toyota Boshoku Hanoi Co., Ltd 6 Summit Auto Seats Industry Co., Ltd 7 Nagata Vietnam Co., Ltd LOCATION PRODUCTS Sensor Assays/ Accelerator Pedals, Valve Assays/Vacuum Switching Binh Duong Batteries Dong Nai Antenna Hanoi Electric Wire System Seat Set, Board assays/Door trims, Vinh Phuc Carrier sub- assays /Spare wheels, Floor Carpets Hanoi Sun Visors Mudguard Ho Chi Minh Plastic parts Hanoi Vietnam Precision Industrial No.1 Co., Ltd 9 Yazaki Hai Phong Vietnam Co., Ltd 10 Inoac Vietnam Co., Ltd Export Mechanical Tool Join Stock 11 Company Source: F8. 8 Hanoi Hai Phong Hanoi Hanoi Press Parts Electric Wire Systems Dam/ Assays Tool Sets Market size is the largest obstacle for the development of F8 and also for its supplier network. To develop Vietnam’s automobile industry, F8 suggests the government should identify strategic vehicles and provide special incentives to increase market size and technology focus, and to attract investors. (9) F9 F9 is a 100% foreign capital, owned by Toyoda Gosei Japan, a brand of automobile components, and a major supplier of Toyota. The company has three factories for the production of car airbags and steering wheels. All of products are exported, mainly to Toyota’s assembly plants worldwide. Therefore, the production system uses modern machines and relies on quality inspection processes. As it falls under a large corporation, its investment and 292 technological strategy are always dependent on its parent company. However, its technological levels and production management processes are very high. Despite this, in comparison with domestic firms, its innovative activities are low. The figure below shows the firm’s technological profile in the evaluation of the research team. Raw materials for production are all imported. The firm would like to purchase them inside the country, but domestic enterprises cannot afford to invest sufficiently to meet quality requirements. The reason for the investment in Vietnam is a very skillful and hardworking work force, according to the CEO. Figure 10: Technological Profile of F9 Awareness 4 Exploiting external linkages and incentives Searching 3 2 Learning 1 Core technological competence 0 Implementing and absorbing technology Technology strategy Assessing and selecting technology Technology acquisition (10) F10 F10 is a state-owned enterprise specialized in the production of chains for bicycles and motorcycles. In 1998, along with the appearance of motorcycle assemblers in Vietnam, the firm began to diversify by manufacturing parts for motorcycles. 293 Nowadays, it has relatively modern and comprehensive machinery and testing equipment, with a full production range such as foundries, stamping, heat treatment, machining and plating. Almost all of the machines are imported from Japan and Taiwan. The company has successfully upgraded a number of old machinery. The figure below shows the technological capability of the firm. Its most important customer is Honda Vietnam. According to the management, Honda Vietnam has helped much in building production and in improving the quality management systems of the firm. In particular, with the assistance of Honda’s supplier support center, the firm imports raw materials at the best prices. In 2005, the company began manufacturing components for F2 Vietnam, but the volume remains low. Apart from technical difficulties, the low number of orders from assemblers raises product prices. This is the main reason the automotive components industry is still underdeveloped. For the firm, the activities of associations and research institutes in the country are not effective, doing little for its business. 294 Figure 11: Technological Profile of F10 Awareness 4 Exploiting external linkages and incentives Searching 3 2 Learning 1 Core technological competence 0 Implementing and absorbing technology Technology strategy Assessing and selecting technology Technology acquisition (11) F11 F11 was started by a former engineer at a state mechanical company. Using second-hand machines imported from Taiwan, F11 initially focused on producing mechanical parts with high market demand. The company has become one of the leading domestic automotive enterprises in Vietnam, with about 3,000 workers. Aimed at low-end cars and trucks in Vietnam, F11’s investment in technology was based on upgrading available equipment. This helps to reduce costs and to enhance the skills of engineers, workers as well as to strengthen their connections with the factory. Despite its lack of more modern machines, F11 is well-known in the industry as an innovator in technological upgrading. Appreciating the difficulties of local firms, the company has a program to support them to become suppliers of F11. However, the company doesn’t have a clear strategy on its technology capabilities. 295 Figure 12: Technological Profile of F11 Awareness 4 Exploiting external linkages and incentives Searching 3 2 Learning 1 Core technological competence 0 Implementing and absorbing technology Technology strategy Assessing and selecting technology Technology acquisition The situation of other private mechanical enterprises in Vietnam, such as Hoang Phat and Tan Hoa, is similar. These enterprises supply mechanical parts and components conforming to the standards of most Japanese and Taiwan motorbike assemblers, and they are now starting to supply simple mechanical parts and components to car assemblers such as F11 and F7. (12) F12 F12 is a typical example of a successful cooperation with a foreign assembler by upgrading technology and machines. Ten years ago, the company started to produce plastic components for Honda Vietnam. With the support and also as a requirement of the buyer, the company uses the JIT (Just in Time) and Kaizen methods in production management. F12 created a pattern department using professional software to support a computer numerical control (CNC) processing center and modern CNC machine. 296 Figure 13: Technological Profile of F12 Awareness 4 Exploiting external linkages and incentives Searching 3 2 Learning 1 Core technological competence 0 Implementing and absorbing technology Technology strategy Assessing and selecting technology Technology acquisition F12 continues to supply most Japanese motorbike brand names in Vietnam. It also supplies large-size plastic components that require a higher level of accuracy for washing machines and other ware in the home appliance industry. Most recently, with the investment in 1,500 ton plastic compressing machines, the company is focused on the production of large-size and higher-skill plastic components for Toyota Vietnam. 3.2. Findings 3.2.1. Overall Ranking Figure 14 presents the results of the individual firm audits and groups divided according to their technological capability. The majority of the 12 firms are type A and type B (passive learners), with 10 firms. There are only two assembly firms in type C, one of them local. This result seems consistent with the general situation of the manufacturing industry in Vietnam. 297 Figure 14: Overall Technological Capabilities 2 6 Type A Type B 4 Type C 3.2.2. Market Size, Technological Capability and Business Linkages There are clear differences between the assessments of three groups of enterprises, especially in technology strategy. Many firms could invest more in R&D activities (especially for assemblers), but they do not intend to. Due to low vehicle demand, investment in technology for localization is much more expensive than importing from neighboring countries. For December 2010, the total sales volume of the members of the Vietnam Automobile Manufacturers’ Association (VAMA) was 12,485 units, a decrease of 17% in comparison to December 2009. A summary of VAMA’s sales in December 2010 is in following table. 298 Table 3: VAMA Sales Volumes in December 2010 PCs Cross-overs MPVs SUVs Minibus, Buses Trucks, pick ups & Vans Grand total Bus chassis Source: VAMA 2011. North Central South Total 2,336 468 607 394 1,913 5,718 7 488 150 206 79 670 1,593 - 1,249 700 859 344 2,022 5,174 108 4,073 1,318 1,672 817 4,605 12,485 115 Assemblers have complained a lot about inconsistent policies for the automobile industry in Vietnam. The government needs to take drastic measures to promote industrial development by identifying strategic vehicles to increase consumption, or it needs to provide special tax regimes for domestic parts and components. Vietnam does not have tax incentives for manufacturing supporting industries. An example is Toyota’s “Innova.” In 2008, with a capacity of 1,300 cars/month, compared with Indonesia’s 5,000 cars/month, Toyota Vietnam could not invest in producing components, and it also faced difficulties in appealing to suppliers for investment. Compared to Toyota Indonesia, the cost difference is US$ 4,000 per car. This is because too few components are manufactured locally, thus logistics costs rise. In addition, the tax level in Vietnam is higher than in Indonesia. Many assemblers of automobile and home appliance products say they have no intention to find local suppliers or to produce in-house because import taxes on parts and components are too low; meanwhile, the government does not provide tax incentives for components produced domestically. 299 Figure 15: Production Cost of “Innova” Source: F8 Local assemblers F7 and F11 are becoming sufficiently localized to implement the commitments of the ASEAN Free Trade Area by 2018 (automotive localization of 40%) and to survive in the market. Most suppliers are very well aware of technological upgrading. However, profit margins and low production hinder their investment. This is also related to the size of the car market in Vietnam. FDI providers in Vietnam are less likely to be more active in technology innovation strategies. More or less, they remain too dependent on parent companies and previous contracts. Throughout interviews with assemblers, it can be seen that the concept of interfirm linkages in the automotive sector in Vietnam is premature. Tier 1 (F1) and tier 2 (F5) suppliers of Toyota are emerging. However, most of these enterprises are already linked. They invested in Vietnam to follow Toyota Vietnam. Business linkages 300 between firms in the industry are very weak in Vietnam due to imported components. It is very difficult for assemblers to choose suppliers inside the country. The interview survey indicates that firms are hampered by the weak management capabilities of suppliers in Vietnam to build long-term relationships (Table 4). In fact, the quality of products is not the biggest problem for local firms, since quality is mainly checked and ensured according to the buyers’ requirements before shipping. On-time delivery is one real issue that Vietnamese enterprises usually violate. This is for several reasons out of their control: unexpected delays in the delivery of material from suppliers, unstable conditions in which to operate machines, like unplanned electricity outrages, traffic jams and a poor transport infrastructure. Also, product quality varies between different production lots. Leaders of Vietnamese enterprises are assessed as people who are not customer-oriented and with poor skills in business communication. A lack of foreign language skills is also an impediment for businesspeople to assess a foreign customer’s needs. In general, domestic firms are not involved in this production network in the automobile industry. A few supply directly to assemblers, but only with bulky, simple and low value added parts and components. Unlike the motorcycles industry, technology transfer from FDIs to domestic firms is rarely done in the automobile industry. Most relationships between suppliers and assemblers have been forged from the outset. Vietnamese enterprises do not highly appreciate how to access potential suppliers and customers, such as through associations, fairs and promotional activities (Table 5). The linkages between firms seem highly spontaneous, without active and effective participation in supporting organizations. Despite linkages, the spirit of monopoly and self-contained production is still heavy in Vietnam. These Vietnamese 301 enterprises invest and manufacture by themselves, including the production of components, with the desire to avoid risk associated with a dependence on other institutions. This thought not only exists in business, but also in many state agencies. Table 4: Choosing Supplying Enterprises of Assemblers Factors Product quality Homogeneous quality of batches of goods Production capacity (size) Ability to self-design and innovate On-time delivery Reasonable costs Standards of managing production, environment Level of leaders Long-term cooperation relationship Source: IPSI 2009. Very important Important Not really necessary 82% 70% 45% 20% 92% 75% 37% 25% 20% 18% 30% 35% 20% 8% 25% 33% 55% 47% 20% 60% 30% 25% 33% Table 5: Business Linkages between Assemblers and Suppliers Manner Via internet, telephone, directories, by themselves Via enterprises associations Fairs, exhibitions, promotion trades Introductions of other companies Existed relationships Enterprises find themselves Source: IPSI 2009. The best effective Sometimes can find Rarely 14% 10% 10% 35% 86% 37% 35% 42% 40% 65% 14% 42% 51% 48% 50% 10% 0% 21% 3.2.3. Internal Factors for Technology Upgrading/Innovation The relatively successful enterprises in technological upgrading, such as F3, F7 and F11, agree that a basic level of technology and the skill level of workers are the important factors in any upgrading/innovation process. Only when production reaches basic standards and technical workers have the needed knowledge, will investment in 302 new equipment or new technology be effective. Most local firms say they have difficulty in accessing and applying new technology and purchasing modern equipment. In fact, the implementation of basic techniques and applied technologies in daily production activities is still not clearly satisfactory. For example, workers of a firm in the mechanical industry do not understand how to choose a suitable knife for a certain kind of metal, though the regulations are clear in the transformation of metals. Thus, human resources are highly appreciated. Most innovative ideas of firms start from the leadership’s strategy, but the implementation is at the level of middle management and workers. Thus, besides study, the enterprises also suggest adding “innovation active worker.” The most significant factor that helps a firm have innovative activities is the demand/requirements of the buyers. In the case of F3, F4 and F12, marketing campaigns over the past 10 years yielded many positive results. For example, F12, starting with Honda Vietnam, developed increasingly wide links with other motorcycle assemblers and also began to supply large-size or precision plastic parts for home appliances, such as washing machines and air-conditioners. Recently, it invested in a 1,500 ton injection machine to expand its automobile customer base even more. In the starting phase of an investment, licensing (with KIA-trucks, cars and buses) is the most important element for the development of technological capabilities, as in the case of F7, the most successful of the local firms in the industry. Other activities included setting up quality control systems, upgrading automation machines, setting out a roadmap for the localization ratio, the establishment of a training center and then the F7 college to supply engineers and workers. These active internal factors allow the company to be successful. Being in very starting stage, the inter-linkage between 303 internal factors exists already in the industry in the country. 3.2.4. External Factor for Technology Upgrading/Innovation With the exception of F11, the only local firm with a satisfactory linkage with Hanoi Technical University for upgrading existing machines, firms do not appreciate government support activities, especially for research and technology activities, from universities and institutes. There is a large distance from these technological support activities and the areas where local businesses need them. Meanwhile, the technical assistance activities of JICA and the Vietnam Chamber of Commerce and Industry (VCCI) are appreciated, especially training in management systems and quality standards. Some technology assisting programs seem to be relatively effective and highly appreciated by many Vietnamese enterprises, such as the support for quality management or control management (QM, QC, 5S) of TAC. However, only a few firms have participated in the programs. For foreign assemblers and suppliers, any linkage with a Vietnamese university is of little value. 4. Policy Implications (1) Enhancing the market size for the automotive industry Vietnam must start with the proper mindset toward the problems of the automotive industry. Currently, the interest, ownership and knowledge of industrial officials and private leaders with regards to automotive industries are very weak. MOIT should continue to strongly recommend policies to increase the market size and identify strategic vehicles in the automobile industry 304 (2) Production network in automotive industry Vietnam has received a large volume of manufacturing FDI which can serve as a base for further industrialization. It is most important to create the tiers for production networks in the automobile industry. But the country has not focused on FDI from multinational suppliers. While suppliers are usually small- and medium-sized enterprises that only need a small area for their workshop, central and local governments do not have any policies to attract investments for these entities. This is what the Association of Japanese SMEs has to face when it encourages its enterprises to invest in Vietnam. Small-sized foreign enterprises always face difficulties because the industrial zones of Vietnam only focus on big investors. Meanwhile, the production of supporting industries does not require large areas. In local clusters, firms face problems of infrastructure and long distances from customers who are usually assemblers in industrial zones near main roads, harbors and airports. Further, Vietnam has not even started to seriously build industrial linkages, and this strategy should not be abandoned without trying. The government needs a special program for business linkages in the automotive industry. Apart from a “Master plan of supporting industries in Vietnam until 2010, vision of 2020” approved in 2007, Vietnam has not had any laws directly related to supporting industries. And the master plan has made many points unsuitable for the facts on the ground and the new context of Vietnam. Among them, the definition of “supporting industry (SI)” as well as the identification of priorities for the development of supporting industries is inadequate. The definition is too broad, including most of the value chain (from materials to production processes and even marketing and services). Meanwhile, the manner in which SI is defined means it is only implemented inside each industry, as an internal 305 matter. For instance, the list of products of supporting industries in the electric and electronic industries does not even include plastic parts and components. MOIT is drafting a decree on developing supporting industries which basically responds to the master plan. Thus, it is necessary to adjust the contents of this before new legal documents are issued. Polices to promote supporting industries are fairly common across countries. They include strategic definitions, a strong legal base, master plans and action plans, high-quality university education, technical training for engineers and workers, management consultation, incentives, proper tax and tariff structures, finance, matching and linkages, full use of business associations, publicprivate partnership, international and regional cooperation, and constant organizational reform to revitalize and coordinate various policy elements. The industrial policies of Malaysia and Thailand cover all of these items, although each has its own way and emphasis. 306 REFFERENCES Hobday, Mike (2004) Firm-level Innovation Readiness – An Audit Tool. Industry Policy and Strategy Institute (2009) “Impact of MNCs on Development of Local Small and Medium Size Industrial Enterprises in Vietnam,” MOIT Research Project. Institute for Development of Vietnam Economy (2010) “Vietnam Industry in Regional Production Network: Position and Policy Recommendations,” Research Project. Jianmin Jin (2007) “Success Cases of Japanese Companies’ Outsourcing in Vietnam,” Economic Topics, October 1, Tokyo: Fujitsu Research Institute.http://jp.fujitsu.com/group/fri/en/column/economic-topics/2007/200710-01-1.html (accessed October 1, 2007) Ohno, Kenichi, ed. (2006) Industrial Policy Formulation in Thailand, Malaysia and Japan: Lessons for Vietnamese Policy Makers, Vietnam Development Forum, Hanoi: Publishing House of Social Labor. Ohno, Kenichi (2009) “Avoiding the Middle-Income Trap: Renovating Industrial Policy Formulation in Vietnam,” ASEAN Economic Bulletin, 26(1): 25-43. 307 CHAPTER 7 Empirical Study of the Formation of Internal Innovation Capability and External Linkages in ASEAN Economies MASATSUGU TSUJI KAZUNORI MINETAKI YUJI AKEMATSU* Graduate School of Applied Informatics, University of Hyogo This paper analyzes how firms in ASEAN countries obtain and accumulate information on technology, know-how, and the market and then assimilate it into their internal capability to promote innovation. In so doing, an index is constructed from various factors related to creating innovation by using AHP (Analytical Hierarchical Process). This index is a proxy of the internal innovation capability of firms. Using this index, how product and process innovation are related to internal capability. Another estimation objective in this paper is to handle the endogeneity problem of variables. This methodological problem is related to reverse correlation between innovation and the internal capability, and we have to prove that the relationship between those variables is causation rather than simple correlation. Coping with these theoretical problems, the treatment model and other methods are utilized to solve the above-mentioned two problems. In addition, this study also uses the propensity score matching (PSM) method to handle so-called “sample selection bias.” As a result, we prove the following hypotheses: (1) Internal capability promotes innovation significantly; (2) External linkages, particularly MNC/JC, have an influence on enhancing internal capability; (3) Internal capability affects external linkages, that is, firms with the higher internal capability index tend to have more external linkages; and (4) External linkages have a less significant effect on innovation, as they enhance internal capability and then promote innovation indirectly. Finally, strategic policy measures to promote innovation in ASEAN countries are provided based on these analyses * Graduate School of Applied Informatics, University of Hyogo, Japan. 309 1. Introduction Industrial agglomeration in East Asia has been continuing even after the Lehmann shock, and the economic recovery from the shock in this area has contributed much to that of the global economy. This proves that “decoupling” is plausible. Further agglomeration has been transforming the area from a simple production base to knowledge-based economies. This paper attempts to analyze how firms in this area obtain and accumulate information on technology, know-how, and the market and then assimilate it into their internal capability to create their own products and services, technologies and ideas. In particular, this paper focuses on firms’ capability to create innovation, which can be termed as internal innovation capability. There are many sources for promoting this capability, including technological ability, managerial organization to enhance the flow of information and ideas related to innovation, orientation of top management to create innovation, human resources such as top management, engineers, and workers at the job shop. Moreover, firms in East Asia have been absorbing the necessary technology and information from outside firms, including MNCs, universities, regional research institutions, and business organizations. These external sources are referred to as linkages. Thus, this paper analyzes how these two sources contribute to firms’ innovations, whether these are substitutive or complementary, and in the case of the latter we have to verify how internal capability is affected by linkages. The concept of internal innovation capability contains many factors, including the level of technology, ability and skills of engineers, managerial ability of top management. Accordingly, it is difficult to identify which factors really contribute to 310 the realization of innovation. In coping with this, the paper attempts to define an index which is a proxy of the internal innovation capability of firms. In other words, this paper aims to construct an index from various factors related to creating innovation. In so doing, a rigorous analytical method named AHP (Analytical Hierarchical Process) is applied to construct the index. Then, using this index, we estimate how product and process innovation are related to internal capability. Another estimation objective of this paper is to solve the endogeneity problem of variables. Economic variables used in empirical studies are more or less endogenous variables whose values are determined inside the model. Without a proper estimation method, estimated coefficients tend to have biases. In addition, we also examine a second important methodological problem related to reverse correlation between innovation and the internal innovation capability index or other variables. We have to prove that the relationship between those variables is causation rather than simple correlation. Coping with these theoretical problems, the treatment model and other methods are utilized to solve the above-mentioned two problems. In addition to the endogeneity problem, this study uses the propensity score matching (PSM) method to handle so-called “sample selection bias,” because only firms with a higher internal capability index might be selected through the survey, or firms could respond arbitrarily and the resulting data from the survey might not be reliable. The PSM method is proposed by Rosenbaum and Rubin (1983), (1985), and developed by Heckman, et al. (1997), (1998b) and Heckman et al. (1998a). This method enables estimation with less sample selection bias. The structure of the paper is as follows. After the introduction, we present the construction of an index of internal innovation capability in Section 2. 311 The methodology of analysis is provided in Section 3, and the results of the estimations are presented in Section 4. Brief conclusions as well as policy recommendations are shown in Section 5. 2. Index of internal innovation capability Firstly, the definition of internal innovation capability of firms and the construction of an index are presented. 2.1. Definition of Internal Innovation Capability In the previous ERIA papers (Tsuji and Miyahara, 2010a, 2010b), we mainly focused on the linkage of firms from which new information related to technology, products and the market is obtained. In this paper, on the other hand, we attempt to identify the capability of firms to create innovation according to questions in the questionnaire. We postulate the following three factors which contribute to innovation: (i) technology; (ii) managerial organization; and (iii) human resources. (i) The technological factor is clearly the basis of innovation. These three constitute the “first layer” and are referred to as first layer factors. Moreover, each of these factors consists of its own detailed sub-factors, which form the “second layer.” These sub-factors are called the second layer factors. Let us take the example of (i) the technological factor, which includes the following three second layer factors: (a) ratio of R&D expenditure to sales at present asked as Q11.1.; (b) owning an intellectual property right (Q14.1.); and (c) technical and management systems (Q15). (ii) Managerial organization 312 indicates whether the managerial organization is designed and functioning to encourage exchange and share information among employees. This first layer factor consists of the following three second layer factors: (d) practicing QC circle (Q16.1); (e) cross-functional team (Q17); and (f) sharing information (Q19). Finally, the first layer factor of human resources is an important factor for engaging in innovation activities as well as for design and managing R&D, which consist of the following three second layer factors: (g) degrees of top management; (h) attitudes toward communication of top management (Q21); and (i) degrees of employees (Q22). Table 1 shows the tree structure of the index and related questions in the questionnaire. Table 1: Construction of Internal Innovation Capability Q11.1. The ratio between R&D expenditure and sales at present Technological factor Q14.1. Own an intellectual property right Q15. Technical and management systems Q16.1. Practicing QC circle Innovation Capability Index Managerial organization Q17. Cross-functional team Q19. Sharing information Q20.1. Degree of top management Human resources 313 Q21. Attitudes toward communication of top management (CEO) Q22. Degree of employees 2.2. AHP Approach This paper utilizes AHP to construct the index. The process, which was initiated by Saaty (1980), (1986), attempts to give people’s decision-making a numerical value. For example, when making a purchase, on what basis does a consumer decide? AHP formulates the mechanism of such decision-making. It allows us to give a numerical value to vague parts of people’s decision-making, with possible application to a wide array of fields. An individual makes a decision based on his/her own criteria. Normally, not one but several evaluation criteria exist, and these often conflict with each other. In a consumer’s decision-making process, the “problem” of what to choose comes first, followed by several “alternatives.” AHP attempts to comprehend the process of the decision-making, assuming that there are some criteria relating the specific problem and the alternatives. Thus, AHP’s approach is to construct an individual’s decision-making according to the hierarchic structure. In order to apply our AHP analysis, we need pair-wise comparisons of all the factors in each layer. That is, taking the value of one factor as one, the value of another factor is measured. To be concrete, scholars or specialists in this filed were asked to choose a number from 1/9, 2/9 …, 8/9, 1, 2, 3 …, 9. If they choose 1, equal importance is placed on two factors. 1/9 (9) implies that its factor is the least (most) important compared to another. Each answer of the pair-wise comparison is termed a “score,” which is the basis of weights of factors. The obtained weights of factors of the first and second layers are shown in Table 2. 2.3. Distribution of Capability Index Based on the weights of factors by AHP, the distribution of the internal innovation capability index of the five regions of Indonesia, Thailand, the Philippines, the Ho Chi 314 Minh City area, and the Hanoi area are shown in Figure 1. The average value of the index of the five areas is 0.449 and the averages of Indonesia, Thailand, the Philippines, the Ho Chi Minh City area, and the Hanoi area are 0.479, 0.479, 0.384, 0.498, and 0.485, respectively. As for the average value of each, the Ho Chi Minh City area has the largest value, while that of the Philippines is lower than the average. The shapes of distribution of the five areas are also different from the five areas’ average. Ho Chi Minh City and Hanoi have more concentrate around their averages, while Indonesia and Thailand are flatter than the five areas’ average. We will examine what makes these differences among five areas. Table 2: Weights of Factors by AHP Technical factor Managerial organization Human resources 0.529084637 0.253556004 0.217359359 R&D investment 0.550325432 Owing property right 0.293328156 Technical and management systems 0.156346412 Practicing QC Cross-function team Sharing of information 0.29619297 0.351660652 0.352146378 Career of COE 0.213007622 Managerial attitude of CEO 0.562255373 Career of employee 0.224737005 315 Figure 1: Distribution of Capability Index 0 .2 .4 .6 Capability Index ALL PHILIPPINES HANOI 3. .8 1 INDONESIA THAILAND HO CHI MINH Methodology of Analysis Here a rigorous econometric methodology and main hypotheses are explained, in addition to data for estimation. 3.1. General Procedure of Analysis This study postulates that innovation is enhanced by two main forces inside and outside firms, namely “internal innovation capability” or simply “internal capability” and “external linkages.” The former consists of factors prompting innovation by internal forces which were already explained in the previous sections, while the latter represents sources of necessary information for innovation, including information of technology, know-how, the market, consumers, and so on. Those are obtained through networks of customers, suppliers, competitors, universities, local R&D institutions, and so on. 316 Internal capability and external linkages surely affect the innovation of firms, but these mechanisms must be proved by empirical studies. We term this procedure Step 1, namely: Step 1: internal capability enhances product and process innovation (C to I). The next procedure is to examine the relationship between internal capability and external linkages, namely, external linkages enhance firms’ internal capability by obtaining new information. On the other hand, the higher internal capability firms achieve, the more other firms approach to start transactions with them. Higher internal capability is a signal of higher technology or a reliable partner of transactions and R&D activities. Thus, we examine whether internal capability promotes more connection with external linkages or external linkages enhance internal capability. Accordingly, there are two steps, namely: Step 2: external linkages affect internal capability (E to C), Step 3: internal capability affects external linkages (C to E). Since C to I is already examined in Step 1, the remaining external capability is analyzed as to whether it affects the promoting of innovation. Therefore, we have the following: Step 4: external linkages affects innovation (E to I). In what follows, we analyze these four hypotheses one by one. It should be noted that estimation methods which handle the endogeneity problem are fully applied. 3.2. Situation of Innovation in Different Countries This paper is based on a survey conducted in November 2010. The questionnaire was sent to firms in Indonesia, Thailand, the Philippines, and the Hanoi area and the 317 Ho Chi Minh City area in Vietnam. Let us briefly examine the current situation of innovation in these countries and areas. Figures 2, 3, and 4 show the number of firms which achieved five different product innovations and process innovations, namely: Figure 2 is product innovation defined by the change in packages and Figure 3 is the number of developments of a totally new product based on new technologies. Process innovation is shown in Figure 4. These figures show that many firms achieved a simple type of product innovation, while more difficult innovations such as a new product based on new technology was achieved by fewer firms, less than one-third of firms in fact. According to Figure 4, the process innovation of “Reduced delivery delay” was achieved by most of the countries and areas, while “Reduced variation in product quality” was achieved by fewer firms. 318 Figure 2: Product Innovation (Change in Packaging) 50 45 40 35 30 Not tried yet Tried Achieved 25 20 15 10 5 0 Hanoi Ho Chi Minh Indonesia Philippines Thailand Figure 3: Product Innovation (New Product based on New Technologies) 70 60 50 40 Not tried yet Tried Achieved 30 20 10 0 Hanoi Ho Chi Minh Indonesia Philippines 319 Thailand Figure 4: Process Innovations 100 80 60 Reduced delivery delay Reduced variation in product quality 40 20 0 Hanoi 4. Ho Chi Minh Indonesia Philippines Thailand Results of Estimations Here we present the results of a series of estimations which examine the relationship between internal capability and external linkages and their effect on innovation. 4.1. Effect of Internal Capability on Innovation In the estimation, the numbers of product innovations and process innovations are taken as the dependent variables. As for product innovation, the following questions are taken as dependent variables, namely: Q12.1.1. Significant change in packaging or appearance design, Q12.1.2. Significant improvement of an existing product, Q12.1.3. Development of a totally new product based on the existing technologies for your establishment, 320 Q12.1.4. Development of a totally new product based on new technologies for your establishment, Q12.6. Has the number of your product types increased between 2009 and 2010? As for process innovation, this paper has a different approach from the usual Schumpeterian definition which includes the creation of a new production method, obtaining new markets, and new organization. These definitions are quite heterogeneous and make analysis more complicated. This paper utilizes the following two questions as proxy of process innovation. Answers to these two questions can be interpreted as the performance achieved by process innovation, namely: Q13.6. Reduced delivery delay, Q13.18. Reduced variation in product quality. These two are also taken as dependent variables for estimation of product innovation. As for explanatory variables, the innovation capability index, which was explained in the previous section, the industry and country dummy, and the size of firms are selected. The summary statistics is shown in Table 3. 321 Table 3: Summary Statistics Variables Change in packaging Improvement of an existing product New product based on the existing technologies New product based on new technologies Number of product increased Reduced delivery delay Reduced variation in product quality Capability Index Capability Index (Technology) Capability Index (Organization) Capability Index (Human) The year begin operating in the region Spin-off from multinational firm The ratio between R&D expenditure and sales Adopted just-in-time delivery QC circle - Research QC circle - Development QC circle - Engineering QC circle - Production QC circle - Quality Control QC circle - Procurement QC circle - Accounting QC circle - Human Resources QC circle - Sales & Marketing QC circle - Others QC circle within a department across your establishment Introduction of a new product - No effors for it Introduction of a new product - No team Introduction of a new product - Market Research Introduction of a new product - Research Introduction of a new product - Development Introduction of a new product - Production Engineering Introduction of a new product - Manufacturing Introduction of a new product - Quality Control Introduction of a new product - Procurement Introduction of a new product - Accounting Introduction of a new product - Human Resources Introduction of a new product - Sales & Marketing Introduction of a new product - Logistics/Distribution Introduction of a new product - IT System Quality Control - No effors for it Quality Control - No team Quality Control - Market Research Quality Control - Research Quality Control - Development Quality Control - Production Engineering Quality Control - Manufacturing Quality Control - Quality Control Quality Control - Procurement Quality Control - Accounting Quality Control - Human Resources Quality Control - Sales & Marketing Quality Control - Logistics/Distribution Quality Control - IT System IT system for Information Sharing - Market Research IT system for Information Sharing - Basic Research IT system for Information Sharing - Development IT system for Information Sharing - Procurement Obs. 781 787 787 782 790 788 784 738 772 794 757 764 777 772 786 794 794 794 794 794 794 794 794 794 794 771 794 794 794 794 794 794 794 794 794 794 794 794 794 794 794 794 794 794 794 794 794 794 794 794 794 794 794 794 794 794 794 794 322 Mean 1.10 1.45 1.21 0.89 1.49 1.13 1.41 0.47 0.41 0.41 0.65 1992.1 1.81 0.84 1.42 0.20 0.28 0.44 0.78 0.64 0.37 0.22 0.26 0.33 0.08 1.29 0.22 0.12 0.20 0.20 0.24 0.27 0.31 0.43 0.12 0.12 0.11 0.29 0.13 0.06 0.16 0.11 0.10 0.16 0.27 0.27 0.33 0.48 0.11 0.06 0.08 0.19 0.10 0.12 0.40 0.28 0.30 0.36 S. D. 0.84 0.71 0.77 0.77 0.66 0.33 0.49 0.18 0.25 0.22 0.20 66.49 0.40 1.08 0.49 0.40 0.45 0.50 0.41 0.48 0.48 0.41 0.44 0.47 0.28 0.45 0.41 0.33 0.40 0.40 0.43 0.83 0.46 0.50 0.32 0.33 0.32 0.46 0.34 0.23 0.37 0.32 0.31 0.37 0.44 0.45 0.47 0.50 0.31 0.24 0.27 0.39 0.30 0.32 0.49 0.45 0.46 0.48 Min 0 0 0 0 0 1 1 0.04 0 0 0.04 190 1 0 1 0 0 0 0 0 0 0 0 0 0 1 0 0 0 0 0 0 0 0 0 0 0 0 0 0 0 0 0 0 0 0 0 0 0 0 0 0 0 0 0 0 0 0 Max 2 2 2 2 2 2 2 0.98 1 0.97 1 2010 3 3 2 1 1 1 1 1 1 1 1 1 1 2 1 1 1 1 1 8 1 1 1 1 1 1 1 1 1 1 1 1 1 1 1 1 1 1 1 1 1 1 1 1 1 1 Table 3 (Continued) Variables IT system for Information Sharing - Production Management IT system for Information Sharing - Production Engineering IT system for Information Sharing - Quality Assurance IT system for Information Sharing - Sales and Marketing IT system for Information Sharing - After-sales Services IT system for Information Sharing - Accounting IT system for Information Sharing - Human Resources share information - Success of your establishment share information - Failure of your establishment share information - Success of other firms share information - Failure of other firms Top management has a bachelor (BA), master or Ph.D. degree Top management is/was an engineer Top management has an experience working for a MNC/JV Major function in the MNC/JV -Planning Major function in the MNC/JV -Other administration Major function in the MNC/JV -Engineering work Major function in the MNC/JV -Procurement Personal connections with people from industry Personal connections with people from politics or government Personal connections with people from academia Top management directs employee Top management strives to listen to his/her employees Top management emphasizes decision-making speed Top management is well-versed in the market of products Top management delegates authorities to job sites/actual places Top management often goes to job sites/actual places Blue-collar workers high school graduates or higher Engineers technical college graduates or higher Training program for employees Engineers quit last year - Middle-class Engineers Engineers quit last year - Senior-class Engineers Engineers quit last year - Manager External source - Final Consumer External source - Competitor External source - Buyer or trading company External source - Consultant External source - Local customer (100% local capital) External source - Local supplier External source - MNC/JV customer located in Country External source - MNC/JV supplier located in Country External source - MNC/JV customer located in a foreign country External source - MNC/JV supplier located in a foreign country External source - Public organization External source - Local business organization External source - University or Public Research Institute Capital structure of customer - 100% locally owned Capital structure of customer - 100% foreign owned Capital structure of supplier - 100% locally owned Capital structure of supplier - 100% foreign owned Duration of the relationship with the customer Duration of the relationship with the supplier Employment size of the customer Employment size of the supplier Distance from your establishment to the customer Distance from your establishment to the supplier 323 Obs. 794 794 794 794 794 794 794 794 794 794 794 789 780 761 377 377 377 377 789 788 787 788 789 787 788 788 791 790 788 764 779 779 782 784 787 782 785 785 782 778 779 777 776 785 784 785 763 763 749 749 782 778 734 731 773 769 Mean 0.40 0.34 0.23 0.51 0.20 0.27 0.43 0.68 0.23 0.26 0.18 1.22 1.39 1.60 0.35 0.44 0.24 0.10 3.36 2.55 2.53 3.46 3.40 3.59 3.44 2.86 2.95 3.69 3.12 1.23 1.73 1.42 1.53 3.50 3.26 3.22 2.69 3.06 3.04 2.44 2.36 2.35 2.21 2.21 2.36 1.86 0.54 0.29 0.50 0.26 5.39 5.42 2.65 2.43 5.43 6.03 S. D. 0.49 0.47 0.42 0.50 0.40 0.44 0.49 0.47 0.42 0.44 0.38 0.64 0.49 0.49 0.50 0.50 0.43 0.30 0.85 1.00 0.96 0.75 0.72 0.60 0.81 1.09 1.00 1.27 1.82 0.42 1.06 0.79 0.91 0.84 0.90 1.01 1.15 1.17 1.01 1.44 1.42 1.44 1.40 1.43 1.34 1.36 0.50 0.45 0.50 0.44 1.60 1.52 1.40 1.30 3.35 3.30 Min Max 0 0 0 0 0 0 0 0 0 0 0 0 0 1 0 0 0 0 1 1 1 1 1 1 1 1 1 0 0 1 1 1 1 0 0 0 0 0 0 0 0 0 0 0 0 0 0 0 0 0 1 1 1 1 1 1 1 1 1 1 1 1 1 1 1 1 1 3 2 2 3 1 1 1 4 4 4 4 4 4 4 4 4 5 5 2 5 5 5 4 4 4 4 4 4 4 4 4 4 4 4 4 1 1 1 1 7 7 5 5 11 11 Table 4 shows the results of estimations of how internal capability affects innovation (product and process innovation) using a treatment-effects model. Since internal capability consists of many factors, it is considered as an endogenous variable. The treatment-effects model controls such endogeneity by some exogenous variables (country, size of establishment, and industries in this model), and calculates unbiased estimators. The result shows that internal capability is positively significant to both product and process innovation. In estimation, the significant variables are as follows: Ho Chi Minh (p<0.05); Philippines (p<0.05-p<0.10); Textiles (p<0.10, but not significant in Case 5); Plastic, rubber products (p<0.05); Iron, steel (p<0.10, but not significant in Cases 1, 5); Machinery, equipment, tools (p<0.05-p<0.10); Other electronics & components (p<0.05-p<0.10); Precision instruments (p<0.10, but not significant in Case 5); and Other transportation equipment and parts (p<0.01). A coefficient of the controlled capability index is statistically significant to both product (Cases 1 to 5) and process innovation (Cases 6 and 7), positively, at the 1% significance level. 324 Non-ferrous metals Iron, steel Other non-metallic mineral products Plastic, rubber products Chemicals, chemical products Coal, petroleum products Paper, paper products, printing Wood, wood products Apparel, leather Textiles Food, beverages, tobacco Thailand (dummy) Philippines (dummy) Indonesia (dummy) Capability Index Ho Chi Minh (dummy) Constant Capability Index 0.379 (0.175) -0.191 (0.179) -0.404 (0.150) -0.078 (0.198) -0.280 (0.201) -0.477 (0.265) -0.211 (0.271) -0.452 (0.541) -0.443 (0.311) -0.495 (0.675) 0.245 (0.294) -0.465 (0.201) -0.351 (0.329) -0.441 (0.287) -5.110 (173.7) ** * *** ** Case 1 0.922 *** (0.193) 0.625 *** (0.103) 0.403 (0.174) -0.157 (0.178) -0.386 (0.149) -0.040 (0.197) -0.276 (0.201) -0.445 (0.262) -0.203 (0.270) -0.460 (0.540) -0.440 (0.310) -0.495 (0.673) 0.248 (0.294) -0.463 (0.201) -0.341 (0.328) -0.487 (0.281) -5.092 (173.7) * ** * ** ** Case 2 1.470 *** (0.196) 0.720 *** (0.105) 325 0.387 (0.174) -0.179 (0.179) -0.394 (0.149) -0.039 (0.198) -0.291 (0.201) -0.458 (0.262) -0.217 (0.271) -0.464 (0.541) -0.453 (0.310) -0.520 (0.676) 0.239 (0.294) -0.456 (0.202) -0.356 (0.329) -0.500 (0.281) -5.106 (173.7) * ** * *** ** Case 3 0.870 *** (0.170) 0.770 *** (0.092) Table 4: Innovation and Capability Index (Treatment-Effects Model) 0.405 (0.175) -0.163 (0.179) -0.382 (0.150) -0.029 (0.199) -0.298 (0.201) -0.470 (0.262) -0.228 (0.271) -0.475 (0.541) -0.460 (0.311) -0.529 (0.675) 0.231 (0.295) -0.469 (0.203) -0.364 (0.329) -0.511 (0.282) -5.105 (173.7) * ** * ** ** Case 4 0.925 *** (0.171) 0.416 *** (0.092) 0.356 (0.175) -0.194 (0.178) -0.427 (0.150) -0.102 (0.195) -0.244 (0.201) -0.403 (0.262) -0.168 (0.270) -0.418 (0.540) -0.413 (0.311) -0.448 (0.673) 0.274 (0.294) -0.429 (0.201) -0.312 (0.329) -0.459 (0.281) -4.918 (116.0) ** *** ** Case 5 0.553 *** (0.156) 1.182 *** (0.084) 0.402 (0.174) -0.161 (0.178) -0.387 (0.149) -0.057 (0.197) -0.278 (0.201) -0.447 (0.262) -0.210 (0.270) -0.460 (0.540) -0.442 (0.310) -0.492 (0.674) 0.245 (0.294) -0.468 (0.201) -0.348 (0.328) -0.494 (0.281) -5.098 (173.7) * ** * *** ** Case 6 0.284 *** (0.079) -1.271 *** (0.042) 0.396 (0.174) -0.166 (0.178) -0.381 (0.149) -0.069 (0.198) -0.282 (0.201) -0.446 (0.262) -0.174 (0.273) -0.742 (0.629) -0.444 (0.310) -0.490 (0.674) 0.242 (0.294) -0.471 (0.201) -0.356 (0.328) -0.499 (0.281) -5.101 (173.7) * ** * ** ** Case 7 0.516 *** (0.110) -1.635 *** (0.059) Case 1 -0.291 (0.192) -0.415 ** (0.205) 0.125 (0.483) -0.365 * (0.193) -0.613 * (0.368) -0.037 (0.255) -1.034 *** (0.332) 701 22.86 0.000 Case 2 -0.292 (0.191) -0.414 ** (0.205) 0.137 (0.483) -0.361 * (0.192) -0.616 * (0.367) -0.033 (0.255) -1.028 *** (0.331) 705 56.27 0.000 Case 3 -0.297 (0.192) -0.420 ** (0.205) 0.124 (0.483) -0.370 * (0.193) -0.618 * (0.367) -0.047 (0.255) -1.040 *** (0.332) 703 26.04 0.000 326 Note 1: Standard errors are in parentheses. Note 2: ***, ** and * indicate significance at the 1%, 5% and 10% level, respectively. Note 3: Dependent variables; Case 1: Change in packaging Case 2: Improvement of an existing product Case 3: New product based on the existing technologies Case 4: New product based on new technologies Case 5: Number of product increased Case 6: Reduced delivery delay Case 7: Reduced variation in product quality. Number of obs. Wald chi2(1) Prob > chi2 Other transportation equipments and parts Automobile, auto parts Precision instruments Other electronics & components Computers & computer parts Machinery, equipment, tools Metal products Table 4 (Continued) Case 4 -0.310 (0.192) -0.457 ** (0.208) 0.113 (0.483) -0.383 ** (0.193) -0.632 * (0.368) -0.055 (0.255) -1.053 *** (0.332) 702 29.34 0.000 Case 5 -0.260 (0.192) -0.382 * (0.205) 0.427 (0.564) -0.326 * (0.193) -0.582 (0.367) 0.051 (0.260) -0.992 *** (0.331) 706 12.55 0.000 Case 6 -0.297 (0.191) -0.419 ** (0.205) 0.129 (0.483) -0.377 * (0.193) -0.621 * (0.367) -0.035 (0.255) -1.034 *** (0.331) 705 12.94 0.000 Case 7 -0.301 (0.191) -0.421 ** (0.205) 0.126 (0.483) -0.371 * (0.192) -0.622 * (0.367) -0.040 (0.255) -1.037 *** (0.332) 704 22.04 0.000 4.2. Effect of First Layer Factors on Innovation Since internal capability consists of three first layer factors such as the technological factor, managerial organization, and human resources, we estimate how the three factors also influence individually two categories of innovation. The treatment-effects model is also adopted in this estimation. Tables 5, 6, and 7 show the results of estimations. According to Table 5 which shows technology, Ho Chi Minh (p<0.01), Indonesia (p<0.05), Philippines (p<0.01-p<0.05), and Chemicals, chemical products (p<0.10) are significant for the index of the technological factor in the treatment equation. The capability index of technology is statistically significant to product innovation (p<0.01), although it does not have a strong effect on process innovation. The capability index shows a positive coefficient for Case 6, “Reduced delivery delay (p<0.05),” but a negative coefficient for Case 7, “Reduced variation in product quality (p<0.01).” In Table 6, which explains the managerial organization, Ho Chi Minh (p<0.01); Food, beverages, tobacco (p<0.01); Textiles (p<0.05-p<0.10); Apparel, leather (p<0.05-p<0.10); Wood, wood products (p<0.05-p,0.10); Paper, paper products, printing (p<0.01-p<0.05); Iron, steel (p<0.05-p<0.10); and Metal products (p<0.05) have a significant coefficient to the capability index of organization. On the other hand, the organization factor is significant to process innovation (p<0.01), but it is not strongly significant to product innovation in contrast with the results of the technological factor. Finally, Table 7 represents the results of the human factor, in which Indonesia (p<0.05), Philippines (p<0.05), Thailand (p<0.01), Food, beverages, tobacco (p<0.05-p<0.10), Chemicals, chemical products (p<0.10), Iron, steel (p<0.10, only Case 1), Computers & computer parts (p<0.10, not significant in Case 5), and Automobile, auto parts (p<0.10, not significant in Case 5) are significant for the 327 capability index of human resources. The coefficient of the index is positively significant to both product and process innovation (p<0.01 for Cases 1, 2, 3, and 4, and p<0.05 for Cases 5 and 6). Based on the results, we can summarize that the technological factor is statistically significant to product innovation, while the organization factor is significant to process innovation. The human factor is significant to both product and process innovation. Since the technological factor does not satisfy Case 7 (Table 5), we conclude that this is not significant to product innovation. In Table 6, managerial organization does not satisfy Case 5, and we also conclude that this is not significant to process innovation. Table 8 provides the summary of these results. The results seem to coincide with the realty. 328 Non-ferrous metals Iron, steel Other non-metallic mineral products Plastic, rubber products Chemicals, chemical products Coal, petroleum products Paper, paper products, printing Wood, wood products Apparel, leather Textiles Food, beverages, tobacco Thailand (dummy) Philippines (dummy) Indonesia (dummy) Capability Index (Technology) Ho Chi Minh (dummy) Constant Capability Index (Technology) -0.571 (0.171) -0.399 (0.177) -0.654 (0.148) -0.044 (0.180) -0.083 (0.193) -0.149 (0.256) 0.019 (0.264) -0.250 (0.548) 0.082 (0.296) -0.472 (0.681) 0.519 (0.293) -0.035 (0.193) 0.243 (0.321) -0.196 (0.267) -5.111 (173.7) * *** ** *** Case 1 0.839 *** (0.195) 0.693 *** (0.097) -0.539 (0.170) -0.360 (0.176) -0.638 (0.147) 0.009 (0.179) -0.082 (0.193) -0.134 (0.254) 0.058 (0.261) -0.256 (0.548) 0.077 (0.295) -0.480 (0.679) 0.523 (0.292) -0.033 (0.193) 0.255 (0.320) -0.246 (0.262) -5.091 (173.7) * *** ** *** Case 2 0.729 *** (0.165) 1.116 *** (0.083) 329 -0.562 (0.170) -0.388 (0.176) -0.649 (0.147) 0.027 (0.179) -0.098 (0.193) -0.147 (0.255) 0.049 (0.261) -0.260 (0.549) 0.062 (0.295) -0.514 (0.682) 0.514 (0.293) -0.015 (0.194) 0.246 (0.321) -0.254 (0.263) -5.104 (173.7) * *** ** *** Case 3 0.856 *** (0.171) 0.802 *** (0.086) -0.546 (0.171) -0.373 (0.177) -0.633 (0.148) 0.001 (0.181) -0.100 (0.193) -0.150 (0.254) 0.006 (0.264) -0.271 (0.548) 0.063 (0.295) -0.501 (0.681) 0.506 (0.293) -0.030 (0.194) 0.232 (0.320) -0.266 (0.263) -5.105 (173.7) * *** ** *** Case 4 1.011 *** (0.177) 0.400 *** (0.089) Table 5: Innovation and Capability Index (Technology, Treatment-Effects Model) -0.567 (0.170) -0.380 (0.176) -0.654 (0.147) -0.023 (0.177) -0.068 (0.193) -0.113 (0.254) 0.070 (0.261) -0.241 (0.548) 0.091 (0.295) -0.458 (0.679) 0.535 (0.293) -0.018 (0.193) 0.264 (0.320) -0.233 (0.262) -5.095 (173.7) * *** ** *** Case 5 0.727 *** (0.159) 1.123 *** (0.080) -0.546 (0.170) -0.368 (0.176) -0.639 (0.147) 0.005 (0.178) -0.097 (0.193) -0.135 (0.254) 0.053 (0.261) -0.258 (0.548) 0.075 (0.295) -0.483 (0.680) 0.521 (0.292) -0.035 (0.193) 0.250 (0.320) -0.249 (0.262) -5.095 (173.7) * *** ** *** Case 6 0.174 ** (0.077) -1.207 *** (0.039) -0.555 (0.170) -0.376 (0.176) -0.634 (0.147) -0.025 (0.179) -0.097 (0.193) -0.131 (0.254) 0.085 (0.263) -0.489 (0.628) 0.026 (0.300) -0.471 (0.679) 0.518 (0.292) -0.038 (0.193) 0.240 (0.320) -0.253 (0.262) -5.101 (173.7) * *** ** *** Case 7 -0.481 *** (0.130) -1.163 *** (0.065) Case 1 -0.258 (0.189) -0.171 (0.199) -0.052 (0.427) -0.190 (0.188) -0.489 (0.382) 0.299 (0.256) -0.406 (0.326) 732 18.59 0.000 Case 2 -0.258 (0.189) -0.171 (0.199) -0.041 (0.426) -0.186 (0.188) -0.494 (0.381) 0.329 (0.254) -0.402 (0.326) 738 19.56 0.000 Case 3 -0.257 (0.189) -0.154 (0.198) -0.046 (0.427) -0.190 (0.188) -0.488 (0.382) 0.315 (0.255) -0.409 (0.326) 737 24.97 0.000 330 Note 1: Standard errors are in parentheses. Note 2: ***, ** and * indicate significance at the 1%, 5% and 10% level, respectively. Note 3: Dependent variables; Case 1: Change in packaging Case 2: Improvement of an existing product Case 3: New product based on the existing technologies Case 4: New product based on new technologies Case 5: Number of product increased Case 6: Reduced delivery delay Case 7: Reduced variation in product quality. Number of obs. Wald chi2(1) Prob > chi2 Other transportation equipments and parts Automobile, auto parts Precision instruments Other electronics & components Computers & computer parts Machinery, equipment, tools Metal products Table 5 (Continued) Case 4 -0.273 (0.189) -0.205 (0.201) -0.063 (0.427) -0.205 (0.188) -0.505 (0.382) 0.284 (0.256) -0.422 (0.326) 733 32.48 0.000 Case 5 -0.244 (0.189) -0.154 (0.199) 0.129 (0.456) -0.170 (0.188) -0.477 (0.382) 0.317 (0.257) -0.386 (0.326) 739 20.87 0.000 Case 6 -0.259 (0.189) -0.155 (0.198) -0.043 (0.426) -0.195 (0.188) -0.493 (0.381) 0.325 (0.254) -0.404 (0.326) 738 5.08 0.024 Case 7 -0.263 (0.189) -0.157 (0.197) -0.048 (0.427) -0.192 (0.188) -0.494 (0.382) 0.296 (0.256) -0.407 (0.326) 735 13.80 0.000 Non-ferrous metals Iron, steel Other non-metallic mineral products Plastic, rubber products Chemicals, chemical products Coal, petroleum products Paper, paper products, printing Wood, wood products Apparel, leather Textiles Food, beverages, tobacco Thailand (dummy) Philippines (dummy) Indonesia (dummy) Capability Index (Organization) Ho Chi Minh (dummy) Constant Capability Index (Organization) 1.991 (0.243) 0.075 (0.177) -0.064 (0.147) -0.122 (0.176) -0.866 (0.204) -0.565 (0.295) -0.529 (0.270) -1.185 (0.582) -0.801 (0.306) -0.149 (0.646) 0.082 (0.289) -0.132 (0.209) -0.426 (0.317) -0.584 (0.293) -4.689 (100.6) ** *** ** * * *** *** Case 1 0.296 ** (0.120) 0.945 *** (0.070) 1.979 (0.242) 0.059 (0.176) -0.070 (0.146) -0.157 (0.175) -0.855 (0.203) -0.587 (0.291) -0.548 (0.267) -1.174 (0.582) -0.788 (0.306) -0.124 (0.646) 0.090 (0.288) -0.122 (0.209) -0.423 (0.317) -0.505 (0.284) -4.691 (100.6) * ** ** ** ** *** *** Case 2 0.883 *** (0.104) 1.006 *** (0.060) 331 1.988 (0.242) 0.067 (0.176) -0.067 (0.146) -0.186 (0.176) -0.853 (0.204) -0.580 (0.292) -0.554 (0.267) -1.174 (0.583) -0.784 (0.306) -0.112 (0.645) 0.090 (0.288) -0.156 (0.210) -0.428 (0.317) -0.512 (0.285) -4.695 (100.6) * ** ** ** ** *** *** Case 3 0.268 ** (0.109) 1.075 *** (0.063) 1.969 (0.242) 0.054 (0.177) -0.082 (0.147) -0.162 (0.177) -0.849 (0.204) -0.580 (0.291) -0.513 (0.270) -1.164 (0.582) -0.783 (0.306) -0.119 (0.646) 0.096 (0.288) -0.140 (0.210) -0.414 (0.317) -0.498 (0.285) -4.691 (100.6) * ** ** * ** *** *** Case 4 0.243 ** (0.108) 0.759 *** (0.063) Table 6: Innovation and Capability Index (Organization, Treatment-Effects Model) 1.948 (0.242) 0.040 (0.176) -0.095 (0.146) -0.189 (0.174) -0.833 (0.203) -0.559 (0.291) -0.522 (0.267) -1.147 (0.582) -0.768 (0.306) -0.094 (0.645) 0.108 (0.288) -0.099 (0.208) -0.402 (0.317) -0.483 (0.284) -4.747 (113.9) * ** ** * * *** *** Case 5 0.073 (0.095) 1.436 *** (0.055) 1.996 (0.242) 0.068 (0.176) -0.065 (0.146) -0.180 (0.175) -0.840 (0.204) -0.612 (0.288) -0.551 (0.267) -1.173 (0.583) -0.783 (0.306) -0.110 (0.645) 0.092 (0.288) -0.127 (0.208) -0.426 (0.316) -0.508 (0.284) -4.692 (100.6) * ** ** ** ** *** *** Case 6 0.173 *** (0.047) -1.215 *** (0.027) 1.987 (0.242) 0.056 (0.176) -0.069 (0.146) -0.168 (0.177) -0.857 (0.204) -0.631 (0.289) -0.536 (0.269) -1.100 (0.601) -0.933 (0.323) -0.140 (0.647) 0.076 (0.289) -0.139 (0.209) -0.440 (0.317) -0.524 (0.285) -4.703 (100.6) * *** * ** ** *** *** Case 7 0.728 *** (0.075) -1.775 *** (0.043) Case 1 -0.481 ** (0.193) -0.320 (0.223) -0.332 (0.612) -0.284 (0.204) -0.397 (0.427) -0.266 (0.243) -0.095 (0.371) 745 6.07 0.014 Case 2 -0.472 ** (0.192) -0.312 (0.223) -0.331 (0.611) -0.277 (0.204) -0.387 (0.426) -0.283 (0.240) -0.085 (0.371) 751 72.71 0.000 Case 3 -0.483 ** (0.192) -0.341 (0.221) -0.341 (0.612) -0.284 (0.204) -0.399 (0.426) -0.282 (0.240) -0.091 (0.372) 750 6.10 0.014 332 Note 1: Standard errors are in parentheses. Note 2: ***, ** and * indicate significance at the 1%, 5% and 10% level, respectively. Note 3: Dependent variables; Case 1: Change in packaging, Case 2: Improvement of an existing product Case 3: New product based on the existing technologies Case 4: New product based on new technologies Case 5: Number of product increased Case 6: Reduced delivery delay Case 7: Reduced variation in product quality. Number of obs. Wald chi2(1) Prob > chi2 Other transportation equipments and parts Automobile, auto parts Precision instruments Other electronics & components Computers & computer parts Machinery, equipment, tools Metal products Table 6 (Continued) Case 4 -0.465 ** (0.193) -0.281 (0.226) -0.324 (0.610) -0.268 (0.204) -0.381 (0.426) -0.249 (0.243) -0.078 (0.371) 746 5.02 0.025 Case 5 -0.450 ** (0.192) -0.290 (0.223) -0.004 (0.752) -0.253 (0.204) -0.367 (0.426) -0.228 (0.244) -0.061 (0.371) 753 0.58 0.445 Case 6 -0.480 ** (0.192) -0.340 (0.221) -0.338 (0.612) -0.303 (0.205) -0.397 (0.427) -0.280 (0.240) -0.089 (0.371) 753 13.29 0.000 Case 7 -0.489 ** (0.192) -0.349 (0.221) -0.356 (0.612) -0.296 (0.204) -0.403 (0.427) -0.271 (0.243) -0.103 (0.372) 749 94.34 0.000 Non-ferrous metals Iron, steel Other non-metallic mineral products Plastic, rubber products Chemicals, chemical products Coal, petroleum products Paper, paper products, printing Wood, wood products Apparel, leather Textiles Food, beverages, tobacco Thailand (dummy) Philippines (dummy) Indonesia (dummy) Capability Index (Human) Ho Chi Minh (dummy) Constant Capability Index (Human) 0.118 (0.173) -0.451 (0.177) -0.377 (0.148) -0.548 (0.193) -0.380 (0.201) 0.201 (0.265) -0.059 (0.266) -0.888 (0.580) 0.053 (0.294) -0.469 (0.697) -0.520 (0.293) 0.153 (0.195) 0.142 (0.316) 0.495 (0.291) -4.800 (116.0) * * * *** ** ** Case 1 0.683 *** (0.221) 0.755 *** (0.116) 0.123 (0.172) -0.443 (0.176) -0.365 (0.147) -0.536 (0.193) -0.401 (0.201) 0.219 (0.262) -0.084 (0.266) -0.909 (0.580) 0.034 (0.294) -0.499 (0.697) -0.538 (0.293) 0.131 (0.195) 0.120 (0.316) 0.383 (0.281) -4.808 (116.0) * ** *** ** ** Case 2 1.378 *** (0.225) 0.772 *** (0.118) 333 0.138 (0.172) -0.424 (0.176) -0.358 (0.147) -0.545 (0.194) -0.389 (0.201) 0.228 (0.262) -0.076 (0.266) -0.903 (0.580) 0.043 (0.294) -0.477 (0.697) -0.531 (0.293) 0.112 (0.196) 0.127 (0.315) 0.388 (0.281) -4.799 (116.0) * * *** ** ** Case 3 0.665 *** (0.199) 0.879 *** (0.104) 0.122 (0.173) -0.439 (0.177) -0.369 (0.148) -0.554 (0.194) -0.383 (0.201) 0.238 (0.262) -0.068 (0.266) -0.894 (0.580) 0.050 (0.294) -0.469 (0.697) -0.525 (0.293) 0.123 (0.196) 0.135 (0.316) 0.397 (0.281) -4.800 (116.0) * * *** ** ** Case 4 0.695 *** (0.203) 0.537 *** (0.107) Table 7: Innovation and Capability Index (Human, Treatment-Effects Model) 0.126 (0.172) -0.444 (0.176) -0.362 (0.147) -0.547 (0.191) -0.403 (0.201) 0.218 (0.262) -0.090 (0.266) -0.911 (0.580) 0.033 (0.294) -0.495 (0.697) -0.541 (0.293) 0.127 (0.195) 0.114 (0.315) 0.378 (0.281) -4.810 (116.0) * ** *** ** ** Case 5 0.399 ** (0.168) 1.268 *** (0.088) 0.128 (0.172) -0.440 (0.176) -0.363 (0.147) -0.551 (0.193) -0.398 (0.201) 0.222 (0.262) -0.086 (0.266) -0.907 (0.580) 0.037 (0.294) -0.488 (0.697) -0.537 (0.293) 0.129 (0.195) 0.118 (0.315) 0.381 (0.281) -4.808 (116.0) * ** *** ** ** Case 6 0.181 ** (0.084) -1.219 *** (0.044) 0.122 (0.172) -0.445 (0.176) -0.369 (0.147) -0.531 (0.193) -0.402 (0.201) 0.217 (0.262) -0.124 (0.269) -0.824 (0.598) 0.033 (0.294) -0.503 (0.697) -0.538 (0.293) 0.131 (0.195) 0.121 (0.315) 0.383 (0.281) -4.809 (116.0) * ** *** ** ** Case 7 0.643 *** (0.137) -1.703 *** (0.072) Case 1 0.099 (0.188) -0.114 (0.203) 0.942 * (0.549) 0.149 (0.187) 0.344 (0.370) 0.446 * (0.250) -0.316 (0.312) 713 9.57 0.002 Case 2 0.077 (0.187) -0.133 (0.203) 0.921 * (0.549) 0.127 (0.187) 0.326 (0.370) 0.423 * (0.250) -0.337 (0.312) 717 37.59 0.000 Case 3 0.076 (0.187) -0.133 (0.203) 0.926 * (0.549) 0.130 (0.187) 0.322 (0.370) 0.435 * (0.250) -0.334 (0.312) 715 11.15 0.001 334 Note 1: Standard errors are in parentheses. Note 2: ***, ** and * indicate significance at the 1%, 5% and 10% level, respectively. Note 3: Dependent variables; Case 1: Change in packaging Case 2: Improvement of an existing product Case 3: New product based on the existing technologies Case 4: New product based on new technologies Case 5: Number of product increased Case 6: Reduced delivery delay Case 7: Reduced variation in product quality. Number of obs. Wald chi2(1) Prob > chi2 Other transportation equipments and parts Automobile, auto parts Precision instruments Other electronics & components Computers & computer parts Machinery, equipment, tools Metal products Table 7 (Continued) Case 4 0.087 (0.188) -0.100 (0.205) 0.937 * (0.549) 0.141 (0.187) 0.335 (0.370) 0.442 * (0.250) -0.323 (0.312) 714 11.69 0.001 Case 5 0.072 (0.187) -0.138 (0.203) 0.822 (0.566) 0.122 (0.187) 0.321 (0.370) 0.398 (0.253) -0.342 (0.312) 719 5.63 0.018 Case 6 0.074 (0.187) -0.136 (0.203) 0.917 * (0.549) 0.111 (0.187) 0.322 (0.370) 0.426 * (0.250) -0.339 (0.312) 718 4.67 0.031 Case 7 0.077 (0.187) -0.133 (0.203) 0.921 * (0.549) 0.127 (0.187) 0.326 (0.370) 0.423 * (0.250) -0.337 (0.312) 717 21.97 0.000 Table 8: Summary of Treatment Models Product innovation Process innovation Capability Index O O Technological factor O X Managerial organization X O Human Resources O O 4.3. Effect of External Linkages on Internal Capability In this estimation, the capability index is taken as a dependent variable, and independent variables are in common with the first estimation, and external linkages (or external sources) are included, which are listed as follows. Q23.1. Final consumer Q23.2. Competitor Q23.3. Buyer or trading company Q23.4. Consultant Q23.5. Local customer (100% local capital) Q23.6. Local supplier Q23.7. MNC/JV customer located in country Q23.8. MNC/JV supplier located in country Q23.9. MNC/JV customer located in a foreign country Q23.10. MNC/JV supplier located in a foreign country Q23.11. Public organization Q23.12. Local business organization Q23.13. University or public research institute Table 9 and Table 10 show the results of the estimation of internal capability and external sources by Instrument GMM, since external sources are also considered 335 endogenous. As noted in the previous sections, instrumental variables are the “Number of full-time employees,” “Dummy variable of startup after 2000,” “Countries, Year beginning operation,” “Dummy variable of spin-off firms from MNC/JV,” and “Dummy variable of locally-owned firm.” Since the number of instruments is larger than the endogenous variables (instrumented variables), the constraint of overidentification restrictions is tested by Hansen’s J test. In most estimations, the constraint of overidentification restrictions is satisfied. The result shows that external sources except “MNC/JV,” “Public Organization,” and “University or Public Research Institute” have negative coefficients to internal capability, which does not satisfy the sign condition. “Public Organizations” and “University or Public Research Institute” are not significant either. These results are interpreted that such external linkages do not enhance the internal capability of firms. By contrast, “MNC/JV customer & supplier located in country (p<0.01)” and “MNC/JV customer & supplier located in a foreign country (p<0.01)” are significant to internal capability. Thus, multinational/joint venture companies are concluded as being primary external sources that enhance internal capability, which coincides with the results obtained in the previous papers (Tsuji and Miyahara 2010a, 2010b). We also estimate some other external factors promoting internal capability shown in Table 10. We assume these factors are endogenous, and the instrumental variable of the GMM estimation is adopted again. According to the results, “Duration of relationship with customer (p<0.01),” “Employment size of the customer & supplier (p<0.01),” and “Granted a technical license or know-how to the customer (p<0.05) & supplier (p<0.01)” are revealed as statistically significant. 336 0.026 (0.006) 0.022 (0.029) 0.016 (0.061) 0.014 (0.059) 0.098 (0.074) 0.000 (0.065) 1.731 (0.389) 696 40.61 0.000 1.35 0.510 *** *** Case 1 -0.412 *** (0.114) 0.032 (0.009) -0.040 (0.048) 0.194 (0.107) 0.142 (0.111) 0.051 (0.108) 0.060 (0.101) 2.306 (0.707) 698 29.22 0.000 0.69 0.707 -0.641 (0.226) Case 2 *** * *** *** 0.046 (0.011) 0.018 (0.046) 0.532 (0.211) 0.293 (0.160) 0.539 (0.241) 0.332 (0.154) 1.759 (0.539) 696 23.52 0.001 0.03 0.986 -0.595 (0.221) Case 3 *** ** ** * ** *** *** 0.061 (0.043) 0.007 (0.056) 0.426 (0.425) 0.231 (0.296) 0.330 (0.410) 0.203 (0.235) 1.563 (1.251) 696 7.00 0.429 1.72 0.424 -0.615 (0.638) Case 4 0.017 (0.004) 0.005 (0.019) 0.146 (0.049) -0.061 (0.040) -0.031 (0.040) 0.066 (0.045) 0.822 (0.141) 698 75.15 0.000 5.11 0.078 -0.155 (0.045) Case 5 *** *** *** *** 0.024 (0.005) -0.013 (0.031) 0.310 (0.168) 0.077 (0.079) 0.285 (0.202) 0.292 (0.182) 1.031 (0.402) 697 40.37 0.000 7.51 0.023 -0.298 (0.174) Case 6 ** * *** * 0.010 (0.005) 0.016 (0.021) -0.173 (0.046) -0.102 (0.040) -0.036 (0.037) -0.023 (0.038) 0.028 (0.063) 694 102.91 0.000 1.37 0.505 0.180 (0.030) Case 7 ** *** * *** 0.005 (0.005) 0.031 (0.020) -0.211 (0.056) -0.075 (0.039) -0.125 (0.040) -0.078 (0.043) 0.118 (0.060) 696 84.79 0.000 3.55 0.170 0.171 (0.033) Case 8 337 Note 1: Instrumented: External sources, Duration of relationship, Employment size (customer/supplier), Grant technical license/know-how to customer/supplier. Note 2: Instruments: Number of full-time employees, Startup 2000, Countries, Year beginning operating, Spin-off from MNC/JV, Local firm. Note 3: ***, ** and * indicate significance at the 1%, 5% and 10% level, respectively. Note 4: Standard errors are in parentheses. Number of obs. Wald chi2(7) Prob > chi2 Hansen's J chi2(2) Prob > chi2 Constant Thailand (dummy) Philippines (dummy) Indonesia (dummy) Ho Chi Minh (dummy) Startup 2000 Number of full-time employees MNC/JV customer located in a foreign country MNC/JV supplier located in Country MNC/JV customer located in Country Local supplier Local customer (100% local capital) Consultant Buyer or trading company Competitor Final Consumer Table 9: Capability and External Sources (1) * * *** * *** *** 0.122 (0.024) 0.005 (0.005) 0.011 (0.016) -0.145 (0.044) -0.116 (0.034) -0.108 (0.032) -0.053 (0.033) 0.234 (0.038) 695 114.05 0.000 2.88 0.237 Case 9 *** *** *** *** *** 0.004 (0.005) -0.003 (0.017) -0.113 (0.040) -0.059 (0.031) -0.104 (0.032) -0.026 (0.033) 0.223 (0.045) 693 92.34 0.000 2.91 0.233 *** *** * *** Case 10 0.128 *** (0.028) 0.022 (0.006) 0.005 (0.021) 0.079 (0.149) -0.079 (0.097) -0.022 (0.112) 0.032 (0.125) 0.514 (0.300) 698 77.41 0.000 17.76 0.000 -0.077 (0.174) * *** Case 11 0.022 (0.007) -0.024 (0.040) 0.150 (0.090) -0.400 (0.195) 0.045 (0.088) 0.160 (0.110) 1.187 (0.412) 696 19.21 0.008 1.33 0.514 -0.347 (0.173) *** ** * *** ** Case 12 0.073 (0.156) -0.067 (0.281) 1.438 (4.254) -1.078 (3.161) 0.393 (1.385) 1.645 (4.923) 2.910 (7.609) 697 0.83 0.997 0.12 0.941 -1.743 (5.212) Case 13 -0.001 (0.011) 0.392 (0.122) -0.031 (0.083) 0.329 (0.139) -0.319 (0.114) -0.184 (0.105) -1.643 (0.597) 698 33.57 0.000 0.31 0.856 0.369 (0.110) *** * *** ** *** *** Case 14 -0.006 (0.008) 0.001 (0.023) 0.054 (0.045) 0.091 (0.051) 0.026 (0.048) 0.177 (0.050) -0.093 (0.095) 667 136.69 0.000 1.05 0.592 0.194 (0.037) *** * *** Case 15 -0.018 (0.014) 0.033 (0.025) -0.033 (0.047) 0.019 (0.044) 0.053 (0.057) 0.113 (0.060) -0.061 (0.157) 665 44.73 0.000 1.09 0.580 0.230 (0.081) * *** Case 16 0.016 (0.005) -0.010 (0.024) 0.240 (0.091) -0.063 (0.047) -0.027 (0.040) -0.171 (0.080) 1.346 (0.396) 685 57.04 0.000 8.54 0.014 0.587 (0.236) 338 *** ** *** *** ** Case 17 Note 1: Instrumented: External sources, Duration of relationship, Employment size (customer/supplier), Grant technical license/know-how to customer/supplier. Note 2: Instruments: Number of full-time employees, Startup 2000, Countries, Year beginning operating, Spin-off from MNC/JV, Local firm. Note 3: ***, ** and * indicate significance at the 1%, 5% and 10% level, respectively. Note 4: Standard errors are in parentheses. Number of obs. Wald chi2(7) Prob > chi2 Hansen's J chi2(2) Prob > chi2 Constant Thailand (dummy) Philippines (dummy) Indonesia (dummy) Ho Chi Minh (dummy) Startup 2000 Grant technical license/know-how to customer Grant technical license/know-how to supplier Number of full-time employees Employment size (supplier) Employment size (customer) Duration of relationship (customer) University or Public Research Institute Local business organization MNC/JV supplier located in a foreign country Public organization Table 10: Capability and External Sources (2) 0.503 (0.128) 0.011 (0.005) 0.004 (0.019) 0.203 (0.053) 0.022 (0.038) -0.046 (0.034) -0.146 (0.054) 1.248 (0.230) 685 93.54 0.000 1.74 0.418 *** *** *** ** *** Case 18 4.4. Effect of Internal Capability on External Linkages In the last section, we examine whether external linkages enhance internal capability. Here we attempt to estimate whether internal capability promotes the attracting of external sources, taking the external resources listed in Section 4.3. as dependent variables and the internal capability and other variables such as industries, countries, and the size of firms as explanatory variables. Again, we use the treatmenteffects model. The results of the estimations are summarized in Table 11 and Table 12. According to the results, Ho Chi Minh (p<0.01), Philippines (p<0.05), “Number of full-time employees (p<0.01),” “Other transportation equipment and parts (p<0.01),” and “Local firms (p<0.01)” are significant for internal capability. The controlled internal capability also has effects on external linkages in the cases of “Competitor (p<0.05),” “Consultant (p<0.10),” “MNC/JV customer located in country (p<0.01),” “MNC/JV supplier located in country (p<0.01),” “MNC/JV customer located in a foreign country (p<0.01),” “MNC/JV supplier located in a foreign country (p<0.01),” “Public organization (p<0.01),” and “University or Public Research Institute (p<0.01).” These results show there is a reverse causality of internal capability and external linkages, that is, if firms enhance internal capability, then they have a higher possibility to construct external linkages with various institutions. Again, this relationship is especially strong for connecting with multinational and joint-venture companies. 339 Iron, steel Other non-metallic mineral products Plastic, rubber products Chemicals, chemical products Coal, petroleum products Paper, paper products, printing Wood, wood products Apparel, leather Textiles Food, beverages, tobacco Number of full-time employees Thailand (dummy) Philippines (dummy) Indonesia (dummy) Capability Index Ho Chi Minh (dummy) Constant Capability Index 0.547 (0.179) -0.026 (0.182) -0.349 (0.151) 0.039 (0.202) 0.090 (0.018) 0.010 (0.216) -0.250 (0.272) -0.118 (0.273) -0.177 (0.559) -0.241 (0.318) -0.205 (0.676) 0.393 (0.301) -0.320 (0.206) -0.119 (0.337) -0.341 (0.288) *** ** *** Case 1 -0.161 (0.169) 3.605 *** (0.090) 0.546 (0.179) -0.027 (0.182) -0.349 (0.151) 0.048 (0.201) 0.090 (0.018) 0.006 (0.215) -0.254 (0.272) -0.120 (0.274) -0.179 (0.559) -0.244 (0.318) -0.215 (0.677) 0.421 (0.298) -0.322 (0.206) -0.122 (0.337) -0.343 (0.288) *** ** *** Case 2 0.398 ** (0.186) 3.075 *** (0.099) 340 0.565 (0.180) 0.000 (0.184) -0.332 (0.151) 0.054 (0.202) 0.089 (0.018) 0.006 (0.216) -0.258 (0.272) -0.130 (0.274) -0.186 (0.559) -0.245 (0.318) -0.213 (0.676) 0.387 (0.301) -0.332 (0.206) -0.126 (0.337) -0.351 (0.288) *** ** *** Case 3 0.196 (0.212) 3.117 *** (0.113) 0.558 (0.180) -0.014 (0.183) -0.336 (0.151) 0.054 (0.202) 0.089 (0.018) 0.007 (0.216) -0.254 (0.272) -0.126 (0.274) -0.184 (0.559) -0.243 (0.318) -0.210 (0.676) 0.391 (0.301) -0.324 (0.206) -0.123 (0.337) -0.344 (0.288) *** ** *** Case 4 0.434 * (0.239) 2.517 *** (0.127) 0.523 (0.180) -0.039 (0.183) -0.360 (0.151) 0.048 (0.201) 0.090 (0.018) 0.011 (0.216) -0.219 (0.269) -0.109 (0.274) -0.171 (0.559) -0.240 (0.318) -0.212 (0.677) 0.428 (0.298) -0.309 (0.206) -0.113 (0.337) -0.331 (0.288) *** ** *** Case 5 0.270 (0.245) 2.907 *** (0.131) 0.547 (0.179) -0.026 (0.182) -0.349 (0.151) 0.039 (0.202) 0.090 (0.018) 0.010 (0.216) -0.250 (0.272) -0.118 (0.273) -0.177 (0.559) -0.241 (0.318) -0.205 (0.676) 0.393 (0.301) -0.320 (0.206) -0.119 (0.337) -0.341 (0.288) *** ** *** Case 6 -0.264 (0.215) 3.142 *** (0.115) 0.542 (0.180) -0.034 (0.183) -0.365 (0.152) 0.029 (0.202) 0.091 (0.018) 0.028 (0.216) -0.252 (0.272) -0.059 (0.277) -0.170 (0.559) -0.241 (0.318) -0.209 (0.676) 0.423 (0.298) -0.320 (0.206) -0.116 (0.338) -0.342 (0.288) *** ** *** Case 7 2.437 *** (0.360) 1.254 *** (0.192) Table 11: Estimation of Results of Reverse Causality from Internal Capability to External Linkages (1) (Treatment Model) Case 1 -4.670 (88.0) -0.157 (0.196) -0.253 (0.210) 0.288 (0.497) -0.264 (0.194) -0.469 (0.373) 0.080 (0.258) -0.973 *** (0.339) -0.398 *** (0.100) 704 0.91 0.341 Case 2 -4.671 (88.0) -0.159 (0.196) -0.254 (0.210) 0.286 (0.497) -0.266 (0.194) -0.470 (0.373) 0.076 (0.258) -0.975 *** (0.339) -0.397 *** (0.100) 705 4.59 0.032 Case 3 -4.667 (87.9) -0.188 (0.198) -0.263 (0.210) 0.281 (0.497) -0.275 (0.195) -0.482 (0.373) 0.072 (0.258) -0.985 *** (0.339) -0.404 *** (0.100) 703 0.85 0.356 341 Note 1: Standard errors are in parentheses. Note 2: ***, ** and * indicate significance at the 1%, 5% and 10% level, respectively. Note 3: Dependent variables; Case 1: Final Consumer Case 2: Competitor Case 3: Buyer or trading company Case 4: Consultant Case 5: Local customer (100% local capital) Case 6: Local supplier Case 7: MNC/JV customer located in Country. Number of obs. Wald chi2(1) Prob > chi2 Local firm Other transportation equipments and parts Automobile, auto parts Precision instruments Other electronics & components Computers & computer parts Machinery, equipment, tools Metal products Non-ferrous metals Table 11 (Continued) Case 4 -4.974 (172.8) -0.163 (0.196) -0.256 (0.210) 0.286 (0.497) -0.269 (0.194) -0.473 (0.373) 0.039 (0.262) -0.978 *** (0.339) -0.403 *** (0.100) 703 3.30 0.069 Case 5 -4.978 (172.8) -0.147 (0.196) -0.239 (0.210) 0.527 (0.574) -0.251 (0.195) -0.454 (0.373) 0.083 (0.258) -0.960 *** (0.339) -0.396 *** (0.100) 705 1.22 0.270 Case 6 -4.670 (88.0) -0.157 (0.196) -0.253 (0.210) 0.288 (0.497) -0.264 (0.194) -0.469 (0.373) 0.080 (0.258) -0.973 *** (0.339) -0.398 *** (0.100) 704 1.50 0.221 Case 7 -4.674 (88.0) -0.156 (0.196) -0.281 (0.212) 0.283 (0.496) -0.263 (0.195) -0.471 (0.373) 0.120 (0.263) -0.972 *** (0.339) -0.390 *** (0.100) 701 45.94 0.000 Iron, steel Other non-metallic mineral products Plastic, rubber products Chemicals, chemical products Coal, petroleum products Paper, paper products, printing Wood, wood products Apparel, leather Textiles Food, beverages, tobacco Number of full-time employees Thailand (dummy) Philippines (dummy) Indonesia (dummy) Capability Index Ho Chi Minh (dummy) Constant Capability Index 0.540 (0.179) -0.033 (0.183) -0.355 (0.151) 0.034 (0.201) 0.090 (0.018) 0.026 (0.216) -0.250 (0.272) -0.114 (0.274) -0.177 (0.559) -0.241 (0.318) -0.207 (0.676) 0.423 (0.298) -0.318 (0.206) -0.119 (0.337) -0.339 (0.288) *** ** *** Case 8 2.249 *** (0.344) 1.276 *** (0.184) 0.538 (0.180) -0.036 (0.183) -0.355 (0.151) 0.031 (0.202) 0.091 (0.018) 0.026 (0.216) -0.250 (0.272) -0.067 (0.277) -0.175 (0.559) -0.242 (0.318) -0.207 (0.677) 0.423 (0.298) -0.319 (0.206) -0.121 (0.337) -0.341 (0.288) 342 *** ** *** Case 9 2.802 *** (0.375) 0.977 *** (0.201) 0.527 (0.180) -0.044 (0.183) -0.368 (0.152) 0.042 (0.203) 0.091 (0.018) 0.057 (0.218) -0.242 (0.272) -0.053 (0.277) -0.164 (0.560) -0.237 (0.318) -0.208 (0.677) 0.431 (0.298) -0.307 (0.206) -0.108 (0.338) -0.329 (0.288) *** ** *** Case 10 2.467 *** (0.353) 1.008 *** (0.189) 0.546 (0.179) -0.027 (0.182) -0.349 (0.151) 0.048 (0.201) 0.090 (0.018) 0.006 (0.215) -0.254 (0.272) -0.120 (0.274) -0.179 (0.559) -0.244 (0.318) -0.215 (0.677) 0.421 (0.298) -0.322 (0.206) -0.122 (0.337) -0.343 (0.288) *** ** *** Case 11 0.773 *** (0.298) 1.791 *** (0.159) 0.547 (0.179) -0.026 (0.182) -0.347 (0.151) 0.044 (0.201) 0.090 (0.018) 0.007 (0.215) -0.253 (0.272) -0.120 (0.273) -0.180 (0.559) -0.243 (0.318) -0.210 (0.676) 0.422 (0.298) -0.321 (0.206) -0.122 (0.337) -0.342 (0.288) *** ** *** Case 12 0.242 (0.284) 2.211 *** (0.151) 0.547 (0.179) -0.026 (0.182) -0.349 (0.151) 0.039 (0.202) 0.090 (0.018) 0.010 (0.216) -0.250 (0.272) -0.118 (0.273) -0.177 (0.559) -0.241 (0.318) -0.205 (0.676) 0.393 (0.301) -0.320 (0.206) -0.119 (0.337) -0.341 (0.288) *** ** *** Case 13 1.030 *** (0.289) 1.288 *** (0.154) Table 12: Estimation of Results of Reverse Causality from Internal Capability to External Linkages (2) (Treatment Model) Case 8 -4.671 (88.0) -0.155 (0.196) -0.251 (0.210) 0.289 (0.496) -0.261 (0.195) -0.467 (0.373) 0.117 (0.262) -0.969 *** (0.339) -0.391 *** (0.100) 703 42.77 0.000 Case 9 -4.673 (88.0) -0.155 (0.196) -0.251 (0.210) 0.287 (0.497) -0.263 (0.195) -0.467 (0.373) 0.115 (0.263) -0.972 *** (0.339) -0.395 *** (0.100) 702 55.72 0.000 343 Note 1: Standard errors are in parentheses. Note 2: ***, ** and * indicate significance at the 1%, 5% and 10% level, respectively. Note 3: Dependent variables; Case 8: MNC/JV supplier located in Country Case 9: MNC/JV customer located in a foreign country Case 10: MNC/JV supplier located in a foreign country Case 11: Public organization Case 12: Local business organization Case 13: University or Public Research Institute. Number of obs. Wald chi2(1) Prob > chi2 Local firm Other transportation equipments and parts Automobile, auto parts Precision instruments Other electronics & components Computers & computer parts Machinery, equipment, tools Metal products Non-ferrous metals Table 12 (Continued) Case 10 -4.672 (88.0) -0.143 (0.196) -0.240 (0.210) 0.299 (0.497) -0.235 (0.197) -0.454 (0.374) 0.123 (0.263) -0.960 *** (0.339) -0.396 *** (0.100) 700 48.79 0.000 Case 11 -4.671 (88.0) -0.159 (0.196) -0.254 (0.210) 0.286 (0.497) -0.266 (0.194) -0.470 (0.373) 0.076 (0.258) -0.975 *** (0.339) -0.397 *** (0.100) 705 6.74 0.009 Case 12 -4.670 (88.0) -0.158 (0.196) -0.254 (0.210) 0.287 (0.497) -0.265 (0.194) -0.470 (0.373) 0.065 (0.259) -0.974 *** (0.339) -0.396 *** (0.100) 704 0.72 0.395 Case 13 -4.670 (88.0) -0.157 (0.196) -0.253 (0.210) 0.288 (0.497) -0.264 (0.194) -0.469 (0.373) 0.080 (0.258) -0.973 *** (0.339) -0.398 *** (0.100) 704 12.67 0.000 4.5. Effect of External Linkages on Innovation The following three causal inferences were analyzed for: (1) effect of the internal capability on innovation; (2) effect of external linkages on internal capability; and (3) effect of internal capability on external linkages. All of the inferences were found to be significant. In this section, the remaining causality is analyzed, namely (4) effect of external linkages on innovation. In so doing, we also examine whether internal capability and external linkages are complementary to influence innovation. This estimation concludes the analysis of how innovation is promoted by the interaction between internal capability and external linkages. Even though treatment-effects models or instrumental variables estimations were used in the series of previous estimations, a sample selection bias is not considered. In other words, through the survey, only firms with a higher internal capability index might be selected, as firms could respond arbitrarily and the resulting data from the survey might not be reliable. These may yield sample selection bias. In order to handle this problem, we utilize the PSM method, proposed by Rosenbaum and Rubin (1983), (1985), and developed by Heckman, et al. (1997), (1998b) and Heckman et al. (1998a). In accordance with PSM, samples are divided into two groups: (i) the innovative group (treatment group) and (ii) the non-innovative group (control group). These two groups are matched so that their propensity scores as calculated by their attributes are similar to one another. This method enables estimation with less sample selection bias. The procedure of the PSM method is as follows: 1. A propensity score is calculated by the probit analysis. The propensity score is interpreted as a predicted probability of this probit estimation. The model consists of the innovation as a dependent variable, and the “Size of the firm,” 344 “Industry,” “Country,” and “Local firms” as independent variables. 2. The treatment group and control group are matched based on the propensity score. There are several ways of matching, and we utilize kernel matching in this model. Moreover, it is tested as to whether sample matching is appropriate by a balancing test, in which independent variables used in probit estimation are examined by the t-test between treatment and control groups. If no significant difference exists, then matching can be successful. 3. Finally, the effect of internal capability and external linkages on innovation is examined with matched samples. The result of the PSM model is shown in Tables 13, 14, and 15. Table 13 summarizes the result of probit estimation, while the result of the balancing test after matching is shown in Table 14. The row named as “Before matching” indicates a simple comparison of the raw data, while “After kernel matching” shows that of matched samples after kernel matching. The result indicated that matching is successful, since there are only two variables that have a statistically significant difference after matching. The effects of internal capability and external linkages on innovation are summarized in Table 15. According to this table, firstly the internal capability has a significant effect even after matching, where Cases 1, 2, 3, and 5 (p<0.01) and Case 4 (p<0.10) are significant. Since the internal capability still has a larger effect after removing sample selection bias, the effect of internal capability is robust. On the other hand, external linkages are significant for “Final consumer” (p<0.10 for Cases 3, 5), “Competitor” (p<0.05 for Cases 2, 3, 4), “Buyer or trading company” (p<0.01 for Case 3), “Consultant” (p<0.01 for Case 1, p<0.05 in Case 2, p<0.01 for Case 3, and p<0.05 for Case 4), Local customer/supplier (p<0.05 for Case 345 1, p<0.01 for Case 3), MNC/JV supplier in a foreign country (p<0.05 for Case 1, p<0.10 for Case 2), Local business organization (p<0.05 for Cases 1, 3), University or Public Research Institute (p<0.01 for Case 1, p<0.05 for Case 2, p<0.01 for Case 3, p<0.10 for Case 4). “Consultant” and “Universities” especially show large effects, and they significantly contribute to innovation. However, there are many insignificant external linkages after matching, which shows that their effects on innovation are not robust. This is quite different from internal capability. In this analysis, we cannot determine which mechanism, from capability to linkages or from linkages to capability, has a stronger effect in this cumulative process. According to the previous studies, MNC/JCs have technological superiority, and constructing ties with them seems to be essential for promoting internal capability. We are required to conduct further rigorous research to verify this. 346 Table 13: Probit Regression for Propensity Score Number of full-time employees (Persons) Local firm Ho Chi Minh (dummy) Indonesia (dummy) Philippines (dummy) Thailand (dummy) Food, beverages, tobacco Textiles Apparel, leather Wood, wood products Paper, paper products, printing Case 1 0.068 *** (0.022) -0.159 (0.110) -0.248 (0.191) -0.146 (0.196) -0.360 ** (0.181) -0.505 ** (0.216) 0.364 (0.228) 0.278 (0.278) 0.212 (0.281) -0.396 (0.613) 0.114 (0.331) Case 2 0.068 *** (0.022) -0.159 (0.110) -0.248 (0.191) -0.146 (0.196) -0.360 ** (0.181) -0.505 ** (0.216) 0.364 (0.228) 0.278 (0.278) 0.212 (0.281) -0.396 (0.613) 0.114 (0.331) Coal, petroleum products Chemicals, chemical products Plastic, rubber products Other non-metallic mineral products Iron, steel Metal products Machinery, equipment, tools Computers & computer parts Other electronics & components Precision instruments Automobile, auto parts Other transportation equipments and parts Startup 2000 Constant Number of obs. Log likelihood Pseudo R2 LR chi2(23/24) Prob > chi2 0.501 (0.304) 0.102 (0.215) -0.057 (0.346) 0.137 (0.290) 0.090 (0.209) 0.209 (0.225) 1.072 (0.506) 0.136 (0.209) 1.179 (0.410) 0.293 (0.280) 0.260 (0.327) -0.155 (0.104) -0.294 (0.240) 685 -442.37 0.050 46.81 0.002 ** *** 0.501 (0.304) 0.102 (0.215) -0.057 (0.346) 0.137 (0.290) 0.090 (0.209) 0.209 (0.225) 1.072 (0.506) 0.136 (0.209) 1.179 (0.410) 0.293 (0.280) 0.260 (0.327) -0.155 (0.104) -0.294 (0.240) 685 -442.37 0.050 123.10 0.000 ** *** Case 3 0.032 (0.022) -0.113 (0.110) -0.317 (0.189) 0.299 (0.193) -0.401 (0.180) -0.334 (0.214) 0.265 (0.227) 0.617 (0.274) 0.208 (0.281) -0.453 (0.612) -0.120 (0.347) -0.347 (0.693) -0.012 (0.311) 0.140 (0.215) 0.007 (0.342) 0.246 (0.283) 0.181 (0.207) 0.158 (0.225) 0.290 (0.455) 0.279 (0.206) 0.236 (0.381) 0.308 (0.275) -0.007 (0.330) -0.214 (0.104) -0.176 (0.237) 690 -447.23 0.051 48.12 0.002 * ** ** ** Case 4 0.054 * (0.028) -0.056 (0.141) -0.675 *** (0.230) -0.027 (0.232) 0.202 (0.228) -0.074 (0.254) 0.343 (0.281) 0.056 (0.344) -0.080 (0.372) 0.281 (0.441) 0.299 (0.918) -0.894 (0.445) -0.046 (0.268) -1.087 (0.588) 0.127 (0.361) -0.046 (0.262) 0.359 (0.278) -0.732 (0.664) 0.168 (0.256) -0.342 (0.510) 0.129 (0.338) 0.147 (0.433) 0.003 (0.136) -0.439 (0.293) 437 -268.99 0.078 45.21 0.004 ** * Note 1: Standard errors are in parentheses. Note 2: ***, ** and * indicate significance at the 1%, 5% and 10% level, respectively. Note 3: Dependent variables; Case 1: Change in packaging Case 2: Improvement of an existing product Case 3: New product based on the existing technologies Case 4: New product based on new technologies Case 5: Number of product increased. 347 Case 5 0.080 *** (0.022) -0.073 (0.112) 0.137 (0.190) 0.186 (0.196) -0.452 ** (0.181) 0.233 (0.218) 0.163 (0.228) -0.045 (0.278) -0.267 (0.290) -0.059 (0.527) 0.040 (0.336) 0.264 (0.311) 0.107 (0.215) 0.331 (0.337) 0.072 (0.294) 0.101 (0.210) 0.244 (0.228) 0.937 (0.579) 0.235 (0.210) 0.404 (0.382) 0.488 (0.291) -0.187 (0.326) 0.235 (0.105) -0.315 (0.238) 689 -429.06 0.088 82.77 0.000 * ** Computers & computer parts Machinery, equipment, tools Metal products Non-ferrous metals Iron, steel Other non-metallic mineral products Plastic, rubber products Chemicals, chemical products Coal, petroleum products Paper, paper products, printing Wood, wood products Apparel, leather Textiles Food, beverages, tobacco Thailand (dummy) Philippines (dummy) Indonesia (dummy) Ho Chi Minh (dummy) Local firm Number of full-time employees Before matching After kernel matching Before matching After kernel matching Before matching After kernel matching Before matching After kernel matching Before matching After kernel matching Before matching After kernel matching Before matching After kernel matching Before matching After kernel matching Before matching After kernel matching Before matching After kernel matching Before matching After kernel matching Before matching After kernel matching Before matching After kernel matching Before matching After kernel matching Before matching After kernel matching Before matching After kernel matching Before matching After kernel matching Before matching After kernel matching Before matching After kernel matching Before matching After kernel matching Table 14: Balancing Test T 5.25 5.13 0.59 0.59 0.21 0.24 0.22 0.25 0.27 0.28 0.15 0.08 0.10 0.09 0.04 0.05 0.05 0.05 0.00 0.00 0.03 0.02 0.00 0.00 0.04 0.04 0.09 0.10 0.02 0.02 0.04 0.04 0.00 0.00 0.13 0.13 0.09 0.09 0.02 0.02 Case 1 C 4.39 5.11 0.66 0.58 0.18 0.23 0.18 0.24 0.33 0.28 0.20 0.08 0.08 0.09 0.05 0.04 0.05 0.04 0.02 0.00 0.03 0.03 0.01 0.00 0.03 0.06 0.10 0.10 0.03 0.02 0.04 0.04 0.00 0.01 0.14 0.13 0.08 0.10 0.01 0.02 t test 0.000 0.938 0.039 0.792 0.328 0.906 0.196 0.821 0.074 0.947 0.099 0.920 0.333 0.960 0.746 0.939 0.974 0.959 0.101 0.984 0.860 0.919 0.095 . 0.252 0.394 0.752 0.939 0.586 0.792 0.740 0.925 0.239 0.206 0.742 0.897 0.710 0.715 0.060 0.600 * * * * ** *** T 5.15 5.10 0.63 0.63 0.28 0.30 0.25 0.27 0.22 0.22 0.12 0.07 0.07 0.07 0.05 0.05 0.03 0.04 0.00 0.00 0.02 0.02 0.00 0.00 0.04 0.04 0.12 0.12 0.02 0.02 0.04 0.04 0.00 0.00 0.13 0.14 0.10 0.10 0.02 0.02 348 Case 2 C 4.17 5.28 0.64 0.57 0.08 0.32 0.13 0.26 0.42 0.22 0.27 0.07 0.12 0.07 0.05 0.05 0.06 0.04 0.02 0.00 0.04 0.02 0.01 0.00 0.02 0.03 0.07 0.11 0.04 0.01 0.04 0.05 0.01 0.01 0.13 0.14 0.07 0.11 0.00 0.00 t test 0.000 0.306 0.650 0.060 0.000 0.645 0.000 0.779 0.000 0.885 0.000 0.752 0.056 0.997 0.856 0.827 0.053 0.971 0.008 0.999 0.286 0.909 0.017 . 0.168 0.409 0.032 0.817 0.211 0.524 0.876 0.614 0.092 0.132 0.833 0.884 0.305 0.414 0.043 0.055 ** * * ** ** *** * * *** *** *** * *** *** T 5.18 5.08 0.60 0.61 0.18 0.20 0.28 0.31 0.24 0.26 0.16 0.09 0.08 0.08 0.06 0.06 0.04 0.04 0.00 0.00 0.02 0.02 0.00 0.00 0.03 0.03 0.10 0.10 0.02 0.02 0.04 0.04 0.00 0.00 0.16 0.17 0.09 0.09 0.02 0.01 Case 3 C 4.43 4.99 0.65 0.58 0.21 0.20 0.14 0.32 0.34 0.26 0.20 0.09 0.10 0.07 0.04 0.06 0.05 0.04 0.02 0.00 0.04 0.01 0.01 0.00 0.04 0.03 0.09 0.11 0.03 0.02 0.04 0.05 0.00 0.00 0.11 0.16 0.09 0.09 0.01 0.01 t test 0.000 0.686 0.156 0.458 0.315 0.976 0.000 0.881 0.003 0.960 0.131 0.973 0.423 0.700 0.260 0.927 0.330 0.910 0.087 0.960 0.245 0.579 0.485 0.928 0.522 0.936 0.589 0.912 0.508 0.934 0.616 0.816 0.227 0.226 0.074 0.753 0.769 0.895 0.617 0.898 * * *** *** *** T 5.54 5.35 0.55 0.57 0.12 0.14 0.23 0.26 0.26 0.28 0.21 0.13 0.12 0.11 0.04 0.04 0.04 0.04 0.00 0.00 0.03 0.03 0.01 0.01 0.02 0.01 0.09 0.09 0.01 0.01 0.04 0.04 0.00 0.00 0.14 0.14 0.10 0.10 0.01 0.01 Case 4 C 4.92 5.36 0.64 0.59 0.29 0.17 0.20 0.24 0.18 0.30 0.19 0.12 0.06 0.13 0.06 0.04 0.03 0.04 0.01 0.00 0.02 0.03 0.00 0.00 0.05 0.01 0.10 0.10 0.03 0.01 0.04 0.05 0.00 0.00 0.13 0.13 0.08 0.09 0.03 0.00 t test 0.013 0.984 0.044 0.656 0.000 0.536 0.427 0.704 0.023 0.757 0.603 0.854 0.051 0.685 0.284 0.936 0.640 0.949 0.115 . 0.615 0.962 0.730 0.903 0.041 0.993 0.769 0.895 0.064 0.966 0.905 0.740 . . 0.707 0.667 0.601 0.758 0.092 0.681 * * ** * ** *** ** ** T 5.20 5.14 0.62 0.62 0.22 0.26 0.23 0.27 0.20 0.22 0.21 0.12 0.08 0.08 0.04 0.04 0.02 0.03 0.01 0.01 0.03 0.03 0.00 0.00 0.04 0.03 0.10 0.11 0.03 0.03 0.04 0.04 0.00 0.00 0.14 0.14 0.10 0.10 0.02 0.02 Case 5 C 4.16 5.04 0.64 0.63 0.15 0.28 0.14 0.24 0.44 0.22 0.14 0.10 0.11 0.06 0.05 0.05 0.08 0.03 0.02 0.01 0.03 0.02 0.01 0.00 0.03 0.03 0.09 0.11 0.03 0.03 0.04 0.04 0.00 0.00 0.13 0.14 0.07 0.12 0.00 0.02 t test 0.000 0.572 0.569 0.847 0.017 0.375 0.002 0.393 0.000 0.925 0.009 0.428 0.189 0.444 0.764 0.885 0.001 0.972 0.270 0.818 0.686 0.536 0.022 . 0.457 0.896 0.458 0.869 0.873 0.947 0.993 0.845 0.847 0.900 0.692 0.700 0.181 0.456 0.050 0.748 * ** *** *** *** *** ** *** Before matching After kernel matching Before matching After kernel matching Before matching After kernel matching Before matching After kernel matching Before matching After kernel matching T 0.11 0.12 0.04 0.04 0.05 0.05 0.03 0.03 0.40 0.41 Case 1 C 0.12 0.12 0.01 0.03 0.05 0.05 0.02 0.03 0.47 0.40 t test 0.612 0.978 0.004 0.513 0.911 0.991 0.706 0.817 0.049 0.855 ** *** T 0.13 0.13 0.03 0.03 0.04 0.04 0.03 0.03 0.43 0.43 Case 2 C 0.10 0.13 0.00 0.03 0.06 0.04 0.02 0.03 0.47 0.45 t test 0.194 0.856 0.009 0.733 0.282 0.943 0.558 0.672 0.289 0.705 349 Note 1: T and C stand for “Treatment group” and “Control group,” respectively. Note 2: ***, ** and * indicate significance at the 1%, 5% and 10% level, respectively. Note 3: Dependent variables; Case 1: Change in packaging Case 2: Improvement of an existing product Case 3: New product based on the existing technologies Case 4: New product based on new technologies Case 5: Number of product increased. Startup 2000 Other transportation equipments Automobile, auto parts Precision instruments Other electronics & components Table 14 (Continued) *** T 0.12 0.13 0.02 0.02 0.04 0.04 0.02 0.02 0.40 0.41 Case 3 C 0.11 0.13 0.02 0.02 0.05 0.05 0.03 0.02 0.48 0.44 t test 0.697 0.837 0.553 0.736 0.678 0.734 0.508 0.972 0.043 0.567 ** T 0.13 0.13 0.01 0.01 0.06 0.06 0.02 0.02 0.41 0.43 Case 4 C 0.11 0.13 0.03 0.01 0.04 0.06 0.03 0.03 0.43 0.42 t test 0.633 0.935 0.233 0.957 0.428 0.974 0.728 0.829 0.515 0.876 T 0.12 0.13 0.02 0.03 0.05 0.05 0.02 0.03 0.47 0.48 Case 5 C 0.10 0.13 0.01 0.03 0.05 0.04 0.03 0.03 0.41 0.49 t test 0.460 0.994 0.264 0.520 0.961 0.867 0.538 0.845 0.073 0.927 * * ** *** *** *** ** *** ** ** *** *** *** ** *** *** Case 2 t value p value 9.08 0.000 3.26 0.001 1.23 0.219 1.47 0.142 4.00 0.000 2.37 0.018 1.97 0.049 1.24 0.215 2.88 0.004 2.10 0.036 0.72 0.472 0.62 0.535 -0.57 0.569 1.04 0.299 3.60 0.000 -0.51 0.610 2.41 0.016 -1.00 0.318 4.61 0.000 0.48 0.631 5.75 0.000 1.94 0.053 -0.14 0.889 -0.21 0.834 0.23 0.818 1.50 0.134 2.37 0.018 2.44 0.015 350 Note 1: ***, ** and * indicate significance at the 1%, 5% and 10% level, respectively. Note 2: Dependent variables; Case 1: Change in packaging Case 2: Improvement of an existing product Case 3: New product based on the existing technologies Case 4: New product based on new technologies Case 5: Number of product increased. Before matching After kernel matching Final Consumer Before matching After kernel matching Competitor Before matching After kernel matching Buyer or trading company Before matching After kernel matching Consultant Before matching After kernel matching Local customer (100% local capital) Before matching After kernel matching Local supplier Before matching After kernel matching MNC/JV customer located in Country Before matching After kernel matching MNC/JV supplier located in Country Before matching After kernel matching MNC/JV customer located in a foreign country Before matching After kernel matching MNC/JV supplier located in a foreign country Before matching After kernel matching Public organization Before matching After kernel matching Local business organization Before matching After kernel matching University or Public Research Institute Before matching After kernel matching Capability Index Case 1 t value p value 7.58 0.000 5.31 0.000 -0.30 0.764 -0.15 0.881 2.09 0.037 1.34 0.181 1.02 0.308 0.86 0.390 2.96 0.003 2.82 0.005 0.88 0.379 1.33 0.184 0.59 0.555 2.25 0.025 2.59 0.010 1.06 0.290 2.37 0.018 1.38 0.168 2.81 0.005 0.67 0.503 3.84 0.000 2.25 0.025 1.56 0.119 1.51 0.132 1.78 0.076 2.03 0.043 3.00 0.003 3.13 0.002 Table 15: Effect of Capability Index and External Sources ** ** *** * *** ** *** *** ** *** ** ** *** *** Case 3 t value p value 6.33 0.000 4.36 0.000 1.56 0.119 1.78 0.076 3.02 0.003 2.43 0.015 2.32 0.021 2.73 0.006 2.45 0.015 2.85 0.005 0.71 0.478 2.65 0.008 0.64 0.522 2.66 0.008 1.81 0.071 -0.10 0.920 0.63 0.529 -0.24 0.810 1.56 0.119 -0.41 0.682 2.28 0.023 1.30 0.194 -0.39 0.697 1.26 0.208 -0.04 0.968 2.18 0.030 1.58 0.115 3.16 0.002 *** ** ** *** * *** * *** ** ** *** ** *** *** *** Case 4 t value p value 1.96 0.051 1.95 0.052 2.74 0.006 1.39 0.165 2.43 0.016 2.26 0.024 1.80 0.073 1.59 0.113 2.56 0.011 2.50 0.013 -0.33 0.742 0.74 0.460 1.32 0.188 0.64 0.523 -0.13 0.897 1.22 0.223 -0.17 0.865 0.81 0.418 0.09 0.928 0.77 0.442 0.56 0.576 1.46 0.145 0.82 0.413 1.13 0.259 0.05 0.960 0.14 0.889 1.11 0.268 1.77 0.077 * ** ** ** ** * * * *** Case 5 t value p value 7.43 0.000 3.23 0.001 1.58 0.115 1.71 0.088 2.40 0.017 1.08 0.281 0.96 0.337 1.38 0.168 0.68 0.497 -0.21 0.834 0.75 0.454 0.45 0.653 -0.65 0.516 0.83 0.407 3.78 0.000 0.80 0.424 2.28 0.023 -0.08 0.936 3.27 0.001 0.02 0.984 2.64 0.008 0.31 0.757 -0.61 0.542 -0.97 0.332 -0.50 0.617 0.02 0.984 1.14 0.255 0.55 0.582 *** *** ** *** * ** *** *** 5. Conclusions The results of the estimations are summarized here and the hypotheses proved are presented with the possibility of remaining problems. 5.1. Summary of Results Let us summarize the results here. (1) Internal capability promotes innovation significantly. (2) External linkages, particularly MNC/JC, influence the enhancing of internal capability. (3) Internal capability affects external linkages, that is, firms with the higher internal capability index tend to have more external linkages. (4) External linkages seem to have less significant effect on innovation in this estimation. In other words, external linkages enhance internal capability, but not innovation directly. According to the above results, there is a cumulative process between internal capability and external linkages. Internal capability itself enhances product as well as process innovation directly, while external linkages promote product innovation indirectly via enhancing internal capability. In this sense, internal capability is a core of innovation. The reasons for these results are that internal capability is presented by one single index, while external linkages are not expressed by one index but by various individual sources. This might highlight internal capability. This conclusion can be applied for designing policy to promote innovation. It seems that all policy recommendations proposed thus are rather comprehensive and applicable in general. Since resources to promote innovation are limited, strategic 351 policy measures target specific objectives. In what follows, we present policy recommendations to promote innovation in ASEAN economies. 5.2. Policy Recommendation: Strategic Measures to Promote Innovation The results of estimations in this paper precisely focus on internal capability which promotes innovation. In order to identify factors promoting internal capability in more detail, mixed logit estimation is used for identifying factors which categorize a particular firm at a particular stage of the capability index. In order to achieve this, the internal capability index is divided into four stages: Stage 1 has the highest capability index, while Stage 4 is the lowest. The number of firms in the four categories is the same, since this division of samples yields the best estimation results. In estimation, the third category is taken as a base outcome. Table 16 summarizes the results of the estimation. It shows that “Accept guest engineers (p<0.01)” and “Audit supplier (p<0.01)” are significant for firms in the lowest category, while “Accept engineers (p<0.01)” and “Provide customer on-site technical assistance (p<0.10)” are significant only for Stage 1 firms. “Public financial support (p<0.05)” and “Just-in-time (p<0.10)” are significant only for Stage 4 firms with the highest degree of capability index. Thus, firms with a low capability index really need technological assistance to promote their technological level, while firms with a high index require financial assistance and linkages with large customers which are practicing the just-in-time system. Since they have already achieved some level of technology, they need financial support to purchase equipment suitable to them or large customers to supply their parts under their delivering system. These are pinpointed policies for firms with a particular stage of capability index. 352 Table 16: Stages of Capability Index (Mixed Logit Estimation) Accept guest engineers Audit supplier Provide customer on-site technical assistance B2C E-commerce Public financial support Just-in-time supplier Ho Chi Minh (dummy) Indonesia (dummy) Philippines (dummy) Thailand (dummy) Number of full-time employees Food, beverages, tobacco Textiles Apparel, leather Wood, wood products Paper, paper products, printing Coal, petroleum products Chemicals, chemical products Plastic, rubber products Other non-metallic mineral products Iron, steel Non-ferrous metals Metal products Machinery, equipment, tools Computers & computer parts Other electronics & components Precision instruments Automobile, auto parts Other transportation equipments and parts Stage 1 1.201 *** (0.325) 1.009 *** (0.303) 0.505 * (0.296) 0.836 * (0.470) -0.043 (0.158) 0.274 (0.311) -3.731 *** (0.924) -1.162 * (0.602) 0.176 (0.510) -0.218 (0.626) -0.141 ** (0.057) -0.013 (0.567) 0.063 (0.741) -0.470 (0.672) 1.139 (1.249) 0.524 (0.869) 1.852 (1.351) -2.111 * (1.189) 1.065 * (0.606) 1.517 (0.928) 1.370 * (0.761) 14.765 (2921.0) 0.954 * (0.541) -0.117 (0.653) 0.962 (1.466) 0.723 (0.551) 0.092 (1.305) -0.434 (0.692) 1.442 (1.145) 353 Stage 2 0.238 (0.327) 0.470 * (0.285) -0.390 (0.292) 1.108 *** (0.405) -0.112 (0.144) -0.167 (0.310) -2.045 *** (0.737) -0.262 (0.538) -0.178 (0.516) 0.519 (0.627) -0.109 ** (0.049) -1.116 (0.695) 0.095 (0.641) -0.682 (0.730) -13.832 (944.2) 0.206 (0.847) -14.091 (1002.3) -0.090 (0.663) 0.930 * (0.498) 0.222 (1.069) 0.590 (0.667) -0.361 (4148.1) -0.019 (0.466) 0.202 (0.473) -0.352 (1.221) 0.282 (0.463) 0.943 (0.819) 0.043 (0.630) 2.126 ** (0.861) Stage 3 -0.092 (0.330) 0.286 (0.299) 0.022 (0.281) 1.715 *** (0.417) 0.302 ** (0.149) 0.544 * (0.318) -2.962 *** (0.734) -1.845 *** (0.535) -1.461 *** (0.491) -0.479 (0.556) 0.043 (0.047) -0.216 (0.527) -0.222 (0.629) -1.202 (0.790) -0.265 (1.511) 0.198 (0.820) -0.902 (1.495) 0.192 (0.629) 0.677 (0.493) 1.159 (0.909) 0.279 (0.667) -0.779 (4131.1) -0.141 (0.473) -0.565 (0.519) 0.816 (0.841) -0.150 (0.467) 0.205 (0.908) -0.012 (0.608) 0.913 (0.941) Table 16 (Continued) Stage 1 -2.782 *** (1.050) Constant Number of obs. Log likelihood Pseudo R2 LR chi2(87) Prob > chi2 Stage 2 0.037 (1.006) 691 -785.38 0.180 344.90 0.000 Stage 3 0.294 (1.000) Note 1: The base outcome is 3. Note 2: ***, ** and * indicate significance at the 1%, 5% and 10% level, respectively. Note 3: Standard errors are in parentheses. 5.3. Further Research In this analysis, pooled data is used for empirical study, but the sample consists of MNV/JC and local firms. The former tends to have a higher capability index, and the latter a low index. The results might be influenced by the nature of the sample. It is necessary to construct the model with MNC/JC and local firms. The same thing can be said as to which has a stronger effect on the mutual process between internal capability and external linkages. Engaging this research will lead to a more fruitful strategic policy for enhancing innovation in East Asian economies. In this paper, internal capability is measured by one single index, but external linkages are not. This is unfair treatment, but external linkages include many heterogeneous sources and no consistent rationale was found. It is better to construct a single index of external linkages. 354 ACKNOWLEDGEMENTS This paper is based on research conducted under the international project “Network Management: How to Enhance Innovation Capability with Internal and External Resources,” which was sponsored by the Economic Research Institute for ASEAN and East Asia (ERIA) in FY 2010. This project also has been carried out with cooperation from the Center for Strategic and International Studies (CSIS) of Indonesia, the Philippine Institute for Development Studies (PIDS), the Sirindhorn International Institute of Technology (SIIT) of Thammasat University, Thailand, and the Institute for Industry Policy and Strategy (IPSI), Ministry of Industry and Trade of Vietnam. This paper is indebted to their efforts in collecting data from the survey. Thanks are also due to Professor F. Kimura, Chief Economist of ERIA, Dr. I. Patarapong, Dr. Y. Ueki, Dr. T. Machikita and other project members for their comments and suggestions to the earlier version of the paper. 355 REFERENCES Heckman, J. J., H. Ichimura, and P. Todd (1997) “Matching as an Econometric Evaluation Estimator: Evidence from Evaluating a Job Training Programme,” Review of Economic Studies, 64(4): 605-54. Heckman, J. J., H. Ichimura, J. A. Smith, and P. Todd (1998a) “Characterizing Selection Bias Using Experimental Data,” Econometrica, 66(5): 1017-98. Heckman, J. J., H. Ichimura, and P. Todd (1998b) “Matching as an Econometric Evaluation Estimator,” Review of Economic Studies, 65(2): 261-94. Rosenbaum, P. R. and D. B. Rubin (1983) “The Central Role of the Propensity Score in Observational Studies for Causal Effects,” Biometrika, 70(1): 41-55. Rosenbaum, P. R. and D. B. Rubin (1985) “Constructing a Control Group Using Multivariate Matched Sampling Methods That Incorporate the Propensity Score,” The American Statistician, 39(1): 33-8. Saaty, T. L. (1980) The Analytic Hierarchy Process: Planning, Priority Setting, Resource Allocation, McGraw-Hill. Saaty, T. L. (1986) “Absolute and Relative Measurement with the AHP: The Most Livable Cities in the United States,” Socio-Economic Planning Sciences, 20(6): 327-331. Tsuji, M. and S. Miyahara (2010a) “Empirical Analysis of Innovation and the Proximity of Information Linkages in ASEAN Economies: Case of Indonesia, the Philippines, Thailand and Vietnam,” iIn Fostering Production and Science & Technology Linkages to Stimulate Innovation in ASEAN ed. Patarapong Intarakumnerd and Yasushi Ueki. ERIA Research Project 2009, No 7-4, Jakarta: ERIA. Tsuji, M. and S. Miyahara (2010b) “Empirical Analysis of Information Linkages and Capability in ASEAN Economies: Case of Indonesia, the Philippines, Thailand and Vietnam,” in ed. Patarapong and Ueki. ERIA Research Project 2009, No 74, Jakarta: ERIA. 356 CHAPTER 8 The Innovation Impact of Knowledge Exchanges within and across Connected Firms* TOMOHIRO MACHIKITA YASUSHI UEKI Institute of Developing Economies (IDE-JETRO), Japan This paper examines whether firms consider adopting cross-functional teams as a device of transforming external information to innovation or upgrading. While addressing the difference between firms with cross-functional teams and without teams, we examine the effects of complementarities between internal and external resources on product innovation and product-level creative destruction, using survey data from manufacturers in Indonesia, the Philippines, Thailand, and Vietnam. The firms with cross-functional teams are more likely to have higher impacts of exchanging engineers on product innovation and destruction. We use the interaction terms between teams and exchanging engineers as an instrumental variable for acquiring information on the past failure experience of other firms, explaining the higher level of product innovation and product-level creative destruction. Product innovation and destruction need a wider sharing of outside knowledge within a firm. * This project could not have been carried out without cooperation from the Center for Strategic and International Studies (CSIS) of Indonesia, the Philippine Institute for Development Studies (PIDS), the Sirindhorn International Institute of Technology (SIIT), Thammasat University of Thailand, and the Institute for Industry Policy and Strategy (IPSI), Ministry of Industry and Trade of Vietnam. 357 1. Introduction This paper investigates the dynamic process of the achievement of product innovation, product destruction, and product churning through studying the impact of interactions between internal and external resources on firms in developing economies. External resources have been known to play an important role in explaining the firm-level upgrading because the forward and backward production linkages between customer and supplier generate positive information externalities. In terms of firm-level performance, we do not know much about both the importance of impacts of external resources and the interactions between internal and external resources. It is especially important to ask how organizational choices within a firm interact with external linkages toward the adaptive organizations in the age of market turbulence and uncertainty for developing economies. However this might be qualitatively important, the effect of organizational choices and external linkages on product innovation has not been fully examined. The dynamic process of the industry upgrading may be affected by not only the internal resources, such as formation of teams, QC circles, or investment in R&D, but also by information exchanging with upstream and downstream firms in the connected world. Our empirical question here is to ask how important a role is played by adopting cross-functional teams when the firm exchanges information with downstream or upstream firms through engineers, in terms both of product innovation and of product-level creative destruction. To answer this question, we need to identify which types of customer-supplier relationships would interact with adopting cross-functional teams within a firm. After presenting the innovation impact of interaction between 358 adopting teams and engineers, we show which types of information would create some benefit for product innovation and creative destruction. In particular, since the interaction of internal and external resources yields a higher accessibility of information on the past failure experience of other firms, the past failure experience of other firms could explain product innovation and firm-level creative destruction. The most relevant theoretical framework is Dessein and Santos (2006), which examines how adopting team production and investment in improvement of communication technologies weakens the trade-off between local adaptation and coordination (the benefit of centralization). Thus, the findings of Dessein and Santos (2006) suggest that adopting team production lowers the coordination costs by using local information that outside engineers diffuse into the firm and which dispatched engineers to outside firms have. The other relevant literature is in the field of social learning and development. Conley and Udry (2010) shows the presence of social leaning in the context of pineapple farming in Ghana by mapping the inter-household network in a village. To do so, they relate the input fertilizer use of the information neighbor with own fertilizer use. In particular, the past failure experience of connected farmers explains the changes in input fertilizer use on growing pineapples, although of unknown technology. That paper applies the same method to input choices for another crop, also of known technology, to indicate an absence of social learning effects. On the other hand, the most relevant empirical studies are in economics of organization, including Ichniowski, Shaw, and Prennushi (1997), Bresnahan, Brynjolfsson, and Hitt (2002), Hamilton, Nickerson, and Owan (2003), Bartel, Ichniowski, and Shaw (2007) and Bloom and Van Reenen (2007). These empirical studies research the cause and consequences of the 359 introduction of new management practices in several settings, and they find significant complementarities between different types of management practices. Unlike this papers interest in establishment-level comparisons of product innovation and the combination of internal resources and external linkages, previous studies tended to concentrate on the impacts of adoption of new internal management practices on the improvement of firm-level productivity. If the engineer exchanges with customer and supplier or acquiring feedbacks from production partners were very important, the dynamic process of industry upgrading becomes closely related to sales and procurement. Especially, geographic features of industry upgrading have not been fully studied in economics of agglomeration such as Fujita and Thisse (1996, 2002) and fragmentation literature like Ando and Kimura (2009) and Kimura (2006, 2008, and 2009). Even though firms strategy of knowledge exchanges with upstream and downstream firms is restricted in each region, it is natural that the dynamics aspects of the decision of product innovation and creative destruction would vary according to a firms organizational choices. Examples include adoption of cross-functional teams or formation of a QC circle, and so on. The purpose of this paper is to examine the impacts of interaction of internal choices of knowledge sharing (internal sharing) and knowledge exchange with external partners (external sharing) on firm-level innovation. This paper proposes a new mechanism linking these two types of information sharing and product destruction as well as product creation in developing economies. It investigates the testable implications using survey data gathered from almost 800 manufacturing firms in Indonesia, Thailand, and Vietnam. We collected firm-level evidence on introducing a new product, decision of discontinuing, changes in the number of product lineups, 360 internal and external resources of information sharing, and the respondent firms own characteristics combining mail surveys and field interviews. Based on these insider variables, we implement a simple econometric analysis. East Asia is our particular focus because it is a major production site for not only local firms but also for multinationals. The most striking difference between East Asian and other developing economies is in the volume of intra-industry trade and combination of spot market and long-term transactions. The huge volume of intra-industry trade and long-term transactions between customer and supplier in East Asia brings a new way of understanding the agglomeration benefit of product creation and destruction. This work concentrates on detecting the complementary impact of adopting cross-functional teams and exchanging engineers on product innovation and creative destruction, controlling the kind of main products and the number of products. There have been few empirical research papers that precisely capture the dynamic process of creative destruction with a focus on the interaction between teams within a firm and local information or feedback which supplier and customer bring. There is also a lack of quantitative evidence. Field survey-based datasets provide new findings lacking in previous studies on industrial organization and innovation in developing economies. Moreover, most of the previous studies do not focus on the determinants of knowledge production function. The empirical result of this paper is quite intuitive. First, the firms which adopt department-wide cross-functional teams tend to have a higher elasticity of knowledge exchanges with upstream and downstream firms on product innovation and product destruction. This suggests that adopting cross-functional teams stimulates the transformation of external knowledge flows to introducing a new good as well as 361 withdrawing an existing good. Thus, it is safe to say that information sharing across teams enhances the likelihood of product churning (reshuffling new products with old ones). Second, since interacting internal and external information sharing has delivered an experience of failure of other firms, then learning an experience of failure from other firms has a positive and significant impact on product innovation and creative destruction. Finally, these results are not supported when we use a QC circle in each department as information sharing within a firm instead of cross-functional teams. Section 2 provides a brief literature review. Section 3 presents a simple theoretical framework for empirical analysis. Section 4 describes the data which we originally collected for this study. The results are presented in Section 5. Section 6 concludes the paper. 2. Related Literature We have three fields of related literature. First, the related literature is on the theory of knowledge creation through mutual learning. The theoretical background of this paper explains a model of learning and knowledge creation through face-to-face communication among different types of agents as described by Berliant and Fujita (2008, 2009), Fujita (2007), and Berliant, et al. (2006). The central concern of these models is how diversity of knowledge among members could affect the decision on collaboration and its outcome. Their fundamental modeling approach has been applied to the question of how the cultural backgrounds of members affects the city system 362 (Ottaviano and Prarolo 2009). In that sense, diversity of knowledge among firms and exchange of knowledge between firms could have aggregate implications like the city system as well as agglomerations of firms. Goyal (2007) and Jackson (2008) showed the measuring and theoretical framework of information diffusion through a network. However, it has been difficult to capture and quantify the information flow between agents one of the growing fields in development, labor, and industrial organization specifically, the study of network impact on productivity growth. The following identified some factors that contribute to such difficulty, such as the Conley and Udry (2010) study in development economics which associated the input use of informational neighbors for pineapple farmers in Ghana, as well as their geographic neighbors as affecting growth. Another is the Bandiera, Barankay, and Rasul (2009) study in labor economics where the social and workplace level connections among fruit pickers affect the changing payment system on productivity. Second, this paper is related to international technology transfer. Productivity growth could differ between firms depending on the types of production or intellectual linkages that they have. It is also true that productivity effects changes on entry or exit, especially when the hub-firm is located central to the production network. Given this situation, the dense network in East Asia could provide new insight on the causes and consequences of information diffusion among local firms. This paper aims to study the innovation impacts of mutual knowledge exchanges among inter-connected firms in the field of industrial development. This paper is also related to the field of international technology diffusion and international knowledge production. Keller (2000) gave an overview of the cause and consequences of technology diffusion across countries. Kerr (2008, 2010) and Kerr and Lincoln (2010) studied the role of ethnic 363 scientific communities on technology diffusion to match ethnic scientist names with individual patent records. Therefore, information exchanges between demand and technologies spill over within the (international) production chain. Information exchanges are not always in "encoded" form (Polanyi 1966, 1967). Communication between firms and their partners is not well-facilitated when demand and technologies become complicated. The same is true with knowledge production in academia. First, team production achieves more cited research than individuals do (Wuchty, Jones, and Uzzi, 2007) across all fields of natural science, social science, and arts-humanities. Second, teamwork in science is done by not only multi-university collaborations but also by stratified groups (Jones, Wuchty, and Uzzi, 2008). Rosenblat and Mobius (2004) studied the impacts of rising Internet usage on international collaboration within a similar field. Third, this paper is related to organizational economics and industrial organization in networked economy. Bloom and van Reenen (2007) emphasize that differences in management practices play a crucial role in productivity dispersion within a country and across countries. Bloom, et al. (2011) also provides the experimental evidence of modern management practices on productivity upgrading among Indian textile factories. Findings showed that treated factories achieve not only product upgrading but also more profitability than control factories do. It is difficult to identify the impact of adoption of modern management practices as well as changing managerial abilities of managers. This was subjected to further testing focus on the background of top management. Hortacsu and Syverson (2009) suggested the importance of intangible inputs like managerial oversight within the firm to show that vertical ownership is not often used to facilitate transfers of goods in the production chain. 364 They concluded that the central motivation of owning production chains is the more efficient transfer of knowledge of production and information on markets. This motivation is closely related to the concept of adaptive organization, such as Dessein and Santos (2006) theoretically analyzes on the complementarities between the level of adaptation to a changing environment, coordination, and the extent of specialization. Production chains within firms help a firm to collect information on the market and use it for production and vice versa. Therefore, since managerial abilities have centralized local information, these abilities play a key role as a technology of product and process innovations within the firm. 3. Theoretical Framework We present a hypothesis to explain the dynamic process of industrial upgrading based on customer-supplier relationships interacting with internal resources. To do this, we would like to present an intuitive view following Dessein and Santos (2006) that explains why improvements in communication technologies can reduce the trade-off between adaptation and coordination. Consider two different manufacturers in terms of investment in improving communication technologies across departments in a firm: That is, one manufacturer invests in improving communication technologies to share the information within a firm while the other manufacturer does not invest. We assume that local information in manufacturing lines is provided by exchanging engineers between customer and supplier. If this is true, the manufacturers investing on improvements in 365 communication technologies are likely to enhance the impact of external linkages on product innovation. This framework derives the hypothesis that, if internal and external resources could be a complement in developing economies such as Indonesia, the Philippines, Thailand, and Vietnam, then such assemblers in these countries will tend to achieve product innovation. The implication of this example is related to the finding of Asanuma (1989). The central proposition of this paper is related to Conley and Udry (2010), which presents the presence of social leaning in the context of pineapple farming in Ghana by drawing an inter-household network in a village. They find that the past failure experience of the information neighborhood has affected the decision of input use rather than the past success experience of the information neighbor. We add the implication of Conley and Udry (2010) to our framework. In short, this framework suggests the following two implications: (1) the marginal benefit of exchanging engineers on product innovation and destruction is higher for firms which adopt cross-functional teams across departments, than for firms which do not adopt such internal activities, and (2) sharing information of the past failure experience of other firms has a significant impact on product innovation. In summary, we can derive the following testable hypothesis based on this framework. Hypothesis 1: The probability of product innovation and product destruction for firms which have adopted cross-functional teams and exchanged engineers with their partners is higher than for firms which have not adopted cross-functional teams. 366 Hypothesis 2: The failure experiences of other firms could diffuse into a firm through exchanging engineers with the connected supplier and customer. The probability of product innovation and product destruction for firms which learn about the failure experience of other firms through adopting cross-functional teams and exchanging engineers with their partners is higher than with firms which have not learned about the failure experience of other firms. These hypotheses are empirically tested in Section 4 and their robustness is also checked. 4. Data 4.1. Sampling Based on in-depth interviews with 794 firms, we constructed innovation, external linkages, internal linkages, and other firm-specific variables in four countries: Indonesia (JABODETABEK area), the Philippines (CARABARZON area), Thailand (Greater Bangkok area), and Vietnam (Hanoi and Ho Chi Minh City). We define product innovation, including the change in package/appearance design, introduction of a new good based on existing technology, and introduction of a new good based on new technology. We also define process innovation, including the introduction of new goods, buying new machines, process improvement, organizational changes, finding a new market, and finding a new source of procurement. 367 4.2. Product Innovation, Creative Destruction, and Main Explanatory Variables In our survey, we asked about a new variable, such as an effective knowledge sharing system for the introduction of a new product and quality control. To achieve product innovation and process innovation, each firm utilizes information on external linkages and combines it with internal knowledge in the firm. of knowledge sharing within the firm. The key point is the tool We have three types of new variables on knowledge sharing with in the firm: (1) a QC circle which diffuses production-related information by word of mouth within the small groups/communities, (2) a cross-functional team across departments, and (3) department-wide IT connections. These three types of knowledge sharing systems will start from the research department to the engineering/production site to human resources, and from the department of market research to logistics/distribution. Especially for the cross-functional team, we asked as to which departments are involved in a cross-functional team that the survey respondent organizes to achieve introduction of a new product and quality control. Another interesting feature of the survey this year is that we asked whether the establishment shares information on the cases/experiences of success/failure of itself or other firms. Sharing the success/failure information could be valuable if the firm faces market turbulence to deal with disequilibria. Since some bottlenecks usually exist in the market or workplace, the managers response would normally reflect the existence of misallocations or maladjustments in the distribution of resources. We hypothesize that an internal knowledge sharing system drives the product and process innovation. Table 1 presents the summary statistics of the innovation variables. The sample firms consist of 41.2% of firms that achieved significant change in packaging or appearance design, 58.3% of firms that achieved significant improvement of an existing 368 product, 42.4% of firms that experienced development of a totally new product based on the existing technologies, and 24.9% of firms that experienced development of a totally new product based on the new technologies. statistics of product churning. Table 1 also shows the summary The sample firms consist of 21.9% of firms that discontinued a product, fewer than 10% of firms that decreased their number of products, 32.9% of firms that did not change their number of product types, and 57.8% of firms that increased the number of product types. On the other hand, 74% of firms dispatched their in-house engineers to main upstream and downstream firms or accepted engineers from main upstream and downstream firms. A cross-functional team across departments within a firm was adopted by 10% of firms while 52.5% of firms established a QC circle within a department. Table 1: Summary Statistics of Product Innovation and Main Explanatory Variables Product innovation Significant change in packaging or appearance design Significant improvement of an existing product Development of a totally new product based on the existing technologies Development of a totally new product based on the new technologies Shipping new product Existing market where your establishment is operating New market to your establishment Product churning Discontinue a product The number of product types decreased between 2009 and 2010 The number of product types is the same between 2009 and 2010 The number of product types increased between 2009 and 2010 Information sharing on experiences of success and failure Success of own establishment Failure of own establishment Success of other firms Failure of other firms 369 No. Obs Mea n Std. Dev. 781 787 0.412 0.583 0.493 0.493 787 0.424 0.495 782 0.249 0.433 695 686 0.888 0.618 0.316 0.486 789 790 790 790 0.219 0.092 0.329 0.578 0.414 0.290 0.470 0.494 794 794 794 794 0.675 0.228 0.263 0.178 0.469 0.420 0.441 0.382 Table 1 (continued) Main regressors Adopting cross-functional team for introduction of a new product Exchanges of engineer with main upstream or downstream firms Cross-functional Team*Exchanges of engineers QC circle QC circle*Exchanges of engineers Source: ERIA Establishment Survey 2010. 794 794 794 794 794 0.101 0.743 0.083 0.529 0.417 0.301 0.437 0.276 0.499 0.493 Table 1 also presents the establishments activities of information sharing on experiences of success and failure of their own and other firms. It is relatively more easy to obtain the information of past experience of success of own establishment than the information of past experience of success of other firms: That is, 67.5% of firms share the information of past experience of success of own establishment while 26.3% of firms access the information of past experience of success of other firms. On the other hand, it is relatively difficult to share the information of past experience of failure of own establishment and other firms: That is, even though 22.8% of firms share the information of past experience of failure of own establishment, only 17.8% of firms can access the information of past experience of failure of other firms. 4.3. Firm Characteristics The sample industries come from manufacturing. Average age is 16.4 years. Since there are younger and older firms, the standard deviation of age among the sample is high. Of the total number surveyed, approximately 63.2% are local firms, 23.1% are multinational enterprises, and the remaining 13.7% are joint-venture firms. A firm is classified by 11 categories of establishment size. Although firm size distributes across small (1-19 persons), medium (100 persons), and very large (2000 persons and more), our survey collected the information about small and medium-sized firms from 20 to 370 299 persons. A firm is also classified by 17 categories of manufacturing industry. Except for the not classified sample, firms in metal products, electronics, components, machinery, and automobile manufacturing and auto parts and components dominate the sample firms. The main product is classified by raw materials, raw material processing, components and parts, and final products. Half of the sample (49.3% of firms) produces the final product. Components and parts are the main product of 30.2% of firms. The remaining firms engage in raw material processing and selling raw materials. The number of product types is also dispersed. Single-product firms make up only 13.5% of the sample, while the peak is 11 or more types of product, 38.5% of firms. Table 2: Summary Statistics of Firm Characteristics Firm age Location The Philippines Indonesia Thailand Hanoi Ho Chi Minh City Capital structure 100% locally owned 100% foreign owned Joint venture Establishment size 1-19 persons 20-49 persons 50-99 persons 100-199 persons 200-299 persons 300-399 persons 400-499 persons 500-999 persons 1000-1499 persons 1500-1999 persons 2000 and above Industry Food, beverage, tobacco Textiles Apparel, leather Wood, wood products 371 No. Obs 770 Mean 16.440 Std. Dev. 13.411 794 794 794 794 794 0.297 0.185 0.131 0.195 0.191 0.457 0.389 0.338 0.397 0.394 793 793 793 0.632 0.231 0.137 0.483 0.422 0.345 790 790 790 790 790 790 790 790 790 790 790 0.058 0.171 0.151 0.190 0.109 0.075 0.041 0.104 0.035 0.018 0.049 0.234 0.377 0.358 0.392 0.312 0.263 0.197 0.305 0.185 0.132 0.217 760 760 760 760 0.091 0.047 0.046 0.011 0.287 0.213 0.210 0.102 Table 2 (continued) Paper, paper products, printing Coal, petroleum products Chemicals, chemical products Plastic, rubber products Other non-metallic mineral products Iron, steel Non-ferrous metals Metal products Machinery, equipment, tools Computers, computer parts Other electronics, components Precision instrument Automobile, auto parts Other transportation equipments and parts Other Main product Raw materials Raw material processing Components and parts Final products The number of product types Single 2 to 5 6 to 10 11 or more The ratio of R&D expenditure to sales No expenditure Less than 0.5% 0.5 to 0.99% 1% and more The date of starting R&D activities Not yet Before 1990 1990-1994 1995-1999 2000-2004 2005 and later Source: ERIA Establishment Survey 2010. No. Obs 760 760 760 760 760 760 760 760 760 760 760 760 760 760 760 Mean 0.030 0.005 0.033 0.097 0.026 0.039 0.003 0.130 0.087 0.013 0.113 0.018 0.047 0.026 0.136 Std.Dev. 0.171 0.072 0.178 0.297 0.160 0.195 0.051 0.337 0.282 0.114 0.317 0.135 0.213 0.160 0.343 785 785 785 785 0.043 0.162 0.302 0.493 0.204 0.368 0.459 0.500 780 780 780 780 0.135 0.286 0.195 0.385 0.342 0.452 0.396 0.487 772 772 772 772 0.545 0.196 0.131 0.128 0.498 0.397 0.337 0.335 776 776 776 776 776 776 0.521 0.084 0.039 0.080 0.093 0.184 0.500 0.277 0.193 0.271 0.290 0.388 The other important firm characteristic is the R&D activities. sample firms do not expend on R&D activities. expenditure ratio of less than 0.5% of total sales. More than half of About 20% of firms have an R&D Firms with an R&D expenditure ratio of less than 1% of total sales account for 13.1% of the sample. Firms with an R&D expenditure ratio of more than 1% of total sales constitute 12.8% of the sample. 372 4.4. Preliminary Findings What are the mechanisms underlying the dynamic process of product innovation and creative destruction in terms of utilizing internal and external resources? First we discuss the distribution of the propensity to achieve product innovation and product churning by information sharing activities within and across firms: That is, exchanging engineers with their production partners upstream or downstream and adopting cross-functional teams across departments. Second we show the distribution of the propensity to achieve innovation for firms holding two types of information sharing activities. Table 3 shows that the probability of achieving product innovation is higher for firms exchanging engineers with their main production partners than for firms that do not exchange engineers with their main production partners. In particular, the probability of achieving product churning is also higher for firms exchanging engineers with their main production partners. They aggressively discontinue a product and introduce a new product. Thus, the probability that the number of products has not been changed is lower for such firms (28.4% of firms) than for firms that do not exchange engineers with their main production partners (45.8% of firms). In sum, firms exchanging knowledge through dispatching or accepting engineers are likely to achieve both product innovation and creative destruction. The propensity of both decreasing and increasing the number of product lineups is higher for firms dispatching or accepting engineers with their partners. Such firms are also likely to access the information of past experience of failure of other firms. In turn, firms adopting cross-functional teams are likely to achieve product innovation. They are also likely to discontinue a product and increase the number of 373 product lineups. Firms adopting cross-functional teams across departments are likely to share the information on their own past experience of success and failure. It is worth saying that such firms are also likely to share the information of past experience of failure of other firms. Thus, firms interacting with these two types of information sharing within and across firms are more likely to achieve product innovation, discontinue a product, and increase the number of product lineups than are firms without holding two types of information sharing. In addition, firms interacting on two types of information sharing activities within and across firms are likely to share the past experience of failure of other firms. We assume that information on the past failure experience of other firms could play an important role in achieving product innovation and product churning. We check whether these arguments are justified under controlling differences in many aspects of firm characteristics in the remaining section. 374 Table 3: Probability of Product Innovation by Exchanges of Engineers and Adopting Cross-Functional Team Exchanges of engineer with main upstream or downstream firms Yes No Product innovation Significant change in packaging or appearance design Significant improvement of an existing product Development of a totally new product based on the existing technologies Development of a totally new product based on the new technologies Shipping new product Existing market where your establishment is operating New market to your establishment Product churning Discontinue a product The number of product types decreased between 2009 and 2010 The number of product types is same between 2009 and 2010 The number of product types increased between 2009 and 2010 Information sharing on experiences of success and failure Success of own establishment Failure of own establishment Success of other firms Failure of other firms Source: ERIA Establishment Survey 2010. 5. Results 5.1. Baseline Results Adopting cross-functional team for introduction of a new product Yes No Exchanges*Team Yes No 0.440 0.332 0.650 0.385 0.667 0.389 0.650 0.391 0.625 0.579 0.667 0.576 0.471 0.291 0.588 0.406 0.606 0.408 0.280 0.160 0.463 0.225 0.470 0.229 0.886 0.895 0.972 0.878 0.967 0.880 0.611 0.644 0.592 0.621 0.574 0.622 0.227 0.109 0.196 0.044 0.338 0.075 0.206 0.094 0.364 0.091 0.206 0.093 0.284 0.458 0.300 0.332 0.288 0.333 0.606 0.498 0.625 0.573 0.621 0.575 0.664 0.244 0.300 0.222 0.706 0.181 0.157 0.049 0.863 0.250 0.238 0.200 0.654 0.225 0.266 0.175 0.879 0.288 0.258 0.227 0.657 0.223 0.264 0.173 Table 4 shows the regression results of how adopting cross-functional teams enhances the innovation impacts of exchanging engineers with upstream suppliers or downstream customers. The dependent variable is the binomial choice of several types of product innovation: (1) significant change in package and appearance design, (2) 375 improvement of existing product, (3) introducing a new product based on existing technologies to the firm, and (4) introducing a new product based on new technologies to the firm. In addition, the simple sum of these several types of product innovation is used as a likelihood of firm-level product innovation. The main explanatory variable is the interaction terms between adopting cross-functional teams within a firm and exchanging engineers across firms. The firms basic characteristics shown in Table 2 are used as control variables. Columns 1 to 4 of Table 2 show the marginal effect of Probit estimates: the interaction effects of department-wide cross-functional teams and engineer exchanges on product innovation. Column 1 of Table 2 suggests that the coefficient for interaction terms between knowledge sharing within and across firms is 0.309 with a robust standard error of 0.074. This result suggests that a firm that adopts cross-functional teams and dispatching/accepting engineers, on average, changes in packaging and designing with a higher probability than firms that have not interacted with internal and external resources. This result is robust even after controlling for additional explanatory variables, in particular, exchanging engineers. This result suggests that if firms dispatch their in-house engineers to upstream and downstream firms or accept engineers from upstream and downstream firms, then those firms could receive more benefit from adopting cross-functional teams in terms of changing packaging, design, and appearance. Investment in communication technologies across departments within a firm enhances the impact of external linkages on product innovation. Column 2 of Table 4 suggests that the coefficient for interaction terms between knowledge sharing within and across firms is 0.176 with a robust standard error of 0.063. This result means that adopting 376 cross-functional teams and dispatching/accepting engineers, on average, significantly improves existing products with a higher probability compared with firms that have not interacted with internal and external resources. Column 3 of Table 4 suggests that the coefficient for interaction terms between knowledge sharing within and across firms is 0.206 with a robust standard error of 0.079. This result means that adopting cross-functional teams and dispatching/accepting engineers, on average, introduces a new product based on existing technologies with a higher probability compared with firms that have not interacted with internal and external resources. Column 4 of Table 4 indicates that the coefficient for interaction terms between knowledge sharing within and across firms is 0.199 with a robust standard error of 0.077. This result means that adopting cross-functional teams and dispatching/accepting engineers, on average, introduces a new product based on new technologies with a higher probability compared with firms that have not interacted with internal and external resources. of the Ordered Logit model. Finally, Column 5 of Table 4 presents the results The interaction term has a statistically significant impact to explain the likelihood of firm-level product innovation. Firms with interacting internal and external resources are more likely to increase the four types of product innovation. In summary, given the situation of exchanging engineers across production partners, adopting cross-functional teams within a firm would increase the impact of knowledge flows from exchanging engineers on several types of product innovation. 377 Table 4: Effects of Interaction of Adopting Cross-functional Teams and Exchange of Engineers on Product Innovation (1) (2) (3) (4) (5) Probit (Marginal Effects) Ordered Logit Dependent variables: Product innovation Significant Development of Development of Significant change in a totally new a totally new The sum of improvement packaging or product based product based product of an existing appearance on the existing on the new innovation product design technologies technologies Team*Exchanges 0.309** 0.176** 0.206** 0.199** 1.215** [0.074] [0.063] [0.079] [0.077] [0.347] Exchanges of engineers 0.051 0.077 0.164** 0.125** 0.655** [0.058] [0.058] [0.054] [0.037] [0.239] Firm age 0.002 -0.001 0.002 -0.001 0.001 [0.002] [0.002] [0.002] [0.001] [0.006] Indonesia -0.06 -0.058 -0.013 0.001 -0.097 [0.075] [0.081] [0.076] [0.061] [0.339] Thailand 0.229** 0.249** 0.226** 0.145+ 1.212** [0.078] [0.053] [0.078] [0.078] [0.291] Hanoi 0.109 0.237** 0.221** 0.003 0.742* [0.078] [0.062] [0.077] [0.060] [0.304] Ho Chi Minh City 0.094 0.338** -0.053 -0.098* 0.434+ [0.075] [0.050] [0.075] [0.049] [0.258] 100% foreign owned 0.053 -0.011 0.022 -0.022 0.098 [0.053] [0.056] [0.055] [0.042] [0.191] Joint venture 0.083 -0.033 0.097 0.093 0.344 [0.066] [0.068] [0.065] [0.059] [0.262] 20-49 persons 0.15 0.048 0.094 0.048 0.15 [0.099] [0.086] [0.097] [0.093] [0.308] 50-99 persons 0.177+ 0.099 0.089 0.089 0.365 [0.098] [0.083] [0.098] [0.099] [0.304] 100-199 persons 0.203* 0.145+ 0.109 0.188+ 0.636* [0.095] [0.080] [0.094] [0.102] [0.293] 200-299 persons 0.235* 0.204** 0.294** 0.306* 1.071** [0.104] [0.078] [0.097] [0.122] [0.326] 300-399 persons 0.132 -0.016 0.077 0.09 0.228 [0.118] [0.105] [0.111] [0.117] [0.342] 400-499 persons 0.198 0.046 0.187 0.244 0.511 [0.127] [0.121] [0.130] [0.149] [0.489] 500-999 persons 0.277** 0.161+ 0.086 0.114 0.656* [0.103] [0.089] [0.109] [0.117] [0.331] 1000-1499 persons 0.319** 0.172+ 0.066 0.262+ 0.834 [0.123] [0.103] [0.141] [0.158] [0.531] 1500-1999 persons 0.292+ 0.214+ 0.238 0.272 0.946 [0.160] [0.124] [0.171] [0.193] [0.622] 2000 and above 0.291* 0.172 0.146 0.352* 0.888+ [0.139] [0.121] [0.146] [0.164] [0.473] Raw material processing -0.084 -0.121 -0.021 -0.143* -0.49 [0.111] [0.123] [0.115] [0.060] [0.499] Components and parts -0.094 0.036 0.032 -0.116 -0.054 [0.109] [0.114] [0.113] [0.076] [0.467] Final products 0.002 0.044 0.042 -0.133 0.007 [0.454] [0.107] [0.109] [0.106] [0.084] 378 Table 4 (Continued) (1) (2) (3) (4) 0.058 -0.039 0.056 0.074 [0.073] [0.069] [0.071] [0.064] 6 to 10 0.125 0.129+ 0.185* 0.076 [0.082] [0.071] [0.079] [0.074] 11 or more 0.051 0.045 0.065 0.107+ [0.072] [0.066] [0.071] [0.063] Less than 0.5% 0.019 0.066 0.145+ 0.024 [0.075] [0.076] [0.078] [0.065] 0.5 to 0.99% 0.178* 0.123 0.237** 0.191* [0.090] [0.085] [0.089] [0.093] 1% and more 0.038 0.163* 0.134 0.177+ [0.092] [0.079] [0.095] [0.097] Before 1990 -0.03 0.098 -0.093 -0.116* [0.097] [0.095] [0.092] [0.051] 1990-1994 0.017 0.247** -0.161 -0.029 [0.137] [0.080] [0.112] [0.095] 1995-1999 0.122 0.026 0.067 0.093 [0.093] [0.094] [0.093] [0.083] 2000-2004 0.038 -0.008 -0.112 -0.071 [0.093] [0.097] [0.087] [0.064] 2005 and later 0.01 -0.074 -0.162* -0.126* [0.083] [0.089] [0.078] [0.052] Observations 687 694 695 686 Note: Robust standard errors in brackets. + significant at 10%; * significant at 5%; ** significant at 1%. Source: ERIA Establishment Survey 2010. 2 to 5 (5) 0.247 [0.279] 0.704* [0.305] 0.438 [0.282] 0.352 [0.270] 0.844* [0.332] 0.591+ [0.337] -0.304 [0.331] 0.294 [0.598] 0.391 [0.353] -0.275 [0.349] -0.475 [0.297] 691 Next, we turn to product destruction and the number of product lineups. Table 5 shows how adopting cross-functional teams changes the impacts of exchanging engineers on the decision of discontinuing a product and decreasing or increasing the number of products. Column 1 of Table 5 suggests that a cross-functional team increases the impact of external linkages on discontinuing a product. Column 2 of Table 5 shows no significant evidence that a cross-functional team changes the impact of external linkages on decreasing the number of total product lineups. Adopting cross-functional teams decreases the impact of external linkages on a firms decision that the number of products is unchanged (Column 3 of Table 5). Column 4 of Table 5 also shows there is no evidence that a cross-functional team changes the impact of external linkages on increasing the number of total product lineups. In sum, both 379 Table 4 and Table 5 show that interaction between teams within a firm and linkages across firms stimulates both product innovation and destruction. Even though the interaction could affect this firm-level creative destruction, it does not change the number of product types. Table 5: Effects of Interaction of Adopting Teams and Exchanging Engineers on Product Churning (1) Discontinue a product Team*Exchanges Exchanges of engineers Firm age Indonesia Thailand Hanoi Ho Chi Minh City 100% foreign owned Joint venture 20-49 persons 50-99 persons 100-199 persons 200-299 persons 300-399 persons 400-499 persons 500-999 persons 1000-1499 persons 1500-1999 persons 0.212** [0.081] 0.008 [0.043] 0.002+ [0.001] 0.378** [0.082] 0.043 [0.075] 0.289** [0.082] 0.041 [0.065] 0.145** [0.048] 0.07 [0.054] 0.099 [0.111] 0.187 [0.126] 0.07 [0.102] 0.016 [0.098] 0.207 [0.139] 0.22 [0.165] 0.08 [0.118] 0.345* [0.167] 0.064 [0.156] (2) (3) Probit (Marginal Effects) Dependent variables: Product churning The number of The number of product types product types is decreased same 0.058 -0.139* [0.054] [0.057] 0.053** -0.042 [0.020] [0.055] 0 0.004** [0.001] [0.001] 0.024 -0.240** [0.048] [0.043] 0.049 -0.153** [0.053] [0.055] 0.024 -0.215** [0.042] [0.055] 0.217** -0.359** [0.069] [0.037] 0.02 -0.043 [0.025] [0.050] -0.024 0.094 [0.026] [0.066] -0.018 -0.026 [0.032] [0.083] -0.013 -0.034 [0.034] [0.083] -0.045+ -0.084 [0.026] [0.080] -0.051* -0.021 [0.020] [0.095] -0.047* -0.136+ [0.021] [0.080] -0.015 -0.05 [0.041] [0.116] -0.060** -0.026 [0.018] [0.102] -0.017 -0.108 [0.047] [0.111] -0.007 -0.222* [0.075] [0.097] 380 (4) The number of product types increased 0.103 [0.073] -0.008 [0.059] -0.005** [0.002] 0.284** [0.057] 0.132+ [0.072] 0.195** [0.070] 0.213** [0.065] 0.011 [0.054] -0.062 [0.067] 0.068 [0.094] 0.086 [0.092] 0.196* [0.084] 0.142 [0.095] 0.236** [0.084] 0.084 [0.122] 0.187+ [0.096] 0.167 [0.120] 0.290* [0.114] Table 10. (Continued) (1) (2) (3) -0.004 -0.102 [0.118] [0.116] Raw material processing -0.122** 0.073 0.01 [0.046] [0.073] [0.099] Components and parts -0.185** -0.046 0.034 [0.055] [0.037] [0.095] Final products -0.099 -0.037 0.017 [0.070] [0.046] [0.087] 2 to 5 -0.014 0.008 -0.144* [0.048] [0.032] [0.057] 6 to 10 0.015 0.004 -0.179** [0.056] [0.034] [0.059] 11 or more 0.036 -0.014 -0.167** [0.051] [0.030] [0.060] Less than 0.5% -0.097* -0.060** 0.047 [0.044] [0.019] [0.078] 0.5 to 0.99% -0.077 -0.073** 0.259** [0.052] [0.016] [0.099] 1% and more 0.032 -0.042+ -0.025 [0.072] [0.023] [0.095] Before 1990 -0.117* 0.136 -0.227** [0.046] [0.092] [0.056] 1990-1994 0.029 0.137 -0.233** [0.102] [0.121] [0.059] 1995-1999 0.171+ 0.065 -0.227** [0.091] [0.067] [0.056] 2000-2004 0.038 0.008 -0.160* [0.077] [0.048] [0.067] 2005 and later 0.189* 0.073 -0.108 [0.087] [0.054] [0.073] Observations 697 660 700 Note: Robust standard errors in brackets. + significant at 10%; * significant at 5%; ** significant at 1%. Source: ERIA Establishment Survey 2010. 2000 and above 381 (4) 0.284** [0.099] -0.114 [0.108] 0.027 [0.104] 0.014 [0.098] 0.172* [0.069] 0.228** [0.071] 0.216** [0.070] 0.098 [0.072] -0.067 [0.090] 0.148+ [0.086] 0.123 [0.096] 0.171 [0.108] 0.185* [0.080] 0.156+ [0.083] -0.004 [0.083] 696 5.2. Internal and External Resources Deliver the Past Experience of Failure of Other Firms We turn to the question of which types of information that cross-functional teams within a firm and exchanging engineers across firms stimulate for sharing. Baseline results present that internal resources increase the impact of external resources on product innovation and destruction. Baseline results suggest a complementary relationship between these resources within and across firms. It is natural to ask about the types of information that internal and external resources deriver and diffuse. Our goal in this estimation is to understand which types of past experience of own and other firms correlate with interactions of adopting cross-functional teams and dispatching engineers to other firms or accepting engineers from other firms. Table 6 summarizes how adoption of cross-functional teams enhances the impact of exchanging engineers on acquiring the information of past success and failure. Columns 1 and 2 of Table 6 show that the interaction terms between cross-functional teams within a firm and exchanging engineers across firms have positive and significant impacts on sharing the information of past success and failure of the own establishment. The most important finding is in comparing Columns 3 and 4 of Table 6. Adopting cross-functional teams does not increase the impact of external linkages across firms on sharing the information of the past success of other firms (Column 3). On the other hand, teams within a firm increase the impact of external linkages across firms on sharing the past failure experience of other firms (Column 4). Since external linkages have delivered the information of the past success and failure of other firms, these results indicate that firms with cross-functional teams and external linkages through dispatching and accepting engineers are likely to share the past failure experience of other firms. These internal and external resources are found to be a better predictor of sharing the 382 past failure experience of other firms than of sharing the past success experience of other firms. Table 6: Effects of Interaction of Adopting Teams and Exchanging Engineers on Information Sharing of Past Success and Failure (1) Team*Exchanges Exchanges of engineers Firm age Indonesia Thailand Hanoi Ho Chi Minh City 100% foreign owned Joint venture 20-49 persons 50-99 persons 100-199 persons 200-299 persons 300-399 persons 400-499 persons 500-999 persons 1000-1499 persons 1500-1999 persons 2000 and above (2) (3) (4) Probit (Marginal Effects) Dependent variables: Information sharing on experiences of success and failure Success of own Failure of own Success of Failure of establishment establishment other firms other firms -0.012 0.243** 0.121+ 0.174* [0.064] [0.041] [0.073] [0.075] -0.06 0.06 0.107* 0.085** [0.050] [0.041] [0.043] [0.032] 0.002 -0.001 -0.001 -0.001 [0.002] [0.001] [0.001] [0.001] -0.254** -0.085+ 0.077 -0.04 [0.077] [0.050] [0.076] [0.049] 0.04 0.142+ 0.043 0.200* [0.071] [0.074] [0.072] [0.083] 0.006 -0.104* -0.190** 0.119 [0.071] [0.050] [0.047] [0.074] -0.137+ 0.191** 0.313** 0.526** [0.074] [0.072] [0.074] [0.080] -0.029 0.008 0.025 -0.009 [0.048] [0.044] [0.045] [0.033] 0.021 0.011 -0.074 0.032 [0.059] [0.052] [0.053] [0.045] 0.003 0.063 -0.085 -0.045 [0.089] [0.082] [0.068] [0.053] 0.118 0.144 -0.084 0.037 [0.075] [0.089] [0.067] [0.071] 0.11 -0.026 -0.07 0.004 [0.077] [0.069] [0.069] [0.060] -0.003 0.052 -0.074 -0.057 [0.097] [0.089] [0.072] [0.049] 0.042 0.068 -0.082 0 [0.096] [0.097] [0.074] [0.070] 0.107 -0.065 -0.140* 0.055 [0.102] [0.081] [0.071] [0.089] 0.099 -0.064 -0.025 -0.067 [0.086] [0.069] [0.083] [0.045] -0.09 -0.04 0.059 -0.108** [0.135] [0.106] [0.126] [0.034] -0.125 -0.106 -0.05 0.016 [0.174] [0.121] [0.128] [0.133] 0.023 -0.096 -0.044 -0.021 [0.134] [0.083] [0.114] [0.080] 383 Table 6 (continued) Raw material processing Components and parts Final products 2 to 5 6 to 10 11 or more Less than 0.5% 0.5 to 0.99% 1% and more Before 1990 1990-1994 1995-1999 2000-2004 2005 and later Observations (1) 0 [0.104] -0.053 [0.105] -0.118 [0.095] -0.04 [0.066] 0.073 [0.069] -0.045 [0.066] 0.058 [0.068] 0.078 [0.072] 0.068 [0.077] -0.056 [0.095] -0.214 [0.139] -0.058 [0.090] 0.073 [0.080] -0.014 [0.078] 702 (2) 0.15 [0.117] 0.006 [0.092] 0.104 [0.084] -0.025 [0.054] 0.026 [0.065] 0.012 [0.056] -0.073 [0.050] -0.134** [0.045] -0.124* [0.049] 0.108 [0.093] -0.012 [0.111] 0.032 [0.083] 0.047 [0.081] 0.021 [0.068] 696 (3) 0.059 [0.100] 0.115 [0.098] 0.083 [0.086] 0.064 [0.065] 0.046 [0.076] 0.016 [0.062] -0.079 [0.056] -0.04 [0.070] 0.036 [0.084] 0.133 [0.102] 0.189 [0.144] 0.167+ [0.096] -0.046 [0.076] 0.019 [0.073] 702 (4) 0.005 [0.078] 0.055 [0.080] 0.072 [0.069] -0.052 [0.040] -0.111** [0.032] -0.100* [0.042] 0.157* [0.066] 0.190* [0.091] -0.007 [0.061] -0.016 [0.058] -0.05 [0.058] -0.079* [0.034] -0.005 [0.056] -0.090** [0.034] 692 Note: Robust standard errors in brackets. + significant at 10%; * significant at 5%; ** significant at 1%. Source: ERIA Establishment Survey 2010. 5.3. Sharing Past Failure Experience of Other Firms Correlated with Firm-Level Creative Destruction In this subsection, we verify the impacts of sharing the past failure experience of other firms on product innovation, product destruction, and product churning: that is, firm-level creative destruction. If firms could utilize other firms past failure experience in the market, sharing the information would help to shape their innovation strategy. We assume that the past failure experience of other firms comes from the main production partners. Keeping long-term relationships with existing suppliers and 384 partners is efficient not only for accumulating relationship-specific assets but also for collecting the past failure experience of other firms among connected firms. This type of information usually does not diffuse publicly compared to the past success experience. Thus, connected firms, for example, firms that dispatch engineers to their production partners or accept engineers from their production partners, could receive more benefit than firms that do not connect. This creates product differentiation, churning, and firm-level product destruction as the sum of product creation and destruction. In addition, we make the assumption that firm-level creative destruction needs the adoption of cross-functional teams within a firm as well as the diffusion of information across firms. We use interaction term between adopting cross-functional teams within a firm and exchanging engineers with upstream suppliers and downstream customers as an instrumental variable for the main explanatory variable: sharing the past failure experience of other firms. We expect that firms interacting with these internal and external resources could examine the past failure experience of other firms, and that they would introduce a new product and discontinue an existing product. Thus, this leads to product reallocation and firm-level creative destruction. Table 7 examines this idea, showing the IV estimates of the impact of the past failure experience of other firms on product innovation. Column 1 of Table 7 presents IV-Probit estimates for firms sharing other firms past experience of failure. The effect of sharing other firms failure experience within a firm on changes in packaging and appearance design is significantly positive. Column 2 of Table 7 shows that the sharing other firms past failure experience within a firm has a positive and significant impact on improving existing products. Column 3 of Table 7 also shows the positive 385 and significant impact of sharing other firms past failure experience within a firm on introducing a new product based on existing technologies at the firm. In addition, sharing other firms past failure experience also significantly explains the introduction of a new product based on new technologies (Column 4 of Table 7). This suggests that sharing the past failure experience of other firms could affect the choice of new technologies. Column 5 of Table 7 presents that firms which share the past failure experience of other firms are likely to have a higher innovation tendency. Table 7: Effects of Information Sharing of Past Failure of Other Firms on Product Innovation (1) Failure of other firms Firm age Indonesia Thailand Hanoi Ho Chi Minh City 100% foreign owned Joint venture 20-49 persons 50-99 persons 100-199 persons 200-299 persons 300-399 persons 400-499 persons Significant change in packaging or appearance design 2.235** [0.687] 0.004 [0.004] -0.087 [0.202] 0.07 [0.254] -0.114 [0.157] -1.009** [0.371] 0.106 [0.123] 0.059 [0.167] 0.374 [0.231] 0.253 [0.258] 0.377 [0.251] 0.681* [0.271] 0.253 [0.287] 0.223 [0.354] (2) (3) (4) IV-Probit Dependent variables: Product innovation Development Development Significant of a totally of a totally improvement new product new product of an existing based on the based on the product existing new technologies technologies 2.187** 2.716** 2.799** [0.629] [0.262] [0.206] 0 0.003 0 [0.004] [0.003] [0.004] -0.045 0.074 -0.044 [0.196] [0.159] [0.042] 0.114* 0.116* 0.107+ [0.274] [0.055] [0.180] 0.042 0.071 -0.218 [0.215] [0.157] [0.041] -0.323 0.440** 0.444** [0.050] [0.193] [0.050] -0.006 0.046 -0.005 [0.127] [0.036] [0.036] 0.041 0.04 0.043 [0.163] [0.040] [0.144] -0.034 -0.032 -0.044 [0.197] [0.064] [0.218] 0.123 0.032 0.018 [0.068] [0.206] [0.071] 0.001 0.136 0.276 [0.067] [0.194] [0.229] 0.648* 0.619* -0.092 [0.258] [0.076] [0.078] 0 0.105 -0.01 [0.079] [0.079] [0.254] 0.079 0.036 0.069 [0.088] [0.089] [0.317] 386 (5) IV-Regression The sum of product innovation 6.285* [2.657] 0.004 [0.008] 0.125 [0.381] 0.129 [0.459] 0.005 [0.336] -2.767* [1.301] 0.083 [0.259] 0.027 [0.324] 0.578 [0.452] 0.239 [0.451] 0.543 [0.438] 1.523** [0.567] 0.28 [0.517] 0.13 [0.645] Table 7 (continued) 500-999 persons 1000-1499 persons 1500-1999 persons 2000 and above Raw material processing Components and parts Final products 2 to 5 6 to 10 11 or more Less than 0.5% 0.5 to 0.99% 1% and more Before 1990 1990-1994 1995-1999 2000-2004 2005 and later Constant rho /athrho /lnsigma (1) 0.759** [0.274] 0.897** [0.324] 0.567 [0.474] 0.628 [0.436] -0.232 [0.290] -0.248 [0.279] -0.133 [0.277] 0.212 [0.167] 0.544** [0.191] 0.300+ [0.168] -0.255 [0.222] -0.025 [0.323] 0.018 [0.232] -0.015 [0.254] 0.184 [0.313] 0.493* [0.233] 0.124 [0.243] 0.337 [0.227] -1.019* [0.409] 0.068 [0.094] -0.829+ [0.461] -1.094** [0.032] -646.67823 (2) 0.550* [0.259] -0.137+ [0.287] 0.46 [0.515] 0.426 [0.094] -0.306 [0.064] 0.054 [0.258] 0.07 [0.059] 0.009 [0.168] 0.533** [0.050] -0.071+ [0.042] -0.166 [0.054] 0.162** [0.291] 0.279 [0.062] -0.003 [0.071] 0.711* [0.335] 0.287 [0.218] -0.007 [0.240] 0.145 [0.231] 0.055 [0.423] -1.093** [0.032] -0.880* [0.092] -0.631+ [0.349] -600.57226 (3) -0.083 [0.078] 0.433 [0.085] 0.002 [0.116] -0.026 [0.093] 0.045 [0.064] 0.058 [0.063] -0.145 [0.059] -0.034 [0.151] 0.565** [0.050] 0.290+ [0.042] 0.139* [0.055] -0.135 [0.260] 0.024 [0.215] -0.005 [0.072] -0.017 [0.304] -0.09 [0.061] -0.012 [0.221] 0.133 [0.218] -1.094** [0.094] 0.046 [0.032] -0.805* [0.364] -1.339** [0.354] -644.35715 (4) -0.093 [0.080] 0.719* [0.087] -0.006 [0.117] 0.535 [0.344] 0.044 [0.064] 0.054 [0.222] -0.403+ [0.216] 0.208 [0.159] -0.120* [0.050] 0.383* [0.158] -0.326+ [0.187] -0.138 [0.062] 0.201 [0.063] 0.008 [0.072] -0.056 [0.084] 0.374+ [0.060] -0.096 [0.068] -0.110+ [0.211] -1.492** [0.096] -0.634+ [0.375] 0.062 [0.032] -1.091** [0.344] -547.80439 Log Psuedo Likelihood Wald test of exogeneity 3.24 4.33 13.55 15.82 (/athrho = 0): chi2(1) Observations 687 694 695 686 Note: Robust standard errors in brackets. + significant at 10%; * significant at 5%; ** significant at 1%. Source: ERIA Establishment Survey 2010. 387 (5) 1.168* [0.567] 1.482* [0.709] 0.879 [0.971] 1.006 [0.677] -0.393 [0.550] -0.224 [0.525] -0.323 [0.528] 0.359 [0.345] 1.200* [0.489] 0.690+ [0.378] -0.549 [0.533] -0.205 [0.630] 0.362 [0.469] -0.231 [0.528] 0.333 [0.664] 0.871+ [0.515] -0.15 [0.513] 0.349 [0.508] -0.039 [0.793] -0.039 [0.793] -0.039 [0.793] -0.039 [0.793] 691 Sharing the other firms past failure information also explains product destruction. Table 8 shows IV-Probit regression results for discontinuing a product and the number of product lineups. Even though Column 1 of Table 8 does not show that the coefficient of sharing on discontinuing a product is positive and significant, Column 2 of Table 8 presents that sharing other firms past failure experience has a significant effect on decreasing the number of product lineups. This suggests that sharing the past failure experience of other firms could affect the narrowing of product varieties and the concentration of product lineups advantageously. Column 3 of Table 8 partially supports this: That is, the probability that the number of products is unchanged is lower for firms that share the past failure experience of other firms. Table 8: Effects of Information Sharing of Past Failure of Other Firms on Product Churning (1) Discontinue a product Failure of other firms Firm age Indonesia Thailand Hanoi Ho Chi Minh City 100% foreign owned Joint venture 20-49 persons 50-99 persons 100-199 persons 1.476 [1.097] 0 [0.004] 0.929** [0.258] 0.113* [0.054] 0.472 [0.292] -0.739 [0.050] -0.007 [0.178] 0.159 [0.040] 0.379 [0.306] 0.476 [0.353] 0.253 [0.067] (2) (3) (4) IV-Probit Dependent variables: Product churning The number of The number of The number of product types product types is product types decreased same increased 2.627** -1.685+ 0.336 [0.301] [0.918] [1.500] 0.002 0.009+ 0 [0.001] [0.001] [0.001] -0.039 -0.728** 0.799** [0.043] [0.041] [0.042] 0.123* 0.116* 0.116* [0.211] [0.055] [0.055] 0.051 0.042 0.042 [0.042] [0.041] [0.041] 0.436** -0.24 0.440** [0.373] [0.740] [0.768] 0.003 -0.01 0.03 [0.130] [0.036] [0.137] 0.037 0.031 -0.161 [0.041] [0.169] [0.172] 0.057 -0.033 0.181 [0.069] [0.227] [0.248] -0.097 0.033 0.201 [0.244] [0.241] [0.256] -0.021 0.002 0.520* [0.071] [0.246] [0.067] 388 Table 8 (continued) 200-299 persons 300-399 persons 400-499 persons 500-999 persons 1000-1499 persons 1500-1999 persons 2000 and above Raw material processing Components and parts Final products 2 to 5 6 to 10 11 or more Less than 0.5% 0.5 to 0.99% 1% and more Before 1990 1990-1994 1995-1999 2000-2004 2005 and later Constant rho /athrho /lnsigma Log Psuedo Likelihood Wald test of exogeneity (/athrho = 0): chi2(1) Observations (1) -0.083 [0.321] 0.59 [0.360] 0.079 [0.469] -0.085 [0.326] -0.136+ [0.083] 0.224 [0.468] 0.044 [0.411] 0.042 [0.064] -0.761* [0.308] -0.409 [0.259] 0.014 [0.044] -0.119* [0.050] -0.071+ [0.042] 0.134* [0.054] -0.514+ [0.266] 0.083 [0.061] -0.003 [0.343] 0.226 [0.359] 0.649** [0.060] 0.125 [0.263] 0.711** [0.242] -0.635 [0.093] -1.095** [0.032] -1.091* [0.510] 0.055 [0.442] -522.52994 (2) -0.107 [0.278] -0.213 [0.287] -0.129 [0.091] -0.057 [0.081] 0.309 [0.327] 0.032 [0.119] 0.045 [0.066] -0.319 [0.253] -0.332 [0.061] -0.037 [0.045] 0.331+ [0.195] -0.084+ [0.183] -0.690** [0.055] 0.157* [0.256] -0.34 [0.063] 0.385 [0.283] -0.04 [0.357] -0.093 [0.061] 0.064 [0.068] -0.134* [0.061] -1.379** [0.408] -0.799* [0.096] -1.091** [0.358] 0.054 [0.033] -394.1857 (3) -0.23 [0.270] -0.351 [0.080] 0.076 [0.088] -0.085 [0.267] -0.135 [0.084] 0.001 [0.115] -0.29 [0.093] 0.04 [0.063] 0.127 [0.062] 0.051 [0.058] -0.399* [0.044] -0.110* [0.197] -0.063 [0.185] 0.334 [0.214] 0.808** [0.061] 0.018 [0.061] -0.003 [0.324] -0.843* [0.083] -0.863** [0.060] -0.447+ [0.067] -0.114+ [0.060] 0.705 [0.351] -1.094** [0.091] 0.600+ [0.457] 0.067 [0.032] -585.14657 (4) -0.084 [0.076] 0.663* [0.291] 0.077 [0.088] -0.085 [0.077] 0.502 [0.084] 0.900+ [0.115] 0.860* [0.417] -0.282 [0.065] 0.034 [0.063] 0.049 [0.262] -0.026 [0.188] -0.110* [0.050] -0.062 [0.042] 0.212 [0.054] -0.205 [0.317] 0.019 [0.061] -0.004 [0.267] -0.062 [0.328] 0.566* [0.248] -0.005 [0.241] -0.114+ [0.256] -1.091** [0.032] -0.166 [0.092] 0.068 [0.514] -1.000* [0.390] -634.28984 1.55 11.41 2.37 0.1 697 660 700 696 389 Note: Robust standard errors in brackets. + significant at 10%; * significant at 5%; ** significant at 1%. Source: ERIA Establishment Survey 2010. In sum, the empirical results of Tables 7 and 8 suggest that sharing other firms past failure experience stimulates product innovation as well as product destruction. As a result, it decreases the number of product lineups. Even though such firms are likely to reduce product lineups, they seem to reallocate and concentrate the resources within the firm to a new product. 5.4. Robustness Check: Adopting QC Circle Does Not Explain Product Innovation We move to a robustness check as to the effect of interaction terms of adopting cross-functional teams and exchanging engineers on the propensity to product innovation across firms. Now we examine whether or not product innovation needs interaction between adopting cross-functional teams and exchanging engineers. If product innovation has required different kinds of information across departments, that is, department-wide information, then there has to be implementation of some internal activities in order to integrate the local information into one. This might exaggerate the benefits of knowledge exchanges with production partners. That is the main story of this paper. But there should be an alternative explanation that firms investing in other types of internal activities could also exaggerate the impacts of knowledge exchanges with their production partners. For example, a firms local knowledge sharing within a department, such as adopting a QC circle, could affect product innovation. If this has been true, then it is difficult to say whether cross-functional teams enhance the impacts of external linkages on product innovation. To check the 390 robustness of the argument of this paper, we replace adopting cross-functional teams into adopting a QC circle in baseline regressions. We expect that the coefficient of interaction terms between a QC circle and exchanging engineers is insignificant. No columns of Table 9, except for Column 1, present that a QC circle does enhance product innovation. Column 1 of Table 9 only shows the positive and significant impacts of interactions between adopting a QC circle and exchanging engineers on changes in packaging and appearance design. Table 10 also shows there is no evidence that a QC circle enhances the impact of exchanging engineers on discontinuing a product and the number of product lineups. In sum, if we replace the proxy of information sharing across departments into the proxy of information sharing within a department, then such local knowledge sharing could not affect product innovation. Thus, these results suggest that product innovation requires an integration of different types of knowledge across departments. The robustness of the argument of this paper is upheld. Table 9: Effects of Adopting QC Circles on Product Innovation (1) Circle*Exchanges Exchanges of engineers Firm age Indonesia Thailand Hanoi Ho Chi Minh City 100% foreign owned Significant change in packaging or appearance design 0.219* [0.100] -0.11 [0.123] 0.002 [0.002] -0.09 [0.073] 0.188* [0.079] -0.017 [0.070] -0.003 [0.069] 0.054 [0.053] (2) (3) (4) Probit (Marginal Effects) Dependent variables: Product innovation Development Development Significant of a totally of a totally improvement new product new product of an existing based on the based on the product existing new technologies technologies 0.135 -0.047 0.047 [0.113] [0.109] [0.085] -0.015 0.238* 0.116 [0.116] [0.099] [0.077] -0.002 0.002 -0.001 [0.002] [0.002] [0.001] -0.075 -0.038 -0.022 [0.081] [0.074] [0.058] 0.233** 0.183* 0.104 [0.056] [0.078] [0.073] 0.178** 0.147* -0.064 [0.062] [0.072] [0.047] 0.303** -0.118+ -0.143** [0.051] [0.067] [0.041] -0.006 0.021 -0.025 [0.056] [0.055] [0.041] 391 (5) Ordered Logit The sum of product innovation 0.474 [0.447] 0.433 [0.480] 0.001 [0.006] -0.2 [0.333] 1.056** [0.290] 0.299 [0.281] 0.088 [0.246] 0.121 [0.191] Table 9 (continued) (1) (2) (3) (4) 0.083 -0.025 0.098 0.092 [0.064] [0.067] [0.065] [0.059] 20-49 persons 0.161 0.059 0.093 0.05 [0.101] [0.085] [0.098] [0.095] 50-99 persons 0.176+ 0.101 0.083 0.089 [0.100] [0.082] [0.098] [0.101] 100-199 persons 0.199* 0.148+ 0.113 0.191+ [0.097] [0.080] [0.095] [0.105] 200-299 persons 0.268** 0.223** 0.309** 0.333** [0.103] [0.074] [0.095] [0.125] 300-399 persons 0.15 -0.003 0.08 0.097 [0.118] [0.105] [0.111] [0.120] 400-499 persons 0.211+ 0.061 0.201 0.259+ [0.127] [0.120] [0.129] [0.151] 500-999 persons 0.314** 0.185* 0.102 0.139 [0.100] [0.085] [0.108] [0.121] 1000-1499 persons 0.339** 0.184+ 0.07 0.280+ [0.121] [0.099] [0.142] [0.162] 1500-1999 persons 0.291+ 0.207+ 0.252 0.283 [0.159] [0.124] [0.165] [0.190] 2000 and above 0.309* 0.184 0.153 0.364* [0.135] [0.118] [0.144] [0.164] Raw material processing -0.066 -0.114 -0.021 -0.136* [0.112] [0.124] [0.115] [0.062] Components and parts -0.065 0.048 0.036 -0.103 [0.110] [0.114] [0.114] [0.077] Final products 0.019 0.053 0.041 -0.123 [0.106] [0.109] [0.107] [0.084] 2 to 5 0.074 -0.031 0.057 0.078 [0.072] [0.069] [0.072] [0.065] 6 to 10 0.144+ 0.141* 0.198* 0.086 [0.081] [0.070] [0.079] [0.074] 11 or more 0.073 0.058 0.079 0.118+ [0.071] [0.066] [0.071] [0.064] Less than 0.5% 0.036 0.073 0.146+ 0.031 [0.075] [0.076] [0.078] [0.065] 0.5 to 0.99% 0.202* 0.132 0.250** 0.207* [0.090] [0.084] [0.089] [0.094] 1% and more 0.049 0.163* 0.135 0.177+ [0.092] [0.079] [0.095] [0.095] Before 1990 -0.032 0.102 -0.075 -0.107* [0.098] [0.096] [0.094] [0.054] 1990-1994 0.018 0.248** -0.151 -0.025 [0.132] [0.079] [0.113] [0.095] 1995-1999 0.14 0.042 0.092 0.111 [0.091] [0.092] [0.093] [0.084] 2000-2004 0.034 -0.005 -0.098 -0.066 [0.092] [0.096] [0.088] [0.064] 2005 and later 0.007 -0.071 -0.153+ -0.123* [0.084] [0.090] [0.079] [0.053] Observations 687 694 695 686 Note: Robust standard errors in brackets. + significant at 10%; * significant at 5%; ** significant at 1%. Source: ERIA Establishment Survey 2010. Joint venture 392 (5) 0.343 [0.261] 0.192 [0.317] 0.355 [0.308] 0.629* [0.300] 1.182** [0.337] 0.271 [0.337] 0.531 [0.482] 0.783* [0.336] 0.829 [0.521] 0.986+ [0.549] 0.955+ [0.495] -0.478 [0.507] -0.011 [0.480] 0.03 [0.467] 0.285 [0.287] 0.740* [0.311] 0.506+ [0.290] 0.388 [0.269] 0.934** [0.331] 0.639+ [0.334] -0.262 [0.334] 0.298 [0.564] 0.495 [0.353] -0.258 [0.345] -0.479 [0.298] 691 Table 10: The Effects of Adopting QC Circles on Product Churning (1) Discontinue a product Circle*Exchanges Exchanges of engineers Firm age Indonesia Thailand Hanoi Ho Chi Minh City 100% foreign owned Joint venture 20-49 persons 50-99 persons 100-199 persons 200-299 persons 300-399 persons 400-499 persons 500-999 persons 1000-1499 persons 1500-1999 persons 2000 and above Raw material processing Components and parts Final products 2 to 5 6 to 10 -0.082 [0.095] 0.103 [0.072] 0.002+ [0.001] 0.337** [0.080] 0 [0.066] 0.193** [0.068] -0.028 [0.054] 0.142** [0.048] 0.071 [0.053] 0.111 [0.114] 0.19 [0.127] 0.088 [0.107] 0.049 [0.109] 0.222 [0.144] 0.255 [0.170] 0.111 [0.125] 0.366* [0.171] 0.082 [0.165] 0.004 [0.121] -0.123** [0.046] -0.184** [0.055] -0.101 [0.070] -0.013 [0.048] 0.027 [0.057] (2) (3) Probit (Marginal Effects) Dependent variables: Product churning The number of The number of product types product types is decreased same -0.057 -0.055 [0.062] [0.103] 0.085** -0.018 [0.030] [0.107] 0 0.004** [0.001] [0.001] 0.012 -0.231** [0.042] [0.044] 0.034 -0.135* [0.048] [0.057] 0.007 -0.170** [0.034] [0.056] 0.181** -0.335** [0.059] [0.037] 0.017 -0.043 [0.024] [0.050] -0.027 0.09 [0.024] [0.066] -0.023 -0.03 [0.031] [0.083] -0.017 -0.034 [0.033] [0.083] -0.044+ -0.088 [0.026] [0.080] -0.050* -0.04 [0.020] [0.093] -0.048* -0.139+ [0.020] [0.079] -0.012 -0.064 [0.044] [0.113] -0.060** -0.046 [0.018] [0.100] -0.018 -0.119 [0.046] [0.109] -0.002 -0.225* [0.079] [0.093] -0.107 [0.116] 0.072 0.005 [0.072] [0.100] -0.047 0.026 [0.037] [0.096] -0.039 0.013 [0.045] [0.089] 0.009 -0.149** [0.032] [0.057] 0.008 -0.186** [0.035] [0.058] 393 (4) The number of product types increased 0.122 [0.103] -0.101 [0.107] -0.005** [0.002] 0.280** [0.057] 0.124+ [0.072] 0.158* [0.067] 0.189** [0.062] 0.012 [0.053] -0.059 [0.068] 0.076 [0.094] 0.091 [0.092] 0.197* [0.085] 0.155+ [0.094] 0.242** [0.083] 0.089 [0.121] 0.202* [0.094] 0.176 [0.120] 0.293** [0.112] 0.291** [0.098] -0.107 [0.110] 0.039 [0.105] 0.023 [0.099] 0.180** [0.068] 0.232** [0.070] Table 10 (continued) 11 or more Less than 0.5% 0.5 to 0.99% 1% and more Before 1990 1990-1994 1995-1999 2000-2004 2005 and later Observations (1) 0.046 [0.050] -0.100* [0.044] -0.074 [0.054] 0.034 [0.073] -0.106* [0.052] 0.051 [0.113] 0.202* [0.093] 0.046 [0.079] 0.200* [0.089] 697 (2) -0.011 [0.030] -0.062** [0.018] -0.072** [0.016] -0.044+ [0.022] 0.153 [0.097] 0.152 [0.130] 0.078 [0.070] 0.012 [0.049] 0.08 [0.056] 660 (3) -0.178** [0.060] 0.045 [0.078] 0.256** [0.099] -0.018 [0.096] -0.232** [0.056] -0.235** [0.060] -0.240** [0.053] -0.165* [0.066] -0.117 [0.072] 700 (4) 0.224** [0.069] 0.104 [0.072] -0.059 [0.090] 0.147+ [0.086] 0.119 [0.097] 0.168 [0.110] 0.191* [0.079] 0.155+ [0.083] -0.005 [0.083] 696 Note: Robust standard errors in brackets. + significant at 10%; * significant at 5%; ** significant at 1%. Source: ERIA Establishment Survey 2010. 6. Conclusion Adopting cross-functional teams affects product innovation and destruction through input-output linkages. Firms exchanging engineers with their customers could affect the positive impacts on product innovation if the firms adopted a knowledge sharing scheme across departments such as cross-functional teams. We summarize our main results as follows. First, adopting cross-functional teams within a firm can stimulate the product innovation impacts of knowledge exchanges through engineers with upstream and downstream firms. This is supported by several types of product innovation, from very simple product upgrading such as changing the package design to more advanced onedevelopment of a totally new product based on new technologies. Second, adopting 394 cross-functional teams within a firm can raise the product destruction impacts of knowledge exchanges through engineers with connected firms. Thus, interactive internal and external information sharing has a positive impact on creative destruction. Third, since interactive internal and external information sharing has delivered the experience of failure of other firms, then learning an experience of failure from other firms has a positive and significant impact on product innovation and creative destruction. Finally, these results are not supported when we use a QC circle in each department as information sharing within a firm instead of cross-functional teams. These findings are basically consistent with the theory of organizational economics, Dessein and Santos (2006) for example, that proves investment in communication technologies could weaken the trade-off between adaptation to the local information and specialization. The empirical result in this paper is consistent with the theory that investment in teams across departments has lowered the coordination costs. The empirical result of the innovation impacts of the past failure experience of other firms is also consistent with the finding from the diffusion of a new agricultural technology in Ghana by Conley and Udry (2010). Thus, sharing the past experience of failure could be a mother of future innovation and industrial upgrading through the organizational learning. The empirical result suggests that interaction between adopting cross-functional teams and exchanging engineers strongly correlates with sharing other firms past failure experience. 395 REFERENCES Ando, M. and F. Kimura (2009) Fragmentation in East Asia: Further Evidence, ERIA Discussion Paper No. 2009-20, Jakarta: Economic Research Institute for ASEAN and East Asia (ERIA), October. Asanuma, B. (1989) Manufacturer-Supplier Relationships in Japan and the Concept of Relation-Specific Skill, Journal of the Japanese and International Economies, 3, 1-30. Banerjee, A., and E. Duflo (2000) Reputation Effects and the Limits of Contracting: A Study of the Indian Software Industry, Quarterly Journal of Economics, 115 (3), 989-1017. Banerjee, A., and E. Duflo (2005) Growth Theory through the Lens of Development Economics, in Steve Durlauf and Philippe Aghion (eds.), Handbook of Economic Growth, Vol. 1A, North-Holland: Elsevier, 473-552. Bartel, A, C. Ichniowski, and K. Shaw (2007) How Does Information Technology Affect Productivity? Plant-Level Comparisons of Product Innovation, Process Improvement, and Worker Skills, Quarterly Journal of Economics, 122 (4), 1721-1758. Berliant, M., and M. Fujita (2008) Knowledge Creation as a Square Dance on the Hilbert Cube, International Economic Review, 49 (4), 1251-1268. Berliant, M., and M. Fujita (2009) Dynamics of Knowledge Creation and Transfer: The Two Person Case, International Journal of Economic Theory, 5, 155-179. Berliant, M., R. Reed, and P. Wang (2006) Knowledge exchange, matching, and agglomeration, Journal of Urban Economics, 60(1), 69-95. Blalock, G. and P.J. Gertler (2008) Welfare Gains from Foreign Direct Investment through Technology Transfer to Local Suppliers, Journal of International Economics, 74, 402-421. Bloom, N, B. Eifert, A. Mahajan, D. McKenzie, and J. Roberts, (2011) Does Management Matter? Evidence from India, NBER Working Papers 16658. Bloom, N. and J. Van Reenen (2007) Measuring and Explaining Management Practices across Firms and Countries, Quarterly Journal of Economics, 122 (4), 396 1351-1408. Bloom, N., R. Sadun, and J. Van Reenen (2009) Recent Advances in the Empirics of Organizational Economics, forthcoming Annual Review of Economics. Bresnahan, T, E. Brynjolfsson, and L. Hitt (2002) Information Technology, Workplace Organization, and the Demand for Skilled Labor: Firm-Level Evidence, Quarterly Journal of Economics, 117 (1), 339-376. Conley, T. and C. Udry (2010) Learning about a New Technology: Pineapple in Ghana, American Economic Review, 100(1), 35-69. Dessein, W. and T. Santos (2006) Adaptive Organization, Journal of Political Economy, 114(5), 956-994. Fujita, M. (2007) Towards the new economic geography in the Brain Power Society, Regional Science and Urban Economics, 37, 482-490. Fujita, M., and J.F. Thisse (1996) Economics of Agglomeration, Journal of the Japanese and International Economies, 10(4), 339378. Fujita, M., and J.F. Thisse (2002) Economics of Agglomeration: Cities, Industrial Location, and Regional Growth, Cambridge: Cambridge University Press. Goyal, S (2007) Connections: An Introduction to the Economics of Networks, Princeton, NJ: Princeton University Press. Hamilton, B, J. Nickerson, and H. Owan (2003) Team Incentives and Worker Heterogeneity: An Empirical Analysis of the Impact of Teams on Productivity and Participation, Journal of Political Economy, 111 (3), 465-497. Hortacsu, A. and C. Syverson (2009) Why do Firms Own Production Chains? Mimeo. Ichniowski, C, K. Shaw, and G. Prennushi (1997) The Effects of Human Resource Management Practices on Productivity: A Study of Steel Finishing Lines, American Economic Review, 87 (3), 291-313. Jackson, M. (2008) Social and Economic Networks, Princeton, NJ: Princeton University Press. Javorcik, B. (2004) Does Foreign Direct Investment Increase the Productivity of Domestic Firms? In Search of Spillovers through Backward Linkages, American Economic Review, 94, 605-627. 397 Jones, B.F., S. Wuchty, and B. Uzzi (2007) Multi-University Research Teams: Shifting Impact, Geography, and Stratification in Science, Science, 322(21), 1259-62. Keller, W. (2004) International Technology Diffusion, Journal of Economic Literature, 42(3), 752-782. Kerr, W.R. (2008) Ethnic Scientific Communities and International Technology Diffusion, The Review of Economics and Statistics, 90(3), 518-537. Kerr, W.R. (2010) Breakthrough Inventions and Migrating Clusters of Innovation, Journal of Urban Economics 67(1), 46-60. Kerr, W.R. and W.F. Lincoln (2010) The Supply Side of Innovation: H-1B Visa Reforms and U.S. Ethnic Invention, Journal of Labor Economics (forthcoming). Kimura, F. (2006) International Production and Distribution Networks in East Asia: Eighteen Facts, Mechanics, and Policy Implications, Asian Economic Policy Review, Vol. 1, 326-344. Kimura, F. (2008) The Mechanics of Production Networks in Southeast Asia: The Fragmentations Theory Approach, in Ikuo Kuroiwa and Toh Mun Heng (eds.) Production Networks and Industrial Clusters: Integrating Economies in Southeast Asia, IDE-JETRO and ISEAS, 33-53. Kimura, F. (2009) The Spatial Structure of Production/Distribution Networks and Its Implication for Technology Transfers and Spillovers, ERIA Discussion Paper, No. 2009-02. Kugler, M. and E. Verhoogen (2008) The Quality-Complementarity Hypothesis: Theory and Evidence from Columbia, NBER Working Paper Series, No. 14418. Polanyi, M. (1966) The Logic of Tacit Inference, Philosophy, The Journal of the Royal Institute of Philosophy, 41(155), 1-18. Polanyi, M. (1967) The Tacit Dimension, Chicago: University of Chicago Press. Rosenblat, T. and M. Mobius (2004) Getting Closer or Drifting Apart, Quarterly Journal of Economics, 119(3), 971-1009. Shaw, K. (2009) Insider Econometrics: A Roadmap with Stops along the Way, Labour Economics, 16 (6), 607-617. 398 Syverson, C. (2009) What Determines Productivity at the Micro Level? Mimeo, University of Chicago. Tirole, J. (1996) A Theory of Collective Reputations (with Applications to the Persistence of Corruption and to Firm Quality), Review of Economic Studies, 63, 1-22. Wuchty, S., B.F. Jones, and B. Uzzi (2007) The Increasing Dominance of Teams in Production of Knowledge, Science, 316, 1036-1039. 399
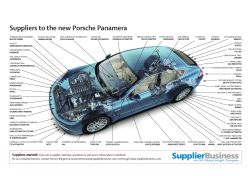


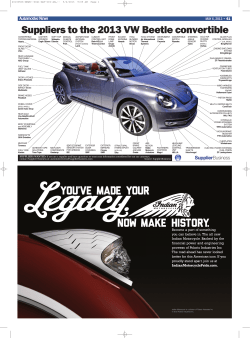


© Copyright 2026