
CHALLENGES FOR NORDIC POWER How to handle the renewable electricity surplus R-2010-083
R-2010-083 CHALLENGES FOR NORDIC POWER How to handle the renewable electricity surplus CHALLENGES FOR NORDIC POWER Document details Econ Report no. R-2010-083 TCG Report no. 2010-3 Project no. 5Z100016.10 ISBN 978-82-8232-151-8 ISSN 0803-5113 Internal codes HTA/FVL/mbh, UMO Report finish date 18. November 2010 Accessibility Public Contact details Oslo Econ Pöyry Pöyry Management Consulting (Norway) AS Post Box 9086 Grønland, N-0133 Oslo Norway Visiting address: Schweigaards gate 15B, N-0191 Oslo Telephone: +47 45 40 50 00 Telefax: +47 22 42 00 40 e-mail: [email protected] Thema Consulting Group ØvreVollgate 6, N-0158 Oslo Norway Contact Håkon Taule +47 400 67 400 [email protected] http://www.t-cg.no Contact Fredrik Vogt-Lorentzen +47 920 55 111 [email protected] http://www.econ.no Enterprise No: NO-960 416 090 Copyright © 2010 Pöyry Management Consulting (Norway) AS Copyright © 2010 THEMA Consulting Group R-2010-083 CHALLENGES FOR NORDIC POWER TABLE OF CONTENTS PREFACE I 1 SUMMARY AND CONCLUSIONS 1 2 WHY NOW? 5 3 THE NORDIC STORY 7 3.1 A successful deregulation 7 3.2 From surplus to scarcity 8 3.3 Prices: First down, then up 9 3.4 Increased transmission capacity 10 3.5 Will the success continue? 12 4 5 SCENARIOS – WHAT COMES NEXT? 13 4.1 15 Building blocks in the scenarios 4.1.1 Climate policy, renewable energy and energy efficiency 15 4.1.2 Macroeconomics 17 4.1.3 The future of power intensive industry 17 4.1.4 Fuel prices and CO2 prices 18 4.1.5 Market integration 19 4.1.6 Technology 19 4.2 Politics Work: EU policy targets are met 20 4.3 Green Growth: A successful transition 27 4.4 Stagnation: Nordic power sector a sunset industry 32 4.5 Supply worries: A Nordicpower deficit 39 SO WHAT? 45 5.1 Significant export in all but one scenario 45 5.2 Nordic prices remain below continental prices 48 5.3 Fuel prices and CO2 prices determine price level 52 5.4 Renewables investments significantly affect the power price 53 5.5 Cables have less effect on prices than renewables 54 5.6 Total interconnector capacity has a limited effect on power exports 55 5.7 Cable revenues are substantial 56 5.8 Cables increase and redistribute welfare 62 R-2010-083 CHALLENGES FOR NORDIC POWER 6 7 5.9 Price and congestion rent vary with inflows 63 5.10 The impact of fuel prices, power balance, and system flexibility 65 5.11 Different opportunities and challenges for different countries 66 WHY SHOULD WE CARE? 74 6.1 Price effects of renewables and cables 74 6.2 Implications for Stakeholders 79 WHAT CHOICES DO WE HAVE? 84 7.1 A common challenge: The Nordics must contribute 84 7.2 A special Nordic challenge 84 7.3 Income distribution effects 85 APPENDIX 1: HOW ELECTRICITY INFRASTRUCTURE CREATES VALUE 88 APPENDIX 2: MODELING METHODOLOGY 94 APPENDIX 3: DETAILED ASSUMPTIONS FOR SCENARIOS 98 R-2010-083 CHALLENGES FOR NORDIC POWER PREFACE Almost two years after the EU Commission put forth the EUs 202020 Climate and Energy policy package, it is clear that the Nordic region may face investment in new renewable generation at levels that are unprecedented since the deregulation of the Nordic electricity market. This report explores the linkages between political choices and market dynamics on the basis of four scenarios for the Nordic Power Sector towards 2020 and 2030. The aim is to contribute to a common understanding of the market challenges and dynamics among different stakeholders: How do different policy and market drivers interact? What are the long-term implications for prices and the energy balance? And ultimately, what policy choices are available when it comes to handling the expected increase in renewable generation and the looming Nordic energy surplus. Econ Pöyry and THEMA Consulting Group have invited companies, industry organizations and government agencies to participate in the process to elaborate on the issues mentioned above. The participants have contributed through workshops, working groups and conferences. We are glad to have this opportunity to thank our sponsors for their financial support and their respective representatives for their contributions and active participation: Øyvind Stakkeland, Agder Energi Jan Svenne, Akershus Energi Kai-Rune Heggland, Alcoa Thor-André Berg, BKK Charlotte Søndergren, Stine Grenaa Jensen, Dansk Energi Birger Holt, Energiselskapet Buskerud Per Arne Torbjørnsdal, E-CO Energi Ståle Størdal, Eidsiva Vannkraft Hans Olav Ween, Energi Norge Espen Borgir Christophersen, Enova Anders Klarström, EON Nordic Niina Honkasalo and Petter Haveri, Finnish Energy Industries Lars Ove Johansen, Hafslund Henrik Gunnertoft Bojsen, Nord Energi Stein Øvstebø, Norsk Hydro Nils Arne Nes, NTE Energi Jon Sagen, NVE (Observer) Henriette Nesheim, OED (Observer) Gunn Ragnhild Jønholt and Jan Erik Nøkleby, Skagerak Energi Roald Amundsen, SKS R-2010-083 i CHALLENGES FOR NORDIC POWER Håkon Egeland, Statkraft Jan Bråten, Statnett Ingrid Lomelde, Statoil Maria Sunér Fleming and Folke Sjöbohm, Svensk Energi Tommy Fredriksen, Østfold Energi This report addresses a broad set of politically controversial and commercially sensitive issues. During the course of work, we have had the pleasure of drawing on the knowledge and enthusiasm of persons in the participating organizations and companies. However, Econ Pöyry and THEMA Consulting Group are solely responsible for the analysis and views expressed in this book. The project team has consisted of Berit Tennbakk, Arndt von Schemde, Eivind Magnus and Åsmund Jenssen from THEMA Consulting Group and Ole Løfsnæs and Eivind Graversen from Econ Pöyry. Håkon Taule, Project Leader, THEMA Consulting Group Fredrik Vogt Lorentzen, Project Leader, ECON Pöyry Oslo, November 2010 R-2010-083 ii CHALLENGES FOR NORDIC POWER 1 SUMMARY AND CONCLUSIONS Interconnectors and renewable energy targets are at the core of the current energy and climate policy debate Investments in renewable energy and construction of interconnectors between the Nordic power market and the rest of Europe are at the core of the contemporary energy and climate policy debate. Both national and EU energy and climate policy targets require substantial investments in new renewable electricity generation. Such investments are deemed necessary in order to facilitate transition of the European energy sector to a system with substantially lower greenhouse gas emissions. In order to transmit the new renewable energy to the customers and to balance its intermittency it is necessary to strengthen the European electricity transmission grid. This applies to reinforcements in the national grids as well as to increases in interconnector capacity between countries. The Nordic EU members have accepted binding commitments as part of EUs renewable directive, and Norway is currently negotiating its national commitment with the EU. At the same time, the Nordic countries must decide to what extent the interconnector capacity within the Nordic area and between the Nordic market and the rest of Europe shall be increased. Several new interconnectors between the Nordic hydropower system and the thermal systems on the Continent and in UK are planned based on: Trade revenues due to hourly price differences between the hydropower dominated system in the Nordic area and the thermal dominated system in Europe The increasing power surplus in the Nordic area due to political targets for renewable generation. In the Nordic market, the increased renewable capacity will yield increased power generation since there is not much fossil fuelled power generation to replace. The increased need for flexibility in the thermal systems due to the increase in the share of new renewable generation capacity (intermittent energy) The project investigates the longterm perspectives for the Nordic power market using a scenario approach. The scenarios enable us to assess how different futures for the Nordic power system affect and are affected by commercial decisions and political choices that need to be made, with regard to investments in both interconnector capacity and renewable generation. Stakeholders are affected differently Investments in both new renewable power generation and associated interconnector and transmission investments have implications for the power balance, electricity prices and grid tariffs. In addition, such investments may interfere with nature conservation values. Hence, various interest groups voice contradicting views on the necessity to and the motives behind the planned transmission grid investments. The system operators argue that the investments are welfare economically profitable, i.e. generate net benefits for society as a whole, and the power utilities argue that substantial investments in renewable generation without increases in interconnector capacity undermines the value of the existing generation capacity. R-2010-083 1 CHALLENGES FOR NORDIC POWER Electricity consumers on the other hand, are concerned that new interconnections to the rest of Europe yield higher electricity prices, which in turn may undermine the basis for the Nordic power intensive industry. A special dilemma for Nordic power The Nordic power sector has a different starting point for investments in new renewable electricity generation than most other parts of Europe. New renewable generation on the Continent and in UK replaces polluting thermal generation. In Norway, Sweden and Finland, however, such generation comes largely in addition to existing generation in hydropower and nuclear power plant. The implications of substantial investments in new renewable generation capacity are much more profound and long term for the power balance and electricity prices in the Nordic area than in the rest of Europe. Different futures for Nordic power In our scenarios we present four different stories for the development of the Nordic power system to 2020 and 2030. The scenarios yield different market balances over time as a result of different developments of supply and demand. In Politics Work Europe carries through with an ambitious climate policy including powerful incentives for investments in renewable generation. Modest economic growth and energy efficiency measures imply a modest growth in electricity demand. The combination of increased renewable generation and low demand growth yields a substantial power surplus that has to be exported from the Nordic area. This also implies a substantial increase in interconnection capacity between the Nordic area and the rest of Europe. In Green Growth substantial investments in renewable generation are made as well. Electricity consumption also increases, due to high global economic growth, conversion from oil to electricity in transport and other sectors, and increased production in the power intensive industry. Despite the high demand growth, the Nordic area develops a substantial power surplus even in this scenario. A number of new interconnectors are hence put in operation during the next two decades. In Stagnation the world economy enters into a lasting period of low economic growth, prolonged by an unexpected and sharp downturn in the Chinese and Indian economies around 2020. Even though investments in new renewable energy in Europe and the Nordics are scaled down compared to the ambitious targets set by EU’s 202020 policies, the Nordic area develops a substantial power surplus. The surplus is reduced towards 2030 because investments in new generation capacity are increasingly put on hold. In Supply worries the Nordic power sector moves into a slight deficit situation due to a strong growth in demand in combination with delays in investments in renewable electricity generation, while parts of Swedish nuclear power is gradually phased out. Using a sophisticated power market model we have estimated the power balances, prices, and trade patterns between the Nordic area and adjacent markets in Europe. Based on the model results we have estimated the revenues and benefits of increased interconnection in the Nordic area. We have also analyzed the effects of additional investments in interconnector capacity. R-2010-083 2 CHALLENGES FOR NORDIC POWER We should prepare for a future with a substantial power surplus The scenarios show a wide variation in power balances and prices in the Nordic power market in the coming decades. Power prices vary between 29 Euro pr. MWh in Stagnation and 76 Euro pr. MWh in Supply Worries in 2020, while the variation is 60-89 Euro pr. MWh in 2030. The power price level in the Nordic market is substantially lower than Continental prices in three out of four scenarios. One important reason is that three out of four scenarios show a substantial power surplus in the Nordic area. Even if the power surplus is somewhat reduced to 2030, a substantial price difference is sustained. The Politics Work scenario has the highest Nordic surplus in 2020, a whopping 46 TWh in a normal year. Only Supply Worries show a small power deficit of 7 TWh in 2020. The average Nordic power price is on level with the Continental price level in this scenario. None of the scenarios do however yield a Continental price pattern in the Nordic market. Despite the substantial variation in prices and market balances among the scenarios we are able to draw some important and robust conclusions from the analysis: It is very likely that a substantial power surplus will develop in the Nordic area towards 2020. The power surplus accrues from the increased investments in new renewable generation that is not balanced by a corresponding increase in electricity demand. With the expected power surplus, Nordic electricity prices will be lower than electricity prices on the Continent, even if we substantially increase the interconnector capacity between the Nordics and the rest of Europe. We do not import Continental prices to the Nordic area in any of the scenarios, although the price levels in all market areas are strongly affected by fuel and CO2 price developments. Estimates of the economics of interconnectors indicate that the projects generate a positive social surplus. In all scenarios the interconnectors generate revenues above the capital and operational costs of the interconnectors. The financial surplus is higher the larger the export surplus and, hence, the price differences between the markets. In most cases the profits are higher than the associated investment costs in the internal grid, by far. This net surplus can hence accrue to users of the transmission grid, i.e. generators and consumers, via reductions in grid tariffs. The planned interconnector capacity between the Nordic area and the rest of Europe yields somewhat higher electricity prices, but this price increase is much less than the price reduction due to the renewable generation targets. Hence, the price increase only to a small extent offsets the price effect of renewable generation. The combined effect, looking at realistic volumes of renewable investments and interconnector capacity, is reduced power prices. This increase compensates some of the reduced value of all power generation due to the investments in new renewable generation, and reduces the subsidy need for new generation. For the power intensive industry the combined effect of increased renewable energy and interconnector capacity is positive. Substantially lower power prices strengthen the competitiveness of the Nordic power intensive industry. Carbon leakage provisions in line with the rest of Europe are more important for the industry than the price effect of interconnectors in order to preserve competitiveness in the global market. For the power intensive industry and consumers’ point of view, the time lag regarding infrastructure investments, generation and transmission capacities is also of significant importance. The grids have to be strengthened before new interconnectors and generators are connected to the grid. The cost of these internal grid investments will typically be added to the asset base of the transmission owners (rather than being R-2010-083 3 CHALLENGES FOR NORDIC POWER financed through connection charges), and will hence increase tariffs. The tariff increase must likely be carried by the consumers, as EU regulations limit the level residual tariffs on generators. This may pose a particular problem for power intensive industries. Large industrial power users tend to assess the profitability of their activities more or less on a continuous basis. Short-run tariff increases due to factors that have little to do with industrial power use as such, may therefore lead to decisions to close down plants. Depending on the circumstances, the closing of industrial plants due to (residual) tariff increases may cause economic losses to society as a whole. Facilitation of new interconnector capacity increases values and supports renewable energy policies The political ambitions and commitments to increase the share of new renewable power generation in Europe, whether we increase power consumption at home or not, is likely to yield a substantial power surplus in the Nordic power market. This surplus has to be exported. If the interconnector capacity between the Nordic market and the Continent is not increased, the value of power generation in the Nordic market could be dramatically reduced. It could even prove difficult to fulfill the renewable energy targets without expansion of the interconnector capacity. Hence, in order to credibly commit to ambitious targets for renewable electricity generation, one should simultaneously plan to increase interconnector capacity. There is no time to lose: Realization of several interconnectors requires investments in the internal grid. These investments take several years to carry through. In order to get the interconnectors in operation in time, the work has to start now. Making the investments in the internal grid and plan for expansion of interconnector capacity is a robust strategy: Both a stronger internal grid and new interconnectors will yield values even if the renewable expansion and associated power surplus is not realized. A strong internal grid increases security of supply and power exchange between the Nordic hydropower system and the Continental thermal system generates substantial revenues even in a more balanced supply and demand situation in the Nordic market. The consequences described above will be further accentuated if power consumption follows a weaker development path than assumed in the analysis, for example if power intensive industry is phased out. Substantially lower power consumption could jeopardize the development of renewable generation and increase the need for domestic reinforcements. To prevent migration of power intensive industry authorities should investigate measures for carbon costs compensation and review how to finance infrastructure investments. Nevertheless, if the Nordic countries, including Norway, are willing to take on ambitious binding renewable targets, the decision to go ahead and increase interconnector capacity to the Continent should be a logical part of this commitment. R-2010-083 4 CHALLENGES FOR NORDIC POWER 2 WHY NOW? Energy policies are becoming more and more complex Investments in new renewable power generation and interconnector capacity, support schemes, CO2 quotas and the subsequent impact on electricity prices are at the core of the Nordic and European energy policy debate. The highly complex interaction between markets, policy, regulation and the overall economy poses new challenges on the Nordic power sector. Understanding the interaction mechanisms is the key to reach national and EU energy policy targets relating to climate gas emissions, security of supply, overall market efficiency, and cost levels. Energy markets are increasingly integrated The focus on investments in renewable energy comes at a particular time in the history of the Nordic electricity sector, which has undergone a major transformation during the last two decades. A common Nordic electricity market has been developed, and significant steps towards European integration have been made through investments in interconnectors and market coupling initiatives. The Nordic market reforms have led to increased efficiency through better utilization of the combined energy resources and existing power plants and networks. Now there is a significant drive for further market integration across borders, motivated by a vision of a more efficient Pan-European power system. Climate change policies set the climate for energy policies The Nordic electricity market reforms have been part of a broad political drive towards liberalization in sectors traditionally dominated by public monopolies since the 1980’s. Since the turn of the century, however, climate change has come to rival liberalization at the top of the policy agenda. The EU has formulated ambitious targets to reduce CO2 emissions, increase production of renewable energy and increase energy efficiency, and corresponding national policies have been formulated. The Nordic power sector is entering a new formative period As we enter a new decade, it is our proposition that the sector is entering a new formative period. The choices made during the next few years will have a lasting impact on the development of the Nordic electricity sector and, by implication, the Nordic economies. The following are just some of the issues facing policymakers and other decision-makers in the sector: National and EU policies are geared towards more investments in renewable power generation. In contrast to our neighbouring countries in North western Europe, new renewable energy capacity in Norway, Sweden and to some extent Finland will not serve to replace existing thermal power plants, but rather add to the existing capacity. This creates a push towards a power surplus in the Nordic region. Low economic activity combined with an increased focus on energy efficiency may limit demand growth both in the short and long run. On the other hand, electric R-2010-083 5 CHALLENGES FOR NORDIC POWER vehicles and electrification of offshore petroleum installations may lead to higher demand. New renewable capacity requires network investments. Similarly, changes in both the level of demand and the geographic structure (i.e. the localization of industry) create a need for new network capacity. However, it is likely that there will be opposition to the building of new transmission lines due to nature conservation concerns. Such restrictions will slow down the transition to a more sustainable energy system and increase the overall system costs significantly. The opportunities for trading electricity between the Continental and Nordic markets are increasing, which creates a demand for new interconnector capacity. As renewable energy production tends to add to overall capacity in the Nordic region instead of replacing existing power plants, the Nordic countries may find it profitable to export surplus energy. Even in a situation with Nordic energy balance, there may be significant value added from cross-border exchange of electricity. This is particularly relevant for Norwegian hydropower producers, whose reservoir capacity and ability to regulate production quickly and cheaply carries a high value in power systems dominated by thermal power plants and wind power. However, interconnector capacity is costly, and may require significant domestic network reinforcements. Interconnectors and increased trade will also have an effect on power prices in the Nordic area. The changes in power prices and network costs impact on the distribution of income between producers and consumers of electricity, as well as the incentives to invest in power generation and power-intensive industries. Stakeholders need a common understanding Our aim with this report is to contribute towards a common understanding of the interaction between policy choices, regulation, market integration and the long-term effects on the energy balance and electricity prices in the Nordic region. We do this by way of a set of scenarios for the Nordic electricity market in 2020 and 2030, where we investigate the effects of different policy choices and investment strategies with regard to new power generation and interconnectors, as well as mapping out possible developments on the demand side. On this basis, we discuss the following issues: What is the outlook of demand and supply of electricity in the Nordic region over the next 20 years? How will this be affected by different assumptions about policy, macroeconomic conditions and fuel prices? How will investments in renewable energy and interconnectors affect Nordic electricity prices, and what is the relative price impact of these two factors compared to other factors such as fuel prices? How will the Nordic countries benefit from investing in power interconnectors? R-2010-083 6 CHALLENGES FOR NORDIC POWER 3 THE NORDIC STORY 3.1 A SUCCESSFUL DEREGULATION During the last 20 years, the Nordic power sector has gone through profound changes. Around 1990, as lower costs and efficiency improvements in the energy sector became main concerns in several countries, the international drive towards a less regulated economy began to dominate energy policy. Liberalization, competition and privatization were the main tools. The Nordic countries followed suit throughout the 1990s, although with less emphasis on privatization than for instance the UK. Of course, market reform has not been the only item on the policy agenda during this period. Energy security and industrial policy have influenced the development of the Nordic power industry during the last twenty years, as well as environmental concerns. The prioritizing of policy targets has varied across countries and over time, but as the 2000s approached, climate change came to rival efficiency and market reforms at the top of agenda across the EU and the Nordic region. Figure 3.1 The policy rectangle Prior to the liberalization process, the utilities were institutional monopolies and could invest in new generation capacity and develop customer relations without any interference from competitors. The utilities had legal obligations to deliver power, and got licenses to build power stations and grid facilities to cover the expected growth in electricity demand in their area. The prices were set to cover costs and investment decisions were based on long-term planning procedures. Improved efficiency was the main argument behind the market reforms. Monopoly institutions lacked incentives to invest and operate efficiently. Cost based power prices created regional price differences since the investment cost could differ significantly between projects. In the old system each Nordic country was more or less self-sufficient. Even Norway, a country one hundred per cent based on hydro power and therefore very dependent on hydrology, had enough capacity to cover its growing electricity demand in 9 out of 10 years. The principle of self-sufficiency created a significant Nordic overcapacity and gave a large potential for efficiency gains by increasing power trade. R-2010-083 7 CHALLENGES FOR NORDIC POWER Competition in generation and supply combined with new principles for grid regulation, started a new age for most power companies. The prices were now set by the balance between supply and demand, and new regulatory schemes were developed to stimulate more efficient grid operations. Exposed to new risks, the transition from institutional monopolies to commercial actors was the main challenge for regional and national actors during the 1990’ies. 3.2 FROM SURPLUS TO SCARCITY A hydro-based system is constrained by the energy available, a thermal system by peak capacity. Due to the complementary nature of hydro- and thermal-based systems, trade between the Nordic countries has increased significantly over time and become increasingly well organized. Thermal capacity based on coal, primarily located in Denmark and to some extend in Finland, has most of the time been the marginal generation capacity, and setting the spot price. Nordic Power Balance without Denmark: Development 1990-2010 370 360 Generation and Demand (TWh) 10 Generation Demand Net Export 350 5 0 340 ‐5 330 320 ‐10 310 ‐15 300 ‐20 290 ‐25 280 270 Import (‐) TWh Export (+) TWh Figure 3.2 ‐30 2009 2008 2007 2006 2005 2004 2003 2002 2001 2000 1999 1998 1997 1996 1995 1994 1993 1992 1991 1990 Source: Nordel Doing away with the goal of self-sufficiency allowed for the full potential of integration to be harvested. Increasing trade and integration across borders was also facilitated by more efficient and transparent price formation, due to the establishment of the Nordic power exchange, Nord Pool, and easier third party access to the grid and interconnectors. As indicated in Figure 3.2, the power demand has steadily increased during the period, while the power trade has oscillated in accordance with variations in the precipitation and temperature. Gradually the excess capacity has been absorbed, and Norway, Sweden and Finland have in sum been net importers of electricity most years after 2000. The annual variations have been large, though, both for the region as a whole and the countries separately. R-2010-083 8 CHALLENGES FOR NORDIC POWER 3.3 PRICES: FIRST DOWN, THEN UP Falling prices and tumbling investments followed the deregulations in the 1990s. Except for 1996, which was a dry year, the power prices followed a falling trend to the year 2000. The downturn in prices and investments signaled the realization of genuine efficiency gains as the excess capacity was reflected in prices and gradually absorbed by increasing demand without the need for large investments. The upward price trend after the year 2000 was partly caused by increasing marginal production costs, i.e. increasing coal prices and a tighter market balance. Figure 3.3 Nordic power prices for the period 1996 to 2009 compared with power prices in Germany and the Netherlands 80 DE ‐ Nordic 70 NL ‐ Nordic 60 Nordic average €/MWh 50 Germany Netherlands 40 30 20 10 0 1996 1997 1998 1999 2000 2001 2002 2003 2004 2005 2006 2007 2008 2009 ‐10 Source: Nordpool, EEX, APX By the turn of the century, an increasing frequency of dry years with escalating prices became a source of worry for policymakers and authorities in the energy sector. Nevertheless, the market was able to maintain the power balance, even in dry years. The price spikes caused significant debate, in particular in Norway and Sweden, where endusers were more exposed to increasing power prices than in the other Nordic countries. Due to the steep decline in investments, price shocks and blackouts in the newly deregulated Californian market, public opinion started to question the robustness of a market-based power system. In particular, there was a growing concern over the ability of the system to generate sufficient and timely investments. Investments have been made during the last few years. However, considerable shares of these investments have been driven by regulations and support mechanisms. R-2010-083 9 CHALLENGES FOR NORDIC POWER Figure 3.4 Nordic generation mix in 1990vs.2008 1990 Nuclear power 15 % 2008 Wind power 0% CHP district heating 7 % CHP industry 4% Condensing power 16 % Hydropower 55 % Wind power 5% Nuclear power 12 % Hydro power 52 % Gas turbines 3% CHP district heating 16 % CHP industry 5% Condensing power 6 % Gas turbines 4% Source: Nordel Regarding the Nordic generation mix, the most notable development is the expansion of wind power which counted for 5 percent of total installed capacity in 2008, up from nearly nil in 1990. In the same period, nuclear capacity dropped from 15 percent to 12 percent, due to the dismantling of the Barsebäck reactors just before the turn of the century. Hydropower has also marginally reduced its importance, dropping from 56 to 53 per cent between 1990 and 2008.Within thermal capacity, the most notable development is the large increase in district heating, which in 2008 took up 16 percent of installed capacity, up from 7 percent in 1990. 3.4 INCREASED TRANSMISSION CAPACITY The transmission capacity between the Nordic countries has grown considerably during the last 20 years, from around 5000 MW to 9000 MW.1 During the same period, the capacity to other countries has more than doubled to a maximum of 5560 MW of imports and 4550 MW exports. By comparison, the installed generation capacity is around 90.000 MW and the typical maximum system load in excess of 60.000 MW. These investments have capitalized on the price differentials between the Nordic market and the Continent, and have constituted an important step in the North European market integration. As well as contributing towards a more efficient overall operation of the system, the increase in transmission capacity strengthens the security of supply in the hydro-dominated countries (Norway and Sweden). 1 As transmission capacities are not necessarily the same in each direction, the exact number depends on the assumed direction of power flow. R-2010-083 10 CHALLENGES FOR NORDIC POWER Table 3.1 Existing interconnectors Countries Stations Denmark – Germany Kassø – Audorf Kassø – Flensburg Ensted – Flensburg 2 x 400~ 220~ 220~ 1500 / 950 Denmark – Germany Ensted – Flensburg 150~ 150 /150 Denmark – Germany Bjæverskov – Rostock 400= 600 / 600 Finland – Russia Imatra – GES 10 110~ ‐ / 100 Finland – Russia Yllikkälä – Viborg Kymi – Viborg 2 x 400~ 400~ ‐ / 1400 Finland – Russia Nellimö – Kaitakoski 110~ ‐ / 60 Finland – Estonia Espoo – Harku 150= 350 / 350 Norway – Russia Kirkenes – Boris Gleb 154~ 50 / 50 450= Norway – Netherlands Voltage kV Capacity From/To MW Year Name Owner / Operator 1996 Kontek Energinet.dk, Vattenfall Europe 2006 Estlink Eesti Energia a.o. 700 / 700 2008 NorNed Statnett, TenneT Sweden – Germany Västra Kärrstorp – Herrenwyk 450= 600* / 600* 1994 Baltic Cable E.ON Sweden, Statkraft Sweden – Poland Stärnö ‐ Slupsk 450= 600 / 600 2000 SwePol Link SvK, Vattenfall, PSE‐Operator Source: Nordel From the early 1990s a few large cable development projects have been cancelled. The most notable ones have been the Euro Cable and the Viking Cable projects connecting Norway with Germany, and the North Sea Interconnector connecting Norway and the UK. A realization of these projects would have boosted the transmission capacity between the Nordic market and the Continent by 2400 MW. The two projects to Germany were terminated by the German counterparts due to falling power prices and doubts about the profitability of the projects. The NSI cable was turned down by the Norwegian authorities due to similar concerns about the overall economic benefits of the project from a Norwegian viewpoint. R-2010-083 11 CHALLENGES FOR NORDIC POWER Table 3.2 Three cancelled cable projects since early 1990 Euro Cable Viking Cable North Sea Interconnector • 600 MW planned capacity • Power exchange agreement between Eurokraft Norge AS and Eurostrom Trading Gmbh received concession in 1995. • Statnett SF established Eurokabel together with Eurostrom in 1995 • Eurokabel received investment concession in 1997 • Eurostrom terminated the power contract in 1999 • Eurokraft annunced arbritration case in 2000 • 600 MW planned capacity • Power exchange agreement between Statkraft and PreussenElectra (E.ON) • A 50/50 joint venture between Statkraft and Preussen Elektra named Viking Cable was established in 1994 • Viking Cable received investment concession in 1997 • Preussen Elektra terminated the contract after declared hardship in 2001 • 1200 MW planned capacity • Statnett SF and Natural grid Transco decided to develop the project in 1996. • Based on long term auction of physical transmission rights • The project did not receive concession by the Norwegian Authorities in 2003 Source: Nordel, project team analysis 3.5 WILL THE SUCCESS CONTINUE? By and large, the deregulation of the Nordic power sectors is a success story. Significant gains have been realized by improved utilization of the Nordic power system by removing the self-sufficiency doctrine, and hence the gradual reduction of overcapacity in the system. However, along with increased focus on climate change policy, investments have increasingly been driven by political decisions. The EU’s 20-20-20 policy implies that an overwhelmingly large part of new investments will be based on renewable energy sources, which in the foreseeable future are completely dependent on regulatory mechanisms such as feed-in tariffs or green certificates. In this perspective, the future of the Nordic market system may be less dependent on market dynamics and more on energy and environmental policies than the architects behind the market reforms of the 1990s probably would have expected. On the other hand, the impact of policy will depend on the market agents’ response to the incentives and obligations imposed, thus creating an ever more complex dynamic interaction. From that perspective, the future of the Nordic power system remains open. R-2010-083 12 CHALLENGES FOR NORDIC POWER 4 SCENARIOS – WHAT COMES NEXT? As described in Chapter 2, the Nordic power sector is faced with great uncertainties. Also, the choices made during the next few years will have a lasting impact on the development of the Nordic electricity sector for the next 20 years. Based on this, we have chosen to use a scenario approach in order to analyze and assess potential futures for the Nordic power market up to 2030. Scenarios are tools that help decision makers to make decisions and plans under uncertainty: “Scenario planning is a discipline for rediscovering the original entrepreneurial power of creative foresight in contexts of accelerated change, greater complexity, and genuine uncertainty” Pierre Wack, Royal Dutch/Shell, 1984 One can tell an infinite number of stories about the future. The purpose of scenarios is to tell stories that matter and that can help in decision-making. The scenario process involves different techniques, such as research, brainstorming, and storytelling. It eventually leads to a narrative account of possible futures, such as the four presented in this chapter. Scenarios are not predictions, or extrapolations of current trends into the future. This implies that scenarios presented here, or the results thereof, are not price forecasts. The purpose is not to pinpoint future events, but to consider forces that may push the future along different paths. It is important not to pick a preferred scenario, nor is it appropriate to focus on the most likely scenario. In order to be prepared for the future, it is essential to have thought and evaluated the outcome in all scenarios. The results of a scenario analysis are not a better picture about the future, but better – and more creative - thinking about it, which will allow better decision making today. The ultimate goal is to understand, and to be prepared. As part of our analysis, we created four scenarios, and we analyzed power balances, prices, cable effects, and other important aspects in the power markets, for each of the scenarios up to 2030. An illustration of the scenarios and the overall drivers is given in Figure 4.1. R-2010-083 13 CHALLENGES FOR NORDIC POWER Figure 4.1 Overview over Scenarios and Drivers How much renewables do we get? Supply growth 1. Politics work Use increased generation at home, or export? 2. Green growth Higher demand for electricity Lower demand for electricity 3. Stagnation 4. Supply worries Supply stagnation Essentially, we distinguish the scenarios by what happens on the demand side (high or low demand for electricity, which may be driven by economic growth, energy conversion, efficiency gains etc.), and by what happen on the supply side (renewable investments, the future of nuclear, etc.). The main long-term driver behind the development of the power system will always be to maximize the value of electricity consumption to society. The economic fundamentals underlying the analysis of the scenarios are presented in Appendix 1: How electricity infrastructure creates value. There we describe how electricity infrastructure – which we define as power plants, network assets and equipment and assets for consumption of electricity – create benefits to society, and at what cost. In particular, we focus on interconnector capacity between the Nordic countries, Continental Europe and the UK. In order to quantify the outcome in the scenarios in terms of prices, power balances, trade, etc., we employ the Econ Pöyry BID model to measure these parameters under the different set of assumptions. The BID model is a so-called fundamental power market simulation model. It mimics the power markets by finding prices, trade, generation, etc. as a result of an optimization problem. A more detailed description of the modeling can be found in Appendix 2: Modeling Methodology. Before describing the scenarios in more details, we continue by mapping out the main drivers and challenges with regard to policies, and market conditions, concentrating on the most important factors that affect electricity demand and supply and the value of network investments. These drivers are translated into scenario building blocks, which are the foundation for the scenarios. R-2010-083 14 CHALLENGES FOR NORDIC POWER 4.1 BUILDING BLOCKS IN THE SCENARIOS In the scenarios that we present in this study, we aim to combine outcome and directions for different drivers and challenges to a consistent picture for future developments and market outcomes. The main building blocks for our scenarios are: Climate policy: What will the targets be and what is actually achieved? Especially for the Nordic countries, this question if of importance as the assumption on achievements will feed directly into the energy balance (both via new renewable energy, conversion of energy, and energy efficiency). Furthermore, climate policy and achievements will also be important in the determination of CO2 allowance prices. Potential carbon costs compensation for power intensive industry in order to prevent carbon leakage is also an important aspect of climate policy measures. Macroeconomic development: How will the world economy develop? The answer to this question is very important in determining future demand for electricity, as demand growth for electricity is strongly linked with economic growth in general. High economic growth typically also determines demand for industrial products, such as aluminum, and is hence an important determining factor for the development of power intensive industry. Power intensive industry: Will the demand increase, or will there be a decline in power intensive industry due to migration of industry? The answer to this question is an important element in determining the future energy balance. Fuel Prices and CO2 prices: What will be the future fuel and CO2 prices? The answer to this question will be essential in determining future price levels, as both fuel and CO2 prices directly determine the short-run marginal costs of generation. Together with investment costs, they are hence crucial in determining the future composition of power capacities, namely whether coal or gas will set the margin price, which in turn also impacts CO2 prices. Market integration: What new interconnectors will be built, and how will they and existing interconnectors be utilized in the market? The answer to this question is important in determining future trade and how strongly prices between countries will be linked. Technology: Which new technologies will become available, and at what costs? The answer will be one of the factors determining the future composition of power generation. The following sections give a more detailed overview over the different drivers taken into account in the different scenarios. 4.1.1 Climate policy, renewable energy and energy efficiency Global The future of international climate policy is unknown. The 15th UN Climate Change Conference in Copenhagen (COP 15) is history, and the upcoming conference in Mexico is unlikely to bring any concrete results and binding agreements. Climate policy is therefore one of the major unknown, yet important drivers for the future of the world economy and, in consequence, the Nordic power market, as it will impact the demand for goods, and the relative competiveness of Nordic industry. R-2010-083 15 CHALLENGES FOR NORDIC POWER In our scenarios, we therefore try to cover possible outcomes for international climate policy: International Climate Accord: In case of an international climate agreement, be it a cap-and-trade system or a global CO2 tax, there will be a level playing field for industry when it comes to carbon costs. This would be an important factor when evaluating the potential migration of industry from the Nordic countries. No International Climate Accord: The relative competitiveness of industry between Scandinavia /Europe and the rest of the world will be crucially dependent on the carbon costs in the EU, and whether there will be carbon cost compensation for industry. EU The EU’s climate policy will play an important role in case there is no international climate agreement. If there is no climate agreement, it is still likely that the EU will pursue the one or other form of cap-and-trade system, or a carbon tax. Three factors will be crucial in determining the outcome for power markets: What will the targets for renewable energy be (until 2030)? Most renewable generation is some form of intermittent generation. The amount of renewable generation will therefore be an important element in the price formation, and future price volatility. This, in turn, will be an important factor in determining the benefit and value of interconnectors to and from the Nordic market. How tight will be the CO2 cap? This is a crucial factor in determining the price for CO2 emission allowances, and hence an important factor in determining generation costs and power prices. Will there be a compensation for carbon costs for power intensive industry? Such compensation, currently discussed in the EU, would aim to rectify disadvantages European industry may have compared to foreign industry as a result of carbon costs. It is therefore an important factor in determining the amount of potential carbon leakages in form of industry migration. National The national targets for renewable generation in the Nordic countries are equally important as the EU targets. First, they are important in determining the power balances. The Nordic market is dominated by hydro and nuclear, and is an energy market rather than a capacity market. Any form of intermittent generation will therefore add to the power balance. As the power balance is an important element in the price formation, the amount of renewables has direct consequences for the price levels. Furthermore, even though the Nordic countries have a better ability to balance the volatile generation of wind and other form of intermittent generation, additional renewable generation may limit the amount of capacity available to balance Continental intermittent generation via the use of cables. R-2010-083 16 CHALLENGES FOR NORDIC POWER The large uncertainties around national renewable policies are therefore: How ambitious will the national targets be (until 2030)? This will determine the amount of renewable generation, and also the allocation between countries. Will there be a common Green certificate market between Norway and Sweden? While the answer to this question is not so important for the total amount of renewable in the Nordic countries, it will be an important factor determining the allocation of renewable generation between Norway and Sweden. Are there bottlenecks in the supply of equipment, or are there “Not-in-my-backyard” (NIMBY) issues around renewables? These factors may delay the achievements in renewable investments. 4.1.2 Macroeconomics Global economic developments are very important in the determination of fuel prices, and hence in the determination of power prices. Furthermore, the international economic climate will not only impact fuel prices, but also demand for industrial products. This is in particular important when making scenarios around future demand in Nordic (power intensive) industry. Long-term macroeconomic developments are impossible to foresee, and need to be part of the scenario story. In our scenarios, we therefore try to distinguish the economic growth. The largest uncertainties for the world economy are: Will there be a double dip recession? The world economy, while in a state of recovery now, is still fragile. For example, the risks that lie in the Chinese housing market and the large deficits of some states are still real, and may cause an international downturn leading to a prolonged stagnation. How high will the long-term growth be? If the world does not end up in a prolonged stagnation, the question still remains how fast global economic activity will expand, and how European states and Scandinavian countries are performing. In our analysis of electricity demand, we take account of GDP growth assumptions, as historically there is strong evidence for a relationship between GDP growth and growth in demand for electricity. 4.1.3 The future of power intensive industry The future of power intensive industry in the Nordic countries is an important factor in determining the future power balance in the Nordics. The development of power intensive industry will be dependent on a number of factors: How will the international economy develop? High growth is typically associated with high demand for industrial products. Thus high economic activity is linked with high activity from power intensive industry. The international economic growth will also be an important factor in determining the costs of other input factors in power intensive industry. What will the power prices be in the Nordic area compared to power prices in other parts of the worlds? The answer to this question will be dependent on the spot prices, potential tariff changes, and whether there will be a form of carbon cost compensation or not. R-2010-083 17 CHALLENGES FOR NORDIC POWER What will happen to the Nordic power intensive industry? The uncertainties are mainly associated with primary aluminum production and the pulp and paper industry. The uncertainties in the aluminum industry are especially large after 2020 when most of the long-term power contracts expire. Within the pulp and paper industry there could be a downside, consisting of more closures due to weakening international markets, particularly in the newspaper market. This is especially relevant in the short to medium term. 4.1.4 Fuel prices and CO2 prices Fuel prices and CO2 prices play a significant role in the formation of power prices, as both enter directly the short-run marginal costs of generation via efficiencies and carbon content of the different fuels. Furthermore, the relative fuel prices for coal and gas (including investment costs) determine the competitiveness of the different forms of generation, and play hence an important role for how the future generation parks may be composed. Fuel prices are one of the most uncertain factors in the scenarios, and the scenarios are differentiated by the following factors: What will be the level of fuel prices? The answer to this question is strongly related to the assumption on general economic growth. Typically, high economic activity implies high demand for fossil fuels, and hence high fuel prices, in particular if the economic rise of countries like China or India continues. We acknowledge, of course, that there is also a feedback, as high fuel prices may dampen economic activity. How will the supply side develop? Will oil extraction have peaked soon (“oil-peak”), or will new technologies and the discoveries of new oil fields ensure sufficient supply? The answer will influence the price level for oil and other fuels. Will the oil-indexation of gas prices continue? The answer to this question will be important when discussing to what extent gas will be competitive with coal as a fuel in power generation. CO2 allowance market The CO2 price plays an important part in both price levels and the relative competiveness of different fuels. The CO2 allowance price enters directly into the short-run marginal costs of power generation. For example, today a coal plant has a pass-through factor of 0.8, meaning that if the allowance price increases by € 10 per ton, the short-run marginal costs increase by € 8 per MWh. At the same time, developments of the carbon market remain a significant uncertainty. No agreement was reached at the meeting in Copenhagen, and when or if a global agreement will materialize remains very uncertain. The main uncertainties around the materialization of the CO2 allowance price are the same as described in Section 4.1.1 about climate policies. In addition, abatements costs in other sectors, and which sectors are included play an important role. The interplay between fuel prices and CO2 prices The CO2 prices are influenced by relative gas and coal prices. The cap implies that emissions cannot exceed a certain level within the trading period. The supply of emission allowances is given. Import of allowances from the flexible mechanisms is allowed, but restricted. Hence, the effective cap is a bit higher than the issued ETS allowances (EUAs). R-2010-083 18 CHALLENGES FOR NORDIC POWER The demand for allowances is determined by general economic growth, changes in production in the power, heat and industry sectors, energy efficiency and fuel prices. For a given economic structure, abatements are made by fuel switching in the power sector: The effect of the CO2 price is to rearrange the merit order of plants so that total emissions stay within the effective cap by shifting coal power plant to the right in the merit order, and hence gas power to the left. This means that the CO2 price is not independent of relative fuel prices. A higher gas price, relative to coal, and all else equal, implies that a higher CO2 price is necessary to induce the required fuel switching. This mechanism also influences investment decisions since the expected economics of a new thermal plant impact on the future demand for allowances, and the expected CO2 price. 4.1.5 Market integration The EU is pursuing increasing market integration, and is promoting a development towards an Internal Energy Market (IEM), characterized by efficient competition, increased transparency and more cross-border exchange of electricity. Furthermore, Statnett has announced ambitious plans to build new interconnectors to Germany, The Netherlands, and the UK. Other Nordic countries also have plans to build other new transmission lines to the Continent (Sweden-Lithuania, Denmark-Netherlands, Finland-Estonia etc.). The degree of interconnection is an important element in determining price developments in the Nordic area, as it will influence how both price levels and price volatility may be linked in the future. In our scenarios, we therefore account for the following uncertainties: Which cable projects will be implemented? The answer to this question will determine the degree of market integration, and to what extent prices in different market areas are correlated. Here we distinguish the scenarios not only by the amount of new transmission cables to the Continent and the UK, but also to what extent the intraNordic grid is extended. Will there be bottlenecks in the supply of cables? Cable project are large projects that take several years to implement. At the moment, there is high demand for transmission cables internationally, also to connect offshore wind farms to the main land. This situation could lead to delays in implementation. 4.1.6 Technology Technology will change. Existing technology will be developed further or it will be replaced by new technologies. This development will to various extents reduce the costs of different types of power generation, end-user flexibility, CCS, transmission and storage of electricity. Key uncertainties include: Will CCS (Carbon Capture and Storage) become commercially available? The answer to this question will impact CO2 prices and costs of power generation in general. How will the costs for renewable generation develop? Will there be a steep learning curve, making new renewable generation commercially available with no or reduced support from governments? The answer of this question will determine the extent of renewable generation. R-2010-083 19 CHALLENGES FOR NORDIC POWER Will there be new technologies for balancing the power system on a large scale, such as smart grids, or new pumped storage or pumped storage equivalent technologies (pressurized air)? The answer to this question will determine future price structures, in particular in thermal/wind systems like Germany or the UK. While we do not address all these questions explicitly in our scenario assumptions, they are implicitly contained in our assumptions about renewable generation. The issue concerning system flexibility is addressed in one of the sensitivities. All prices, costs and revenues reported are in 2010 real prices. The scenario descriptions are written from the perspective of an observer in the year 2030. 4.2 POLITICS WORK: EU POLICY TARGETS ARE MET Over the last 20 years, European greenhouse gas emissions have been substantially reduced through a remarkable reformation of energy use and production. This unprecedented restructuring of a multi-billion industry would probably not have happened without the adaptation of widely accepted global emission reduction targets at the COP meeting in Moscow in 2018. However, for Europe, the success story can be traced back to the ambitious climate and energy policy package adopted in 2009, and the successful implementation of market based measures, both of which have proved instrumental to reach the goals. Today the European energy sector is highly efficient, highly integrated and adapted to the requirements of a low-emission future. The Nordic electricity sector has contributed to the development through exports of renewable electricity. In addition, the expansion of interconnector capacity from the Nordic area has helped facilitate the transition by providing hydropower flexibility to the market. Table 4.1 Politics Work: Main Indicators 2020 2030 New transmission capacity (MW) 5.350 6.450 Power export 2020 (TWh) 46 22 Power price Nordic (€/ MWh) 40 61 Power price Europe (€/ MWh) 57 70 CO2 price(€/ t) 18 30 2 Gas price ($/ MMBtu) 7 10 Oil price ($/ barrel) 86 87 Coal price ($/ t) 69 69 Source: Project team analysis 2 From the Nordics to outside Nordics; does not include inner-Nordic grid investments R-2010-083 20 CHALLENGES FOR NORDIC POWER Ambitious European climate policy targets The 23rd of April 2009, the EU Parliament adopted radical and ambitious policy targets: The so-called 20-20-20 by 2020 climate and energy policy package. The package set the EU on track to reduce greenhouse gas emissions by 20%, increase the share of renewable energy to 20% and improve energy efficiency by 20%, all by 2020. The Commission followed suit by designing community-wide benchmarks, standards and burden allocation mechanisms. Although the targets were not fully met by 2020, the policy package proved to be a powerful political tool, setting Europe on track to reshape its energy sector and prepare for a low-carbon future. The largely policy driven development in 2010-2020 was succeeded by a strongly market driven approach in the following decade. In the target year 2020 the general perception of the implications of the climate and energy policy package was positive, although some environmentalists were unhappy, pointing at the failure to fully comply with the targets and arguing the need for stricter policies. However, the European energy sector was largely transformed in the decade from 2010 to 2020, both in terms of energy use and emissions, and in terms of market solutions and trade. Particularly in view of the new international climate policy agreement reached in 2018 in Moscow, which entered into force in 2020, it now seems clear that the implementation of the “2020 policy” had positioned Europe for making the necessary adaptations. However, the costs had been high, and the massive investments carried out clearly put a strain on the European economies, particularly in the early years. But along the way some remarkable compromises were made – ensuring that the program was carried forward – albeit with some adjustments along the way. The climate and energy package got off to a rugged start in 2010-2011, when several member states still struggled hard with weak state finances following the credit crunch shaking financial markets and the world economy in 2008-2009. The EU Commission managed in spite of this to pull the energy and climate policies through, amid fears that the Euro would collapse. This included keeping the emission reduction target at 20% and allowing moderate targets for renewable energy and energy efficiency in the early years of the implementation phase. The 2014 progress evaluation showed that the countries had managed to broadly follow the targets set by the National Action Plan (NAP) trajectories, partly helped by the slow upturn of the economies. The EU countries had managed to steer state budgets back on sustainable tracks, through tough budget cuts and a solidarity approach to the economic problems. The Euro was saved and the economies positioned to take on increased efforts. Unemployment levels were still high, but the consensus perception was that the economic stimuli offered by investments in infrastructure and energy would be beneficial in helping economic growth levels pick up. The increased integration of markets – both physically and by way of trade – was crucial in order to manage the political ambitions and achieve efficiency gains benefiting European businesses. The now familiar market for green certificates in Europe was instrumental to incentivize investments in new renewable heat and electricity from 2015 onwards. The crucial compromise made in 2014 was to postpone the 20% renewable energy target to 2025, and to allow more flexibility in Member State’s compliance. This compromise would not have been possible without the increasing evidence of global warming and the continued efforts to reach a global climate policy agreement, efforts that were rewarded by the adoption of the Moscow Protocol commitment period to 2030 and beyond. R-2010-083 21 CHALLENGES FOR NORDIC POWER It was indeed crucial to start the transition of the energy sector in the 2010s as huge shares of the power generation infrastructure, mainly coal power plant, were heavily in need of investments. Expecting a new global climate agreement, politicians and electricity generators saw a common interest in facilitating investments in carbon free technologies. CCS is still not a viable commercial technology, although some promising technology progress has been made. The new Nuclear Security Directive (NSD) entering into force in 2021 secured nuclear power as a viable option for base load generation in the low-carbon energy sector. Worries and challenges associated with the intermittency of wind power have been managed by new developments in demand side flexibility, flexible gas turbines and new market design, and facilitated by the increase in interconnector capacity to the Nordic hydro system. Here market incentives have been instrumental in providing the proper incentives during the last decade. Nordics successfully utilized renewable resources and flexibility Intermittent renewable energy in Europe has expanded and an increasing Nordic power surplus was built up between 2010 and 2020. The Nordic countries seized this opportunity to increase interconnector capacity to the Continent and thus profit from exports of electricity as well as regulating services. Electricity exchange between the Nordic countries and supply of regulating power and system services eased the expansion of wind power in North West Europe. In addition to this, the successful implementation of a common green certificate market for Norway and Sweden in 2012 paved the way for the common European green certificate market that most EU countries are now participating in. Electricity demand growth was initially modest in the Nordic area after the initial catch-up following the financial crisis, but has seen a remarkable growth in the last decade. In the 2010s large-scale migration of energy intensive industries was mitigated by carbon leakage policies implemented from 2013. With the adoption of the Moscow Protocol, introducing a global cost of CO2 emissions, carbon leakage seized to be a threat to EU and Nordic industries. Carbon leakage provisions were phased out and industries could compete globally at a level playing field. Nordic industry could then fully benefit from low electricity prices compared to the rest of Europe and the world, based on the substantial power surplus established before 2020, and thrived. Norway has embarked on a process of transforming from an economy based on oil and gas exports, to an economy based on energy technology competence. The new markets for bio fuels and biomass are set to be a growth area for Nordic industry. Globally, the demand for aluminum and other light metals is set to grow as the rest of the world follows Europe in renewable energy expansion (wind and solar). Figure 4.2 shows the trend in power generation per energy type and demand from 2000 to 2030. The increasing export surplus from 2010 to 2020 is easily spotted, and so is the subsequent catching up by Nordic demand in the last decade. R-2010-083 22 CHALLENGES FOR NORDIC POWER Figure 4.2 Nordic Power Balance 2030, Politics Work 500 TWh 450 400 Biomass 350 Wind offshore Wind onshore 300 Hydro 250 Other 200 Oil 150 Natural gas 100 Coal Nuclear 50 Demand 0 2030 2028 2026 2024 2022 2020 2018 2016 2014 2012 2010 2008 2006 2004 2002 2000 Source: Project team analysis In the 2010s, the main increase in generation came from renewable energy sources and nuclear power. The Nordic power industry comes out on top Obviously, the strong build-up of new renewable capacity and export surplus in the Nordic market in the 2010s reduced the margins of existing generation capacity. New additions of power generation capacity were almost exclusively made in new renewable capacity eligible for green certificates or feed-in tariffs. Old coal power capacity phased out in Finland and Denmark were not replaced by new fossil generation capacity. New base load additions came in the form of a new nuclear reactor commissioned in Finland, Olkilouto 3, in 2011, and expansions of existing nuclear plants in Sweden. Since 2020, however, the growth in new renewable capacity has been modest, with the main capacity addition being the new nuclear plant in Finland. The increase in demand from the power intensive industry and the strong interconnections with markets outside the Nordics, coupled with integrated, sophisticated market mechanisms, means that the meager years’ from 2010-2020 has been succeeded by a very prosperous period in the 2020s. The fuel markets Modest economic growth and lenient climate policies implied a certain supply surplus of gas in Europe and coal globally in the aftermath of the 2008 economic meltdown. After the completion of several large investment projects, removing bottlenecks in the coal value chain in 2010-2012, coal prices have stayed largely on level with supply costs throughout the decade. Shale gas developments in the US and increased Liquid Natural Gas (LNG) terminal capacity in Europe, combined with modest demand growth in the early years, implied that European gas prices were finally delinked from oil prices, and currently gas prices are set by long-term supply costs to Europe as well. R-2010-083 23 CHALLE ENGES FOR NO ORDIC POWER R Figu ure 4.3 Fuel Pricces in the Politics P Work k Scenario (normalized d: 2010 = 10 00) Sourrce: Project team analysis The e combinatiion of relattively low gas prices and rema aining unce ertainty abo out future clim mate policie es and cossts for Carb bon Capturre and Sto orage (CCS S), made gas g more attra active for new n investments in power p gene eration than n coal in tthe 2010s. In some countries, som me coal plant investtments werre carried out, but these were mainly asso ociated with h lifetime exxtension of plant in order to complly with the L LCPD3-direc ctive, and replacement off existing old plant. e to the rela atively low gas g price an nd lenient ca ap in the EU U ETS, the CO2 price was w fairly Due low in the perio od up to 2020, at only € 18 per to on CO2. Fro om 2020 onwards, how wever, the CO2 price has increased to some € 30 per ton CO2 as a result of more strict and global caps, and an increasing global gas price. Natu urally, globa al demand for gas ha as soared follo owing the adoption a of the Mosco ow Protocol, putting a price on emissions worldwide, w and this has afffected gas prices. Alth hough coal prices have e stayed fairrly low, the growth in coal demand fo or power ge eneration ha as substantially slowed d down in th he last deca ade. wer prices Pow Masssive investtments werre made in interconne ector capaccity between n the Nordic market and the marketts on the co ontinent and d in UK up to t 2020. However, sign nificant diffe erences in pricce levels rem mained. Th he huge exp port surplus s that was built b up in tthe Nordic market in the 2010’s, at the same tiime as price variations s implied more m system matic and intermittent pricce variationss in Contine ental marke ets, implied that electrricity prices in Norway,, Sweden and Finland stayed well below b prices elsewhere e in Europe e, see Figure 4.4 belo ow, where the German prrice is used d to illustratte prices on n the Contiinent. In the e last deca ade, there havve been less investment in new power p gene eration capa acity and in nterconnections, and due e to the masssive growtth in deman nd, particula arly from th he power intensive industry, the pricce level in th he hydropow wer system came close er to the Co ontinental le evels. 3 L Large combustio on plant directive R-201 10-083 24 CHALLENGES FOR NORDIC POWER Figure 4.4 Power Price Developments in the Politics Work Scenario (€ per MWh) Power Price (€ per MWh; Real 2010 Prices) 80 70 60 50 40 30 Nordic 20 Germany 10 0 2010 2020 2030 Source: Project team analysis Despite the massive investments in interconnector capacity, and high net exports from the Nordic area, particularly in the 2010s, the Nordic price structure only to a small extent mirrors the Continental peak/off peak pattern. Trade Substantial new interconnector capacity has been installed between the Nordic area and Continental markets, including Estonia, Lithuania, Germany, Netherlands and the UK. The big boom in interconnectors mainly took place towards the end of the 2010s. Table 4.2 below gives an overview of capacities and launching of the most relevant expansions. Expansions include some increases in intra-Nordic transmission capacity, such as the Southwest Link and Skagerrak 4, but the majority of investments strengthened the capacity between the Nordic area and adjacent markets. Altogether transmission capacity has increased by a whopping 9650 MW, of which 7850 MW were directed to the Continent and Baltic states. R-2010-083 25 CHALLENGES FOR NORDIC POWER Table 4.2 Additions in interconnector capacity 2010-2030 Connected areas Capacity, MW Commissioning year Expansions Denmark-Germany 500 2012 Southwest link Norway-Sweden 1200 2015 SK4 Denmark-Norway 600 2015 BritNed Netherlands-UK 1000 2015 Estlink 2 Estonia-Finland 650 2015 COBRA Denmark-Netherlands 600 2025 SweLC Lithuania-Sweden 700 2018 Nord.Link (or NorGer) Germany-Norway 1400 2020 PolLit IC Lithuania-Poland 1000 2020 NorNed 2 Netherlands-Norway 700 2020 Expansions Denmark-Germany 500 2025 NSN Norway-UK 1400 2025 Total 10.250 Source: Project team analysis The increase in transmission capacity is of course related to the substantial surplus generation from hydro, wind, biomass and nuclear capacity – all capacity with low variable costs. Hence, expanding interconnector capacity to several high-price markets was a security of demand measure, as well as a way of securing the value of existing generation capacity. As can be seen in Figure 4.5, the export surpluses of Norway and Sweden in the last 20 years have been, and basically remain, high. In 2020, the Norwegian export surplus was 14 TWh, about 10% of total generation. The corresponding numbers for Sweden were 25 TWh and 14%. Both Finland and Denmark have substantial trade flows, but imports/exports are more balanced on an annual basis. In 2030, Norwegian exports are down to less than 5% of generation in normal years. Similarly, Swedish normal year exports are below 4% of annual generation. Finland, on the other hand, despite investments in nuclear capacity, has yet again developed an import dependency in normal years. However, contrary to historic trade patterns, the net import to Finland now comes from Sweden, partly as transit from Norway. Denmark has significant net transit of power from Sweden to Germany, whereas net exchange with Norway is pretty much balanced. R-2010-083 26 CHALLENGES FOR NORDIC POWER Figure 4.5 Net Trade in the Politics Work Scenario (TWh per year) Exports (‐) Import (+) (TWh per annum) 15 10 Russia Lithuania 5 Estonia 0 UK 2020 ‐5 2030 Norway 2020 " 2030 Sweden 2020 " 2030 Finland 2020 " 2030 Denmark ‐10 Poland Netherlands Germany Finland ‐15 Denmark ‐20 Sweden Norway ‐25 ‐30 Source: Project team analysis The figures imply that on the whole, the interconnector capacity that was mostly developed in the latter half of the 2010s, to a large extent for exports, now serves as exchange capacity between the Nordics and the Continent. This does not mean that the utilization of the cables is dramatically reduced, just that the capacity has been increasingly used for imports in low load periods as electricity consumption has caught up with supply during the last decade. 4.3 GREEN GROWTH: A SUCCESSFUL TRANSITION Admittedly, we still have a long way to go before the transition to a low-carbon economy is completed. And there are still many challenges to overcome. But the last 20 years major policy and market changes have made it clear that we have made substantial progress. The reductions in global climate gas emissions have exceeded the targets so far. How has this been possible? To a large part it is a result of bold political choices backed by one of the longest growth periods in modern history. Some countries have been bolder than others, and have profited the most. The Nordic countries have been particularly successful in reaping the benefits from the transition, and are now at the forefront of technological and regulatory development. Indeed, not only power is exported, but also sophisticated market design solutions allowing for extensive export of flexibility from hydro power generation to the Continental markets. R-2010-083 27 CHALLENGES FOR NORDIC POWER Figure 4.6 Green Growth: Main Indicators 2020 4 2030 New transmission capacity (MW) 5350 7050 Power export 2020 (TWh) 23 22 Power price Nordic (€/ MWh) 51 72 Power price Europe (€/ MWh) 62 81 CO2 price (€/ t) 30 45 Gas price ($/ MMBtu) 7 10 Oil price ($/ barrel) 120 134 Coal price ($/ t) 105 119 Source: Project team analysis A major political achievement: The global climate agreement The global economic growth has been an important driver to make the necessary climate and energy policy changes. But economic growth has also been a result of the political choices made. For many countries investments in renewable energy and necessary upgrade and expansion of infrastructure was one important element in the economic recovery after the financial crisis that hit the global economy in 2008-2010. Along with increasingly extreme weather conditions resulting in storms, hurricanes, floods and droughts at a frequency and level never before experienced, this paved the way for one of the most remarkable political achievements in history; the global climate agreement in 2012. The global climate agreement reinforced EU’s move on combating climate change by setting an emission reduction target of 30%, increasing the share of energy consumption from renewable energy to 20% and to increase energy efficiency by 20% within 2020. The global climate agreement led to CO2 prices that reached 30 Euro per ton in 2020 and 45 Euro per ton in 2030. The diminishing role of fossil fuels in energy consumption Oil, gas and coal still are the most important energy sources even though their share has been reduced. A major reason behind the reduced share was the global climate agreement that put a global price on carbon emissions. However, other factors such as economic growth, gradual reduction of oil subsidies and supply side constraints have pushed prices higher. Historically, oil and gas prices have been closely linked. However, political opposition towards both tar sand production and deep-water production hit the oil industry in the 2010’s. The vast oil leakage in the Mexican gulf in 2010, which led to the once so mighty BP being sold to ExxonConocoPhillips, was the main reason that deep-water oil production came to a halt for many years. In addition, production from existing fields was gradually declining, leading to the high oil prices in the so-called “peak oil” era from 2012 to 2020. Demand for oil was initially still strong, however, as there were few viable substitutes for petroleum in the transport sector. So even if oil subsidies were reduced over time and weakened demand, prices were high. The peak oil era on the one hand, 4 From the Nordics to outside Nordics; does not include inner-Nordic grid investments R-2010-083 28 CHALLENGES FOR NORDIC POWER and the increasing development of shale gas was finally enough to decouple oil and gas prices, leading to lower gas prices vis-à-vis the oil price. Over time, however, the increased use of gas to power in Europe and switching to gas globally led to higher gas prices in absolute terms. Coal is still a vast resource. So even though carbon prices were implemented and economic growth strengthened demand, the price increase has partly been offset by resource availability and few supply chain constraints. Fuel Prices in the Green Growth Scenario 160 14 140 12 120 10 100 8 80 6 Coal 60 4 40 Natural Gas 20 2 0 0 Gas Price ($ per MMBtu) Coal Price ($ per tonne) Figure 4.7 2030 2029 2028 2027 2026 2025 2024 2023 2022 2021 2020 2019 2018 2017 2016 2015 2014 2013 2012 2011 2010 2009 2008 2007 Year Source: Project team analysis The ever-increasing role of electricity The use of electricity has now spread to new fields. According to experts in IEA, converting from fossil fuel to renewable electricity has been the most effective way to both reduce emissions and to increase energy efficiency. First of all, in the transport sector electricity used for transport is 60-70 percent more efficient than petroleum. After the technological break-through in batteries, the penetration of electric vehicles in the Nordic market has skyrocketed. Electricity has also been used to replace gas turbines on platforms in the North Sea effectively reducing emissions from oil and gas production. In later years, electricity is increasingly used in the heating sector, replacing other fuels in large heat pumps and electrical boilers in periods with low prices due to hydro or wind conditions. Another interesting aspect of implementing the global climate agreement was that the Nordics again was considered an attractive place to locate power intensive industry. The reasons: First, putting a global price on carbon emissions created a level playing field for industry, thus locating industry where power supplies were abundant, secure and power prices relatively low. Secondly we have seen a structural shift in location of manufacturers from China to the EU. Manufacturers have done this in order to reduce the threat of trade barriers and to be located closer to the marketplaces and raw material suppliers. R-2010-083 29 CHALLENGES FOR NORDIC POWER Many means to an end The conversion from other fuels to electricity in new sectors supported the trend towards increased investments in renewable power generation due to EU’s ambitious targets for renewable energy. The Nordic countries have historically based their power systems on different combinations of technologies for power generation. So it was only natural that the countries found different ways to meet the RES goals initiated by the EU. Norway and Sweden implemented a joint green certificate market to support renewable electricity generation in order to meet the targets in the RES directive. By being technology-neutral, the certificate market ensured cost-effective investments in renewables, regardless of whether the investments were made in Norway or in Sweden. Norway and Sweden have also effectively put the system to use for building offshore wind production in the North Sea and Baltic Sea. Denmark on the other hand, continued its successful feed-in and auction system to incentivize wind production along with an aggressive phase-out of coal, partly by conversion to bio. Finland phased out coal by building new nuclear capacity. The last two decades Finland has put three nuclear facilities into production. All in all, it proves that EU’s idea of setting goals, and then leave it to the national governments to find the means, has proven to be effective in reaching the aggressive RES goals set in 2010 and 2020. The result of the drive towards energy efficiency and increased RES put the Nordics at the forefront of the transition to the low-carbon economy. Figure 4.8 Nordic Power Balance in the Green Growth Scenario 500 TWh 450 400 Biomass 350 Wind offshore Wind onshore 300 Hydro 250 Other 200 Oil 150 Natural gas 100 Coal Nuclear 50 Demand 0 2030 2028 2026 2024 2022 2020 2018 2016 2014 2012 2010 2008 2006 2004 2002 2000 Source: Project team analysis Capitalizing on system changes - the Nordics role as swing producer for Europe As an increasing part of power production comes from wind turbines in Europe, the challenge of balancing the system has increased. Countries like Norway have capitalized on this development by exporting the flexibility in hydro generation. “Norway’s vast hydro reservoirs are Europe’s battery”, one senior EU official comments, “as the power production may be regulated up or down according to the fluctuating wind production and demand.” R-2010-083 30 CHALLENGES FOR NORDIC POWER But the infrastructure costs have been high, both in relation to investments in interconnectors, as well as the strengthening of the national grids. Senior officials from the large power intensive industry worried that the infrastructure costs would reduce the industry’s competiveness. “This has been refuted.” the director of the Norwegian TSO says, “There is no doubt that the interconnectors are economically profitable for Norway, and have contributed to a reduction in network tariffs.” Figure 4.9 Power Price Developments in the Green Growth Scenario (€ per MWh) Power Price (€ per MWh; Real 2010 Prices) 90 80 70 60 50 40 Nordic 30 Germany 20 10 0 2010 2020 2030 Source: Project team analysis The changing generation mix has benefited both Norway and other countries. Denmark, a worldwide front-runner in wind generation, has developed several system services in order to balance their power system. Among these are systems that incentivize the use of electricity for charging car batteries when prices are low, and putting them back to the grid when prices are high. Systems that later have been exported to several countries around the world. Trade: Strengthening the interconnector capacity between the Nordics and the Continent and UK Following the growth in renewables, the interconnector capacity out of the Nordic region has been significantly strengthened. Particularly important have been the new links between Norway and the Continent, and Norway and the UK. The ambitious plan of the Nordic TSOs from the early 2010s has therefore been implemented much in contrast to what many stakeholders thought possible around 2010. The major obstacle to such a rapid infrastructure development was the trade-off between climate change and local community issues. Initially, the fact that meeting the climate change challenge created a need for strengthening infrastructure was not understood neither by politicians nor public opinion. Neither was it fully understood that the need for strengthening the internal national grids came as a result of building interconnectors. However, after some investment cases where the trade-off became clear and the R-2010-083 31 CHALLENGES FOR NORDIC POWER politicians in charge made a firm commitment towards the climate targets, the environmental resistance weakened. The result was that the Nordic TSOs, in close cooperation, were able to build the necessary grid enforcements. Figure 4.10 Net Trade in the Green Growth Scenario (TWh per year) Exports (‐) Import (+) (TWh per annum) 20 15 Russia 10 Lithuania Estonia 5 UK 0 ‐5 2020 2030 Norway 2020 " 2030 Sweden 2020 " 2030 Finland 2020 " 2030 Denmark ‐10 Poland Netherlands Germany Finland ‐15 Denmark ‐20 Sweden Norway ‐25 ‐30 Source: Project team analysis Challenges ahead Despite the many positive developments, there are still challenges ahead for the Nordic generation system. For instance, there is yet to be established a consensus on the distribution of costs of cross-border transmission investments. This is a frequent source to disputes among the Nordic countries. More fundamentally, policies for increasing energy efficiency also include measures for reducing the use of electricity. Along with reduced power consumption, due to the phase-out of the oil and gas sector, will Europe be able to absorb the surplus, or will prices fall? “Not bad for all”, comments a senior Swedish politician, “for one thing, the consumers will at last benefit”. 4.4 STAGNATION: NORDIC POWER SECTOR A SUNSET INDUSTRY After almost 20 years of low economic activity, the Nordic Power Sector still suffers from stagnation. The power prices are modest due to reduced demand from power intensive industry and low fuel and carbon prices. Falling capital investments and reduced employment have transformed the Nordic Power Sector to a sunset industry. It took the OECD countries almost 10 years to recover from the debt problems, which escalated after the financial crisis in 2008/09. Ironically, the world economy was hit again around 2020, this time by an unexpected and sharp downturn in emerging economies, in particular China and India. A global climate change agreement is still on hold, as lower than expected emissions have reduced the feel of urgency of implementing costly climate change measures. R-2010-083 32 CHALLENGES FOR NORDIC POWER Table 4.3 Stagnation Main: Main Indicators 2020 5 2030 New transmission capacity (MW) 3250 4450 Power export 2020 (TWh) 28 19 Power price Nordic (€/ MWh) 29 41 Power price Europe (€/ MWh) 40 48 CO2 price (€/ t) 15 25 Gas price ($/ MMBtu) 4 5 Oil price ($/ barrel) 52 48 Coal price ($/ t) 48 42 Source: Project team analysis Less focus on climate change The long lasting economic turmoil has made the international community less occupied with climate change issues. After several rounds with international negotiations, a global climate change agreement is still on hold. In USA, the Republicans regained office in 2013 and have kept the majority both in the Senate and the House of Representatives that they won in 2011. The republicans preferred to pursue climate emission cuts by national measures and did not support a new global agreement, which was up for negotiations in 2018. They were not alone. Important countries like China, Russia and India also worked against a global climate agreement, perceiving it threatening to national sovereignty. Nevertheless, the global warming is increasingly visible, but lower growth in climate emissions has reduced the feel of urgency. Europe has still its ETS, but a relative soft cap combined with low demand growth and still some investments in renewable energy sources, have altogether kept the carbon price at a low level. The carbon price has varied between € 15 per ton in 2020 to € 25 per ton in 2030. More integration Making the economy more efficient has been a top priority, and has affected energy markets in several ways. In the first years of the slow economic recovery, there were some tendencies of protectionism and hesitations, but the attempts did not affect the ongoing market integration process in the European power sector. In the outset, the increased share of wind power in the generation mix on the Continent and the UK was one important driving force for the market integration process. The instability created by varying wind conditions increased the need for flexible capacity. The view was that an integrated European power sector would make it more cost efficient to provide such capacity compared to a fragmented system. The economic downturn made it even more important to develop solutions that utilized existing infrastructure more efficiently, even though the investments in renewable capacity did not bring the share to 20 percent by 2020 as originally planned. 5 From the Nordics to outside Nordics; does not include inner-Nordic grid investments R-2010-083 33 CHALLENGES FOR NORDIC POWER The market integration process covered several issues such as common products, market solutions and principles, harmonized network regulations and transmission tariffs. One exception is the support regimes for renewables that is still fragmented across European countries. Energy efficiency has been stimulated by significant increases in energy taxes. The treasuries, seeking ways to strengthen public budgets, have also motivated higher energy taxes. The market integration process has improved the overall utilizations of both the existing generation plants and the existing infrastructure, including a more efficient management of congestions. A more efficient European power sector has improved the power balance and reduced the need for capacity expansions. Demand stagnation Even though the total Nordic electricity consumption is equal to the pre-crisis level, we have seen significant variations between market segments. While we have experienced moderate growth rates in the residential segments, stagnation has been the reality for the Power intensive industry. One exception is the Norwegian oil and gas industry in which the electricity demand has increased by some 25 per cent between 2010 and 2030,due to decisions on electrification taken well before the financial crisis. During the last twenty years, there has been a significant population growth in the Nordic countries, particularly in Norway, but also to some extent in Denmark and Sweden. As an average, the Nordic population has grown by more than ten percent since 2010.This trend has been driven by increased immigration and prolonged life expectancy. The high immigration rates were partly due to the hard times, and partly due to the fact that the Nordic countries, in relative terms, were less hit by the financial crises than the rest of Europe. That is the main reason why the emigration flow from other part of Europe to Scandinavia accelerated. The high population growth has partly been counterbalanced by reduced electricity consumption per capita, due to more energy conservation and low growth rates in households’ disposable income. But the net result has been a moderate increase in total electricity demand in the residential sectors. The Nordic power intensive industry, on the other hand, was not able to return to the precrises level, and the twelve percent drop in demand after the financial crises in 2008/2009 turned out to be permanent. Most vulnerable was the Norwegian pulp and paper industry, which was reduced by 1/3. The pulp and paper industries in Sweden and Finland were much more resistant to low economic growth. The aluminum and iron industries were also more competitive and manage to keep its post- crisis level as far as electricity demand is concerned. Fading investment activity The Nordic Power balance is presented in Figure 4.11. The major part of investments in generation capacity in the Nordic power sector has come within onshore wind. But even these investments were far below the ambitious plans developed by the Nordic governments twenty years ago. Overcapacity and falling power prices and recognition that there was a long lasting overcapacity in the Nordic power market were the main reasons for the decision to cancel the common Swedish/Norwegian market for green certificates in 2012. Without quantitative goals, the incentives to invest were too weak for the majority of the development projects. R-2010-083 34 CHALLENGES FOR NORDIC POWER Some investments in renewables have been carried out. Wind power capacity expanded from 5200 MW in 2010 to 9700 MW in 2020, but the investment activity slowed substantially after 2020.During the last decade the capacity expansion in the whole region was only 1600 MW. Today, in 2030, the total installed wind power capacity is 11300 MW. Offshore wind turned out to be far too costly, and the debt crisis made it difficult to finance technology projects in CCS and other emerging technologies. Admittedly, we are far away from the ambitions set twenty years ago. Market developments, along with the political shift towards other goals than climate change, have necessitated a reorientation of the Nordic energy policies. The Nordic nuclear industry is still an important element in the Nordic generation mix, but no new nuclear plants have been built or initiated after the Finnish Olkiluoto3 was put in operation in 2013. Figure 4.11 The Nordic Power Balance in the Stagnation Scenario 500 TWh 450 400 Biomass 350 Wind offshore Wind onshore 300 Hydro 250 Other 200 Oil 150 Natural gas 100 Coal 50 Nuclear 0 Demand 2030 2028 2026 2024 2022 2020 2018 2016 2014 2012 2010 2008 2006 2004 2002 2000 Source: Project team analysis A sunset industry Low investment activity and declining profit margins have changed the strategies of most power companies. The main task has been to optimize existing assets by utilizing synergies and implementing cost cutting programs in order to defend profit margins. As a result, the employment in the power sector has been reduced. A positive element, though, has been a few profitable interconnector projects, which has increased the power trade between the Nordic countries and the Continent. The enhanced capacity has reduced current barriers and bottlenecks, making Norwegian hydro generators able to export more of their flexibility. Quite recently, things have started to move again. The last few years we have seen demand picking up and future energy prices indicate a tighter market balance the next coming years. R-2010-083 35 CHALLENGES FOR NORDIC POWER The fuel markets The fuel price development is presented in Figure 4.12 in North West Europe. The global oil and gas markets and the coal market were hit hard by the global economic downturn and the subsequent fall in demand for oil and gas. The oil price stabilized around USD 6080/barrel (bbl.) in the first phase after the deep financial crisis in 2008/09, but slipped further down to around 50 USD/bbl. in 2020 and has fluctuated around this level since then. One explanation for the soft market condition was increased production from Iraq and some emerging markets in Africa and Brazil which made it hard for OPEC to defend the oil price by holding back on production elsewhere. The low oil price and gloomy global economic situation made it even more burdensome for individual OPEC countries to keep the discipline within the cartel. The situation for the European gas market was even worse the first years after the financial crisis. The European gas market was the victim of a series of events: The global recession affected gas demand worldwide particularly through lower industrial and commercial demand. It took many years before demand in the distressed gas market reached the pre-crisis level. Low growth in energy demand and the long-term focus on renewable generation, also served to limit demand for gas from European power generators. The low gas prices have, on the other hand, made gas competitive towards coal. The boom in LNG investments during the preceding decade, both in the EU and the US led to significant increase in LNG import terminals. A rapid shift in the US gas supply mix due to the emergence of cost effective indigenous unconventional gas production. Whereas these events in isolation should not necessarily lead to distress for the European gas market, their simultaneously occurrence caused a very long period of imbalance between potential supply and demand for gas in North West Europe. R-2010-083 36 CHALLENGES FOR NORDIC POWER Coal and gas prices in the Stagnation Scenario 160 14 140 12 120 10 100 8 80 6 Coal 60 4 40 Natural Gas 20 2 0 0 Gas Price ($ per MMBtu) Coal Price ($ per tonne) Figure 4.12 2030 2029 2028 2027 2026 2025 2024 2023 2022 2021 2020 2019 2018 2017 2016 2015 2014 2013 2012 2011 2010 2009 2008 2007 Year Source: Project team analysis The shale gas boom in the US contributed by taking out the expected LNG demand from across the Atlantic and by putting a soft price ceiling on the US market. LNG shipments from the Middle East looked for the highest paying market, on either side of the Atlantic. This strengthened the tendency to interlinking the US and the European gas markets. However, the gas market picked-up again after 2020, when a new wave of dash for gas started. This was mainly a result of fuel switching from coal. The coal market was also hit by low growth and reduced demand for coal in power generation both in Europe and in the rest of the world. The new generation capacity in Europe has been renewables or gas power, a tendency that can be seen all over the world. Hence the coal price has oscillated around the short run marginal cost for a considerable period of time now. Low Prices – Also on the Continent The power markets in general suffered from low economic activity. Low fuel prices, combined with low CO2 emissions prices resulted generally in low fuel prices, compared with 2010 levels. The Nordic power prices, still sensitive to variation in water inflow, have oscillated around 30 € per MWh in 2020, increasing to some 40 € per MWh by 2030. Due to a positive energy balance for the Nordic countries, the Nordic price level remained significantly below the prices on the Continent. This is also illustrated by Figure 4.13, showing prices in Germany and Norway over the time period 2010-2030. R-2010-083 37 CHALLENGES FOR NORDIC POWER Figure 4.13 Price Development in the Stagnation Scenario (€ per MWh) Power Price (€ per MWh; Real 2010 Prices) 60 50 40 30 Nordic 20 Germany 10 0 2010 2020 2030 Source: Project team analysis As for the Continent and the UK, low gas prices lead to new investments in CCGT, which gradually started to replace coal capacities, also as base-load generation technology. Furthermore, Germany exited the phase-out plans for nuclear generation, and kept some 13 GW of generation capacity online after 2015. The UK experienced a renaissance of nuclear generation, with new reactors being built in the period 2015-2030. Renewable achievements, on the other hand, were modest both in the UK and on the Continent. Trade and infrastructure investments During the last twenty years, transmission capacity has increased, both internally between the Nordic countries and between the Nordic region and the Continent. Decisions to expand links between Denmark and Germany, Finland and Estonia and between Sweden and Lithuania were taken in 2010-2012, while investment decisions for the cable connections between Norway and Germany were taken 10 years ago. Today, in 2030, the total transmission capacity out of the Nordic countries is 9700 MW. In terms of main net trade flows, shown in Figure 4.14, the pattern is relatively stable, as Norway and Sweden keep their positions as net exporters though the whole period, while Finland continues to import power, primarily from Sweden. Denmark’s role as a transit country, however, is somewhat reduced during the last decade due to the new cable investments between Norway and Netherlands and a tighter power balance in Norway, Sweden and Denmark. R-2010-083 38 CHALLENGES FOR NORDIC POWER Figure 4.14 Net Trade in the Stagnation Scenario (TWh per year) Exports (‐) Import (+) (TWh per annum) 15 10 Russia Lithuania 5 Estonia UK 0 2020 ‐5 2030 Norway 2020 " 2030 Sweden 2020 " 2030 2020 Finland " 2030 Poland Netherlands Denmark Germany ‐10 Finland Denmark ‐15 Sweden Norway ‐20 ‐25 Source: Project team analysis 4.5 SUPPLY WORRIES: A NORDICPOWER DEFICIT In 2010 everybody expected the Nordics, in particular Norway, to become an exporter of cheap renewable energy and peak capacity to Europe. Now, 20 years later, the Nordic countries rely on imports from Europe, and power prices have soared due to high fuel prices, high CO2 prices, and supply shortages in the Nordic area. So what went wrong? The high fuel prices and CO2 prices were a result of generally high worldwide economic activity, combined with tight CO2 caps, so nobody can be blamed for this. As for the Nordic countries, however, the phase out of nuclear power in Sweden, the delay of new reactors in Finland, and the too optimistic expectations that renewables could replace conventional capacities, aggravated the picture. Furthermore, the strong support for electrification of transport, electrification of the oilrigs, and the carbon compensation for power intensive industry, which lead to strong growth in this sector, added strain to the system. Table 4.4 Supply Worries: Main Indicators 2020 2030 New transmission capacity (MW) 2550 6450 Power export 2020 (TWh) -7 -7 Power price Nordic (€/ MWh) 76 89 Power price Europe (€/ MWh) 76 91 CO2 price (€/ t) 30 45 Gas price ($/ MMBtu) 4 5 Oil price ($/ barrel) 120 134 Coal price ($/ t) 105 119 6 Source: Project team analysis 6 From the Nordics to outside Nordics; does not include inner-Nordic grid investments R-2010-083 39 CHALLENGES FOR NORDIC POWER Decline of Nuclear Generation in the Nordics and Abroad A substantial reduction of power output from nuclear plants materialized between 2010 and 2020. This was due to two factors: The governing green parties in Sweden started a program to replace nuclear production with new renewable generation, mostly wind. The program included higher taxes for nuclear generation (partly also to finance renewable generation), and a change in legislation that prohibits any investments in new nuclear capacity in Sweden. Small technical and operational incidents in nuclear power plants shifted the public climate for nuclear generation. The generally opposing position of both the public and the government lead to the fact that maintenance and refurbishment investments in Swedish plants were not undertaken. In effect, some of the planned upgrades for Swedish plants were not carried out. In Finland, the changes in public opinion lead to the 6th reactor being deferred. In effect, nuclear generation in Sweden fell from around 74 TWh in 2010 to some 52 TWh in 2020, due to the shutdown of Oskarshamn I & II and partly Ringhals. On the Continent and in the UK, similar sentiments and political calculus lead to a phaseout of nuclear generation in Germany, and a reduction in nuclear capacity in the UK. After the supply shortage in the Nordics manifested by 2020, the sentiment towards nuclear power changed. In Sweden, the planned phase-out of nuclear power came to a halt, and nuclear generation remained constant at the 2020 level up-until 2030. In Finland, both the 6th and the 7th reactor were built (also with support from Swedish power intensive industry with operations in both Sweden and Finland), which avoided that the supply shortage turned into a supply crisis. Renewable Investments were lagging behind At the same time as nuclear capacities were retired, renewables investments, which were partly meant to replace nuclear generation in Sweden, were lagging behind government plans. The common Green Certificate Market between Norway and Sweden was not implemented and created investment uncertainty. Bottlenecks in the supply of windmills – due to high international demand for this technology - and NIMBY7 attitude of the public, aggravated the picture. Furthermore, the coal-to-bio conversion policy was not able to replace all retired coal capacity in 2020. In effect, the Nordic countries did not meet their renewable targets for 2020. After 2020, however, support for renewable generation was harmonized between Nordic countries, and a common Green Certificate Market between Norway and Sweden was finally implemented. Furthermore, bottlenecks in the supply of windmills were removed, and investments in renewable generation increased. A similar pattern of renewable investments was observed on the Continent, and in the UK. 7 NIMBY – Not In My Back Yard R-2010-083 40 CHALLENGES FOR NORDIC POWER High Economic Growth Leads to Strong Demand Growth While the supply side was contracting (nuclear) or lagging behind (renewables), demand experienced a considerable growth. The financial crisis was succeeded by a long period of steady and strong growth in the world economy, including the Nordic countries, with growing domestic consumption as well as export sales. This growth led to a significant growth in electricity demand. But it was not only high economic growth that contributed to the demand growth. Demand was also driven by an active industrial policy combined with a politically driven conversion from oil and gas to electricity in the transport and petroleum sector. Carbon compensation for power intensive industry, in combination with active industrial policy, made the Nordic countries an attractive location for power intensive industry. Support for the conversion from oil to electricity in the transport sector – facilitated by new battery technologies – increased demand for electricity in transport. Finally, subsidies combined with political pressure to replace old gas turbines on oilrigs with electricity from onshore generation increased electricity demand from the petroleum sector. A country-specific element for Norway was the clarification of the dividing line in the Barents Sea. This led to a faster growing economic activity in the Northern Part of Norway during the 2020’s. As plans for the Barents Sea matured, a much stronger growth for the period 2020 – 2030 was materialized, both for the fishing sector, the petroleum sector and derived from this, the national yard / mechanical industry. All this resulted in an energy deficit of around 7 TWh of all Nordic countries in 2020 (see Figure 4.15). As the investment activity picked up after 2020, and as demand growth somewhat slowed down, the deficit did not aggravate, but remained stable at this level until 2030. Figure 4.15 Nordic Power Balance in the Supply Worries Scenario 500 TWh 450 400 Biomass 350 Wind offshore Wind onshore 300 Hydro 250 Other 200 Oil 150 Natural gas 100 Coal 50 Nuclear 0 Demand 2030 2028 2026 2024 2022 2020 2018 2016 2014 2012 2010 2008 2006 2004 2002 2000 Source: Project team analysis R-2010-083 41 CHALLENGES FOR NORDIC POWER High prices also as a result of high fuel prices While the tightening energy balance in the Nordic countries alone would have led to higher prices, the generally high fuel and carbon prices added to this picture (see Figure 4.16). The generally high global economic growth led to strong demand for fuels, resulting in high prices. Fuel Prices in the Supply Worries Scenario 160 16 140 14 120 12 100 10 80 8 Coal 60 40 6 4 Natural Gas 20 2 0 0 Gas Price ($ per MMBtu) Coal Price ($ per tonne) Figure 4.16 2030 2029 2028 2027 2026 2025 2024 2023 2022 2021 2020 2019 2018 2017 2016 2015 2014 2013 2012 2011 2010 2009 2008 2007 Year Source: Project team analysis The aforementioned underachievement concerning renewable investments, in conjunction with high ambitions of governments to cut carbon emissions, lead to generally high abatement costs, resulting in emission prices of € 30 per ton CO2 in 2020 and € 45 per ton CO2 in 2030 (real 2010 prices). As carbon prices have pass-through rates of around 0.4 in gas fired generation and 0.8 in coal fired generation, the high carbon costs did their part in increasing power prices even further. Power prices As a result of a tight energy balance and generally high fuel and carbon prices, power prices increased significantly in the time period from 2010 to 2020.As global economic growth persisted also in the time period from 2020 to 2030, power prices continued to increase also in this time period, although the increase was slightly dampened (see Figure 4.17). In fact, power prices not only increased, but the price gap between the Nordic countries and the Continent (exemplified in Figure 4.17 with Germany), which persisted historically, declined over time, and more or less vanished by 2020. The reason for the slight price gap in 2030 can be found in the new transmission cables that are built between 2020 and 2030, and their effect on water values and dry-year insurance premiums. R-2010-083 42 CHALLENGES FOR NORDIC POWER Power Price (€ per MWh; Real 2010 Prices) Figure 4.17 Power Price Development in the Supply Worries Scenario 100 90 80 70 60 50 40 30 20 10 0 Nordic Germany 2010 2020 2030 Source: Project team analysis Trade and infrastructure While Statnett had ambitious plans to establish new interconnection to Continental Europe and the UK, the materialized plans by 2020 were moderate, as only the SK4 cable between Norway and Denmark and the NorNed2 cable were built. There are a number of reasons for this underachievement: first, bottlenecks in the supply of new transmission cables delayed some projects; second, there was a strong opposition against required internal grid reinforcements; third, the tightening energy balance led to investment insecurity for the Continental counterparts, due to increased convergence of average prices between the Nordic and the Continent and the UK. Statnett and its counterparts implemented a number of new interconnection cables between 2020 and 2030, namely a cable between Norway and Germany and the interconnector between Norway and the UK. The main drivers were the tightening energy balance and consequently the need for insurance against dry years, along with persistent diurnal price variations between the Nordics and the Continent and the UK. Furthermore, the Nordic TSOs, realizing the need for better interconnection within the region, carried out a number of grid investments between the Nordic countries. As a result of a tightening energy balance and – in consequence – a diminishing price gap, the Nordic countries became net importers of electricity. This applied in particular to Sweden, with declining nuclear capacities, and Norway thus became a transit zone for flows from the Continent to Sweden. Finland, with the 6th and 7th reactors only coming into operation after 2020, and increasing demand, sought to secure supplies through imports from Russia to the amount of 5 TWh per year up until 2030. An overview over trade patterns is given in Figure 4.18. R-2010-083 43 CHALLENGES FOR NORDIC POWER Figure 4.18 Net Trade in 2020 and 2030 (TWh per year) Exports (‐) Import (+) (TWh per annum) 20 Russia 15 Lithuania Estonia 10 UK Poland 5 Netherlands Germany 0 2020 ‐5 2030 Norway 2020 " 2030 Sweden 2020 " 2030 Finland 2020 " 2030 Denmark Finland Denmark Sweden ‐10 Norway ‐15 Source: Project team analysis R-2010-083 44 CHALLENGES FOR NORDIC POWER 5 SO WHAT? Our set of scenarios covers a wide range of policies, economic developments and market outcomes. Despite the many different inputs and assumptions, there are several striking similarities across scenarios with regard to the results, which enable us to draw robust conclusions about the future of the Nordic power sector along some important dimensions. Of course, there are also some major differences. The scenarios differ substantially in a number of characteristics, reflecting the significant uncertainty pertaining to the development of the electricity industry. In this section we summarize the main quantitative results across scenarios and discuss implications. Important facts and findings are summarized in text boxes. All prices, costs and revenues reported are in 2010 real prices. 5.1 SIGNIFICANT EXPORT IN ALL BUT ONE SCENARIO The annual energy balance is a main scenario descriptor, following both axes in the scenario cross. Correspondingly, energy and trade balances differ significantly across scenarios. This is particularly the case for the 2020 balances shown in Figure 5.1. Total Nordic consumption is shown on the x-axis and total generation on the y-axis; the diagonal line shows where generation equals consumption. A dot above the diagonal signifies a net export situation, and a dot below the diagonal signifies a net import situation. Figure 5.1 Trade and Energy Balances for 2010 and 2020 for the Nordics for a Normal Year (TWh) export (2) Green Growth (1) Politics Work 23 TWh 46 TWh (3) Stagnation 7 TWh 28 TWh 2010 Proxy (4) Supply Worries import Source: Project team analysis R-2010-083 45 CHALLENGES FOR NORDIC POWER Not surprisingly, the Politics Work scenario results in the largest Nordic power surplus and exports. A total of 10 per cent of generation is exported in a normal year. In this scenario consumption growth is modest, while generation grows rapidly due to investments in renewable and nuclear capacity. In the Stagnation scenario, generation grow this smaller, but so is demand growth because of generally lower economic growth. There is still a considerable total surplus in the Nordic area, however. The Green Growth scenario has the highest consumption and generation, but even here the export surplus is substantial. Only in the Supply Worries scenario do we find net imports. The imports are modest, however, despite assumptions on considerable demand growth, moderate investments in renewables, and a decline of nuclear generation. Within the overall picture, there are substantial differences in power balances among the Nordic countries. Norway experiences a power surplus in all scenarios, while Finland has a deficit in all. Sweden shows the largest variation, mostly on account of investments or decommissioning of nuclear capacity. In the Politics work scenario in 2020, the “hydro power area” – Norway, Sweden and Finland – has a surplus of 39 TWh, Sweden exports 16% of its generation in a normal year, and Norway 11%. Adding inflow variation to the hydro system, the combined surplus could be as high as 70 TWh in very wet years! It takes around 8.000 MW of dedicated export capacity (i.e. 8760 hours annually) to export that volume of electrical energy during one year.8 Without the addition of new interconnector capacity beyond Skagerrak 4 and Danish-German expansion, the total export capacity is around 5500 MW, corresponding to a theoretical maximum of 45 TWh of full exports. This implies that there is a need to increase demand by at least 25 TWh or else water has to be spilt. This would mean a welfare economic loss in the magnitude of around € 1 bn. By 2030, power balances even out somewhat between the scenarios as shown in Figure 5.2. Both Politics Work and Stagnation move towards a more balanced power situation spurred by market and policy forces. The Green Growth scenario maintains its power surplus, and also the deficit in the Supply Worries scenario remains at the same level. 8 We have assumed 90% availability of the cable capacity. R-2010-083 46 CHALLENGES FOR NORDIC POWER Figure 5.2 Trade and Energy Balances for 2030 for the Nordics for a Normal Year (TWh) 520 (2) Green Growth Generation (TWh) 500 export 480 22 TWh (1) Politics Work 460 22 TWh 440 7 TWh (4) Supply Worries (3) Stagnation import 420 19 TWh 400 380 380 400 420 440 460 Demand (TWh) 480 500 8 Source: Project team analysis In the Stagnation scenario, generation remains at the same level as in 2020, but due to some demand growth the surplus declines. In the Politics Work scenario, consumption increases by altogether 40 TWh, to a large extent spurred by industrial growth fuelled by low Nordic power prices. In Green Growth, both demand and supply continues to increase, largely moving in parallel. R-2010-083 47 CHALLENGES FOR NORDIC POWER Facts and Findings 1: The impact of the Renewables Directive is different in the Nordic hydropower market than in Continental markets: there is a high likelihood that the Nordic market will develop a substantial power surplus in the coming decade. Even in the scenarios where we assumed increase electricity demand or smaller increases in generation in order to create a more balanced development, i.e. the Stagnation and Green Growth scenarios, we ended up with a substantial export surplus in 2020. In Supply Worries we have a small net import, but this is perhaps the least plausible scenario, considering the strong policy drivers instituted in the market by the EU Climate and Energy Policy Package. Facts and Findings 2: The Nordic power surplus may become even larger if demand growth slows down due to a lack of carbon leakage compensation and increased energy efficiency provisions The demand growth over the last decade has shown signs of “saturation”, and in the last couple of years, electricity demand has slumped. There are several reasons for this, e.g. slow economic growth, changes in industry structure, increase in the use of district heating and heat pumps, increased energy efficiency, etc. Demand growth in the coming years may be additionally mitigated if the recession continues (“doubledip), if Nordic power intensive industries do not receive carbon leakage compensation and if energy efficiency measures further reduce electricity demand. 5.2 NORDIC PRICES REMAIN BELOW CONTINENTAL PRICES Power prices differ between the scenarios for a number of reasons, but the main drivers are fuel and CO2 price assumptions, the annual power balance and interconnector capacity. To illustrate price levels between the scenarios and the price differences between the Nordic market and the Continent, 2020 prices in Norway and Germany are shown in Figure 5.3. Detailed price results for all countries and scenarios are given in Table 5.1.9 Whereas the Norwegian price is a good proxy for the price level in the “hydro power area”, German prices are a good proxy for long term equilibrium prices in thermal systems. As such, the variation in the German price level reflect the different assumptions on fuel and CO2 prices, and the divergence of the Norwegian price level reflect the different degrees of export surplus in the “hydro power area”. 9 The numbers also support the following observation: The Norwegian power price is a good proxy for the Nordic power price, in particular for prices in Sweden and Finland. The price in Denmark lies between the price in Norway and Germany; only in the Supply Worries scenario does it lie above the German price. R-2010-083 48 CHALLENGES FOR NORDIC POWER Figure 5.3 Power Prices in Norway and Germany (€ per MWh) 100 Power Price (€ per MWh) 90 80 Norway Germany Green Growth Stagnation 70 60 50 40 30 20 10 0 Politics Work Supply Worries Politics Work Green Growth 2020 Stagnation Supply Worries 2030 Source: Project team analysis The results show clearly that in all scenarios with a Nordic power surplus, Nordic power prices remain well below Continental prices. But even in the Supply Worries scenario, with a Nordic net deficit, the “hydro power area” price is the same or slightly lower than the German price. Danish power prices lie somewhere between the other Nordic prices and the prices in Germany. As Denmark is a transit area, this is also in line with expectations. Only in the Supply Worries scenario, the Danish price is higher than prices in Germany, which is due to occasional high peak prices as a result of increased wind generation in conjunction with high marginal costs for peak capacities. Table 5.1 Power Prices for All Scenarios and Countries (€ per MWh) 2020 2030 Politics Work Green Growth Stagnation Supply Worries Politics Work Green Growth Stagnation Supply Worries Norway 39 50 29 76 60 71 40 89 Sweden 39 51 29 77 61 72 41 90 Finland 39 51 28 77 61 71 40 87 Denmark 43 59 32 80 70 79 48 94 Germany 56 62 40 77 70 80 48 91 Netherlands 56 62 39 75 69 81 47 90 UK 57 62 41 76 69 81 47 91 Source: Project team analysis In Figure 5.4 we have plotted the relationship between the Nordic power balance (without Denmark) and the price difference between Norway and Germany. The figure shows a clear correlation between power price differences and the size of the power surplus. The interconnector capacity differs somewhat between the scenarios, and as such, the resulting price differences may indicate the difference in transmission capacities rather than the magnitude of the surplus. The total interconnector capacities are however largely the same in Politics Work and Green Growth, both in 2020 and 2030, but the correlation R-2010-083 49 CHALLENGES FOR NORDIC POWER still holds. Within reasonable ranges, it appears that the interconnector capacity is less significant than the power surplus. Figure 5.4 Relationship between Power balance and Price difference between Norway and Germany (€ per MWh) Nordic Trade/Energy Balance (TWh) 0 ‐10 Price Difference Norway and Germany (€ per MWh) ‐20 ‐2 ‐4 ‐6 0 10 20 30 Politics Work 2020 Green Growth 2020 Stagnation 2020 Supply Worries 2020 40 50 Politics Work 2030 Green Growth 2030 Stagnation 2030 Supply Worries 2030 ‐8 ‐10 ‐12 ‐14 ‐16 ‐18 Source: Project team analysis Thus, in case of a positive power balance (Politics Work, Green Growth, and Stagnation), power prices in the Nordic countries can be expected to be well below the Continental level. This is also the case even if a number of new transmission cables are built. Price Structures are likely to remain the same as today The congestion rent or income to the cable owners from price differences and traded volumes, which we will analyze in more detail in Section 5.7, is not mainly driven by differences in average prices, but by hourly price differences. The hourly price structure is very different in a (mainly) hydro based and a (mainly) thermal based electricity system. The Nordic hydro system is characterized by being energy-constrained (i.e. generation is constrained by inflows and not the installed capacity in MW), and of abundant effect capacity. In combination with large hydro reservoirs, this creates a large degree of flexibility, and hence price differences between hours are evened out. Thermal systems are on the other hand characterized by being capacity-constrained and with an abundance of energy (fuels can be purchased in the markets for coal, gas etc.). Moreover, it is costly to adjust generation in base load plant, and it is expensive to cover demand in high and peak load. This means that prices differ significantly with different load levels. In addition, investments in renewable capacity such as wind increase the price volatility in the market. Differences in price structure can we visualized by looking at hourly prices for an average week, i.e. by taking hourly values for the entire year and building averages for the respective hour of a week. As can be seen in Figure 5.5, the average weekly price structures in Germany differ significantly between the scenarios in 2020. The figures also R-2010-083 50 CHALLENGES FOR NORDIC POWER indicate that diurnal price variation in the “hydro-power system”, represented by Norway, remain fairly limited. Even in the presence of new transmission cables (for example, 3500 MW new installed transmission capacity from Norway to the UK and the Continent), we do not observe large price variation during a day in the hydro based system. As for Germany, we foresee a continuation of the currently observed price structure, i.e. large diurnal variation between off-peak/night and peak/day prices. This means that the congestion rent potentials are clearly substantial in all scenarios (see also Section5.7). Power Price (€ per MWh) 130 110 Price Structure for Germany and Norway in 2020 across Scenarios Norway Politics Work Germany 90 70 50 30 130 Power Price (€ per MWh) Figure 5.5 10 110 70 50 30 1 11 21 31 41 51 61 71 81 91 101 111 121 131 141 151 161 130 Norway Germany 90 70 50 30 Power Price (€ per MWh) Power Price (€ per MWh) 110 Germany 90 Hour of the Week Stagnation Norway 10 1 11 21 31 41 51 61 71 81 91 101 111 121 131 141 151 161 130 Green Growth Hour of the Week Norway 110 Germany 90 70 50 30 Supply Worries 10 10 1 11 21 31 41 51 61 71 81 91 101 111 121 131 141 151 161 Hour of the Week 1 11 21 31 41 51 61 71 81 91 101 111 121 131 141 151 161 Hour of the Week Source: Project team analysis R-2010-083 51 CHALLENGES FOR NORDIC POWER Facts and Findings 3: The Nordic power price level is likely to be substantially lower than Continental prices. The impact of the EU Renewables directive is different in the Nordic area and on the Continent. The Continental markets have substantial generation capacity based on coal and nuclear, and to some extent gas, that is going to be phased out over the next decade. In that respect, it makes sense to replace some of that capacity with renewable capacity rather than new fossil capacity that will continue to emit CO2 for 3040 years into the future. In the Nordic hydropower system (Norway, Sweden and Finland), most of the existing capacity is hydropower, or new or newly refurbished nuclear power. In the Nordic countries, the increase in renewable capacity to a large extent comes in addition to, and not instead of, fossil fuelled capacity. The higher the surplus, all else being equal, the lower is the price level in the Nordic market and the larger is the price difference compared to the Continent. Facts and Findings 4: The Nordic hydropower system does not import Continental prices in any of the scenarios. Due to the flexibility in the Nordic hydropower system, and the lack of flexibility in the thermal systems on the Continent, the hourly price structure remains very different in the Nordic system even in the cases where interconnector capacity increases substantially. This also explains why the average price stays below Continental prices even if export and imports are balanced: Peak prices on the Continent are very high, and in most peak hours there are full exports from the hydropower system but still not full utilization of the effect capacity. Although prices are lower on the Continent in offpeak hours, this does not reduce average prices in the Nordic region correspondingly. 5.3 FUEL PRICES AND CO2 PRICES DETERMINE PRICE LEVEL Figure 5.5 and Figure 5.3 show that power price levels differ significantly in the scenarios. The fuel price levels largely determine the price levels. In Germany, for example, prices are in line with the long-run marginal costs of new coal and or gas generation. In the Nordics, price levels follow the same trend, but since the Nordic market is rather an energy market than a capacity market, price levels are also affected by the power balance, cable capacity, etc. The long-run marginal cost of generation can be split up into the following parts: Fuel costs: The fuel costs for generation are determined by fuel prices and efficiencies. CO2 costs: These are determined by efficiencies, CO2 content of the fuel, and CO2 prices. Capital costs: These are the annualized capital costs for new investments (between ca. € 15 per MWh for new CCGT (Combined Cycle Gas Turbines), and ca. € 25 for new coal plants, depending on type and load factor). Other costs: Include other costs, as for example variable non-fuel operating costs. R-2010-083 52 CHALLENGES FOR NORDIC POWER This implies that power prices – also in the Nordics - are largely influenced by the CO2 emissions prices.10 Facts and Findings 5: The main drivers for the general average price levels are fuel prices and CO2 prices The differences in price levels in the different scenarios can largely be attributed to differences in CO2 prices and fuel prices. This means that to some extent, average prices in the Nordic area and on the Continent move in parallel when fuel and CO2 prices change. 5.4 RENEWABLES INVESTMENTS SIGNIFICANTLY AFFECT THE POWER PRICE The relationship between power prices in the Nordics and the power balance can be used to evaluate the effect of renewable investments on power prices. In the Nordic market new hydro power investments add directly to the power surplus, and other renewable investments are typically intermittent generation that are not sensitive to market prices: Wind and solar generate whenever the wind blows or the sun shines, bio plants are typically CHP plants that run mostly according to heat obligations (and not power market prices). Using the results from the model simulations (cf. Figure 5.4), as a rule of thumb, we say that 10 TWh of new renewable generation in the Nordics reduce power prices by around € 4 per MWh. This is a significant impact, and has large implications for power prices in the different scenarios. For example, in the Politics Work scenario, where we assume new renewable investments between 2010 and 2020 to the extent of ca. 35 TWh in the Nordics (outside Denmark), this implies that the power prices is around €14 per MWh (3.5 * € 4 per MWh) lower than it would have been without these investments. The consequences of renewable investments for power prices in the different scenarios are summarizes in Table 5.2, using the rule of thumb. Table 5.2 New Renewable Investments until 2020 (TWh) and Nordic Power Price (€/MWh) in 2020 with and without renewable investments Politics Work Green Growth Stagnation Supply Worries New Renewables until 2020 (TWh) 35 45 14 28 Price Effect (€ per MWh) 14 18 6 11 Price with Renewables (€ per MWh) 39 50 29 76 Price without Renewables (€ per MWh) 53 68 34 88 Source: Project team analysis 10 As coal plants have a pass through factor of ca. 0.8 (meaning that € 1 per ton CO2 increases costs for power generation by ca. € 0.8 per MWh), and CCGT a factor of 0.4, this influence is significant. For example, a CO2 price of € 30 per ton increases power price levels between ca. € 12 per MWh and € 24 per MWh, depending on what technology and fuel is on the margin. R-2010-083 53 CHALLENGES FOR NORDIC POWER 5.5 CABLES HAVE LESS EFFECT ON PRICES THAN RENEWABLES Transmission cables will affect the respective markets. In the Nordic market, they will change the value of water in the Nordic reservoirs, and hence prices. On the Continent and in the UK, cables will lead to changes in generation and investments. The price effect of the different cables as estimated in the model runs is given in Table 5.3, which shows the changes in prices with the assumed interconnectors that are built in the time period 2010-2020 and 2020-2030, respectively. In the Politics Work scenario, for example, the prices shown for 2020 are with and without NorNed2, Nord.Link (or NorGer), and NSN. In the Green Growth scenario, the 2030 prices are those with a Swedish-German Link of 700 MW and NSN2 of 1000 MW.11 Table 5.3 Nordic prices (€ per MWh) with and without new interconnection capacity (MW) and price effect per 1400 MW cable (€ per MWh) 2020 2030 PW GG ST SW PW GG ST SW Without Cables 36.7 49.8 28.0 77.3 n/a 72.0 40.9 90.2 With Cables 39.6 51.2 28.8 76.9 61.3 72.4 41.2 89.0 Difference 2.9 1.4 0.9 -0.4 n/a 0.4 0.2 -1.1 Δ Transmission Capacity 3500 3500 1400 700 0 1700 700 2800 Effect per 1400 MW Cable 1.1 0.6 0.9 -0.8 n/a 0.3 0.4 -0.6 Source: Project team analysis As a rule of thumb, corresponding to the one developed for renewables investments, we have estimated an “Effect per 1400 MW Cable”, which is simply an average price effect. The marginal effect of another 1400 MW cable is likely to be less, as the price effect is typically diminishing with additional interconnection. Compared with the price effect with renewable investment, the price effect of new cables is fairly limited, with a maximum of € 2.9 per MWh for 3500 MW of interconnector capacity in the Politics Work scenario in 2020. A direct comparison is of course difficult, but given the magnitude of new renewable capacity vs. new interconnector capacity assumed in the scenarios, based on current plans and targets, the comparison is still relevant.12 The price effect of interconnectors is also correlated with the power balance: The larger the power surplus, the higher is the price effect of the cable. This is illustrated in Figure 5.6. Thus, in a balanced power market the price effect of a cable is small. In other words: If cables are built, but not renewables, the price effect of the cable will be limited, as the power balance will be less positive. 11 Please note that in the Politics Work scenario, all major cables are built before or in 2020; there are no major new interconnectors from Norway or Sweden to the Continent after 2020, which is why we cannot identify a price effect. 12 It should be noted that the real price effects are likely to be slightly smaller than the ones calculated by the model because the model simulations do not capture changes in demand levels due to different price levels. This is valid for the price effects of both cables and renewables R-2010-083 54 CHALLENGES FOR NORDIC POWER Figure 5.6 Price Effect of a Standard 1400 MW Cable (€/MWh) on Nordic prices (outside Denmark) dependent on Power Balance for 2020 Price Effect of a 1400 MW Cable (€ per MWh) 1.5 ‐20 1 0.5 0 ‐10 0 ‐0.5 ‐1 10 20 30 40 50 Nordic Trade/Energy Balance w/o DK (TWh) Politics Work 2020 Green Growth 2030 Stagnation 2030 Green Growth 2020 Stagnation 2020 Supply Worries 2020 Source: Project team analysis Facts and Findings 6: The price impact of interconnectors is much smaller than the price impact of investments in renewable capacity. The scenarios describe realistic levels of new investments in renewable capacity and new interconnector capacity between the Nordic market and the Continent and UK. In all scenarios we find that the price reducing effect of renewable generation is much stronger than the price increasing effect of new interconnector capacity. 5.6 TOTAL INTERCONNECTOR CAPACITY HAS A LIMITED EFFECT ON POWER EXPORTS Viewed in isolation, i.e. before taking price effects into account, cables do not increase net trade or net exports, but the value of trade. A country like Norway, where almost all generation is given in terms of annual energy (hydro and wind), can only export the difference between annually available energy and demand, independent from how many cables there are. But the cables influence the export opportunities, and hence the opportunity costs for hydro generation. To the extent that domestic electricity demand responds to price changes due to increased trade, the power balance can be somewhat affected. As we have seen, though, the price effects of cables are small, and hence the effect on consumption is probably small, too. Moreover, end users respond to changes in the total cost of electricity, i.e. including distribution and transmission tariffs, and not directly on changes in wholesale prices. R-2010-083 55 CHALLENGES FOR NORDIC POWER An overview and comparison of net trade between and from Nordic countries is given in Figure 5.7. It confirms the above argument, namely that the total net trade is not affected by the amount of cables. Only to the extent that there is some flexible generation in form of condensing plants, CCGT, or extraction CHP, does the amount of domestic generation vary and hence the amount of net trade (as a result of price changes). Figure 5.7 Net annual trade with and without transmission cables in 2020 (TWh per annum) 20 Russia 10 Lithuania 0 Estonia UK ‐10 Poland Netherlands ‐20 Germany Finland ‐30 Denmark PW NO GG NO ST NO SW NO PW SE GG SE ST SE SW SE PW FI GG FI ST FI With Cables Without Cables " With Cables Without Cables " With Cables Without Cables " With Cables Without Cables With Cables Without Cables " With Cables Without Cables " With Cables Without Cables " With Cables Without Cables With Cables Without Cables " With Cables Without Cables " With Cables Without Cables " With Cables Without Cables ‐40 With Cables Without Cables " With Cables Without Cables " With Cables Without Cables " With Cables Without Cables Import (+) and Exports (‐) (TWh per annum) 30 SW FI PW DK GG DK ST DK Sweden Norway SW DK PW: Politics Work; GG: Green Growth; ST: Stagnation; SW: Supply Worries NO: Norway; SE: Sweden; FI: Finland; DK: Denmark Source: Project team analysis Facts and Findings 7 Increased interconnector capacity is not likely to yield substantially increased power exports In principle, there are two possible sources of increased power exports: Reduced Nordic demand and increased Nordic generation. As for generation, it can basically only increase in power plant with flexible fuel supply, i.e. gas and coal plant.1When it comes to effects on consumption, these would be a function of price effects. The model simulations show however that the effect on wholesale prices is minor. Hence, the interconnector expansions per se, should not have a crucial impact on electricity demand in the Nordics. 5.7 CABLE REVENUES ARE SUBSTANTIAL The model simulations can be used to estimate the congestion rents, or income from trade on the assumed interconnectors. We emphasize however, that the model results presented here will only partly reflect the true expected cable revenues and costs. Based on experience from various cable analyses, we know that the model results are likely to underestimate total revenues. One reason for this is that we only consider the revenue potential related to power traded in the spot market under fairly normal market conditions. We have not analyzed the revenues in case of extreme market imbalances (e.g. extreme R-2010-083 56 CHALLENGES FOR NORDIC POWER dry/wet years, unforeseen plant or transmission outages, etc.).Finally, we have not taken other possible benefits into account such as sale of system and balancing services. The congestion rent estimates for an average 1400 MW cable for the different scenarios is given in Table 5.4. It shows that the congestion rent is substantial in all scenarios, even those where either annual average price differences are small (Supply Worries), or where prices are moderately volatile (Stagnation). Table 5.4 Normalized Cable Revenues per 1400 MW (€ mill per annum) Politics Work Green Growth Stagnation Supply Worries 2020 177 151 129 155 2030 180 132 117 188 Source: Project team analysis Cable income high also for lower average price differences The reason for the cable income being significant even when the average price difference between the Nordics and the Continent is small is that the cable revenue is driven by hourly price differences, not by the difference in average prices. Average hourly price differences are shown in Figure 5.5.13 As a consequence, the cable income would still remain relatively high even if the difference in average prices decreases, for example as a result of a smaller Nordic power surplus. This is illustrated in 13 The graphs in Figure 5.5 show the annual average price for each hour in a week, and the price fluctuations around this pattern can be substantial. R-2010-083 57 CHALLENGES FOR NORDIC POWER Figure 5.8. The x-axis shows changes in the Norwegian price compared to the level found in the scenario simulations. The y-axis shows the corresponding changes in cable income. For example, if power prices in the Politics Work scenario should be around € 15 per MWh higher than modeled (for example, as a result of less renewables built or increased demand due to the low price level), the annual cable revenue would be lower, but still lie around € 130 mill per annum. Thus, the price structure differences secure a certain minimum cable income of at least around € 120 mill per year across scenarios. R-2010-083 58 CHALLENGES FOR NORDIC POWER Figure 5.8 Cable Income (proxy in € mil per year) for shifts in Norwegian power prices as a result of difference power balances for 2020 Cable Income for a 1400 MW Cable (proxy; € mill per annum) 300 Politics Work Green Growth 250 200 Stagnation Supply Worries 150 100 50 0 ‐10 ‐8 ‐6 ‐4 ‐2 0 2 4 6 8 10 12 14 16 18 20 Norwegian price shift (€ per MWh) Source: Project team analysis If the difference in average prices is reduced due to lower prices on the Continent, and specifically if that change is explained by a power surplus in the Continental markets, the cable incomes would be lower. By power surplus we refer to a situation with excess capacity in the sense that the marginal investments are not profitable. This could be the case if renewable capacity does not replace existing thermal capacity, or if power producers are too optimistic about the market prospects. The effect of such a situation would first and foremost be reduced peak and high load prices, and this would reduce the value of exchange with the Nordic market. It is however not very likely that such a surplus situation would prevail for longer time periods. The cable income is robust even if further cables are built We have also simulated a case for the Politics Work scenario for 2030 with an additional 600 MW cable between Germany and Sweden. The aim was to analyze how this may impact the congestion rent on other cables. As can be seen in Table 5.5, this has a small negative impact on the congestion rent from the cables to Germany and the Netherlands. Only for the existing Sweden-Germany link is the reduction substantial, another indication that the congestion rent on cables between Norway and the Continent seems to be robust. R-2010-083 59 CHALLENGES FOR NORDIC POWER Table 5.5 Cable Income with and without additional SE-DE link for 2030 Politics Work (€ mill per annum)14 Politics Work Politics Work with new SE-DE Link NorGer/Nord.Link 163 150 NorNed2 163 153 NSN 214 209 SE-DE Link 77 55 SE-DE Link 2 n/a 55 Source: Project team analysis Revenues exceed cable costs In order to assess the profitability of cables, costs must be compared to revenues. The costs of cable investments can be divided into two components: Direct costs: the costs for the cable itself and directly associated investments such as transformers, etc., including construction costs. Indirect costs: system related costs caused by the cable, such as domestic grid investments that become necessary when new cables are built. While the direct costs can be estimated using costs estimates for cables that have already been built, the indirect costs are very difficult to measure, as it is difficult to assess what internal grid investments may become necessary. Although Statnett’s Grid Development Plan gives some indications of the costs, it is also difficult to allocate costs to different cables, and to distinguish costs associated with changes in demand and supply, such as increased renewable generation and electrification, and new interconnector capacity. The transmission grid is inherently a public good with economies of scale, and the optimal, total development plan is affected by assumptions about a large array of uncertain factors pertaining to future market situations. Based on information about recently constructed cables we assume that the costs for new transmission cables lies somewhere between € 0.9 and€ 1.2 mill per MW. Assuming a lifetime of 40 years for cable investments, and a real interest rate of 5%, the annualized investment costs per MW of cable are between € 50.000 and € 70.000 per MW. From a total economic welfare point of view, the profitability of the cable is not only associated with the direct congestion rent on the cable, but with the other welfare economic effects of the cable as well. Looking at interconnectors from a country point of view, the relevant measure is the total welfare economic consequence for that country. These include changes in the congestion rent on other interconnectors, and changes in consumers’ and producers’ surplus. The changes in these elements are associated with price changes: The congestion rent on other interconnectors change due to changes in total flow and price changes The consumers’ surplus increases in hours where prices decrease and, vice versa, decreases in hours where prices increase 14 The revenue on the SE-DE link between Sweden and Germany in the reference case is for a 600 MW line, the revenue in the case with an additional line is for a 1200 MW line (two 600 MW cables). R-2010-083 60 CHALLENGES FOR NORDIC POWER The producers’ surplus increases in hours where prices increase and, vice versa, decreases in hours where prices decrease Generally, this means that the impact on the total social surplus, apart from the direct income on the cable, is likely to be smaller the smaller the price impact of the cable is. There is however also a positive volume effect: Increasing the interconnector capacity implies that production plans in flexible hydro power plant can change so that production increases in hours with higher prices (export hours) and decreases in hours with lower prices (import hours). The upper rows of Table 5.6 show the direct costs and the direct congestion rent revenue, in the latter case also taking into account the changes in revenues on other cables for the Norwegian TSO (Δ CR in the table). Since the cables in question are connected to the Norwegian grid, this would be the numbers relevant from the Norwegian point of view. In all scenarios we find that the increase in congestion rent is higher than the direct cost of the cable, even if we apply the high cost estimate. The annualized revenues shown in Table 5.6 are 40% to 80% higher than the annualized high cost estimate and 60% to 110 % higher if we apply the average cost estimate. These values are important because they indicate to what extent the cables will generate revenues that can contribute to associated internal grid investments. Table 5.6 Size (MW) Costs Revenue Difference Change in Total Congestion Rent (Δ CR) for Norwegian TSO and Total Norwegian Welfare Change (Δ Welfare) and Cable Costs for Norwegian TSO 2020 (€ mill per annum) Politics Work Green Growth Stagnation Supply Worries All 3500 3500 1400 700 Min 88 88 35 18 Max 123 123 49 25 Average 105 105 42 21 Δ CR 225 195 68 36 Δ Welfare 290 249 80 56 Δ CR-Costs 120 90 26 15 Δ Wel.-Costs 185 144 38 35 Source: Project team analysis The numbers indicate that cable investments would also be interesting for private investors, as the return would be positive at higher interest rates. The bottom rows of Table 5.6 shows the net welfare gains that do not accrue as monetary revenue to the cable owners, but changes in the surplus accruing to society through changes in prices and resource values. That is, they include the changes in the terms of trade, reflects the change in value of all trade (see also Appendix 1: How electricity infrastructure creates value). This number is higher than the congestion rent income alone, indicating that return for the country as a whole is even higher than the return for the TSO or a private investor. R-2010-083 61 CHALLENGES FOR NORDIC POWER Facts and Findings8: Interconnector cables generate substantial economic gains in all scenarios. Since hourly price differences prevail, the bottleneck revenues from spot market trade are substantial in all scenarios. In addition, there are positive gains associated with welfare economic effects such as consumers’ and producers’ surplus, and security of supply benefits. Trade patterns, however, differ between scenarios. The higher the surplus, the more are the cables used for exports. The smaller the surplus, the more are the cables used for exchange, exporting power to the Continent during high and peak load hours, and importing power during low load hours. Facts and Findings9: Bottleneck revenues contribute to internal grid investments and/or tariff reductions. The scenarios represent reasonable combinations of interconnector capacity and power surplus, and in all scenarios the bottleneck revenue is estimated to at least 40% more than the direct cost. We do not have a basis to do own assessments of the investments and system costs in the internal grid associated with new interconnectors, but it is clear that the bottleneck revenues are likely to yield a significant contribution to the financing of such costs. Revenues accruing from intraday trade and balancing services represent an additional upside. Facts and Findings10 Interconnectors are profitable even in scenarios where the power surplus is not extreme. Even if a large power surplus is not realized, interconnectors are profitable based on the differences in hourly prices between the Nordic (hydropower) area and the Continental market. Facts and Findings11: End user prices are likely to be less affected by interconnector expansion than wholesale prices End user prices depend on wholesale prices, grid tariffs, excise taxes and green certificate fees. To the extent that interconnector revenues cover more than the grid costs associated with interconnectors, the effect on grid tariffs will be negative, and counteract the price increase effect of interconnectors. 5.8 CABLES INCREASE AND REDISTRIBUTE WELFARE The price effect of the cables will have consequences for the respective stakeholders in the market. For example, producers will benefit from higher prices (as they earn more), while the consumers will have to pay the bill for the higher prices. But the effect is not a mere redistribution. If the trade balance of a country is positive, the terms of trade improve with higher prices, and aggregated welfare is increased. In addition, the welfare picture includes the change in total congestion rent income for a country, including change in congestion rent on existing lines. The summary of these main indicators, the terms of trade, and the change in congestion rent, is given Table 5.7.15 15 Please note again that in the Politics Work Scenario there are no major new transmission cables built between Norway and Sweden, and the Continent or the UK in the period 2020-2030, so we cannot report welfare indicators for this scenario R-2010-083 62 CHALLENGES FOR NORDIC POWER Table 5.7 Welfare Indicators across Scenarios (€ mill. per annum) 2020 Norway Sweden Finland Denmark Nordic 2030 Politics Work Green Growth Stagnation Supply Worries Politics Work Green Growth Stagnation Supply Worries Δ ToT 66 54 12 21 n/a 57 8 133 Δ CR 225 195 68 36 n/a 30 29 185 Total 290 249 80 56 n/a 86 37 318 Δ ToT 73 35 22 19 n/a -28 6 29 Δ CR -73 -41 -27 -22 n/a 28 -2 -28 Total 1 -6 -5 -3 n/a 0 4 1 Δ ToT -31 -20 -10 16 n/a 21 -2 6 Δ CR -9 -6 -1 -5 n/a -12 -1 -2 Total -39 -26 -11 11 n/a 8 -3 4 Δ ToT 18 0 3 -3 n/a 6 -4 22 Δ CR -40 -20 -15 -1 n/a -28 -3 -41 Total -22 -20 -12 -4 n/a -21 -7 -19 Δ ToT 126 68 27 53 n/a 56 8 190 Δ CR 103 128 25 8 n/a 18 24 114 Total 230 197 52 60 n/a 73 31 303 ToT: Terms of Trade; CR: Congestion Rent Source: Project team analysis Transmission cables contribute to an overall increase in total welfare in the Nordic. We would, however, like to point out that the results are only results of a partial analysis, namely the cable effect on the wholesale power prices. Other effects or benefits that lie outside the model scope are not included in the numbers above (for example, security of supply, supply diversification, balancing options, etc.; see Appendix 1). 5.9 PRICE AND CONGESTION RENT VARY WITH INFLOWS All results presented so far are results for a normal hydrological year. But the market effects will vary between normal, wet and dry years. We have therefore also modeled the scenarios for wet and dry hydrological years. We picked a dry year representing the 5%percentile of the inflow distribution, and a wet year representing the 95%-percentile of the inflow distribution.16 The effect of the hydrological situation on the prices in Norway and the congestion rent is illustrated in Figure 5.9. It shows the percentage change in values in both wet and dry years. As one would expect, wet years lead to a price decrease in Norway, which in turn increases the congestion rent. Conversely, prices are higher in dry years, which decreases congestion rent.17 16 This means that only 5% of historic years have an annual inflow lower than the dry year modeled, and only 5% of historic years have an annual inflow higher than the modeled wet year. In other words, the numbers represent 1-in-20years extremes. 17 Only for the supply worries scenario the price increase in Norway in dry years leads also to a (small) increase in cable income. This is due to the effect that wet and dry years will have different effects in different weeks of the year, depending also on the distribution of inflow over the year. Such small changes lie typically within the range of model uncertainty. R-2010-083 63 CHALLENGES FOR NORDIC POWER Overall, average annual prices vary by +/- 10%according to variations in inflow levels in dry and wet years. The price changes in particular seasons are even stronger. It should be noted that the price spread between wet and dry years would be much higher without new interconnectors, i.e. the inflow effect on prices would be much more pronounced if no new cables were built. This is particularly the case for wet year situations in the scenarios that already have a substantial power surplus in normal years. Figure 5.9 Prices in Norway (€ per MWh) and Congestion Rent (€ mill. per annum) in 2020 for wet and dry years Dry Congestion Rent per 1400 MW Price Norway Supply Worries Stagnation Congestion Rent per 1400 MW Green Growth Wet Politics Work Price Norway ‐30 % ‐20 % ‐10 % 0 % Change of Value 10 % 20 % Source: Project team analysis While we observe that values change with the hydrological inflow, the congestion rent is still substantial also in dry year. For example, the largest decline in congestion rent is in a dry year in the Politics Work scenario, with a decline of 23% compared to a normal year. Nevertheless, the total income per 1400 MW cable is still € 135 million per annum (compared to € 177 mill per annum in normal years), as the diurnal price variation still ensures a substantial cable income. Another issue concerning wet years is the likelihood of spill. In Norway alone, the annual inflow can vary with +/- 30 TWh. This means that in wet years (or two wet years in a row) a substantial interconnection capacity is needed in order to export the resulting power surplus. Facts and Findings12: In scenarios with a large power surplus, increased interconnector capacity is necessary to avoid spilling in wet years and to secure the value of hydropower capacity Some increase in the power surplus can be handled without expansion of interconnectors. However, it is very probable that the power surplus in wet years could be too large to be handled by existing interconnectors. R-2010-083 64 CHALLENGES FOR NORDIC POWER 5.10 THE IMPACT OF FUEL PRICES, POWER BALANCE, AND SYSTEM FLEXIBILITY In order to test the robustness of the results, and the importance of certain input factors, we also simulated a number of sensitivities. All our sensitivities are based on the 2020 Politics Work scenario, and include the following changes: Higher and lower coal prices($ 105 per ton and $ 47 per ton instead of $ 69 per ton) Higher and lower gas prices ($ 10.5 per MMBtu and $ 3.6 per MMBtu instead of $ 6.9 per MMBtu) Lower and higher CO2 prices (€ 15 per ton and € 30 per ton instead of € 18 per ton) Reduction in demand from power intensive industry in the Nordic area. The reduction of 9 TWh corresponds with a phase out of two large aluminumsmelters Increased system flexibility in Germany (increased pumped storage equivalent, i.e. access to local flexibility) All sensitivities use the same generation capacity assumption as the 2020 Politics Work scenario, i.e. we ignore capacity adjustments as a result of, for example, fuel price changes. In this respect, the sensitivities represent short rather than long-term effects. To what extent the analyzed changes are indeed short-term, varies from case to case: We know from history that fuel prices vary over time, and as such, it is likely that fuel prices will vary within each scenario as well. CO2 prices are more long term, and to a large extent affected by expectations about the future. In the Politics Work scenario for example, we have assumed that a global climate agreement is in place by 2020 and that the 2030 CO2 price is significantly higher than the 2020 CO2 price of 18 €/ton. If this is anticipated by the market, it is likely that allowances will be banked, thus increasing the CO2 price in 2020 as well. To what extent this will affect investments, depends on when market participants start to anticipate this change. Hence, we can argue that the capacity should be the same, representing low CO2 price expectations for most of the decade from 2010 to 2020, but that the actual price in 2020 is likely to be higher. Reduced electricity consumption in the power intensive industry could be a result of poorer competitiveness in global markets, or a lack of carbon compensation for the Nordic industry. In any case, this represents a more long-term change in market conditions. Increased system flexibility in Germany also represents a more long-term adjustment, and should induce changes in other investments as well. This means that the sensitivity will overestimate the price response in Germany and hence, the effect on the cable income as well. R-2010-083 65 CHALLENGES FOR NORDIC POWER Figure 5.10 Changes in Cable Income and Prices in the Sensitivities relative to Politics Work 2020 (changes in %) Cable Income NorGer/NordLink Increased System Flexibility PII demand reductions Price Germany Lower CO2 price Price Norway Lower gas price Lower coal price Higher CO2 price Higher gas price Higher coal price ‐30 % ‐20 % ‐10 % 0 % 10 % 20 % 30 % 40 % Change of Value (%) Source: Project team analysis The results for the sensitivities are given in Figure 5.10. As expected, increased system flexibility in Germany reduces the cable income. A reduction of power intensive industry improves the Nordic power balance, lowers prices, and increases cable income. Higher CO2 prices and coal prices have similar effects: Both lower the cable income, as the price effect in the Nordic countries is larger than in Germany. In Germany, the higher CO2 and coal prices lead to more fuel switching, which is not an option in the Nordic countries. Lower coal and CO2 prices have the opposite effect. Higher gas prices, on the other hand, lead to significantly higher prices in Germany, as peak load prices increase substantially. As a result, cable income increases. Lower gas prices, on the other hand, decrease power prices in the Nordic area more than in Germany. This is due to the fact that a part of the start-up costs is not fuel price related, but is related to wear-and-tear. The result is a small increase in cable income, which may lie within range of model uncertainty. 5.11 DIFFERENT OPPORTUNITIES AND CHALLENGES FOR DIFFERENT COUNTRIES The basic challenges in the different scenarios are to a large extent shared by the Nordic systems. When it comes to price impacts, the outcomes in the different scenarios are particularly similar for what we have called the Nordic hydropower system, i.e. Norway, Sweden and Finland. These three countries all have significant amounts of hydropower generation capacity, a high degree of internal connectivity, and a similar demand structure. Still there are important differences when it comes to policy choices, challenges and market impacts. Denmark is also different when it comes to both generation and demand structure, and is furthermore situated between the hydropower system and the Continental markets. In this section we will briefly comment on the country-specific challenges revealed by the scenarios. R-2010-083 66 CHALLENGES FOR NORDIC POWER Norway Norway develops a power surplus in all four scenarios, including the Supply Worries scenario (See Figure 5.11). In 2020 the surplus ranges from 15 TWh in a normal year in the Politics Work scenario to 7 TWh in Supply Worries. As a consequence, any price increase will improve the terms of trade. From this perspective, transmission cables increase the overall welfare. Demand and Generation (TWh) Figure 5.11 Generation and demand for Norway in the four scenarios (TWh) 180 Nuclear 160 Other 140 100 Natural Gas Coal 80 Biomass 60 Wind offshore Wind onshore Water 120 40 20 0 2020 2030 " 2020 2030 " Politics Work " Green Growth " 2020 2030 Stagnation " 2020 2030 " Supply Worries Demand Source: Project team analysis Furthermore, Norway seems well suited as a landing point for new interconnectors outside the Nordic region. Our sensitivity analysis and the results for the Green Growth 2030 scenario indicate that the congestion rent on cables from Norway will be higher than the congestion rent on respective cables from Sweden, although the Swedish surplus is larger in all but the Supply Worries scenario. Table 5.8 Prices within Norway (€ per MWh)18 2020 2030 PW GG ST SW PW GG ST SW Norway NSY 40.8 51.2 29.3 76.8 61.4 72.5 40.7 89.7 Norway NST 39.3 49.9 28.5 76.4 60.0 71.7 40.2 89.1 Norway NVE 39.3 49.9 28.5 76.4 60.0 71.7 40.2 89.1 Norway NOS 39.3 49.9 28.5 76.4 60.0 71.7 40.2 89.1 Norway NMI 39.3 49.9 28.5 76.4 59.9 71.4 40.2 88.5 Norway NNO 38.6 49.2 28.5 76.0 59.5 70.7 40.2 87.7 Norway NFI 38.6 49.2 28.5 75.9 59.5 70.4 40.2 87.2 Source: Project team analysis 18 NSY: South Norway; NST: Buskerud, Vestfold, Telemark; NVE: West Norway; NOS: Oslo and Østfold area; NMI: Mid Norway; NNO: North Norway; NFI: Finmark. Please note that our results do not account for physical challenges (loop flows, frequency instability, etc.) that may be imposed on the system. R-2010-083 67 CHALLENGES FOR NORDIC POWER In a future with increased interconnector capacity between Norway and the Continent, and a growing export surplus in Sweden as well, the Norwegian flow pattern is set to change substantially, e.g. Norway will increasingly become a transit area to/from Sweden and Denmark. In our model simulations, we find that prices between different parts of Norway will vary slightly (see Table 5.8). Flow changes are however not only associated with new interconnectors, but with new electricity demand (e.g. offshore electrification) and connection of new generation capacity. Hence, internal bottlenecks in Norway are associated with the location of new generation capacity and new demand. In our model simulations we have not analyzed this aspect in detail. Based on this, we merely conclude that locational signals in grid tariffs and price area definitions may be important to manage system and grid costs for Norway. In addition, Norway has a special challenge related to the annual inflow variations, implying that hydro power generation can vary by +/- 30 TWh between wet and dry years compared to a normal year. Hence, the surplus may be up to 45 TWh in Politics Work if 2020 is a wet year. On the other hand, if 2020 is a dry year, Norway may have to import 15 TWh in Politics Work. As such, the interconnector capacity provides flexibility, particularly in terms of handling wet years, and also contributes to stabilization of price variations from year to year. Even in Supply Worries, the dry year challenge seems to be of less importance for Norway in the future than what has been the case in recent years. Sweden With the current plans for renewables in Sweden, we expect Sweden to experience an unprecedented power surplus in the future (compare Figure 5.12). The only scenario in which Sweden ends up in a deficit situation is the Supply Worries scenario, where we assume a significant decline in Swedish nuclear power generation combined with a slower growth in new renewable generation. The surplus is around 20 TWh in all the other scenarios. Sweden has a normal year hydro power generation of about 66 TWh, and annual inflow variations are approximately +/- 12 TWh. Hence, Sweden is not as exposed to inflow variations as Norway, but the substantial normal year surplus means that the need for export capacity can be large in wet years. For Sweden, however, it is possible to manage some of the variation through adjustments in thermal power generation, although this is mainly nuclear power which is not easy to regulate in the short term. Hence, a specific challenge for Sweden, in view of the looming increase in export capacity, is the potential for and willingness to adjust nuclear generation. Historical data reveal that there are substantial annual variations in nuclear generation, but these are not strongly correlated with variations in hydro generation. Inflow variations have mainly been managed by variations in imports. R-2010-083 68 CHALLENGES FOR NORDIC POWER Demand and Generation (TWh) Figure 5.12 Generation and demand for Sweden in the four scenarios (TWh) 200 Nuclear 180 Other 160 Natural Gas Coal 140 120 100 Biomass 80 Wind offshore Wind onshore Water 60 40 20 0 2020 2030 " 2020 2030 " Politics Work " Green Growth " 2020 2030 Stagnation " 2020 " Supply Worries 2030 Demand Source: Project team analysis In all scenarios Sweden is likely to face similar challenges as Norway, as substantial investments in renewables will probably require internal grid investments. The significant power surplus also implies that Sweden needs increased interconnection with its neighbours to export the surplus. As for the three scenarios with a power surplus, a price increase induced by new transmission cables will also improve the terms of trade for Sweden. Furthermore, the price increase will lead to a reduction in prices for Green Certificates, and will hence decrease necessary renewable support to be paid by end-users. Figure 5.13 Annual electricity consumption in Sweden in the four scenarios (TWh) 180 160 Demand TWh 140 120 100 80 60 Politics Work Stagnation Historic 40 20 Green Growth Supply Worries 0 2030 2028 2026 2024 2022 2020 2018 2016 2014 2012 2010 2008 2006 2004 2002 2000 Source: Project team analysis R-2010-083 69 CHALLENGES FOR NORDIC POWER One major uncertainty in the development of the Swedish power balance is demand. Historical data show that electricity demand has been very stable in Sweden since the 90ies (compare Figure 5.13). While we expect some demand growth in all scenarios starting from today’s level, both Politics Work and Stagnation barely reach pre-crisis levels before 2020. Figure 5.13 also illustrate that Sweden was hit hard by the financial crisis, and this affected electricity demand as well. Green Growth and Supply Worries show a somewhat more optimistic demand picture. If demand growth continues the weak trend in these scenarios, the power surplus would be even larger and the price level lower than in our estimates. The critical issue for demand is whether the general business environment and relative power price level would attract investments in the electricity intensive industry. Finland Historically, a central challenge for Finland has been the reliance on extensive electricity imports from Russia and from the Nordic area. Security of supply concerns are the main background for the planned investments in nuclear capacity in Finland, regardless of the expected supply surplus in Norway and Sweden. Although the import needs vary between the scenarios, from 4 to 12 TWh annually in 2020 and from -2 to 10 TWh in 2030, we conclude that Finland is likely to continue to rely on imports to meet its domestic electricity demand (cf. Figure 5.14), despite increased nuclear capacity investments in all but the Stagnation scenario. We have assumed that the contractual imports from Russia will cease to zero by 2030 (except from the Supply Worries scenario, where they will remain at a level of 5 TWh per annum). In most scenarios, however, Finland imports from Sweden and Norway, but has some exports to Estonia. Demand and Generation (TWh) Figure 5.14 Generation and demand for Finland in the four scenarios (TWh) 120 Nuclear 100 Other Natural Gas Coal 80 60 Biomass 40 Wind offshore Wind onshore Water 20 0 2020 2030 " 2020 2030 " Politics Work " Green Growth " 2020 2030 Stagnation " 2020 2030 " Supply Worries Demand Source: Project team analysis The severity of the deficit, however, depends on whether or not Finland will be able to extend its nuclear generation. Although renewables generation increase and coal capacity is reduced to varying extents in the scenarios, reducing the import need depends on the construction of the 6th and 7th reactor. An important question is whether investments in Finnish nuclear capacity will be profitable in the long run, if the Finnish electricity price level stays low because of the build-up of a power surplus in Sweden and Norway as in the Politics Work scenario particularly. And if not, will an increasing dependency of imports from Sweden, and perhaps even Estonia, be R-2010-083 70 CHALLENGES FOR NORDIC POWER politically acceptable? In the Green Growth and Supply Worries scenarios, the electricity prices are higher due to a smaller Nordic surplus and higher international fuel and CO2 prices, implying that nuclear capacity is more likely to be profitable on market terms. The power balance situation will, of course, also be dependent on how demand develops in the different scenarios, in particular power intensive industry. In this respect, the interplay between the supply situation and the domestic demand is important. Without extending its local generation or ensuring relatively low prices by having sufficient interconnection with its neighbours, the demand increase in power intensive industry would adjust and slow down. Given the relative importance of these industries in Finland, maintaining its competitiveness may be a major political issue as well. Denmark In terms of the electricity sector, Denmark is very different from the rest of the Nordic area. Starting from a system based almost exclusively on coal generation, the country has successfully subsidized wind power generation over the last 10-15 years, to the extent that wind generation now currently supplies 20% of total demand. At the same time, electricity consumption in Denmark is relatively low, both because of a ban on electric heating and due to the absence of a power intensive manufacturing industry. Generation in the central coal and gas units is flexible to a certain degree and depends on price developments in neighbouring markets. The import/export balance of Denmark does hence not necessarily always follow the general scenario logic. As we can see, Denmark has substantial net exports in most cases, even in the Politics Work scenario 2020 where the combined Norwegian/Swedish surplus is at its largest. The Danish ambition is to increase the share of wind power generation even more, up to 50% of total generation (cf. Figure 5.15). The combination of intermittent wind power generation and a large share of combined heat and power generation has been a major incentive for the increase in interconnectivity between Denmark and adjacent market areas, as well as the connection between East and West Denmark in recent years. The challenges in clearing supply and demand on an hourly basis (and even shorter time periods on the balancing market) mean that Denmark depends on exchange capacity with neighbouring markets. Demand and Generation (TWh) Figure 5.15 Generation and demand for Denmark in the four scenarios (TWh) 60 Nuclear 50 Other 40 Natural Gas Coal 30 Biomass 20 Wind offshore Wind onshore Water 10 0 2020 2030 " 2020 2030 " Politics Work " Green Growth " 2020 2030 Stagnation " 2020 2030 " Supply Worries Demand Source: Project team analysis R-2010-083 71 CHALLENGES FOR NORDIC POWER So while interconnectors are important for the other countries in order to drain annual surpluses or secure energy imports, interconnection is important for Denmark in order to manage hourly variations. While the level of interconnection has spot price consequences for the other Nordic countries (in particular Sweden and Norway), it is likely to have implications for system stability and the performance of the physical grid in Denmark, in addition to the price impact. This challenge is not likely to become smaller in the coming years. This is the reason why Denmark is pursuing plans to increase its level of interconnectivity. Reinforcements to Germany, Skagerrak 4 (with a part reserved for balancing services), the Great Belt, and the COBRA cable will all contribute to increase system flexibility and Denmark’s ability to clear demand and supply. At the same time the Danish system probably has to prepare for substantial transit of power. Typically, power will flow from the Nordic hydropower area to Germany (and the Netherlands if Cobra is built) during the daytime and in periods with low wind generation in the thermal systems or wet conditions in the north, and from Germany to the Nordic area when wind generation is high or conditions are dry in the north. A share of the existing large coal generation capacity is to be phased out in the years to come. Increasing price volatility and a possible reduction in operation hours for the central capacity may imply that it will not be profitable to replace these units and the consequences for system stability and the system’s ability to accommodate a large share of wind power is being questioned. The combination of increased wind generation, reduced thermal generation, and increased transit, implies that system and grid challenges may be the most crucial for the Danish system in the coming decades. Demand response and smart-grids may contribute to increased system flexibility. The challenge for Denmark, however, lies in the fact that the potential for demand response is, compared to other Nordic countries, limited, as electricity is not so much used for heating purposes, which is one of the areas with the most potential for demand response. Installing electric boilers that can switch from thermal fuel to electricity are among the options pursued in order to increase the flexibility on the demand side. R-2010-083 72 CHALLENGES FOR NORDIC POWER R-2010-083 73 CHALLENGES FOR NORDIC POWER 6 WHY SHOULD WE CARE? The scenario analysis and the model simulations show a wide variation in long-term wholesale prices in the Nordic areas as well as on the Continent. Price levels vary according to fuel and CO2 price assumptions and, in the Nordic hydropower system particularly, according to the overall balance between supply and demand. Similarly, price differences between market areas and between different load situations (price structures) vary according to these and other scenario assumptions as well. The wholesale price development is naturally an important parameter for producers, consumers and the investors in interconnections. However, the consequences for different stakeholders do not depend on wholesale price effects only, but also on consequences for other elements in end-user prices. For example, wholesale prices are directly relevant for producers, while end-user prices including grid tariffs, excise taxes and supply margins are the relevant prices for consumers. And while increased renewable generation may reduce wholesale prices, grid tariffs and/or taxes may increase. 6.1 PRICE EFFECTS OF RENEWABLES AND CABLES Wholesale price effects and implications The main elements explaining wholesale prices are fuel prices, CO2 prices, renewable investments, and interconnectors. This is illustrated in Figure 6.1. The relative size of the different elements varies between scenarios and markets. International fuel prices, i.e. coal and gas prices, make up the main part of the marginal cost in the price setting power plants in the Nordic area as well as on the Continent, as they enter directly into the costs of generation and define the water values. These prices are set in world and European markets, and are obviously not influenced by Nordic policies or markets. Global climate policies may influence fuel prices, but they are mainly market driven and a common driver in the various markets. R-2010-083 74 CHALLENGES FOR NORDIC POWER Figure 6.1 Overview over wholesale market price effects General market effect Nordic market effect Producers Income distribution effects Prices determined by Drivers Fuel prices Global economy and fuel markets CO2 allowances RES investments Global, EU and Nordic climate policies MAIN AREA OF POLITICS Interconnectors Consumers Market reaction Redistribution policies - Carbon cost compensation Source: Project team analysis The CO2 price is a result of climate policies. Currently the CO2 price in Europe is determined by the EU ETS (Emission Trading Scheme), which is to be in place at least until 2020 (provisions for the development of the cap beyond 2020 are given in the Directive). The CO2 cost adds to the marginal cost in coal and gas power plants, and yields a higher electricity price. Nordic policies and market developments may have a marginal effect on the CO2 price, as increased renewable generation generally yields a lower price (all else being equal), but the main determinants of the CO2 price are the ETS cap, abatement costs in other sectors and the relative coal and gas price. The combination of fuel and CO2 prices explain the differences in Continental electricity price levels between the scenarios. Investments in renewable generation have a negative impact on the electricity wholesale price in the Nordic market to the extent that it increases the export surplus. This effect does not occur in the markets on the Continent because the additional generation replaces generation in plants based on flexible fuels in the short term and investments in new thermal capacity in the long term. Both in the Nordic area and on the Continent, however, investments in new renewable capacity are policy driven, i.e. subsidized. Thus, the price decline on the Nordic power market does not imply that generation has actually become cheaper. On the contrary, the capacity based on new renewable energy sources has higher costs, and thus needs to be subsidized. Hence, this effect is mainly policy driven. However, the price effect depends on the market situation, and it can be argued that it makes more sense to subsidize renewable power generation in order to replace investments in CO2 emitting plant, than to pay out subsidies to increase the power balance. As the markets are connected however, the overall effect on investments and total emissions do not necessarily differ. New interconnector capacity will yield an increase in Nordic wholesale electricity prices because it increases the value of the resources, including “old” hydropower and nuclear power. The effect is generally stronger when the annual power surplus is large compared R-2010-083 75 CHALLENGES FOR NORDIC POWER to the total interconnector capacity, and smaller when the market or the combination of surplus and interconnector capacity is more balanced. The impact on Continental average market prices is generally negligible, because impacts are absorbed by adjustments in generation and investments, similar to the effect of renewables investments. Interconnectors can be built by private investors or by transmission system operators (TSOs). New interconnectors require licensing by the authorities, and must be open for third-party access. As such, the market impacts of a new interconnector are not likely to differ according to ownership. In both cases the decision will be based on the market fundamentals, and in that respect, interconnector investments are basically market driven. That being said, there is no doubt that regulations – and hence policies – play an important role when it comes to assessing the fundamentals of the investments. Nevertheless, we will maintain that interconnector projects are mainly based on market considerations. Wholesale prices are hence affected both by market developments and by policies, and the price impacts differ between markets. The main policy related influences stem from CO2 policies and renewable policies. But while European (and global) CO2 policies affect the price level both in the Nordic area and on the Continent, the price impacts of renewable policies are different. Although exports of renewable electricity replace fossil fueled generation in Continental markets, there is a negative price effect in the Nordic market due to an increasing surplus and transmission bottlenecks. In that respect we can say that the cost of renewable policies in the Nordic hydropower area is higher than on the Continent (all else equal): Since increased renewables lowers the Nordic price, the difference between the market price and the total cost of new renewable generation increases as well. Figure 6.2 shows the magnitude of the different elements making up the Nordic wholesale price in the different scenarios. We observe that the fuel prices and CO2 prices explain most of the general price level differences between the scenarios. The impact of new renewable generation is negative in all scenarios. The largest absolute price impact of renewable is found in Green Growth. The smallest impact of renewable is found in Stagnation, in which the investments in renewable are low and so are the fuel prices. The largest price impact of interconnectors is found in Politics Work, but the impact is only about 25% of the (opposite) impact of renewable generation. In all the other scenarios, the price impact of interconnectors is negligible. R-2010-083 76 CHALLENGES FOR NORDIC POWER Spot price (€ per MWh) Figure 6.2 Overview of wholesale price effects in the scenarios, 2020 simulations 100 100 90 90 80 80 70 70 60 60 50 50 40 40 30 30 20 20 10 10 0 0 Spot price (€ per MWh) Initial Price (including CO2 element) RES Cables Initial Price (including CO2 element) 100 100 90 90 80 80 70 70 60 60 50 50 40 40 30 30 20 20 10 10 0 Initial Price (including CO2 element) 0 RES Cables Initial Price (including CO2 element) RES RES Cables Cables Source: Project team analysis Price effects along the value chain Generally, elements increasing the power price gain electricity generators and hurt electricity consumers. However, the effect on total costs or gains for most stakeholders does not only depend on wholesale prices, but on developments in grid tariffs, taxes and subsidies and supply margins as well. Hence, it is too simplified to conclude that whatever gains generators, equally hurts consumers or vice versa. Figure 6.3 gives an overview of the total effects on end-user prices from interconnectors and renewables. In the figure we have added the impacts on transmission tariffs and enduser subsidy payments to the wholesale price effects (blue columns to the left). R-2010-083 77 CHALLENGES FOR NORDIC POWER Figure 6.3 Overview of end-user price effects Relevant for other end-users Relevant for Power Intensive Industry Relevant for Producers ‐ Fuel prices CO2 RES Wholesale + + ‐ + RES Cables RES ‐ + Cables Tariffs Cables Subsidies Legend: RES Renewable Generation Source: Project team analysis All consumers (and generators) pay transmission tariffs in order to cover transmission and system costs. Investments in both new renewable generation and interconnectors affect the tariff base. New interconnectors increase grid costs because they change flow patterns and increase flow changes. Increased shares of renewable electricity generation increase grid costs because of location and because of scale and intermittency characteristics. As such, necessary investments in the internal grid are not only associated with interconnector expansion. It is generally difficult to allocate grid development costs between different “sources” since the transmission grid is in a sense a public good and exhibits economies of scale. This is the reason why the grid is subject to monopoly regulation. Regulations imply that the total tariff revenues of the TSOs do not exceed a predetermined level, usually set by the grid costs (as in classic rate of return regulation) or a revenue cap which is at least partly separate from the cost level. In the Nordic region, the regulated revenues typically include all income to the TSO, even congestion rent on interconnectors. Hence, to the extent that interconnectors generate revenues beyond the cost of operating and investing in the cable, the cost increase due to internal grid investments may be partly or fully covered by congestion rent revenues on the interconnectors. If these congestion rent revenues exceed internal grid costs associated with new interconnectors, investment in interconnectors will actually lower grid tariffs. Our analysis indicates that congestion revenues are on average at least twice as high as the direct cost of the cable. This means that as a rule of thumb, we can say that if we invest € 100 mill in an interconnector, the revenues will on average cover annual investment costs in the internal grid of € 100 mill. In the figure we have illustrated this effect as a negative effect on the transmission grid tariff, i.e. interconnectors lower the average tariff due to higher congestion rent revenues than the overall increase in grid costs due to the interconnectors (including the cost of accompanying internal grid investments). The outcome for a specific end-user depends on a number of factors, such as the allocation of grid investment and system operation costs R-2010-083 78 CHALLENGES FOR NORDIC POWER between renewables, interconnectors, different groups of consumers (i.e. the tariff model) and general structural changes in supply and demand. In addition, end-users must somehow pay for the subsidies to renewable generation capacity. Whether the subsidies are paid as a green certificate obligation or a feed-in tariff included in the electricity bill, it nevertheless accrues as an increase in the electricity price per kWh. In the figure we have indicated that interconnectors reduce the subsidy payment in the electricity bill. This is because interconnectors increase the wholesale price (dark blue column) and hence the residual cost to be paid through subsidies is reduced. The total effect is thus decomposed into two separate effects in the figure. As the increase in the wholesale price is larger than the reduction in the subsidy share (as the renewables share is less than 100%), the reduction in the subsidy element due to the price effect of interconnectors is smaller than the wholesale price effect. 6.2 IMPLICATIONS FOR STAKEHOLDERS The description of the different price components, i.e. wholesale prices, tariffs, and subsidies, implies that the price effect of cables and renewables will be different for different stakeholders. For example subsidy payments may not, or only partly, be imposed on the power intensive industry, meaning that the effect on subsidies is only relevant for non-industrial demand groups. This section gives a systematic overview over the implications for different stakeholders. Producers Generators sell and buy power directly on the power exchange, and are as such directly exposed to drivers affecting the wholesale price. Thus, as renewable investments will on reduce wholesale prices, the income for producers is directly affected (and hence also the income for the owners; see below). Interconnectors only partly offset this price effect. It could be argued that producers may be unwilling to invest in renewable generation in order to avoid the negative price effect. But this would be a false conclusion. If incumbent generators fail to invest, then the investment opportunity will be taken by other investors as long as the support schemes deem such investments profitable. Hence, the decision for an incumbent will be whether he will reap the benefits of investments in new renewables or leave this business opportunity to others. The negative effect on existing generation will occur anyway. Thus, as the amount of new renewable generation is set by subsidies determined by politics, the only way for producers to impact the outcome is to influence renewable targets via political channels, or by increasing pressure on cable investments (by, for example, pushing for own cable investments such as NorGer). Other sources of additional revenues will however emerge for hydropower producers in particular. It is likely that more renewable investments will increase the need for system and balancing services. This also represents a potential substantial upside for Nordic generators in relation to interconnector capacity, as the demand for, and willingness to pay for system and balancing services will increase as the share of renewables increase in Continental markets. R-2010-083 79 CHALLENGES FOR NORDIC POWER Power intensive industry The power intensive industry buys power on long term contracts or directly on the power exchange. Usually the price in a long term contract is linked to spot price developments. In addition, they contribute to grid costs via their share of transmission grid tariffs. The power intensive industry is probably the most price sensitive part of Nordic electricity demand both in the short run and in the long run. As the price paid by the power intensive industry does not include the subsidy element – so as to not distort the competitiveness of these industries - the “net” of renewables and cables when it comes to the electricity price facing the power intensive industries is thus Renewables investments reduce the wholesale price and increases grid tariffs Interconnector investments increase the wholesale price and may reduce grid tariffs Of these, our analyses show that the impact of renewables investments is likely to be the largest element by far, and perhaps more importantly, this effect is particular to the Nordic market. This means that renewables not only reduce electricity prices, but even reduces the relative prices for Nordic industry compared to the rest of Europe. New interconnectors only partly offset some of this price effect, but as renewables clearly increase grid tariffs, interconnectors may reduce tariffs because of the contribution from congestion revenues. Moreover, renewable investments increase the variation in generation from year to year because precipitation and wind vary, whereas interconnectors even out such price variations. Increased interconnector capacity means that prices decrease in dry years and increase in wet years. The power intensive industry may however not be exposed to the wholesale price as depicted in the figure: One very important element in the wholesale price is the CO2 cost component. The power intensive industry does compete in a global market, and the Europe-specific CO2 cost reduces the global competitiveness of the industry, foremost via its effect on electricity prices. Here the possibility to offer carbon leakage compensation may prove to be a crucial mechanism for the industry. If carbon leakage compensation is instituted in a way reflecting the real indirect costs, the combined effect of the climate policy package could prove to increase the competitive edge of the Nordic power intensive industry substantially. For example, the Carbon price in 2030 in Politic works is assumed at € 30 per ton, and represents a substantial share of the wholesale electricity price. As a simplified illustration, this price yields a cost of € 12 per MWh in a new gas power plant and € 24 per MWh in a coal plant. The actual carbon cost element may vary between markets, scenarios and market situations, however, but compensation would hence mean significantly lower enduser prices for power intensive industry. This means that the industry will pay a “wholesale” price that is lower than the wholesale market price received by generators. The relevant difference is the CO2 cost element in the wholesale price represented by the second dark blur rectangle in the price figure above. Even for industries, the ability to offer short and longer-term system services may represent an additional income potential related to increase system costs associated with renewables as well as interconnectors. Our analysis has focused on the situation with regard to prices, generation, consumption and transmission capacities in two particular years, 2020 and 2030. However, the trajectory towards these milestones may be equally important. Specifically, the investments in new renewable generation and interconnectors require domestic grid R-2010-083 80 CHALLENGES FOR NORDIC POWER reinforcements in advance. The grids have to be strengthened before new interconnectors and generators are connected to the grid. The cost of these internal grid investments will typically be added to the asset base of the transmission owners (rather than being financed through connection charges), and will hence increase tariffs. The tariff increase must likely be carried by the consumers, as EU regulations limit the level residual tariffs on generators. The exact distribution of costs between consumers depends on the tariff models employed by regulators and/or TSOs Over time, the tariff increases are offset by the bottleneck income from the interconnectors. From a consumer point of view, the time lag between costs and benefits mean that future benefits from lower prices and tariffs have to be larger than the short-run tariff increases in order to be viewed as profitable. Also, there is no guarantee that the new generation capacity and interconnectors are built, which serves to reduce further the value of future benefits to the consumers. This may pose a particular problem for power intensive industries. Large industrial power users tend to assess the profitability of their activities more or less on a continuous basis (at least if we disregard the Norwegian petroleum sector, where the impact of the power price is likely to be negligible). Short-run tariff increases due to factors that have little to do with industrial power use as such, may therefore lead to decisions to close down plants. Such decisions may be practically irreversible once they have been made. Depending on the circumstances, the closing of industrial plants due to (residual) tariff increases may cause economic losses to society as a whole Non-Industrial end-users Non-industrial end-users include manufacturing and service industries, and domestic consumers. This consumer group is likely to be presented with the remaining bill. As the power intensive industry is likely to be largely exempt from direct financing renewable generation, the required subsidy increase will be higher the higher the relative share of power intensive industry is. This user-group, however, will benefit from lower tariffs as result of cables, and reduced subsidy for renewable generation. TSOs The TSOs have a responsibility for the quality and security of supply, and their objective is to develop the electricity system in a way that ensures this in a cost-efficient manner and to the benefit of society as a whole. This is a complicated task. As briefly mentioned above, the transmission grid is a collective (or public) good exhibiting economics of scale, and hence it is not really possible to allocate all costs and benefits of the grid to different sources or sectors in the economy. Among the challenges facing the TSOs is the distribution of tariffs in order to minimize the impact on markets and market behaviour. Today the TSOs face a situation with a great deal of uncertainty about future market developments, but with a strong drive for investments in renewable generation and, as the scenarios show, a prospect for an increasing power surplus. Analyses show that this creates a need for increased investments in the grid and a market case for investments in interconnector capacity. New interconnectors contribute to internal grid investments and increase social welfare. For Norway particularly, interconnectors increase the value of the hydro power resources. R-2010-083 81 CHALLENGES FOR NORDIC POWER We have seen that transmission cables from Norway are likely to generate a welfare economic surplus, and that the extra revenues can be used to lower grid tariffs. The main challenge for the TSOs, however, is to be able to make the adequate investment decisions at the right time and under a great deal of uncertainty. It takes a long time to realize the necessary investments in interconnectors as well as in the domestic grids, and the connection of new renewable generation may well depend on both. It is also clear that explaining and documenting the benefits of huge investments in the electricity infrastructure to politicians and the general public is an increasing problem. Owners of generation capacity We have argued that higher wholesale prices as a result of increased interconnection benefit the producers, while consumers have to pay higher prices (to the extent that enduser prices do in fact increase). However, a large share of the Nordic generation capacity is publicly owned by the state or by municipalities. Hence, a relatively small share of the generator revenues accrues to private investors. And even in privately owned utilities, revenues are of course subject to taxation. Therefore, the increased income of producers is to a large extent redistributed to the public via ownership or taxes, and hence indirectly benefitting the consumers. Especially for the Norwegian government, the price effect incurred by the cables would mean increased revenues via its shares in companies and the natural resource tax. Thus, as the size of the cake gets bigger with additional cables, there is more to share, and the distribution of costs and benefits is not determined by wholesale price effects alone. R-2010-083 82 CHALLENGES FOR NORDIC POWER R-2010-083 83 CHALLENGES FOR NORDIC POWER 7 WHAT CHOICES DO WE HAVE? 7.1 A COMMON CHALLENGE: THE NORDICS MUST CONTRIBUTE Global warming and climate change poses a common threat to the global community. A crucial element in the mitigation of greenhouse gases to the atmosphere is to reduce emissions in from electricity generation. Based on this recognition, the EU has launched an ambitious energy and climate policy package with the aim to profoundly restructure stationary energy supply and demand in Europe in the coming decades. Both the global climate change challenge and the EU policy efforts concern the Nordic countries, including the Nordic electricity market. The Nordic countries are politically committed to take part in the restructuring of the European market by increasing investments in renewable energy sources just like the other EU and EES countries. Although some degrees of freedom exist, there is little doubt that a significant part of this commitment must be realized through investments in renewable electricity. 7.2 A SPECIAL NORDIC CHALLENGE All countries incur costs related to the increase in renewable generation, but the costs associated with market price effects in the Nordic market differ from those on the Continent. Whereas renewable capacity on the continent more or less directly replace fossil fuelled generation, increased capacity in the Nordic market increases the power surplus, and hence reduces the value of existing generation. This is particularly true for what we can call the hydropower area, i.e. Finland, Norway and Sweden. Increased renewable generation can either be exported, or be used “at home”. In order to export this surplus it is necessary and highly profitable to increase the interconnector capacity between the Nordic area and the Continent. Increased interconnector capacity gives the option to increase exports, and, furthermore, increases the value of exports from the Nordic area. And our analysis shows that all the planned interconnectors are highly profitable in such a scenario (Politics Work). In addition, not building interconnectors increases the likelihood for spill of water. The other option is to increase Nordic electricity consumption, which is described in the Green Growth scenario. Even in this scenario we find that the export surplus is significant, and the proposed interconnectors are still clearly profitable. Policy implication: If the Nordic countries, including Norway, are willing to take on ambitious binding renewable targets, the decision to go ahead and increase interconnector capacity to the Continent should be a logical part of this commitment. Most of the planned interconnectors are likely to be put in operation between 2015 and 2020. In Norway the full realization of the planned interconnectors require strengthening of the internal grid. This implies substantial investments that will take time, in the region of 4 billion NOK (€ 500 mill) according to Statnett’s Grid Development Plan (investments in the so-called Eastern and Western Corridors). If these projects are not started today, it will not be possible to build all the planned interconnector capacity from Norway (or to fully utilize the capacity). One might object that it is not obvious that the renewable targets will be high, or that the targets might not be reached. In that case we would have a strong network, but we do not have to build all the interconnectors. The interconnectors are usually built as joint projects R-2010-083 84 CHALLENGES FOR NORDIC POWER between a Nordic and a Continental partner. Hence, if the project is not deemed profitable for both partners, based on the welfare implications and prices in both markets, it is less likely that the interconnectors will be built. In that sense, the profitability of the interconnectors also reflects the value of exchange between the two markets, including the environmental value. The challenge at hand today, is to make a decision about investments with a long leadtime and under considerable uncertainty. However, our analysis implies that the mistake we make if we do not plan for integration of substantial new interconnector capacity – as we commit to ambitious renewable targets – is less than the mistake we make if we do plan for increased interconnectivity and less is needed after all. The decision we make today in any case has implications for what options we have down the line. Fulfilment of the renewable targets may also be compromised if the export capacity is not sufficient in wet years. It is also important to keep in mind that a strong internal grid and interconnectors are not worthless without a substantial power surplus in the Nordics. The value is related to security of supply and environmental and efficiency benefits. Power exchange between the Nordic hydropower area and the thermal system on the Continent will still earn substantial revenues. 7.3 INCOME DISTRIBUTION EFFECTS Investments in renewable generation capacity and interconnectors affect the income distribution as well through the impacts on market prices. This means that the indirect costs of reaching the targets are not equally distributed between producers and consumers, and among different consumer groups. Increasing renewable generation has a profound impact on price levels, and hence the value of all generation capacity in the hydropower area. The value of Nordic hydropower is, using 2020 as an example, reduced € 2.5 bill in a normal year if renewable targets are reached and no new interconnectors are built. Naturally tax revenues and owner dividends are reduced correspondingly. On the other hand, the reduction in wholesale power prices benefits power consumers. Our analysis does however show that investments in interconnectors only to a smaller extent offset the negative impact on wholesale prices: Even with full realization of the interconnections planned, the price lowering impact of increased renewable generation is substantial. Moreover, in scenarios with a lower power surplus, the price impact of interconnectors is very small. And what is more, interconnectors do not yield Continental prices in the Nordic area in any of the scenarios. Policy implication: The worry that interconnectors imply import of Continental price levels and structures is not substantiated, and should not be a big concern. For the power intensive industry, the distribution and level of transmission grid tariffs, and provisions for carbon leakage compensation, should be a more important concern. The price impact of renewable targets in the hydropower area is likely to be substantial, with or without increased interconnector capacity to the Continent. The larger the Nordic surplus, the larger is the price differences to the Continent, and the higher is the bottleneck revenues on interconnectors. The higher the bottleneck revenues, the more will the interconnectors contribute to a lowering of the transmission grid tariff. Thus, the combination of renewable targets and interconnectors is likely to increase the competitiveness of the power intensive industry. It may well be difficult to fulfil the R-2010-083 85 CHALLENGES FOR NORDIC POWER renewable targets without increased interconnectivity: Reaping the benefits of renewable generation without accepting the slight offsetting effect of interconnectors may not be a realistic option. Domestic end-users must ultimately carry the costs of renewable subsidies. Given the price-lowering effect of renewable generation, however, the total electricity bill may not increase. If internal grid investments are carried through and it turns out that the renewable targets, and hence EU’s climate and energy policy efforts, break down, transmission grid tariffs may increase for all users. The main political question is whether it is rational and credible to adopt ambitious renewable targets without at the same time committing to an increase in interconnector capacity to Continental markets. R-2010-083 86 CHALLENGES FOR NORDIC POWER R-2010-083 87 CHALLENGES FOR NORDIC POWER APPENDIX 1: HOW ELECTRICITY INFRASTRUCTURE CREATES VALUE The main long-term driver behind the development of the power system will always be to maximize the value of electricity consumption to society. This appendix describes how electricity infrastructure – which we define as power plants, network assets and equipment and assets for consumption of electricity – create benefits to society, and at what cost. In particular, we focus on interconnector capacity between the Nordic countries, Continental Europe and the UK. Economic fundamentals: Consumer and producer surplus Electricity infrastructure serves a purpose by enabling producers and consumers of electricity to reap economic benefits. For producers, the benefits take the form of profits from generating and selling electricity. For consumers, the benefits arise from producing or consuming goods and services that require electricity (i.e. computers, television, heating and cooling, lighting etc.). Essentially, the optimal electricity infrastructure maximizes the joint benefits from power consumption and generation and minimizes the costs of the power system (including environmental costs), while at the same time satisfying constraints with regard to supply security. The fundamental economic cost-benefit perspective is illustrated in the figure below, where we illustrate the concepts of consumer and producer surplus with simple demand and supply curves. The sum of consumer and producer surplus equals the net benefit to society from electricity infrastructure. The optimal level of consumption and generation of electricity is found at the intersection of demand and supply, i.e. where the marginal willingness to pay for one extra kWh is equal to the marginal cost of supplying that kWh. The consumer surplus (the area marked Consumer Surplus in the figure) equals the consumers’ collective willingness to pay minus the cost of buying the desired amount of electricity (price x volume). Similarly, the producer surplus is equal to the sales price multiplied by the volume generated minus the costs of production (the area marked Producer Surplus in the figure). Obviously, this is a stylized illustration, but it serves to show the basic relationship between demand, supply, and value creation in the electricity system. R-2010-083 88 CHALLENGES FOR NORDIC POWER Figure A.1.1 Illustration of Consumer and Producer Surplus Price Consumer Surplus S Producer Surplus D Volume Source: Project team analysis The demand curve measures the consumers’ willingness to pay for electricity, which is again derived from the various uses of electricity. For instance, the willingness to pay for electricity-specific consumption such as electricity for computers and lighting is very high per kWh, making demand fairly insensitive to price changes. At the other end of the scale we find electricity use in power intensive industry sectors with small operating margins, where the willingness to pay may be limited and demand highly price-sensitive. Electricity for heating is another type of demand that is highly flexible, provided that the end-users have an alternative source of heating. Overall, demand depends on a number of factors such as population levels, energy intensity, the level of economic activity in general, types of economic activity (i.e. the structure of the economy), temperatures, taxes and subsidies on electricity and other forms of energy. The supply curve shows the marginal cost of generating electricity. For our purpose, we assume that the supply curve includes network and environmental costs as well as ordinary fuel costs and other costs facing a generator. We may also assume that security of supply requirements are included. The supply curves may be interpreted as short-term (marginal operating costs only) or long-term (marginal long-term costs including investment costs). The marginal operating costs depend on several factors, including fuel prices (in thermal power plants), tariffs for injecting power into the grid, personnel costs and taxes pr. kWh produced. Among these, fuel prices and taxes tend to be the most important factors. For hydropower with reservoir capacity, the marginal cost is less relevant. Instead, it is necessary to consider the water value or the opportunity cost of using the water to generate power at another point in time. The water value is typically linked to the marginal cost in thermal power plants. R-2010-083 89 CHALLENGES FOR NORDIC POWER Interconnector - benefits and costs Having described the basic structure of the demand and supply for electricity, we now move on to network infrastructure in general and interconnectors between power systems in particular. The table below summarizes the main elements in a cost-benefit analysis of a network investment. Table A.1.1 Cost-Benefit Elements of Network Investments Benefit/cost element Effect of network investment Benefit cost (-) Investment costs Cost of building network assets (manpower, materials etc.) - Cost of operating and maintaining network assets and reinvesting +/- Bottleneck costs Costs of congestion in the grid are typically reduced through network investments. Implies that the overall cost of operating the power system is reduced (or a switch from low-value to high-value demand as measured by willingness to pay), i.e. a net increase in the combined producer and consumer surplus. + Congestion rent Income from price differences and trade between markets (relevant for interconnectors between countries) + Terms of trade Changes in export/import prices due to electricity +/- New capacity for increased generation or consumption Increase in producer or consumer surplus due to connection of new power plants or consumption facilities to the grid + Exchange of system and balancing services Economically similar to benefits from exchange of power + Network losses Changes in total network losses due to a network investments +/- Security of supply Reduced risk and expected cost of outages, voltage interruptions and rationing + System costs Changes in costs of operating the power system, for instance reserves. +/- Environmental costs Environmental impact of network assets +/- Transit costs Costs related to EU transit compensation system – primarily relevant for interconnectors +/- Operating maintenance including reinvestments and costs operation (+)/ Source: Project team analysis R-2010-083 90 CHALLENGES FOR NORDIC POWER These elements may be quantified to a larger or smaller degree, depending on available data. It should be noted that some benefits and costs are included in other elements. For instance, the value of reducing CO2 emissions is (at least partly) reflected in the market price of electricity due to the EU ETS system. The factors described above determine the net value of a network investment to society. I.e., an investment is economically beneficial if the overall benefits outweigh the costs. Of course, network investments that change domestic power prices also influence the distribution of wealth between consumers and producers due to changes in power prices and network costs. A network investment may have an overall positive effect for society, but result in a loss from the perspective of consumers or producers. The distribution of wealth may be adjusted by other means, however, such as taxes, and the model for allocating network costs between producers and consumers is also important. The effect on power prices therefore only measures the direct distributional consequences. In the following, we describe some of the benefits and costs that are of particular relevance when evaluating interconnector projects. The fundamental value of an interconnector arises from the fact that trade between two power systems enables a more efficient operation of the two systems combined, which increases the producer and consumer surplus. In turn, more efficient operation may lead to lower investments. In order to illustrate the economic principles, consider the following example in the figure below: We have two countries, A and B. There is no transmission capacity between the two countries at the outset. The demand in each country is fixed and equal to the width of the horizontal axis. We assume that the demand in country A is equal to XA in the figure (measured from the left along the horizontal axis) and XB in country B (measured from the right). The supply in country A is shown as an upward-sloping curve from the left in the figure, SA. Similarly, the supply in country B is shown from the right as SB. The supply curves are assumed to be linear in order to simplify the illustration. SA0 and SB0 are the initial generation levels in each country. Without transmission capacity between A and B, domestic supply has to cover demand, resulting in the price levels PA0 and PB0. Assume now that an interconnector with a capacity C is built. This lead to an increase in the price in A and a reduced price in B, to PA1 and PAB respectively. Part of the consumption in B is now covered by imports from A equal to the interconnector capacity. The value of the interconnector is given by the following elements: Change in producer and consumer surplus: In country A, the producer surplus increases due to increased generation and prices to SA1 and PA1, while the consumer surplus is reduced (the triangle marked CPA). In country B, the consumer surplus increases and the producer surplus is reduced as prices and generation decrease to SB1 and PB1 (the triangle marked CPB). Congestion rent: The congestion rent is equal to the price difference (after the interconnector investment) multiplied by the interconnector capacity (the rectangular area CR). R-2010-083 91 CHALLENGES FOR NORDIC POWER Figure A.1.2 Illustration of Cable Effects C SB PB 0 CPB PB 1 SA CR PA1 CPA PA0 SA1 SA0 SB0 XA XB S B1 R-2010-083 92 CHALLENGES FOR NORDIC POWER R-2010-083 93 CHALLENGES FOR NORDIC POWER APPENDIX 2: MODELING METHODOLOGY In order to quantify the outcome in the scenarios in terms of prices, power balances, trade, etc., we employ the Econ Pöyry BID model to measure these parameters under the different set of assumptions. The BID model is a so-called fundamental power market simulation model. It mimics the power markets by finding prices, trade, generation, etc. as a result of an optimization problem. BID has an hourly time resolution, something that is essential when analyzing trade between regions. It models the Nordic hydro reservoirs using an explicit water value approach, and models thermal units with start-up costs, part-load efficiencies, minimum load restrictions, and other relevant restrictions. Its current geographic focus is North-West Europe. The BID model has been back-tested and validated in a number of external and internal projects. We use the BID model to assess the impact of power balances, transmission cables, fuel prices, and CO2 prices on spot market prices for electricity, and, as a consequence, on welfare measures, trade, and congestion rent income. Conservative results As a fundamental model, the results from BID in terms of price volatility and observed market fluctuations are conservative in the sense that they underestimate price volatility and other fluctuations in the market. The observed fluctuations in the market are often driven by random, unforeseen, and unexpected factors, such as, for example, plant outages (e.g. nuclear in Sweden or Germany) o, transmission capacity outages (e.g. Oslofjord Cable). Furthermore, market fluctuations can sometimes be the result of extreme expectations (for example, very high fuel price expectations or the expectation of very low inflow and low reservoir fillings), which are difficult to capture by a fundamental model. As a result of this, the BID model typically underestimates the value of arbitrage between markets, as arbitrage is often driven by imbalances within and between markets. As a consequence, the BID model typically underestimates congestion rent on transmission lines between the Nordic countries and the Continent. This implies that there is an upside to the congestion rent results presented in this study, which we estimate to lay in the area of 10-20 percent. Issues that lie outside the model The BID model is a partial equilibrium model. This means that it models the power markets only. Fuel prices, CO2 prices, and other important factors are not determined by the model, and are an input into the model. The model does also not take into account demand response from power intensive industry or other sectors. In order to do so, one would not only need to model the power markets, but the markets for raw materials, competitiveness between regions, global economic demand for goods, etc., something which lies beyond the scope of this study. R-2010-083 94 CHALLENGES FOR NORDIC POWER In our scenario descriptions and assumptions, we therefore aimed at addressing these issues by building sets of consistent assumptions. As many of the assumptions are highly uncertain, also within each scenario, we also included sensitivities in order to test how changes in underlying assumptions may change the conclusion. When we quantify the benefits of cables, it is therefore important that the model only allows measuring two main factors of the cable, namely congestion rent of a cable (including changes in congestion rent on other cables as a result of this cable), and how the cable affects the terms of trade (which, in technical terms, can also be expressed as the changes in producer and consumer surplus). Other benefits, such increased system efficiency, CO2 emissions effect, upside on the balancing market, security of supply19, etc., have to be evaluated outside the model (see also Figure A.2.1). Figure A.2.1 Sources for Cable Benefits (Illustrative) Bottleneck income (Price differences) Balancing power/system services Other Business case total Increased systems efficiency Terms of trade Security of Supply (Dry-year) (Global climate effect) Other Grand Total – business and economic value Source: Project team analysis Interpretation of results It is important to recognize that the results from the model simulations presented in this report do not represent a price prognosis, but are part of a scenario analysis, where the relative performance is much more important than the absolute levels. We therefore would like to emphasize that the numbers presented in this report do not represent an official price forecast by Econ Pöyry or THEMA Consulting Group. 19 While we model wet and dry years, we do not model severely extreme years in which load would have to be shed. R-2010-083 95 CHALLENGES FOR NORDIC POWER Model results are strongly dependent on the input assumptions, what aspects are taking into account, and how this is done. Consequently, models can only achieve a certain degree of certainty. It is therefore no point in comparing after-comma digits in model results, as some variations may be simply due to imprecise assumptions or modelling of mechanism. For example, the results for a dry year in Norway will not only depend on the annual inflow modelled, but also how the inflow is distributed over the year, and how expectations may change along the way. Therefore, two dry years with the same annual total inflow may yet have very different effects on the markets depending on the distribution of the inflow. R-2010-083 96 CHALLENGES FOR NORDIC POWER R-2010-083 97 CHALLENGES FOR NORDIC POWER APPENDIX 3: DETAILED ASSUMPTIONS FOR SCENARIOS In this appendix we give a comparative overview of the most important and relevant input assumptions. We present detailed data tables for demand, capacity, fuel prices, and transmission assumptions. Generation Capacities Generation capacities, in particular assumptions on renewables and nuclear capacities vary between scenarios. A detailed overview of the assumptions is given in Table A.3.1 below. Table A.3.1 NorWay Sweden Finland Denmark Hydro Wind Bio Nuclear Coal N.Gas Other Hydro Wind Bio Nuclear Coal N.Gas Other Hydro Wind Bio Nuclear Coal N.Gas Other Hydro Wind Bio Nuclear Coal N.Gas Other Generation Capacities in the Nordic Countries across Scenarios (TWh) 2010 30 0 0 0 0 0 0 16 1 3 9 0 2 3 3 0 4 3 3 2 1 0 4 1 0 5 3 1 Politics Work 2020 2030 32 33 4 4 0 0 0 0 0 0 1 1 0 0 17 17 4 5 6 6 10 10 0 0 3 3 2 2 4 4 2 4 3 3 4 6 2 1 2 2 1 1 0 0 4 5 2 2 0 0 3 2 2 2 1 1 Green Growth 2020 2030 33 34 4 5 0 0 0 0 0 0 1 1 0 0 17 17 7 9 6 6 10 10 0 0 3 3 2 2 4 5 3 6 3 3 4 7 1 0 2 2 1 1 0 0 6 7 2 4 0 0 2 1 2 2 1 1 Stagnation 2020 2030 31 31 1 1 0 0 0 0 0 0 1 1 0 0 17 17 3 3 6 6 10 9 0 0 3 3 2 2 4 4 1 1 3 3 4 4 2 1 2 2 1 1 0 0 5 6 1 1 0 0 3 2 2 2 1 1 Supply Worries 2020 2030 32 33 3 4 0 0 0 0 0 0 1 1 0 0 17 17 4 5 6 6 7 7 0 0 3 3 2 2 4 4 2 4 3 3 4 7 0 0 2 2 1 1 0 0 4 5 2 2 0 0 2 2 2 2 1 1 Source: Project team analysis R-2010-083 98 CHALLENGES FOR NORDIC POWER As for the Continent and the UK, the assumptions on renewable and nuclear capacities follow the story line of the Nordic countries. That is, for example, if we assume increased renewable investment activity in the Nordics, we assume a similar story line for the Continent and the UK, as the drivers are similar. Furthermore, investments on the Continent and in the UK are influenced by CO2 emissions price, fuel prices assumptions, and investment costs for different technologies. An overview over capacity assumptions for the main Continental countries of relevance and the UK is given in Table A.3.2 below. Table A.3.2 Capacity Overview for Continent and UK (installed GW) DE NL PL UK Hydro Wind Renew. Nuc. Coal Lignite N.Gas Other Hydro Wind Renew. Nuc. Coal Lignite N.Gas Other Hydro Wind Renew. Nuc. Coal Lignite N.Gas Other Hydro Wind Renew. Nuc. Coal Lignite N.Gas Other 2010 10 25 5 20 28 21 25 3 0 3 2 0 4 0 13 0 2 1 0 0 22 9 1 0 4 5 1 12 28 0 32 0 Politics Work 2020 2030 10 10 35 40 22 27 4 0 10 34 11 8 32 16 1 1 0 0 8 9 2 3 0 0 2 12 0 0 16 8 0 0 2 2 3 3 3 3 0 0 4 7 4 4 14 14 0 0 4 4 22 26 6 8 5 11 0 17 0 0 41 20 0 0 Green Growth 2020 2030 10 10 46 52 22 27 4 4 10 7 11 8 39 56 1 1 0 0 10 12 2 3 0 0 2 1 0 0 17 19 0 0 2 2 3 3 3 3 0 0 4 1 4 4 17 23 0 0 4 4 27 33 6 8 4 4 0 0 0 0 45 46 0 0 Stagnation 2020 2030 10 10 34 39 22 27 13 13 10 7 9 4 21 29 1 1 0 0 7 9 2 3 0 0 2 1 0 0 16 15 0 0 2 2 3 3 3 3 0 0 4 1 2 1 16 19 0 0 4 4 19 24 6 8 5 11 0 0 0 0 37 31 0 0 Supply Worries 2020 2030 10 10 34 40 22 27 0 0 17 36 11 8 36 27 1 1 0 0 7 9 2 3 0 0 12 19 0 0 10 5 0 0 2 2 3 3 3 3 0 0 19 23 4 4 2 1 0 0 4 4 19 26 6 8 4 4 19 30 0 0 29 19 0 0 Legend: DE - Germany, PL – Poland, NL.–Netherlands, UK - United Kingdom, Renew. All other renewables except from wind and hydro Source: Project team analysis R-2010-083 99 CHALLENGES FOR NORDIC POWER Demand Demand varies significantly between scenarios, and is mostly driven by assumptions on GDP growth and energy conversion assumptions. An overview over the demand assumptions is found in Table A.3.3. Table A.3.3 Gross Demand across Scenarios (TWh per year) Politics Work Green Growth Stagnation Supply Worries 2010 2020 2030 2020 2030 2020 2030 2020 2030 PII 41 43 54 48 54 38 35 48 51 Elec. Veh. 0 0 1 0 3 0 0 1 3 Other 80 83 85 84 89 82 84 83 85 Subtotal 121 126 140 132 147 120 119 131 140 Swe- PII 34 41 47 45 47 36 36 45 47 den Elec. Veh. 0 0 1 1 7 0 1 1 7 Other 101 105 106 109 113 109 111 108 110 Subtotal 135 146 154 155 167 145 149 154 164 PII 32 36 46 41 46 32 33 39 41 Elec. Veh. 0 0 1 0 3 0 0 0 3 Other 53 57 60 57 62 55 57 57 61 Subtotal 85 92 107 98 111 86 90 97 105 Den- PII 0 0 0 0 0 0 0 0 0 mark Elec. Veh. 0 0 1 0 3 0 0 0 0 Other 35 37 39 39 44 36 38 38 40 Subtotal 35 37 39 40 47 36 38 38 40 PII 107 119 147 133 147 106 104 131 140 Elec. Veh. 0 0 3 2 16 0 2 2 14 Other 269 281 289 289 308 281 291 286 296 Total 376 401 440 425 472 387 397 419 449 Norway Finland Nordic Legend: PII - Power Intensive Industry, Elec. Veh. - Demand from Electric Vehicles Source: Project team analysis Fuel Prices and CO2 emission prices Fuel prices and CO2 emission prices vary significantly among scenarios, and are one of the most important determinants of power prices as they directly influences the short-run marginal cost of generation for different technologies. An overview over the different fuel prices in absolute terms can be found in Table A.3.4. R-2010-083 100 CHALLENGES FOR NORDIC POWER Table A.3.4 Fuel Price Assumptions across Scenarios Politics Work Green Growth Stagnation Supply Worries Fuel Unit 2010 2020 2030 2020 2030 2020 2030 2020 2030 Coal $/ton 76 69 69 105 119 48 42 105 119 Oil $/barrel 77 86 87 120 134 52 48 120 134 N. gas $/MMBtu 5 7 10 7 10 4 5 10 14 Coal €/MWh 8 7 7 11 13 5 4 11 13 N. gas €/MWh 12 17 25 17 25 9 12 26 35 CO2 €/tCO2 13 18 34 30 45 15 25 30 45 Source: Project team analysis Transmission One of the central assumptions for the scenarios is the assumption on additional interconnection to and from and within the Nordic market area. An overview over the main assumptions is given in Table A.3.5. Table A.3.5 Overview over Transmission Investments across Scenarios (Year of Implementation) Transmission Line Capacit y Politics works Green Growth Stagnation Supply Crisis Southwest Link Sweden-Sweden 1200 2015 2015 2015 2015 SK4 Denmark-Norway 600 2015 2015 2015 2015 Britned 1000 2015 2015 2015 2015 Nord.Link (or NorGer) Norway-Germany 1400 2020 2020 2020 2025 Reinforcements Denmark-Germany 500 2012 2012 2012 2012 Further Reinforcements DenmarkGermany 500 2025 2025 2025 2025 NorNed2 Norway-Netherlands 700 2020 2015 2025 2020 Estlink 2 Finland-Estonia 650 2015 2015 2015 2015 SweLC Sweden-Lithuania 700 2018 2018 2018 2018 Poland Lithuania interconnector 1000 2020 2020 2020 2020 Southwest Link extension SwedenNorway 1200 2015 2015 n/a 2015 NSN Norway-UK 1400 2020 2020 n/a 2025 COBRA Denmark-Netherlands 600 2025 2025 n/a 2025 New transmission Norway-Finland 600 n/a 2024 n/a 2018 Grid extension Sweden-Finland 600 n/a 2023 n/a 2018 Second link between Sweden and Germany 600 n/a 2022 n/a n/a Second NSN Cable Norway-UK 1000 n/a 2026 n/a n/a Norway-Russia Link 600 n/a 2028 n/a n/a Source: Project team analysis R-2010-083 101 Pöyry is a global consulting and engineering firm Pöyry is a global consulting and engineering company dedicated to balanced sustainability. We offer our clients integrated management consulting, total solutions for complex projects and efficient, best-in-class design and supervision. Our in-depth expertise extends to the fields of industry, energy, urban & mobility and water & environment. Pöyry has 7000 experts operating in about 50 countries. Pöyry’s management consultants guide our clients and help them find solutions to complex business challenges. Over the years we have accumulated a vast source of industry-specific knowledge, thought leadership and expertise. We put that knowledge to work for our clients – adding insight and new ways to solve business-specific problems. Pöyry Management Consulting has about 500 consultants in Europe, NorthAmerica and Asia Pacific. Econ Pöyry PöyryManagement Consulting (Norway) AS Schweigaards gate 15B Tel: +47 45 40 50 00 0191 Oslo Fax: +47 22 42 00 40 Norway E-mail: [email protected] www.econ.no / www.poyry.com Econ Pöyry is the Norwegian part of Pöyry Management Consulting, with offices in Oslo and Stavanger. We offer insight and understanding into the complex interaction between markets, technology and policy. For more than 20 years we have guided informed decision making across business, organizations and the public sector. We offer three integrated types of services and ways of working: Market analysis, Market design, and Strategy and business consulting. Our three core competence areas are Energy, Economics, and Environment and climate.


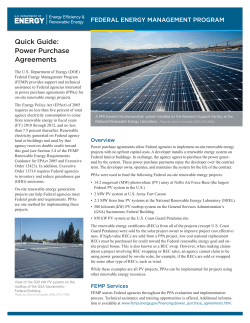


© Copyright 2026