
DEVELOPMENT OF COMPETITIVE GAS TRADING IN CONTINENTAL EUROPE in European gas markets?
INTERNATIONAL ENERGY AGENCY
AGENCE INTERNATIONALE DE L’ENERGIE
DEVELOPMENT OF COMPETITIVE
GAS TRADING IN CONTINENTAL EUROPE
How to achieve workable competition
in European gas markets?
IEA INFORMATION PAPER
IAN CRONSHAW, JACOB MARSTRAND,
MARGARITA PIROVSKA, DANIEL SIMMONS AND JOOST WEMPE
INTERNATIONAL ENERGY AGENCY
© OECD/IEA, May 2008
INTERNATIONAL ENERGY AGENCY
The International Energy Agency (IEA) is an autonomous body which was established in
November 1974 within the framework of the Organisation for Economic Co-operation and
Development (OECD) to implement an international energy programme.
It carries out a comprehensive programme of energy co-operation among twenty-seven of
the OECD thirty member countries. The basic aims of the IEA are:
n To maintain and improve systems for coping with oil supply disruptions.
nTo promote rational energy policies in a global context through co-operative relations
with non-member countries, industry and international organisations.
nTo operate a permanent information system on the international oil market.
nTo improve the world’s energy supply and demand structure by developing alternative
energy sources and increasing the efficiency of energy use.
nTo promote international collaboration on energy technology.
nTo assist in the integration of environmental and energy policies.
The IEA member countries are: Australia, Austria, Belgium, Canada, Czech Republic,
Denmark, Finland, France, Germany, Greece, Hungary, Ireland, Italy, Japan, Republic of Korea,
Luxembourg, Netherlands, New Zealand, Norway, Portugal, Slovak Republic, Spain, Sweden,
Switzerland, Turkey, United Kingdom and United States. Poland is expected to become a
member in 2008. The European Commission also participates in the work of the IEA.
ORGANISATION FOR ECONOMIC CO-OPERATION AND DEVELOPMENT
The OECD is a unique forum where the governments of thirty democracies work together
to address the economic, social and environmental challenges of globalisation. The OECD
is also at the forefront of efforts to understand and to help governments respond to new
developments and concerns, such as corporate governance, the information economy
and the challenges of an ageing population. The Organisation provides a setting where
governments can compare policy experiences, seek answers to common problems, identify
good practice and work to co-ordinate domestic and international policies.
The OECD member countries are: Australia, Austria, Belgium, Canada, Czech Republic,
Denmark, Finland, France, Germany, Greece, Hungary, Iceland, Ireland, Italy, Japan, Republic
of Korea, Luxembourg, Mexico, Netherlands, New Zealand, Norway, Poland, Portugal, Slovak
Republic, Spain, Sweden, Switzerland, Turkey, United Kingdom and United States.
The European Commission takes part in the work of the OECD.
© OECD/IEA, 2008
International Energy Agency (IEA),
Head of Communication and Information Office,
9 rue de la Fédération, 75739 Paris Cedex 15, France.
Please note that this publication is subject
to specific restrictions that limit its use and distribution.
The terms and conditions are available online at
http://www.iea.org/Textbase/about/copyright.asp
Foreword
Natural gas markets are globalising, and the trends affecting one region may have consequences beyond
the geographical span of the physical market. Development of competitive trading in continental Europe
since the beginning of the liberalisation process in the late 1990s has been a complex process and must take
into account the differences compared to other regional gas markets such as North America.
Meeting the efficiency, transparency and security challenges in European gas markets in the present
context is a high-priority task for policy makers in European governments and the European Commission.
At a time when a third package of legislative proposals is being negotiated, rising prices, tight supply
prospects and the necessity to curb greenhouse gas emissions impact heavily on energy policies in
consuming countries.
In this challenging context, the IEA has studied the history, the fundamentals and the possible evolution of
liberalised natural gas markets in Europe, in order to outline the major issues that should be addressed
while leading reforms further on the path to workable competition.
This book examines the history of major gas markets’ development in OECD Europe, and explores the
expansion of trading throughout the setting of different hubs on the European markets. However, proper
competition does not yet exist at a European level. An analysis of the North American market allows some
lessons to be drawn to identify the fundamentals for workable competition in natural gas. European
markets require particular efforts on enforcing more transparency throughout the value chain, as well as a
more investor-friendly regulation and investment in supply and flexibility infrastructure.
Competitive trading based on transparent, non-discriminatory rules in a flexible and integrated European
gas market will lead to more efficiency and market resilience, enabling markets to absorb large incremental
volumes that might come from new pipeline supply projects, or in extreme cases, to manage potential
supply interruptions. Thus competitive markets can afford more security for both customers and suppliers
in the long term. At a time of sharply rising energy prices and increasing concern over energy security, the
benefits of these reforms are substantial. They should be pursued vigorously, and supported by all EU
members, and indeed all energy users.
Nobuo Tanaka
Executive Director
Acknowledgements
This book was coordinated and prepared by the Energy Diversification Division of the International Energy
Agency. The book was designed and managed by Ian Cronshaw and the lead authors were Jacob
Marstrand, Margarita Pirovska, Daniel Simmons and Joost Wempe.
Significant contributions were made from right across the IEA, including Andreas Biermann, Pieter Boot,
Rebecca Gaghen, Hiroshi Hashimoto, Ellina Levina, Kieran McNamara, Elena Merle-Beral, Isabel Murray,
Olivier Rech, Susan Schwarte, James Simpson, Ulrik Stridbaek and Aad Van Bohemen.
Helpful reviews were provided by Jacques de Jong, Richard Marriott and Mark Van Stiphout.
Muriel Custodio, Virginie Buschini and Corinne Hayworth ensured the timely publication of the book.
Bertrand Sadin provided essential help in the book’s preparation for printing. Catherine Foureix assisted
with valuable bibliographical research.
The book greatly benefited from input and overview from Bentek Energy, the European Commission,
Eustream, Fluxys, GasTerra, Gaz de France, Heren, RWE-Transgasnet, and the Governments of the United
Kingdom, Belgium and the Netherlands.
However, the final responsibility for the book lies with the IEA.
The book was made possible by voluntary contributions from the Governments of Belgium, the
Netherlands and the United Kingdom, plus valuable assistance from DONG Energy and Gaz de France.
This paper reflects the views of the IEA Secretariat and may or may not reflect the views of the individual IEA member countries.
Table of contents
FOREWORD.................................................................................................................................................................. 3 ACKNOWLEDGEMENTS ......................................................................................................................................... 3 TABLE OF CONTENTS .............................................................................................................................................. 4 EXECUTIVE SUMMARY............................................................................................................................................ 7 CHAPTER I – THE PAST. EVOLUTION OF EUROPEAN GAS MARKETS (1960 TO 2008) ....................... 9 I. HISTORY OF EUROPEAN GAS: 1960 – 1998 ................................................................................................. 9 A. FIRST USAGE OF GAS IN EUROPE – START OF DOMESTIC PRODUCTION........................................................... 9 1. France ............................................................................................................................................................... 9 2. Italy ................................................................................................................................................................ 10 3. The Netherlands ............................................................................................................................................. 11 4. United Kingdom ............................................................................................................................................. 11 5. Germany ......................................................................................................................................................... 12 6. Eastern Europe ............................................................................................................................................... 12 B. START OF INTERNATIONAL GAS TRADE – ENERGY DIVERSIFICATION ............................................................... 13 1. 2. 3. 4. 5. 6. Box 1: Long-term contracts in Europe ..............................................................................................................................13 France ............................................................................................................................................................. 14 Fig.1: Primary energy consumption of France (1960-2006) ...........................................................................................14 Italy ................................................................................................................................................................ 14 Fig.2: Primary energy consumption of Italy (1960-2006) ...............................................................................................15 The Netherlands ............................................................................................................................................. 15 Fig.3: Primary energy consumption of the Netherlands (1960-2006) ...........................................................................16 United Kingdom ............................................................................................................................................. 16 Fig.4: Primary energy consumption in the United Kingdom (1960-2006) ...................................................................17 Germany ......................................................................................................................................................... 17 Fig.5: Primary energy consumption in Germany (1960-2006) .......................................................................................18 Eastern Europe ............................................................................................................................................... 18 Box 2: Russia –Europe transit pipelines ...........................................................................................................................19 Map 1: Main transit lines in Eastern Europe ...................................................................................................................19 C. LOW OIL PRICES – PATH TO LIBERALISATION – THE ERA OF CHEAP ENERGY ............................................... 20 1. France ................................................................................................................................................................. 20 2. Italy ................................................................................................................................................................ 20 3. The Netherlands ............................................................................................................................................. 20 4. United Kingdom ............................................................................................................................................. 21 5. Germany ......................................................................................................................................................... 21 6. Eastern Europe ............................................................................................................................................... 22 Fig.6: Gas consumption in Eastern Europe during transition .......................................................................................22 Box 3: Eastern Europe in 1998 on the eve of first Gas Directive and EU enlargement ..............................................23 II. EU LIBERALISATION PUSH AND THE INDUSTRY’S RESPONSE ................................................. 24 A. 1998-2008: TEN YEARS OF CONTINUED REGULATORY CHANGE.................................................................... 24 1. 1998: Liberalisation “à la carte” ..................................................................................................................... 24 2. 2003: Acceleration under the Lisbon agenda .................................................................................................. 25 3. 2003-2006: “More needs to be done” ............................................................................................................. 26 4. 2007: Towards a third Directive..................................................................................................................... 27 5. Fig.7: Chronology of EU liberalisation (1998-2008) ........................................................................................................28 Critique........................................................................................................................................................... 29 B. THE INDUSTRIAL AND NATIONAL RESPONSE ................................................................................................... 29 1. The industry’s response to the EU regulatory revolution .............................................................................. 29 2. Fig.8: Market value of major European gas companies .................................................................................................31 National reactions to the liberalisation process .............................................................................................. 32 Box 4: The Energy Charter .................................................................................................................................................35 CHAPTER II – THE PRESENT. TENSIONS IN A HYBRID MARKET........................................................... 36 I. THE MANAGED MARKETS – GROWING UNCERTAINTIES AND SLOWING INVESTMENTS
36 A. CURRENT ISSUES IN EUROPEAN GAS MARKETS – INVESTMENT AND SECURITY............................................ 36 1. 2. 3. Old industrial model unsuitable for new industry challenges ....................................................................... 36 Fig.9: Overview of import dependency ...........................................................................................................................37 Fig.10: Gas demand and import dependency projections (reference and alternative) for OECD Europe to 2030 .38 Investment mechanisms that delivered in the managed markets.................................................................... 38 What are the barriers to new investment? ..................................................................................................... 39 Fig.11: Investment projections to 2030 (OECD Europe) .................................................................................................39 Box 5: The upstream position – the example of Russia ..................................................................................................40 B. TRANSITION TOWARDS TRADED MARKETS IN EUROPE ..................................................................................... 41 1. Oil indexation vs. hub pricing........................................................................................................................ 41 2. Sharing flexibility down the value chain ........................................................................................................ 42 3. Increased volatility? ....................................................................................................................................... 43 Fig.12: Oil indexed price vs. NBP Day-ahead .................................................................................................................44 Fig.13: Oil indexed price vs. yearly averaged NBP Day-ahead price...........................................................................44 4. Development of derivatives markets ............................................................................................................... 45 II. CURRENT STATUS OF THE EUROPEAN GAS TRADING HUBS .......................................................... 46 A. CONCEPT OF A GAS TRADING HUB ................................................................................................................ 46 B. DEVELOPMENT AND ACCESS CONDITIONS TO THE EUROPEAN GAS HUBS ....................................................... 47 1. British hub ...................................................................................................................................................... 47 2. 3. 4. 5. 6. 7. 8. Fig.14: Entry capacity price at Easington .........................................................................................................................47 Belgian hub ..................................................................................................................................................... 48 Dutch hub....................................................................................................................................................... 48 German hubs .................................................................................................................................................. 49 French hubs .................................................................................................................................................... 49 Italian hub ...................................................................................................................................................... 50 Austrian hubs ................................................................................................................................................. 50 Fig.15: Volumes traded at European hubs .......................................................................................................................51 Russia’s traded market ................................................................................................................................... 51 Fig.16: Evolution between TTF and ETP month-ahead prices ......................................................................................52 C. 1. 2. 3. 4. 5. 6. OTHER PROPERTIES OF EUROPEAN HUBS ...................................................................................................... 53 Geographical span and capacity constraints .................................................................................................. 53 Fig.17: Map of Zeebrugge area ..........................................................................................................................................53 Balancing regimes .......................................................................................................................................... 54 Box 6: Cash-out balancing mechanism in the United Kingdom ...................................................................................55 Storage services .............................................................................................................................................. 55 Preferred framework contracts / Master trading agreements ......................................................................... 57 Trading platforms ........................................................................................................................................... 58 Transparency .................................................................................................................................................. 58 Fig.18: Difference between the close day-ahead TTF and the LEBA day-ahead index..............................................59 Table 1: Comparing trading platforms .............................................................................................................................60 CHAPTER III – THE CRYSTAL BALL – WHAT COULD THE EUROPEAN GAS MARKET LOOK
LIKE?............................................................................................................................................................................. 61 I. THE NORTH AMERICAN EXAMPLE OF A COMPETITIVE GAS MARKET ..................................... 61 A. THE PROCESS OF DEREGULATION IN THE IEA NORTH AMERICAN MARKETS .............................................. 61 1. Overview of the IEA North American gas market ......................................................................................... 61 2. The deregulation of the North American gas market ..................................................................................... 61 3. The present regulation authorities.................................................................................................................. 63 4. Box 7: North American federal regulators .......................................................................................................................63 The role of hubs............................................................................................................................................... 63 Map 2: US natural gas spot prices at major trading hubs, 2006 ($/MBtu) ..................................................................64 Box 8: North American hubs: Henry Hub and NIT .......................................................................................................65 B. THE PHYSICAL MARKET / THE VALUE CHAIN ................................................................................................... 66 1. Upstream: role of producers............................................................................................................................ 66 2. New midstream players .................................................................................................................................. 66 3. A varying transport structure........................................................................................................................ 67 4. Storage as a flexibility tool.............................................................................................................................. 67 5. Box 9: Aftermath of hurricanes Katrina & Rita: dealing with a crisis ..........................................................................68 Fig.19: High prices cause demand reduction in US industry ........................................................................................68 Impacts on the downstream segment.............................................................................................................. 68 Box 10: Fertiliser producers in the competitive gas market...........................................................................................69 Fig.20: US and Canadian electricity generation mix (2006) ...........................................................................................70 C. CASE STUDY - ROCKIES EXPRESS PIPELINE. INVESTMENT IN A LIBERALISED MARKET ................................. 71 Map 3: Overview of Rockies Express Pipeline Project ...................................................................................................71 II. THE WORKABLE COMPETITION SCENARIO FOR EUROPE .......................................................... 74 A. THE EUROPEAN MARKET FOR NATURAL GAS ................................................................................................ 74 1. The European market in a globalising context ............................................................................................... 74 2. Prerequisites for functioning competitive gas markets in Europe .................................................................. 75 3. Lessons learned from North America ............................................................................................................. 76 B. WHAT THE EUROPEAN MARKET COULD LOOK LIKE IN THE FUTURE ................................................................ 77 1. Market fundamentals ..................................................................................................................................... 77 2. Prices and market power ................................................................................................................................ 77 3. Information and data collection ...................................................................................................................... 78 4. Companies ...................................................................................................................................................... 79 5. Producer interests........................................................................................................................................... 79 6. Consumer protection ...................................................................................................................................... 80 7. Infrastructure and investment ....................................................................................................................... 80 Box 11: How could the European market work in 10 years time if competitive trading develops? ........................81 Map 4: Possible future market organisation ....................................................................................................................82 CHAPTER IV – IEA PROPOSALS FOR THE EUROPEAN GAS MARKET .................................................. 83 I. NECESSARY TRANSPARENCY MEASURES ............................................................................................. 83 A. PRODUCTION.................................................................................................................................................. 83 1. Economic reserves........................................................................................................................................... 83 2. Production rates ............................................................................................................................................. 84 3. Planned production profile ............................................................................................................................. 84 B. CONSUMPTION ................................................................................................................................................... 84 1. Historical consumption .................................................................................................................................. 84 2. Consumption forecasts ................................................................................................................................... 84 C. INFRASTRUCTURE ........................................................................................................................................... 84 1. Capacities and historical flow data ................................................................................................................. 84 2. Inventory and storage levels ........................................................................................................................... 85 3. Future capacity availability ............................................................................................................................ 85 4. Short-term balancing ...................................................................................................................................... 85 5. Commercial transparency............................................................................................................................... 85 II. PROPOSALS TO ENHANCE INVESTMENTS ....................................................................................... 86 A. REGULATORY PREDICTABILITY AND STABILITY ............................................................................................. 86 B. REGULATED INVESTMENT PLANNING ............................................................................................................... 86 C. CROSS-BORDER INVESTMENT COMMISSION ................................................................................................... 86 D. NEW SUPPLY FOR EUROPE ............................................................................................................................. 87 III. REGULATION ................................................................................................................................................ 88 A. REGULATORY AUTHORITIES ........................................................................................................................... 88 1. European regulatory body .............................................................................................................................. 88 2. Consolidation of regulatory powers for national regulators ........................................................................... 88 B. ENHANCED REGULATORY PREROGATIVES ........................................................................................................ 88 1. Common preferred balancing regime and trading contracts .......................................................................... 88 2. Secondary capacity markets............................................................................................................................ 89 C. GLOBAL OBJECTIVES ....................................................................................................................................... 89 1. Investment-friendly regulation ...................................................................................................................... 89 2. Promotion of European network standard...................................................................................................... 89 GLOSSARY ................................................................................................................................................................. 90 SELECTED BIBLIOGRAPHICAL SOURCES ...................................................................................................... 91 Executive summary
Based on experience from other IEA countries and regions, it is clear that in order to achieve an
efficient and integrated market structure for European gas, governments should focus on several
measures to implement within the legislative and regulatory framework of the industry:
transparency of information, enhanced investment and regulatory convergence.
Transparency, adequacy and relevance of information available to the market are a priority, and
should focus on production levels, flows, infrastructure planning and utilisation and demand levels.
Governments should also propose measures to increase commercial investment – in transmission
and distribution networks, in international interconnection as well as in flexibility tools. Promotion
of an interlinked and transparent internal network within Europe should trigger upstream
investment in turn.
Investment-friendly regulatory convergence between European gas markets is the third pillar of the
necessary measures to achieve a functioning integrated market. The regulatory framework should be
designed to enhance investment and not impede it; noting that all infrastructure when mature
“returns” to the free market.
History of European gas markets
Energy diversification was the principal driving force for the dramatic increase in the use of natural
gas in IEA European countries, turning a locally produced fuel into a major international energy
source. After the first oil shock, West-European economies were given new impetus to diversify their
energy mix and substitute away from oil in favour of other sources. For many applications,
particularly in stationary energy use, natural gas was an effective substitute. Although there was
opposition to European dependence on imported natural gas, particularly that from the Soviet
Union, the huge Siberian gas fields were able to provide Europe with a non-OPEC source of energy.
A compromise was agreed whereby Europe would restrict its dependence on Soviet Union to 30%,
and the development of Norway’s Troll field would be promoted as a counterweight to Russian
influence. Soon after, Algeria also became a major supply source for Europe.
Meanwhile, in Eastern Europe, the barter principle “gas for manufactured goods” was promoted,
with the USSR becoming the region’s energy supplier. The immensity of the Soviet reserves matched
well with the East-European countries’ heavy industries. Gas, as energy in general, was considered
as a central tool of economic policy, and was sold for a symbolic price in many of the countries that
are now European Union member states.
National governments became aware that they would have to support the growth of the natural gas
industry, in order to achieve their national energy policy objectives. Gas systems in general - and
international gas pipelines in particular – required significantly larger investments than their
counterparts in the oil industry. The industry required long-term commitments from consumers in
order to minimise the risk of these investments. For example, the Dutch pioneered a type of longterm commitment which involved granting one company an exclusive right to market gas in the
country. Long-term contracts were put in place to match the lifetime of investments, with minimum
take-or-pay obligations on customers to guarantee cashflow for the financiers. With only weak
downstream competition to keep pressure on consumer prices, the price of gas was linked to oil, to
ensure its competitiveness.
The market reform process
The aim to build a single market for gas and electricity is a principle embedded in the creation of the
European Union – the EC Treaty mandates the achievement of a common market including energy.
In 1996, the EU embarked on a process aimed at reforming first electricity, then in parallel, starting in
1998, gas markets. Making the energy sector in Europe competitive and more efficient was viewed as
part of the response to growing concerns on the competitiveness of European industries in
globalising markets. Introducing competition in the gas sector was aimed particularly at creating a
more appropriate competitive framework, notably more gas-to-gas competition, thus increasing
7
economic efficiency and lowering costs for final consumers in markets frequently monopoly
dominated. This process has advanced over the last decade with competitiveness being
supplemented by concerns on security and environmental performance of the energy sector.
Although not specifically mentioned at the time, it is clear from experience in IEA member countries
that a single workable gas market delivers resilience in the event of supply disruptions from any
cause, thus increasing gas security.
By 2008, key goals remain to be achieved. Europe remains in a transition towards truly competitive
markets. The outcome and the conclusions of this process are a complex set of proposals, some of
which are binding (industry structure). Other proposed measures are based on non-binding
encouragement (energy efficiency) or left to the initiative of member states (investment, security of
supply, foreign relations).
Generally, in continental Europe, real reform progress has been observed in markets under strong
and independent regulatory authority. Another trend visible in some countries (in Western and
Eastern Europe) is the separation of national networks from private sector activities like supply or
sales; this unbundling happened in the Netherlands, Poland, Romania, and Hungary before the EU
proposal of full ownership unbundling. These decisions were based on a national strategic vision or
on business model decisions such as in the Netherlands, where ownership had to be cleared between
the Dutch state and two historical private energy players, Shell and ExxonMobil. In other countries, a
similar logic was used to justify the preservation of an integrated model (France, Germany, Czech
and Slovak Republics, Bulgaria, Baltic States).
The future evolution of European gas markets
While demand continues to grow, domestic supply has stagnated and Europe is on course to
increase its import dependency. A huge amount of upstream and infrastructure investment is
needed to respond to this import challenge. Gas imports will increasingly come from LNG, priced on
a global market basis, influenced by North American and Asian prices, and hence the circumstances
in those markets. New large-scale import pipelines will be needed, crossing multiple national
frontiers within and outside Europe. But the present industrial and regulatory conditions are
struggling to deliver this. Europe is therefore under increasing risk of underinvestment, which could
lead to supply and market consequences if not addressed.
After the 2005-2006 supply crises, energy policy has progressively focused on security of supply
issues. There are different explanations of the meaning of “security of supply”, but clearly neither
“security” nor “supply” can occur unless there is sufficient investment in the gas value chain. In the
absence of the right conditions for such investment, it will be very challenging to bring increasing
supplies of long-distance gas imports to the market and ensure reliable, affordable supply in the long
term. Competitive gas markets in other IEA member countries such as the US, Canada and the UK
have been shown to deliver investment, but through radically different means than in the utility
markets in continental Europe before the liberalisation process in the 1990s.
From the perspective of some companies, governments and customers, it is quite understandable
that many European energy companies have moved defensively and tended to resist change to their
traditional business model. Instead they have played a waiting game, expanding geographically to
the East and West, as other countries’ companies have been privatised. In addition, the presence of
giant upstream state-owned players, with significant supply market share and not necessarily subject
to the same regulatory or market reforms as European companies, is a major issue for development
of competition throughout the value chain in European markets.
In the current transition period between administered and competitive markets, the consumer has
yet to see the security and price benefits of competition. Its development has suffered from
regulatory uncertainty downstream, while geopolitical and economic upstream risks were growing.
Europe has remained a set of national gas markets, rather than a single market, and is still dominated
by incumbents. There is pressing need to complete market reforms to stimulate a new round of much
needed investment at lowest cost, through a new business model based on efficient, affordable, panEuropean competition, while securing external relations with producing countries and affordable
long-term supplies for the consumers.
8
Chapter I – The Past. Evolution of European gas markets
(1960 to 2008)
I. History of European gas: 1960 – 1998
The first part of this chapter is intended to set the scene for the liberalisation process in Europe by
giving an overview of the evolution of the European gas industry. The focus of the chapter is on five
countries in Western Europe, which account for roughly 70% of European gas consumption (United
Kingdom, Germany, Italy, France and the Netherlands) and on Eastern Europe1 as a whole, because
of its importance as main transit region and the differences in its history.
The development of the gas industry in Europe is divided into three time-frames charting the growth
of indigenous gas industries and the major companies which they spawned.
o
The first period starts with the use of manufactured gas and ends with the start of domestic
gas production and how it replaced manufactured gas in each country.
o
The second period looks at the developments in the time-frame between the first
international gas trades and the high oil prices during the 1970s and their influence on the
energy policies of the different countries.
o
The third period starts in 1986, characterised by low oil prices, and ends with the start of the
liberalisation of gas markets in 1998.
The process of market liberalisation itself is covered in the next part of the chapter: EU liberalisation
plan and the industry response.
A. First usage of gas in Europe – Start of domestic production
In the early 19th century, before natural gas was found in Europe, manufactured gas, mostly
produced from coal, was used, mainly for lighting. Starting from the early 20th century,
manufactured gas has also been used for cooking. The companies producing manufactured gas were
private or owned by the municipality and the market was unregulated. Manufactured gas is often
referred to as town gas, which clarifies the fact that it was produced and could be used only locally.
This changed in the beginning of the 20th century when the first long-distance pipelines were built to
distribute coke-gas, an industrial by-product, to residential users. In the 20th century electricity and
petroleum took over many roles formerly filled by manufactured gas, but with the introduction of
natural gas, manufactured gas was phased out completely.
The West-European countries studied in this book already had their own often modest gas
production, before international trade started. The United Kingdom is an exception; it started
importing liquefied natural gas (LNG) in the 1950s while domestic gas production only started in the
1960s. In Italy and France gas was first discovered at the end of the 1930s, while in the Netherlands
and Germany first production was in the 1950s.
1. France
The French gas industry first developed in the 19th century with the production of gas from coal. In
1946, the gas industry was nationalised amidst post-war economic reforms. At the time, there was no
national gas network and many gas manufacturing sites were not economically viable; the
nationalisation was viewed as a means to revive and develop this stagnating sector. Nationalisation
covered 94% of all the town gas production, transportation and distribution assets in France,
1
East-European countries allied to the URSS before 1989 – Bulgaria, Romania, former Czechoslovakia and Yugoslavia,
Hungary, Poland.
9
transferred to a newly created state company – Gaz de France (GdF). In the beginning GdF was
joined to its sister company Electricité de France (EdF), but in 1949 Gaz de France became an
independent state-owned “industrial and commercial institution” (EPIC).
Natural gas was discovered at Saint Marcet in the south of France in 1939, which in 1948 was
supplying one eighth of all gas sales in France. However, production of natural gas (rather than
manufactured gas) had been excluded from the decree of nationalization in 1946, natural gas being
controlled by the oil industry at the time. Nevertheless, GdF received the sole rights of natural gas
distribution in France, with the exception of 17 non-nationalized distribution companies, which had
a majority public shareholding.
In the 1950s, a rationalisation of the production segment and the building of a national gas transport
system spurred the renaissance of the French gas industry. The National Society of Oil in Aquitaine
(SNPA – which would later become known as Elf Aquitaine, now part of Total) discovered in 1951 a
major gas field in Lacq, southern France, which it subsequently developed. Transportation of gas in
northern and eastern France was done by GdF, in south-western France by Société Nationale de Gaz
du Sud Ouest (SNGSO) (owned by Elf and GdF) and in central France by Compagnie Française du
Méthane (CFM) (owned by GdF, Elf and Total). This structure would remain in place until 2004
when CFM and GSO were merged with respectively the GdF and Total networks.
2. Italy
The first step towards domestic natural gas production was the creation of the state-owned refinery
company Agenzia Generale Italiana Petroli (AGIP) in 1926 as a counterbalance to the major oil
companies Standard Oil of New Jersey (later Exxon) and Shell, which had come to dominate the
Italian market. During the second half of the 1930s the Italian government exerted considerable
pressure on AGIP for a rapid exploitation of national mineral resources to achieve self-sufficiency.
Backed by government financing, AGIP focused its energies on exploration in Italy, primarily in the
Po Valley (in the north). When gas was found there in 1938, AGIP became the first natural gas
producer in Italy. In 1939 a pipeline was built to Florence. In 1941 the state-owned company Società
Nazionale Metanodotti (SNAM) was created for the purchase, transport and marketing of gas in
Italy. Gas production was driven by rapid industrial development concentrated in the northern
regions. To speed up the use of gas, in 1949 the first Italian gas-fired power station was set up.
Local gas distribution was controlled either by municipal companies or by small firms on the basis of
local concessions granted by municipalities. In distribution and retail sales, a fragmented market
structure allowed the existence of small private firms and municipal undertakings operating as local
natural monopolies. Since its creation, SNAM has gained significant interests in the largest local
distribution companies, but the local distribution market remains fragmented up till the present
time.
After the Second World War, the government decided that AGIP should be liquidated and sold to
private companies. In the liquidation process it became clear that the Caviaga field (discovered in
1944) was a major deposit. Despite the pressure from the various multi-nationals AGIP managed to
halt the liquidation, with the argument that Italy should have a national company which could
defend national interests.
In 1953 Ente Nazionale Idrocarburi (ENI) was created by law to manage all the state-owned energy
companies, including SNAM and AGIP. ENI was given the exclusive right to look for and exploit
hydrocarbon deposits and the exclusive right to build and run gas and oil pipelines in the Po Valley.
Driven by robust economic growth during the 1950s and 1960s and subsequently the high demand
for gas, more gas infrastructure was built connecting the Po Valley with the north of Italy. The high
profits from natural gas funded the search for new fields, the development of pipelines and the
acquisition of new customers. While Italy followed the general European path from coal-based
energy to oil-based, it had an unusually high proportion of natural gas consumption by the end of
the 1960s. The chosen marketing strategy for the natural gas business was that methane was a
10
cheaper and more functional substitute for imported coal for the growing industrial activities in the
north of Italy.
Gas tariffs were set by public authorities (the Inter-ministerial Price Commission), in negotiation
with ENI. Price controls coupled with legal monopoly at the wholesale level led to some cross
subsidies among consumers. In order to extend the gas network to the south of Italy, for example, the
denser consumer base in the north effectively subsidised the south. By spreading most of the
commodity costs over consumers located in the coldest regions of the country, natural gas became
available at competitive prices all over Italy.
3. The Netherlands
In the 1930s a subsidiary of Shell called BPM (Bataafse Petroleum Maatschappij) acquired exclusive
oil and gas exploration rights for the north-eastern part of the Netherlands. In 1947 BPM and
Standard Oil Company of New Jersey (later to become Exxon) established the NAM (Nederlandse
Aardolie Maatschappij), a joint venture for oil and gas exploration and production in the
Netherlands. Natural gas was first found in 1948 and a number of moderately sized fields of oil and
gas were then discovered in the 1950s.
In 1959 NAM discovered a huge gas field in northern Netherlands, in the province of Groningen.
Shell, Esso and the government started negotiations in 1960, with the field size estimated at 60 bcm.
In the following years, the size of the field was re-estimated several times, before the final size was
confirmed at 2,600 bcm 30 years later.
In 1962, three years after the discovery of Groningen, the main principles of the Dutch gas policy
were established. Gasunie - a 50/50 public-private partnership between the government, and Shell
and Exxon - was created in 1963, for the transportation and marketing of Dutch gas. First of all the
“market-value” principle was introduced as the basis on which the gas should be produced and sold.
This meant that the price of gas was linked to the price of the alternative fuels for that customer. So,
consumers would never have to pay more (but also not less) for gas than for competing fuels.
Secondly, production of Dutch gas resources were harmonised with the sales of gas achieved.
Control over the supply of gas was understood to be a government responsibility, while exploitation
and marketing of the gas reserves should be undertaken by the private concession holders.
The main target for Groningen gas was premium markets, such as the replacement of manufactured
gas as well as the chemical, metallurgical and ceramic industries. Groningen gas was sold to those
segments, in order for the government to reap profits as soon as possible. The government was keen
to act quickly as commercial nuclear power – at the time – was making people question if energy
would have anything more than a token value in the future. A transport network was built with
great speed. The municipalities were encouraged to connect as many households as possible through
premiums given by Gasunie. The most densely populated areas were connected first, followed by
rural areas.
4. United Kingdom
In the initial period after the Second World War (1945-1951), the UK domestic energy sector was
nationalized, including the gas sector with the Gas Act 1948. The manufactured gas companies were
divided into twelve Area Gas Boards. A Gas Council was established which had advisory functions
to the government, as well as assisting the Area Boards, though it had no direct powers over them.
The Gas Council was made up of the twelve Area Board Chairmen and had a chairman of its own.
As consumption grew, it became obvious that the gas manufacturing plants could not keep up with
demand. With no discovered sources of natural gas within pipeline distance of the United Kingdom,
Shell proposed a novel method of transporting supercooled gas via tanker. In 1959 the first LNG
cargo came from the Gulf of Mexico and five years later LNG supplies started arriving in bulk from
Algeria. In 1963 a pipeline from Canvey Island near London to Leeds was completed, which enabled
eight regions to be supplied with Algerian gas.
11
Triggered by the onshore gas discoveries in the Netherlands, the United Kingdom also started
surveying the North Sea between the Netherlands and the British islands in 1962. Oil and gas were
soon discovered and production started in 1967 whereupon a national gas grid was built. The
government encouraged the industry to build up the use of natural gas speedily to enable it to
benefit as soon as possible from the advantages of this new indigenous energy source.
The Continental Shelf Act 1964 and the Gas Act 1965 gave monopoly powers to the Gas Council on
both buying and selling. All gas produced in Great Britain had to be sold to the Council and all Area
Boards were supplied by the Council, which negotiated long-term contract prices (averaging 25
years) with North Sea companies and paid them cost-based prices. These prices were low (below
coal-based manufactured gas and LNG).
5. Germany
The big gas industries of Germany also have their origin in the days when gas was a co-product of
coke manufacture. Massive regional concentrations of coal and steel production in the Ruhr area
provided the basis for an urban gas supply from the first half of the 19th century. The dominant
company in the sector was Ruhrgas, established in 1926 to sell town gas based on coke-oven gas in
the Ruhr and Rhine basins, and ultimately expanded to become a supra-regional supplier. Ruhrgas’
earliest shareholders were steel producers and coal companies.
Government initiative transformed the coke- and steel-based regional into more suitable vehicles for
supplying gas on a national level. In Germany a kind of private-sector nationalisation was
implemented before the Second World War by the establishment of the so-called
Demarkationsvertrag: agreements to divide markets on a territorial basis. If a community chose to
license a private provider, it issued an exclusive concession, usually for 20-25 years. The
municipalities generated income from the utilities to subsidise other municipal services. The
prevalent opinion in Germany was that energy issues were better left to the market and to economic
actors than to the public sector.
Small amounts of natural gas were found in the 1950s, but German natural gas consumption really
took off after the discovery of the Groningen field over the border in the Netherlands. Large volumes
of gas were imported from the field, starting in the mid 1960s. Also, as in the United Kingdom, the
exploration of German territory adjacent to Groningen intensified and significant discoveries were
made. The international oil companies started to play an important role in Germany; between them,
Shell and Esso (Exxon) gained a 50% share in Ruhrgas, in order to financially strengthen it into a
regional pipeline company. Later also BP and Texaco moved into the German gas market.
The German gas industry was (and still is) divided into three types of companies:
o
Upstream companies, mainly owned by international oil companies.
o
Sales and transmission, consisting of companies with production interest, importers and
companies purely acting as transporters of gas. They were partly owned by the producers
(Shell, Exxon etc) and partly by the consumers (coal and steel companies). In addition, some
of the companies are publicly owned.
o
Utilities, mostly owned by the various municipalities in conjunction with the sales and
transmission companies (not dissimilar to the Dutch model for municipalities). The
municipalities have very heterogeneous interests regarding energy sources, prices, taxation
and distribution.
6. Eastern Europe
After the Second World War, many countries from Eastern Europe became linked with the USSR and
gradually reduced economic, social and political relationships with Western Europe. This new EastEuropean order was structured by the foundation in 1949 by the USSR of the Council for Mutual
Economic Assistance (CMEA), in response to the US-backed Marshall Plan for Western Europe and
the creation of the European Community.
12
East-European states developed their national industries on centrally planned economic basis within
the Socialist bloc they formed. Initially based on indigenous resources like coal, their economies were
modified to run on hydrocarbon imports from the USSR, the major source of significant oil and gas
supplies in the CMEA zone.
The Soviet gas industry was developed in the 1940s in the oil-rich region of the Volga, and became
quickly a centrepiece in the economic strategy of the USSR. The Ministry of Gas, which would
become later Gazprom, was created in 1956, to handle this rapidly developing industry.
B. Start of international gas trade – Energy diversification
During the 1960s and 1970s the demand for natural gas in France, Italy and Germany started to
outpace indigenous production and imports were needed. The United Kingdom had enough
production for domestic consumption and remained a gas island (it only started exporting in the late
1990s after the construction of the Interconnector2). The Netherlands, after the discovery of
Groningen, started exporting on a large scale. This period of time is therefore characterised by the
large transportation network which was built in Europe in order to trade gas internationally, first
from the Netherlands, then from Russia and Norway and most recently the United Kingdom.
For international trading – particularly from the Netherlands to Italy - an international network of
high-pressure pipelines in Europe was needed. These were funded via the netback principal – the
price of gas in the destination country remained linked to competing fuels, and the producer
received those revenues less transportation costs (see box 1). In the 1960s and early 1970s, Gasunie of
the Netherlands became the dominant party within the European international gas trade.
Box 1: Long-term contracts in Europe
International gas exports required significant investments in the upstream production and especially the
transmission system. Export sales were based on long-term contracts in order to minimise the risk of these
investments. The Dutch started with this type of contract, but they would become so popular that Russian and
Norwegian gas would also be sold on the basis of similar contracts. The contracts had the following structure:
- Long-term: 20-30 years contracts, matching the duration of investments.
- Take-or-pay: the buyer has to pay for a certain amount of gas regardless of whether he uses it or not.
- Market-value principle: price of gas was linked to the price of the alternative fuels for that customer. This was
added to the long-term contracts after the first oil crisis, although it was already used in the Dutch domestic
market.
- Netback price: transportation costs were subtracted from the price the producer received. Destination clauses
in some supply contracts assured that gas would flow to the destined market. Hence, a local market-value
approach could be maintained.
- Price review clauses (typically 3-year reviews): were introduced in the mid 1980s to ensure that the contract
price always represented the market value.
- Many aspects of these contracts mirrored the long-term contracts being written to support the developing LNG
trade at roughly the same time.
After the first oil shock, Western economies were given new impetus to diversify their energy mix.
Although the United States in particular opposed European dependence on Soviet Union gas, the
huge Siberian gas fields were able to provide Europe with a non-OPEC source of energy. A
compromise was agreed whereby the Europeans would restrict their dependence on Soviet Union to
30%, and the development of Norway’s Troll field would be promoted as a counterweight to Russian
influence.
The first Soviet pipeline to be finished was Brotherhood in 1967, connecting gas fields in Ukraine to
Czechoslovakia, but this was not initially intended for exporting to Europe on large scale. At the
2 Some fields lying across borders or on the UK side of the North Sea were produced before 1990 and sent to the continent,
marking the technical start of exports from the UK.
13
same time, Russia started producing from the Siberian fields. The Urengoi field was opened in 1978;
to export gas to Europe new export routes were created, starting with the Transgas pipeline network
in 1974. The first Norwegian deliveries from the Ekofisk field started in 1973 and in 1986; deliveries
were made from Troll. In 1983 the Transmed pipeline came on stream connecting Algeria with Italy.
1. France
The discovery of Lacq wasn’t followed by other major discoveries in France; however, the
development of natural gas fields in Europe spurred the negotiation of long-term supply contracts to
ensure that sufficient supply would meet growing gas demand in France. Natural gas supply
contracts were signed with Algeria and with the Netherlands in the 1960s, and later in the 1970s and
the 1980s, with the USSR and Norway.
Fig.1: Primary energy consumption of France (1960-2006)
100%
90%
80%
n
o
ti
p
m
u
s
n
o
c
yg
r
e
n
e
yr
a
im
r
p
la
t
o
t
f
o
%
70%
60%
Renewables
Nuclear
Oil
Gas
Coal
50%
40%
30%
20%
10%
0%
Source: IEA
Gaz de France positioned itself at this time as a major marketer in the French gas market, shifting
from locally produced town gas to imported natural gas. Indeed, the production of gas from coal and
oil products was progressively diminishing; this trend being accentuated after the first oil shock.
These events helped increase the role of natural gas in the French energy balance (although nuclear
provided the major means of diversification from imported oil), and increased the status of Gaz de
France as the primary natural gas wholesaler in France. Gaz de France’s role was enhanced by the
building of the first big transit pipelines in Europe in consortium with other European and external
players.
2. Italy
Italian economic growth in the 1950s and 1960s was mainly powered by oil; in 1973 the share of oil in
primary energy consumption reached 79%. After the first oil crisis, natural gas was identified as an
alternative source of energy. An increasing share of oil consumption was substituted by natural gas,
mainly in the household/service sector for space-heating, but also in industry and power generation.
In absolute terms, oil consumption has remained relatively static since 1970, but its primary energy
share has decreased significantly, steadily replaced in particular by natural gas.
SNAM started importing gas on a large scale in the 1970s. In 1971 Italy finished its first (and still
only) LNG regasification plant Panigaglia situated near Genoa. To bring Dutch gas to Italy the TENP
(owned by Ruhrgas and SNAM) and Transitgas (owned by Swissgas, SNAM and Ruhrgas) pipelines
14
were built and the TAG pipeline (owned by ENI and OMV) crossing Austria was constructed to
import Russian gas. In 1977 an agreement was concluded between SNAM and Sonatrach for gas
delivery starting in 1981 through the Transmed pipeline between Tunisia and Italy, which was
completed in 1983. Italy thus pioneered deep underwater gas pipeline transport.
Fig.2: Primary energy consumption of Italy (1960-2006)
100%
90%
n
o
ti
p
m
u
s
n
o
c
yg
r
e
n
e
yr
a
im
r
p
alt
o
t
f
o
%
80%
70%
60%
Renewables
Nuclear
Oil
Gas
Coal
50%
40%
30%
20%
10%
0%
Source: IEA
3. The Netherlands
During the mid 1960s, when the actual size of the Groningen field became clearer, the policy of
reserving gas use to premium markets became less relevant. In particular, it was feared that it might
be impossible to sell gas after the year 2000, because it was expected that low-cost nuclear energy
would by then have taken much of the energy supply. As a result, even the power sector, which had
previously been prevented, started to use gas.
The first oil crisis led to another change in policy. The level of reliance on oil for energy was made
clear by this crisis, and two white papers were produced in 1974 and 1979. Energy saving was cited
as a means of reducing the exposure to oil, as was reducing the use of oil and gas by switching to
nuclear energy and coal in electricity generation. The Dutch gas reserves, and particularly
Groningen, gained in international importance. Three approaches were suggested to reduce its
depletion rate.
Firstly, national gas sales were limited through a revised gas pricing and sales policy. Within the
Netherlands the government imposed a reduction of gas use in the power sector. Domestic prices
had been linked to oil products, but with a limited ability to follow those prices. When oil prices rose,
the price for gas was only allowed to rise by a reduced percentage. To achieve oil-parity, a law was
passed in 1974 that enabled the government to intervene in the price negotiations between Gasunie
and the distribution companies and to establish minimum prices for supply by Gasunie.
Regarding the export of gas, Gasunie told its customers that it was planning to reduce its exports;
existing contracts would be honoured, but there would not be new additional contracts. Because of
the large increase in oil prices, especially after the second oil shock, export prices were below market
value. Substantial price increases in the renegotiations of the export contracts were sought.
15
Secondly, the small field policy was implemented. The exploration and production from other fields
in Dutch territory were to be encouraged at the expense of production from Groningen. Gasunie was
obliged to buy gas from any producer of a “small” gas field at a high load factor at a reasonable price
related to the market value of gas and producers were obliged to sell the gas to Gasunie. Since 1996,
the producers’ obligation changed into an option, Gasunie (and since 2006 GasTerra), however, still
has the obligation to offer a market value price for all Dutch small fields.
And thirdly, gas imports were planned. First gas imports from the Ekofisk field in the Norwegian
North Sea arrived in 1977. At that moment, gas prices were lower in the Netherlands than in
neighbouring countries. In order to import gas, Gasunie had to be able to get a consumer price
consistent with the import price, which resulted in a price increase in the domestic market.
Fig.3: Primary energy consumption of the Netherlands (1960-2006)
100%
90%
n
o
ti
p
m
u
s
n
o
c
yg
r
e
n
e
yr
a
im
r
p
la
t
o
t
f
o
%
80%
70%
60%
Renewables
Nuclear
Oil
Gas
Coal
50%
40%
30%
20%
10%
0%
Source: IEA
4. United Kingdom
After the United Kingdom started producing significant quantities of gas in the early 1970s, imports
were no longer needed. With the Gas Act of 1972 the Gas Council was abolished and replaced by the
fully integrated British Gas Corporation (BGC), which was to continue the monopoly activities. BGC
set the gas purchase price from producers, the sales price to consumers, the supply/demand balance
(assisted by ‘take-or-pay’ arrangements and interruptible contracts) and managed all necessary
storage. All gas produced on the United Kingdom Continental Shelf (UKCS) had to be sold to BGC
(apart from that lying close to the maritime borders which could be exported). In the period 19781981, BGC entered long-term take-or-pay contracts with offshore oil and gas companies.
The fact that British gas producers had to sell gas to the BGC was not popular because of the pricing
policy. BGC bought gas from the oil companies on an individual cost-plus basis and sold on the basis
of marginal costs (the most expensive production). The cheaper southern basin gas-only fields were
the first to be produced, after that the more difficult fields were produced, and therefore the
marginal costs rose, as did BGC profits. Nevertheless, gas was still much cheaper than oil, especially
after the oil shocks. As a consequence, gas demand rose and there was a real danger that demand
would exceed supply. The supply problem was solved when BGC contracted gas from the AngloNorwegian “Frigg” field, which was priced on an oil basis, for the first time. The deal aggravated the
pricing disputes because Frigg was bought at a higher price than BGC was paying to its British
suppliers.
16
In order to reduce BGC’s monopsony, the Oil and Gas Act of 1982 permitted gas-producing
companies to supply customers directly and to have access to BGC transmission network. The Act
applied solely to large industrial sales. The Act also removed the obligation of BGC to make an offer
for gas and the producer no longer had the right to appeal to the Department of Energy if an offer
from BGC appeared unreasonable.
Fig.4: Primary energy consumption in the United Kingdom (1960-2006)
100%
90%
% of total primary energy consumption
80%
70%
60%
Renewables
Nuclear
Oil
Gas
Coal
50%
40%
30%
20%
10%
0%
Source: IEA
5. Germany
From the 1970s, with the availability of more imports, the role of gas in Germany gained in
importance and Ruhrgas started to take a dominant role in the west. The network owned and
controlled by Ruhrgas extended from the Ruhr region east and south across the country and became
by far the largest and most strategically located in West Germany. The network encompassed both
the north-south corridor and the east-west passage (of West Germany). Ruhrgas was also well
diversified, with domestic production, Norwegian, Dutch and Russian imports in its portfolio, and
because of this and the size of its network, it was difficult for other companies to buy gas from
anyone else. Examples are Gelsenberg, which tried to buy Norwegian and Russian gas, and
Bayerngas which tried to get Algerian gas. Gelsenberg was outbid by Ruhrgas regarding the
Norwegian gas, and while able to buy the Russian gas, it was unable to transport it to the final
customer and therefore eventually had to sell to Ruhrgas. Bayerngas, after Ruhrgas changed the
prices, tried to obtain Algerian gas, but also had to use the Ruhrgas transport system; in this way
Ruhrgas was able to block that deal. Before the Russians sold gas to Wintershall in the 1990s, the only
company they were dealing with was Ruhrgas because of its dominant position, particularly its
control over the gas pipeline transport system.
The first Russian gas arrived in 1973 and Norwegian gas came in 1977. Fearing excessive dependence
on Russia, in the early 1980s the government set a 30% limit for Soviet gas supplies to West
Germany.
17
Fig.5: Primary energy consumption in Germany (1960-2006)
100%
90%
% of total primary energy consumption
80%
70%
60%
Renewables
Nuclear
Oil
Gas
Coal
50%
40%
30%
20%
10%
0%
Source: IEA
6. Eastern Europe
With the help of East-European states, gas production in Russia expanded to the huge gas deposits in
Siberia. Under the CMEA agreement, on a mutual investment basis, the USSR allies contributed to
the development of the gas reserves and of the required transport infrastructure starting in the 1960s,
and received in exchange long-term gas supply contracts.
The principle of “gas for manufactured goods” was initiated in the Soviet bloc, with the USSR
becoming the region’s major energy exporter, boosted by the immensity of the Siberian reserves, and
East-European countries developing heavy industries fuelled by the barter-exchanged Soviet oil and
gas. Gas, as energy in general, was considered as a central tool of the socialist economic policy, and
was sold for a symbolic price in the whole CMEA bloc.
The first Soviet natural gas arrived in East-European countries at the turn of the 1970s. The European
allies of the USSR had played a major role in the Soviet fuel-switching strategy, accelerating the
importance of natural gas as a major energy resource. Even so, the Siberian gas reserves were much
larger than the CMEA market could absorb.
18
Box 2: Russia –Europe transit pipelines
Despite the Iron Curtain that divided Europe into two hostile parts, the USSR started discussions with some
import-dependent countries in Western Europe, who, having suffered a severe blow with the first oil shock,
were in search of new energy supply to diversify from OPEC oil and satisfy the growing energy demand of their
economies. France, Germany, Austria and Italy were keen, despite geopolitical tensions, to contract with the
USSR.
Brotherhood-Transgas - The first gas deliveries to Czechoslovakia arrived in 1967; the transit line was
prolonged to Austria where it reached Baumgarten in 1967 and France in 1984. From less than 1 bcm in 1969,
this transit system shipped around 80 bcm in its latest stage, thirty years after.
Southern corridor - In parallel to the Brotherhood system, another transit line was built to the south to Romania
and Bulgaria in 1974, and was extended to Turkey in 1987 and Greece in 1988. The southern branch was initially
planned, like Brotherhood, under the CMEA agreement on a mutual investment basis.
Yamal – The Europol pipeline represented a new type of investment. Initially intending to bring gas from the
undeveloped Yamal Peninsula in the far north of Siberia to lucrative West-European markets, the main rationale
of the pipeline was the first transit by-pass by Russia, passing through Belarus rather than Ukraine. Yamal
delivered first gas to Poland in 1996 and Germany in 1997.
Western gas markets became, from 1985, the biggest source of revenues from gas exports for the USSR,
compared to Eastern Europe. They now account for around 80 bcm out of 200 bcm per year of Russian gas
exports.
Map 1: Main transit lines in Eastern Europe
The boundaries and names shown and the designations used on maps included in this publication do not imply official
endorsement or acceptance by the IEA.
Sources: Petroleum Economist, IEA
19
C. Low oil prices – Path to liberalisation – The era of cheap energy
This time frame covers the period from the low oil prices in 1986 to the start of the liberalisation in
1998. After the high oil and gas prices and the perception of scarcity, the efforts in exploration and
investment in production and transport facilities all over the world increased. Substantial volumes of
gas became available in Europe, produced particularly through an expansion of activities in the
United Kingdom, Norway, Soviet Union and Algeria. From 1989 Russia made increasing amounts of
gas and oil available for export because internal demand had dropped after the demise of the
Communist regime. A situation emerged in which Europe could be supplied by a number of
potential suppliers.
1. France
In 1993 an interconnection was made with the Spanish network, the first Trans-Pyrenees gas
pipeline, linking Lacq with Calahorra in Spain. The Franpipe connected the Norwegian Sea to France
in 1998. In the period between 1972 and 1980 two LNG re-gasification terminals were built, one near
Marseille and one near Nantes.
2. Italy
ENI was converted into a joint stock company in 1992 with the Treasury owning 100% of the shares.
Between 1995 and 1998 the government's shareholding in ENI was reduced to 30.3% through four
tranches of public offerings. Prior to ENEL signing its own import contract in 1992, ENI, through
SNAM, was the sole importer of gas into Italy.
Legislation passed in 1988 included provisions making possible some restricted form of TPA in
SNAM pipelines. The intention of this reform was to enable ENEL, the national electricity company,
to purchase gas directly from the producers, at home and abroad. The right for producers to gain
access was conditional upon the availability of spare capacity. Since there was no regulation forcing
the transmission company to increase its transport capacity to accommodate the gas of third parties,
SNAM in practice was able to refuse this type of operation, except during summer months when
consumption was low.
Gas imports from Algeria increased after the signing of contracts in 1991 and 1993. The capacity of
the Trans-Med pipeline was doubled and, import levels reached 19 bcm in 1996 (of which 4 bcm was
for ENEL) up from 13 bcm in 1993.
3. The Netherlands
In the 1980s radical changes began to take place in the Dutch position in the European gas market.
National and export sales had fallen significantly, while reserves improved. The small-fields policy
proved successful and many new fields were found, particularly offshore. To sell more gas, Gasunie
was allowed to sell to the electricity sector (20 bcm during the period 1982-1987). In 1984 the
restrictions on the use of gas in power plants and export were terminated.
In the period 1985-1995 the Netherlands strongly opposed EU initiatives to liberalise the gas market.
It was thought these initiatives would jeopardise traditional Dutch gas policy objectives and to
interfere with the market-value principle. The third white paper in 1995 was a turning point; instead
of opposing liberalisation, it concluded that it would be more advantageous to reap the benefits a
free market would provide. The first direct supply of gas from a foreign company occurred at the
end of the 1980s, when a gas-fired power generator in the Groningen Province was supplied with
Norwegian gas. The contract was based on coal-parity (the competing fuel). Many local distribution
companies, seeking the benefits of scale, merged. In 1985 there were 158 local distribution
companies, in 1998 the number had fallen to 26, and currently approximately 10 remain, of which
Essent, Nuon and Eneco are the largest.
20
4. United Kingdom
With the Gas Act 1986, BGC was privatised and renamed British Gas plc (BG) and a regulator, Ofgas,
was set up. Although the Gas Act also provided third-party access to the national pipeline network,
competition came only very slowly. In the following years three Monopolies and Mergers
Commission (MMC) investigations would be needed in order to find the right framework to increase
competition.
In November 1987, BG was referred to the MMC for the first time by the Office of Fair Trading
(OFT), which had received complaints from industrial consumers that, despite the Gas Act, there was
no real competition and that price reductions were only being given by BG to customers who had an
alternative source of supply. The MMC reported in 1988 that British Gas was ‘guilty of extensive
discrimination in the pricing and supply of gas to contract customers’ and that this resulted from the
monopoly position and was against public interest. The MMC proposed the following:
o
BG had to publish price-schedules for large industrial and commercial consumers.
o
Interruption rights under contracts should be even-handed.
o
Common pipeline carriage terms should be published.
o
BG was prevented from contracting more than 90 per cent of the production of any new gas
field.
The second MMC investigation (1993) suggested British Gas to be broken in two. British Gas fought
break-up and a compromise was sought. Instead of breaking up, BG accepted a fast-track to
competition in 1998, and accounting separation (“Chinese walls” between network monopoly and
supply, as if it were two different companies) to overcome conflict of interest. The Gas Act 1995
effected the removal of the monopoly. Now it became clear that British Gas had signed up long-term
contracts with North Sea producers on the basis that costs could be passed on to customers. Now
customers could desert to cheaper spot-priced gas and BG was left holding much more costly longterm contracts.
BG needed to separate out and protect its transmission and distribution businesses from its supply
contracts problem, and the way to do this was to break itself up, and to place the contracts within a
separate company, called Centrica, which was formally demerged from BG in 1997. The new
company would not be financially viable if it contained only the contracts and the supply business,
which was expected to be loss making. Therefore assets in the form of the producing area
Morecambe Bay were added in.
In summary, the liberalisation process in the United Kingdom lasted from 1982 to 1997, and resulted
in the restructuring of the industry. BGC was replaced by a transport company (Transco, later
National grid), an upstream company (BG international) and a downstream company (Centrica).
Other functions necessary in the new market design were taken on by a new gas regulator (Ofgas,
later Ofgem) and by the government (DTI).
5. Germany
An important factor for the introduction of the first real gas-to-gas competition in Germany was the
strategy of the German gas supply company Wingas, a joint venture between Gazprom and
Wintershall (a subsidiary of the chemical company BASF), created in 1993. Wintershall and Gazprom
shared opposition to the monopoly position of Ruhrgas. Gazprom saw bypassing Ruhrgas as a way
to get higher export prices by securing part of the wholesale mark-up that Ruhrgas had traditionally
obtained. BASF helped secure Gazprom’s role in Wingas by agreeing in 1993 to build a large
chemical complex in western Siberia; in return, Gazprom pledged that Wingas would hold exclusive
marketing rights for the Yamal output. The joint venture would allow Wingas to sell directly to large
customers – including BASF - and to gas distributors. Costs for pipelines were shared.
Gazprom handed the task of renegotiating the main supply contracts to Wingas, and in 1994 the firm
created new contracts with prices that were only slightly higher than existing arrangements—
21
disappointing Gazprom. Wingas opened the first pipeline in the Belarus Connector in 1996 — a
connection between Poland and Germany that allowed quantities of gas to flow as Wingas lined up
buyers. The net effect of this competition between Wingas and Ruhrgas was to drive down prices for
distribution companies and for final consumers. As wholesale contracts between Ruhrgas and
distributors expired, Wingas would attempt to entice the distributors with rebates, only to find that
Ruhrgas would match the offers and in most cases win the contracts. Margins for Ruhrgas declined
in the regions where Wingas also operated, and Wingas struggled to gain market share. Throughout
this process, Gazprom nonetheless sustained a close relationship with Ruhrgas as its largest
customer; Ruhrgas bought the largest non-Russian share of Gazprom (currently 6.5%).
6. Eastern Europe
In 1989 the CMEA bloc broke up progressively; two years later this was followed by the demise of
the USSR. Despite the collapse of the Soviet regime in Eastern Europe, the gas agreements endured,
remarkable given the changes afoot. However, two major issues arose for the countries entering in a
process of transition: firstly, strong hydrocarbon import dependency from Russia, and secondly,
massive inefficiency in energy use encouraged by low state-administered prices.
Whilst the former USSR ministry of gas became Gazprom, so the East-European gas administrations
each were reformed by their governments into state gas companies. Under pressure from Gazprom
to renegotiate CMEA barter deals for dollar-denominated contracts, these state companies entered
into difficult negotiations. On the one hand, they served consumers used to paying token values for
their energy supplies; on the other hand they were being told that economic relations with their
energy supplier had to be comparable to the market-based deals with Western Europe.
In a context of growing globalisation and international competition, East-European countries
engaged in radical reform of their economies, based generally on liberalisation, stabilisation and
privatisation. Large scale and rapid privatisation was the hallmark of the transition period from
Soviet-designed to market-based economies. East-European economies saw a drastic drop in
industrial output following the break-up of the centrally planned regime which led to a fall in energy
consumption. The total consumption of natural gas in Eastern Europe fell by more than 20 bcm from
90 bcm per year in 1989 to a total of 70 bcm per year in 2000. In the former USSR, consumption
dropped between 1991 and 1997 by some 185 bcm. Gas consumption in the former USSR returned to
its 1991 level only in 2005.
Fig.6: Gas consumption in Eastern Europe during transition
100
Slovakia
90
Poland
80
billion cubic meters
Hungary
70
Czech Republic
60
Slovenia
50
Serbia and Montenegro
40
Croatia
30
Bosnia and Herzegovina
20
Romania
10
Bulgaria
0
1989 1990 1991 1992 1993 1994 1995 1996 1997 1998 1999 2000
Source: IEA
22
Nevertheless, the heavy industrial bias of the former CMEA countries remained, and with it their gas
import dependency fed by branches of gas transit pipelines. In this sense, East-European countries
didn't inherit a truly integrated gas network, but one that more closely resembled a chain of major
consumers aligned along major transit pipelines. Furthermore, there are no alternative supply routes.
This situation has reinforced the dependency of East-European countries on their major supplier, and
almost 20 years after the break-up of the CMEA bloc, gas import dependency from Russia is still a
major consideration, particularly since Gazprom exercises a monopoly on gas exports from Russia.
Box 3: Eastern Europe in 1998 on the eve of first Gas Directive and EU enlargement
The rush to liberalisation
Many East-European states in 1998 were considering a political process of major importance: accession to the
European Union. A fundamental condition for the accession of new member states in the EU was (and still is)
the adoption in national law of the European “acquis”, comprising European laws and directives such as those
liberalising the gas and electricity markets.
The integration of Eastern Europe and the liberalisation process in the gas and electricity markets were
concomitant – the first Gas Directive was issued in 1998 while the European Councils in 1998 and 1999 identified
ten former socialist economies in Eastern Europe as candidates for EU accession.
As the accession to the EU was a political priority for these countries, the prerequisite of adopting the Gas and
Electricity Directives was almost viewed as a formality among many (of 31 chapters in discussion during preaccession, energy was but one). Only two countries asked for transitional periods in which their energy
industries could develop and modernise. These periods were reviewed and shortened after accession.
Therefore, after emerging from 40 years of a centrally planned economic regime with state ownership and no
free market, Eastern Europe had to rapidly adjust its energy sector to a market-based economy and the new
competition rules of the European Union.
Weaknesses of the gas industries
Several market imperfections characterised the East-European gas sector that would make it difficult to
successfully transform the organisation of these gas markets.
The industrial structures within the Soviet bloc were based on nationally administered prices and volumes, and
on gas import barter exchanges (including services, raw materials and manufactured goods). With the collapse
of the Soviet Union, and the need on both sides to proceed to market reforms, barter contracts were
progressively replaced by new ones labelled in US dollars. As the terms of exchange during Soviet times were
unclear, the price and volume adjustments created tensions and conflicts among former allies.
In this particular context, the single supplier of gas to Eastern Europe, having alternative and more lucrative
markets in Western Europe, exercised substantial market power in the transit states. This market power was
enhanced by the lack of interconnections among the Eastern markets as pipelines evolved as transit and supply
corridors from the source in the East to the destination in the West. The enlargement of the EU increased the
degree of heterogeneity in EU gas markets, thus necessitating a differentiated approach to liberalisation as shall
be shown in the subsequent section.
For East-European states, engaged in profound political and economic reforms, achieving workable competition
in the energy industry was thus a substantial challenge. Some governments, incapable of managing electricity
and gas administrations in a dynamic context, opted for privatisation of energy industries.
23
II. EU liberalisation push and the industry’s response
A. 1998-2008: ten years of continued regulatory change
The aim to build a single market for gas and electricity is a principle embedded in the creation of the
European Union – the EC Treaty mandates the building of a common market including energy
(Treaty of Rome 1957, Single European Treaty 1985, Treaty of Maastricht 1992). Making the energy
sector in Europe competitive and more efficient was viewed as part of the response to growing
concerns on the competitiveness of European industries in globalising markets. Introducing
competition in the gas sector was aimed particularly at creating a more appropriate competitive
framework, notably more gas-to-gas competition, thus increasing economic efficiency and lowering
costs for the final consumers in markets frequently monopoly dominated. A truly working internal
market would also deliver more resilience in the event of supply disruptions from any cause, thus
increasing gas security.
1. 1998: Liberalisation “à la carte”
Negotiations between the EU authorities, the member states and the market stakeholders during the
1990s culminated in an Electricity Directive (96/92/EC) and, two years later, in a Gas Directive
(98/30/EC) introducing a first set of common rules for the EU energy markets. On natural gas, the
new legal framework was aimed at opening the gas networks to third parties. This was to be
achieved through unbundling of the vertically integrated historical gas operators, thus allowing
competition for supplies and customers within the natural monopoly network. The European
Commission encouraged the industrial re-organisation within each country to be supervised by an
independent regulatory authority, but this was not mandated. The member states had two years to
implement the corresponding national legislation and industrial regulation reforms.
Initially, the opening to competition granted the choice of supplier to big gas customers such as
power plants and big industrial facilities. A level of eligibility was to be defined by the member
states such that at least 20% of the national market was free to choose suppliers when the Directive
entered in force, the level being updated five years later to minimum of 28%, and 33% after another
five-year period. The eligible customers were free to contract their gas supply with the supplier of
their choice, the latter being authorised to ship gas through the existing network with the Third Party
Access (TPA) provision of the Directive.
To ensure transparent and non-discriminatory access to all potential suppliers of the market, the
infrastructure operator was to be unbundled – separated – from the integrated undertaking. This
unbundling requirement was, at a minimum accordance with the first Gas Directive, on an
accounting level, which in practice had to put an end to cross subsidies and transform the mature
networks into essential facilities.
The monitoring of this new system was assigned to a regulatory body which had to be independent
from the market and from the state, to ensure transparent and non-discriminatory operations on the
market. The regulator had the prerogatives to grant licenses to suppliers and infrastructure operators
in the market, supervise tariffs and ensure the efficient functioning of the market. TPA could
however be either regulated (tariffs and conditions published by the transport operator ex-ante), or
negotiated on a bilateral case-by-case basis.
The member states could choose different approaches to implement the opening to competition
process (negotiated or regulated TPA, accounting unbundling, legal unbundling or complete
separation, ex-ante or ex-post regulation of the market), but overall equivalent economic results and
market opening were required between the national markets.
The gas market liberalisation was conceived taking into account existing national features such as the
level of maturity of the market, import dependency, public service obligations etc. On the light of
these, the first fallowed certain derogations granted to member states.
24
Derogations were granted in the following cases:
o
If the opening to competition process was contrary to existing public service obligations, to
long-term take-or-pay obligations, to security of supply prerogatives, or was likely to create
other economic difficulties;
o
If the national or regional market was not sufficiently interconnected with other EU markets,
or had only one external supplier and no indigenous resources;
o
In the case of emerging and developing markets in need of substantial investments.
Subsidiarity was therefore embedded in these new common energy market rules, made “à la carte”
to address the quite heterogeneous natural gas markets in the EU. Nevertheless, this process tried to
create a harmonised and integrated market, and the member states were only allowed to choose the
best solutions appropriated to their specific contexts in order to achieve the common goal.
The negotiations of this first Gas Directive began in a Europe of 12 which in 1995 became the EU-15
with Austria, Finland and Sweden joining the club. By the time the Directive was effectively
implemented by the member states in 2000, the perspective of a new unprecedented enlargement
was confirmed by the European Council, which adopted the outlines of a future Europe of 25 and
later of 27. Yet of the continental countries of the EU-15, only Portugal, Finland and Greece were
considered as developing gas markets - the rest of Europe was legally regarded as quite mature in
terms of gas industry development. As was demonstrated in the previous section, the gas industry
had developed in a different manner in East-European countries.
2. 2003: Acceleration under the Lisbon agenda
Even before the implementation of the first Gas Directive there was already a push to accelerate gas
and electricity liberalisation. The European Council, held in Lisbon in March 2000, requested that the
Commission undertake further steps towards the completion of the internal energy market. The new
aims were far more ambitious and global than the first Gas Directive, and this time gas and
electricity were treated jointly in one proposal. Therefore, a second Gas Directive was postulated
before the first had been fully incorporated into some member countries’ national laws.
Market conditions partially justified this further step: several markets had opened more than the
required consumption level (79% in real average compared to 20% of legal minimum); nine out of
fifteen EU member states were planning total market opening by 2008; eight member states had
opted for regulated TPA. At the same time the benefits of a competitive market weren’t obvious yet;
after the coming into force of the first Gas Directive, price rises were observed in EU gas markets,
while in the electricity market, prices decreased after liberalisation. This encouraged policy makers to
consider that the objective of liberalisation was not to reduce prices per se, but instead to make them
more cost reflective and exert maximum downward competitive pressure on them. It became clear
that wholesale gas price rise was linked to oil price increases and was not related to the opening to
competition.
The analysis made by the Commission on the implementation of the first Gas Directive revealed an
unequal level of market opening, tariff and TPA problems, concentration of gas production and
imports. Because of these main reasons, competition at this stage was not effective, and consumers
were seeing little benefit. Further structural measures and full market opening were deemed
necessary in order to advance towards the initial objectives of lower prices and efficient markets.
The EU Council at Barcelona in March 2002 decided on full market opening for industrial gas
consumers in 2004 while total market opening was intended for 2005. It launched the preparation of
a new legislation to implement these decisions. A year later, the second Gas Directive was adopted
(2003/55/EC). Concomitant to a second Electricity Directive (2003/54/EC), the new EU gas law
mandated regulated TPA as the basic rule (for all existing infrastructure) as well as moving the level
of unbundling of TSOs to the level of legal separation (e.g. regulated activities under the
responsibility of separate entities). The role of independent regulators was also reinforced.
25
The new Directive was accompanied by deeper analysis of the public service obligations and of the
security of supply issues. Although the first Directive already recognised the weight of these issues
in the European gas industry by relying on subsidiarity and “made to measure” solutions for each
state, in the new diagnosis, the process of liberalisation was treated separately from security of
supply measures, which was to be a matter for a separate directive. While the push for more
competition was adopted in 2003, the security of supply issue was subject to substantial problems
and the Directive adopted on the subject in 2004 (2004/67/EC) was not as binding as is the one on
liberalisation.
Another interesting feature of the second Gas Directive was the proposal for updating the Transit
Directive issued in 1991 and for joint regulation of all high-pressure transport pipelines in the EU,
which would be subjected to TPA. This proposal implied the end of the special status of “transit
pipelines” as exempt from TPA rules under the first Gas Directive dispositions by “demoting” transit
pipelines to European distribution lines. The Energy Charter Treaty and its clauses were impacted by
this move, as the Treaty only refers to transit pipelines.
The subject of pipelines in the liberalisation process was handled with a certain caution – new
pipeline projects were temporarily exempted from TPA in order to make the investment and its
repayment possible. But the question of whether temporary TPA exemption would be sufficient to
trigger the necessary investment for the pan-European gas networks remained unresolved.
3. 2003-2006: “More needs to be done”
By 2003, the market reality in Europe was that competition was still very slow to develop. After two
attempts to open the energy sector to competition, a new series of benchmarking reports made by the
Commission (third & fourth3) in 2004 pointed out the issues that seemed to impede the creation of a
truly competitive and functioning energy market in the EU:
o
Customer switching was not sufficient.
o
In the absence of increased interconnection, new suppliers were not able to enter the
markets, and gas could not circulate freely from one point to another.
o
Competition between suppliers was difficult to achieve on a national basis where one import
source often dominated the market (to the extent that a wider European natural gas market
could be created, this concern might be alleviated).
o
Prices might had not fallen as expected, while regulated end-user prices were distorting
market functioning.
o
Investment had become an issue, especially in cross-border interconnections. In the medium
term, a number of projects, particularly for LNG terminals, were either in progress or being
considered. It was expected that such investments would be forthcoming without specific
support measures.
o
The industry structure was far too concentrated, and TSOs were not sufficiently
independent.
These conclusions, added to anti-trust enquiries led by the Competition Directorate of the
Commission, shifted the focus from changing the basic conditions (which failed to yield results
rapidly), to changing directly the market structures in the gas and electricity sector (in electricity,
conclusions were similar).
The fifth benchmarking report4 in 2005 stated that the “most persisting shortcoming is the lack of
integration between national markets”5. Lack of liquidity, market concentration and cross-border
infrastructure still remained major problems according to this report. In particular, long-term take-
3 Brussels, 5.1.2005 – COM/2004/863 final. http://ec.europa.eu/energy/gas/benchmarking/doc/4/com_2004_0863_en.pdf
4 Brussels, 15.11.2005 – COM/2005/568 final. http://ec.europa.eu/energy/electricity/report_2005/doc/2005_report_en.pdf
5 Idem p. 2
26
or-pay contracts were singled out as a problem, contributing to market foreclosure, and also the lack
of investment in new pipelines, which would drive market integration.
The Commission also recognised that reforms were being enacted legally, but that some member
states were (perhaps intentionally) reducing their effectiveness, noting that “Member states need to give
careful consideration to ensure that in their implementation of the Directives in practice, they pursue their
spirit and not only their letter”.
The security of supply analysis led by the Commission arrived at the conclusion that in a context of a
globalising market, the EU must ensure that it remains attractive to suppliers – requiring an internal
market which functions properly and has a stable regulatory regime. Nevertheless, the Security of
Supply Directive issued in 2004 only suggested ways of improving the security situation, without
imposing concrete measures to actually promote investment at a time when the market was not
complete.
Overall, the flexible approach initially adopted for energy market liberalisation has shown to deliver
results at best slowly. Hence new measures have been taken in order to accelerate the reforms in the
part of the gas value chain which is under EU responsibility – the common market. No further
solutions concerning external relations and geopolitical issues concerning the gas imports have been
taken beyond the already existing “dialogue” with external stakeholders.
4. 2007: Towards a third Directive
The 6th benchmarking report was issued in January 2007 and provided a general overview of the
future energy policy of the EU. It envisaged a “third package” of legislative proposals for the
European gas and electricity markets. The rationale of this third package is the integration of the
energy and the environment objectives of the EU through the use of market based environmental
and other measures.
The EU Commission proposed ambitious and far-ranging measures such as complete de-integration
of the gas operators through ownership unbundling and further institutions to back-up the creation
of an integrated EU gas market (European regulatory agency). On a practical level the solutions put
forward concerning investment between national markets are left to the member states’ bilateral
cooperation and initiatives.
Consequently, the main new feature of the third package for market liberalisation consists in internal
industry structural change – namely ownership unbundling; the others being acceleration of already
existing measures such as network harmonisation, continuous identification of missing
infrastructure, increased coordination between TSOs and regulators through existing institutional
groups (ERGEG, GIE etc.).
The main features of the third package concerning the natural gas markets are:
o
Energy and environmental issues to be treated together
o
Gas and electricity to be treated equally
o
Ownership unbundling between transport and sales
o
A European agency of energy regulators set by the Commission to monitor cross-border
issues
o
Energy security and market integration to be dealt with by member states and companies
Stakeholders’ views on these measures are summarised below:
o
On the regulators’ side, ERGEG (European Regulators' Group for electricity and gas)
proposed that the new legislation include more concrete measures in order to define high
level public interest objectives, EU operating and security standards, roles and
responsibilities to ensure investment, enhance the EU-level vision and responsibilities over
regulation, networks, and their accountability. Concerning infrastructure issues, despite
some disagreement, the overall outcome of the ERGEG proposal favours ownership
27
unbundling because it would allow more effective monitoring of TSOs. On the TPA
exemption issue on new pipelines, ERGEG states that a balance should be found between
incentives for new investments and competition.
o
The infrastructure operators through GIE (Gas Infrastructures Europe) proposed a nuanced
vision on the ownership unbundling issue, including the possibility for a moderate model
called ISO (independent system operator) implying vertical integration on ownership but
separate management of transport companies. GIE points out that in already liberalised
markets alternative models can work efficiently next to each other and that one solution for
all EU markets might be provided by TSOs integrated in supply companies, but providing
transparent and non-discriminatory services to the whole market, and thus acting
independently.
o
Finally, the gas operators (represented by Eurogas) confirmed their commitment to progress
towards a secure, sustainable and competitive European energy market. They state that
security for the market relies on a sound, consistent, single foreign policy for the EU,
adequate investment notably in importing facilities, and a balance between internal and
external dimensions of EU energy policy. In relation to the objective of a well functioning
energy market, Eurogas generally aligns with the other stakeholders in demanding
improved regional cooperation and a well-functioning TPA regime which, as in the GIE
view, does not necessarily need to embrace total separation of infrastructure and other
activities.
Fig.7: Chronology of EU liberalisation (1998-2008)
•Regulated or negotiated TPA
•Gradual market opening
•Accounting unbundling
1998: FIRST GAS
•Independent regulation
DIRECTIVE
2000 & 2003:
LISBON AND
BARCELONA
COUNCILS
2003: SECOND
GAS DIRECTIVE
2004 & 2005:
4th AND 5th
BENCHMARKING
REPORTS
•Acceleration of liberalisation
•Several markets already open to competition
•New legislation launched
•Full market opening scheduled for 2005
•Gas and electricity treated equally
•Regulated TPA
•Market opening for all professional customers decided for 2004
•Legal unbundling
•Transit and transport treated equally; TPA exemption for new infrastructure
•Lack of customer switching
•Industry concentration
•Insufficient market integration
•Prices haven’t fallen as expected
•Integration of environmental and energy measures
•Ownership unbubdling
•European agency of energy regulators to monitor cross-border issues
2007: 6th
BENCHMARKING • Energy security and market integration left to Member States
REPORT AND 3rd
PACKAGE
Source: European Commission
28
5. Critique
At the moment (May 2008), the outcome and the conclusions of this dialogue are a complex set of
proposals, some of which are binding – compulsory for all member states. These include internal
market provisions on industry structure change (ownership unbundling) as well as some measures
on emissions trading and renewable energy objectives. Other proposed measures are based on nonbinding encouragement (R&D and energy efficiency for instance) or left to the initiative of member
states (external relations, solidarity in the case of supply disruption and general security of supply
issues).
It is not clear whether this mix of compulsory and non-binding measures will deliver key objectives,
notably security and diversity of supply, and sustainability. Globally, gas supplies from both
pipeline and LNG are tightening, and supply side investment is weak everywhere. Infrastructure
investment is lagging, including for storage. Governments are demanding ever higher shares of
renewable electricity, which given its current intermittent production regime almost certainly
necessitates gas-fired back up power. In any event, lagging investment in alternative sources for
electricity generation guarantees a more prominent place for gas-fired power, rising from less than
15% ten years ago to 25% by 2015.
As structural changes to the gas industry occur, consideration needs to be given to integrating
policies for security and sustainability in order that those functions performed currently by
companies within national borders are not lost. Perhaps a single gas market in the future would
automatically produce some of the security outcomes, but perhaps additional policy levers or market
mechanisms are needed which can act on the market to make it deliver desirable outcomes. Other
reforming markets have found it necessary to establish legally binding reliability standards in, for
example, electricity markets, e.g. in North America.
A second issue concerns investments – especially the investments required to integrate the markets
such as missing interconnections not linked to new supply routes. Inconsistent and changing
regulatory regimes across member states remain a major barrier to cross-border investment,
including new large-scale import infrastructure (e.g. Nabucco).
Generally, the liberalisation process in the EU should still focus on the main industrial problem for
European gas, which is not specifically linked to the EU markets but is a global issue: how to ensure
bringing increasing supplies of long-distance gas imports to the market and secure reliable,
affordable supply in the long term? This issue is presently left to companies to guarantee. Any set of
reforms must continue to keep sight of this fundamental objective, so that companies and investors
in general can work towards this aim, and so that the relevant institutions can be put in place in a
timely way.
B. The Industrial and National response
1. The industry’s response to the EU regulatory revolution
Since the beginning of the 1990s and the renewal of the EU internal market construction, European
energy companies have started preparing for the potential effects of the opening to competition of
their historically protected national or regional markets. In the interest of their shareholders, the
expected loss of historical market share in their domestic markets had to be compensated in some
new way, and different strategies were deployed by the energy companies in order to ensure their
growth within the EU energy market.
Generally, the natural gas industry in Europe made certain that they complied (sometimes in
advance) with national laws by the time these incorporated the first Gas Directive. In 2000, at least a
minimal compliance with the basic provisions of the Directive could be observed in most member
states not under a derogation protection (with very few exceptions). In parallel, the energy
29
companies involved in the natural gas business in the EU were preparing for this organizational
change by implementing new development strategies. Four general trends may be observed since the
mid-1990s to the present period.
o
First, the big national or regional incumbent operators, with the perspective of losing their
monopolistic market share, started acquiring assets in other European countries and abroad.
o
Second, downstream local utilities merged on a national or regional basis, reducing therefore
the number of downstream players in their markets.
o
Third, synergies were sought across gas and power industries. There was an increase of
mergers and acquisitions between gas and power companies.
o
Fourth, the newly created pan-European energy groups engaged in a policy of vertical
integration up- or downstream in order to secure market shares and their supplies.
With the acceleration of the opening to competition process, (second Directive and following
benchmarking reports and sector inquiries in 2004-05), these parallel development strategies became
more aggressive and were viewed as vital to many firms, but anti-competitive issues quickly
surfaced. The EU authorities noted these trends in the fifth benchmarking report6: “In addition to the
high levels of concentration in national markets, an increasing number of cross-border acquisitions can be
observed. In certain electricity markets there also seems to be a tendency towards growing vertical integration
between generation and supply activities, which might lead to a reduction of liquidity on the wholesale markets
concerned, aggravating the risks associated with concentration. Furthermore there have been attempts by
incumbent gas and electricity companies to merge. These mergers can reduce incentives for competitors to
build new gas fired plants. The Commission is monitoring these developments carefully and – to the extent
applicable – strictly applies its merger rules. In its competition cases the Commission pays particular attention
to remedies that facilitate market opening and integration. The Commission is investigating the concentration
and consolidation of the industry in more detail as part of the ongoing sector inquiry launched in June 2005.”
Here are several examples of the outcome of these market changes in Europe:
o
Gas incumbents like Gaz de France, Eni and E.ON Ruhrgas acquired gas assets in other
European markets, thus increasing their gas customer base to counter the trend of their local
markets.
o
Downstream utilities started merging and concentrating on a regional and national level
(examples of Dutch utilities Essent, Nuon, Eneco, as well as of Italian utilities Hera, AEM)
o
Power companies acquired significant gas operators in Europe: EDF buying out EnBW in
Germany and Edison in Italy, but also power assets and clients in the United Kingdom,
Germany, Central and Eastern Europe. In 2001, RWE bought the Czech gas incumbent
Transgas (after securing by the acquisition of VEW a total of 38% of German electricity sales
in 2000).
o
The acquisition of Ruhrgas by E.ON is a specific example of power companies taking over
gas companies in their own countries. The German competition commission itself tried to
block the deal, but was overruled by the government. In a similar vein, the Italian electricity
player Enel developed in the gas business on its home market, and DONG acquired power
assets in its native Denmark.
o
European gas suppliers were facing a severe reaction by external gas producers and their
main suppliers. Companies lacking significant production assets such as Gaz de France or
Centrica (having been separated from the upstream part of the British Gas monopoly) and
even newly merged entities like E.ON, started exploration and production activities, mainly
in the North Sea, but also abroad.
The enlargement of the EU to Eastern Europe and the transition from centrally planned to marketbased economies in that region triggered the concentration of the gas business on a pan-European
6 COM/2005/568 final, p.8
30
level. As noted previously, the East-European governments were facing difficult objectives in the
overall economic restructuring of their countries; therefore many of them chose to entrust
management of the energy businesses to large and market experienced western energy players, be
they public or private.
Downstream gas utilities were sold in Hungary and Romania, transport and sales companies were
privatised in Czech and Slovak Republics, while whole integrated incumbent operators were
acquired by foreign utilities in the Baltic States. The main gas assets were transferred to the already
growing energy oligopoly in the EU as well as to Gazprom itself in some neighbouring countries.
Only two countries retained state-ownership of the majority of gas assets (Bulgaria and Poland).
Some other countries realised a compromise by retaining either a majority of the company or
ownership of the transport assets, which were considered by them to be strategic (e.g. Romania,
Hungary).
Generally, the concentration and the vertical integration by key market players on the midstream
and downstream in the European markets may be viewed as a strategy to counter-balance the
growing uncertainties and risks in the European and in the global energy scene. While such
concentration may adversely affect competition at national levels, it might ultimately facilitate panEuropean competition. Arguments that such consolidation is essential for adequate market power
vis-à-vis upstream suppliers need to be seen in the light of the still small size of such consolidated
players.
Fig.8: Market value of major European gas companies
250
Gazprom
200
Producers
Royal Dutch
Shell
BP
Total
Eni
150
Billion USD
ENEL
Endesa
Scottish Power
100
E.ON
Suez
Utilities
50
RWE
Gaz de France
0
2002
2003
2004
2005
Source: data from FT Global 500 (2002-2007)
31
2006
2007
2. National reactions to the liberalisation process
EU member states, having different industrial structures in the energy sector, have set differing
priorities in their national energy policies.
a.
Impact in Western Europe
In France, the first Directive was implemented with some delay; nevertheless the two incumbents in
gas and electricity went ahead with the liberalisation process and started reorganising internally in
order to be ready for European-level competition. The second Directive pushed forward the
restructuring process with the creation of regulated third party access on the gas grid, which was
transformed into an independent affiliate in 2005. The presence of a strong regulator in France and
the basic compliance of the French incumbent with the EU legislation provided a relatively
transparent and non-discriminatory access to the network. However, the absence of local production
and the dependency on external long-term supply contracts made it difficult for competition to
develop organically. Only neighbouring energy players (from Belgium, Italy, Germany) could enter
the market and supply industrial consumers with gas.
The German situation is different from the French one precisely because of the regulator’s role in the
ex-post monitoring of the energy market, as well as because of the different industry structure.
Firstly, Germany entrusted the already existing Bundeskartellamt (competition commission) to
supervise the energy markets liberalisation. However, this competition commission was empowered
to perform only ex post regulation, and not ex ante as it could be interpreted from the first and second
Directive. A dedicated regulatory authority was finally created only in 2005 (Bundesnetzagentur)
which has taken time to acquire experience and appropriate skills. Secondly, a merger between the
major gas player Ruhrgas and one of the main electricity players, E.ON (itself a merger between
Veba and Viag), created a dominant energy company which rapidly built on an already significant
presence of the two companies in Germany and abroad. Thirdly, the presence of several regional
players in Germany, and therefore of several networks, complicated the access to networks by third
parties. All these factors help explain why the German market remained relatively closed to new
entrants and retained its initial rigid structure. Since the creation of the energy regulator, new laws
have been passed, intending to curb the market dominance of the big players and to develop a more
flexible industry structure, notably by restraining downstream long-term contracts (between
wholesalers and retailers).
The Italian restructuring is also linked to a tug of war between the regulator (l’Autorità) and the gas
and electricity incumbents. Although the networks have been partially separated from the
incumbents, two strategic moves characterise the Italian energy market today: the gas incumbent has
moved upstream, thus becoming a real oil & gas producer, while the electricity incumbent has
developed strongly in the gas market through dual fuel supply. The major issue for Italy remains the
security in primary energy supplies: being a peninsula, gas connections and transit lines are limited
compared to the size of the market, and authorisation procedures to build LNG terminals have
slowed or stopped many projects (Italy has only one LNG terminal despite being 80% dependent on
imports) and thus undermined the overall gas supply security.
In the United Kingdom, market restructuring had taken place before energy liberalisation became an
issue on European level. The United Kingdom has widely supported EU liberalisation processes, and
has underlined the delays in implementing appropriate measures to open the continental markets,
considering that these needed restructuring and that the British energy industry should also benefit
from market opening in continental Europe as the French and German operators for instance took
advantage of the liberalised British market. Furthermore, since UK liberalisation, the NBP has started
to act as the balancing market for continental Europe, in the absence of liquid hubs there. The most
dramatic example of this can be found in the price spikes of winter 2005-2006, and in the low prices
of winter 2006-2007.
The white paper of 1995 formed the turning point for the Netherlands in energy policy. As noted
earlier, prior to that time the Netherlands opposed liberalising energy markets, because it was
32
thought to jeopardise traditional Dutch gas policy objectives. After the white paper it was decided it
would be more advantageous to realise the benefits of a free market. This was done by first
privatising electricity utilities, then allowing some concentration on the downstream level and finally
in 2005 by unbundling the incumbent Gasunie into a state-owned transportation part and a publicprivate trading company, exclusive marketer of Groningen gas. In order to preserve the Groningen
field, in 2006 the 80 bcm per year annually overall Dutch gas production objective was replaced by a
ten-year cap of 425 bcm in total on solely the Groningen field. Unbundling of the downstream energy
utilities into a trading and a distribution part has been heavily discussed over the recent years and
currently is planned for 2012.
Generally, in continental Europe, real reform progress has been observed in markets under strong
and independent regulatory authority. After the 2005-2006 supply crises, energy policy orientations
have progressively incorporated a renewed concern on security of supply issues. Another trend
visible in some countries (in Western and Eastern Europe) is the separation of national networks
from private sector activities like supply or sales, and this unbundling has happened in the
Netherlands, Poland, Romania, and Hungary before the EU proposal of full ownership unbundling.
These decisions were based on a national strategic vision or on business model decisions such as in
the Netherlands, where ownership had to be cleared between the Dutch state and two historical
private energy players, Shell and ExxonMobil. In other countries, a similar logic was used to justify
the preservation of an integrated model (France, Germany, Czech and Slovak Republic, Bulgaria,
Baltic States).
Finland was among the few countries that demanded an exemption from the Gas Directive, as it had
only one gas provider, Russia. The other countries exempted from the gas Directives were Greece
and Portugal, because of relative market immaturity. Surprisingly, East-European countries that are
in the same situation (Bulgaria, Poland) did not seek such derogation and accordingly had to comply
with the Directive principles.
b. Impact on Eastern Europe
As many governments in Eastern Europe were facing profound economic difficulties in their
countries during the transition period (post-1989), some adopted the denationalisation strategy as a
way to deal with the difficult but necessary market reform of the centrally planned economic system.
Many state assets were privatised, either by mass privatisation or by sale to strategic investors, as
financial markets weren’t sufficiently developed to take over important companies.
The restructuring and privatisation of the energy industry in Eastern Europe offered the WestEuropean energy players unique opportunities for international business development. Many big
European utilities started European expansion with the privatisation of East-European companies.
Privatisation of state assets wasn’t required by the European acquis7. But privatisation of their assets
gave these governments vital cash injections as well as helped them to quickly establish a new
economic system. Privatisations in the East were thus to some extent motivated by the political
decision to join the EU. On the eve of the first wave of European accession in 2004, only two
countries out of ten candidates hadn’t started privatising their gas industries (Bulgaria and Poland).
The privatisation that occurred after 1989 in the East-European gas industries may be explained
through the main players’ strategies: those of governments, and of the big European energy players.
The national governments in Eastern Europe had several complex issues to deal with. The European
acquis compliance implied a trade-off between price liberalisation and cost reflective tariffs, and
socially acceptable level of energy prices. In the same time governments had to deal with local
pollution due to inefficient coal usage in power and heat generation, and generally with weak
7 The energy chapter was only one among more than 30 in the pre-accession negotiations between the East-European
countries and the EU; some compromises were made by East-European governments willing to integrate quickly with the
Union. This was necessary as the energy chapter was open for the majority of East-European candidates in 1999 and closed
before 2003.
33
management of energy companies. On an external level, they had to manage complicated relations
with the former Russian ally (end of historical barter exchange, price rises and unilateral contract
revisions by their major energy supplier) while at the same time attempt to interconnect gas
networks on a regional basis. Several governments then chose to transfer these responsibilities totally
or partly to market-experienced western utilities, which was seen as a move parallel to that of the
future EU-integration.
In the mean-time, big West-European energy players had to prepare for the forthcoming opening to
competition of their historic markets and face an inevitable fall of their historical market share. An
opportunity to gain in size was presented by geographical expansion and vertical integration at a
European level. The restructuring and the privatisation of East-European markets offered the needed
opportunities to achieve this.
c.
Impact on non-EU member countries
With the start of the liberalisation process in Europe, some external suppliers have progressively
expressed their worries about the potential threats that this process could bring onto the long-term
supply contracts existing with European countries, as well as on the investment prospects on supply
infrastructure.
From 2000 on, Gazprom was a strong and vocal critic of the liberalisation directives as potentially
leading to the destruction of long-term contracts in a context where Europe seemed to be favouring
spot deals and shorter-term supply agreements. At the same time, the Competition Commission of
the European Union was starting to question the restrictive “destination clauses” in long-term
supply contracts between Gazprom and European utilities. Producers expressed concerns on the
ability of the liberalisation process to ensure the financing of the supply projects needed to meet
rising gas demand, especially when these would require long-term take-or-pay contracts to secure
upstream investment. These concerns persist.
The Gas Exporting Countries Forum was founded in Tehran in 2001, concomitant with rising
concerns about the outcome of the downstream market restructuring in Europe on producers’
revenues. With Russia and Algeria, two of Europe’s largest suppliers are member countries of this
forum; Norway is an observer.
In 2002 Gazprom agreed to eventually drop territorial restrictions in supply contracts, although,
producers were keen to find a new balance in the risk and profit sharing between the upstream and
the downstream. At the same time, Russia started considering shifting to Asia for part of its future
exports, although, apart from the shortly to commence Sakhalin LNG project, purchased from Shell,
Mitsubishi & Mitsui, nothing material has emerged from this strategy. The transit diversification
strategy (avoiding transit countries and multiplying transit routes to diminish the negotiation power
of transit countries) gained momentum with the proposal for the North Transgas pipeline (now
Nordstream).
With the acceleration of reforms and the second Gas Directive adopted in 2003, the Russian position
toughened. The Russian president announced that Russia would resist “excessive liberalisation”
especially of the Russian gas market and that the gas exports monopoly was a “red line” that the
Russian government would not cross8. The hydrocarbon business is clearly important for Russia: in
2002, the oil and gas business accounted for half of government revenues and 55% of exports; in
2007, the overall share of oil and gas related revenues in the federal budget was still growing.
Discussions on the Energy Charter Treaty and its Transit Protocol continue, but seem unlikely to be
concluded successfully in the near term.
8 FT 16/10/2003, « Russia toughens stance on energy prices »
34
Box 4: The Energy Charter
In 1990, with the ending of the Cold War regime, the European Union proposed a charter aiming at energy
market international rules harmonisation, especially between Western Europe and Eastern Europe and former
Soviet republics. The treaty was developed to help the transition to market economies and democracy in the
East, as well as to contribute to the stability of the energy trade with the West.
The treaty was signed in 1994 on the basis of this energy charter by the majority of these stakeholders (including
all OECD Europe and EU countries).
The Energy Charter treaty is a multilateral agreement for cooperation in the energy market and improvement of
energy trade and investment. The main principles of the treaty are equity, transparency, dialogue, and nondiscrimination between signatory members. A major objective of the treaty is the guarantee of international
energy transit, stating that transit costs should be fair and based on real transport expenditures, therefore
suppressing potential “royalties” and transit rents. An eventual outcome of the treaty was a move towards the
integration of east and west energy markets and greater security of energy supplies in the zone. With rising
geopolitical concerns, supply tightening and high energy prices, energy transit remains an issue, and the main
energy supplier in the region, Russia, has not yet ratified this treaty.
Algeria followed a similar line to Russia: in 2002, the Algerian president declared that the EU plans
to liberalise its gas markets would undermine investment and that it was against the producers’
interests, those plans being actually conceived without consulting them. The Algerian proposal at the
time was based on profit-sharing agreements replacing the logic of destination clauses. In 2003
Sonatrach agreed to end the destination clauses, and like Gazprom, proposed to replace those with
fixed delivery point, to ensure visibility for the producers on the added value of the gas sales in the
European market.
These critical arguments were developed and underlined over the following years, with Russia and
Algeria both opposing the effects judged as negative on their long-term revenue guarantees, and
turning to new markets to reduce the interdependence with the European markets by stressing LNG
development or new supply routes to other gas consuming regions.
It remains to be seen whether in fact the effect of “liberalisation” in Europe will be actually positive
or negative for producers. Certainly the early signs are that they have achieved unprecedented access
to internal EU market, and at record prices.
35
Chapter II – The Present. Tensions in a hybrid market
I. The managed markets – Growing uncertainties and
slowing investments
As noted in chapter I, the old industrial model is struggling to deliver adequate investment and
security of supply, while a new industrial model is not yet clearly established. The present hybrid
model, combining legacies of the managed markets with new market mechanisms, is not sustainable.
There is need to complete market reforms to stimulate a new round of much needed investment, as
well as measures to deliver policy objectives, such as enhanced security of supply.
A. Current issues in European gas markets – Investment and security
1. Old industrial model unsuitable for new industry challenges
The transmission of gas from the production site to the border of the European market, comprising
pipelines outside the EU, can be viewed as specific investment because no alternative uses are
possible than the ones designed initially. In Europe, the gas networks inherited at the start of
liberalisation were not designed to be contestable. Even without the effects of national monopoly
exporters, investment specificity alone tends to restrict the potential contestability of a given market
area as it is supplied by limited number of production sites through a limited number of transport
infrastructures. It is worth noting that for electricity this constraint is minor.
In the “old” industrial model, the downstream market areas and the transmission pipelines were
developed and operated under legal or de facto monopolies with a reserved market base, as discussed
in chapter I. As gas networks matured, the classical vision of the “natural monopoly”, which was
granted to almost the whole industry, was narrowed.
In modern industrial economics, only the infrastructure part of network industries is viewed as
natural monopoly, the services (gas sales) being potentially subject to competition. Third party access
to pipelines and the unbundling of sales and infrastructure activities were derived from this new
vision. Opening to competition was thus possible as third party access to essential facilities gave the
final consumer the choice of supplier.
A major problem with investment in the European gas industry is that the majority of companies
used to operate on the principal of geographic concession (often, but not always, a country). The
industry delivered on the following model: within that exclusive geographic area, a company can
market a volume of gas (generally at oil-based substitution value prices) secured by long-term
contracts. Given the security of the customer base, the importer can make long-term investments in
import pipelines, at low risk, knowing that it can get its money back over a period of the import
contract because there is no threat to its customer base. In some countries there are checks and
balances to ensure that this arrangement does not cost the consumer too much – for example in
France, where Gaz de France’s remuneration is regulated by the government partly using the total
cost of supplies. However, in other countries, such as Germany, no such regulation by the
government is in place.
It is clear that this investment methodology had to change in a competitive environment –
competition is diametrically opposed to concession. Downstream energy companies have therefore
been forced to take defensive steps and have tried to resist change. From the perspective of some
downstream stakeholders (companies, governments, customers), this is understandable – their
relatively low risk business, was often linked to public service activities, and used to bring high
security to the market at a cost. The opening to competition imbalanced the system, bringing
regulatory restructuring and uncertainty downstream, while geopolitical and economic upstream
risks were growing.
36
Competition was thus viewed as a threat to companies and to the sustainable growth of the business
on the long term. The incumbent companies were armed with a variety of weapons to prevent such
competition, from restricting infrastructure access, to splitting the market, designing punitive
balancing regimes etc. Despite this, many companies also took competition also as an opportunity
and started considering their development strategy no longer on a purely national but on a European
level, and tried to limit the potential loss of historical market share in their original markets. Where
markets have been more successfully liberalised, downward pressure on gas prices has occurred,
resulting in quite low prices when gas supplies are abundant. Asset utilisation and optimisation has
improved, especially where independent system operators have been established.
Overall, however, continental Europe has remained a set of national gas markets, rather than a single
market, and is still dominated by incumbents. The growing mood of resource nationalism upstream
did little to diminish the difficulties of establishing a competitive market downstream, creating a
vicious circle reinforced by unprecedented energy price inflation on global scale.
While demand continues to grow, domestic supply has stagnated and Europe is on course to
increase its import dependency. A huge amount of upstream and infrastructure investment is
needed to respond to this import challenge. Gas imports will increasingly come from LNG, priced on
a global market basis, influenced by North American and Asian import prices, and hence the
circumstances in those markets. New large-scale import pipelines will be needed, crossing multiple
national frontiers within and outside Europe. But the present industrial and regulatory conditions
are struggling to deliver this. Europe is therefore under increasing risk of underinvestment, which
could lead to supply and market consequences if not addressed.
Fig.9: Overview of import dependency
140
Import
120
Export
Indigenous production (minus export)
100
Billion cubic meters
80
60
40
20
France
Germany
Italy
UK
Netherlands
2006
2000
1990
1980
1970
1960
2006
2000
1990
1980
1970
1960
2006
2000
1990
1980
1970
1960
2006
2000
1990
1980
1970
1960
2006
2000
1990
1980
1970
1960
2006
2000
1990
1980
1970
1960
0
IEA Eastern Europe
Source: IEA
New factors will impact the European markets in the near future. Firstly, there is a growing
vulnerability coming from the increased usage of gas to power where oil pricing is either
inappropriate or irrelevant. Moreover, a strong winter-summer differential without sufficient
coverage in terms of flexibility emerges. In addition, the threat of external disruptions like those that
happened in the US (natural disasters, terrorist threats, financial market tensions, Enron bankruptcy
for example) as well as global warming and heat waves in Europe (in 2003) simply are not addressed
by current gas market arrangements, notably oil-based pricing. All those elements are likely to
37
impact the markets at least as extensively as the generally considered security threats which are
traditionally linked to geopolitical and regulatory uncertainty. In short, the European gas markets
are becoming more dynamic, and more exposed to risk factors, including those of global gas
markets.
Given this market context, it is perhaps surprising to see that new investment has been lagging. On
pipe-to-pipe competition, the 1998 Directive’s provision of freedom to build and operate gas facilities
has not seen a rise in new entrants contesting others’ markets by building competitive infrastructure
downstream. New pipeline construction has been confined to the historical TSOs. New entries were
made by actually buying out the historical player, including its transport facilities, except in the
specific case of the LNG terminals which represent a relatively low barrier to entry in the gas and
electricity markets (where regulatory approval can be obtained readily).
Fig.10: Gas demand and import dependency projections (reference and alternative) for OECD
Europe to 2030
900
800
Billion cubic meters
700
600
Imports
500
Demand
400
Imports (alternative)
300
Demand (alternative)
200
100
0
1980
2000
2005
2015
2030
Source: IEA World Energy Outlook 2007
In Eastern Europe, there is a continuing inability to create diversification in sources of supply, or to
build new import corridors, due to the proximity to Russia and the existing transit pipelines. The
global issue of the impact of the enlargement to the East, apart from creating opportunities for
market growth to already market-experienced western incumbents, consisted in the inability of the
former communist countries to create functioning markets. This problem was based on the historical
lack of market mechanisms in the energy business – in most countries during the 1990s energy
imports were still dealt with at state level – and before 1989 there was no market at all as most of the
economy was centrally planned and administered by the state. Moreover, gas import dependency
often reaching 100% with a single supplier (Russia) impeded further potential gas-to-gas competition
that was expected to happen with the introduction of the liberalisation acquis of the European
Union’s jurisdiction in their national laws. In comparison, West-European markets were already
supplied by several producers, and their national economies were based historically on market
principles.
2. Investment mechanisms that delivered in the managed markets
It is interesting to analyse the drivers for investment in managed and competitive markets to try to
understand some differences in the incentives and therefore the nature of the investment decisions
made.
As already noted, large national or regional gas incumbents, who existed in all European gas
markets, were each established with similar goals in mind – to develop the gas business as a
monopoly within a geographic area. A business case for midstream and downstream infrastructure
investment had to convince the producer that such investment was necessary in order to market his
gas to the largest possible number of clients, and hence maximise revenue from future gas
production. The downstream monopoly in turn saw the need to ensure a certain level of security in
38
its supply pattern (whether through diversity, investment or strengthened relationships with the
producers).
Within managed markets, the mechanism of gas pricing (linked to inter-fuel substitution value, often
oil products) was intended to maximise the revenue from the sale of gas at the burner tip. The risks
of the value chain were shared between the downstream sales entities and the upstream production
entities (foreign or otherwise). The downstream entity was responsible for a large part of the volume
risk (essentially sales/market making and infrastructure investment) while the upstream entity was
responsible for the price risk. In both cases, risk was mitigated by direct links to oil price. Such
arrangements were backed by the creditworthiness of downstream companies who underwrote the
large long-term capital commitments required to deliver gas to West-European markets.
Having a secure market to penetrate without worrying about the threat of competition allowed each
of these monopolies to plan investment in what it understood to be the best interests of the
consumer, whether as an individual or as a region. In such an environment, the downstream
companies had incentives to satisfy all potential gas demand and invest in the necessary
infrastructure given that each investment decision was relatively low risk9. Nevertheless, the longterm contract negotiations with the producers acted as a brake on overspending in the downstream,
as these negotiations specified the allowable costs of marketing (including investment) in whatever
form.
Hence the level of investment along each gas supply chain tended to take into account the nature of
each specific supply field and each demand region. If demand for flexibility services was projected to
increase, the companies along the value chain could jointly work out the cheapest way to satisfy that
demand. In this case, a producer with a more flexible production profile would be less inclined to
want to cover the cost of downstream investment in gas storage, while a producer with flatter
production might be prepared to pay for storage. Whatever solution was decided upon was then
formalised in long-term contracts, which were offered as collateral to banks in order to make
investments.
As the downstream markets diversified their sources of supply and grew a portfolio of assets, so the
downstream companies were better able to negotiate with the upstream – they alone had knowledge
of the demand profile and potential in their region, and therefore the cost (and value) of
infrastructure built there.
3. What are the barriers to new investment?
Currently, there is substantial lack of investments accumulating in European markets. This comes at
a time when some investment fundamentals are positive: demand is rising while supply is tightening
with domestic supply falling, so there is a clear need for import infrastructure, storage and new gas
for Europe. However, new concerns such as resource nationalism, local opposition to new energy
installations, and/or slow or complex planning and approval procedures, loosely called “NIMBY”
(“not in my backyard”), may impede further potential investment in the market.
Fig.11: Investment projections to 2030 (OECD Europe)
Reference Scenario WEO 2007
Cumulative
OECD Europe
Billion $ 2005
Notional Yearly Average
2006-2015
2016-2030
2006-2030
2006-2015
2015-2030
2006-2030
120.6
110.3
230.9
12.1
7.4
9.2
LNG
21.2
13.5
34.8
2.1
0.9
1.4
T&D
24.0
24.9
48.9
2.4
1.7
2.0
Exploration & Development
Source: IEA World Energy Outlook 2007
9 Being guaranteed by the customer, or in some cases the government, and paid for by the producer who had to accept a
certain “cost of sales”.
39
On the upstream side, the increasing European demand should be an incentive to invest in
additional production and supply infrastructure. Nevertheless, there have been rising concerns over
the existing investment level in the producing countries. Moreover, the major upstream producers
have focused on the shifting regulatory environment, in particular the perceived threat to long-term
contracts, as a major risk to their business.
Box 5: The upstream position – the example of Russia
The present position of a major upstream player in European gas towards the proposals of the third package
provides some insights into the strategic positioning of external stakeholders in the future EU gas markets
organisation but also highlights some major issues still unresolved in this reform. Here is a brief view on the
Russian vision on the current reforms.
The third package has on one hand positive aspects for the Russian position: it gives Gazprom the possibility of
bypassing its present competitors and accessing the whole EU gas market through a transparent and nondiscriminatory access to all pipelines, as stated by Commissioner Piebalgs in a meeting in October 2007 in
Russia. There has never been an attempt to limit the expansion of Russian companies in Europe. Given the fact
that Gazprom doesn’t own a majority in any existing infrastructure in Europe, the ownership unbundling
shouldn’t be a concern for Russia (at least not a major one, as existing shares in pipelines like Yamal or Wingas
are all subject to potential negotiation). Moreover, TSOs willing to maximize the volume of flows through their
pipelines should facilitate Russian supplies. Thus, Gazprom could flow gas from Siberia to Spain – while today
it cannot. Concerning new infrastructure, it is possible for the investor to control the pipeline for many years
(unbundling exemption clauses) – therefore there is no immediate impact on Nordstream.10
The response of the minister for energy in Russia (in October 2007, V.Khristenko) was that considering the gas
and the electricity market on the same level was not appropriate. The major trans-national infrastructure
projects should, in his view, be excluded from the current third package proposals which may bring heavy risks
to the gas industry.11 If European plans may be viewed as not directly impacting Gazprom’s present position in
the European markets, they go however against its strategy to become a major vertically integrated energy
player in Europe. The EU reform plans are considered by some Russian analysts as a “vertically integrated
murder”12 especially for Gazprom’s main clients and potential competitors (E.ON, Gaz de France, Eni…).
If the EU Commission has tried to persuade Russia of the benefits of splitting the supply and the transport
business, and even state that it is in Russia’s interests to ratify the Energy Charter treaty, the Russian authorities
have made clear to the EU that if any of the new proposals are perceived as a threat to Russia, this could lead to
a risk for the global supply security of the European gas markets. Russia, supplying a quarter of total European
gas consumption, is interested in being deeply involved in the discussions over the third package, while up to
now the Russians claim to have learned about the third package proposals in the press. This could have been
interpreted as a clear sign of the European will to bar Gazprom’s further expansion on the EU markets.
However, the EU Commission has underlined the positive aspects of weakening Gazprom’s main competitors
and former allies on the European markets, as being one major change that the third package of reforms
represents to the Russian energy interests.
Midstreamers are reluctant to invest in new pipelines or storage capacity without long-term
guarantees, given the threat to their future market size. Cross-border investment is further
threatened by insufficient regulatory harmonisation and lack of regulatory responsibility for such
international projects.
The absence of a European market means that storage, flexibility and consumer protection is handled
either on national or on company level. Each country has its own criteria and requirements
concerning flexibility and public service. TSOs generally have responsibility for networks in their
own sub-region or country, and not for optimising networks on a larger regional or Europe-wide
basis. Therefore, the market remains fragmented and the majority of investment takes place within
national borders.
The global overview of the European market is that of a patchwork of national or sub-national TSOs
with their own regulations, responsible for their respective territories. In terms of investment, some
10 A.Piebalgs cited by Kommersant, 24/10/2007
11 Idem
12 Gazeta, 24/10/2007
40
regulators performed better than others. In the absence of sufficient European-level guidelines on
regulation or investment, there is no sharing of best practices and it is left to individual regulators to
implement home-grown models.
Furthermore, little attention is given to the idea of minimum essential infrastructure requirements
before a market can physically operate. Many EU countries do not have interconnected networks to
their neighbours, but are still required to implement a market structure based on multiple suppliers
and multiple customers. Particularly in Eastern Europe, this is a significant problem to the
development of a competitive market. Regarding Europe as a whole, clearly this problem must be
solved through much greater interconnection capacity before a single European internal market can
be realised.
It is generally recognised that a degree of multiple source capacity and even overcapacity are
preferable in gas networks in order to guard against unforeseen or low probability events.
Overcapacities are a means to provide physical insurance for the gas market, whether in the form of
larger pipelines than absolutely necessary, additional storage capacities, or multiple supply routes or
LNG terminals. In the old industrial model, investment in overcapacity was mandated and justified
on public service and national security criteria, and not solely on financial grounds. In a competitive
market environment, these factors need to be priced, included in the market design or internalised in
the regulatory framework, so that there are financial incentives to deliver it. This is a matter for
further general security of supply policies on national and European level.
Overcapacities do not only correspond to security of supply or European policy objectives – they
help also increase the flexibility and resilience of a given network and increase the number of
potential supply routes, thus increasing competition in the market. In order for a competitive market
to deliver these overcapacities, their benefits must be internalised and priced. A properly functioning
market can be a powerful tool for delivering objectives such as greater diversity, storage or even
supply security at least cost.
B. Transition towards traded markets in Europe
1. Oil indexation vs. hub pricing
Historically, gas in Europe has been sold indexed to the price of certain alternative fuels. Such a
pricing mechanism is markedly different from the one found in traded gas markets, where price is
determined solely by gas demand and supply at market areas or “hubs”. This has led some to pose
the natural question of whether oil indexed and hub-priced contracts can co-exist. The simple answer
to this question is that they already do. This is easily observed in the United Kingdom, where the
majority of gas is sold at the NBP price (around 60%), but a substantial minority of oil indexation
nevertheless still exists, originating from old long-term contracts that are yet to expire. On the
continent the case is different in that oil indexed contracts still dominate, with hardly any hub-priced
long-term contracts having been signed. However, a number of short or medium contracts do exist
which are either fully or partially hub-priced.
Where gas priced markets co-exist with long-term fuel substitute contracts, there will be a
competition between the two contracted sources of gas. If long-term oil-based contract prices are
higher than the gas hub prices, than it is likely that customers will buy at the hub and try to minimise
purchases at the contract price. This will drive hub prices up to contract prices. If there is a well
functioning, deep and liquid hub, then it is possible the hub price will influence the long-term
contract price.
In the case of the United Kingdom, in a cold winter, we see the interaction of large long-term
contracts with a hub-based market in a supply constrained environment. In this case, the long-term
contract price is likely to be a floor price to the hub with players looking to buy additional gas in the
traded market, driving prices up. Conversely, in an oversupplied market, such as winter 2006/2007
in the United Kingdom, long-term contract holders look for an outlet for take-or-pay volumes and
41
sell on the hub, driving prices down; in this case the long-term contract price is likely to be a cap for
the hub price. The continental markets are mainly supplied on long-term take-or-pay basis, while the
United Kingdom represents a liquid hub. Therefore, the British hub is likely to experience increased
volatility because of this interaction, a trend observable over the year 2007. Such relativity can also
drive storage investment, which can act as a countervailing trend.
Even in the cases where short- to medium-term contracts are indexed to oil, these will be influenced
by the level of the hub-based forward markets. The logic being that even though oil products might
sometimes be a good alternative to gas, if gas can be bought at a hub this will naturally be a perfect
substitute. It can therefore be seen that suppliers will adjust the price level of their oil indexed shortto medium-term contracts, so as to be consistent with the forward markets at the hubs, as this is the
customers best sourcing alternative. If such an adjustment to the price of the long-term contracts is
not undertaken regularly, suppliers will achieve less profit as the customer will only choose the oil
formula when this is beneath the forward hub price. However, the reverse is also true leading
customers to simply source their gas from the hubs either directly or through intermediaries when it
is lower than the contract price.
This same logic dictates that with time even the longer-term contracts in Europe will be affected by
the existence of the traded markets, as the price level of these will have to be inline with the
expectations of the level of future spot prices at the hubs. The mechanism by which the two markets
affect each other should not be new to the markets, as it is in fact quite similar to the reasoning
behind the traditional oil indexed contracts, namely that for customers to have the incentive to use
gas this cannot be priced above the price of alternative commodities (oil products), or – in the case of
hub versus oil indexation – above the price of sourcing the gas at an alternative market place (the
hub).
From the perspective of a producer, who is supplying to the wholesale market, on a traditional oilindexed contract, the situation is different. The industry has long argued that the long-term gas will
be priced by inter-fuel competition. If this is a fact, then a supplier should be indifferent as to
whether he prices his gas at a hub or at an alternative fuel. Furthermore, there could be additional
benefits to the producers of supplying at a hub namely to avoid the opportunity cost described in the
previous paragraph, in the short term. However, the lack of liquid hubs in continental Europe
currently discourages producers from selling at that price. Moreover, the industry has operated on
oil-based prices for more than thirty years and views such a major change in business practice as a
huge risk to its business sustainability. Finally, in the current environment, oil prices are at record
heights. This removes the incentive to the producer to try a different pricing system.
2. Sharing flexibility down the value chain
Traditionally a large share of European supply contracts have contained a substantial amount of
flexibility allowing the buyer a certain variation in his daily, monthly and yearly take. Suppliers have
therefore been able to pay for the physical flexibility provided by the producer’s infrastructure.
OECD Europe has import capacity of roughly 50% more than its yearly consumption.
This flexibility is of considerable value in allowing suppliers to respond to variations in demand, or
even shortfalls from another supplier (e.g. Russia supplying extra gas to Turkey in 2008 when Iran
was unable to meet export obligations), or allowing producers to optimise transit routes. But as
European gas production declines, this flexibility will increasingly come from outside the EU.
As traded markets are being introduced, the value of this flexibility becomes much clearer, the
reason being that flexibility can also be monetised by bringing it to a hub where all users and
suppliers can bid for it. It is important to realise that the change to a hub-based market involves a
large portfolio benefit; instead of every customer contracting for his worst case flexibility needs. Now
all customers can rely on one source of flexibility, potentially quite cheaply, but also possibly at times
at a very high cost.
Most long-term import contracts contain an element of flexibility which has historically been difficult
to price. A move towards hub-based prices thus means that unless flexibility is priced differently in
42
existing contracts, wholesalers will make a profit by arbitraging between the production contracts
and the hubs. This can be done by several methods, either by reselling the flexibility to other
suppliers in the form of traditional gas contracts or swaps, by offering virtual storage services, or
finally by managing the flexibility directly in the market. The simplest strategy when optimising
flexible contracts directly in the market will be to each day compare the contract prices with the
expectations of future spot prices. On the basis of this price comparison, the customers should either
maximise or minimise their daily purchase on the contract and sell or buy the difference from the
market. From the perspective of the flexible producer, the easiest way to avoid this is to sell on a hubbased price. Often however traders will use more refined methods, when optimising, in order to
obtain a certain risk profile, mitigate liquidity concerns, or take advantage of changes in market
volatility.
Because all market participants will be able to see the market value of flexibility, they will be able to
resell any under-priced flexibility in their long-term contracts. This marks quite a change from the
old world in which consumers had no way of selling that flexibility, because they had no access to a
market place. Depending on the amount of flexibility that the producers have available, such a full
scale optimisation can require daily trading of potentially rather large volumes. In order for this
process to happen, the market must be sufficiently mature to be able to absorb the volumes.
Currently only the combined market areas spanning north-western Europe (United Kingdom,
Belgium, and the Netherlands) are sufficiently developed to allow flexibility trading.
Many historical long-term contracts have flexibility clauses. However, valuing flexibility in the gas
markets is notoriously difficult, and underinvestment in this area, such as storage, is inevitable in
these circumstances. In the near future, producers may become more reluctant to sign new long-term
contracts including large amounts of flexibility, preferring to use the traded markets. An important
question arises therefore as to the future distribution of value in the gas chain. The control of
flexibility is likely to move upstream from a situation where such flexibility used to be shared
through these long-term contracts. Therefore, midstreamers would need to invest in storage and
other flexibility instruments, and promoting and using hubs, in order to balance demand profile. In a
perfect market, the cost of acquiring storage capacity would be identical to the cost of acquiring the
same flexibility at a hub. In the European market, it is likely therefore that the role of hubs in
providing flexibility services will increase, but utility companies will be needed to provide flexibility
for small industrial and domestic users and to manage their demand profile.
3. Increased volatility?
An argument often heard against supplying gas at the supply/demand determined prices of the
traded markets, as opposed to oil indexed contracts, is that hub prices exhibit greater volatility. The
implication being that this will be to the disadvantage for the “ordinary” customer as it greatly
increases the uncertainty of his gas bill. Figure 12 shows a standard oil indexed contract where price
changes four times a year against a gas hub price which changes every day. It is understandable why
this argument is raised.
At a first glance it might look as if a customer with a gas contract linked to the daily spot price would
indeed be facing much greater uncertainty as to his yearly gas bill than a customer having a
traditional oil indexed contract. This however is not necessarily the case because the price that the
customer with a hub contract faces can be the average of the spot price over the entire period of his
contract.
The relationship between the customer and the spot price in a competitive market is not dissimilar to
the relationship between the customer and the spot oil price under the traditional price formula. So if
we instead take a historical look at how a given gas customer’s annual bill would have been had he
signed up on a given date for a one year contract indexed to the NBP Day-ahead, compared to a
traditional oil indexed contract, the picture changes somewhat. While it is not possible using only
historical data to deduce anything about how volatility in the future will differ between markets,
figure 13 gives an indication that historically the order of magnitude of volatility between the two
types of contracts does not differ substantially. In both situations, if there is a physical shortage of
43
gas, this has negative consequences for the consumer – either in the form of high prices or physical
interruptions.
Fig.12: Oil indexed price vs. NBP Day-ahead
100
90
80
70
EUR/MWh
60
50
40
30
20
10
0
NBP day ahead
Gas price oil indexed
Source: Heren, industry sources
In fact, many consumer goods are priced on a daily basis and are therefore volatile (grain, steel, gold,
money…). However, end-user customers hardly notice. In fact, on a wholesale basis, the most
volatile of these commodities is electricity, because it cannot be stored and is expensive to produce,
but most customers are billed monthly, quarterly or yearly on the basis of average prices, and hence
only observe moderate changes.
Fig.13: Oil indexed price vs. yearly averaged NBP Day-ahead price
30
25
EUR/MWh
20
15
10
5
0
NBP day ahead year mean
Source: Heren, industry sources
44
Gas price oil indexed
Furthermore, certain customers are able to profit from volatility by varying their demand with the
price level. These price-elastic customers reduce the volatility of prices and therefore increase the
flexibility and security of the system as well. A risk of this daily balanced market is the question as to
who is responsible for long-term security. Both short-term and long-term security measures are
necessary for a well functioning spot market. The real challenge is therefore to design a market that
puts a proper value to security. For example, recent changes to US electricity markets embodied in
the Energy Policy Act 2005 recognise this issue by providing legally enforceable reliability standards.
4. Development of derivatives markets
At a certain level of maturity, more complex “derivatives” markets emerge. These are financial
products based on an underlying asset price which is the price of gas at a hub. This level of maturity
can only be achieved once counterparties are confident that the hub price represents the true value of
gas, then they will base futures pricing and options pricing on the spot market. These derivatives
markets are then used by various companies. An example of the use of derivatives by a company
supplying gas to end consumers might be that it sells gas to these consumers at a fixed price on oneyear contract and then buys the gas back in the futures market. This is an example of “hedging”, or
mitigating price risk by purchasing derivatives (in this example the company is said to be “short” of
physical gas and “long” on derivatives). In general, the derivatives markets are used to modify the
risk profile of a company given its physical assets.
The risk profile that a given company will aim for, and thereby the share of exposure it would like to
hedge, differs between different segments of the industry, and amongst individual businesses.
Traditional producers, most noticeably pure E&P companies, have historically had little desire to
hedge very much of their market risk, and if so, seldom more than a couple of years ahead. Utilities,
on the other hand, will often want to have stable cash flows due to their very different capital
structure, which explains why they have traditionally been the most active users of hedging
instruments, compared to their share of market exposure. However, in the past, gas consumers
(barring power producers and a few others) have been somewhat reluctant to hedge large parts of
their exposure to energy commodities, often because their competitors do not hedge. As the hedging
needs from producers, utilities and customers do not necessarily complement each other perfectly;
banks and other investment entities play an important role in satisfying market needs for derivatives,
by taking risk onto their books, naturally in expectation of a profit.
It is observed that the cost of using derivatives products on an immature hub is higher than the cost
of using such derivatives in a mature market. European gas companies currently have exposure to
the oil markets, through oil-linked gas pricing which allows them to modify their risk profile
through oil hedging: they do not need a mature gas market in order to hedge against a price rise as
they can obtain this insurance through the oil market. As has been seen on the most active hubs TTF
and NBP, forward products will naturally develop at gas hubs as companies’ exposure shifts from oil
to a higher share of spot gas. This will mean that the cost of hedging gas exposure will decrease over
time. Banks and other financial intermediaries will play an important role on this development as
they grow more comfortable with the supply and demand risks of the gas market.
It is however true that trading in oil products can be conducted further into the future, in some
instances out to 10 years, but in general the market becomes very thin beyond 3 years into the future,
as liquidity is reduced. On the NBP, liquidity can also be observed for a maximum of five years and
this can be expected to extend into the future as the market develops further, although again forward
liquidity declines quickly beyond two-three years even for the most liquid hubs.
45
II. Current status of the European gas trading hubs
A. Concept of a gas trading hub
A successful gas trading hub has two basic characteristics: first and foremost it must be possible to
easily move gas into and out of the market, whether the market is defined as a single point or as a
whole area (virtual hub); second, there must be a use for the gas, either through the existence of a
significant customer base, or through the demand from other markets that can be reached from the
traded hub.
An important requisite for a trading hub is the ability for market players to manage volume risk
(swings in consumer or export demand, compared to production or import supply) at a competitive
cost. For a gas marketer, volume risk can be mitigated either by the use of storage or by having a
customer base of a size and mix that matches the supply characteristics; similarly, a gas consumer
will manage his volume risk by purchasing flexibility services from his supplier, or by having access
to storage himself. Most hubs in North America also have access to significant quantities of storage.
Another major element of trading hubs is the legal and financial framework of the marketplace. For
existing markets a number of master trading agreements have developed, most noticeably the EFET
(European Federation of Energy Traders) contract for physical gas trading, and various annexes to
the ISDA (International Swaps and Derivatives Association) contract. These frameworks contain the
basic legal text for most standard provisions, serving as a foundation on which contracts are
negotiated. The negotiation of credit terms in particular is often very time-consuming, as different
ownership structures require different solutions. One way of overcoming such barriers is, instead of
trading bilaterally, to have all trading cleared by a central body, in which all parties have confidence.
The principle behind such a cleared exchange is that all contractual obligations and claims are
directed toward one single creditworthy company, thus paving the way for a setup in which only
one contract needs to be signed with the exchange. Forwards and futures are essential risk
management products within this framework.
If any trading company is asked if they are looking to go into a new untried market, the response
will most likely be, yes if the liquidity is there. Liquidity can be a somewhat elusive concept, since it
incorporates four distinct characteristics of a market namely: depth, breadth, immediacy, and
resilience. Deep markets are ones in which large volumes can be bought or sold without moving the
price excessively, and wide markets are ones in which a large number of different bids and offers are
present in the market. Immediacy on the other hand relates to the ability to trade large volumes in a
short period of time, and resilience to the ability of the market to recover towards its natural
supply/demand equilibrium after having been exposed to a shock. Liquidity itself tends to develop
as market players become more confident in the fairness of a market – and once liquidity increases it
tends to form a virtuous circle.
We can thus summarise the minimum requirements for a successful new trading market as:
o
Access to gas sources, and to customer base.
o
Possibility of managing volume risk for all market participants at a competitive cost.
o
Low barriers to entry for new players, known contractual setup and possible clearing
services, with low transaction costs.
o
Managing price risk, through the market (existence of a forward/futures market).
o
Fairness and transparency, leading to confidence and liquidity.
46
B. Development and access conditions to the European gas hubs
1. British hub
The gas transmission network in the United Kingdom is owned by National Grid Gas plc, the
transport company separated from the British Gas monopoly in 1997. National Grid also owns four
of the local distribution networks, while the other eight are owned by Scotia Gas Networks, Wales
and West Utilities, and Northern Gas Networks. Capacity charges in the distribution networks are in
general offered on a cost basis, but if capacity constraints are expected, auctions can be held. Most
gas at the National Balancing Point (NBP), the virtual British gas hub, originates from the North Sea,
from where it is brought in through one of five the entry points, also known as beach terminals: St.
Fergus, Teeside, Easington, Theddlethorpe and Bacton. Capacities at entry/exit terminals are
allocated in periodic auctions, where both long-term and short-term capacity is offered. Actors in the
market are also free to trade capacity bilaterally in a secondary market outside of the primary
market. This primary market is based on auctions and the fairest way of allocating scarce resource.
The capacity auction process has the added benefit, besides allowing equal access to the network for
all, of providing strong price signals when capacity constraints are experienced by the market. Figure
14 shows the development in price for entry capacity at the Easington terminal: a steep price increase
can be seen in some future winter months. This is a clear signal that the network has not been
upgraded to cope with all of the newly added Norwegian production, some of which will have to go
to the continent instead. This price signal, if strong enough, will naturally give incentives to start
construction of expansion where necessary. Designing a system that allows fair entry, is however no
guarantee for success, as shippers’ ability to move through neighbouring systems, is just as
important.
The majority of gas imports arriving from the Norwegian offshore pipelines are jointly owned by the
oil and gas producing companies in the Norwegian sector through the company Gasled. The
Norwegian state operates the network through the company Gassco which is committed to provide
access to the system on an objective and transparent basis. This means that fair access is provided to
the market participants from the production platforms in the North Sea right into the home of the
local customer, something that undoubtedly has been an important factor in the development of the
NBP into the most competitive and liquid market in Europe.
Fig.14: Entry capacity price at Easington
1
p/kWh log. scale
0.1
0.01
0.001
Auction date feb-2006
Auction date may-2007
Source: National Grid
47
Gas can also be brought into the United Kingdom, at Bacton, from sources outside the North Sea,
namely the Belgian market through the Interconnector pipeline coming from Zeebrugge, from LNG
(Isle of Grain terminal), and from the Dutch market through the BBL (Balgzand-Bacton Line)
pipeline. The Interconnector, which at present is owned by seven different gas suppliers, offers
physical flow in both directions, so that gas can also be exported from the United Kingdom to
Belgium. Some 15 shippers hold primary capacity in the pipeline that was sold on 20 year contracts
(ending in 2018) at fixed capacity charges when construction on the pipeline started in the mid
1990’s. The transfer to other parties of primary capacity, together with the related long-term
obligations, is possible but a rather arduous process. The usual way for third parties to obtain
capacity is through subletting it from primary capacity holders, who against a bilaterally negotiated
fee will allow the access to the pipeline, while still retaining all obligations towards the pipeline
owner Interconnector UK (IUK) Ltd.
When there is transport and entry capacity available, the price difference, or spread between prices
on markets connected should be limited to the cost for transportation. Otherwise traders are able to
arbitrage between the two markets and narrow the price differential. However, when there is
congestion, price differences can be larger.
Because of the extended North Sea offshore pipeline network, many of the North Sea gas fields are
connected both to the United Kingdom and continental Europe. This allows producers to flow the
gas to the highest priced market, creating another link between the United Kingdom and continental
Europe.
2. Belgian hub
The Zeebrugge hub is the main gas trading hub in Belgium, connected to the United Kingdom, to the
Norwegian offshore fields and to the Belgian transit pipelines to France, Germany and the
Netherlands, and receiving LNG. Getting capacity to move the gas east of Zeebrugge however is
much more difficult, in that the major high-pressure pipeline systems running through Belgium to
Germany, Netherlands and France are in practical terms unavailable to third party access due to
their historic role as “transit” pipelines. Currently all capacity in these pipelines is reserved on longterm contracts, which makes more difficult the development of more competitive markets in the
region. If the Zeebrugge hub is often referred to as the one of the most liquid continental hubs, it is
counterbalanced with its inadequate market connection with the continent. In fact, the Zeebrugge
hub price displays close historical price correlation with NBP, and is even priced in British units
(pence per therm) rather than continental EUR per MWh.
There are three other major entry points in the Belgian network: Blaregnies (French border),
Hilvarenbeek (Dutch border) and Aachen/Eynatten (German border). Each of them is connected to
the main transit pipelines and to the distribution networks.
3. Dutch hub
Other markets than the NBP have also benefited from direct connectivity to the North Sea gas fields,
most significantly the Dutch TTF (Title Transfer Facility) which is linked directly to onshore and
offshore gas production pipelines at the Dutch shoreline from British, Danish, German and Dutch
fields. In addition, large volumes can also be imported from Germany, where the Emden/Dornum
area just across the border receives gas from three major North Sea pipelines.
A more direct link between the TTF and the NBP also exists through the Balgzand-Bacton Line (BBL),
which has been flowing gas from the Netherlands to the United Kingdom since winter 2006. The
pipeline has a capacity of 15 bcm per year of which 8 bcm per year is tied up in a long-term contract,
under which GasTerra supplies Centrica in the United Kingdom. Currently the pipeline is not
capable of physical reverse flow. However, gas can flow indirectly from the United Kingdom to TTF
via Zeebrugge using the 6 bcm per year Zebra pipeline. The Zebra pipeline connects the DutchBelgium border point Zelzate to the Dutch high pressure grid and was created in 2001 by two Dutch
utilities (Essent and Delta) to be able to import cheap gas from the United Kingdom.
48
In 2007 Gasunie, owner of the Dutch gas transportation grid, announced a takeover of the
transportation division of BEB in Germany (see below). Gasunie expect this to boost liquidity on both
BEB and TTF, although it will take some years to implement the changes.
4. German hubs
The German market is divided between several transport operators each developing different hubs.
The BEB V.P in north-west Germany, for a long time the most developed, has an entry point in
Emden and receives also gas through the Danish-German Deudan pipeline. It has undoubtedly
benefited from being in the middle of transit gas flows, leading to relatively high natural liquidity,
although fair access to the grid was also a key factor.
Regulators have taken a somewhat firmer stance against other German network owners where hubs
had not developed sufficiently. Observers questioned the commitment of the big regional gas
companies to making the hubs work – Germany has a similar sized gas market to the United
Kingdom, but where the United Kingdom has one market area, Germany had 21 at the start of 2007.
As a response to regulatory pressure, companies have volunteered to merge different parts of their
networks into larger market areas to facilitate trading by third parties. But even though by October
2008 the number of market zones will be reduced to eight, the market remains very fragmented.
Of particular interest are the two market areas, each for a different gas quality, established by the
largest gas supplier in Germany, E.ON Gastransport (E.ON GT). If fair and competitive physical
access terms were to be provided, E.ON GT certainly has the potential to be the future price setter in
the continental market because of its size and the variety of suppliers13. The market area extends
from Emden/Bunde (where important North Sea pipelines makes landfall) eastwards to Frankfurt
am Oder (where Russian gas is piped into Germany from Poland). If in the future the covered area is
extended to the entry point of the planned Nordstream pipeline, the significance of E.ON GT to
European gas markets will only increase. In the south, it brings gas from Russia at the Austrian and
Czech borders and provides an export route to France, while the central area ties the north and south
together and borders Belgium, and by extension, the United Kingdom.
The consolidation/merger of the 21 former market areas in Germany towards just one or two in the
future would, if it could be made to occur, make a significant difference to gas trade in Europe.
However, the availability of capacity in the transmission network to third parties needs addressing if
the ambitions of establishing a truly competitive market are to materialise, otherwise the German
market would still be effectively monopolised and dominated by a handful of companies operating
in their own market areas.
5. French hubs
France currently has five market hubs, four belonging to GRTgaz (transportation subsidiary of Gaz
de France) and one belonging to TIGF (transportation subsidiary of Total). GRTgaz will merge the
three northern PEG (Point d’Echange de Gaz), named North H, West and East, into one hub by 2009.
This will undoubtedly be an important step in increasing liquidity in this important part of Europe,
as the proposed new market area has pipeline connections to Belgium, Germany and Switzerland as
well as access to LNG imports at the terminal at Montoir de Bretagne near Nantes. The expansion of
the LNG terminal at Montoir as well as the planned construction of new LNG terminals, at Antifer
near Le Havre and Dunkerque will require extensive debottlenecking of the network if this import
capacity is to be effectively utilised. GRTgaz therefore estimates investing EUR 3.7-5.7 billion over
the next 10 years, in upgrading its network to be able to cope with greater demand and new import
routes.
The southern part of GRTgaz’s network covers the planned LNG terminal at Fos Cavaou near
Marseille, the existing terminal at Fos Tonkin also near Marseille, and will be connected to both the
13
For a total market of 90 bcm per year, Germany has access to Russian, Dutch, Danish and Norwegian gas, but also to
local production covering 18% of total demand. E.ON GT area has access to all these sources.
49
northern hubs and the south-eastern area connecting the Spanish pipeline system with the French.
Interconnection between the south-western area operated by TIGF, and the south-eastern, managed
by GRTgaz, is however somewhat hampered by the pipeline systems not originally being designed
to interact, making it difficult to move larger volumes of gas originating from the new planned
terminal at Fos Cavaou, northwards in the system. Currently it is also only possible to flow gas in the
southward direction through the Larrau pipeline between France and Spain, making it impossible to
physically import gas from the extensive network of Spanish LNG terminals (capacity 58 bcm per
year). For these reasons GRTgaz and TIGF, are looking at jointly upgrading the infrastructure of the
two areas. If the planned projects are carried out they will considerably improve liquidity in the
southern gas markets. GRTgaz is also looking at expanding export capacity to Italy, transiting
Switzerland, by increasing exit capacity at Oltingue near Basel. It is however uncertain when this
project, which requires the cooperation of Italian Eni CH, could realistically be completed.
The PEG connectivity with both north-west European pipeline gas and LNG terminals in France and
Spain, makes the market areas interesting to a number of different players operating in European gas
markets, whether it be companies looking to arbitrage LNG-pipeline differentials, source gas to other
markets such as Italy, or explore opportunities presented by the French opening of the domestic gas
market. It is therefore not surprising that GRTgaz has more than 30 different companies registered as
shippers, even if still only a small handful of these are responsible for the vast majority of trading at
the PEG.
6. Italian hub
Further east is another market into which gas flows from a large number of different sources, namely
the Italian gas hub Punto Scambio Virtuale (PSV). To the north, Russian gas transiting Austria is
imported, as well as gas coming from the North Sea flowing from France and Germany across
Switzerland. In addition to this, gas is brought into the PSV from the LNG terminal at Panigaglia
near Genoa, as well as further south by two pipelines originating in Algeria and Libya. Bringing gas
into the PSV is however a major problem for new entrants, as virtually all pipeline capacity is booked
on existing contracts with Italian incumbents who have shown a marked lack of enthusiasm to either
expand capacity, or offer unused capacity to new entrants. Recent regulation requiring that 10% of
imports be traded on the hub might improve liquidity and efficiency on PSV.
7. Austrian hubs
The Central European Gas Hub (CEGH) offers a title transfer facility at the location of the pipeline
import interconnections at Baumgarten in Austria. This location is the confluence of the Brotherhood
and Transgas pipeline systems that flow Russian gas to Europe.
A major difference between Europe’s other gas hubs and the CEGH is that all gas flowing into
Baumgarten physically originates from Russia. Furthermore, thanks to its export monopoly, this gas
all ultimately originates from one company: Gazprom. In January 2008, an agreement has been
signed between OMV Gas International GmbH (originally owning 100% of CEGH) and Gazprom,
giving the Russian company a 50% stake in the Austrian hub. Both shareholders stated the aim that
CEGH will become one of continental Europe’s most liquid hubs. Although there is only one source
of gas at the CEGH, there are many destinations, meaning that it has the potential to become a
buyer’s hub. Gas can be moved away from Baumgarten by the TAG pipeline going to Italy and the
WAG pipeline going to Germany. Due to the supply situation, most of the trading takes place
around the flexibility of existing long-term contracts held by established European suppliers.
Traditionally most of the volumes traded at the hub have been bought by players looking to flow gas
to Italy.
While Baumgarten holds great importance as a transit point for large volumes of Russian gas, it is
not at all clear if the ambitions of the CEGH of becoming one of the big liquid European hubs can be
fulfilled in the absence of significant suppliers to the market other than Gazprom. Figure 15 shows
the development of volumes transferred at the facility from the gas year 2005 until May 2007. While
it appears that volumes have increased steadily over time some caution should be exercised when
50
drawing conclusions from this data. Higher volumes traded in the summer could be due to
optimisation of flexibility in the incumbents’ contracts. A year on year increase in activity from 2005
to 2006 is likely due to unusually mild weather which caused unused flexibility in incumbents’
contracts to come to the market.
Fig.15: Volumes traded at European hubs14
140.0
+35%
120.0
+44%
BCM / year
100.0
80.0
+42%
60.0
+59%
40.0
20.0
0.0
2003
2004
2005
2006
2007
2003
2004
Traded volume
Zeebrugge ('00)
TTF ('03)
PSV ('03)
2005
2006
2007
Physical volume
PEG's ('04)
BEB ('04)
CEGH ('05)
EGT ('06)
Source: based on TSOs published data
8. Russia’s traded market
The majority of gas used by Russian industrial customers is bought from Gazprom at regulated
tariffs, the exact price depends on which of the 13 price zones the customer is located. Regulated
prices net of VAT for 2008 are expected to be around 35 euros per 1000m3 for residential users and 45
euros per 1000m3 for non-residential users. As these prices would be unsustainably low in an open
market, gas is rationed by only allowing each customer to buy a certain volume. The principles that
Gazprom uses to allocate extra quotas are rather opaque. If a customer has a need for more gas,
traditionally he has two options, either to ask Gazprom to raise his quota, or, if pipeline capacity is
available, to purchase the gas from some of the independent producers at non-regulated prices. The
regulated price is the lower one and acts as a floor to the non-regulated price.
In November 2006, Gazprom through its 100% owned subsidiary Mezhregiongaz (MRG), introduced
an additional way for industrials to purchase excess gas: via auctions. Initially monthly auctions
were held for front-month deliveries, but later the schedule was expanded so now auctions are held
every 10 days. For the first year a total of 10 bcm were planned to be auctioned off, with 5 bcm
supplied by Gazprom and 5 bcm by independent producers out of total Russian 2006 gas demand of
453 bcm. After this it will be assessed whether the auctions are to continue and whether the yearly
volume is to be increased. Customers can bid on gas delivered at three different compressor stations
in western Siberia, namely Nadym, Yuzhno Balyksky, and Vyngapurovskoye, through the
“Electronic Trading Exchange” (Elektronaya Turgovaya Ploshchadka – ETP). About one day before
each auction MRG publishes how much spare capacity Gazprom has in its pipelines running from
the three delivery points to the exit zones in which the customers are located. This capacity is then
allocated together with the gas to the successful bidders. Since its inception prices at the exchange
have been around 120%-140% of the regulated prices, making the state of under pricing clear.
14
In case of PSV, CEGH and BEB only the physical volumes for only the last years were given, while for PEG’s no
physical volumes were given. The missing physical volumes had to be estimated. The physical volume (often also the
physical throughput) is the amount of gas delivered through the hub at then end, while the traded volume is the amount of
gas that has been traded. Because gas can be traded more often before finally delivered, the traded volume is higher than the
physical volume. The churn ratio represents the amount of times gas is being traded before it is delivered. Therefore the
traded volume divided by the physical volume equals the churn ratio.
51
Fig.16: Evolution between TTF and ETP month-ahead prices
30.00
25.00
Euro per MWh
20.00
15.00
10.00
5.00
0.00
ETP
TTF Month ahead
Source: based on Heren and industry sources
Even though such a market consisting of weekly auctions completely dominated by one single player
seems very far from the more liquid gas hubs of Western Europe in terms of market design,
Gazprom’s reasons for launching the ETP are relevant for these markets as well. First and foremost it
is of importance to Gazprom that the current situation where gas is priced below the market is
addressed, since both over- consumption and under-investment will result. This is consistent with
the current policy of removing all price regulation for the industrial sector by 2011, thus bringing
prices up, on a net back basis, to the level charged for exports to the rest of Europe. Such a move will
also end the current situation where domestic demand cannot be met but has to be rationed, as well
as increasing the general efficiency of the industrial sector by the abolition of artificially low prices.
Whether it will be possible to remove all subsidies within the relatively short time horizon without
creating unacceptable disturbances to the local economy is another matter, but it is worth noticing
that the “net-back” price is exclusive both of transport out of Russia, and crucially export duties
(which are currently 30% of export revenue), so even when prices are fully liberalised within Russia,
gas will still be markedly cheaper domestically compared to delivered export prices. Secondly
Gazprom considers a market based price important in order to give signals so as to “more accurately
identify industry’s real gas needs15”. This last argument is very similar to the idea that the existence
of traded hub-based markets will provide price signals as to where and when production and
infrastructure investments are most needed.
The future success of the ETP as a competitive market place for gas depends on whether more
volumes will be committed to the exchange in the future, as well as on which terms the independent
producers will be allowed to compete against Gazprom, notably concerning pipeline access. For the
exchange determined price to be robust enough to be used as the benchmark for gas contracts within
Russia, Gazprom estimates that 5% – 10%16 (33 to 66 bcm per year) of the industry’s output should be
traded at the ETP.
15 Source: http://eng.gazpromquestions.ru/index.php?id=19 (May 2008)
16 Idem
52
C. Other properties of European hubs
1. Geographical span and capacity constraints
Historically there have been two very different ways of defining the geographical span of a traded
commodity market. One way is to assign delivery at a very specific physical point such as the nexus
of two pipelines. This is seen in physical hubs such as Zeebrugge, which is defined as being the
location within the Fluxys landing terminal of the Interconnector in Zeebrugge (IZT). While it may
seem logical at first glance to limit delivery to a specific point, this will imply the necessity of having
many such points within a given network. If gas trade within a region is conducted at many different
geographical locations in the transportation system, then gas in fact ceases to be a fungible
commodity (because the number of products that companies need to be able to trade is multiplied).
The more the market is sub-divided, the more that liquidity is diluted, meaning that market zones
become more susceptible to manipulation by key players at those points. In other words, defining a
commodity market too narrowly reduces what is often seen as its prime benefit – a commodity
should be a specific standardised product concentrating liquidity and leading to confidence in the
validity of its price. Alternatively, if commodity prices are to mean anything in the real world, they
must carry some locational information. Therefore, there is a balance to be made between defining a
market so tightly that the locational information is perfect, but liquidity is low, and defining a market
so loosely that liquidity is high, but the price gives less useful supply, demand and location signals.
When the UK market was liberalised there was a debate as to whether trading should occur on beach
terminals (physical points) or at a virtual point. In the end the advantages of having one single
market outweighed those of “real” locations, and the NBP was created, the principal reason being to
ensure liquidity.
Fig.17: Map of Zeebrugge area
Source: Fluxys
When looking at the Zeebrugge area map (figure 17), it should be obvious how some further
aggregation of delivery points in the area was needed. In the limited geographical area around the
Zeebrugge harbour, three different pipelines connect with the transmission system, one being the
Interconnector at the IZT defining the actual hub, and the other two being the landing terminal of the
Zeepipe pipeline (ZPT) and the LNG terminal, thus defining three unique but often highly correlated
markets. This system means that if for instance an LNG cargo arriving at the terminal is to be flowed
by pipeline to the United Kingdom, capacity has to be booked beforehand not only at the terminal
and in the Interconnector, but also from the LNG terminal into the IZT. Huberator, the company
running the hub (fully owned by the Belgian TSO Fluxys), has realised this difficulty and has
therefore simplified this complex situation by creating the ZEE Platform Service, expanding the
traded hub to the two other pipeline points. Under this new service agreement, shippers will have
the right to unlimited transfer between all entry points (Interconnector terminal, Zeepipe terminal,
53
LNG terminal and the Zeebrugge hub) without needing to book capacity separately, by paying a flat
monthly membership fee plus a certain usage fee for volumes effectively transferred. From February
2008, Huberator offers such unlimited capacity transfers in the Zeebrugge area. Expectations are this
will further increase liquidity. The demand and supply of capacity at the three specific points, being
un-transparent to the market, will be replaced by a price signal representing the Zeebrugge hub as an
entity and not by physical flows
The opposite method to determine where delivery is to take place is by legally defining a “virtual
point”, a non-physical point through which all gas in a particular transmission network must flow.
This is the case for the British NBP that spans on the whole of the national transmission system. The
NBP is the theoretical point through which the operator requires all producers to sell and all buyers
to take delivery in the United Kingdom’s network of transmission pipelines. The advantage of such
system is that gas becomes a completely standardised commodity having a uniform price no matter
where it is delivered within the domestic transmission system. An evident obstacle of this design is if
a bottleneck emerges within the transmission system, this could have the potential to force the TSO
to reduce capacity in the entire system, instead of only in a specific part of the pipelines. There are
several indirect ways in which National Grid can manage such bottlenecks, including its own actions
to buy capacity. It is also possible to scale up and down available capacity into the system from the
different points receiving domestic production or imports, or into the twelve local distribution zones.
National Grid can closely monitor the degree of congestion, optimise system operation, debottleneck
with smarter investments, and invest to meet growing transport demand, thus overcoming some of
the weaknesses of the “postage stamp” transport pricing system.
The geographical span of the Dutch TTF is designed similar to the NBP, being however more
complex with 50 separate entry points into the system and 1100 exit points, compared to the NBP 8
entry and 14 exit points. Moreover, there is only limited access to quality conversion facilities, subdividing the Dutch gas market between the historically important Groningen gas and that from other
sources. This means that the design of the Dutch gas market in reality is somewhere in between the
virtual NBP and the physical Zeebrugge hub, with respect to standardisation and ease with which
gas can be moved to different parts of the system.
When assessing capacity constraints in traded markets, two different aspects are equally important,
one is capacity into and out of the geographical area that the market spans, the other is capacity from
the traded market to local consumers, usually connected to the distribution network. Also it is not
enough only to look at whether unused pipeline capacity is available, but just as much whether this
spare capacity is offered equally to all market participants on a fair and competitive basis.
2. Balancing regimes
As actual physical gas supply and demand can vary more rapidly than the timeframe in which
commercial action can be taken, all markets may experience imbalances. These can be caused by
various factors, e.g. a rapid demand variation, a pipeline disruption, an upstream problem, or a
downstream interruption. As imbalances are a normal feature of markets, it is necessary for network
operators to have some flexibility to ensure that the pressure of the system they manage is kept
within its physical constraints.
Any balancing action by the TSO incurs costs to the system; therefore it is better for the TSO to
operate in an environment where all major market participants are actively incentivised, through the
market design, to have balanced portfolios. In this way, it is only in a minimum of events that the
TSO should step in and take balancing actions.
In Europe two different time frames, or balancing periods, exist for dividing the balancing
responsibilities between the TSO and the other actors in the market. Most TSOs require daily
balancing, meaning that the each shipper’s flows into and out of the system must be balanced by the
end of the gas day. Within each day, it is the responsibility of the TSO to balance the system. There
are however a few countries, most notably Germany, the Netherlands, and Austria (for its domestic
system), which require hourly balancing. The advantage of hourly balancing is that it makes those
customers who have high intraday variability in their demand pay for it, instead of spreading the
54
costs across the whole market17. But there are major drawbacks of having hourly balancing periods:
firstly, that it further subdivides liquidity on the market by splitting the commodity in time rather
than in geography; and secondly, that it requires the actors on the market to hold a substantial
portfolio of hourly flexibility. For new entrants without a substantial supply portfolio, the only way
to achieve this is through purchase of high deliverability storage in the market zone, which
represents a significant barrier to entry.
As mentioned before, imbalances are a fact of life for the gas industry. Indeed, on a small scale, it will
be impossible for physical actors in the market to be fully in balance all the time even if there are no
unexpected events. Recognising this, TSOs in general allow shippers to be out of balance within
some small technical tolerance, which usually is defined as some percentage deviation in total flows.
These imbalance tolerances are charged for the hour (where hourly balancing applies), day and
month. Most often there will also be limits not only on imbalances within the different time periods
but also on the cumulative imbalances. In some cases the TSO offers to sell additional tolerance
services to shippers, such as Energinet (the Danish TSO) does at its GTF (Gas Transfer Facility). Most
commonly, however, requirements for additional services can be met by purchasing unused
tolerance services from other shippers. In some instances imbalances can also be traded amongst
shippers. For example, in Belgium, this can only be done in advance, whereas other TSOs, such as
National Grid in the United Kingdom, allow system users to net off imbalances with other shippers
retroactively.
Box 6: Cash-out balancing mechanism in the United Kingdom
National Grid is balancing the United Kingdom gas grid through the traded market. If a shipper at the end of
the day has injected too much gas in an over-pressured system, he will be penalised by receiving a relatively low
price for the extra gas (below the average of the within day deals on the market), giving the shipper an incentive
to balance its portfolio. The same applies when at the end of the day a shipper has injected too little gas in an
under-pressured system, he will have to pay a relatively high price (higher than the average of the trades) for his
shortfall.
National Grid on the other hand rewards shippers that are ‘helping’ keep the system in balance. Shippers who
at the end of the day, injected gas above their obligations in an under-pressured system are rewarded as are
shippers who injected gas below their obligations in an over-pressured system. To ensure that shippers can
respond to this incentive, National Grid posts the pressure of the system to all shippers very frequently
throughout the day, allowing shippers to undertake balancing actions, in the hope of being cashed out at a
higher price than the within-day price. This arrangement means that the shipper destabilising the system will
lose money because of his imbalance, but that the loss will be proportional to the cost of rebalancing the system,
while the shipper rectifying the system imbalance may earn money for his actions. When during the day the
system becomes too much over- or under-pressured, National Grid also has the option to rectify imbalances by
buying or selling on the electronic OCM market which is also open outside ordinary office hours.
The TSO can thus to some extent be seen as a form of market maker for within-day gas because it is
acting in the balancing market at the end of the day to cash out shippers with imbalances, or during
the day if the aggregate system imbalances become too important. This approach provides liquidity
to the within-day market, and ensures shippers that in the event of unforeseen imbalances these can
be rectified at near market prices.
3. Storage services
The most successful hubs offer a degree of flexibility services, most often in the form of gas storage.
The hub operator can offer additional services like short-term parking and loaning of gas. The
fundamental demand for storage in any gas system comes from the high variability in daily and
seasonal demand for gas compared to the usually limited flexibility in gas production.
17
Power generators benefit from this aggregation as they can quickly increase gas use to respond to peak power needs,
while the whole gas market pays for their hourly demand variations.
55
The amount of available storage varies greatly from hub to hub in Europe, but as markets are
increasingly interconnected, the amount of flexibility available at a current point is likely to be
affected by nearby storage beyond the country or regional borders. One example of such intermarket exchanges of storage has traditionally been seen between the Dutch TTF and the German BEB
V.P., where in summer gas has flowed from TTF into German storage to be withdrawn again in the
winter. This has historically resulted in the BEB trading at a premium to the TTF in summer and at a
discount in the winter. Another example is the interaction between the CEGH and PSV, where gas
stemming from excess flexibility in Russian supply contracts going through Baumgarten, where
there are large storage facilities, has been bought by Italian companies for use in the PSV market
area. As the Italian use of gas for electricity generation increases, it can be expected that flexibility
increasingly will be exchanged not only through physical gas flows, but also through the power
lines. Gas and electricity sectors may provide flexibility for each other, with important implications,
if there are mismatches between the ways in which the two markets work.
When an area with prices mostly based on the traded market, such as the United Kingdom, is
interconnected with an area mainly priced on long-term oil contracts, such as continental Europe,
this can have particular implications for the use of storage. In times of a gas shortage with supplies
from long-term contract being insufficient, the continental utility has the choice to either get more
supplies or to interrupt customers. Because of existing public service obligations utilities have a
strong preference for increasing supply, even when it is highly priced. This can be seen from the
winters of 2004-2005 and 2005-2006, when the NBP acted as a supply of last resource for continental
utilities. The volumes being relatively small, the continental utilities have been able to add the high
priced gas in their portfolio with a small overall price increase averaged over their supply portfolio.
However, the action of these companies on a nearby hub can have quite a dramatic upward effect on
price volatility.
The introduction of seasonality and short-term volatility into prices through trade at hubs gives a
clear incentive to companies to develop storage facilities which allow delivery to and from the hubs.
However, it is difficult to base business decisions on these prices if a lack of transparency makes it
difficult to see the fundamentals behind them. In the case of the United Kingdom winter 2005-2006,
the behaviour of continental utilities was not based on fundamentals that the market could assess,
due to lack of transparency. Therefore, it would be particularly risky to build storage in the United
Kingdom in anticipation of the event repeating itself.
Market players’ access to storage services varies greatly from region to region, both in terms of
transparency of rules and regulations, and in terms of the amount of uncommitted capacity
available. Although the amount of storage is small relative to demand and in absolute terms, the
United Kingdom has the most liquid market for storage services. A number of different gas storages
exist, the biggest being the Rough storage owned and operated by Centrica Storage, which is under
common ownership with Centrica Plc, and therefore subject to strict regulation. Under the terms of
British regulations, Rough storage services are offered to the market both through periodic auctions
and on the secondary market. Standardised storage packages, also known as “Standard Bundled
Units” (SBUs) made up of injection and withdrawal capacity are traded freely amongst market
participants. The number of users, who own capacity rights for the Rough storage (39 in 2006), is an
approximate indication of its high level of accessibility for third parties to acquire flexibility at the
NBP. This number is markedly higher than for access to storage in continental Europe, with the
exception of Italy’s Stogit. Stogit operates a storage volume nearly five times the size of Rough on
behalf of similar number of users. In the market areas where only a handful of companies have
access to a given storage, naturally a secondary market for storage services will be practically
nonexistent. It is particularly important in the case where few companies own the majority of
storage, that storage is accessible (perhaps as an entry/exit point) from the hub itself, in order to
facilitate access for new players.
One significant problem for new entrants who try to gain access to flexibility in continental Europe is
the lack of harmonisation and transparency of rules and regulations to which different storage
operators are subject. This is particularly important in the case where storage is used across borders.
Another prevalent problem is that companies in some markets are given incentives to hoard storage,
56
in particular by the penalising balancing regimes described earlier. Hoarding of capacity is further
exacerbated by the majority of storage capacity being booked by long-term contracts.
Proper congestion management can somewhat alleviate this problem by offering interruptible
capacity, so that physical utilisation of the storage is maximised. In some markets the so called
“rucksack principle”, well known from transport capacity allocations, has been utilised. A supply
company who gains a new customer inherits storage services from the former supplier – the storage
services are said to be carried with the customer like a rucksack. Such redistribution methods can be
used to kick start competition in a largely closed market, but it should be realised that they are not
market-based mechanisms. In a rucksack system, the amount of storage in the rucksack carried by
each customer must be administratively managed.
In conclusion it seems clear that a significant problem with storage availability in Europe is that the
majority of continental storage is reserved on long-term basis, exempted from third party access or
unregulated. Whilst it is not a necessary condition for all storage to be regulated, it is clear that
storage is essential for gas markets to function effectively. Those markets in which it is not necessary
to regulate storage should be readily diagnosed by the variety of owners and operators and their fair
and transparent sales methods. As the production flexibility declines with gas output, greater access
to storage will become necessary. This change in production capability will make reform to storage
markets even more urgent.
4. Preferred framework contracts / Master trading agreements
Commodities trading is characterised by many agents conducting a relatively large number of small
block trades in standard products. Therefore a contractual framework suited for this purpose is
needed in order to define the terms of the trade, and the nature of the standard product.
Where trading is conducted through an exchange, the exchange will most often require that all
members sign up to a uniform contract drawn up specifically for that exchange. This is one of the
main advantages of trading through an exchange, since it means a minimum of contract negotiation
is required, and with a single counterparty only, namely the exchange. Having only the exchange as
counterparty also greatly simplifies the task of managing credit exposure. This is because the
products traded on most exchanges are futures, which are financially settled daily, as opposed to
forward contracts where payments are conducted after delivery. With strict margin requirements,
day to day changes in credit exposure are therefore limited. Furthermore the credit exposure that
does remain will be with a single counterparty, namely the clearing house, which most often will be
a top rated bank. Especially in the trade of contracts for delivery several months or years into the
future, credit concerns are particularly important to address.
Most trading on gas hubs takes place OTC (over the counter), whereby two companies enter into
contracts on the basis of a bilaterally negotiated framework. This means that framework contracts,
also known as master trading agreements, have to be negotiated with all counterparties with whom a
company wants to trade. As these contracts have to govern all legal aspects of gas trading (gas
quality, payment terms, credit provisions, force majeure clauses, etc.) their negotiation can be a rather
cumbersome process. A number of standard contracts exist, enabling trading arrangements to be
drawn up from a menu of standard clauses. As companies are increasingly being active on more than
one market, there is a gradual shift towards contracts that, by adding standardised appendices, can
be used on multiple markets.
The standard contract of the International Swaps and Derivatives Association (ISDA) has been long
favoured especially by banks and other financial institutions. The ISDA initially focused purely on
financial derivatives now has appendices for physical gas trading at the NBP and ZBT, as well as for
a number of other commodities on different markets. Since many established companies already
have ISDAs in place with several banks for other purposes, when they enter into hub-based gas
trading they can just add the relevant annex. When entering into master trading agreements with
other energy companies, most will however prefer the standard contracts drawn up by the European
Federation of Energy Traders (EFET). As the name suggests these are tailored specifically to the
trading of energy commodities, primarily natural gas and electricity. As the EFET has published
57
appendices for the most developed gas hubs in Europe (NBP, TTF, ZBT, PEG and PSV), these will
suit the legal needs of most short-term trading between energy companies.
5. Trading platforms
A number of different trading platforms exist for the different gas hubs of Europe. These can be
divided into exchanges and brokered markets or bilateral without a broker. As will be described in
the following each method has its own characteristics and therefore own usage (see table 1).
All exchanges in Europe offer an electronic trading platform where traders can post bids and offers.
For example, in the United Kingdom physical futures trading takes place for month ahead and
forward on the Intercontinental Exchange (ICE), while within-day and day-ahead trading is
conducted on the APX Gas UK (APX). A similar setup exists for the TTF where the ENDEX exchange
offers curve trading, while day-ahead trading can be done at the APX Gas NL.
Most trading within the brokered market is conducted as OTC forward trading. Brokers offer
electronic platforms similar to those of the exchanges, they also complement this with voice
brokering (over a telephone line). One major difference between the exchanges and the brokered
market is that at the exchange it is possible (in principal) to accept any deals, while in the brokered
market, the only deals allowed are with a counterparty with whom a master trading agreement
exists. This means that the situation can arise where a company cannot trade at the best price in the
brokered market, simply because it does not have a contract with the counterparty. As it is in the
interest of all market participants to have as much liquidity (and speed and low transaction costs) as
possible, in the most liquid markets (NBP, TTF and ZBT) it is possible to get some other party to
“sleeve” the deal. This means that a third party, with which both companies have a master trading
agreement, acts as middleman. This is done on an entirely voluntary basis, and has the potential to
increase the credit exposure of the third party. Another possibility is to “give up” the trade to an
exchange if one offering this service is active at the current market. The disadvantage of this
approach is however that the transaction cost of conducting the trade increases, as it will now
include fees to the broker, the exchange and the clearing house.
Another substantial difference between OTC trading and on an exchange is that an exchange-based
market guarantees anonymity of buyer and seller. The bilateral nature of the contracts employed in
the brokered (OTC) market means that the buyer or seller will have to reveal his identity to the
counterparty when a trade has been conducted. While this is a disadvantage for some individual
players who want to hide their actions, it also creates increases the transparency in the market.
While exchanges are popular for standardisation, the brokered market is popular because it makes it
possible to gauge the market for interest in rarely-traded products. This is particularly valuable for
new markets, in which there is lower liquidity and perhaps less confidence in where the over all
price level should be (an example might be hourly within-day gas at the TTF).
Finally there is of course the opportunity for a trader to call directly to another company with which
a master trading agreement is in place. While this method is only used in a minority of the trading on
the most liquid hubs, it is more prevalent at the less liquid ones. It is also something that can be
necessary if a change in position occurs outside normal office hours, for instance as a result of
interruptions.
6. Transparency
The concept of market transparency covers a wide area of subjects, from information about how the
industry decision making process functions, to accessibility to rules and regulations covering the
different market areas. Here the focus however will be on two important basic aspects, namely price
and physical flow information. Observing prices and physical flows not only gives a snapshot of the
immediate state of the market, but also an important overview on storage levels, congestion points in
the network, flexibility of supply/demand, and potentially signals as to where future investments
are needed.
58
a.
Price transparency
A number of daily publications provide price assessments for the European gas hubs (ex. Argus,
Heren, Platts). The published assessments are an attempt to describe the price levels at a specific
point in time, most often 16:30 GMT. This cut-off time is often referred to as “the close” even though
there is no formal closing time of the OTC markets. Many supply contracts exist in which the gas
price is indexed to these published price assessments, so some actors will have an interest in where
the price stands exactly at the close. At the most liquid hubs, such as the NBP and the TTF, there can
therefore be a flurry of trading conducted in the minutes leading up to this point in time.
It is argued that certain market players, either buyers or sellers of an index, might have an interest in
manipulating the published prices by misreporting trading to the daily price publications. However,
the most popular publications have become more or less industry standards, implying a general
interest in having reliable published prices. Potential monitoring between traders on reported prices,
as well as auditing of the prices used to value the trading portfolios, particularly at important times
in the year (end of the month and of the year), provide good reasons to be confident that the
published prices in general are a good representation of the market.
For the day-ahead market at the TTF, another source of information on OTC trades exists, namely the
price indices published by the London Energy Broker’s Association (LEBA). The “day-ahead index”
is the weighted average of all trades brokered, between 08:00 and 17:00 GMT by ICAP, Spectron and
Prebon, who between them account for nearly all brokering at the TTF. LEBA also publishes a “dayahead window index”, being the volume weighted average of all day-ahead trades conducted in the
time between 16:20 and 16:30 GMT.
Fig.18: Difference between the close day-ahead TTF and the LEBA day-ahead index
30
25
20
EUR/MWh
15
10
5
0
01-Jun-06 01-Aug-06 01-Oct-06 01-Dec-06 01-Feb-07 01-Apr-07 01-Jun-07 01-Aug-07 01-Oct-07 01-Dec-07 01-Feb-08
-5
-10
Heren
LEBA
Delta (Heren - LEBA)
Source: Heren, Leba
In general there is better transparency on price levels for those trades done on exchanges, since all
participants can see all prices that are published and all trades that happen. The exchange will also
publish settlement prices for all tradable contracts, often complementing this with information about
the volumes traded.
In general therefore, there is abundant information on the level of prices and to some degree on the
dynamics of price formation in both exchange and OTC markets, which are of course related18. There
18Exchange prices for a future period will be similar to, but not necessarily the same as, forwards prices for the same
period. The difference is due to the nature of the contracts. With the OTC market, profits or losses on trading are realised at
a time in the future which corresponds with the period traded, while exchange traded profits are paid out once the deal is
closed. The difference in valuation of a future period should therefore be calculated factoring in the cost of financing. This
difference is clearly small for month-ahead contracts, but can be substantial for several years in the future.
59
is however an extra layer of information available to the most active players on the OTC markets
about the trading patterns of the different companies in the market. This is quite exclusive in that it
can only be learned through being present in the market continuously and actively with a large
number of counterparties.
b. Physical flow transparency
The level of information on physical flows differs widely from market to market despite the fact that
EC regulation (No. 1775/2005) sets out some minimum standards on the publication of flow and
capacity information. Notably, TSOs are required to publish capacity information such as: maximum
technical capacity, total contracted and interruptible capacity, and available capacity on a regular
basis. Often TSO limit themselves to the publication of “historical maximum and minimum monthly
capacity utilisation rates and annual average flows at all relevant points”. Furthermore pipelines
with less than three capacity holders can have exemption from the transparency requirements, under
the so called “three shipper rule” issued from the EC regulation mentioned above.
The lack of firm unified regulation means that the amount of information on physical flows differs
widely across the traded markets. The most advanced TSO with regards to publication of flows is the
National grid, that every 12 minutes publishes physical flows on the Internet for all entry points into
the NBP with a two minute resolution. Also available to shippers daily is detailed information on the
flows out of the NBP at the exit points. On the opposite end of the spectrum is a large part of the
markets in Germany, where for instance information on physical flows from Poland into Germany is
only available to the few capacity holders; it is unavailable to all others, including governmental
agencies. The available information on the other traded hubs in Europe in general tends to be at best
monthly information again most often only for points with more than two shippers, thus excluding
important transit and import pipelines.
Table 1: Comparing trading platforms
OTC
EXCHANGE
BILATERAL WITHOUT BROKER
One agreement with
the exchange
An agreement between the
companies is needed
METHOD
An agreement between the
companies is needed (or use a sleeve)
Through broker – either Electronic
platform or voice brokering
Electronic platform
Personal contact
COUNTERPARTY
Other company
Exchange
Other company
Medium
High
Low
TRANSPARENCY
Good, different publications on end
of day prices
High, information
given by the exchange
None
ANONYMITY
Company has to reveal it self to other
company after deal
Anonymous
MAIN USAGE
All products
Most liquid products
Framework contract
One agreement with
exchange
CONTRACTS
TRADING
TRANSACTION
COSTS
TYPE OF
AGREEMENT
Source: IEA analysis
60
Before deal companies
already know others’
identity
Illiquid products and large
volumes
Bilateral contract
Chapter III – The Crystal Ball – What could the
European gas market look like?
I. The North American example of a competitive gas market
Liberalisation in the North American gas market started in 1979. A highly competitive market has
evolved along the whole value chain. The first part of this chapter will examine how the North
American market is structured, policed and operated, with particular focus on the drivers for new
investment. This study is relevant because the future of the European gas market is often described
in terms of the current North American gas market. We have to emphasise, however, that the
European gas history fundamentals are vastly different from those found in North America. In the
second part of this chapter – workable EU competition – we will address how competition can
actually develop in the EU, taking into account these differences.
A. The process of deregulation in the IEA North American markets
1. Overview of the IEA North American gas market
The North American market (US and Canada) consumes annually 770 bcm compared to 540 bcm per
year in IEA Europe. As a whole, North America is almost self-sufficient, but there is considerable
trade between its component parts – overall, the US imports around 14% of total consumption from
Canada, although the trade is not unidirectional as the north-eastern US exports gas to Canada.
Before the market was opened to competition, the gas delivery chain had a linear structure which
was not dissimilar to the one which has evolved in Europe. E&P companies produced gas, sold it to
inter-state pipeline companies, who in turn delivered it to the city gate and sold it to the LDC (Local
Distribution Company), who then sold it to the end-user.
The deregulation of the market meant that the roles of the market participants were changed, most
significantly the role of the pipeline company. Their role changed from marketing and transportation
of gas as a single service, to gas transportation alone. Nevertheless, it was recognized that the
expertise of pipeline companies in managing gas transactions as well as in balancing supply and
demand would somehow have to be carried over into a structured marketplace. The principal of
market centres was proposed. These centres were to be places where services could be provided to
customers so that they might manage their own portfolios of supply, transportation, and storage. The
federal regulators promoted the concept of the market centres, but left it up to the actors whether to
make use of it. Largely due to the key pieces of regulation, which are discussed in the next section,
the concept caught on. The North American gas market is now traded as a system of “hubs and
spokes”, in which balancing is done at market centres, with pipelines connecting them.
In this new market structure, the market centres manage information flows, producing real-time
prices of gas. These prices act as the mechanism of coordination in the market, allowing many
specialist companies (including new participants) to emerge. Information which had traditionally
been kept inside several vertically integrated companies was available to all players on equal terms,
allowing maximum opportunity for the use of resources. This part will describe the North American
market by looking at each actor and their interaction with market hubs.
2. The deregulation of the North American gas market
US wellhead price regulations were put in place in 1954 with the Supreme Court’s Philips Decision,
meaning that gas destined for inter-state consumption would be produced at government
determined prices. Intra-state regulation remained the prerogative of the individual states. At nonmarket based prices, gas did not respond to the realities of the changing US energy market. In the
early 1970s, oil prices rose dramatically, but gas prices remained low, driving gas demand. As
61
demand increased, the gas supply was unable to keep up. At the same time unregulated intra-state
gas buyers in production regions of Texas and Louisiana were able to outbid regulated tariffs for the
scarce gas, intensifying the shortages on the inter-state market to the north.
At the moment that oil prices started to rise, in the early 1970s, Canadian prices were still
unregulated. As a result of the gas shortage in the price-controlled US market, more gas was bought
in Canada. The export price of Canadian gas increased, leading to higher prices in Canada than in
the regulated US market. To avert this, Canada decided to regulate its gas prices in 1975 and have a
single border price for exports to the US (Petroleum Administration Act). The regulated gas prices
were tied to crude oil prices, export prices were permitted to exceed domestic prices, and the export
price premium had to be distributed to all Canadian producers, even the ones that did not have
export contracts.
From 1980 the Canadian government became the sole exporter of gas. The government ‘bought’ the
gas from the producers, exported it and divided the rents pro-rata to each seller according to his
production. After the deregulation of the gas prices in the US in 1979, with the Natural Gas Policy
Act of 1978, gas prices increased and gas demand fell. As a result it became difficult for Canada to
maintain the regulated tariff and it was decided to deregulate gas prices in 1985 with the Halloween
Agreement.
It would take different Federal Energy Regulatory Commission (FERC) and National Energy Board
(NEB) orders before the gas prices in North America were finally deregulated in 1993. The most
important orders are:
o
(US) 1979 – Natural Gas Policy Act of 1978: wellhead price controls were removed through a
‘partial de-regulation’ of wellhead prices. Because of a gas shortage at the time, this act was
meant to give incentives for new production, but also to reduce the intra-state purchasing
advantage by placing it under pricing regulation. The old contracts would stay under
regulated tariffs (in 1993 `The Natural Gas Wellhead Decontrol Act of 1989’ repealed the
remaining price regulation), but new contracts were partially or completely deregulated.
o
(US) 1984 – FERC order 380: removed contractual minimum bill obligation. The pipeline
companies had long-term sales contracts with a minimum bill obligation (referred to in
Europe as a Take or Pay commitment). This order was put in place against a background of
rapidly falling gas prices, but consumers not being able to make use of it because of the
minimum bill obligations in their existing contracts. The removal of this obligation allowed
buyers to buy the cheapest gas and escape their commitments for the more expensive gas.
o
(Canada) 1985 - Agreement on Natural Gas Markets and Prices (often called the `Halloween
Agreement’): deregulation of gas prices. The system of a price regulated Canadian market
and a deregulated US market became difficult to manage and Canada decided to deregulate
the gas price (while keeping gas transportation regulated). Before the US market was
deregulated, Canadian gas exports were higher priced than the regulated US tariffs. Hence,
Canada fulfilled the role of swing supplier: when supply was short, the US pipeline
companies had to buy Canadian gas. The final blow to this system was FERC order 380,
which also applied to US companies purchasing Canadian gas: utilities had no minimum bill
obligation anymore. Because imports from Canada were one of the more expensive sources,
Canadian exports dropped.
o
(US) 1985 - FERC Order 436: allowed pipeline companies, on a voluntary basis, to offer
transportation services to customers. With prices (partially) deregulated, a spot market for
natural gas arose. However the ability of end-use markets to access spot gas was severely
restricted because most inter-state pipeline capacity was controlled by the pipeline
companies themselves, which moved only the gas they owned. Transportation rate
minimums and maximums were set, but within those boundaries the pipeline companies
were free to offer competitive rates to their customers. Although the framework established
was voluntary, all of the major pipeline systems eventually took part. As a result the
transportation function became the primary function of pipelines, as opposed to offering
bundled merchant services.
62
o
(US) 1992 – FERC Order 636: required pipelines to separate their sales service from their
transportation service and provide all transportation on an equal basis for all gas suppliers.
Transportation remained a regulated monopoly but sales were opened to competition.
Arguably it was this instrument which was the most significant single instrument in the
market opening process, but as set out above, it was one event in a long process of
improving market functioning in a period of rapid and marked energy price changes.
Storage was also placed on an open access basis.
3. The present regulation authorities
In North America there are two levels of regulation: a federal and a state/province19 level. The FERC
and NEB are the federal regulators for respectively the US and Canada. Both are independent
government agencies and have mandates for inter-state issues. An overview of the mandates of the
federal regulators is given in box 7.
Since 2003 the federal regulators of the US, Canada and Mexico have worked closely and meet
regularly to share perspectives on regulatory approaches and to work on eliminating inconsistencies.
An example is the agreement signed in 2004 between NEB and FERC which reinforces the existing
cooperative relationship and further commits each agency to work together to harmonise the
regulatory approaches to cross-border projects.
State regulators, often called public service commissions or public utilities boards, have mandates on
an intra-state level, not only for gas, but for all types of energy and often also for water,
telecommunications, transportation and sometimes even automobile insurance. Opening up the
intra-State market to competition is a decision made by state regulators, as a result, some states have
opened the residential market for competition and some have not.
The NARUC (National Association of Regulatory Utility Commissioners) and CAMPUT (Canadian
Association of Members of Public Utility Tribunals) are overarching bodies providing a forum for the
exchange of information and views among its state regulator members (NEB is also a member of
CAMPUT).
Box 7: North American federal regulators
The FERC and NEB have the following mandates involving gas:
o
Monitoring and investigating energy markets
o
Approving the construction of inter-state and international natural gas pipelines and Liquefied Natural Gas
(LNG) terminals.
o
Approving the construction of storage facilities (FERC only).
o
Inter-state pipeline tariffs (in some cases also intra-state pipelines).
o
Gas production activities not covered by state regulator.
o
Approving long-term contracts (NEB only, in the US this is done by state regulators).
4. The role of hubs
Natural gas can be traded or priced at almost any location in North America. Over time, some
pricing points have evolved into trading hubs. This has occurred when multiple buyers and sellers
have expressed a wish to transact at the location, and when an infrastructure owner decided to
facilitate the trade by providing transaction services. These pricing points then become physical
exchanges where gas can be easily bought or sold. Trading hubs have tended to develop at the
junction of multiple pipeline interconnections, and usually have access to natural gas storage
facilities, allowing the hub operator to offer balancing services, enhancing the trading options for
19 For simplicity reasons, in the following, when referring to a State, we also refer to a Canadian province.
63
buyers and sellers. In North America there are 38 different hubs (29 in US and 9 in Canada). Trading
hubs, whether a producing area hub located near a gas supply basin or a market area hub located
near a market centre, are characterised by numerous market participants and access to services, such
as balancing and title transfer, organised by the hub operator.
Gas transportation and ownership transfer are the most important hub services for the customer. For
example, when a shipper with firm capacity on one pipeline wants to deliver gas to an end-user
located on another pipeline connected to it via a hub, the shipper can make arrangements to transfer
the gas through the hub administrator. The administrator will arrange for compression-adjustment
services if the pipelines operate at different pressures. Needed capacity on the receiving pipeline
may be acquired at the hub if trading services (or traders) are available. Similarly, the shipper can
use the hub's services to revise its nominations on either pipeline, with the centre handling the
administrative requirements such as the confirmations process required to effect the transaction. To
cover any imbalances that might occur when the receipt/delivery volume exceeds nominated
capacity on either pipeline, the shipper can execute an operational balancing agreement with the
hub.
If sufficient capacity is available to transport gas between hubs, price differentials between these
hubs will represent the marginal transportation costs between the different locations (see map 2).
This is because any increase in the differential beyond the costs of transportation will lead to more
gas physically flowing – countering the increase. However, if there is no incremental capacity
available, price differentials can increase above the transportation costs. Congestion can be caused by
many events - temporary congestion due to a disruptive event such as a fire – or systematic
congestion in which case it is a signal that supply/demand fundamentals have changed. As we will
see later in the discussion on the Rocky Express Pipeline case, systematic price differentials give
pipeline companies a clear timely signal and an incentive to build new gas infrastructure between
hubs.
Map 2: US natural gas spot prices at major trading hubs, 2006 ($/MBtu)
The boundaries and names shown and the designations used on maps included in this publication do not imply official
endorsement or acceptance by the IEA.
Source: FERC - State of the Market Report 2006
64
Changing market conditions impact prices and influence North American gas flows. For example,
suppose that the price of natural gas in the U.S. Midwest rose relative to California. In such a
situation, Canadian and U.S. natural gas sellers would prefer to sell in the U.S. Midwest because the
returns would be higher. More supplies would be offered in the U.S. Midwest and sellers would
divert their volumes from California. As more supplies were offered in the U.S. Midwest, the price
there would tend to fall; conversely, as less natural gas was offered in California, the price would
tend to rise. This process would continue until sellers were indifferent between selling in either
market.
Henry Hub and NIT are the most liquid producing hubs in North America (see box 8 for an overview
of these hubs). Both are located close to producing regions enabling producers to sell their gas and
from here gas flows to consuming regions mostly to consuming hubs.
An example of a consuming hub is the Chicago Citygate hub. It is strategically located at a point
where different major inter-state pipelines from the Gulf of Mexico and Canada converge, together
with different storage sites (aquifer and depleted gas fields). This enables consumers to trade
between the different producing areas. With the construction of the Rocky Express Pipeline, the
Chicago Citygate will indirectly also be linked to the Rocky Mountains producing area (see below),
giving more trade opportunities.
Box 8: North American hubs: Henry Hub and NIT
The most liquid hubs in North America are Henry Hub, located at the Gulf of Mexico in Louisiana, and NIT hub
(NOVA Inventory Transfer – NIT is often also referred to as Alberta hub or AECO hub) located in the western
Canadian Sedimentary Basin in Alberta. Both hubs are located in the largest producing areas of their country
and serve different markets. Prices at other hubs typically will be referenced as a differential between Henry
Hub or NIT. From Henry Hub, most gas flows to eastern markets and gas from NIT is either used in western
Canada or exported to the US. The following elements have made these hubs a success:
o
Connected to many large pipelines serving different markets (Henry Hub: 14 and NIT hub: 6).
o
Large volume of gas flows (Gulf of Mexico: 20% of US production, western Canadian Sedimentary Basin:
80% of Canadian production). Henry Hub is also connected to the country's largest grouping of LNG regasification terminals.
o
Connected to high deliverability storage facilities.
o
Prices and other relevant information available. Delivery point of exchanges (Henry Hub: Nymex, NIT:
NGX).
o
Many different types of buyers and sellers.
o
Large daily volume of transactions
Timely, transparent, accurate and affordable price information for market players is vital when
making market decisions. There are different sources to get information. Firstly there are the
independent energy trading platforms (such as ICE, NYMEX, NGX or TradeSpark, among others).
They publish subscription-based spot price information for multiple locations in North America.
Secondly there are previous-day gas prices which are available for various gas trading points in the
United States and Canada. These are available through several trade press publications also on a
subscription basis. The information of the underlying trades are based on a network of individual
market traders, the details on the transaction and prices are provided by the parties involved in the
trades, rather than by the centres. This price information has been used extensively as a source for
price indexing of gas-purchase contracts. Following the collapse of Enron’s on-line energy trading
platform in 2001, such price indexing came under close scrutiny. Investigation discovered that some
traders reported daily trade erroneously at times, perhaps in an attempt to influence market
behaviour. In 2003 FERC and the Securities Exchange Commission developed voluntary guidelines
for gas price reporting that are intended to eliminate similar abuses in the future.
65
In addition the Energy Information Administration (EIA) of the US Department of Energy reports
various historical monthly prices (wellhead, import, city gate, residential, commercial, industrial and
power generator prices) split by state. Besides prices, the EIA also publishes historical data on
production, exploration and reserves, imports/exports, storage and consumption again all split up
per state. This data give much transparency to the North American market.
B. The physical market / the value chain
1. Upstream: role of producers
The upstream gas sector is highly competitive, with literally thousands of producers in the US and
hundreds of producers in Canada (in stark contrast to Europe). The market share of each individual
producer is small. In the US for instance there are around 20 to 30 major gas producers, often (but not
always) also major oil companies, but the market share of the largest producer is approximately 3 to
4%.
The upstream players sell the gas they produce on the hub against a daily index price which
represents for them the “fair price of gas”. Because the daily index price is set by supply and demand
of gas, these companies get a direct financial incentive to increase production when gas prices are
increasing. Therefore a normal reaction for them would be to increase production if possible – in the
short term through surge production, in the longer term through increased production drilling and
exploration. This can be demonstrated by the high correlation between drilling rates and gas prices,
usually with a time lag of 6 months.
The majority of the gas consumed in the US is produced domestically (84%), with most of it coming
from the Gulf of Mexico, Texas and Louisiana. However, as mature areas have declined, so have gas
prices been rising. This has led to higher cost reserves becoming attractive, including tight gas and
shales as well as coalbed methane. However, there have also been more conventional gas discoveries
in the Rocky Mountains area. The Rockies production and associated pipelines provides a good
recent example as to how the North American market delivers new supplies.
The remaining gas used in the US is imported. Most of the imported gas comes from Canada (86%),
flowing to the north-east, Midwest and western area. The remaining 14% imports come from LNG,
with Trinidad & Tobago being the biggest LNG supplier, followed by Egypt, Nigeria and Algeria.
Most of the LNG regasification capacity is located in the Gulf of Mexico area, which despite being
distant from consuming areas is relatively well connected to other market zones. The US is also an
exporter of relatively small volumes of gas to both Mexico and Canada (and Alaska exports a small
quantity of LNG to Japan).
2. New midstream players
After deregulation, inter-state pipeline companies changed their focus to gas infrastructure services.
The midstream gap that opened was filled by different actors, most prominently the unregulated
marketers (in addition to brokers and retail agents) and energy traders. Both these actors make
extensive use of hubs.
Independent gas marketers act as middlemen and, in addition to marketing gas supply can arrange
for a “package” of sales and transportation services or even arrange demand management services.
The difference between marketers and brokers/retail agents, is that marketers actually own the gas,
while brokers/retail agents usually do not. Successful marketers add value by saving producers and
end-users the trouble of finding each other, by arranging transportation and storage, and sometimes
even by arranging financing or assuming price risk. Partly as a consequence, there are now about 250
independent natural gas marketers.
Energy traders, who optimise the system by taking risks, such as basis (or location) risk, timing risk
or commodity risk, can be divided into two groups. First are the physical traders; these are players
with an actual need for a surplus of gas (a physical position on the market) which they try to
66
optimise. These players are often active on the short-term (spot) and long-term (futures and
forwards) market. The other players are financial players, mostly banks, which are most active on the
forward/future market.
Many market participants do not wish or cannot tolerate the risk of price fluctuations that occur in
the commodity market, e.g. manufacturers offering fixed price products such as ammonia, or even
plate glass. Often these risks can be covered through the use of futures contracts with e.g. the
NYMEX, or through direct contracts with other counter parties for delivery at a hub. However in
some cases a financial services company, trader or bank may be used to offer a fixed price in
exchange for a particularly complex trade. For some buyers or sellers, the fee charged by financial
service companies is a small price to pay for the services offered, such as price stability.
3. A varying transport structure
Inter-state pipeline tariffs are regulated by the federal regulators, while, apart from a few exceptions,
intra-state pipelines are regulated by the state regulator. There is a general framework for setting the
cost of transportation. Most often these rates are cost-of-service based, that is, they are set at a level
that is expected to generate enough revenues to allow the company to recover its expenses plus an
allowed rate of return on assets used in producing the service.
Pipeline tariffs can be divided into a reservation charge and a usage charge. The reservation charge
covers all the fixed costs related to the transportation. For companies to reserve pipeline capacity –
most often done via long-term contracts – they have to pay the reservation charge. As we will see
later on in the case study on the Rockies Express Pipeline, the long-term capacity contracts, sold in an
open-season, underpin new investment in pipelines. The usage charge is the price which shippers
have to pay when making use of the capacity. Interruptible capacity users generally only pay a usage
charge (often higher than for a shipper with firm capacity), because another shipper has already paid
for the reservation charge.
4. Storage as a flexibility tool
The role of storage has changed fundamentally since FERC order 636 required pipeline companies to
operate storage facilities on an open-access basis. Beside the inter-state/intra-state pipeline
companies and Local Distribution Companies, independent storage service providers became
owners of gas storage. Storage services have more and more developed as financial instruments; on
the NYMEX exchange, a liquid market has emerged for futures and options for natural gas storages.
Access to storage is vital for the proper functioning of gas markets and, in particular, gas hubs. Hub
prices and particularly their volatility are directly influenced by available storage levels. A good
example of the interaction between price levels on hubs and storage levels was the shortage
following the hurricanes Katrina and Rita, as is described in box 9.
Underground storages can be divided into three categories: depleted gas fields, aquifers and salt
domes. Each type of storage has its own characteristics such as the working gas capacity, injection
and withdrawal rates. Generally, however, only salt domes have high injection and withdrawal rates
needed for intra-day balancing, whereas depleted fields and aquifers are more useful for seasonal
injection and withdrawal. Gas can also be stored above-ground in LNG facilities and gas tanks, these
facilities having a low working gas capacity and a high withdrawal rate.
Most existing gas storage in North America is in depleted natural gas or oil fields. Depleted gas
fields have large working gas capacity, and a relatively lower injection and withdrawal rate. They are
normally filled in periods of low prices, between April and November and emptied when demand
and prices rise, between December and March. In some areas, most notably the U.S. Midwest,
natural aquifers have been converted to gas storage reservoirs. The large majority of salt dome
storage facilities have been developed in salt dome formations located in the Gulf Coast states.
Since 2000 inter-state pipeline companies have to provide short-term storage services on a hub (FERC
Order 637), such as parking (short-term transaction in which the market centre holds the shipper's
67
gas for redelivery at a later date) and lending (short-term advance of gas to a shipper by a market
centre that is repaid in kind by the shipper a short time later). While most hubs are connected to
storage, some lack access to storage and instead have to use the line-pack (or production flexibility)
available to offer short-term storage services.
Box 9: Aftermath of hurricanes Katrina & Rita: dealing with a crisis
In 2005, after hurricanes Katrina and Rita, gas production in the US was heavily affected. With no possibility of
increased production or gas imports making up for this shortfall, the US was in a situation in which demand
response was needed to overcome a gas shortage. Hurricane Katrina, after striking the south of Florida on 25
August 2005, continued into the Gulf of Mexico, where it did much damage to the region’s oil and gas
production before it hit the coast on August 29. Rita, a second large hurricane, struck on September 24. The
latter particularly hit much of the region’s natural gas processing capacity. Total shut-in capacity amounted to
about 80% of production in the Gulf and 25% of total national production. The few parts of the production chain
which were left in operational status, or could be quickly brought back online, often did not correspond to the
necessary next or previous step – meaning that where processing plants were available, they often had no gas to
process. Conversely, even if platforms and pipelines were either unaffected or readily restored to service, the
gas often couldn’t flow to market without treatment.
As a result of the loss of gas supply, prices rose and volatility increased. Although spot trading on Henry Hub
was not possible for two weeks due to flooding, the price was $16/MBtu when the centre re-opened up from an
average of $6.7/MBtu in July. This resulted in demand reduction, particularly in the industrial sector, so that
large scale shortages in other sectors were averted. The demand response from the different sectors is
represented in figure 19 (originally published in the IEA Natural Gas Market Review 2006).
The market reacted in a logical manner. Draining all storage facilities after Katrina struck could have led to large
shortages in winter. However futures prices further increased as the hurricanes struck, which formed an
incentive to retain and expand storage levels. Save a short period in which gas was withdrawn from storages in
the producing region, this meant that gas continued to be injected into storage facilities – especially in the
eastern region.
Total consumption in September-December
(bcm)
100.0
80.0
3.5
captive
consumers
demand
reduction
pass on
high gas
prices to
consumers
60.0
3.0
2.5
2.0
1.5
40.0
1.0
20.0
0.5
0.0
0.0
residential &
commercial
industrial
Total consumption in September-December (tcf)
Fig.19: High prices cause demand reduction in US industry
average 2001-04
2005
power
Source: IEA Natural Gas Market review 2006
5. Impacts on the downstream segment
The deregulation of the market and the arrival of hubs represented a major change to consumers.
The price of gas is related to supply and demand fundamentals, and consumers (especially larger
ones) were directly exposed to changing price signals. Hence gas procurement became an active
process, rather than a passive one – when gas prices are high enough, consumers are now able to
make a profit by switching fuels or just by reducing gas consumption, through for example
industrial users reducing their output by drawing on inventories. As will be shown in this section
some end-users are better equipped to make use of these opportunities than others.
68
In a non-liberalised market, demand side response is almost never available, and if so, only on an
administered basis; imbalances are solved primarily by increasing supplies (withdrawing more from
storages, increasing imports or if possible increasing production). Only in cases of physical gas
shortages, will the gas company enforce demand response through interruptible contracts which it
has with some of its customers. Interruptible contracts give the supplier the right to interrupt a
customer in case of gas shortages. As compensation the customer receives a discount on its gas
contract.
In a liberalised market, the price is based on the balance between supply and demand, and thus
demand response is used continuously. In cases of gas shortage price signals are perceived quickly
by larger users. As the price each consumer is willing to pay is best known by the consumer itself,
this results in a more efficient allocation of supplies than when the supplier decides who to interrupt.
a.
Residential and commercial users
While Europe opened the residential and commercial markets rapidly to competition, in North
America only a part of this consumers group is able to purchase natural gas from another supplier
than their incumbent utility company – the decision whether to open the residential market to
competition is up to the individual states.
Within the US, twenty-one states and the District of Columbia allow residential users to switch
supplier. Seven states and the District of Columbia allow all residential consumers to choose their
natural gas suppliers, but a lack of marketer participation has precluded the development of
competitive retail markets in three of these states. Six states are in the process of implementing
consumer choice state-wide, with programs available to more than half of their residential
customers, and another eight states have pilot or partial opening to competition programs in place or
awaiting development. The remaining states are not considering residential consumer choice
programs. From the 35 million customers who are theoretically allowed to choose their gas supplier,
only 12% actually switched to another company.
b. Industrial users
Industrial users are the gas consumers most responsive to prices in the North American market. The
group is heterogeneous, with a wide variety of uses and therefore also with different responsiveness
to prices, including over time and seasons. It is impossible to evaluate the demand developments
from all these different sectors. Box 10 provides the example of the fertiliser industry, which is
particularly responsive to price signals.
Box 10: Fertiliser producers in the competitive gas market
The fertiliser industry is a good example of an industry on which the liberalisation of the gas market has had a
large impact. Natural gas is the main ingredient of fertiliser manufacture as it is a relatively cheap hydrocarbon
and is easily converted to ammonia. Fertilisers are well equipped to actively manage their input costs: they are
in general large firms and gas prices are a major part of marginal production costs. Together with ammonia
production, fertilisers consume 4% of North American gas (and a similar proportion in Europe).
However, as there are no easy substitutes, the only way for a fertiliser to reduce demand is to reduce
production. Fertiliser producers have to make a produce or no-produce decision at high gas prices to prevent it
being a loss-making operation. As a result of this price-sensitivity, fertiliser production is one of the gasconsuming industries which are able to provide a large demand response and thereby reduce volatility on the
gas market.
During the high gas prices in winter 2005/2006, many fertiliser producers in both North America and Europe
had to shut down production. In continental Europe this happened mainly because suppliers interrupted the
(interruptible) gas deliveries, while in North America and the British markets fertiliser producers reacted
themselves to the increased gas prices. Both in North America and Europe this resulted in a – much needed –
reduction of demand.
In general all industrial customers have a “make or buy” decision. This theoretically means that if
marginal costs exceed marginal revenue, they will decide not to operate their plants. However in real
69
life this decision is more complicated. First of all, many industrials have a back-up fuel. The decision
then becomes a three-way optimisation involving the marginal cost of production from each fuel and
the marginal revenue of the product.
Secondly, most industrial users have made a commitment to supply customers. When gas prices are
high the producer can try to arrange a settlement with the end-user instead of delivering the product,
or buy its product on the market and deliver it to the customer. In the longer run, it can be
commercially attractive for an industrial user to hold stocks of either raw material or finished
product (quite contrary to the theory of ``just-in-time-management”). Production may be therefore
increased in periods of lower gas prices, and decreased when prices are high. The industry will
progressively start to take these risks into account when contracting with its own customers.
Not every industrial user will be pro-active in the market, because it requires significant investment
(IT, back-up fuel, knowledge, etc). Energy costs must constitute a significant part of total costs;
otherwise the costs of actively participating in the market will outweigh the benefits.
c.
Power generation
Gas is responsible for one fifth of power generation in North America. The main alternatives – coal,
nuclear and renewables – have relatively high up-front investment costs but relatively low marginal
costs. In the case of coal, the marginal costs have increased considerably in some areas with the
increases in coal prices. Because a power plant will only produce electricity if the marginal costs are
covered by the market price of electricity, sources with the lowest marginal cost will be used first,
and sources with the highest marginal cost last. Renewables and nuclear are the first to be used,
followed by coal and then gas, depending on coal and gas prices. So, often, gas is last in the merit
order. In that case gas will then determine the price of electricity. Gas tends to be the fuel meeting
expensive peak electricity demands in both winter and summer (air-conditioning load). On a price
weighted basis, it contributes to the average cost of electricity much more than its 20% contribution
to total electricity production suggest.
Fig.20: US and Canadian electricity generation mix (2006)
US
Canada
Source: IEA
As a result gas-fired power generators are relatively less responsive to gas prices’ variations. When
electricity demand is too low, they will not produce. And when electricity demand is high enough,
producers are able to pass on increases in gas prices into electricity prices. Even when gas prices may
be very high, gas-fired power producers will generally not have an incentive to reduce gas
consumption, since they are among the only generators who can respond to peaks, and hence set the
power price20.
20
However, coal and gas have been competing, and coal prices have increased substantially. Often the final plants in the
merit order are open cycle gas turbines, but after that old coal and oil plants may enter the merit order.
70
The share of gas fired power in North America is growing. In the US, this trend is likely to continue
to 25% by 2010 and 35% by 2020. This will mean that in the future, the electricity price will more and
more be determined by the gas price.
C. Case study - Rockies Express Pipeline. Investment in a liberalised
market
Gas production in the Rocky Mountains producing area has increased by more than 4 percent per
year since 1998 and is expected to increase by another 18% by 2010. With nearly 22% of total proven
natural gas reserves in the United States, gas production in North America is becoming more and
more dependent on this area. Because gas consumption is much lower than production in this area,
the remaining is exported to other states (both western and eastern markets). However, in recent
years, the inter-state pipelines exporting natural gas were already running close to maximum
capacity, resulting in low and volatile prices in the Rocky Mountains area. In order to export the
anticipated new production, extra infrastructure was needed.
In 2005, the signing of a Memorandum of Understanding between Kinder Morgan Energy Partners
(KMP) and Sempra Energy marked the start of the construction of the largest pipeline in the US in
the last 20 years: the Rocky Express Pipeline (REX-pipeline). This 2700 km pipeline, crossing eight
different states, will cost in total $4.4 billon. It will open up producing areas in the Rocky Mountains
with consumers in the east. In the original proposal, REX consisted of three parts: REX Entrega, REX
West and REX East (see map 3). After its initial success, in 2007 an open season was held to extent the
pipeline further north-east to New Jersey.
Map 3: Overview of Rockies Express Pipeline Project
The boundaries and names shown and the designations used on maps included in this publication do not imply official
endorsement or acceptance by the IEA.
Source: data based on FERC and industry sources
71
Price signals for pipeline investment are not based on absolute price levels at any one location, but
on the “basis differential” between the value of gas at one point and another. It is therefore common
for pipeline companies to look at basis differentials between hubs in order to determine the need for
infrastructure investment. During the period 2002-2003 the differential between the Rocky Mountain
region and the Northern Natural Gas Demarcation (DEMARC), which is the end point of REX-West,
reached 2 – 3 USD per MBtu. At the time, different pipeline extensions, but most importantly the
expansion of the Kern River pipeline (adding 0.9 bcm per year of capacity), caused price differentials
to decrease in the short term. Between the end of 2003 and the time when the companies held the
open season for REX, price differentials were small. However the demand for infrastructure became
clear when at the end of 2006, gas prices in the Rocky Mountains became very volatile and low. Part
of the cause for such swings was that transportation bottlenecks constrained Rockies gas deliveries to
markets, at a time of rising production.
Even though price differentials weren’t that high at the time of the open season, the business case for
the REX pipeline was based on expectations of the basis differential once the pipe was complete.
Based on increasing production, there was a good case for a new pipeline even in 2004/5, as was
proven by the price differentials actually seen in summer 2007. Looking further in the future, more
additional pipeline capacity will be needed to prevent transportation bottlenecks for deliveries out of
the Rockies production region.
The capacity on the pipeline was sold before the pipeline itself was built, using an open season
process. In this process, expressions of interest are sought by the pipeline company from any
shipper. The pipeline company calculated that there needed to be a minimum interest 15.5 bcm per
year for the project to go ahead. In the period before the open season, three companies – EnCana,
Wyoming Natural Gas Pipeline Authority (WNGPA) and Sempra Pipelines & Storage – indicated
they would buy in total 9 bcm per year of the capacity in the pipeline. EnCana at that time was
constructing a 530 km pipeline in the Rocky Mountains linking producing zones. As part of the REX
open season process, EnCana also offered capacity on their pipeline. In February 2006 this
(production zone) part of the pipeline was incorporated in the REX-pipeline company.
The pipeline open season attracted interest from gas traders and producers; however, there was also
interest from several unusual parties:
o
o
The WNGPA was keen to provide debt financing for the project and provide support for
(another) extension into Wyoming. The state of Wyoming was keen to support the REX
project because gas prices in the state had been forced down before by over-production and
pipeline capacity bottlenecks, causing a knock-on decrease in state revenues. The state of
Wyoming calculated that each 0.50 USD fall in price represents a loss of state revenue of
approximately USD 150 million per year.
The Federal Minerals Management Service (MMS) provided support for the project through
its decision to subscribe for 0.5 bcm per year of long-haul capacity on a long-term basis to
service its royalty in kind gas program in Wyoming. The MMS decision underscores the
strong business case for Rockies Express. Creditworthy major and independent producers
form the bulk of the remaining firm commitments, and their support reflects the importance
of this project to the region and to the United States as a whole.
After the open season REX executed binding agreements for a long-term lease of capacity on this
pipeline. Total upfront commitments from all shippers to the project amounted to over USD 4 billion
– enough for the pipeline to be constructed. Prices to transport gas through Entrega (zone 1) started
at USD 0.25/MBtu, through REX-West (zone 2) started at USD 0.704 /MBtu and finally transporting
gas from west to east started (zone 3) at USD 1.074/MBtu.
The shipper commitments resulted in a final capacity for the REX pipeline as follows; REX-Entrega
(production zone) and REX-West, a capacity of 15.5 bcm per year; and REX-East a capacity of 18.5
bcm per year. The REX-Entrega pipeline was finished in February 2007, the REX-West pipeline was
finished in January 2008 and the REX-East pipeline will be in service partially in December 2008 and
fully in June 2009. KMP is the pipeline owner, and it intends to finance the projects with 50 % equity
and 50 % debt.
72
Being an inter-state pipeline, FERC had jurisdiction over the proposed REX pipeline. In order to
secure the project's regulatory approval, a dialogue was initiated with FERC as soon as the start of
the project. FERC granted the REX request to commence the FERC pre-filing process under the
National Energy Policy Act in November 2005. The regulatory process was run in parallel to the
project development, saving much time for the sponsors who would normally have run the
regulatory process in series (one regulatory stage following a project stage etc.). Thus a major new
pipeline development carrying more than 30 bcm per year over 2.700 km was brought from concept
to operation in 3 years. The key factors in this relatively rapid process were:
o
Transparent market signals that gave investors confidence in project fundamentals.
o
Strong links between producers and the pipeline owner operator.
o
Open season process which encapsulated these factors, allowing markets to be identified
clearly for pipeline services, giving confidence in “right-sizing” of the pipeline, and
attracting project finance.
o
Transparent, expeditious regulatory processes for a pipeline crossing several state
boundaries, implemented by a single Federal agency, backed by the Energy Policy Act
changes allowing “parallel” approval processes.
o
Pipeline routes utilising existing utility corridors for 90% of the length.
73
II. The workable competition scenario for Europe21
A. The European market for natural gas
The North American market serves as an interesting case study for liberalisation of European gas
markets, but while there are some similarities, there are also differences in the European situation
which may require different policy approaches and measures to achieve the necessary level of
competition in Europe. Of these differences, two are most often cited; the importance of an oligopoly
of external gas supplying countries, much greater in Europe, which accounts for nearly half of total
supply (and growing), compared with North America which was almost self sufficient at the time of
reform and where no single producer has a dominant position; and, how to replicate the role of
regional bodies to act as a means of coordination during the process of market reform as FERC and
NEB did in North America.
1. The European market in a globalising context
The European gas industry value chain extends beyond the actual borders of the OECD Europe
consuming countries. Given that nearly half of the production of natural gas used in Europe is
imported (the majority by pipelines dedicated to European markets), some non-European regions are
an intrinsic part of the European gas industry. That the reform of the European gas market directly
impacts non-European companies and countries is a major characteristic which distinguishes the
process from that in North American gas markets. Often the British gas market is seen as a blue-print
for liberalisation, but it too was almost entirely self sufficient at the time of reform. It is useful to note
that if the North American market is characterised by the international gas trade between the US and
Canada, and to a smaller extent Mexico, these three countries are bound together under the
framework of the NAFTA (North American Free Trade Agreement).
The increasing need for imports, the concentration of upstream reserves and their progressive
remoteness and rising costs will be key features for all OECD gas markets, even if diversification of
routes and of gas sources may alleviate this to some degree. Natural gas markets are globalising, and
Europe must remain an attractive consuming region in the long term, if it is to obtain necessary
imports. Major producers and marketers will continue to optimise gas sales between European,
North American, Asian and emerging markets, wherever physically possible, which is likely to
become increasingly so. Notwithstanding existing pipeline infrastructure, upstream players like
Russia or Algeria are no longer as tied as in the past to European markets as an outlet. The US and
Asia are becoming alternative prospects through the LNG trade, for short- and long-term contractual
arrangements, putting Europe potentially in competition as the target market for new investments by
its historical suppliers. Russia and Central Asian producers may also take advantage of growing
Asian demand to develop pipeline delivery systems to that region in the medium to longer term. Gas
demand is high and rising in many gas rich regions, for uses from power supply, oil field reinjection,
petrochemical development, and desalinisation in the Gulf. Finally, the lack of sufficient investment
on upstream, or at least the lack of transparency on the production prospects in the next 10-15 years,
brings more uncertainty on whether new supply contracts could be signed with the traditional
foreign suppliers of Europe in order to fill the potential supply gap for European demand.
Import dependency is not a short-term issue for Europe; indeed it will rise continuously to more than
two-thirds by 2030. External import dependency is not problematic in itself, however, from a policy
perspective, it does bring a major foreign policy element to the evolution of European gas markets.
Therefore, a clear and consensual global energy policy dialogue with external stakeholders is needed
in order to ensure the security and sustainability of European energy markets, while achieving
market liberalisation and integration. To build such a global European policy within an industry
controlled by bilateral relationships, the common market for gas must be completed if there is to be
sufficient coherence in the foreign policies of the member states.
21
For the purposes of this analysis, “Europe” will mean “OECD Europe”.
74
The majority of industry analyses on the future of European gas markets have underlined the
potential positive effect of upstream competition on downstream markets. However, the tightening
global energy supply has undermined moves towards a more competitive upstream landscape; even
if one very clear lesson of North America and the British reform processes is that they were both very
beneficial for suppliers' market position, allowing them much more assured, easier and more
transparent customer access. However, upstream concentration in the European gas market is much
higher than in the US – in Europe, the largest supplier detains one fourth of market share (Gazprom),
followed by two other big suppliers, Sonatrach and Statoil; while in the US, the largest supplier’s
share is no more than 3-4%.
2. Prerequisites for functioning competitive gas markets in Europe
Against this background, as we described earlier, the European Union has undertaken a long process
of market reform and integration, to make markets more responsive, flexible and competitive, and
adaptive to new market needs and supply sources.
Gas markets within individual European countries have different levels of gas penetration, network
development, supply profile, customer protection standards and regulatory experience.
Harmonisation on all these levels is required in the process of integration within the single EU gas
market. In comparison with the North American gas market, where wholesale and inter-state
regulatory harmonisation and consumer protection are achieved through federal regulatory
framework, in Europe this process has yet to be developed.
a.
Network integration
An integrated European network, adapted to local structures and energy balances’ profiles, must be
in place to guarantee that market operations can be deployed on a regional level, beyond national
boundaries. Today, the market is not integrated primarily because the networks are not. For instance,
the Baltic countries, Finland, Iberia, Turkey and the Balkan Peninsula are only weakly connected to
the rest of the European gas grid. In general, in Eastern Europe, market integration on a European
level is quasi non-existent, leaving aside East-West transit lines (but which are often technically
separated or separable from the national local transport networks). While we expect market signals
to drive infrastructure investment, there should ideally be multiple players along the value chain
before there can be a market – these participants can only be present if the infrastructure allows it.
Even in Western Europe, many downstream networks were built independently – for example there
are at least three separate networks in Germany with minimal interconnections. Many network
interconnections between member states in Europe are insufficient and serve mostly transit
requirements. While they were not designed for market integration, there is at least the potential for
buyers and sellers to transact in many countries; unfortunately this is discouraged in many
circumstances by lack of optimisation of spare transport capacity. This state of affairs is, as noted
above, a significant difference between Europe and North America.
b. Regulatory build-up
Regulatory harmonisation and a build-up of international experience are necessary across many
European countries. Regulatory reforms must tackle internal harmonisation but also deal with the
likely absence of similar reforms in neighbouring markets. Many European gas operators are
importers of gas, therefore their main industrial assets are infrastructure (pipelines, storage, and
LNG terminals), in some cases representing more than half of their balance sheet. This financial
structure has been vital for negotiating long-term contracts and underpinning large investments with
suppliers.
US gas regulatory policy is strongly grounded in pro-competitive, anti-monopoly law, naturally
taking account of existing industry structures. Thus the approach has been to shrink the regulatory
fence around monopoly parts of the system to the greatest degree possible, leaving other parts of the
gas supply chain to compete effectively. Given the US gas upstream supply industry structure, with
quite low concentration, this has led to a strong focus on the downstream part of the chain. Many
FERC orders and regulatory efforts were designed to achieve greater separation between
transmission and downstream sales, to ensure effective competition for consumers, avoiding
75
monopoly abuses, and maintaining downward pressure on prices. These efforts culminated in order
636, legally separating transmission and sales. For Europe, with a high and growing concentration of
suppliers upstream, theoretical considerations alone point strongly to the need of effective separation
between production and transmission. It is worth noting that FERC, a well resourced, vigorous
energy regulator, late in the reform process, having full jurisdiction over inter-state transmission
companies, used legal separation to address monopoly issues. In Europe, where such an energy
regulator doesn’t exist (although a competition one does) vigorous action will be required to achieve
desired market reform goals.
c.
Investment challenges
The investment issue is of prime importance in the current European gas market because, on the one
hand, such investments ensure security of supply and sustainable development of the industry over
the long term and on the other hand, investment may well be necessary to make way for competition
in the first place. Therefore, an important place must be given to the issue of investment in EU
natural gas policy. First, demand is expected to grow in IEA member countries, while indigenous
production declines and additional supply infrastructure is needed. This supply infrastructure
includes long-distance pipelines from surrounding production regions as well as new LNG terminals
to reach more distant supply sources. Moreover, as pointed out previously, markets need to be
integrated in order to provide both more competition and security, meaning investments are
required as well on internal level – interconnection pipelines and insurance capacity (notably
storage) infrastructure.
3. Lessons learned from North America
Even if fundamentals differ in Europe, there are some lessons to be learned from the North American
liberalisation experience.
Availability of gas for the market has been a major trigger for competition development in the US
market. The absence of market power upstream and a demand-responsive production has
contributed to create a flexible and competitive wholesale market.
Greater market integration can deliver more competitive, resilient and secure gas supplies, all the
more given the rising role of gas in power generation. The network integration in North America
around different market hubs, completed through market and regulatory mechanisms, has been
fundamental for opening to competition. Such market structure is favourable for delivering large
amounts of timely investment in all parts of the value chain, especially in long distance transmission.
The process of liberalisation is long, and could take more than a decade. The wholesale market
restructuring in the US started in the end of the 1970s and reached its conclusion in the 1990s; still
today, the regulatory process is being completed through continuous innovation and adjustment to
the market evolution, and has not yet been extended to the majority of intra-state companies.
Regulation needs to focus on clear identification of the areas of market failure and monopoly abuse,
and target these effectively.
A clear advantage has been the existence of a single regulator for the market before the start of
liberalisation, allowing a harmonised approach over inter-state issues, and ensuring long-term
consistency of the regulatory approaches to the greatest extent possible.
Gas quality and technical standards harmonisation has also constituted an advantage for effective
market integration and liberalisation.
However, even in a harmonised and integrated market, prices vary on different hubs and are set for
different lengths of term and on many different bases (electricity, fertilisers etc.). Price differentials
are due essentially to transportation costs.
Transparency and available information made compulsory by the regulators on federal and state
levels have created the confidence that all players can have network access provided physical
capacity is available. Greatly improved transparency can “shine a light into dark corners”
highlighting monopoly abuses which need to be eliminated, such as capacity hoarding, or deliberate
76
underinvestment to forestall competition. For investment, the role of the open season process has
been essential to ensure future capacities match shippers demand. The sustainability of this system is
based on its investor friendly characteristic, with first movers / first investors getting an advantage.
Legal separation of transport and sales in the US market was a key step to greater competition. In
Europe, with notably fewer suppliers, legal separation of supply and transport should be completed
with vigorous anti-competitive activity of a well resourced single regulator like FERC.
Natural gas will always be a regulated market – a totally free market is not possible. However, the
regulatory framework, when designed to be “investor-friendly”, can deliver a competitive and
efficient market functioning.
B. What the European market could look like in the future
The European Commission is reforming the regional European gas markets in order to integrate
them into a single European gas market, characterised by a workable competition delivering benefits
to all customers. If workable competition is to be achieved in the European gas market, the following
statements could describe the future features of such a market.
1. Market fundamentals
The concentration in the gas market leads to a small number of international companies operating on
the European gas market; however, niche operators have also a place on this market especially on the
trading, retail and service parts of the value chain, and increasingly in specific investment, e.g.
storage.
Different layers of ex-ante regulation exist: a single European regulator for inter-state, transit and
certain external activities; national regulators for retail customers and national companies. Ex-post
regulation is possible for competition issues. Regulation is ever present in the gas business but
remains stable, predictable, investor-friendly and aims at customers’ protection.
The market is organised on a regional basis around several hubs, naturally bordered by physical
infrastructure bottlenecks and not necessarily by national boundaries, with interconnections between
the different market zones. These hubs have different characteristics – supply hubs, demand hubs,
LNG etc. with appropriate and different pricing bases. Transmission capacities, storage and other
services will be easily available and tradable.
The infrastructure profile of this market will be characterised by inter-state pipelines regulated on a
European basis, national pipelines supervised on a national basis, with strong coordination between
the two; storage serving either local or regional markets. The main features of the European network
system are its flexibility and its resilience. Transparent and non-discriminatory third party access
creates confidence in the market for all players.
Transparency of information will be radically improved.
2. Prices and market power
It will be possible to trade gas at prices set by the supply and demand of gas at that moment, taking
into account future supply and demand as it is assessed. This will reflect the true market value of gas
in a dynamic way.
The true market value of gas may, or may not, follow oil or other energy prices over the short,
medium or long term; however, given the influence of so many other price determining factors such
as coal, carbon, electricity, gas supply and demand in globalising markets, gas prices are highly
unlikely to follow oil prices on any given day, or even for extended periods, in the same
mathematical way as now.
Pricing systems in different parts of the European market will be interlinked through free trade and
network integration. Supply shortfalls and surpluses will be shared without the need for
77
administrative mechanisms; however, this may not totally obviate the need for additional security
mechanisms.
Prices at the different trading points in Europe will not be identical. Wholesale price differentials
between the different locations are justified essentially by transportation costs.
By aggregating all European demand into one interlinked market, upstream investment targeting
that market will be more attractive, notably by becoming less risky, particularly for large supply
increments.
Transparency is essential in this market. Market power abuses will be easier to identify, particularly
those due to manipulation of physical gas flows as these become transparent. An agency tasked with
investigative and punitive powers will be essential to monitor market functioning, as in the US and
Canada, and will need the remit to investigate all companies active on the European gas market.
Moreover, as the market becomes more dynamic, a short-term supply side response will reduce the
impact of such physical market manipulation.
Gas markets will be less open to manipulation over the long term, because the principal of
controlling market areas by major suppliers will be challenged by market transparency and customer
choice in a globalising market. Consistent track record of market manipulation, e.g. due to underdelivery, will be punished by a loss of market share as price increases draw gas from other sources.
As in North America, wholesale gas prices will vary with time more than at present because gas
demand and supply varies faster than oil, though less than electricity. Such variations, especially
transparent predictable ones, will encourage investment in flexibility mechanisms, especially storage.
Gas prices will automatically reflect fair value – there will be no need to have price re-opening
clauses if long-term gas contracts are indexed to hub prices. However, price regulation may be
necessary in naturally uncompetitive areas of the market, as well as infrastructure itself; some groups
of small users may also represent a natural monopoly, e.g. local utilities in small, emerging markets.
In a competitive market it is important that prices are subjected to competitive forces to ensure they
are cost-reflective. In particular, price regulation of a potentially competitive market will distort the
ability of the market to respond to supply interruptions, reducing collective security.
Futures prices represent an opportunity to reduce price exposure for several years (up to say five)
but, even when the market is fully mature, are unlikely to be able to offer insurance for one business
cycle of 15 to 20 years.
Futures prices and current spot prices (on-the-day prices) should not be seen to be a sufficient signal
for new investment; investments will be made following analysis of long-term gas supply and
demand in the expectation that this will be reflected in prices.
The EU ETS carbon price will be able to interact more strongly with a gas market priced every day
rather than one priced every few months. This will give more cost-reflective carbon, power and gas
prices, and better carbon mitigation outcomes.
3. Information and data collection
Transparency of information will be far greater, allowing more efficient use of pipelines and storage
sites across the market place. Experience in other jurisdictions suggests productivity gains of 10-20%
are available when fragmented networks are integrated in this way.
More information and data will benefit the understanding of the market by both producers and
consumers, leading to better forecasting and greater long-term security of demand and supply.
Data collection will need to focus on the physical aspects of gas flows; storage and pipeline capacity
availability and LNG terminal availability as well as supply and demand.
Financial data collection will become more difficult, the users of such information (regulators) will
need special powers to access trading data in order to monitor the market, as with financial markets.
78
4. Companies
The European gas industry is likely to contain a mixture of vertically integrated, horizontally
integrated, and specialist companies, as is the case in the US market. The main trigger for the
structure of these companies will be the risk-reward profile and the shareholders’ objectives. For
example, regulated pipeline ownership will be a marginally profitable business for a highly
leveraged company, which will probably render it financially unattractive to the shareholders of
upstream companies. However, shareholders seeking steady if unspectacular returns may be
attracted to these assets (e.g. pension funds). Potential market manipulation and cross-subsidisation
by integrated companies will be prevented by strong pan-European regulatory authorities.
Banks will become more comfortable with gas-price risk based on a large liquid gas market.
Upstream companies which are active in the debt markets will no longer have strong financing
incentives to sell gas only at oil-indexed contracts, but will still be able to do so should they find
counterparties.
Trading companies will have an important role by accepting pricing risks in a fair market. Trading
companies will have a role in aggregating market knowledge and taking opportunities on behalf of
risk-averse market participants, enhancing overall efficiency of the system. Proper financial
regulation should prevent potential drawbacks from the trading activity.
A formal pan-European regulatory oversight and promotion of the trading hubs themselves to
increase liquidity and depth should prevent use of market power in a concentrated gas market.
Production companies (especially if few in number) stand to gain financially over the short term
from physical under-delivery to market centres. This increases the uncertainty, which causes in turn
volatility in prices. Such a situation would give incentives for storage investment, providing an
insurance against this behaviour in the short term.
Long-term reductions in production by underinvestment will draw more suppliers into Europe, such
as LNG, or favour other energy sources, especially in the electricity sector.
Large gas consumers will be exposed to industry fundamentals for the first time through gas prices.
Over time this will drive demand response in the industry. In some situations it may be more
efficient for manufacturers to store finished products than pay high volatile prices – this activity will
lower the volatility of the gas market as well as saving the gas buyer money.
5. Producer interests
The EU will represent a pool of demand for nearly 500 million consumers capable of paying
attractive gas prices in the world market. Such buying power in one market will ensure security of
demand for even the largest supply increment, and at the same time contribute greatly to security of
supply.
It will be easier to add large, incremental supply to a Europe-wide market than it is currently to
deliver the same supply to just one or a few individual countries.
Rather than having to displace existing sources of supply at the same oil-indexed price, new supplies
will be complementary at a hub price.
Since pipelines will be open to third party access, in an integrated European market, a new supply
project of moderate scale will be able to get gas to hubs without necessarily having to rely on a
marketing company.
The supply-demand fundamentals for European gas will be clearer to all stakeholders: customers,
suppliers, analysts and policy makers. Better investment decisions and better policy are likely to
result from this increased transparency.
The true environmental and scarcity value of gas will be reflected in the price, potentially
representing a premium on oil-indexed prices, in certain uses at certain times of the year, for
example.
79
Producers have the option to supply their customers with gas from hubs rather than from their own
production. This could be the case when gas prices are below marginal costs, or when they have an
interruption in production, or a surge in demand in their home markets.
6. Consumer protection
National and EU regulators will have responsibility for consumer protection; they will no longer
have the responsibility for increasing competition, but will need to focus on ensuring security of
supply through incentives for sufficient investment.
Should they so desire, consumers can opt to be protected from volatility in the gas market as they are
protected from the volatility of the oil market on which their prices currently depend in many cases;
by paying an intermediary to sign a fixed price contract for a period they choose.
Consumers will be able to take an active part in energy procurement, either by switching supplier
(residential + small industrial) or by actively managing their exposure to hub prices (industrial).
Small industrials can rely on energy service companies to organise demand response for them. This
will enhance the security of the gas system in the same time.
Careful consideration must be given to the level of consumer protection implemented in
neighbouring countries as it could affect trade between them. This is the reason why such measures,
including public service obligations and last-resort supplier mechanisms, need to be integrated
within pan-European standards.
It will be possible to influence the behaviour of the gas industry through market-based mechanisms,
for example, in order to encourage the development of more gas storage, or to invest in spare
capacity.
The market should be regarded as a means of achieving an end and can be designed to be a very
inexpensive or on the contrary very secure. By careful design the market can be weighted in favour
of consumer protection, e.g. a law stating that residential customers must be physically insured
against a gas demand peak corresponding to a 1 in 100 winter. Making the costs and benefits of these
policies quite transparent is consistent with functioning markets.
Under normal conditions, some countries in Europe physically receive gas from only one source.
Greater flexibility provided by an interconnected, integrated European market will allow gas from
other sources to supply them in the event of a supply shortage – something currently impossible,
even when there are potentially multiple supply sources, as pipeline capacity is often not
contractually available (a form of market abuse).
7. Infrastructure and investment
In an integrated European market, additional infrastructure investments will no longer depend on
large companies recovering costs from a critical mass of customers to which they have more or less
exclusive access. Investments will serve market areas rather than specific customer groups.
Storage investment will occur first where it is of least cost and most value; storage built anywhere in
Europe will contribute to security of the whole market and not just to the region in which it is built,
given the increasing degree of pan-European network integration.
Prices within market areas will vary with supply and demand; an economic rationale will exist for
pipeline investment between areas – to connect lower priced (over-supplied) regions to higher priced
(undersupplied) ones.
“Open season” processes and capacity auctions will occur designed to split the cost and share the
risks of substantial infrastructure investments among many companies (of different sizes), and
determine the appropriate size for expansion of new projects.
Large investments can be made by informal consortia for the benefit of the market rather than by
individual companies for the benefit of “their” customers – this lowers risks for companies, who can
spread risk geographically, and consumers who will suffer less if one company under-invests.
80
Larger investments will have lower risk in a large integrated market; it is lower risk to add a 1 bcm
storage site to the European market of consuming 540 bcm per year than to an individual country
consuming 20 bcm per year.
Competition will be enhanced because barriers to entry and exit of the gas market will be lower –
third party access to infrastructure will be enforced by powerful EU and country regulators.
As national and European regulatory bodies are to some extent responsible for security of supply,
they play a greater role in the monitoring of gas networks maintenance and development. Regulators
can take a pro-active stance by examining transmission system needs, and publishing regular
“transmission investment opportunity statements”. This function could also be performed by TSOs.
Should markets not be responding to consumer needs, or should lack of investment cause higher
costs to consumers, in the absence of market based remedies, the regulator might seek to have certain
links constructed if cost-effective. Similar approaches could be adopted for storage, in both cases
taking account of government policy on for example provision of service to certain types of
customers (e.g. households, hospitals) or overall security of supply objectives.
Box 11: How could the European market work in 10 years time if competitive trading develops?
In ten years time, European domestic production will have declined further, leaving Europe more reliant on
imports. The major production areas (Russia, Central Asia, Algeria, and most LNG-producers) are located
outside Europe and most gas is supplied by the producers on long-term contracts. However, more and more is
also being sold directly into the hubs. LNG to some markets is almost all on a hub basis, with significant use of
spot contracts (10% or more). In map 4 an overview is given of a possible market organisation.
The Central-European market will acts as a producer’s hub, where Russian and Central-Asian gas will be sold.
Depending on which area is priced most attractively, Algeria will either supply the South-West or the Adriatic
market and gas from the North Sea will either flow to the United Kingdom or the North-West market.
The United Kingdom, North-Western and South-Western European markets will import large amounts of LNG,
while the other supply markets (Baltic, South-East, Central-European, Adriatic and North-West) will be more
reliant on pipeline gas. LNG prices will need at least to match US Henry Hub prices, and potentially compete
with Asian buyers too.
In the following, to make the scenario more concrete, a year in the future will be simulated. At the start of the
summer, with storage levels at around the five-year average, gas will be flowing from production areas, mostly
outside Europe, into storage. The amount of gas storage and the type of storage will differ per market area,
depending on the geological characteristics of a region, and its demand characteristics. While some areas will
have more seasonal storage (depleted gas fields and aquifers) others will have more high-deliverability storage
(salt caverns and LNG); however as long as the market areas are interconnected, storage can also be used in
other market areas.
In the summer, especially in southern Europe, there is a growing peak electricity demand for cooling. Over time,
power generation has become more and more dependent on gas, resulting in a high gas demand. Following
price signals, most gas flowing through the Central-European gas hub will head for the Adriatic market and
possible also the South-West market. Depending on Henry Hub prices, and potentially Asian prices, LNG will
arrive in Europe.
If summer demand and prices are low, producers (especially in the smaller North Sea fields) might decide not to
produce gas, but instead use it for injection into oil fields. In order to fulfil their commitments, producers would
have to buy on the hub to deliver to their customers.
At the start of the winter, storages are full. Let’s assume that temperatures in the northern markets, but also in
Russia, are unseasonably low. Because of the low temperatures, Russia has a high domestic demand and needs
to buy a small amount of gas on various hubs to fulfil its commitments to the market. As a result prices on the
hubs will rise, and gas flows will be reset. The increased prices will have various effects.
First of all, gas flows will adjust to hub prices. The major gas flows through the Central European market will
now head to northern markets with little flowing to southern markets. Although temperatures are not below
average in the southern market, prices there still rise because less gas will be supplied to these markets.
Secondly, more LNG is being shipped to (the whole of) Europe. Prices on Henry Hub, the most important
competitor for LNG in the Atlantic basin, are below European levels and available (spot) cargoes are transported
to Europe. This will also tend to raise prices on the North American market.
81
Thirdly, the European market takes gas out of storage. Because it is still at the start of the winter, this is a
difficult choice and depends on the marketer’s expectation for the rest of the winter. Banks who are willing to
accept risks and traders will make the system as efficient as possible.
Fourthly, industrials and power generators will respond to increased prices. They have to decide whether or not
it is attractive to switch to back-up fuel or reduce production. In 2018, switching possibilities have increased, as
the added value to the consumer is based on market prices, which is higher than currently. Even if consumers,
before the start of the winter, have bought gas on a forward basis, it might be attractive for them to sell the gas
when it generates higher revenues. This will also be dependent on the carbon price, potentially to a significant
degree.
All these actions will have a dampening effect on prices. The better the market is equipped to deal with these
price increases, the lower the volatility on the market will be. For the market to react efficiently, real time
information on gas flows, available pipeline capacities and storage levels is essential, which will give the market
insight into the availability of gas and bottlenecks in the system and will allow the Energy Market Monitoring
Agency – a single market-wide European agency charged with market monitoring and regulation – to
investigate possible market manipulation (e.g. under-delivery). Unused capacity is made available to the market
with the UIOLI principle, ensuring flexibility in changing circumstances.
When there is no congestion in interconnection between market areas, price differentials between hubs should
not be larger than transportation costs; where such differences exist, they provide strong transparent signals for
investment in pipelines, or possibly storage.
After a cold start of the winter, temperatures in the months January to April are above seasonal average. Gas
flows from the Central-European market again will flow to the North-West and Adriatic markets. The more the
winter progresses, the more gas prices weaken. At some point European prices will be below Henry Hub prices,
causing most of the LNG to flow to the US and other consuming areas (e.g. South America, Asia or Pacific).
Map 4: Possible future market organisation
The boundaries and names shown and the designations used on maps included in this publication do not imply official
endorsement or acceptance by the IEA.
Sources: Petroleum Economist, IEA
82
Chapter IV – IEA proposals for the European gas market
In order to achieve an efficient and integrated market structure for European gas, governments
should focus on the following measures to implement within the legislative and regulatory
framework of the industry: transparency of information, enhancing investment and regulatory
convergence:
Transparency, adequacy and relevance of information available to the market are a priority, and
should focus on production levels, flows, infrastructure planning and utilisation, and demand levels.
Governments should also propose measures to increase commercial investment – in transmission
and distribution networks, in international interconnection as well as in flexibility tools. Promotion
of an integrated and transparent internal network within Europe should trigger upstream
investment in turn.
Investment-friendly regulatory convergence between European gas markets is the third pillar of the
necessary measures to achieve a functioning integrated market. The regulatory framework should be
designed to enhance investment and not impede it, noting that all infrastructure when mature
“returns” to the free market.
I. Necessary transparency measures
One of the largest changes from the previous industrial model to the competitive market is that a
substantial amount of information which was formally only needed by and available to individual
monopolies now must be made available to the whole market. Clearly, confidentiality has value in a
competitive market, but a high level of information to all participants is essential for the market to
function.
In the old model, information was kept private unless it could be demonstrated that it should be
public, whereas in a competitive market, information should be automatically publicly available
unless it can be demonstrated that it threatens commercial functioning. Commercial integrity is not
threatened in many circumstances despite the availability of large amounts of information on system
operation, supply, demand etc.
For example, in both the North American and the British markets transparency measures are
enforced and the market participants have adapted to the new situation. Timeliness of this
information is also critical. For example, indicating that an LNG terminal is free the next day is not
useful to markets as LNG shipping takes sometimes weeks. However, there are many barriers:
institutional, technical and corporate culture to this information becoming available. The most
important outcome is that governments, policy makers, regulators, markets participants and final
consumers are better able to play a role in the market. Set out below are some types of information
that well functioning markets receive.
A. Production
1. Economic reserves
Proven reserves are often published for a country as a whole. This gives the market uncertainty as to
where the gas is coming from and the likelihood of its production. The information would be very
useful if each producer has to publish their known reserves split up per field in a standardised way.
This approach provides market insight about the amount of gas per field that is able to flow in the
future to the market. Market-players themselves can make investment decisions accordingly. Ideally
this approach should apply to all reserves capable of supplying the European market.
83
2. Production rates
Supply forecasting is greatly improved if information is provided on actual field performance over
time. Accordingly, annual / monthly production should be published by producers.
This will enable the market to build up better knowledge of the performance of certain types of gas
fields in order to predict life cycles of new and existing supplies.
In both the North Sea and the US Gulf of Mexico production regions, surprisingly high decline rates
have been observed; information on field performance could aid supply forecasting at other locations
worldwide, and provide producers and consumers alike greater certainty for investment.
3. Planned production profile
Customers and prospective producers / suppliers should have an accurate view on the timing of
production projects and their supply profile, probably well into the medium term, say 5 to 10 years.
These data give the market insight about the amount of expected production. A history of such
forecasts will give the market the ability to evaluate the quality of these estimates. Producers and
consumers have an interest in gaining a clearer understanding of expected future supply into their
market(s).
For example, the IEA produces a monthly oil market report which incorporates a market view on the
timing of new field developments globally. This is a very important tool for the oil industry in
assessing future supplies. A similar tool would be very useful for the gas industry.
B. Consumption
1. Historical consumption
It is very important for demand forecasting to have accurate information on the actual consumption
by sector and sub-sector over time. The IEA collects monthly consumption data from its members.
Each country should ensure that it has the necessary means to continue publishing consumption
levels on a monthly basis despite changes to market structure. This will enable the market to build a
more complete knowledge of the variation of demand in order to have better understanding of
emerging market trends in the market, such as summer demand peaks in southern Europe.
2. Consumption forecasts
Producers, suppliers and consumers alike need to have as accurate as possible a view of future
consumption evolution and the demand profile of markets they currently or potentially supply, over
the same time frame as production forecasts, split up by sector and sub-sector in a standardised way.
The market will be better able to assess the required investments. In particular, producers will have a
better idea as to what investments are needed. Rising gas demand is driven by power generation in
IEA Europe: this will require for instance specific investments in the gas sector, like more short-term
high-deliverability storage downstream.
C. Infrastructure
1. Capacities and historical flow data
It is impossible to know the level of congestion of infrastructure without daily information on
capacity utilisation.
For each cross border entry-point into the system, the technical capacity and historical (and future)
utilisation rates must be published with sufficient detail.
84
Transparent timely information on flows and capacities including LNG, storage and major pipelines
will help to value gas at different locations and will enable greater efficiency of the use of the
transmission system.
During winter 2005/2006, prices at Zeebrugge (and NBP) spiked; however, according to the
companies it was impossible to transfer gas from continental Europe because of bottlenecks.
Historical flows will show where the bottlenecks are, and enable investments to be confidently made
to avoid them in the future.
2. Inventory and storage levels
Currently, many countries already give working gas inventories, but not all. Storage operators and
LNG operators have to publish the amount of gas in inventory on a daily basis and the historical
storage levels. In case of LNG also the utilisation rate must be given.
Inclusion of all countries on a comparable basis will give insight into the amount of gas available to
the market, which enables available gas to be used more effectively, enhancing security of supply.
The EIA in the US publishes charts with current storage level compared to storage levels of the last
five years (per region).
3. Future capacity availability
While the majority of firm capacity is allocated in long-term contracts, it is very important that the
remaining capacity is made available to ensure that the infrastructure is fully used, balance the need
for long-term capacity reservation and short-term optimisation.
A full schedule of infrastructure availability (including advanced reservations and maintenance
periods) should be made freely available and UIOLI (“use it or lose it”) principle should be strictly
enforced on a regional basis. Capacity hoarding needs to be identified and unused capacity, both
physical and contractual, freed up.
The Commission’s sector enquiry pointed out that much of the transportation capacity in Europe
was not open to competition due to foreclosure, even when not actually being used. This represents a
substantial barrier to entry in the market. On the contrary, in the US market, FERC requires pipeline
companies to establish electronic bulletin boards to provide shippers with equal and timely access to
information about the availability of service on their systems.
4. Short-term balancing
For liquidity to develop at traded locations, all market participants must have access to the same
quality of information on the day-ahead and within-day balancing markets.
Transportation business practices should be standardised across Europe to provide common
nomination and scheduling timelines as well as internet-based communication with all
counterparties on an equal basis. Also, temperature-dependent demand curves should also be made
available to all market participants.
No single market participant has access to physical balancing information before its competitors.
This will generate confidence in the market and attract liquidity.
For instance, FERC order 636 in the US market required pipelines to provide open access
transportation services that are equal in quality whether the gas is purchased directly from the
pipeline company or elsewhere, such as from a producer or a marketer.
5. Commercial transparency
Tariffs and commercial conditions for storage, LNG and transmission services are fundamental but
frequently difficult to determine on a comparative basis.
85
Hence all regulated tariffs should be published and be freely available to potential clients on a
comparable basis. This will create a level playing field and allow system optimisation as capacity
services will be easier to transact.
II. Proposals to enhance investments
A. Regulatory predictability and stability
Multiple regulatory regimes, and the resultant potential for inconsistent changes in the regulatory
framework, can have a detrimental effect on investment by increasing the level of risk. This is one
major reason for the current shortfall of European investment. A single regulator offers the
opportunity for simple, stable, predictable transparent regulation, certainly for pipelines crossing
national frontiers. Such a central regulator should strive for regulatory convergence among national
regulators to avoid distortions between intra-country and cross-border investments.
In order to reduce the investment risk, inevitable regulatory changes whilst the market develops
should be set in a context of a coherent energy policy and a long-term vision.
B. Regulated investment planning
Not all European TSOs are open about their investment planning nor are such plans coordinated
among TSOs.
Each TSO should produce a medium- to long-term investment plan. The investment plans of the
TSOs have to be coordinated and optimised on a regional / European level.
Providing insights on overall investment planning by European TSOs would help increase visibility
in network development and improve confidence in the market. It also helps regulators to
benchmark their TSOs investment plans.
For instance, the French TSO is already publishing a ten-year investment plan coordinated with the
French regulator, and thus giving clear insight on the French network development to shippers and
suppliers.
C. Cross-border investment commission
Many markets in Europe are not sufficiently interconnected and there is no responsibility for crossborder regulation which would allow this interconnection to be made by individual country TSOs
(indeed for many, it would be beyond their powers). The anticipation is that market-based
mechanisms will drive investment between hubs, but the hubs have not yet developed sufficiently to
allow this – therefore the investment is not forthcoming. But without more cross-border investments,
hubs will not develop, or certainly not in an optimal way and in a reasonable time span.
A European body should be established to act as a catalyst for cross-border investment (as well as
assess transmission adequacy) in the absence of companies with this skill set. The body might
identify potential interconnection possibilities in concert with the TSOs and national regulators and
then identify and aggregate shipper interest through an open season process. This body should act
on projects which enhance efficiency through completion of the internal market and also increase
security through greater diversity of supply routes and sources.
There is a role for a single, central administration to support and enhance the market at its early
stages. The European gas market would clearly benefit from measures which would allow new
market entrants to own capacity in new interconnections, thus improving competition and security.
It would be expected that private companies would step in to manage the project once sufficient
shipper interest is identified, and stakeholders are convened. In the case of marginal projects (from
86
the point of view of shippers’ opportunities), support mechanisms might be considered if these serve
the purpose of European network integration, or system security. In Eastern Europe, for example,
more diverse pipelines need to be present in order to bring multiple suppliers and multiple
consumers together in a competitive market. One possible way to do this might be through a NorthSouth interconnector, linking existing, mainly East-West pipelines.
D. New supply for Europe
The European Commission has recently introduced a mechanism whereby significant new supply
for Europe can be given political support in order to align stakeholders’ interests. However, criteria
for European interest project status are ill-defined. Projects which are worthy of such status and
support should be able to demonstrate substantial enhancement of European security through
greater diversity of supply routes and sources, and efficiency through completion of the internal
market.
Ensuring that these projects fulfil multiple criteria simultaneously will help attain the main objective
of the single European gas market.
Nabucco is an example of a European priority supply project and has been given a European
coordinator support, because it offers a means for greater cross-border interconnection in south-east
Europe, as well as diversity of gas sources and supply routes.
87
III. Regulation
A. Regulatory authorities
1. European regulatory body
Since the beginning of the liberalisation process, regulation has been at country level. A single
European regulator is needed to ensure proper market functioning, including market integration,
and balance of power between all stakeholders, including customers.
As with national regulators, the European regulatory body should be independent from executive
powers as well as from the market players.
In the United States, Canada, and the United Kingdom, independent regulators are charged with the
mission of consumer welfare through regional regulation.
2. Consolidation of regulatory powers for national regulators
Consumer welfare protection and efficient market functioning should be priority missions to all
national regulators, including the European regulatory body. National regulators currently have a
tendency to focus on the long-term reduction of costs without due attention to the impact on
investment and hence security.
The regulators should be explicitly entrusted with consumer welfare protection and correct market
functioning. For example, regulators should scrutinise supply contracts signed on behalf of
consumers to ensure these are market-based and beneficial to the consumers, while recognizing
contractual freedom and the necessity of a long-term outlook for investors.
Expanding the missions of the regulators to these aspects ensures that the markets deliver at the best
price and optimal security.
In the US, the role of state-level Utility Commissions is to ensure that long-term contracts are marketbased and to the benefit of the customers. The state Utility Commission has the power to intervene if
such contracts can be proved not to be in the interest of consumers.
B. Enhanced regulatory prerogatives
1. Common preferred balancing regime and trading contracts
Different market areas in Europe have individual balancing mechanisms in order to suit the needs of
the local markets. There is a role for an EU-wide body in harmonising the balancing regimes and
trading contracts across the European market to aid liquidity and market functioning.
Balancing regimes and trading contracts should be market-based and harmonised to the greatest
extent possible. Guidelines or minimum requirements at EU-level would help in convergence of
systems and to prevent balancing systems based on a non-cost reflective penalty.
More harmonised balancing regimes and trading contracts will promote competition on a European
level rather than a national level and remove potential barriers to entry in more onerous balancing
systems. More harmonisation between regional operators will ultimately lead to the ability to book
bundled multiple capacity across Europe on a common platform. A totally fluid pan-European “gas
pool” is not necessary - the speed and the cost of gas transport does not make the prospect of
physically flowing gas from “Stockholm to Sofia” economically possible or desirable, especially
given that such a trade can be achieved indirectly by re-routing gas flows at the margins. This will
allocate flexibility more efficiently between the European markets and therefore increase their
collective security.
88
An example of market-based balancing regime may be found in the United Kingdom where
incentives are given to keep the system in balance. As for harmonised trading contracts, work on this
aspect is being done by EASEE-gas (European Association for the Streamlining of Energy Exchange –
gas).
2. Secondary capacity markets
The optimal use of infrastructure is one of the main benefits achievable through the EU market
reorganisation. However, as secondary capacity markets are not obligatory in Europe (and are, at
best weak, illiquid, or non-existent), capacity hoarding is possible.
Secondary capacity markets should become obligatory, and use it or lose it clauses should be applied
to firm capacity purchases. Derogations might be possible if not contrary to competition
development.
These measures will allow the maximum opportunity for market participants to obtain access to
infrastructure.
To help the capacity release market develop in the USA, FERC required pipeline companies to
establish electronic bulletin boards to provide shippers with equal and timely access to information
about the availability of service on their systems.
C. Global objectives
1. Investment-friendly regulation
In the present market context, significant shortfall in investment throughout the value chain of the
industry can be observed globally. The regulatory framework implemented in European gas markets
should be designed as “investment-friendly”, to allow costly and long-term investments needed by
the markets to be realised. Regulatory holidays / exemptions are an important tool to encourage new
investment in the gas industry. For example, TPA access exemptions (time-limited) undoubtedly
encourage LNG terminal and large transmission investment.
In the US market, this approach has been adopted to enhance infrastructure investment. Once the
infrastructure is mature, it can return to the free market and be opened to third parties.
2. Promotion of European network standard
There is not yet sufficient confidence in European markets as being part of the same system –
external suppliers still seek to bypass transit countries even if these countries are situated inside the
European Union or are IEA member countries.
Harmonised and transparent access to networks within Europe should be promoted to avoid
excessive costs of bypassing supply infrastructure and duplication of pipelines for non-economic
reasons.
Once gas enters a European network, the shippers should be completely confident about its transport
or transit throughout European territory, including cost and other conditions of access.
89
Glossary
AGIP – Agenzia Generale Italiana Petroli (oil and gas producer in Italy)
BASF – Badische Anilin- und Soda-Fabrik (German chemical company)
BCM – billion cubic meters
BEB – Brigitta und Elwerath Betriebsführungs (German gas company)
BGC – British Gas Corporation, now British Gas (former UK gas incumbent)
BMP – Bataafse Petroleum Maatschappij (Dutch gas company)
BP – British Petroleum (international oil and gas company)
CAMPUT – Canadian Association of Members of Public Utility Tribunals
CEGH – Central European gas Hub (Austria)
CMEA – Council for Mutual Economic Assistance, USSR-backed trade organisation in East Europe before 1991
DONG – Dansk Olie OG Naturgas (Danish gas incumbent)
DTI – Department of Trade and Industry (UK)
EDF – Electricité de France (French electricity incumbent)
EEA – European Economic Area (EU + Norway, Iceland, Liechtenstein)
EFET – European Federation of Energy Traders
ISDA – International Swaps and Derivatives Association
EIA – Energy Information Administration (USA)
EnBW - Energie Baden-Württemberg (German energy company)
ENEL – Ente Nazionale per l'energia Elettrica (Italian electricity incumbent)
ENI - Ente Nazionale Idrocarburi (Italian oil and gas integrated operator)
ERGEG - European Regulators' Group for electricity and gas
ETP – Elektronaya Turgovaya Ploshchadka (Russian hub)
FERC – Federal Energy Regulatory Commission, (USA)
GdF – Gaz de France (French gas incumbent)
GIE – Gas Infrastructure Europe
GRTgaz – Gaz de France Réseau de Transport (TSO of Gaz de France)
ICE – Intercontinental Exchange
ISO – Independent System Operator
IZTF – Interconnector in Zeebrugge terminal facility
LEBA – London Energy Broker’s Association
LDC – Local Distribution Company (USA)
LNG – liquefied natural gas
MMC – Monopolies and Mergers Commission (UK)
NAFTA – North American Free Trade Agreement
NAM – Nederlandse Aardolie Maatschappij (gas production company in the Netherlands)
NARUC – National Association of Regulatory Utility Commissioners (USA)
NBP –National Balancing Point (UK)
NEB – National Energy Board (Canada)
NIMBY – « Not In My Back-Yard »
NIT – NOVA Inventory Transfer hub (USA)
NYMEX – New York Mercantile Exchange (USA)
OFGAS-OFGEM – Office of Gas Supply / of Gas and Electricity Market (UK regulator)
OMV – Österreichische Mineralölverwaltung (Austrian oil and gas incumbent)
OTC – “Over The Counter”
PEG – Point d’échange de gaz (French trading hub)
PSV – Punto Scambio Virtuale (Italian hub)
REX – Rockies Express pipeline (USA)
RWE - Rheinisch-Westfälisches Elektrizitätswerk (German energy company)
SNAM – Società Nazionale Metanodotti (Italian gas transport operator)
TAG – Trans-Austria gas pipeline
TIGF – Total Infrastructures Gaz France (TSO of Total in France)
TPA – Third Party Access
TSO – Transport System Operator
TTF – Title Transfer Facility (Dutch trading hub)
UIOLI – “Use It Or Lose It”
UKCS – United Kingdom Continental Shelf
ZBT – Belgian trading hub, Zeebrugge Trading
ZPT – Zeepipe pipeline terminal (Belgium)
90
Selected bibliographical sources
Beltran A., Williot J.P. (1992), Le Noir et le Bleu – 40 ans d’histoire de Gaz de France. Paris, Belfond.
Chevalier J.M., Percebois J. (2007), Marchés Européens de l'électricité et du gaz - quels prix ? Quelle marge de
manœuvre pour la France? Paris, Conseil d’Analyse Economique.
Cavaliere A. (2007), The Liberalization of Natural Gas Markets: Regulatory Reform and Competition Failures in Italy.
Oxford Institute for Energy Studies, working paper NG20. www.oxfordenergy.org
Correljé A., Van Der Linde C., Westerwoudt T. (2003), Natural Gas in the Netherlands: From Cooperation to
Competition?. CIEP Energy Publication, Amsterdam, Oranje-Nassau Groep B.V.
EIA – Department of Energy (2003), Natural Gas Market Centers and Hubs. http://www.eia.doe.gov
European Commission, DG TREN. Benchmarking reports on progress in creating the internal gas and electricity
markets (2001-2007). http://ec.europa.eu/energy/electricity/benchmarking/index_en.htm
European Commission, Directives on the internal market of gas, and third legislative package.
http://ec.europa.eu/energy/gas/index_en.htm
Estrada J., Moe A., Martinsen K.D. (1995), The development of European Gas markets. Chichester, John Wiley and
sons.
FERC (2006), State of the markets report. http://www.ferc.gov
Financial Times (2007), FT Global 500. http://www.ft.com
Heren, www.heren.com
Helm D. (2004), Energy, the state, and the market: British energy policy since 1979. Oxford, Oxford University Press.
IEA (2007), Electricity Information 2007. Paris, OECD.
IEA (2007), Energy Policies of IEA Countries – Germany. Paris, OECD.
IEA (2007), Energy Policies of IEA Countries – United States. Paris, OECD.
IEA (2007), Natural Gas Markets Review 2007 – Security in a globalising market to 2015. Paris, OECD.
IEA (2007), Natural Gas Information 2007. Paris, OECD.
IEA (2007), World Energy Outlook 2007 – China and India insights. Paris, OECD.
IEA (2006), Energy Policies of IEA Countries – Hungary. Paris, OECD.
IEA (2004), Security of gas Supply in Open Markets – LNG and power at a turning point. Paris, OECD.
Stern J. (1998), Competition and liberalization in European Gas markets. London, Royal Institute of International
Affairs.
Websites of companies and regulators cited in the text.
91
The Online Bookshop
International Energy Agency
All IEA publications may be bought
online on the IEA website:
w w w. i e a . o r g / b o o k s
You may also obtain PDFs of
all IEA books at 20% discount.
Books published before January 2007
- with the exception of the statistics publications can be downloaded in PDF, free of charge
from the IEA website.
IEA BOOKS
Tel: +33 (0)1 40 57 66 90
Fax: +33 (0)1 40 57 67 75
E-mail: [email protected]
CUSTOMERS IN
NORTH AMERICA
Turpin Distribution
The Bleachery
143 West Street, New Milford
Connecticut 06776, USA
Toll free: +1 (800) 456 6323
Fax: +1 (860) 350 0039
[email protected]
www.turpin-distribution.com
International Energy Agency
9, rue de la Fédération
75739 Paris Cedex 15, France
You may also send
your order
to your nearest
OECD sales point
or use
the OECD online
services:
www.oecdbookshop.org
CUSTOMERS IN
THE REST OF THE WORLD
Turpin Distribution Services ltd
Stratton Business Park,
Pegasus Drive, Biggleswade,
Bedfordshire SG18 8QB, UK
Tel.: +44 (0) 1767 604960
Fax: +44 (0) 1767 604640
[email protected]
www.turpin-distribution.com


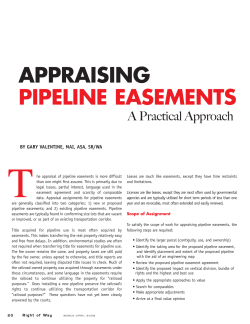
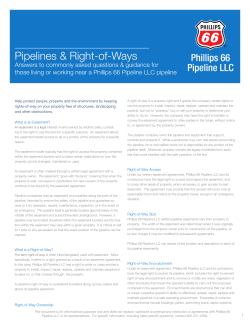


© Copyright 2026