
Microfinance in the Caribbean: How to Go Further Glenn D. Westley
Microfinance in the Caribbean:
How to Go Further
Glenn D. Westley
Inter-American Development Bank
Washington, D. C.
Sustainable Development Department
Technical Papers Series
Cataloging-in-Publication data provided by the
Inter-American Development Bank
Felipe Herrera Library
Westley, Glenn D.
Microfinance in the Caribbean : how to go further / Glenn D. Westley.
p.cm. (Sustainable Development Department Technical paper series ; MSM-129)
Includes bibliographical references.
1. Microfinance—Caribbean Area. 2. Banks and banking—Caribbean Area—Risk management. I. InterAmerican Development Bank. Sustainable Development Dept. Micro, Small and Medium Enterprise Division. II.
Title. III. Series.
332.742 W433—dc22
Glenn Westley is Senior Advisor in the Micro, Small and Medium Enterprise Division of the Sustainable Development Department. The author is very grateful for the hours of interview time and other support given by people
working at the four case study Caribbean microfinance institutions. These include: Frank Whylie, Thelma Yong, and
Rosemarie Evelyn of JNSBL; Leslie Chin, Yogieraj Das, Errol Chapman, Orrin Minns, and Allison Duncan of
IPED; Brenton McCarthy and Jeffrey Banton of Portmore CDF; and Debra Williams and Hervin Sutherland of
MEFL. Suzanne Duryea and Cecilia Calderón of the IDB’s Research Department processed the household surveys
from three Caribbean countries and provided the data summarized in Annex B. Many other people made important
contributions to this paper with their help, ideas, and comments. These include: Damian von Stauffenberg, Todd
Farrington, Mark Wenner, Bikki Randhawa, Juan Buchenau, Bob Christen, Beth Rhyne, David Dewez, Maureen
Webber, Michel Butler, Alberto Didoni, Claudia James, Lizbeth Fajury, Sarah Dunn, Tomás Miller, Miguel Aldaz,
Edgar Rivera, Winsome Leslie, Bibiana Vásquez, Dieter Wittkowski, and Fernando Campero. I also wish to thank
Gerry Pemberton and the other organizers and participants of the Fourth Caribbean Roundtable, at which a draft of
this paper was presented. Finally, I wish to thank my supervisor, Álvaro R. Ramírez, for suggesting the idea of a
paper on Caribbean microfinance, a topic that I might never have come to on my own.
The opinions expressed in this paper are those of the author and do not necessarily represent the official position of
the Inter-American Development Bank. Permission is granted to reproduce this paper in whole or in part for noncommercial purposes only and with proper attribution to the author, the Sustainable Development Department and
the Inter-American Development Bank.
September, 2005
Copies of this report (Reference No.: MSM-129) can be obtained from:
Micro, Small and Medium Enterprise Division
Sustainable Development Department
Inter-American Development Bank
1300 New York Avenue, N.W.
Washington, D. C. 20577
Email:
Fax:
Web Site:
[email protected]
(202) 312 4134
www.iadb.org/sds/msm
Foreword
For far too long in the IDB, the English-speaking Caribbean has been the stepchild of microfinance, with
the Bank working much more intensively to build up microfinance institutions (MFIs) in Latin America.
To be sure, the IDB has done some operations with microfinance providers in the Caribbean, such as
DFL, DFLSA, IPED, and the credit union systems of Jamaica, Trinidad & Tobago, and the Bahamas.
However, we would like to do much more.
What is the reason for this lack of activity in the Caribbean? Many have blamed a difficult environment in
which to do microfinance. Certainly, there are difficulties. The markets are undoubtedly much smaller
than those of Latin America. Subsidies have distorted incentives and undercut repayment discipline. But
as this paper points out, many Caribbean countries are favored with important natural advantages as well.
For example, their small size reduces MFI operating and client transaction costs, and the Caribbean road
and telecommunications infrastructure is often better than that found in many Latin American countries
where microfinance has flourished.
As the paper then argues in detail, just as many MFIs in Latin America have overcome extremely harsh
operating environments—including the presence of government subsidies as well as a number of other
difficulties—so too can the Caribbean MFIs overcome the external obstacles they face. The paper concludes that Caribbean MFIs can become profitable, successful financial institutions by making changes to
their internal policies and procedures, especially their lending methodology. This is a very empowering
conclusion, for it says that Caribbean MFIs need not wait for someone else to remedy external difficulties.
They can be successful by changing their own practices.
The second half of the paper goes on to analyze the kinds of changes that are needed for Caribbean MFIs
to become successful. We hope that the analysis presented in this paper will open a path toward sustainability and success for those MFIs that wish to follow it and that the IDB can join in partnership with such
MFIs to build a stronger microfinance industry throughout the Caribbean region.
Álvaro R. Ramírez
Chief
Micro, Small and Medium Enterprise Division
Contents
The Challenge of Microfinance in the Caribbean
1
External vs. Internal Factors
Microenterprise Formation and Market Size
Alternative Credit Supply and Effects of Government
Favorable External Factors
2
3
5
6
Small Caribbean Markets and the Four Challenges of Microfinance
6
Good MFI Management Can Overcome Harsh Environments
7
The Control of Loan Delinquency: Study Methodology
10
Four Caribbean MFIs
10
What Explains Success vs. Failure in Controlling Loan Delinquency?
Loan Underwriting
Loan Collection
Loan Officer Incentive Pay
Loan Product Design
Loan Monitoring
13
13
18
19
22
24
Pathways to Profitability and Beyond
24
Conclusions
27
References
29
Annex A. Time Trend Data for the Four MFIs
Annex B. Characteristics of Three Markets for Microfinance:
Jamaica, Guyana, and Belize
30
34
develop the same theme, discussing a number of
external factors that inhibit Caribbean microfinance. They also cite one factor that is internal
to the MFIs, namely, that loan underwriting in
Caribbean MFIs tends to place too much emphasis on collateral and not enough on the other
elements of successful microlending, such as
assessments of character (willingness to pay)
and household cash flow (ability to pay).
The Challenge of Microfinance in the
Caribbean
Studies by von Stauffenberg (2000), Wenner and
Chalmers (2001), and USAID (2004) all conclude that most microfinance institutions (MFIs)
in the English-speaking Caribbean have not enjoyed great success. These MFIs generally operate on a very small scale, experience great difficulties with loan recovery, and lack sustainability.1 Of the 15 MFIs on which von Stauffenberg
collected data, the median number of clients was
775 and the median 30-day portfolio at risk was
39 percent, a delinquency rate so high as to virtually preclude sustainable microfinance.2 While
the median return on equity (ROE) was marginally positive at 3.1 percent, von Stauffenberg
makes it clear that this figure would turn highly
negative if subsidized funding were repriced at
market rates, adequate provisions were made for
loan losses, and operating cost subsidies were
eliminated. Judging by the more recent (though
less comprehensive) microfinance data given in
USAID (2004), our own data collection (some
of which is presented in this paper), and numerous recent conversations with donor and MFI
staff about Caribbean MFIs, these characteristics
of low outreach and sustainability levels and
high loan delinquency are still quite prevalent
among MFIs in the region.
This paper argues that the reason that Caribbean
microfinance has lagged is fundamentally explained by factors internal to the MFIs, rather
than external to them. This is a very empowering
conclusion for Caribbean MFIs. It says that Caribbean microlenders can be successful by changing their own practices. They do not need to wait
for someone else to fix conditions over which
they have little or no control.
The remainder of the paper is structured as follows. The next section examines the external
factors inhibiting and favoring microfinance in
the Caribbean vis-à-vis Latin America. It shows
that some of the drawbacks of microfinance in
the Caribbean may not be as serious as is sometimes argued, and that Caribbean microfinance is
also favored in some important ways vis-à-vis
microfinance in Latin America. Next, a series of
four challenges that successful MFIs must meet
are discussed, the first of which is achieving low
loan delinquency rates and the second of which
is becoming profitable. The following section
presents empirical evidence that well-managed
MFIs have maintained low loan delinquency
rates and good profitability levels even in the
face of very dire circumstances, or in short, that
management can overcome even extremely difficult environments. The paper then introduces
four Caribbean MFIs, two with track records of
low loan delinquency rates and two with track
records of high loan delinquency rates. It thoroughly analyzes the lending methodology used
by each, as well as other factors thought to be
pertinent to explaining the difference in loan
delinquency performance. The factors that appear to be crucial in explaining success versus
failure in controlling loan delinquency are highlighted. The paper then turns to a discussion of
how these four MFIs might achieve sustainability and a track record of profitability. A final
What is the reason for this generally weak performance? A common answer from many donor
and MFI staff involved in Caribbean microfinance is that there are many conditions external
to Caribbean MFIs that make it much more difficult to be successful in the Caribbean than in
Latin America. Wenner and Chalmers (2001)
1
Throughout this study we refer to the Englishspeaking Caribbean simply as the Caribbean. This
study specifically considers seven Caribbean countries that are members of the Inter-American Development Bank (IDB): Jamaica, Trinidad & Tobago,
Barbados, Bahamas, Guyana, Suriname, and Belize.
We follow the common practice of counting the last
three as Caribbean countries even though they are on
the mainland of South and Central America.
2
Portfolio at risk is a measure of loan delinquency
and is equal to the following ratio:
Outstanding principal balance of loans overdue more
than 30 days / Gross loan portfolio.
1
section highlights the principal conclusions of
the study and makes recommendations for how
governments and donors can best implement
these findings.
rowers unaccustomed to the high nominal loan
rates of interest charged by MFIs, which may
reduce demand due to lack of acclimation to and
perhaps resentment of such high rates), and possibly a greater alternative supply of funding
available to all microentrepreneurs from government and donor programs, credit unions, and
other financial institutions.
External vs. Internal Factors
The left-hand column of Table 1 attempts to organize and present many of the common arguments one encounters about why microfinance is
more difficult in the Caribbean than in Latin
America.3 Many of these arguments are reasons
that the market for microloans is much smaller
in the Caribbean countries (see the first two bullets of the left-hand column of Table 1). Population sizes are obviously much smaller in the Caribbean than in the Latin American countries.
The Caribbean countries generally have higher
education and income levels and may also have
lower unemployment and underemployment
rates and better social safety nets. These factors
can all inhibit microenterprise formation and
lead to a smaller ratio of microenterprises to
population, further reinforcing the tendency for
Caribbean countries to have a small number of
microenterprises. Finally, a smaller percentage
of Caribbean microenterprises may demand
loans from MFIs because in the Caribbean there
are: lower poverty rates (with the higher-income
Caribbean microentrepreneurs possibly having
more savings or access to credit cards, banks, or
other funding sources), a long history of macroeconomic
stability
(leaving
bor-
Microenterprise Formation and Market Size
Wenner and Chalmers (2001) provide data to
back up many of the differences between the
Caribbean and Latin America that are asserted in
points i-vii of Table 1. (For some of these differences, data would be very difficult or perhaps
even impossible to find.) Table 2 shows that the
seven Caribbean countries do tend to be higherincome countries compared to the 19 other borrowing members of the IDB, although Guyana
and to some extent Suriname, are exceptions.
While Table 3 shows that the Caribbean countries certainly have smaller populations, their
ratios of microenterprises of population are not
necessarily lower than those found in Latin
America. The average of this ratio for the three
Caribbean countries on which we have data is
12.0 percent, nearly equal to the 12.4 percent
average for the 18 Latin American countries.4
This calls into question the importance of points
ii-iv in the first bullet since these factors are
supposed to inhibit microenterprise formation
and reduce the microenterprises/population ratio.
4
The data for the number of microenterprises are
obtained by analyzing the household surveys for each
of the 21 countries. Of the seven Caribbean IDB
member countries, household surveys were available
for three: Jamaica, Guyana, and Belize.
3
The latter is used as a comparator region because of
its geographical proximity to the Caribbean and because numerous MFIs in many Latin American countries have achieved substantial success.
2
Table 1
External Factors Inhibiting and Favoring Microfinance in the Caribbean (vis-à-vis Latin America)
Conditions Inhibiting Caribbean Microfinance
(vis-à-vis Latin America)
• Fewer microenterprises:
i. smaller population sizes
ii. possibly lower unemployment and underemployment rates
iii. higher education and income levels
iv. better social safety nets
•
•
•
Smaller percentage of existing microenterprises may demand MFI credit because in the
Caribbean there are:
v. lower poverty rates (thus, a greater percentage of Caribbean microenterpreneurs
are higher income and so may have more
savings or access to other funding sources)
vi. greater macroeconomic stability in the
past, which leaves borrowers unaccustomed to high nominal rates of interest
charged by MFIs on their loans; this may
reduce demand due to lack of acclimation
and possibly resentment
vii. possibly greater alternative supply from
government and donor programs, credit
unions, and other financial institutions
Government and donor programs that tolerate
lax loan repayment may harm the repayment
discipline in the market
Government and donor programs that provide
subsidized loans to MFIs may give them a
comfort level that undermines control over operating expenses and portfolio quality
•
•
•
•
•
Conditions Favoring Caribbean Microfinance
(vis-à-vis Latin America)
Small geographic areas and generally high population densities allow MFIs to reach most microenterprises with a smaller number of branches, reducing operating costs
Relatively good roads and telecommunications
infrastructure facilitate access to clients, further
reducing MFI operating costs and client transactions costs
Informal collateral seizure (entering client homes
and taking the collateral—in accordance with the
loan contract, but despite the fact that clients do
not have to let MFI personnel into their homes)
works in a high percentage of cases: 95-98 percent in some Caribbean countries versus 60 percent or less in some Latin American countries
The secured transaction framework, which is
based on English common law in the Anglophone
Caribbean, favors the creditor in a number of
ways. While the seizure and sale of collateral
through a judicial proceeding is generally more
expeditious in the Caribbean than in Latin America (where the secured transactions framework is
based on Napoleonic law), it is still much less expeditious than in the U.S. and Canada.
Lower prevalence of enforced upper limits on
loan interest rates in the Caribbean (usury ceilings)
3
•
Neutral Conditions
(favoring neither region)
Macroeconomic stability present in both
regions facilitates the provision of financial
services, including microfinance (by reducing MFI liquidity, term transformation, and
currency mismatch risks; credit risks from
economic downturns and changing relative
prices of borrowers’ inputs vs. outputs; etc.)
Table 2
GDP per Capita in 26 Countries
GDP per capita
(US$)
Country
1
16,548
Bahamas
2
9,624
Barbados (2002)
3
8,308
Trinidad & Tobago
4
6,051
Mexico
5
4,557
Chile
6
4,193
Costa Rica
7
3,939
Panama (2000)
8
3,793
Belize
9
3,782
Venezuela
10 Argentina
3,375
3,270
11 Uruguay
12 Jamaica
3,074
13 Brazil
2,834
2,292
14 El Salvador
15 Suriname
2,245
16 Peru
2,230
2,084
17 Ecuador
18 Guatemala
2,003
19 Dominican Republic
1,893
20 Colombia (2002)
1,866
1,027
21 Paraguay
22 Honduras
1,001
23 Guyana (1999)
991
24 Bolivia
893
25 Nicaragua
756
26 Haiti
335
Sources: Economist Intelligence Unit for Bahamas and
Trinidad & Tobago, and International Financial Statistics for
all other countries. Conversion of GDP from local currency
to dollars is done with the market exchange rate. Data refer to
2003 unless otherwise noted.
in both countries report that there is great unexploited potential, with room for the largest MFI
in each market to easily double its clientele or
more.5 Even the 24,000 microenterprises of Belize offer enough size for a reasonable microlending market to develop.
While MFIs in the Caribbean certainly must
contend with much smaller markets than their
counterparts in Latin America, the data in Table
3 make it clear that the situation is far from
hopeless. With 409,000 microenterprises in Jamaica and 58,000 in Guyana, these markets are
of substantial size Microlenders and others
5
Accion International (2002) notes that in the case of
Guyana the unserved market is particularly large outside of the capital city of Georgetown.
4
Table 3
Number of Microenterprises and Relationship to Population
Country
1
2
3
4
5
6
7
8
9
10
11
12
13
14
15
16
17
18
19
20
21
Peru
Paraguay
Dominican Republic
Bolivia
JAMAICA
Colombia
Honduras
Ecuador
Venezuela
Guatemala
Brazil
El Salvador
Mexico
Uruguay
Panama
BELIZE
Costa Rica
Nicaragua
Chile
GUYANA
Argentina
Number of
Microenterprises
Population
(millions)
Number of
Microenterprises /
Population
(in %)
6,866,193
987,326
1,392,188
1,362,321
408,627
6,501,805
891,180
1,694,663
3,247,271
1,421,714
18,989,753
667,186
10,273,945
341,909
289,004
23,621
311,219
417,570
1,207,184
58,327
1,911,170
24.37
5.22
8.10
8.14
2.56
41.59
6.39
12.17
23.71
10.80
165.37
6.03
96.65
3.29
2.81
0.23
3.53
4.80
14.82
0.76
36.12
28.2
18.9
17.2
16.7
16.0
15.6
13.9
13.9
13.7
13.2
11.5
11.1
10.6
10.4
10.3
10.3
8.8
8.7
8.1
7.7
5.3
TOTAL
59,264,176
477
12.4
Sources: Household surveys for 21 countries (for number of microenterprises) and International Financial
Statistics (for population). Data for the 18 Latin American countries are from 1998-99 (except 1997 for
Peru). For the three Caribbean countries, the data are from 1999 for Guyana and Belize and 2002 for Jamaica.
serve, particularly if they can provide rapid loan
approvals with a minimum of transactions costs
imposed on the borrower (common failings of
state-supported programs). Many, if not most,
leading MFIs in Latin America grew up alongside and had to compete with state-subsidized
lending programs from development banks and
other sources. And while credit unions have a
strong presence in the Caribbean, they mostly
provide consumer and housing loans.
Alternative Credit Supply and Effects of
Government
One might also question the importance of point
vii (of the second bullet) and of the third and
fourth bullets in the left-hand column of Table 1.
Concerning point vii, while some Caribbean
countries certainly have important governmentor donor-supported programs that may unfairly
compete with commercial MFIs, the state simply
does not have sufficient resources to provide
subsidized credit to anywhere near all of the micro and small enterprises in the country that potentially need a loan and would be creditworthy.
Because of this, there are normally plenty of
clients left over for commercial microlenders to
Turning to the third bullet, it is true that the lax
collection policies associated with many of the
state-sponsored lending programs can harm the
culture of disciplined loan repayment among
borrowers in general, including microenterprise
5
issue, it is helpful to recall Christen’s (1997)
series of four challenges that MFIs face as they
develop and mature:
borrowers. However, if the commercial MFI is
serving a clientele that is simply not attended to
by the state-sponsored programs and whose primary alternative is to pay the far higher rates
charged by moneylenders, then the MFI should
be able to insist on strict repayment discipline
and should also be able to charge loan rates that
allow it to make a profit (at least if the MFI is
not too inefficient). Again, many leading MFIs
in Latin America have coped successfully with
exactly this situation. Much the same argument
can be made about the fourth bullet: many leading MFIs in Latin America have also coped successfully with the temptations of the “easy life”
provided by cheap funding, and have maintained
control over operating expenses and portfolio
quality.
1) Achieving low loan delinquency rates
2) Becoming profitable
3) Accessing commercial funding sources (e.g.,
mobilizing deposits, obtaining commercial
bank loans, and issuing bonds)
4) Attracting private, for-profit equity investment
The first problem facing any MFI is how to do
well at its core business, that is, how to make
loans and then recover on time a high percentage
of what it has lent. This is critical. Loan delinquency has been termed the number one killer of
MFIs, reflecting the fact that it is often a leading
cause of MFI decapitalization and insolvency.
MFIs that are not able to maintain reasonably
low delinquency rates (certainly in the single
digits and preferably under five percent) feel an
immediate impact on their incomes as loans go
uncollected. Next, they may see operating costs
ballooning since, when loans go bad, loan collection easily becomes the most expensive component of the loan granting/administration/ collection cycle and thus adds significantly to total
costs if done on any substantial share of the portfolio. Sometimes even more debilitating in the
longer run is the nature of the client relationship
that can develop. When delinquency is high,
MFI staff can spend a great deal of their time in
very negative interactions with clients, instead of
in roles that foster the idea that the MFI is an
institution that supports and helps its clients.
This can undermine a base of customer loyalty.
Moreover, at higher delinquency rates, a contagion effect may develop in which a large percentage of borrowers stop repaying loans on
time (or at all) because they observe other clients doing the same and getting away with it.
Finally, in addition to contributing to poor financial health in all of these ways, weak loan
recovery undermines the growth and expansion
of the MFI because it leads to a reduction in the
availability of funds with which to extend new
loans.
Favorable External Factors
Finally, to be fair in assessing the effect of external factors on MFIs in the Caribbean compared to those in Latin America, one should also
consider the external factors that favor the Caribbean MFIs over their Latin American counterparts (second column of Table 1). These are
hardly inconsequential. Partly because of their
generally higher income levels, Caribbean countries typically have better roads and telecommunications infrastructure. This tends to reduce
MFI operating costs and lower transactions costs
for clients in accessing MFI offices. These benefits are further enhanced by the more compact
size of the Caribbean countries. In addition, both
informal and formal collateral seizure generally
work better in the Caribbean (see Table 1), and
the absence of usury ceilings eliminates a problem that is increasingly prevalent in Latin America.
Small Caribbean Markets and the Four
Challenges of Microfinance
The smaller size of the potential microfinance
market in the Caribbean countries certainly limits the size to which MFIs in these countries can
grow. This is beyond question. What is open for
discussion is whether the Caribbean MFIs can
achieve the same levels of loan delinquency and
profitability that so many MFIs in Latin America
and elsewhere have achieved. In discussing this
Meeting the first challenge—by reducing loan
delinquency to low levels—increases MFI in6
bullets of this column). Let us first consider the
issue of market size. As can be seen in Table 4, a
number of small MFIs in Latin America have
achieved delinquency rates of under 10 percent
and positive profits (ROA), despite having only
1000-3500 clients. Delinquency control is not
particularly size dependent; rather, it is mostly a
function of the MFI having the knowledge and
discipline to employ an appropriate credit methodology on a consistent basis. Therefore, it is
not surprising to see small MFIs with low delinquency rates. On the other hand, there are
economies of scale in the provision of financial
services, and so it is interesting to see examples
of small MFIs that have controlled costs well
enough and/or raised loan rates high enough to
also achieve sustainability.
come, decreases the costs of loan provisioning
and write-offs, and helps the MFI to become
sustainable and profitable in all of the other
ways just discussed. Building on this base, MFIs
wishing to meet the second challenge (becoming
profitable) generally must streamline loan underwriting and collection procedures, reduce
other operating costs, and possibly increase loan
rates. Once an MFI has achieved a track record
of profitability, it can attack the third and fourth
challenges: obtaining commercial liabilities and
equity. Only the most mature MFIs are grappling with these last two challenges; the Caribbean MFIs are still basically occupied with challenges one and two.
Good MFI Management Can Overcome
Harsh Environments
But, can low delinquency rates and profitability
be achieved by small Caribbean MFIs in the
presence of government and donor microlending
programs that: a) tolerate lax loan repayment
(which may harm the repayment discipline in the
market) and b) provide subsidized loans to MFIs
(which may give the MFIs a comfort level that
undermines control over operating expenses and
portfolio quality)? These are the third and fourth
bullets of the left-hand column of Table 1, and it
was argued earlier that many, if not most, leading MFIs in Latin America grew up and
Is it reasonable to expect Caribbean MFIs to be
able to overcome challenges one and two,
achieving low loan delinquency rates and becoming profitable, despite the handicaps given
in the left-hand column of Table 1? These are
important handicaps. Caribbean MFIs face a
much smaller potential market (because of all
the factors cited in the first two bullets of the
left-hand column of Table 1), and in many cases
must deal with the distorting effects of government and donor microlending programs (last two
Table 4
MFI
Country
Small MFIs in Latin America with Good Performance
Number of Active
Borrowers
974
1395
2151
Average Loan
Size (US$)
1021
292
916
Portfolio at
Risk (30 days)
10.7%
4.5%
8.0%
Profitability: Return
on Assets (ROA)
1.2%
9.4%
5.8%
FONDESURCO Peru
ADIM
Nicaragua
EDPYME Crear Peru
Arequipa
EDPYME Crear Peru
2354
719
7.6%
1.3%
Trujillo
AgroCapital
Bolivia
3270
3675
1.4%
2.3%
ACTUAR
Colombia
3467
386
7.2%
2.4%
Tolima
CEAPE - PE
Brazil
3636
236
6.5%
2.7%
Notes: The 30-day portfolio at risk measures the outstanding principal balance of all loans with arrears over 30 days
divided by the total gross loan portfolio. ROA is measured as the ratio of profits (after taxes and excluding any
grants and donations) to average total assets.
Source: The MIX Market (www.MixMarket.org). We used the most recent year of data available from this website at
the time of our analysis (April 2005).
7
in difficult environments (Table 5). To appreciate the meaning of these data, one must recall
that Latin America suffered a deep recession in
1998-99 after the solid growth years of 1996-97.
The Asian financial crisis of 1997, the Russian
payments moratorium of August 1998, and the
major Brazilian devaluation of January 1999
sparked a severe economic recession in 1998
and 1999 that was widespread across the countries of Latin America. The economies of Colombia, Bolivia, and Peru were among those hit
hardest by these events. As a result, the banking
systems of all three countries also suffered crises
during 1998-99.
coped successfully with exactly these problems,
demonstrating that this is indeed possible.
Moreover, as discussed earlier, the Caribbean
MFIs have a number of important advantages
over their Latin American counterparts (middle
column of Table 1), which help them in overcoming Christen’s first two challenges.
As a final argument in favor of the proposition
that MFIs can be successful under difficult conditions, we present evidence that well-managed
MFIs have achieved low loan delinquency rates
and good profitability levels even in the face of
very dire external circumstances. Or, to put it
more succinctly, management can overcome
even extremely difficult environments. This is
our final argument for the proposition put forward at the beginning of the paper: that Caribbean microfinance has fundamentally lagged
because of factors internal to the Caribbean
MFIs, rather than external to them, and so these
MFIs can be successful by changing their own
practices.
In Colombia, these shocks came atop a grinding
civil war. Colombia suffered its deepest recession in 60 years in 1999, with GDP declining 3.8
percent and the unemployment rate jumping to
an unprecedented level of 20 percent. Despite
these extremely difficult circumstances, the five
affiliates of the Women’s World Bank (WWB)
maintained outstanding records of delinquency
control (with the 30-day portfolio at risk always
under four percent) and profitability (with ROA
generally well above the 1-2 percent range that
is considered to be good performance in a banking institution). Beyond even these impressive
Data on loan delinquency (30-day portfolio at
risk) and profitability (ROA) for 11 MFIs in Colombia, Bolivia, and Peru over the period 19982000 illustrate what well-managed MFIs can do
Table 5
Country
Performance of Well-Managed MFIs in Difficult Environments (%)
MFI
Portfolio at Risk
Profitability: Return on
(30 days)
Assets (ROA)
1998
1999
2000
1998
1999
2000
Colombia
WWB Cali
0.4
1.2
0.8
6.2
9.2
9.8
WWB Popayán
2.2
1.7
1.2
11.6
18.8
20.8
WWB Bucaramanga
2.5
2.4
1.1
-0.7
4.7
10.4
WWB Medellín
3.3
2.6
1.5
6.0
3.4
6.1
WWB Bogotá
2.5
1.3
1.5
2.8
3.9
10.3
Bolivia
BancoSol
1.8
9.2
8.1
3.8
0.3
0.4
Caja los Andes
0.9
5.1
5.6
3.3
1.5
1.2
FIE
0.5
4.2
9.0
1.4
0.6
1.2
Peru
Mibanco
2.5
1.9
1.0
0.9
3.4
CMAC Arequipa
1.6
4.8
5.4
2.5
1.8
2.6
CMAC Cusco
6.3
8.3
2.5
4.3
4.6
4.5
Notes: Blank cells indicate missing data. The 30-day portfolio at risk measures the outstanding principal balance of
all loans with arrears over 30 days divided by the total gross loan portfolio. It is measured at the end of the year.
ROA is measured as the ratio of profits (after taxes and excluding any grants and donations) to average total assets.
Sources: All data except those pertaining to Mibanco are from MicroRate (www.MicroRate.com). Mibanco data are
from the MIX Market (www.MixMarket.org).
8
quests, in order to root out borrowers who were
overindebting themselves by taking loans from
several financial institutions at once or whose
repayment discipline was weakened by the entrance of consumer lenders, which offered credit
under recklessly loose underwriting standards.
accomplishments, the delinquency and profitability performance of some of the WWB affiliates, such as WWB Cali, actually improved from
the strong growth years of 1996-97 to the subsequent recession years of 1998-99. This is largely
attributable to the fact that these MFIs got even
better at what they were doing, so much so that
they more than made up for the far harsher macroeconomic environment in which they had to
operate. In particular, these MFIs made notable
strides in improving their loan underwriting and
collection practices, and in increasing loan officer productivity. For example, the Cali affiliate
steadily increased the number of borrowers per
loan officer, from 387 in 1996 to 612 in 1999.
Finally, the Peruvian MFIs faced not only the
aforementioned economic and financial sector
difficulties, but also the ravages of the El Niño
phenomenon, which peaked in December 1997May 1998 and hit Peru and Ecuador the hardest
of any countries in Latin America.
Even wider support for the idea that MFIs can
overcome difficult operating environments
comes from the MIX Market database of approximately 100 Latin American MFIs
(www.MixMarket.org). These MFIs are a broad
selection of some of the better-managed MFIs in
Latin America. Table 6 shows that the average
portfolio at risk (30 days) and ROA of these
MFIs held up very well during the 1998-99 and
2001-02 economic crises, both of which hit most
Latin American countries very hard.
The impressive performances of the Bolivian
MFIs shown in Table 5 came not only while
confronting a difficult macroeconomic and financial sector environment, but also some of the
most intense competition faced by MFIs anywhere in the world and a borrower revolt that
exploded in 1999 and continued into 2000 and
beyond. These events forced Bolivian MFIs to
deepen their analysis of even repeat loan re-
Table 6
1998
1999
2000
2001
2002
2003
Delinquency and Profitability Peformance
of Latin American MFIs (%)
Portfolio at Risk
(30 days)
4.5
5.8
4.9
6.4
6.2
3.1
Return on Assets
(ROA)
2.8
2.2
3.0
3.6
4.3
5.1
Notes: The 30-day portfolio at risk measures the outstanding principal balance
of all loans with arrears over 30 days divided by the total gross loan portfolio.
ROA is measured as the ratio of profits (after taxes and excluding any grants
and donations) to average total assets. The table reports weighted averages of
individual MFI portfolio-at-risk and ROA measures, with weights proportional
to each MFI’s total gross loan portfolio and total assets, respectively.
Source: The MIX Market (www.MixMarket.org).
9
American peer group (last column of Table 7) is
largely postponed until the later section on
achieving profitability, a few of the data series
are examined now, in order to set the stage for
the delinquency discussion.6
The Control of Loan Delinquency:
Study Methodology
To summarize the argument so far, this paper
contends that Caribbean MFIs, on the whole,
have simply not strengthened themselves sufficiently to cope with the challenges presented by
their microlending environments. The next part
of the paper is devoted to an analysis of the
kinds of changes Caribbean MFIs might need to
make in order to overcome the first challenge of
microfinance: achieving low loan delinquency
rates. We have already discussed the many reasons why controlling loan delinquency is a key
task facing any MFI. By controlling loan delinquency, Caribbean MFIs demonstrate mastery of
their core business and put themselves well
down the road towards sustainability and profitability. Without such control, their stability will
be continually in question and sustainability will
be difficult to achieve.
The four MFIs were selected for a number of
reasons. First and foremost, they fulfill the central criterion that two have a track record of low
loan delinquency rates—Jamaica National Small
Business Loans (JNSBL) and Micro Enterprise
Financing Limited (MEFL), both of Jamaica—
and two have a track record of high loan delinquency rates—Institute of Private Enterprise
Development (IPED) of Guyana and Portmore
Community Development Fund (Portmore CDF)
of Jamaica. Second, all four MFIs are essentially
specialized in lending; if any training or other
nonfinancial services are offered, these services
account for only a tiny share of overall operating
costs. Third, most or all of the loans granted by
these MFIs go to microenterprises rather than to
small or medium-scale enterprises. Finally, we
emphasized, but did not exclusively focus on,
private sector MFIs over those that are tools of
the government for disbursing credit. MEFL and
IPED are NGOs whose funding is obtained from
donors and commercial banks. JNSBL is a microlending subsidiary of the Jamaica National
Building Society (JNBS) and receives its funding from the parent company. (JNBS is a regulated savings and loan institution, which intermediates savings into home loans.) Portmore
CDF is a member-owned credit cooperative and
obtains its funding entirely from a Jamaican
government agency (the Micro Investment Development Agency, or MIDA). The emphasis on
private sector MFIs reflects our own belief that
this is the best way forward for microfinance in
the Caribbean, as it has been in most of the
world. However, Portmore CDF is included as a
representative of the government-based model, a
model that is quite common in the Caribbean.
Portmore is easily the largest of the 13 CDFs
And so, we ask the following questions. How do
Caribbean MFIs with a track record of low loan
delinquency rates achieve such results? What do
they do that is different from what is done by the
Caribbean MFIs with high delinquency rates? In
order to answer these questions, we selected four
Caribbean MFIs—two with a track record of low
delinquency rates and two with a track record of
high delinquency rates—and thoroughly analyzed the lending methodology used by each, as
well as other factors thought to be pertinent to
explaining the difference in loan delinquency
performance.
Four Caribbean MFIs
In order to set the stage for the analysis of why
some MFIs have been able to achieve low delinquency rates and others have not, and also to lay
the groundwork for a subsequent discussion on
achieving profitability, we briefly introduce the
four MFIs that are analyzed here. We first discuss why these four MFIs were selected. Table 7
then presents the most recent data available for
the four MFIs (for their fiscal years 2004), with
preceding years of data given in Annex A. While
discussion of the data pertaining to the four
MFIs and to the Microbanking Bulletin’s Latin
6
All issues of the Microbanking Bulletin including
issue no. 9, which we have used here, can be found at
the website www.MixMarket.org.
10
Table 7
Characteristics of the Four Case Study MFIs and a Latin American Benchmark
Reporting dates -->
JNSBL
MEFL
IPED
Portmore
CDF
MBB –
Latin Am.
Jan 2005
Sept 2004
Dec 2004
Dec 2004
2001-02
Country
Jamaica
Jamaica
Guyana
Jamaica Latin Amer.
Start of lending operations
Oct 2000
Nov 2002
1986
1999
Type of lending: Individual (I) or Solidarity Group (G)
I
mostly G
I
I
Number of offices (main and branch)
28
1
12
3
12
Gross loan portfolio (US$ thousands)
$2,683
$142
$5,574
$1,081
$8559
Number of borrowers
8,972
939
5,124
490
13,755
Growth rate of US$ gross loan portfolio (1 year)
49.3%
200.5%
-3.5%
42.9%
Growth rate of number of borrowers (1 year)
37.6%
184.5%
-7.0%
11.9%
Average outstanding loan balance per borrower (US$)
$299
$151
$1,088
$2,206
$816
Average loan term (months)
5.5
approx. 4
7
12.8
Portfolio at risk > 30 days (% gross portfolio)
3.3%
5.5%
38.0%
15.6%
4.9%
Loss provision coverage > 30 days 1
178%
99%
66%
82%
120%
Operating costs / Average gross loan portfolio
87%
341%
14%
24%
27%
Operating costs / Average number of borrowers (US$)
$251
$511
$151
$471
$195
Borrowers / Loan officers
236
117
223
140
353
Borrowers / Total staff
114
55
73
41
128
Average remuneration of all staff (US$ per annum)
$15,514
$17,762
$5,681
$9,196
Cost of funding liabilities 2
6.2%
4.5%
2.9%
9.4%
Portfolio yield 3
93%
90%
22%
35%
44%
Debt/Equity
4.0
2.5
1.1
209
2.7
4
ROA = return on average assets (before taxes)
1.1%
-16.0%
3.2%
7.9%
AROA = adjusted ROA 5
-5.8%
-22.8%
-5.8%
5.6%
-0.1%
FSS = % of total adjusted costs covered by revenues 6
91%
32%
69%
122%
102%
Notes: The four MFIs have different fiscal years. The four columns of MFI data pertain to the one-year period ending at the
date shown in each column heading (or for point-in-time data such as portfolio at risk, to the date itself). The only exception is
JNSBL, where the data cover the 10 months ending in January 2005, but are expressed as annual rates as needed in order to be
comparable to the data given for the other MFIs. The final column is taken from the Microbanking Bulletin issue no. 9, and
provides data for the Latin America peer group. Blank cells indicate missing data.
1
This is the ratio: Loan loss reserve / Outstanding balance of loans overdue > 30 days.
2
This is the ratio: Interest and fee expenses on funding liabilities / Average funding liabilities.
3
This is the ratio: Total interest, commissions, and other revenue from loan portfolio / Average gross loan portfolio.
4
This is the ratio: Net operating income before income taxes / Average total assets. The numerator excludes grants and donations. Only JNSBL has paid income taxes. These taxes are excluded from ROA in order to better compare JNSBL with the
other three MFIs.
5
AROA is the same as ROA but with the following adjustments made to net operating income: a) if the average cost of the
MFI’s funding liabilities is less than the interest paid by the banking system on certificates of deposit (using the CD rates given
in International Financial Statistics, line 60L), then funding costs are increased to the CD rate; b) provisioning expenses are set
equal to 100 percent of the outstanding balance of loans overdue > 30 days; c) if the net worth of the MFI is > 0, then an inflation expense equal to net worth times the inflation rate is subtracted from net income; and d) the value of in-kind subsidies is
subtracted from net income (a consideration only for JNSBL).
6
FSS is the Financial Self Sufficiency ratio: Operating revenues / (Adjusted funding liability costs + Adjusted provisioning
costs + Adjusted operating costs). This ratio employs the same adjustments specified in footnote 5, above.
Sources: The final column is from The MIX (2003) and uses somewhat different adjustments for AROA and FSS than those
employed in the rest of Table 7. Inflation rates, bank deposit rates, and exchange rates used in the four MFI calculations are
obtained from the International Monetary Fund’s International Financial Statistics. All other data are from the MFIs.
11
funded by MIDA, and, according to some observers, the best.7
prescription were even possible). Rather, the two
key aims of the case study analysis are: a) to
buttress by example the argument made above
that where an MFI’s delinquency rate remains
high over a period of years, this is almost certainly due to internal causes such as a defective
lending methodology; and b) to suggest, but not
exhaustively catalogue, the kinds of things that
might be wrong (and right) in how Caribbean
MFIs do microlending.
Some readers may wonder why three of the four
case study MFIs are from Jamaica. The reason is
simple. Among the financial institutions that are
located in one of the seven Caribbean IDBmember countries and that are specialized in
lending to microenterprises, JNSBL and MEFL
clearly have the best track record of low loan
delinquency rates and also possess an excellent
grasp of how to do microlending. In order to
obtain positive lessons on how to lend to microenterprises in the Caribbean, these seemed
clearly to be the two best MFIs to study. Having
established that, it was then decided that one of
the two MFIs with a track record of high delinquency rates should also be from Jamaica, so
that the differences in loan methodology between the high and low delinquency rate MFIs
could not simply be ascribed to differences in
country circumstances. For that reason, Portmore CDF was selected. Finally, the fact that we
have household surveys—which provide fundamental information on the size of the microfinance market—available only for Jamaica, Guyana, and Belize tilted the choice of the fourth
MFI in favor of an MFI from one of these countries, specifically from one of the last two countries, in order to provide at least some crosscountry variation in the location of the MFIs.8
IPED was chosen because it is easily the largest
of the MFIs in Guyana and Belize, and therefore
of importance in its own right.
The purpose of our comparative analysis of the
four case study MFIs is not to single out specific
MFIs for criticism or praise. Rather, as just
noted, it is to support a more general analysis
and provide examples of things that are being
done right and wrong in Caribbean microlending. Since there are numerous MFIs in the Caribbean with track records of high delinquency
rates, Portmore CDF and IPED are but two of
many examples that could have been picked.
Turning to the data in Table 7, the most important fact for present purposes is that the delinquency rates of JNSBL and MEFL are substantially lower than those of IPED and Portmore
CDF: 3.3 and 5.5 percent versus 38 and 15.6
percent, respectively. These delinquency rate
differences are observed consistently over time
(Annex A). For purposes of the loan delinquency discussion, it is also helpful to know that
all four MFIs employ only individual lending
except for MEFL, which is primarily a group
lender. MEFL is also the newest program, only
2½ years old at the time of our analysis. Despite
its newness, MEFL has a disciplined approach to
lending. Although it has only one office from
which to make loans, a partnership with Scotiabank enables MEFL’s clients to repay at any of
Scotiabank’s 32 offices in Jamaica. JNSBL is
the largest of the four MFIs in terms of number
of borrowers (8972), although given its small
average loan size of US$ 299, its total portfolio
is only US$ 2.7 million. At US$ 5.6 million,
IPED has the largest loan portfolio, based on a
sizable number of loans (5124) of considerably
larger average size (US$ 1088). Portmore CDF
has the largest average loan size (US$ 2206),
which allows it to achieve a portfolio of over
US$ 1 million despite having only 490 borrowers. At US$ 151, MEFL has the smallest average
An important disclaimer arises from the fact that
we have analyzed the lending methodologies
(and other loan delinquency controls) used by
four case study MFIs—not by 10 or 15 or even
more MFIs. Accordingly, the specific weaknesses found in the lending methodologies used
by the case study MFIs may or may not hold in
most other MFIs in the Caribbean. This is all
right; our aim is not to provide a detailed prescription for how all Caribbean MFIs should
achieve low delinquency rates (if such a detailed
7
The lack of readily available financial data makes
this last claim difficult to verify.
8
Annex B presents the data obtained from the three
household surveys.
12
loan size, the product of the poor neighborhoods
it is targeting and the newness of the program
(so that many of MEFL’s borrowers have not
had time to work up to larger loan sizes).
Loan Underwriting
Why would clients choose to repay their loans
with an MFI, month after month, during which
many adverse events might occur? And why
would a very high percentage of clients (95 percent or more) do this, allowing the MFI to effectively control loan delinquency and paving the
way to sustainability and profitability? The answer given by leading MFIs is that four factors
are key. First, MFIs should select clients who
can repay, as shown by an analysis of the client’s combined business and household cash
flow and the stability of the client’s business and
other sources of income. Second, MFIs should
conduct a character analysis of prospective clients in order to determine whether they are the
kinds of responsible people who are willing to
repay the loan. Third and fourth, MFIs should
provide sticks and carrots to encourage clients to
repay. Thus, clients will want to repay the loan
in order to avoid losing their collateral or being
pressured by any loan guarantors (sticks). And,
clients will also want to repay the loan in order
to maintain access to high-quality loan and other
financial services, for example, loans with few
client transactions costs and a rapid response to
credit requests (carrots). Of these four factors,
the ability of the two MFIs with high delinquency rates to recover a high percentage of
their loans on time appears to be most severely
compromised by inadequacies in their character
analyses, the second factor, though other weaknesses in loan underwriting play a role as well.
We now discuss the four factors in turn.
What Explains Success vs. Failure in
Controlling Loan Delinquency?
What factors explain why JNSBL and MEFL
have loan delinquency rates consistently around
2-5 percent while Portmore CDF and IPED have
far higher rates, of approximately 15-25 and 4050 percent, respectively? We have already argued that factors internal to the MFI, rather than
external to it, are likely to provide the main explanation. For these four MFIs, there are three
particularly crucial differences that appear to
explain much of the observed disparity in delinquency rates. All three of these differences are
critical aspects of the credit methodology used
by the MFIs:
•
•
•
How the MFIs assess the character (willingness to pay) of loan applicants
How effectively the MFIs follow up on loan
delinquency after it has occurred
Whether the MFIs have implemented an
appropriate loan officer incentive pay system
Tables 8 and 9 present key characteristics of the
credit methodologies used by the four MFIs in
the areas of loan underwriting and loan collection, respectively. Table 10 presents other credit
methodology characteristics as well as loan
product design issues. The three most crucial
differences, highlighted in the bullet points
above, emerge from the analysis of the factors
considered in these tables. As just discussed, we
cannot say whether these three deficiencies,
which were identified for Portmore CDF and
IPED, would necessarily explain high delinquency rates in other Caribbean MFIs, though
they may be suggestive of the kinds of things
that could go wrong and more generally buttress
the argument that adopting an adequate credit
methodology is central to controlling loan delinquency. We now discuss the comparisons presented in each of Tables 8, 9, and 10 in turn.
Ability to Pay (Cash Flow Analysis)
Best practice MFIs undertake a thorough analysis of household cash flows in order to determine monthly household savings.9 Household
savings are calculated by summing the income
from the loan applicant’s business (net of all of
the business’s expenses) together with the
household’s income from all other verifiable
9
To simplify the exposition, we assume the repayment frequency is monthly, and so savings are calculated on a monthly basis. If the repayment frequency
is weekly or biweekly, then the calculation of savings
is also weekly or biweekly, respectively.
13
Table 8
Ability to pay (cash
flow) calculation
Willingness to pay
(character) analysis
Collateral
Transactions costs
for MFI and borrower
Delays for 1st
loans: time from
loan inquiry until
borrower receives
loan
IPED
a) Fails to integrate business
with household: loan payments
must be < 40% of business profits (instead of < 70% of household savings)
b) Inadequate use of margins in
profit calculation
Credit Methodology Issues: Loan Underwriting
Not efficient or sufficient
Portmore CDF
a) Fails to adequately integrate
business with household: loan
payments must be < 50% of
business profits net of some
household expenditures (instead
of < 70% of household savings)
b) Complex cash flow projection is used that could hide a
money-losing business
c) Virtually insist on written
sales records
Not sufficient
Value of household and other
goods > 100% of loan value in
all cases, and usually more—
often as much as 200%
All loans must be 100% collateralized, with 25% in cash up
front and the rest in household
and other goods
a) Extensive pre-credit requirements list imposes substantial
transactions costs on 1st time
borrowers and on loan officers
b) Loan officers spend significant time in the office with
walk-ins (approximately 1000
walk-ins per month)
c) Loan officers spend only 50%
of their time in the field
a) Pre-credit requirements (including savings) impose more
than usual transactions costs on
1st time borrowers
Substantial delays. Extensive
pre-credit requirements list imposes substantial delays on 1st
time borrowers: typically takes
3-4 weeks to receive the loan.
b) Loan officers spend significant time in the office with
walk-ins (approximately 450
walk-ins per month)
c) Loan officers spend only 4050% of their time in the field
Substantial delays. Pre-credit
requirements (especially forced
savings) impose substantial delays on 1st time borrowers: typically takes 4-5 weeks to receive
the loan.
14
JNSBL
a) Properly integrates business
with household, but uses an
extremely conservative underwriting criterion: loan payments
must be < 25% of household
savings in the low period
(household savings are calculated in high, medium, and low
periods)
MEFL
a) Fails to integrate business
with household: loan payments
must be < 50% of business profits (instead of < 70% of household savings)
A model of best practices (see
text)
Loans must generally be 125%
collateralized with household
and other goods. This may be
reduced to 90% or even less for
clients who have repaid 4 or
more loans well
A model of best practices (see
text)
Forced savings of 1% of the
loan amount per week serves as
cash collateral. Also, group
loans have the group guarantee
and all individual borrowers
must have a co-signer for the
full loan amount.
a) Fairly minimal pre-credit
requirements—similar to
JNSBL (including reference
letters)
a) Fairly minimal pre-credit
requirements: applicants need
only bring ID, tax registration
number, 2 photos of themselves,
2 reference letters, and phone
numbers of 2 other references
b) Loan officers spend no time
with walk-ins—receptionist
gives them requirements list
c) Loan officers spend 80-90%
of their time in the field
Reasonably expeditious: 1st time
borrowers typically receive their
loan in 1½ to 2 weeks
b) Loan officers spend no time
with walk-ins—receptionist
gives them requirements list
c) Loan officers spend 90% of
their time in the field
Somewhat expeditious: 1st time
borrowers typically receive their
loan in 2½ to 3 weeks
ments will be less than 40 percent of household
savings. However, such a conservative loan underwriting standard may cause many borrowers
to be frustrated with the small loans they are
permitted, given their capacity to repay much
larger loans out of all household income sources.
This may lead many borrowers to value the
credit service less and thus may lead to greater
loan delinquency rates since clients who are not
very satisfied with the credit product may not
make as great an effort to repay their loans when
they encounter financial difficulties in their
business or personal lives. The lower levels of
client satisfaction may also lead to lower client
retention and accession rates (where the latter
refers to the percentage of prospective clients
who choose to apply for a loan), which reduce
IPED’s sustainability. By lending some of its
clients less than these clients would like and
could manage, IPED reduces its sustainability in
another way since it is earning interest on a
smaller loan portfolio.
sources and subtracting total household consumption expenditures. The difference is the
amount of money the household has available to
meet loan repayments. Conservative assumptions are often employed in calculating household income; for example, remittance and other
income flows may not be counted (or fully
counted) unless the client can provide proof of
the amounts received. Also, leading MFIs typically calculate savings in good, normal, and bad
months, and size client loan repayments to the
level of their household savings in the low (bad)
months. In most leading MFIs, monthly loan
payments must be less than 70 (or sometimes
80) percent of calculated monthly savings in the
low months in order to allow for a margin of
safety. Some MFIs also allow this percentage to
vary from client to client depending on the volatility of each client’s income flow, insisting on a
larger margin of safety (i.e., a smaller percentage) when income flows are more volatile.
The cash flow analyses carried out by the four
Caribbean MFIs all suffer from one or more important defects. The most common mistake is
conducting the cash flow analysis only on the
loan applicant’s business, instead of on the entire household unit, thus failing to take account
of the fact that money is usually fungible within
this unit. For example, IPED requires that loan
payments not exceed 40 percent of the profits of
the business that has applied for the loan. This
criterion fails to consider other sources of
household income (which could help to support
a larger loan payment) and it fails to subtract out
household expenditures (which reduce the funds
available for loan repayment). Thus, depending
on which of these two omissions is larger, and
by how much, IPED’s formula could provide
either too conservative or too liberal an underwriting standard compared to the more typical
70 percent of household savings. For example, if
the household is large, has large food and other
expenditures, and has no other sources of income, it may struggle to make loan payments
that are permitted by IPED’s formula, putting it
in constant danger of default. On the other hand,
if the household’s other income is greater than
its total consumption expenditures, the client
should have little difficulty affording even the
largest loan IPED will allow since the loan pay-
The problem just described in IPED’s cash flow
analysis also applies to Portmore CDF and
MEFL. Only JNSBL’s analysis properly integrates the loan applicant’s business within the
framework of the entire household’s cash flow.
However, JNSBL then applies an extremely
conservative underwriting standard, allowing
loan payments to be at most 25 percent of
household savings in the low savings period.
Again, this may reduce client satisfaction, loan
repayment rates, retention and accession rates,
and sustainability. In fact, we argue later that
this highly conservative underwriting standard
may be a major factor that has held JNSBL’s
average loan size to such low levels and kept it
from achieving full financial sustainability.10
The ability-to-pay calculations of IPED and
Portmore CDF suffer from additional deficiencies, including IPED’s inadequate use of margins in calculating microenterprise profits and
Portmore CDF’s complex cash flow calculation,
10
JNSBL’s low loan delinquency rates may be attributed to its otherwise excellent procedures for underwriting loans and its very aggressive loan collection
program, all backed by a loan officer incentive pay
system that heavily rewards low delinquency rates.
15
which may hide certain problems. To understand
the first of these two issues, it must be recalled
that a major problem in microlending is that
most microenterpreneurs do not have written
records of their business’ sales and costs. Thus,
loan officers must reconstruct business profits
by probing the loan applicant’s memory and using what receipts or other records may be found.
This often involves a lengthy process in which
the loan officer: a) asks the microentrepreneur
about their sales on normal, good, and bad days
in the most recent week and the weeks just prior
to that; b) then aggregates up to sales in normal,
good, and bad weeks and counts how many
weeks there are of each; c) and then aggregates
up to sales in normal, good, and bad months and
counts how many months there are of each. A
common mistake is to then try to do the same
thing with costs, finally subtracting costs from
sales in order to get profits week by week and
month by month. The problem is that since both
sales (S) and costs (C) are relatively large numbers compared to their difference (S - C = profit)
and since both S and C are usually estimated
with substantial errors in this reconstruction process, profit is often estimated with an extremely
large error compared to its size since it is calculated as the difference between two large numbers, both with sizable errors.
normally subtracts out only variable costs and so
fixed costs (such as rent, utilities, loan interest,
and other overhead items) must then be subtracted out to finally get business profits. It appears that IPED does not avail itself of this strategy for more accurately calculating microenterprise profits to as great an extent as do leading
MFIs, which use it extensively not only for
commercial enterprises but also for those engaged in service and manufacturing activities.
Portmore CDF employs a somewhat complex
cash flow calculation, which is useful but needs
supplementation. The cash flow of the microenterprise is simulated month by month over the
life of the loan, up to a maximum of 12 months.
The additional complexity over what leading
MFIs normally do is that profits are carried over
from one month to the next in order to see if the
enterprise can afford the purchases it is projected
to make in each month. This can be especially
useful if the enterprise makes lumpy purchases
during the loan repayment period (for example,
from periodic importations of goods for resale).
The difficulty is that the simulation starts by
crediting the business with its initial cash on
hand. Thus, the business could lose money in
every month and still show a positive cash balance at the end of every month as long as the
initial cash on hand were sufficient to absorb
these losses during the life of the loan (or at least
for the 12-month simulation period if this is less
than the life of the loan). The MFI would then be
in the position of lending to a money-losing enterprise, a potentially risky proposition, especially if the loan term goes beyond the 12-month
simulation period. This problem could be corrected by supplementing this useful analysis
with a simple calculation of the business’ profit
in each month in isolation (without any carryover of cash), the more typical computation used
by leading MFIs. Profits could be calculated in
normal, good, and bad months and the loan
could be sized so that repayment is reasonably
assured even in bad months, as noted earlier.
The better procedure, used by leading MFIs, is
to first estimate either sales or costs (whichever
can be reconstructed more reliably) and then
apply a percentage margin to it in order to obtain
the other. This leads to a much more accurate
estimate of business profits (and avoids, for example, the common pathology of initially obtaining negative profits when profits are estimated as sales minus costs). The microentrepreneur often knows the margin (s)he has, and with
experience, loan officers come to know these
percentages as well since they normally fall in a
narrow range for a given type of activity in a
given area.11 The resulting profit calculation
11
For example, based on many detailed profit margin
calculations that they have done, Portmore CDF has
found that the markups over the cost of goods sold by
their clients typically fall in the following ranges:
bars 45-50 percent, retail grocery 19-21 percent,
wholesale grocery 11-15 percent, and retail hardware
Portmore CDF virtually insists that its loan applicants have written sales records. While this
unnecessarily restricts the loan applicant pool,
23-25 percent.
16
per. Loan officers who are used to going to a
loan applicant’s home and business in search of
people to talk to and other clues about the applicant’s character and reliability will find such
clues in many other ways, for example: how
well these places are organized and maintained,
whether the applicant has books in the house,
whether there are children in the house and how
they appear, whether the applicant is well known
in the neighborhood or may be more transient,
and whether the applicant is involved in church,
parent-teacher associations, or other community
organizations and thus is more rooted in the
community.
reduces portfolio growth, and drives up the cost
of finding new clients, it should not increase
loan delinquency rates.
Willingness to Pay
Best practice MFIs make a detailed investigation
and assessment of the borrower’s character and
his/her likely willingness to repay the loan. This
evaluation is based on visits to the business site
and home and on talks with business associates,
neighbors, friends, and relatives.
In contrast, the procedure used by IPED is
overly formalistic, inefficient, and not sufficient
to separate good credit risks from bad. Applicants are asked to bring to IPED as many as 26
documents and other items as part of the loan
granting process—including, for example, two
written letters of recommendation; photos of the
applicant, collateral, and business; affidavits of
ownership and valuation; ID card; and certificates of title or lease. This imposes significant
transactions costs and loan approval delays on
the applicant; it typically takes first-time loan
applicants 1-2 weeks to gather all of these materials together, especially the two reference letters. At the same time, the analysis of these
documents falls well short of telling IPED
whether the applicant really is the sort of responsible person who would repay the loan. The
two written reference letters were not deemed to
be very useful by IPED itself: “less than useless”
in the words of one senior IPED official—
indicating the potential for being misled by
overly positive reference letters. IPED loan officers would do better to place more emphasis on
conducting personal interviews with a small selection of the applicant’s business associates,
neighbors, friends, and relatives. The loan officer would then be able to assess the people making the recommendation, ask them questions and
follow-up questions directly, hear their answers
more spontaneously, and note their tone of voice
and body language—all in an effort to try to distinguish overly-biased from genuine information
and to get to the bottom of the question of the
applicant’s reliability and character. Face-to-face
questioning also allows people to speak more
candidly about the loan applicant and to say
things that they may not be willing to put on pa-
Compared to IPED, Portmore CDF does not
have such a long list of documents and other
items for loan applicants to assemble. However,
like IPED, its loan analysis is based more on
making sure that the items it has asked for have
been supplied and on verifying whether the applicant’s cash flow and collateral meet the standards that have been set. The best practice character analysis described above does not appear
to be employed by IPED or Portmore CDF. In
contrast, both JNSBL and MEFL do an excellent
job of screening loan applicants for their potential reliability in repayment, and this appears to
be one of the major factors explaining their very
low delinquency rates.
Collateral
Best practice MFIs require that their loans be
collateralized with household goods, tools and
equipment, other physical collateral, or cash.
Cosigners (for individual loans) and group guarantees (for group loans) may be used in place of
physical collateral in whole or part. Where
physical collateral is used, the minimum ratio of
collateral value to loan size varies among leading MFIs, but normally falls in the range of 70 to
150 percent. Some MFIs allow different percentages for different kinds of clients, with
lower percentages used especially for repeat borrowers with good repayment records and for
those borrowers with strong businesses and cash
flows.
In general, the four Caribbean MFIs have adequate collateral practices, though Portmore
17
from the field—and not enough time in the field
doing such things as character assessments and
developing new business.
CDF’s insistence that all loans be 25 percent
collateralized with cash before the loan is
granted and IPED’s requirement that some loans
have as much as 200 percent collateralization
may unduly restrict the loan applicant pools of
these two MFIs and slow their portfolio growth.
For purposes of delinquency control, however,
the loan underwriting methodologies used by
Portmore CDF and IPED really fall down by
failing to do an adequate character analysis and
instead relying too much on the more easily
quantified elements of loan underwriting: collateral and cash flow. Finally, as discussed below
in the section on Loan Product Design, MEFL’s
use of cash collateral may have some undesirable (and probably unintended) consequences.
Loan Collection
The presence or not of a strong and effective
loan collection program is probably the single
most important factor that explains why some
MFIs have low loan delinquency rates and others have high delinquency rates. An important
element of such programs that one finds in best
practice MFIs is the production and distribution
of reports every morning showing all clients
with delinquent loans as of the end of the previous day. These reports are delivered to all loan
officers and possibly management, so that delinquent clients can be contacted that same day, or
the next day at the latest.
Transactions Costs and Loan Delays
Best practice MFIs minimize the transactions
costs they impose on borrowers and the length
of time it takes from loan inquiry to loan disbursement. These practices increase the value to
borrowers of the MFI’s credit services, and thus
encourage client loyalty and repayment.
While Portmore CDF, JNSBL, and MEFL all
produce and distribute daily delinquency reports,
IPED does not. Although IPED has been trying
to upgrade its MIS for some time to make this
possible, it has suffered a series of setbacks, and
also faces the difficulties of the limited telecommunications infrastructure present in Guyana. As a result, IPED’s loan officers are not
given daily reports showing which of their clients are delinquent, but instead must take their
own time to create such reports, which they
typically do twice a week. These reports exclude
payments made by clients at post offices and
within the week at IPED’s 11 branch offices,
and the reports may contain errors due to the
manual transcription of data on repayments
made at locations other than IPED’s headquarters—all of which further limits their utility.
As can be see in Table 8, the two MFIs with
high delinquency rates (IPED and Portmore
CDF) impose more transactions costs on new
loan applicants and take longer to process and
disburse a first loan than the two MFIs with low
delinquency rates (JNSBL and MEFL). All four
MFIs are reasonably efficient in these regards at
handling repeat loan requests.
Best practice MFIs also minimize the costs that
their loan underwriting process imposes on their
own staff, in order to reduce their own operating
costs and enhance profitability. In best practice
MFIs, loan officers typically spend 80-90 percent of their time in the field, mainly identifying
new clients, analyzing new and repeat loan requests, and trying to collect delinquent accounts.
JNSBL and MEFL structure their lending methodology so as to achieve these high percentages
while IPED and Portmore CDF do not. In the
latter institutions, loan officers spend only 40-50
percent of their time in the field. Loan officers in
these two MFIs spend too much time preparing
and presenting loans for approval, talking to
walk-ins, and doing other tasks that keep them
The response of loan officers and other personnel to delinquency at JNSBL and MEFL are
models of best practice, whereas IPED’s and
Portmore CDF’s responses are relatively slow,
formal, and inactive, and thus are far less effective. For example, MEFL loan officers call the
delinquent client on the first day of delinquency.
This call is done in a friendly way, as a reminder, and has a strong exploratory content:
why was the payment missed? If the loan is still
delinquent by day three, the loan officer’s supervisor calls with a stronger message. By day
18
contrast, by day seven, MEFL and JNSBL have
had at least three contacts with clients and are
getting very serious and tough.
seven, the loan officer is meeting with the entire
group (nearly all loans are group loans in
MEFL) and telling them with utmost clarity that
all group members are in serious danger of losing access to future loan services. A first written
notice is delivered at the group meeting and a
second notice on day 10. By day 14, a demand
notice is delivered, and if the loan is not settled
on that day, references and family members are
called in order to further pressure delinquent
clients and obtain payment. MEFL also has the
right (as specified in its loan contract) to print a
picture of delinquent clients in the newspaper
and to take legal action to recover the money it
is due. So far, MEFL has not had to resort to
these last two actions.
After its initial response of a hand-delivered letter, Portmore CDF follows up by handdelivering second and third deficiency notices
once the loan becomes 30 and 60 days delinquent, respectively. It then turns the matter over
to a bailiff for collection if payment has still not
been received. This procedure lacks the force of
MEFL’s and JNSBL’s repeated client contacts
within the first two weeks of delinquency and
thus fails to give clients a signal that collection
efforts will be very tough. To its credit in this
regard, in the second week of delinquency, IPED
seizes one of the items that the client has
pledged as collateral (typically a television or
music set, which are both items that the client
will miss very much). However, IPED then takes
another month to seize the remaining collateral
and institute legal proceedings. Compared to
JNSBL and MEFL, Portmore CDF and IPED
also appear to be more accepting of excuses
from clients about why they could not repay, and
this also contributes to the much higher delinquency rates observed in the latter two MFIs.
JNSBL loan officers also call clients on the first
day of delinquency and then deliver a first warning letter on day three if the client has not made
arrangements to pay. These actions are followed
by a series of visits and warning letters, leading
up to a third and final delinquency notice on day
15 for those who appear completely unyielding
and unlikely to repay or as late as day 30 for
other delinquent clients. If the loan is still not
satisfied, a bailiff is then dispatched to seize all
of the client’s loan collateral within 2-3 days
after this last notice is delivered. If the sale of
the collateral turns out to be insufficient to settle
all outstanding debts, JNSBL will go to court to
recover as little as US$ 170. Outside lawyers
charge JNSBL US$ 85 per case plus 20 percent
of whatever they recover, a low cost made possible by the fact that the lawyers handle a batch
of these cases at once.
Loan Officer Incentive Pay
In best practice MFIs, an important percentage
of a loan officer’s overall remuneration comes
from an incentive pay scheme. In good incentive
pay schemes, the amount of incentive pay
earned by a loan officer is determined by his/her
portfolio delinquency rate and loan volume.
These schemes normally put a particular premium on keeping delinquency rates low, as is
appropriate given the threat to the MFI posed by
high delinquency rates (see earlier discussion).
Thus, these incentive pay schemes reward loan
officers for doing a good job in loan underwriting (screening out bad credit risks) and loan collection—reinforcing these critical aspects of the
lending methodology. Good incentive pay
schemes also reward loan officers for greater
lending volumes (which can be measured in a
number of ways) because greater lending volumes are also important in helping the MFI to
achieve sustainability and profitability.
As can be seen in Table 9, IPED and Portmore
CDF are slower and less forceful in responding
to delinquency. Portmore CDF loan officers
bring by a deficiency notice about one week after a loan becomes delinquent. This misses the
chance to give the client a reminder phone call
on the first day or two of delinquency that is
friendly but that at the same time signals the seriousness with which delinquency is viewed.
IPED’s initial response to delinquency is similarly anemic: loan officers bring by a deficiency
notice to clients within four to seven days of the
loan becoming delinquent, though if the client
cannot be located, the notice is sent by mail. In
19
Table 9
Are loan delinquency reports
prepared daily for the loan
officers?
Branches included in loan
tracking system?
Initial response to loan delinquency
Subsequent responses to loan
delinquency
Credit Methodology Issues: Loan Collection
IPED
No. Loan officers must use
the MIS to create their own
delinquency reports through
an involved process. These
reports exclude payments
made at post offices and
within the week at branch
offices. Loan officers create
and check delinquency reports only twice a week.
No. Payments made in
IPED’s 11 branches are
manually entered once a
week (based on paper receipts
shipped to headquarters),
giving rise to reporting delays
and potential data input errors.
Relatively slow and formal: a
letter signed by the loan officer’s supervisor or branch
manager is brought by the
loan officer to the client
within 4-7 days. If client not
located, letter is sent by mail.
Relatively slow, formal, inactive, and forgiving: partial
collateral seizure in 2nd week
after delinquency; rest of collateral seized and legal proceedings begun in 2nd half of
2nd month after delinquency
Portmore CDF
Yes. Every day, support staff
prepare a 1st overdue notice
for all clients falling delinquent the previous day.
JNSBL
Yes. Every morning the loan
officers (and management)
receive a report covering all
loan delinquencies through
the end of the previous day.
MEFL
Yes. Every morning the loan
officers (and management)
receive a report covering all
loan delinquencies through
the end of the previous day.
Yes. Payments made in Portmore CDF’s 2 branch offices
are captured for purposes of
the next day’s delinquency
notices.
Yes. Payments made at any
of the 23 JNBS branches or 5
post office locations used by
JNSBL are captured in the
next day’s delinquency report.
Yes. While MEFL has no
branches at present (April,
2005), clients may repay
loans at any of Scotiabank’s
32 branches. All such payments are captured in the next
day’s delinquency report.
Relatively slow and formal: a
letter signed by the loan officer’s branch manager is
brought by the loan officer to
the client after about 1 week
A model of best practices (see
text)
A model of best practices (see
text)
Relatively slow, formal, inactive, and forgiving: after 30
days the loan officer brings
by a 2nd late notice with
somewhat stronger wording;
after 60 days a demand letter
is delivered and the matter is
turned over to a bailiff for
collection (including possible
collateral seizure and court
action)
A model of best practices (see
text)
A model of best practices (see
text)
20
Table 10
Is there an appropriate loan
officer incentive pay scheme
in effect?
Other Credit Methodology Issues and Product Design
IPED
No. No incentive pay scheme
in use at all.
Are there important rigidities
or defects in the loan product
design?
No
Are routine loan monitoring
visits made?
Yes. For all loans, credit is
considered to be supervised,
with all clients visited at least
1-2 times per month.
Portmore CDF
No. While a scheme is used,
it is extremely complex and
overwhelmingly rewards loan
volume, rather than loan quality (low delinquency).
No
JNSBL
A model of best practices (see
text)
MEFL
Appears to be along best
practices lines (see text)
No
Yes. For all loans, a single
visit is made to the client
within 30 days of loan disbursement to make sure the
loan has been used for the
agreed-upon purpose.
Almost no. For 1st loan only,
a single visit is made to the
client within 2 weeks of loan
disbursement to make sure
the loan has been used for the
agreed-upon purpose.
Yes:
a) Group loans—all group
members must have the same
size loan
b) Group and individual
loans—all borrowers must
save 1% of the loan amount
per week. These forced savings cumulate from one loan
cycle to the next and are not
sufficiently accessible to borrowers (see text).
Yes. All loan clients (group
or individual, new or repeat)
are visited at least once per
month.
21
As noted in Table 10, the loan product designs
of the four MFIs are generally satisfactory, with
the exception of two aspects of MEFL’s loan
products. First, MEFL’s group loans require all
group members to have the same size loan, a
rigidity that may cause some clients in the group
to be dissatisfied because their loan is too small
to meet their needs while other clients in the
group are struggling to manage a loan that is too
large. Second, all MEFL clients, whether they
receive a group or individual loan, must save
one percent of their loan amount per week
throughout every loan cycle, a requirement that
is likely to hurt many clients. These forced savings cumulate in a bank account from one loan
cycle to the next and thus can become a substantial percentage of the loan amount after several
cycles (and eventually even exceed the loan
amount). Clients sign an agreement that MEFL
can take these savings to make up for any
amounts owed in the event the client defaults on
the loan. Also, as a matter of official policy, clients can gain access to these forced savings only
if the client leaves MEFL’s loan program or in
the event of an emergency (such as a hurricane
or hospitalization). As an evolving unofficial
policy, MEFL allows clients who have had several loans, and thus have accumulated substantial savings, to withdraw some of these savings
if the clients ask to do so and have a good reason, such as the need to buy equipment or restock inventory in the middle of a loan cycle.
Not all clients are aware of this unofficial policy,
however. MEFL’s forced savings program could
be made more flexible and thus improved, and
should be applied equally to all clients, as we
now discuss.
We observe major differences among the four
Caribbean MFIs in this area, with JNSBL and
MEFL utilizing best practice incentive pay
schemes, Portmore CDF using a deficient
scheme, and IPED employing no scheme at all
(Table 10). The incentive pay schemes used by
both JNSBL and MEFL put a premium on keeping delinquency rates low, as is appropriate.
These schemes also reward larger loan portfolios
and the disbursement of a greater number of new
and repeat loans, which are all important for
growth and sustainability. For example, to qualify for incentive pay in a given month, loan officers in both JNSBL and MEFL must achieve a
portfolio at risk measure of five percent or less
for their individual loan portfolios. Minimum
loan volume targets must also be achieved. For
instance, JNSBL loan officers must disburse an
average of at least 12 new or repeat loans per
week and must achieve a minimum portfolio
size to qualify for incentive pay. For JNSBL
loan officers who meet all of these eligibility
criteria, the amount of incentive pay they receive
for the month is given by several tables that depend on a number of characteristics of the loan
officer’s portfolio for the month: delinquency
rate, outstanding portfolio value, the number of
new plus repeat loans disbursed, and the number
of new loans disbursed.
In contrast to the schemes used by JNSBL and
MEFL, Portmore CDF’s incentive pay scheme
mostly rewards loan volume. Each loan officer’s
incentive pay is a function of two indicators: the
volume of loans (s)he has disbursed during the
month and the volume of loans (s)he has collected during the month. Since loan delinquency
affects collections, portfolio quality does have
some impact on performance pay. However, the
effect is much weaker than in JNSBL and
MEFL, where the loan officer must keep his/her
delinquency rate at five percent or less or else all
incentive pay is lost.
As is commonly the case, MEFL has instituted
its forced savings program for two main reasons:
cash collateral (explained in the previous paragraph) and client savings accumulation. This
second reason refers to the fact that by forcing
their clients to save, MEFL is introducing them
to the discipline and habit of saving and to the
possibilities that having a sizable savings balance could open up for them. For example, a
sizable pool of savings could be used for emergencies, to pay school fees and other large
household expenditures, to buy tools or machinery, or to start another business.
Loan Product Design
As discussed earlier, clients have greater incentives to repay their loans if they are highly satisfied with the package of financial services they
are receiving. An important element of this
package is the design of the loan product itself.
22
riages, funerals, childbirth, festivals, education,
and establishing a household.
Many MEFL clients are likely to be hurt by the
forced savings requirement. These clients could
more quickly increase their incomes and escape
poverty if they were allowed to take some or all
of their forced savings contributions and invest
them in their own businesses—for example, as
additional working capital or to buy tools and
equipment. While MEFL does grant clients access to their forced savings if they have accumulated a substantial sum and ask to use these savings for what MEFL considers to be a good reason, many clients are not aware that they can
even make this request. All of this is not to say
that there aren’t many clients who wouldn’t be
helped by saving—because they need larger
amounts to invest, for example. The critical
question is: will these clients save voluntarily
when it is in their own best interests to do so, or
must they be forced to save because they do not
have the willpower to save even when it is in
their own best interests? Considering these possibilities, the question can be stated more explicitly: how many clients are harmed by MEFL’s
forced savings program (because the clients do
not need so much savings and would be better
off if allowed to save less or nothing at all) and
how many are helped by the forced savings requirements (because the clients need at least this
much savings but lack the willpower to save)?
There is a wealth of empirical evidence that
even the poor save on their own. We do not attempt to review all of this evidence here, but cite
only a few examples. Wright (2000, p. 72) notes
that there are five savers for every borrower in
the renowned Bank Rakyat Indonesia (BRI), a
microfinance institution that has long offered
both credit and voluntary savings services to
many poor people. Another set of institutions
that have also offered both credit and voluntary
savings services to poor clients for a long time
are the Latin American credit unions. Judging
from the available survey evidence on client income levels, the poverty rate of credit union clients in Latin America appears to be roughly
equal to the poverty rate of the clients of other
microfinance institutions in the region, approximately 20-50 percent (Westley, 2001). In a recent IDB/CGAP inventory of 273 of the largest
and most important credit unions in 11 Latin
American countries with major microfinance
markets, there were 2.64 savers for every borrower.12 Both this and the BRI data show that
voluntary savings is a much more widespread
activity than borrowing. Data on the average
size of savings accounts in Latin American
credit unions corroborates the survey evidence
showing that many credit union savers are poor,
thus reinforcing the point that the poor save on
their own in large numbers. For example,
Branch and Klaehn (2002, p. 9) find that 94 percent of the 120,000 savings accounts in 15 leading Bolivian credit unions are under US$ 500,
and have an average balance of US$ 47. Branch
(2002) finds that of the 782,000 savings accounts in 22 leading Ecuadorean credit unions,
81 percent are under US$ 100 and 94 percent are
under US$ 300. Richardson (2002) finds that 89
percent of the 116,000 savings accounts in four
leading Guatemalan credit unions are under US$
300, with an average balance of US$ 29. Finally,
While this question is very difficult to answer
directly, there is ample evidence that the old belief that the poor do not save on their own is
clearly false. In fact, there is a growing consensus around a new view that the poor may be too
poor and vulnerable not to save. The poor, like
all people, face the possibility of both individual
emergencies (such as illness, accidents, death,
fire, theft, increased business competition, and
job loss) and systemic emergencies (such as recessions, inflation, floods, and hurricanes).
These events can exert large downward economic pressures on households. Therefore, poor
households, which may already exist on the
margins of subsistence, have strong motivations
to save, so that they and their families are not
pushed by such events into states of even graver
deprivation such as severe food insufficiency or
even starvation. The poor, like other people, also
save for important life cycle events such as mar-
12
The 11 countries are Bolivia, Colombia, Costa Rica, Dominican Republic, Ecuador, El Salvador, Guatemala, Honduras, Nicaragua, Paraguay, and Peru.
There were 3.37 million savers versus 1.28 million
borrowers. The data generally refer to December
2001.
23
learns that the borrower is sick or has other
problems, or the loan officer just happens to be
nearby and so may pay a quick visit with minimal travel time. The reason for this practice is
that routine visits are simply not cost effective. It
is better for loan officers to spend their time
promoting products, screening applicants for
new or renewed loans, pressuring and collecting
from delinquent borrowers, and trying to head
off arrearages in accounts with signs of potential
trouble. As shown in Table 10, only JNSBL
comes close to meeting this ideal. While excessive monitoring probably does not greatly affect
MFI delinquency rates (either up or down), it
does increase the operating costs of the MFIs
and likely reduces their sustainability.
Richardson (2002) shows that of the 2.44 million savings accounts in 85 credit unions in Bolivia, Ecuador, Guatemala, Romania, and the
Philippines, 94 percent are under US$ 300, with
an average balance of US$ 33.
In light of this new view that the poor have
strong reasons to save and that large numbers of
them do in fact save voluntarily, MFIs with
forced savings programs such as MEFL’s should
reconsider the wisdom of these requirements.
This is because such programs eventually result
in many clients having substantial savings balances (20-30 percent of their loan amounts or
more) that they cannot access or don’t know that
they can access. Such MFIs may well be depriving many of their clients of the capital they need
to expand their businesses now and grow their
own way out of poverty. For this reason, we
suggest that MEFL consider moving toward a
uniform policy that permits all clients to access
their forced savings whenever they want, subject
to maintaining a minimum percentage of their
loan amount in the savings account as cash collateral. As MEFL gains greater experience, it
may want to discard its forced savings program
entirely, just as Latin American MFIs largely
abandoned this element of their group loan
methodology in the 1990s. Instead of utilizing
forced savings as cash collateral, MEFL could
follow the Latin American group lenders and
rely on their clients’ desires to access high quality financial services and MEFL’s provision of
such services as the fundamental motivator of
loan repayment. MEFL could also offer savings
services on a voluntary basis, which would be
based on the non-patronizing idea that poor clients are normally rational and generally act in
their own self interest—saving when it is best
for them to do so. As Wright (2000) discusses,
programs of voluntary, liquid savings can lead to
larger savings balances than programs of forced,
illiquid savings.
Pathways to Profitability and Beyond
If JNSBL and MEFL are the best of the four
MFIs at the core business of making loans and
recovering a high percentage of the resulting
portfolio, then why are they not the most sustainable and profitable of the four MFIs? Returning to Table 7 and its FSS sustainability measure
(percentage of total adjusted costs covered by
revenues) and AROA profitability measure (adjusted return on assets), we see that Portmore
CDF ranks highest on both of these measures
and MEFL ranks lowest. We now discuss these
seemingly paradoxical results and also offer
some possible paths by which each of the four
MFIs could compile a track record of profitability, something that none have yet accomplished
(see the FSS and AROA measures in Annex A).
As discussed earlier, such a track record, in addition to being an end in itself, also opens the
doors to overcoming the final two challenges of
microfinance, accessing commercial funding and
attracting private, for-profit equity investment.
Because the latest year of MEFL data (found in
Table 7) correspond to only its second year of
loan operations, it is hardly surprising that
MEFL’s sustainability and profitability indicators should be as low as they are. More interesting is the case of JNSBL, which is in year five
of loan operations and thus has had time to overcome startup problems, put many initial investment and other costs behind it, and build up a
substantial loan portfolio. With the FSS measure
Loan Monitoring
In best practice MFIs, loan officers do not normally visit loan clients during loan repayment
unless there is a specific reason to do so such as:
the loan has become delinquent, a hurricane or
other shock has hit an area, the loan officer
24
indicating that JNSBL’s revenues cover 91 percent of its adjusted costs,13 JNSBL is close to
achieving sustainability but is still not there yet.
By way of comparison, the average MFI in Latin
America has an FSS ratio of 102 percent,
slightly above full cost recovery.
this advantage is more than counterbalanced by
JNSBL’s high operating costs. The ratio of operating costs to average gross loan portfolio is
87 percent in JNSBL, 60 percentage points
above the Latin American average of 27 percent.
Why are JNSBL’s costs so high? Based on the
data in Table 7, productivity is one possible answer. The number of borrowers per loan officer
in JNSBL is only 236, compared to the Latin
American average of 353. While there is definitely room to improve performance in this area,
JNSBL’s support staff are much more efficient
than their Latin American counterparts, giving
JNSBL a ratio of borrowers to total staff of 114,
nearly equal to the Latin American average of
128. Therefore, although staff efficiency could
certainly be improved, it does not appear to be a
major contributor to JNSBL’s high operating
cost ratio vis-à-vis that of Latin America.
JNSBL charges one percent per week flat interest on its loans, a very high interest rate that,
together with its low delinquency rate, results in
a high portfolio yield of 93 percent.14 This portfolio yield is 49 percentage points above the
Latin American average of 44 percent. However,
13
Adjustments are made for in-kind subsidies and for
funding, provisioning, and inflation costs in order to
eliminate subsidies from the FSS and AROA measures and render these sustainability and profitability
indicators more comparable across MFIs. The Table
7 footnotes describe these adjustments. The adjustments we make are similar, though not identical, to
those made in the Microbanking Bulletin and explained in the Microbanking Bulletin’s Appendix I.
The two major differences between our procedures
and those used by the Microbanking Bulletin are in
the areas of inflation costs and provisioning. On inflation costs, we multiply the inflation rate times all
of the MFI’s equity—rather than equity minus fixed
assets, as done in the Microbanking Bulletin—and
then subtract the result from profits. The reason for
the procedure we have adopted is that while it is true
that the value of real estate tends to rise with inflation, our four MFIs mainly rent, rather than own,
their premises. Thus, their fixed assets largely consist
of equipment and vehicles, whose value does not
generally rise over time with inflation. As for provisioning, Table 7 shows that the average Latin American MFI reporting to the Microbanking Bulletin has a
loan loss reserve equal to 120 percent of their 30-day
portfolio at risk. We adopt the slightly more liberal
loan loss reserve standard of 100 percent of the 30day portfolio at risk. The Microbanking Bulletin uses
a more complex rule for determining the size of MFI
loan loss reserves involving the 90-day and 180-day
portfolios at risk, which we could not implement due
to lack of data.
14
Flat interest is computed on the original loan
amount, rather than on the outstanding balance. For
example, clients with a $100 loan and a flat interest
rate of one percent per week pay $1 per week in interest all during the repayment period, regardless of
their outstanding loan balance. Portfolio yield is defined in Table 7.
One might also be struck with what appears to
be the high average remuneration level of
JNSBL staff, of over US$ 15,000 per year.
While this is high compared to the compensation
paid by many Latin American MFIs, many of
these MFIs operate in countries that are much
poorer than Jamaica. As noted in Table 2, Jamaica’s GDP per capita is just over US$ 3000,
which means that the average annual staff remuneration of JNSBL is just over five times GDP
per capita. This is actually below the Latin
American peer group average of 6.1 given in the
Microbanking Bulletin, issue no. 9 (not shown in
Table 7). Although a somewhat crude test, this
analysis suggests that JNSBL’s remuneration
levels may not be out of line with the Jamaican
standard of living and with what is typically paid
to MFI personnel. A more detailed investigation
of local labor markets would need to be made in
order to better determine whether this is really
true.
The major reason that JNSBL’s ratio of operating costs to average gross loan portfolio is so
high appears to lie not in factors such as productivity and wages that affect the numerator of this
ratio, but, rather, in factors that affect the denominator. In particular, the average outstanding
loan balance per borrower is only US$ 299 in
JNSBL, versus US$ 816 in Latin America. As a
25
MEFL, they have a major advantage in the quest
to achieve sustainability: they make much larger
size loans. The average outstanding loan balance
per borrower is US$ 1088 in IPED and US$
2206 in Portmore CDF, versus US$ 299 for
JNSBL and US$ 151 for MEFL. Since the costs
of making and collecting loans of different sizes
is relatively fixed, an MFI can achieve a much
lower ratio of operating costs to average gross
loan portfolio simply by serving clients who
need larger size loans. Portmore CDF has the
additional advantage of paying relatively low
wages of about three times GDP per capita, versus 5-6 times GDP per capita in the other three
MFIs.
percentage of GDP per capita, the difference is
even more striking: the average outstanding
loan balance per borrower is 10 percent of GDP
per capita for JNSBL vs. 57 percent for the Latin
American peer group. Thus, JNSBL is located in
a middle-income country and is paying middleincome country salaries, while making exceedingly small loans. This appears to be the fundamental contradiction in its operating model and
the main reason it has not achieved profitability.
The previous discussion of JNSBL’s loan underwriting criteria suggests a neat solution. Recall that JNSBL utilizes an extremely conservative underwriting standard: loan payments must
be less than 25 percent of household savings in
the low period (Table 8). Increasing this percentage over time up to the best practices level
of 70-80 percent would allow JNSBL to substantially increase its loan portfolio, decrease its operating cost ratio, and probably improve client
satisfaction and retention rates at the same time.
If done with reasonable care, JNSBL should be
able to avoid overlending and any significant
increase in its loan delinquency rates—all while
maintaining its focus on the low-income clientele it has traditionally served. Other possible
ways for JNSBL to reduce its operating cost ratio include the following: continue to expand the
number of borrowers in order to take advantage
of the economies of scale that exist in the provision of financial services (which are largely a
product of economizing on back-office and other
central-services costs); explore whether it is
worthwhile to continue utilizing all 23 JNBS
offices used by JNSBL or whether profitability
could be increased if JNSBL focused more on a
smaller number of branches; increase average
loan size by reaching out to a greater number of
higher-income clients, who would typically demand larger loans; and finally, as noted earlier,
explore whether labor productivity could be increased, especially for loan officers. Some of
these suggestions, including the liberalization of
JNSBL’s underwriting criteria, require that
JNSBL acquire significant additional loanable
funds, either from the parent company (JNBS)
or from other sources.
What can IPED and Portmore CDF do to
achieve a track record of profitability? The most
obvious suggestion is to implement the bestpractice lending methods discussed in the preceding section and thus bring down loan delinquency rates to single digits and hopefully to
below five percent. A reduction in delinquency
rates reduces loan provisioning costs, increases
loan income and portfolio yield, and has a number of other benefits discussed earlier. In addition, improving lending methods by reducing
transactions costs for borrowers and the time it
takes for new clients to receive a first loan helps
increase client satisfaction and retention rates,
which has a number of salubrious effects on
MFI sustainability. With a greater percentage of
clients satisfied and remaining with the MFI,
client growth rates will increase, not only because there will be fewer dropouts but also because new clients will likely become easier to
attract. This will increase revenues and profits,
with profits rising particularly as clients remain
in the program longer and take out larger loans.
The MFIs will also avoid the high costs of replacing dropouts with new clients who must be
put through a costly initial credit screening process and typically start out with much smaller
loans. Beyond improvements in lending methodology and delinquency rates, the loan officer
and total staff productivity ratios in IPED and
Portmore CDF are quite low compared to the
Latin American peer group (Table 7), and would
seem to offer interesting avenues for reducing
costs. Whether IPED and Portmore CDF should
try to or could increase their profitability by in-
Even though IPED and Portmore CDF are much
weaker at delinquency control than JNSBL and
26
mended in this paper for strengthening MFIs.
They can do this by directly strengthening the
MFIs through the provision of technical assistance support and by helping to expand MFI
loan portfolios by providing funding to these
institutions. With respect to the latter strategy,
governments and donors should avoid making
loans to MFIs that can mobilize deposits or borrow commercially (including from their parent
company) in amounts and tenors sufficient to
meet their funding needs. Moreover, the interest
rates charged by governments and donors on
portfolio funding should be increased over time
as a means of transitioning MFIs to commercial
funding.
creasing loan rates on their relatively larger and
longer term loans is less clear. This question
should be tackled in a market study that examines client satisfaction and the availability, cost,
and desirability of alternative sources of credit.
MEFL’s pathway to profitability is fairly obvious, at least in the short run: continue to expand
its client base and credit portfolio, while maintaining its excellent control over loan quality.
MEFL’s ratio of operating costs to average gross
loan portfolio of 341 percent is artificially high
because of startup costs and the fact that clients
are new and haven’t had much time to progress
to larger loan sizes. This ratio will naturally
come down as MEFL continues to expand operations, as it has been doing. (For example, the
number of clients has grown from 939 in September 2004 to over 1500 in May 2005.) MEFL
could also try to increase its loan officer and
total staff productivity ratios up to at least the
average levels for Latin America, though, again,
MEFL’s numbers may be artificially low because it has so recently begun lending operations. Finally, MEFL could implement the
changes in lending methodology and loan product design discussed in the preceding section,
which should give it a more accurate assessment
of client ability to pay and should also increase
client satisfaction and retention rates.
In light of the lending methodology problems
and related issues identified here (including
weaknesses in management information systems
and loan product design), government and donor
provision of technical assistance to strengthen
Caribbean MFIs is especially critical. However,
it is important to ensure that such technical assistance money is well spent and has the greatest
possible chances of achieving its objectives. The
following guidelines may be helpful in this regard:
•
Conclusions
•
Caribbean MFIs need not simply be prisoners of
small markets distorted by government subsidies. They too can implement best practice lending methodologies and achieve low loan delinquency rates. Two Caribbean MFIs, JNSBL and
MEFL, have shown the way, with impressive
track records of delinquency control. Once delinquency is controlled, Caribbean MFIs can
then go on to compile a track record of profitable operations and ultimately access commercial funding sources and attract private, forprofit equity investment. And as a result of this
process of institution building, MFIs in the Caribbean will be able to serve greater numbers of
microentrepreneurs with improved credit and
other financial services.
Governments and donors can play an important
role in implementing the strategies recom-
•
•
15
Donors and governments should work with
MFIs that are genuinely interested in making
the kinds of changes discussed in this paper.
The disbursement of the technical assistance
funds should be tranched or otherwise conditioned on measurable performance improvements such as reductions in MFI delinquency rates and increases in sustainability or profitability indicators.
Serious consideration should be given to
tying a substantial part of the pay of the consultants providing the technical assistance to
improvements in these same indicators, an
idea that worked very well recently in Peru
with the strengthening of a set of MFIs there
known as the CRACs (Cajas Rurales de
Ahorro y Crédito).15
In the same way, the amount of counterpart
funds the MFIs are required to provide to
This program is IDB/MIF technical assistance no.
ATN/ME 6636-PE and was executed during the period July 2002 to December 2003.
27
neurs and a tolerance for lax loan repayment
should be recast on a commercial footing or else
greatly scaled back or eliminated. Governments
must recognize that they simply do not have the
funds to provide subsidized loans to all micro
and small entrepreneurs who potentially need
credit and could be creditworthy. The only way
to adequately serve this market is through commercial microfinance, in which the reinvestment
of profits and the use of other funds attracted by
these profits permit the rapid growth of lending
operations and the eventual provision of highquality financial services to all creditworthy clients who demand them.
help pay the cost of the technical assistance
program can be made a function of these
same indicators, so that all parties have incentives to pull in the same direction—
another idea from the recent Peruvian operation.
Finally, through policy dialogue and possibly
policy-based lending, donors can try to convince
governments to create conditions conducive to
sustainable microfinance. Government-sponsored programs that damage the market with
cheap loans to micro and small entrepre-
28
References
Accion International. 2002. Prefeasibility Study: Microfinance Operations in Guyana & Suriname. Prepared for Caribbean Microfinance Limited. Boston, Massachusetts: Accion International.
Branch, Brian. 2002. Savings Mobilization. Presented at the conference “Best Practices in Savings Mobilization,” organized by the World Council of Credit Unions (WOCCU), United States Agency for
International Development (USAID), and the German Confederation of Credit Unions (DGRV).
November 5-6, 2002. Washington, D.C.
Branch, Brian and Janette Klaehn. 2002. The Keys to Striking the Balance: An Introduction to Savings
Mobilization. Chapter 1 in Striking the Balance in Microfinance: A Practical Guide to Mobilizing
Savings, eds. Brian Branch and Janette Klaehn. Washington, D.C.: Pact Publications.
Christen, Robert. 1997. Banking Services for the Poor: Managing for Financial Success. Boston, Massachusetts: Accion International.
Richardson, David. 2002. Counting the Costs of Savings Mobilization. Presented at the conference “Best
Practices in Savings Mobilization,” organized by the World Council of Credit Unions (WOCCU),
United States Agency for International Development (USAID), and the German Confederation of
Credit Unions (DGRV). November 5-6, 2002. Washington, D.C.
The MIX (Microfinance Information eXchange). 2003. The Microbanking Bulletin. Issue No. 9. Washington, D.C.: Consultative Group to Assist the Poorest. Website: http://www.MixMarket.org/
USAID. 2004. Caribbean Financial Sector Assessment. Prepared by Deloitte Touche Tohmatsu Emerging Markets, Ltd. Washington, D.C.: United States Agency for International Development.
von Stauffenberg, Damian. 2000. Microfinance in the English Speaking Caribbean. Prepared for the Caribbean Development Bank. Washington, D.C.: MicroRate.
Wenner, Mark and Geoffrey Chalmers. 2001. Microfinance Issues and Challenges in the Anglophone
Caribbean. Micro, Small and Medium Enterprise Division Working Paper. Washington, D.C.: Inter-American Development Bank. Website:
http://www.iadb.org/sds/publication_list_e.htm
Westley, Glenn. 2001. How Poor Are the Clients of Credit Unions and MFIs in Latin America? Scope of
Work for a Survey Research Project. Unpublished. Washington, D.C.: Inter-American Development Bank (IDB) and Consultative Group to Assist the Poorest (CGAP).
Wright, Graham. 2000. Microfinance Systems: Designing Quality Financial Services for the Poor. London: Zed Books.
29
Annex A Time Trend Data for the Four MFIs
Table A1
Jamaica National Small Business Loans (JNSBL)
Reporting Dates -->
3/31/2002
3/31/2003
3/31/2004
1/31/2005
Number of offices (main and branch)
14
19
29
28
Gross portfolio (US$ thousands)
$1,136
$1,142
$1,797
$2,683
Number of borrowers
3,416
3,969
6,520
8,972
Growth rate of US$ gross portfolio (1 year)
0.5%
57.4%
49.3%
Growth rate of number of borrowers (1 year)
16.2%
64.3%
37.6%
Average outstanding loan balance per borrower (US$)
$332
$288
$276
$299
Average loan term (months)
5.0
5.0
5.4
5.5
Portfolio at risk > 30 days (% gross portfolio)
3.3%
1.3%
1.7%
3.3%
Loss provision coverage > 30 days
180%
472%
354%
178%
Operating costs / Average gross loan portfolio
83%
97%
87%
Operating costs / Average number of borrowers (US$)
$265
$269
$251
Borrowers / Loan officers
163
165
176
236
Borrowers / Total staff
81
95
100
114
Average remuneration of all staff (US$ per annum)
$15,170
$16,604
$15,514
Cost of funding liabilities
10.5%
12.9%
6.2%
Portfolio yield
95.7%
107.5%
93.3%
Debt/Equity (=total liabilities/total net worth)
14.9
9.1
6.2
4.0
ROA = return on average assets (before taxes)
-2.5%
-4.0%
1.1%
AROA = adjusted ROA (before taxes)
-6.7%
-8.0%
-5.8%
FSS = % of total adjusted costs covered by revenues
69%
90%
91%
91%
Notes: Data in the table pertain to the one-year period ending at the date shown in each column heading (or for
point-in-time data such as portfolio at risk, to the date itself). The only exception is for the last column, where the
data cover the 10 months ending in January 2005, but are expressed as annual rates as needed in order to be comparable to the data given for the other years. See the footnotes in Table 7 for explanations of some of these series.
Blank cells indicate missing data.
Sources: Inflation rates, bank deposit rates, and exchange rates used in these calculations are obtained from the International Monetary Fund’s International Financial Statistics. All other data are from JNSBL.
30
Table A2
Micro Enterprise Financing Limited (MEFL)
Reporting Dates -->
9/30/2003
9/30/2004
Number of offices (main and branch)
1
1
Gross portfolio (US$ thousands)
$47
$142
Number of borrowers
330
939
Growth rate of US$ gross portfolio (1 year)
200%
Growth rate of number of borrowers (1 year)
185%
Average outstanding loan balance per borrower (US$)
$143
$151
Average loan term (months)
4.0
approx. 4
Portfolio at risk > 30 days (% gross portfolio)
2.7%
5.5%
Loss provision coverage > 30 days
149%
99%
Operating costs / Average gross loan portfolio
1138%
341%
Operating costs / Average number of borrowers (US$)
$1,725
$511
Borrowers / Loan officers
110
117
Borrowers / Total staff
33
55
Average remuneration of all staff (US$ per annum)
$33,070
$17,762
Cost of funding liabilities
4.5%
4.5%
Portfolio yield
51.7%
89.5%
Debt/Equity (=total liabilities/total net worth)
5.0
2.5
ROA = return on average assets (before taxes)
-36.4%
-16.0%
AROA = adjusted ROA (before taxes)
-42.9%
-22.8%
FSS = % of total adjusted costs covered by revenues
20%
32%
Notes: Data in the final column of the table pertain to the one-year period ending on September
30, 2004 (or for point-in-time data such as portfolio at risk, to this date itself). The data in the preceding column cover the period from the start of operations in November 2002 until the end of the
fiscal year in September 2003, but are expressed as annual rates as needed in order to be comparable with the data in the final column. See the footnotes in Table 7 for explanations of some of
these series. Blank cells indicate missing data.
Sources: Inflation rates, bank deposit rates, and exchange rates used in these calculations are obtained from the International Monetary Fund’s International Financial Statistics. All other data
are from MEFL.
31
Table A3
Institute of Private Enterprise Development (IPED)
Reporting Dates -->
12/31/2001
12/31/2002
12/31/2003
12/31/2004
Number of offices (main and branch)
10
10
11
12
Gross portfolio (US$ thousands)
$4,785
$4,904
$5,775
$5,574
Number of borrowers
4,776
5,036
5,508
5,124
Growth rate of US$ gross portfolio (1 year)
2.5%
17.7%
-3.5%
Growth rate of number of borrowers (1 year)
5.5%
9.4%
-7.0%
Average outstanding loan balance per borrower (US$)
$1,002
$974
$1,048
$1,088
Average loan term (months)
7
7
7
7
Portfolio at risk > 30 days (% gross portfolio)
40.3%
53.6%
47.1%
38.0%
Loss provision coverage > 30 days
45%
42%
47%
66%
Operating costs / Average gross loan portfolio
11.6%
12.6%
14.2%
Operating costs / Average number of borrowers (US$)
$114
$127
$151
Borrowers / Loan officers
239
265
250
223
Borrowers / Total staff
75
77
80
73
Average remuneration of all staff (US$ per annum)
$3,939
$4,809
$5,681
Cost of funding liabilities
3.8%
3.3%
2.9%
Portfolio yield
14.3%
17.8%
22.2%
Debt/Equity (=total liabilities/total net worth)
0.9
1.0
1.0
1.1
ROA = return on average assets (before taxes)
1.8%
2.4%
3.2%
AROA = adjusted ROA (before taxes)
-17.6%
-14.9%
-5.8%
FSS = % of total adjusted costs covered by revenues
55%
40%
45%
69%
Notes: Data in the table pertain to the one-year period ending at the date shown in each column heading (or for
point-in-time data such as portfolio at risk, to the date itself). See the footnotes in Table 7 for explanations of some
of these series. Blank cells indicate missing data.
Sources: Inflation rates, bank deposit rates, and exchange rates used in these calculations are obtained from the International Monetary Fund’s International Financial Statistics. All other data are from IPED.
32
Table A4
Portmore Community Development Fund (Portmore CDF)
Reporting Dates -->
12/31/2001
12/31/2002
12/31/2003
12/31/2004
Number of offices (main and branch)
1
1
2
3
Gross portfolio (US$ thousands)
$293
$454
$756
$1,081
Number of borrowers
344
425
438
490
Growth rate of US$ gross portfolio (1 year)
54.7%
66.7%
42.9%
Growth rate of number of borrowers (1 year)
23.5%
3.1%
11.9%
Average outstanding loan balance per borrower (US$)
$853
$1,068
$1,727
$2,206
Average loan term (months)
14.0
14.0
12.8
12.8
Portfolio at risk > 30 days (% gross portfolio)
17.5%
23.2%
15.6%
Loss provision coverage > 30 days
140%
72%
82%
Operating costs / Average gross loan portfolio
22.1%
29.5%
23.9%
Operating costs / Average number of borrowers (US$)
$219
$408
$471
Borrowers / Loan officers
344
283
292
140
Borrowers / Total staff
172
106
49
41
Average remuneration of all staff (US$ per annum)
$11,627
$8,924
$9,196
Cost of funding liabilities
12.5%
10.5%
9.4%
Portfolio yield
27.9%
28.8%
35.4%
Debt/Equity (=total liabilities/total net worth) 1
-7.9
-6.4
-13.1
209.4
ROA = return on average assets (before taxes)
-11.7%
1.3%
7.9%
AROA = adjusted ROA (before taxes)
-6.9%
-3.7%
5.6%
FSS = % of total adjusted costs covered by revenues
74%
89%
122%
Notes: Data in the table pertain to the one-year period ending at the date shown in each column heading (or for
point-in-time data such as portfolio at risk, to the date itself). See the footnotes in Table 7 for explanations of some
of these series. Blank cells indicate missing data.
1
Negative values of the debt/equity ratio in some years are caused by negative values of equity in those years.
Sources: Inflation rates, bank deposit rates, and exchange rates used in these calculations are obtained from the International Monetary Fund’s International Financial Statistics. All other data are from Portmore CDF.
33
Annex B Characteristics of Three Markets for Microfinance:
Jamaica, Guyana, and Belize
The following tables are obtained by direct analysis of the most recent available household surveys for the
three Caribbean countries for which we could obtain these surveys. The following are the surveys we
have analyzed:
•
•
•
Jamaica—April 2002 Labour Force Survey (provides the data in the first column of the top panel of
Table B1, below) supplemented by the 2002 Survey of Living Conditions (provides the remaining
data in Table B1)
Guyana—1999 Survey on Living Conditions
Belize—1999 Labour Force Survey
These are substantial size surveys, covering 6579, 2608, and 2951 earners for Jamaica, Guyana, and Belize, respectively. In all cases, the surveys are representative of the entire country, not merely the urban
areas.
These tables present not only the number of earners of various types, including the number of microentrepreneurs (row 6), but also various characteristics of these earners such as location, age, gender, sector,
and poverty rates. A final column presents the share of total household income derived from business
profits. Some have claimed that households that are more dependent on business income are more likely
to repay their loans on time in order to avoid losing access to loans. On the other hand, households that
are overly dependent on a single source of income may encounter greater difficulties in loan repayment
due to the lack of diversification of their income sources.
In all tables, blank cells indicate missing data. In the case of the Belize table for the number of poor earners (middle panel of Table B3), the number of poor earners in the subcategories generally do not add up to
the total for the entire country given in the first column (e.g., the number of poor earners in urban areas
plus the number of poor earners in rural areas does not equal the total number of poor earners for the entire country). This is the only case where such discrepancies occur. They occur because in the case of Belize the total number of earners (top panel) is obtained from the employed population. The poverty rates
(bottom panel) are obtained as the percentage of all earners reporting income greater than zero whose reported household income per capita falls below the poverty line. These poverty rates are then multiplied
by the totals in the top panel (cell by cell) in order to derive the number of earners in poverty, given in the
middle panel. Because the total numbers of earners (top panel) and the poverty rates (bottom panel) are
derived from two different populations, the aforementioned discrepancies arise.
34
Table B1
Analysis of Jamaica’s April 2002 Labour Force Survey and 2002 Survey of Living Conditions
Number of Earners
Sector
Entire
country
Urban
Areas (1)
Rural
Areas
Single Major
City (2)
Rest of
country
Youth (age Non-youth
24 or less) (> age 24)
Female
Male
Commerce
Services
Manufacturing
Agric. &
livestock
Business
Income/
Total InOther
come
189,888
X
1. All earners (=2 + 5)
955,240
399,219
556,021
132,184
823,056
147,865
807,376
397,494
557,746
195,846
249,159
63,191
257,156
2. Employees - all
3. Of microenterprises
4. Of larger firms (5+ employees)
542,223
194,592
347,631
283,185
73,227
209,958
259,038
121,365
137,673
96,747
20,228
76,520
445,476
174,364
271,111
114,466
40,769
73,697
427,757
153,823
273,934
259,038
105,685
153,353
283,185
88,907
194,278
97,531
26,500
71,031
201,177
90,318
110,859
48,609
7,370
41,239
43,434
22,736
20,698
151,471
47,668
103,803
X
X
X
413,018
116,034
296,984
35,437
377,580
5. Firm owners - all
6. Of microenterprises
408,627
113,682
294,945
34,183
374,444
7. With no employees
387,772
102,549
285,224
30,576
357,196
8. With 1-4 employees
20,855
11,133
9,722
3,606
17,248
9. Of larger firms (5+ employees)
4,390
2,352
2,038
1,254
3,136
(1) Includes Kingston Metropolitan Area (with Portmore and Spanish Town), as well as other urban areas.
(2) Includes only Kingston (excludes Portmore and Spanish Town).
33,399
33,399
32,458
941
0
379,619
375,228
355,314
19,914
4,390
138,457
137,673
131,400
6,272
784
274,561
270,955
256,372
14,583
3,606
98,315
96,433
90,475
5,958
1,882
47,982
47,668
41,866
5,802
314
14,583
14,426
13,015
1,411
157
213,722
213,094
208,547
4,547
627
38,417
37,005
33,869
3,136
1,411
74.8%
74.8%
74.7%
75.8%
82.8%
Agric. &
livestock
63,505
Number of Poor Earners
137,045
25,245
111,800
4,547
132,498
22,109
114,936
58,958
78,088
20,855
Sector
Manufacturing
30,890
5,174
2. Employees – all
3. Of microenterprises
4. Of larger firms (5+ employees)
65,543
39,828
25,716
16,935
8,467
8,467
48,609
31,360
17,248
3,606
1,254
2,352
61,937
38,573
23,364
14,583
8,467
6,115
50,961
31,360
19,600
35,124
23,520
11,603
30,420
16,307
14,112
10,663
4,077
6,586
26,029
21,012
5,018
4,234
941
3,293
10,035
5,802
4,234
14,583
7,997
6,586
5. Firm owners – all
6. Of microenterprises
7. With no employees
8. With 1-4 employees
9. Of larger firms (5+ employees)
71,502
71,502
69,777
1,725
0
8,311
8,311
8,154
157
0
63,191
63,191
61,623
1,568
0
941
941
784
157
0
70,561
70,561
68,993
1,568
0
7,527
7,527
7,370
157
0
63,975
63,975
62,407
1,568
0
23,834
23,834
23,050
784
0
47,668
47,668
46,727
941
0
10,192
10,192
9,722
470
0
4,861
4,861
4,704
157
0
941
941
941
0
0
53,470
53,470
52,529
941
0
2,038
2,038
1,882
157
0
Sector
ManufacServices
turing
12.4%
8.2%
Agric. &
livestock
24.7%
Entire
country
1. All earners (=2 + 5)
Urban
Areas (1)
Rural
Areas
Single Major
City (2)
Rest of
country
Youth (age Non-youth
24 or less) (> age 24)
Female
Male
Commerce
Services
Other
16,621
Poverty Rates
Entire
country
Urban
Areas (1)
Rural
Areas
Single Major
City (2)
Rest of
country
Youth (age Non-youth
24 or less) (age > 24)
Female
Male
Commerce
1. All earners (=2 & 5)
14.3%
6.3%
20.1%
3.4%
16.1%
15.0%
14.2%
14.8%
14.0%
10.6%
2. Employees – all
3. Of microenterprises
4. Of larger firms (5+ employees)
12.1%
20.5%
7.4%
6.0%
11.6%
4.0%
18.8%
25.8%
12.5%
3.7%
6.2%
3.1%
13.9%
22.1%
8.6%
12.7%
20.8%
8.3%
11.9%
20.4%
7.2%
13.6%
22.3%
7.6%
10.7%
18.3%
7.3%
10.9%
15.4%
9.3%
Other
8.8%
12.9%
23.3%
4.5%
8.7%
12.8%
8.0%
23.1%
25.5%
20.5%
9.6%
16.8%
6.3%
17.3%
7.2%
21.3%
2.7%
18.7%
22.5%
16.9%
17.2%
17.4%
10.4%
10.1%
5. Firm owners – all
6. Of microenterprises
17.5%
7.3%
21.4%
2.8%
18.8%
22.5%
17.0%
17.3%
17.6%
10.6%
10.2%
7. With no employees
18.0%
8.0%
21.6%
2.6%
19.3%
22.7%
17.6%
17.5%
18.2%
10.7%
11.2%
8. With 1-4 employees
8.3%
1.4%
16.1%
4.3%
9.1%
16.7%
7.9%
12.5%
6.5%
7.9%
2.7%
9. Of larger firms (5+ employees)
0.0%
0.0%
0.0%
0.0%
0.0%
0.0%
0.0%
0.0%
0.0%
0.0%
Note: Poverty rate calculations use the Department of Labor poverty line of J$ 3015.77 per person per month and household consumption per capita as given in the Survey of Living Conditions.
6.5%
6.5%
7.2%
0.0%
0.0%
25.0%
25.1%
25.2%
20.7%
0.0%
5.3%
5.5%
5.6%
5.0%
0.0%
35
Table B2
Analysis of Guyana’s 1999 Survey on Living Conditions
Number of Earners
Entire
country
Urban
Areas
Rural
Areas
Youth (age 24
or less)
Non-youth
(> age 24)
Sector
Female
Male
Commerce
Manufacturing
Services
Agric. &
livestock
Other
Business
Income/
Total Income
1. All earners (=2 + 5)
206,750
65,625
141,125
21,565
185,185
77,889
128,861
30,243
16,475
19,353
43,661
97,018
X
2. Employees - all
3. Of microenterprises
4. Of larger firms (5+ employees)
148,423
50,079
98,344
18,881
129,542
58,838
89,585
11,938
14,686
15,635
25,767
80,397
X
58,327
15,546
42,781
2,684
55,643
19,051
39,276
18,305
1,789
3,718
17,894
16,621
66.4%
5. Firm owners - all
6. Of microenterprises
58,327
15,546
42,781
2,684
55,643
19,051
39,276
18,305
1,789
3,718
17,894
16,621
66.4%
7. With no employees
48,351
12,415
35,936
2,594
45,757
16,757
31,594
15,478
1,233
3,194
15,064
13,382
65.3%
8. With 1-4 employees
9,976
3,131
6,845
90
9,886
2,294
7,682
2,827
556
524
2,830
3,239
71.6%
9. Of larger firms (5+ employees)
Note: Since the Guyana household survey does not distinguish firms by the number of employees, we have assumed that all firms with employees have 1-4 employees, both in this table and the next two. By way of comparison, the percentage
of firms with 1-4 employees, out of all firms with employees, is 70 percent in Belize and 83 percent in Jamaica.
Number of Poor Earners
Entire
country
Urban
Areas
Rural
Areas
Youth (age 24
or less)
Non-youth
(> age 24)
1. All earners (=2 + 5)
56,636
7,807
48,829
5,765
50,871
19,341
37,295
4,784
Sector
Manufacturing
5,084
4,481
2. Employees - all
3. Of microenterprises
4. Of larger firms (5+ employees)
42,214
6,009
36,205
5,416
36,798
15,613
26,601
2,518
4,740
3,589
9,388
21,979
5. Firm owners - all
6. Of microenterprises
7. With no employees
8. With 1-4 employees
9. Of larger firms (5+ employees)
14,422
14,422
13,563
859
1,798
1,798
1,798
0
12,624
12,624
11,765
859
349
349
349
0
14,073
14,073
13,214
859
3,728
3,728
3,630
98
10,694
10,694
9,933
761
2,266
2,266
2,266
0
344
344
247
97
892
892
892
0
7,679
7,679
7,090
589
3,241
3,241
3,068
173
Agric. &
livestock
39.1%
Female
Male
Commerce
Services
Agric. &
livestock
17,067
Other
25,220
Poverty Rates
Entire
country
1. All earners (=2 & 5)
27.4%
Urban
Areas
11.9%
Rural
Areas
34.6%
Youth (age 24
or less)
Non-youth
(age > 24)
26.7%
27.5%
Female
15.8%
29.7%
21.1%
32.3%
23.0%
36.4%
27.3%
27.2%
27.2%
31.4%
9.9%
12.4%
12.4%
14.6%
0.0%
19.2%
19.2%
20.0%
17.4%
24.0%
24.0%
27.9%
0.0%
42.9%
42.9%
47.1%
20.8%
19.5%
19.5%
22.9%
5.3%
Commerce
24.8%
28.4%
12.0%
36.8%
28.7%
28.4%
26.5%
2. Employees - all
3. Of microenterprises
4. Of larger firms (5+ employees)
24.7%
11.6%
29.5%
13.0%
25.3%
19.6%
5. Firm owners - all
6. Of microenterprises
24.7%
11.6%
29.5%
13.0%
25.3%
19.6%
7. With no employees
28.1%
14.5%
32.7%
13.5%
28.9%
21.7%
8. With 1-4 employees
8.6%
0.0%
12.5%
0.0%
8.7%
4.3%
9. Of larger firms (5+ employees)
Note: Poverty rate calculations use the national poverty line of G$ 6086 per person per month and household consumption per capita from survey.
36
28.9%
Sector
Manufacturing
30.9%
23.2%
Male
Services
Other
26.0%
Table B3 Analysis of Belize’s 1999 Labour Force Survey
Number of Earners
1. All earners (=2 + 5)
78,105
37,245
40,860
24,618
53,487
20,176
57,929
24,138 53,967
5,729
Sector
Business
Income/
ManufacAgric. &
Other
Total Income
turing
livestock
6,332
3,185
21,421 41,437
X
2. Employees - all
3. Of microenterprises
4. Of larger firms (5+ employees)
53,580
26,609
26,971
18,140
35,440
18,146
35,434
18,138 35,442
4,357
4,575
2,162
12,504
29,983
X
5. Firm owners - all
6. Of microenterprises
7. With no employees
8. With 1-4 employees
9. Of larger firms (5+ employees)
(1) Belize City.
24,525
23,621
18,127
5,494
904
10,636
10,446
7,576
2,870
189
13,890
13,174
10,551
2,624
715
6,479
6,367
4,868
1,499
111
18,047
17,254
13,259
3,995
793
2,030
2,000
1,767
233
30
22,495
21,621
16,360
5,261
874
6,001 18,524
5,922 17,699
5,185 12,942
737 4,758
79
825
1,372
1,353
1,053
300
19
1,758
1,739
1,582
157
19
1,024
974
664
311
50
8,917
8,235
6,283
1,951
682
11,455
11,319
8,544
2,775
135
84.2%
83.5%
83.2%
84.5%
89.0%
Entire
country
Urban
Areas
Rural
Areas
Single Major
City (1)
Rest of
country
Youth (age 24
or less)
Non-youth
(> age 24)
Female
Male
Commerce
Services
Number of Poor Earners
1. All earners (=2 + 5)
9,227
2,187
6,058
1,142
6,930
1,992
7,264
2,525
6,651
71
946
Sector
Manufacturing
521
2. Employees - all
3. Of microenterprises
4. Of larger firms (5+ employees)
3,751
1,323
2,204
617
2,744
1,239
2,514
1,352
2,414
36
590
302
1,167
1,431
5. Firm owners - all
6. Of microenterprises
7. With no employees
8. With 1-4 employees
9. Of larger firms (5+ employees)
5,461
5,783
4,681
913
47
904
995
818
0
0
3,809
3,918
3,307
552
39
762
777
676
0
4,149
4,356
3,525
698
41
670
653
555
103
15
4,740
5,080
4,107
763
23
1,138
1,222
1,099
74
0
4,305
4,544
3,555
819
48
34
36
29
0
364
353
301
157
215
245
217
0
0
3,054
3,092
2,696
372
39
1,263
1,400
1,065
313
0
Agric. &
livestock
19.4%
Entire
country
Urban
Areas
Rural
Areas
Single Major
City (1)
Rest of
country
Youth (age 24 Non-youth (>
or less)
age 24)
Female
Male
Commerce
Services
Agric. &
livestock
4,158
Other
2,661
Poverty Rates
11.8%
5.9%
14.8%
4.6%
13.0%
9.9%
12.5%
10.5%
12.3%
1.2%
14.9%
Sector
Manufacturing
16.3%
7.0%
5.0%
8.2%
3.4%
7.7%
6.8%
7.1%
7.5%
6.8%
0.8%
12.9%
14.0%
9.3%
4.8%
22.3%
8.5%
27.4%
11.8%
23.0%
33.0%
21.1%
5. Firm owners - all
24.5%
9.5%
29.7%
12.2%
25.2%
32.6%
23.5%
6. Of microenterprises
7. With no employees
25.8%
10.8%
31.3%
13.9%
26.6%
31.4%
25.1%
8. With 1-4 employees
16.6%
0.0%
21.0%
0.0%
17.5%
44.2%
14.5%
5.2%
0.0%
5.5%
5.2%
49.1%
2.7%
9. Of larger firms (5+ employees)
Note: Poverty rate calculations use the US$ 2/day poverty line (in 1985 purchasing power parity) and household income per capita from survey
19.0%
20.6%
21.2%
10.0%
0.0%
23.2%
25.7%
27.5%
17.2%
5.8%
2.4%
2.7%
2.8%
0.0%
20.7%
20.3%
19.0%
100.0%
21.0%
25.1%
32.7%
0.0%
0.0%
34.3%
37.5%
42.9%
19.1%
5.7%
11.0%
12.4%
12.5%
11.3%
0.0%
Entire
country
1. All earners (=2 & 5)
2. Employees - all
3. Of microenterprises
4. Of larger firms (5+ employees)
Urban
Areas
Rural
Areas
Single Major
City (1)
Rest of
country
Youth (age 24 Non-youth (age
or less)
> 24)
37
Female
Male
Commerce
Services
Other
6.4%


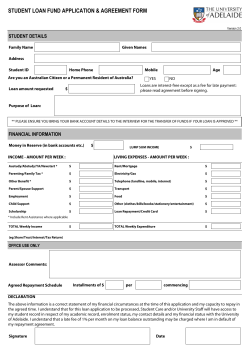


© Copyright 2026