
Edinburgh Research Explorer Prenatal maternal effects on body condition score, female
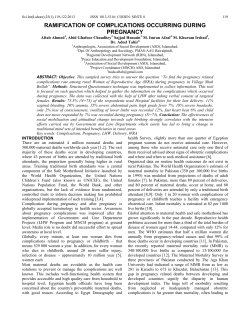
Edinburgh Research Explorer
Prenatal maternal effects on body condition score, female
fertility, and milk yield of dairy cows
Citation for published version:
Banos, G, Brotherstone, S & Coffey, MP 2007, 'Prenatal maternal effects on body condition score, female
fertility, and milk yield of dairy cows' Journal of Dairy Science, vol 90, no. 7, pp. 3490-3499.,
10.3168/jds.2006-809
Digital Object Identifier (DOI):
10.3168/jds.2006-809
Link:
Link to publication record in Edinburgh Research Explorer
Published In:
Journal of Dairy Science
Publisher Rights Statement:
© American Dairy Science Association, 2007
General rights
Copyright for the publications made accessible via the Edinburgh Research Explorer is retained by the author(s)
and / or other copyright owners and it is a condition of accessing these publications that users recognise and
abide by the legal requirements associated with these rights.
Take down policy
The University of Edinburgh has made every reasonable effort to ensure that Edinburgh Research Explorer
content complies with UK legislation. If you believe that the public display of this file breaches copyright please
contact [email protected] providing details, and we will remove access to the work immediately and
investigate your claim.
Download date: 11. Jun. 2014
J. Dairy Sci. 90:3490–3499
doi:10.3168/jds.2006-809
© American Dairy Science Association, 2007.
Prenatal Maternal Effects on Body Condition Score, Female Fertility,
and Milk Yield of Dairy Cows
G. Banos,*1 S. Brotherstone,†‡ and M. P. Coffey†
*Department of Animal Production, School of Veterinary Medicine, Box 393, Aristotle University of Thessaloniki, GR-54124 Thessaloniki,
Greece
†Sustainable Livestock Systems Group, Scottish Agricultural College, Bush Estate, Penicuik, Midlothian, EH26 0PH, United Kingdom
‡School of Biological Sciences, University of Edinburgh, Ashworth Laboratories, King’s Buildings, Edinburgh, EH9 3JT, United Kingdom
ABSTRACT
In this study, maternal effects were described as age
of dam at first and second calving, first-lactation body
condition score (BCS) of the dam during gestation, and
milk yield of the dam. The impact of these effects on
first-lactation daughter BCS, fertility, and test-day
milk yield was assessed. The effect of milk yield of dam
on daughter 305-d yield in the latter’s first 3 lactations
was also investigated. The proportion of total phenotypic variance in daughter traits accounted for by maternal effects was calculated. Dams calving early for
the first time (18 to 23 mo of age) had daughters that
produced 4.5% more first-lactation daily milk, had 7%
higher BCS, and had their first service 3 d earlier than
cows whose dams calved late (30 to 36 mo). However,
daughters of dams that calved early had difficulties
conceiving as they needed 7% more inseminations and
had a 7.5% higher return rate. Cows from second calvings of relatively young (36 to 41 mo) dams produced
6% more first-lactation daily milk, had 2% higher BCS,
and showed a significantly better fertility profile than
cows whose dams calved at a late age (47 to 55 mo).
High maternal BCS during gestation had a favorable
effect on daughter BCS, nonreturn rate, and number
of inseminations per conception. However, it was also
associated with a small decrease in daughter daily milk
yield. Changes in dam BCS during gestation did not
affect daughter performance significantly. Maternal effects of milk yield of the dam, expressed as her permanent environment during lactation, adversely affected
daughter 305-d milk, fat, and protein yield. However,
although the effect was significant, it was practically
negligible (<0.3% of the mean). Finally, overall maternal effects accounted for a significant proportion of the
total phenotypic variance of calving interval (1.4 ± 0.6%)
and nonreturn rate (1.1 ± 0.5%).
Received December 4, 2006.
Accepted March 20, 2007.
1
Corresponding author: [email protected]
Key words: maternal effects, fertility, body condition
score, milk
INTRODUCTION
Early fetal development in most animal species is
influenced by exogenous factors related to the uterine
environment in which they are born. Such factors may
include nutrient intake and partitioning by the dam,
nonnuclear genomic functions, hormones, antibodies,
placental permeability, and maternal behavior, and are
referred to, collectively, as prenatal maternal effects
(for a review, see Mousseau and Fox, 1998). They can
be viewed as the uterine environment a dam offers to
her fetus comprising her own genetic and environmental components, while excluding any genetic effects the
dam transmits directly to the fetus.
The impact of prenatal maternal effects on postnatal
development and adult life of the offspring has not been
documented as well as that of postnatal nursing environment (Rutledge et al., 1972; Rhees et al., 1999). Prenatal uterine environment has been shown to have an
effect on murine growth, mature size, and morphology
(Cowley et al., 1989; Rhees et al., 1999). Barker (1992)
speculated that nutrition of the fetus in early gestation
may influence its fitness as an adult. In the Netherlands, during the winter of 1944–1945, humans were
subjected to starvation rations and subsequent offspring were found to be at increased risk of coronary
heart disease depending on the stage of their mothers’
pregnancy when restricted nutrition had been imposed
(Roseboom et al., 2000). In sheep, the nutritional state
of the ewe during gestation seems to have an impact
on the offspring’s future reproductive performance
(Gunn et al., 1995; Borwick et al., 1997). For a review
of the intergenerational effects of fetal programming,
see Drake and Walker (2004).
In dairy cattle, calves are removed from their dams
immediately after calving; hence, any maternal effect
on the calf would be a combination of prenatal uterine
environment and cytoplasmic inheritance. Maternal
3490
3491
PRENATAL MATERNAL EFFECTS
lineage, implying cytoplasmic (mitochondrial genetic)
effects, may account for a small but significant proportion of the variation in future offspring milk production
(Schutz et al., 1992; Albuquerque et al., 1998). Jamrozik
et al. (2005) reported sizeable proportions of the total
variation in reproduction and fertility traits of Canadian Holsteins being due to overall maternal effects.
Small but significant maternal effects on Norwegian
heifer performance were reported by A.-Ranberg et
al. (2003).
Very few studies have been conducted on the effect
of the prenatal uterine environment on adult traits of
the calf. Pryce et al. (2002) investigated the effect of
maternal diet during gestation on heifer fertility but
found no significant associations. However, this was
attributed mainly to the lack of sizeable variation in
the nutritional status of the pregnant cows raised on
the research farm where that study was conducted.
A pregnant cow’s capacity to care for her embryo is
largely determined by the way she partitions nutrients
to support fetal development together with her own
growth, maintenance, and milk production. Although
the energy requirements of a developing embryo at the
blastocyst stage may be very small, the maternal uterine environment of a high-yielding cow may create an
effect on her offspring via hormonal or other routes
that are detectable in the offspring’s own life through
a number of traits such as milk production, disease
resistance, survival, BCS, body energy, and fertility.
Conceptually, a dam’s own energy level may be deduced
from her BCS, milk production, and age at calving.
These can be viewed as indicators of maternal environment during gestation. For example, BCS is associated
with the amount of energy available to sustain growth,
production, and fetal development. Milk yield is the
main competitor of the fetus for nutrients and energy.
Age at calving manifests the state of development of
the dam during gestation regarding her own growth.
Fuerst-Waltl et al. (2004) reported a significant association of age of the dam with milk production and longevity of the offspring.
The objectives of this study were a) to investigate the
impact of the dam’s age at calving, BCS and milk yield
on offspring BCS, fertility, and milk production traits
and b) to estimate the maternal variance component
for these traits.
MATERIALS AND METHODS
Traits of interest were mainly first-lactation BCS,
measured on a scale from 1 (thin) to 9 (fat) according
to Jones et al. (1999), calving interval (CI), interval
between calving and first service (DFS), number of inseminations per conception (NINS), nonreturn rate at
Table 1. Descriptive statistics of first-lactation cow traits
Trait1
Mean
SD
Minimum
Maximum
BCS2
CI, d
DFS, d
NINS, n
NR56
MY3, kg
4.40
401.7
87.0
1.74
0.67
26.5
1.65
57.4
31.6
1.08
0.47
5.9
−1.5
301
3
1
03
5.0
10.5
599
200
10
1
59.8
1
CI = calving interval; DFS = interval from calving to first service;
NINS = number of inseminations per conception; NR56 = nonreturn
rate 56 d post first insemination; MY3 = daily milk yield on third
test-day.
2
Standardized according to Brotherstone (1994).
3
0 = cow returned to service within 56 d.
56 d post-first insemination (NR56), and milk yield on
the day of the third test (MY3). These traits are routinely considered in a hexavariate analysis for the computation of official national genetic evaluations for cow
fertility in the United Kingdom (Wall et al., 2003a).
Records were obtained from the UK national fertility
database and were first validated according to Kadarmideen and Coffey (2001). The total number of fertility
records was 228,229, spanning the calving year period
1997–2005. Table 1 describes these 6 traits.
Four separate studies were conducted to investigate
the impact of maternal effects on these traits, considering i) the effect of calving age of the dam on offspring
performance, ii) the effect of BCS of the dam during
gestation on offspring performance, iii) the effect of milk
yield of the dam on offspring performance, and iv) the
proportion of the total variation in offspring traits due
to the dam. The UK national genetic evaluation model
for MY3, BSC, and fertility traits (Wall et al., 2003a)
provided the base model for these analyses. Additional
effects fitted were those whose impact the present study
had set out to investigate, as described next. In all
cases, REML variance component and effect solutions
were calculated with the ASREML software package
(Gilmour et al., 2002).
Age of Dam at Calving
Pairs of dams and daughters with validated fertility
records were obtained from the UK national database
used for fertility genetic evaluations. Daughters were
from the first 2 recorded calvings of each dam. There
were 13,703 first-calving records in which the average
dam age was 27.4 mo (standard deviation = 3.25 mo).
Based on its distribution, age at first calving was divided into 3 classes: 18–23 mo (early first calvings), 24–
29 mo (intermediate first calvings), and 30–36 mo (late
first calvings). There were also 11,269 second-calving
records with average dam age of 39.8 mo (standard
Journal of Dairy Science Vol. 90 No. 7, 2007
3492
BANOS ET AL.
deviation = 3.83 mo). In this case, age was divided into
4 classes: 30–35 mo (early second calvings), 36–41 mo
(early-intermediate second calvings), 42–46 mo (intermediate-late second calvings), and 47–55 mo (late second calvings). The impact of age class of the dam on
the daughter traits of interest was assessed with the
use of the following model; separate analyses were conducted for first and second calvings:
Yijkm = HYi + Mj + Ak + a1 ⴢ age
+ a2 ⴢ phol + a3 ⴢ mlkc + a4 ⴢ dim + a5 ⴢ bcsd
[1]
+ a6 ⴢ mlkd + cowm + eijkm
where Yijkm = the first-lactation record (BCS, CI, DFS,
NINS, NR56, or MY3) of cow m (daughter) in herd-year
of calving i that calved in month j whose dam was in
age-class k; HYi = fixed effect of herd-year of calving
interaction i, Mj = fixed effect of calving month j (j =
1–12), Ak = fixed effect of age-class of the dam k, a1 =
regression (linear and quadratic) on age at calving of
the cow (age), a2 = regression (linear) on percentage of
North American Holstein genes of the cow (phol), a3 =
regression (linear) on MY3 of the cow (mlkc, for Y =
BCS or fertility), a4 = regression (linear and quadratic)
on DIM of the cow (dim, for Y = BCS or MY3), a5 =
regression (linear) on dam EBV for BCS (bcsd, firstcalving analysis) or on dam BCS (bcsd, second-calving
analysis), a6 = regression (linear) on dam MY3 (mlkd,
for second-calving analysis only), cowm = random effect
of cow m (including pedigree genetic relationships
among animals), and eijkm = random residual term.
Each trait was analyzed separately.
The effect of interest in model [1] was the age-class
of the dam (A). Days-in-milk adjusted MY3 of the cow
(daughter) was included in the analysis of BCS and
fertility to assess the effect of dam age on these traits
for constant milk yield. Body condition score and MY3 of
the dam (each adjusted for DIM) were added to remove
sources of biological variation that might have otherwise masked the age of the dam effect. Because such
data were not available for first-calving analysis, the
dam EBV for BCS was included as a proxy to her body
condition prior to first calving. All other effects fitted
in model [1] were as defined in the UK national genetic
evaluation model for BCS and fertility traits (Wall et
al., 2003a). Furthermore, possible genetic trends affecting the traits of analysis were accounted for by the
inclusion of a cow genetic effect and pedigree information.
BCS of Dam During Gestation
Data for this exercise were the 11,269 second-calving
records that were considered in the previous analysis.
Journal of Dairy Science Vol. 90 No. 7, 2007
These included first-lactation BCS, CI, DFS, NINS,
NR56, and MY3 records of dams and respective daughters from the dams’ second calvings.
Each cow in the data had a single BCS record. To
predict BCS during lactation and gestation, individual
cow BCS records were fitted in a random regression
model including DIM-adjusted MY3 and DIM when
BCS was recorded. The latter was modeled with a
fourth-order Legendre polynomial for the fixed curve
and a second-order Legendre polynomial for the random
deviation of individual cows from the fixed curve. Different fixed curves were calculated for each of the 3 age
at first calving classes: early (18–23 mo), intermediate
(24–29 mo), and late (30–36 mo) calvings. Cow solutions
were obtained by adding the individual random effect
to the corresponding fixed curve solution. This model
allowed the prediction of adjusted cow BCS across a
time trajectory, defined here as d 4 to 400 postpartum. A
similar approach to analyzing single records per animal
was proposed by Tsuruta et al. (2004). Cow solutions
were subsequently de-regressed by first subtracting the
appropriate fixed curve solution, then dividing by the
estimated reliability and, finally, adding back the fixed
curve solution (Wall et al., 2003b). For each cow, deregressed BCS values corresponding to the last day of
each month of gestation were kept.
The entire process was repeated with the analysis of
individual cow BCS as single measures with a model
including DIM-adjusted MY3, DIM when BCS was recorded, and cow (random). Cow solutions were de-regressed by dividing by their respective reliabilities.
The above exercise involved all cows in the data.
Dams with offspring with records in the data set were
matched to their own de-regressed BCS solutions. The
effect of BCS of the dam on daughter performance was
then assessed with the use of the following model:
Yijm = HYi + Mj + a1 ⴢ age + a2 ⴢ phol
+ a3 ⴢ mlkc + a4 ⴢ dim + a5 ⴢ bcsc
[2]
+ a6 ⴢ bcsd + cowm + eijm
where Yijm = the first lactation record (BCS, CI, DFS,
NINS, NR56, or MY3) of cow m (daughter) in herdyear of calving i that calved in month j, a5 = regression
(linear) on BCS of the cow (bcsc, for Y = MY3 or fertility),
a6 = regression (linear and quadratic) on de-regressed
solutions for BCS of the dam (bscd); HYi, Mj, a1, a2, a3,
a4, cowm, and eijm are defined as in model [1].
The regression of interest in model [2] was that of
cow (daughter) trait on BCS of the dam (a6). The latter
were de-regressed cow effect solutions either from the
single measure analysis or for mo 1 to 9 of gestation
3493
PRENATAL MATERNAL EFFECTS
from fitting a random regression model. In the latter
case, 9 consecutive analyses took place for each trait.
In addition, changes in de-regressed dam BCS during
gestation were considered as independent variables in
model [2] to assess their effect on offspring performance. Changes were expressed either as differences
of BCS on each gestation month (1 to 9) from BCS on
the day of conception or as regressions of monthly BCS
on time. The latter represents the average estimated
BCS change during gestation. When model [2] included
a BCS change effect, dam BCS level corresponding to
day of conception was also fitted. Thus, the effect of
BCS change during gestation was assessed for constant
BCS level at the onset of gestation.
Body condition score (adjusted for DIM) of the cow
(daughter) was included in the analysis of MY3 and
fertility to account for the additive genetic BCS effect
the dam directly transmits to her daughter and the
additive genetic correlation among traits. Hence, the
marginal effect estimated for BCS of the dam would
describe the noninherited maternal uterine effect associated with her energy level during gestation. In the
analysis of BCS of the cow, the effect of BCS of the dam
would be a combination of additive genetic and prenatal
maternal components.
Milk Yield of Dam During Lactation
For the purposes of this exercise, permanent environment solutions for all cows were obtained from the official UK national genetic evaluation for milk yield. The
latter is calculated with a random regression model
analysis of repeated test-day records of the first 3 lactations (Mrode et al., 2005). Permanent environment solutions for milk yield represent the noninherited proportion of variation during a cow’s lactation and were used
here to describe maternal environment.
The permanent environment solutions for milk yield
on the last day of each month of lactation were extracted
for all cows with at least 10 test-day records in the
official analysis that also had daughters with validated
fertility data. These monthly dam permanent environment solutions were then matched with their daughters’ first-lactation BCS, fertility, and MY3 data. A total
of 19,922 records was considered for this analysis. The
effect of the dam’s permanent environment solution for
milk yield on cow (daughter) BCS, fertility, and MY3
was assessed using the following model:
Yijlm = HYi + Mj + a1 ⴢ age + a2 ⴢ phol + a3 ⴢ mlkc [3]
+ a4 ⴢ dim + a5 ⴢ mlkd + lcdl + cowm + eijlm
where Yijlm = the first-lactation record (BCS, CI, DFS,
NINS, NR56, or MY3) of cow m (daughter) in herd-year
of calving i that calved in month j, lcdl = fixed effect of
lth lactation of the dam leading to the birth of cow m
(l = 1 to 3), a5 = linear regression on monthly permanent
environment solution for milk yield in lth lactation of
the dam (mlkd); HYi, Mj, a1, a2, a3, a4, cowm, and eijlm
are defined as in model [1].
Monthly dam permanent environment solutions for
milk yield were also matched with their daughters’ 305d milk, fat, and protein yield records. A total of 43,395
records of 19,922 daughters in their first 3 lactations
were considered for this analysis. The effect of the dam
permanent environment solution for milk yield on
daughter 305-d yield was assessed using the following model:
Yijklm = (HYi + Mj + a1 ⴢ age + a5 ⴢ mlkd)k
[4]
+ a2 ⴢ phol + lcdl + cowm + pem + eijklm
where Yijklm = the record (305-d milk, fat, or protein
yield) of cow m (daughter) in lactation k in herd-year
of calving i that calved in month j, k = fixed effect
of lactation of cow m (k = 1 to 3), pem = permanent
environment associated with cow m; HYi, Mj, a1, a2, a5,
lcdl, cowm, and eijklm are as defined in model [3].
The regression of interest in models [3] and [4] was
that of cow (daughter) performance (BCS, fertility,
MY3, or 305-d yield) on milk yield of the dam (a5). The
latter were permanent environment solutions for milk
yield of the dam, for mo 1 to 10 of her lactation. Their
impact was assessed in 10 consecutive analyses for each
trait. In the case of 305-d daughter yield, separate coefficients were calculated for each of the 3 daughter lactations. The estimated effects represented the noninherited maternal effect associated with milk production
during the dam’s lactation. Because permanent environment solutions were available only for the first 305
d of lactation, the full gestation of the dam could not
be modeled; therefore, associations with milk yield of
the dam during gestation were not made.
Variance Due to the Dam
Data for this exercise were obtained from the UK
national fertility database comprising first-lactation individual cow records on CI, DFS, NR56, NINS, BCS,
and MY3, as described previously. Only dams with multiple daughters having validated fertility records were
kept. This data structure ensures proper estimation of
variance components including maternal effects (Maniatis and Pollott, 2003). A total of 19,623 cow records
from 7,340 dams were analyzed.
The following model was used to estimate variance
components:
Journal of Dairy Science Vol. 90 No. 7, 2007
3494
BANOS ET AL.
Table 2. Effect of maternal age at first calving (SE in parentheses),
expressed as deviation from the early calving class (18–23 mo), on
first-lactation cow performance
Age class of the dam
1
Trait
24–29 mo
BCS
CI
DFS
NINS
NR562
MY3
−0.15
−2.11
0.16
−0.10
0.04
−0.52
(0.05)
(1.88)
(1.03)
(0.04)
(0.02)
(0.18)
P-value
0.00*
0.26
0.88
0.01*
0.02*
0.00*
30–36 mo
−0.31
1.11
2.98
−0.12
0.05
−1.18
(0.06)
(2.09)
(1.15)
(0.04)
(0.02)
(0.20)
P-value
0.00*
0.59
0.01*
0.00*
0.01*
0.00*
1
CI = calving interval; DFS = interval from calving to first service;
NINS = number of inseminations per conception; NR56 = nonreturn
rate 56 d post-first insemination; MY3 = daily milk yield on third
test-day.
2
0 = cow returned to service within 56 d.
*Significant at P = 0.05.
Yijkm = HYi + Mj + a1 ⴢ age + a2 ⴢ phol
[5]
+ a3 ⴢ mlkc + a4 ⴢ dim + cowm + damk + eijkm
where Yijkm = the first-lactation record (BCS, CI, DFS,
NINS, NR56, or MY3) of cow m (daughter) in herd-year
of calving i that calved in month j, damk = the random
genetic effect of the dam of cow (including genetic relationships among animals); HYi, Mj, a1, a2, a3, a4, cowm,
and eijkm are defined as in model [1].
In model [5], cow represented the direct additive genetic effect and dam was the overall maternal genetic
effect. The latter includes both prenatal uterine and
cytoplasmic components and might be thought of as
any maternal contribution beyond that of the nuclear
genome. The percentage of total phenotypic variance
accounted for by the maternal effect would determine
its importance for the traits in question. Efforts to include a direct by maternal interaction effect were computationally unsuccessful.
RESULTS AND DISCUSSION
Age of Dam at Calving
Age at calving indicates the stage of a pregnant cow’s
development and may be associated with the proportion
of nutrients expended during gestation to support her
own growth vs. development of the fetus.
The effect of maternal age at first and second calving
on first-lactation daughter performance is shown in Tables 2 and 3, respectively. In both cases, the solution
of the first class (early calvings) was set to zero and the
effects of the other class solutions were expressed as
deviations from the first. All other fixed effects included
in model [1], representing sources of systematic variation, were statistically significant (P < 0.05). Some firstJournal of Dairy Science Vol. 90 No. 7, 2007
calving data examples are presented here to illustrate
the point. Regression coefficients for percentage of
North American Holstein genes were −0.003 (±0.001),
0.092 (±0.006) kg, 0.171 (±0.051) d, 0.081 (±0.031) d,
0.002 (±0.001), and −0.0009 (±0.0004) for BCS, MY3,
CI, DFS, NINS, and NR56, respectively. This suggests
that an increase in the percentage of North American
Holstein genes was associated with improved milk production but slightly compromised BCS and fertility.
Similarly, the regression on cow MY3 that had been
included in the analysis of BCS and fertility to ensure
assessment of the effect of dam age for constant milk
yield, was −0.012 (±0.002) for BCS, 0.560 (±0.085) d for
CI, 0.412 (±0.045) d for DFS, 0.007 (±0.002) for NINS,
and −0.003 (±0.001) for NR56.
The age of the dam at her first calving had a significant (P < 0.05) effect on daughter BCS, DFS, NINS,
NR56, and MY3 (Table 2). Daughters of older dams had
lower BCS, paradoxically produced less daily milk, and
needed more days to first service. In fact, daughters
from late calvings (30–36 mo) had 0.31 lower BCS (7%
of the mean), produced 1.18 kg less milk (4.5% of the
mean), and had their first service almost 3 d (3.4% of
the mean) later than daughters from early calvings (18–
23 mo). On the other hand, cows whose dams calved at
intermediate or older age needed fewer inseminations
per conception and had fewer returns to estrus (i.e., a
higher proportion conceived in first insemination).
Thus, the nonreturn rate of daughters from the 24–29
mo and the 30–36 mo maternal age class was 6 and
7.5% higher than those from the early calving class
(18–23 mo), respectively. Furthermore, the later calving groups needed 6 to 7% fewer inseminations per
conception compared with the early group. The opposing combined effects on NR56, NINS, and DFS resulted
in nonsignificant differences between CI of daughters
from different maternal age classes.
The significance of this result was corroborated by a
side analysis of the same data using model [1], except
that age of dam was now fitted as a linear and quadratic
regression instead of a class variable. Significantly (P
< 0.05) negative linear regressions were observed for
BCS, NINS, and MY3, and positive for DFS and NR56.
The quadratic regression was significant only for NINS
and NR56.
A first-calving cow is frequently a growing cow (Coffey
et al., 2006). Therefore, she requires nutrients for both
maintenance and her own body development during
first lactation. During the pregnancy period leading to
this first calving, the fetus may face intense competition
for nutrients from its mother’s own metabolic needs. As
a consequence, early-calving cows may produce calves
with difficulties at conceiving as first-lactation cows, as
manifested by the adverse impact on NINS and NR56.
3495
PRENATAL MATERNAL EFFECTS
Table 3. Effect of maternal age at second calving (SE in parentheses), expressed as deviation from the
early calving class (30–35 mo), on first-lactation cow performance
Age class of the dam
1
Trait
BCS
CI
DFS
NINS
NR562
MY3
36–41 mo
−0.07
5.93
2.49
0.08
0.00
−0.64
(0.05)
(1.75)
(0.96)
(0.04)
(0.01)
(0.16)
P-value
0.14
0.00*
0.01*
0.03*
0.86
0.00*
42–46 mo
−0.17
9.33
4.47
0.09
0.00
−1.16
(0.06)
(1.99)
(1.09)
(0.04)
(0.02)
(0.18)
P-value
47–55 mo
−0.07
13.15
7.95
0.12
−0.01
−1.56
0.00*
0.00*
0.00*
0.02*
0.88
0.00*
(0.08)
(2.85)
(1.59)
(0.06)
(0.02)
(0.26)
P-value
0.40
0.00*
0.00*
0.05*
0.71
0.00*
1
CI = calving interval; DFS = interval from calving to first service; NINS = number of inseminations per
conception; NR56 = nonreturn rate 56 d post first insemination; MY3 = daily milk yield on third test-day.
2
0 = cow returned to service within 56 d.
*Significant at P = 0.05.
This is a marginal effect adjusted for the cow’s own age
at calving. These cows seem to mature early, exhibiting
the characteristics of high-producing Holsteins, but
they can not conceive as easily as cows born to older
first-calving dams.
The age of the dam at her second calving had a significant (P < 0.05) effect on all daughter traits except
NR56 (Table 3). Clear trends were observed for increasing CI, DFS, and NINS and decreasing MY3 with the
age of the dam. In general, daughters from late-calving
dams had longer intervals from calving to first service,
meaning they delayed showing evident estrus by up to
8 d (9% of the mean) and needed as many as 7% more
inseminations per conception; consequently, they had
longer CI. In addition, they produced nearly 6% less
MY3 than their early calving (30–35 mo) counterparts.
They also had lower BCS, although the effect was statistically significant (P < 0.05) only in the case of intermediate-late calvings (42–46 mo).
Fitting age at second calving as a linear and quadratic
regression instead of a class variable supported these
findings as the linear regression was significantly (P
< 0.05) negative (unfavorable) for BCS and MY3 and
positive (unfavorable) for CI, DFS, and NINS. The quadratic regression was significant only for CI.
Second-calving Holsteins are usually animals that
have completed their growth phase. As cows age, the
frequency of chromosomal abnormalities increases,
with consequences for the offspring’s productive and
reproductive life. Fuerst-Waltl et al. (2004) reported
decreasing milk production, nonreturn rate, and longevity with maternal age in Austrian dual-purpose Simmental cows. Admittedly, their data spanned a wider
range of ages, reaching a maximum of 16 yr compared
with 4.5 yr in the present study. However, Simmentals
mature later than Holsteins. Furthermore, the effect
was evident even for early age classes in the FuerstWaltl et al. (2004) study; for a maternal age class of
4 to 5 yr, first-lactation ECM yield was reduced by
approximately 1% (P < 0.01) and nonreturn rate decreased by 3% (P = 0.24) compared with a maternal age
class of 2 to 3 yr (Fuerst-Waltl et al., 2004). No other
similar studies on dairy cattle were found in the literature. Wang and vom Saal (2000) reported delayed puberty in mice born to older dams.
BCS of Dam During Gestation
The BCS of a pregnant cow is associated with the
amount of energy available to her to sustain growth,
maintenance, milk production, and fetal development.
In this respect, a cow’s BCS level and change during
gestation can be associated with the proportion of energy expended to cover the needs of the embryo, which
can potentially affect the latter’s future performance
as a milk-producing cow.
In the present study, the effect of dam BCS, derived
from a single measure analysis, on first-lactation
daughter performance is shown in Table 4. All other
fixed effects included in model [2] were statistically
significant (P < 0.05). For example, regression coefficients for the percentage of North American Holstein
Table 4. Effect of maternal BCS, derived from single measure analysis, on first-lactation cow performance (SE in parentheses)
Trait1
BCS
CI
DFS
NINS
NR562
MY3
Linear
regression
0.08
−0.78
−0.30
−0.03
0.01
−0.09
(0.01)
(0.46)
(0.23)
(0.01)
(0.00)
(0.04)
P-value
0.00*
0.09
0.19
0.00*
0.00*
0.01*
Quadratic
regression
0.01
0.07
−0.06
0.01
0.00
0.01
(0.00)
(0.19)
(0.09)
(0.00)
(0.00)
(0.01)
P-value
0.03*
0.72
0.53
0.10
0.44
0.66
1
CI = calving interval; DFS = interval from calving to first service;
NINS = number of inseminations per conception; NR56 = nonreturn
rate 56 d post first insemination; MY3 = daily milk yield on third
test-day.
2
0 = cow returned to service within 56 d.
*Significant at P = 0.05.
Journal of Dairy Science Vol. 90 No. 7, 2007
3496
BANOS ET AL.
genes were −0.007 (±0.003), 0.023 (±0.008) kg, 0.134
(±0.059) d, 0.039 (±0.020) d, 0.0036 (±0.0017), and
−0.0007 (±0.0004) for BCS, MY3, CI, DFS, NINS, and
NR56, respectively. Furthermore, the regression on cow
MY3 was −0.046 (±0.004) for BCS, 0.591 (±0.139) d for
CI, 0.291 (±0.071) d for DFS, 0.007 (±0.003) for NINS,
and −0.0009 (±0.0004) for NR56. These effect solutions,
which are based on the analysis of cow records from
second dam calvings, were similar to those from model
[1], as reported earlier, pertaining to cow records from
the first calvings of their dams.
The effect of dam BCS on daughter BCS was positive
and, to a certain extent, is affected by the additive genetic heritability. The analysis of the other traits, however, had accounted for BCS of the daughter and hence
for the additive genetic correlation between these traits
and BCS. Therefore, the estimated effect of dam BCS
on daughter fertility and MY3 was free from any direct
genetic component and reflected the prenatal maternal
environment as described by the body energy content
and body condition of the dam. This effect was significantly (P < 0.05) negative on NINS and MY3, and positive on NR56 (Table 4). This means that dams offering
a high-energy uterine environment to the fetus had
offspring with improved fertility but slightly reduced
test-day milk yield. A 1-point increase in maternal BCS
level (on the 1 to 9 scale) would result in a 1% higher
nonreturn rate, 0.03 fewer inseminations per conception, and 90 g less daily milk produced by the offspring.
Higher dam BCS would also shorten CI and DFS but
this result was not statistically significant in the present study (P = 0.09 and P = 0.19, respectively).
The effect of BCS of the dam at different stages of
gestation on daughter NINS, NR56, and MY3 is shown
in Figure 1. These 3 traits were significantly affected
by the prenatal environment expressed by the overall
body condition of the dam (Table 4). Results presented
in Figure 1 are from 10 separate analyses considering
predicted dam BCS at the day of conception and then
at 30-d intervals corresponding to the 9 mo of gestation.
The effect was more pronounced during the second and
third trimesters of gestation. This may be associated
with critical phases in the development of the embryo.
Thus, cows that maintain high BCS in mid to late gestation appear to produce offspring with improved fertility
but slightly reduced test-day milk. The opposing signs
for these effects are probably associated with the antagonistic relationship between milk yield and fertility.
Furthermore, MY3 was evidently more affected by dam
BCS during the last 2 mo of gestation (Figure 1). The
latter coincides with the cow’s dry period. It can be
speculated that cows that build good body condition
during this period are likely to have offspring more
Journal of Dairy Science Vol. 90 No. 7, 2007
Figure 1. Effect of maternal BCS in different months of gestation
of the dam on first-lactation cow performance. NINS = number of
inseminations per conception; NR56 = nonreturn rate 56 d post first
insemination (0 = cow returned to service); and MY3 = daily milk
yield on third test-day.
inclined to reserve energy for the benefit of body condition and fertility rather than expend it to produce milk.
Changes in dam BCS during gestation had no significant effect (P > 0.05) on daughter performance. Results were the same whether changes had been expressed as differences of BCS on each gestation month
(1 to 9) from BCS on the day of conception or as regressions of monthly BCS on time. On average, dam BCS
increased by 0.04 (standard deviation = 0.13) points
(de-regressed solutions) during gestation. The effect of
this change was adjusted for BCS at the onset of gestation so it was assessed for a constant level of BCS for
all cows. The most notable findings here were an increase of daughter BCS by 0.79 (±0.48; P = 0.10) for
each 1-point increase in maternal BCS gain and a corresponding daily milk reduction of 2.31 kg (±1.50; P =
PRENATAL MATERNAL EFFECTS
3497
0.12). A 1-point increase in BCS gain is only a theoretical figure, as in our data the absolute maximum change
was 0.45 points. These results suggest that dams with
above average BCS gains during gestation may produce
better conditioned daughters that yield slightly less
daily milk.
Milk Yield of Dam During Lactation
Impact on Daughter First-Lactation Traits. Milk
yield is the key competitor to the fetus for nutrients
during gestation and may influence the latter’s development indirectly in early gestation, when fetal nutrient
requirements are low, and then directly later in gestation when they are high.
The effect of milk yield of the dam, expressed here
as monthly permanent environment solutions, on firstlactation daughter BCS, fertility, and MY3 was nonsignificant (P > 0.05) in all cases. This means that maternal
effects (as measured by permanent environmental solutions for milk production) during a dam’s lactation do
not have an impact on first-lactation performance of
the offspring that was born during that lactation. In
the present study, a cow’s lactation was defined by the
first 305 d. This partially overlaps with her gestation
(average number of days open in the data was 112)
meaning that the full gestation could not be modeled.
However, our results suggest that a maternal environment defined by high milk yield of the dam during
conception and the early stages of gestation does not
seem to affect future offspring’s first-lactation BCS, fertility, and MY3.
In the first instance, permanent environment of the
dam during any lactation (first, second, or third) leading
to the birth of a particular offspring was considered. It
could be argued, however, that animals are still growing
during their first lactation, whereas in lactations 2 and
3 they are closer to mature size; therefore, animals
might exhibit different behavior regarding partitioning
of nutrients and energy in first vs. later lactations. To
test this, the entire exercise was repeated considering
maternal yield (permanent environment solutions)
from the dam’s first lactation only; results (not shown),
however, did not change. In all cases, the impact of
maternal yield on first-lactation daughter BCS, fertility, and MY3 was nonsignificant (P > 0.05).
Impact on Daughter Yield in the First Three
Lactations. The overall effect of dam milk yield, expressed as monthly permanent environment solutions,
on daughter 305-d yield in their first 3 lactations was
significant (P < 0.05) in all cases. Figure 2 depicts the
linear regressions of daughter 305-d yield on dam milk
permanent environment per month of dam’s lactation,
emanating from 10 consecutive analyses with model
Figure 2. Effect of maternal milk yield in different months of
lactation of the dam on daughter 305-d yield in the latter’s first
3 lactations.
[4]. This effect is pooled across the daughters’ 3 lactations. In general, increasing maternal milk yield was
associated with decreasing daughter yield; month 5 of
lactation of the dam had the most pronounced effect
(Figure 2). However, although significant, this effect
was practically negligible because it amounted to a
maximum of 0.17, 0.23, and 0.22% of the average 305d milk, fat, and protein yields, respectively.
Looking at daughter yield in each lactation separately, the effect of maternal yield followed the pattern
of Figure 2 in all cases; however, the effect was significant (P < 0.05) for lactations 2 and 3 but not (P > 0.05)
for lactation 1. The latter is consistent with our results
regarding MY3. It may not be immediately obvious why
such an effect is only significant on greater-than-firstlactation daughter production. Possibly cows that have
completed their own growth are more responsive to
other factors that may prohibit full expression of their
producing potential.
In general, our results suggest that a favorable maternal yield environment appears to have a very small
Journal of Dairy Science Vol. 90 No. 7, 2007
3498
BANOS ET AL.
Table 5. Proportion of total phenotypic variance accounted for by
direct additive and maternal genetic effects for first-lactation cow
performance (SE in parentheses)
Trait1
BCS
CI
DFS
NINS
NR56
MY3
Direct
0.18
0.03
0.04
0.02
0.01
0.27
(0.03)*
(0.01)*
(0.01)*
(0.01)*
(0.00)*
(0.02)*
Maternal
0.029
0.014
0.024
0.009
0.011
0.003
(0.027)
(0.006)*
(0.015)
(0.006)
(0.005)*
(0.010)
1
CI = calving interval; DFS = interval from calving to first service;
NINS = number of inseminations per conception; NR56 = nonreturn
rate 56 d post first insemination; MY3 = daily milk yield on third
test-day.
*Significant at P = 0.05.
(<0.3% of the mean) adverse effect on future daughter
305-d production. Because this definition of maternal
yield does not include any genetic effects, it can be
entirely associated with the maternal environment during lactation, which coincides with the time the offspring was conceived and in early gestation. Negative
environmental correlations between dam and offspring
performance are not uncommon in livestock (Bijma,
2006). Furthermore, they may often affect the estimation of additive genetic correlation between direct and
maternal effects (Bijma, 2006). Although there are
studies of the latter in dairy cattle (e.g., Schutz et al.,
1992; Albuquerque et al., 1998), reports on nongenetic
relationships are largely missing. Van Vleck and Bradford (1965) suggested that they are probably very small,
supporting results from the present study. In beef cattle, antagonistic environmental associations between
dam and offspring have been reported for some growth
traits (Cantet et al., 1988; Dodenhoff et al., 1998).
In this exercise, the effect of milk yield of the dam
was described by permanent environment solutions
from the UK national genetic evaluation. Such solutions were available throughout the lactation of each
cow. Therefore, it was possible to assess the impact of
this effect at different stages of lactation. Temporary
environmental effects specific to the time when a dam
is bearing her offspring might also be important but
were not considered in the present study.
Variance Due to the Dam
Table 5 shows the proportion of total phenotypic variance of first-lactation traits accounted for by direct additive and maternal genetic effects. The former, equivalent to narrow sense heritability, was 0.18 and 0.27 for
BCS and MY3, respectively, whereas it ranged between
0.01 and 0.04 for the 4 fertility traits. All estimates were
significantly greater than zero (P < 0.05) and consistent
Journal of Dairy Science Vol. 90 No. 7, 2007
with those used in the UK national genetic evaluation
for fertility (Wall et al., 2003a).
Maternal genetic effects accounted for a relatively
small proportion of variance for each trait. Exceptions
were the 2 significant (P < 0.05) estimates derived for
CI (1.4%) and NR56 (1.1%). These estimates reflect the
combined effects of uterine environment, cytoplasmic
inheritance, egg quality, and fetus survival. For the 2
lowly heritable traits, these are considerable proportions. Estimates from the present study are very similar
to those reported by A.-Ranberg et al. (2003; 1.2% for
NR56), slightly higher than those by Jansen (1986; 0.7%
for NR56) and lower than those of Jamrozik et al. (2005;
4 to 6% for similar fertility traits).
Maternal genetic effects accounted for just 0.3% of
the total variation of MY3 and it was nonsignificant
(P = 0.10). This is lower than the 1.1% reported by
Albuquerque et al. (1998) for 305-d lactation milk yield.
CONCLUSIONS
This study set out to investigate the impact of various
maternal effects on future offspring performance.
Based on results presented here, the following conclusions may be drawn.
Optimal first-calving age is between 24 and 29 mo.
Ensuing progeny are then expected to have a better
balance of production, BCS, and fertility profiles. On
the other hand, calving at an earlier age would produce
high-yielding offspring that may later experience difficulties in conceiving as first-lactation cows.
The interval between first and second calving should
decrease. Offspring resulting from early second calvings would be associated with increased production and
improved BCS and fertility.
A dam’s BCS during gestation has an impact on the
calf’s future performance. It is important to avoid BCS
losses of the dam especially during the second and third
trimester of gestation. Appropriate nutritional strategies at late lactation and the dry period become crucial
factors in this respect.
Continuing selection for milk production may be
linked to a slightly adverse cross-generational environmental effect, meaning that production of daughters of
high-yielding dams can be compromised. However, the
very small magnitude of this effect is not expected to
seriously influence milk selection and genetic improvement programs.
Finally, maternal genetic effects seem to account for
a significant proportion of the total phenotypic variance
of calving interval and nonreturn rate. Including such
effects in genetic evaluation models is recommended
because it would improve variance partitioning and
breeding value estimation.
PRENATAL MATERNAL EFFECTS
ACKNOWLEDGMENTS
This work was partly financed by Avoncroft Sires
Ltd., BOCM Pauls Ltd., CIS, Cogent, Dartington Cattle
Breeding Trust, Genus Breeding Ltd., Holstein UK,
National Milk Records plc, the Royal Society for the
Prevention of Cruelty to Animals, and the UK Department for Environment Food and Rural Affairs, in the
Sustainable Livestock Production LINK program. The
work was based on data collected under a grant from
the Scottish Executive Environment and Rural Affairs
Department. Useful discussions with Geoff Pollott and
Eileen Wall are gratefully acknowledged. Many thanks
also to Raphael Mrode for making cow permanent environment solutions available from the UK national genetic evaluation system.
REFERENCES
Albuquerque, L. G., J. F. Keown, and L. D. Van Vleck. 1998. Variances
of direct genetic effects, maternal genetic effects, and cytoplasmic
inheritance effects for milk yield, fat yield, and fat percentage.
J. Dairy Sci. 81:544–549.
A.-Ranberg, I. M., B. Heringstad, G. Klemetsdal, M. Svendsen, and T.
Steine. 2003. Heifer fertility in Norwegian dairy cattle: Variance
components and genetic change. J. Dairy Sci. 86:2706–2714.
Barker, D. J. P. 1992. Impact of diet on critical events in development:
The effect of nutrition of the fetus and neonate on cardiovascular
disease in adult life. Proc. Nutr. Soc. 51:135–144.
Bijma, P. 2006. Estimating maternal genetic effects in livestock. J.
Anim. Sci. 84:800–806.
Borwick, S. C., S. M. Rhind, S. R. McMillen, and P. A. Racey. 1997.
Effect of undernutrition of ewes from the time of mating on fetal
ovarian development in mid gestation. Reprod. Fertil. Dev.
9:711–715.
Brotherstone, S. 1994. Genetic and phenotypic correlations between
linear type traits and production traits in Holstein-Friesian dairy
cattle. Anim. Prod. 59:183–187.
Cantet, R. J. C., D. D. Kress, D. C. Anderson, D. E. Doornbos, P.
J. Burfening, and R. L. Blackwell. 1988. Direct and maternal
variances and covariances and maternal phenotypic effects on
preweaning growth of beef cattle. J. Anim. Sci. 66:648–660.
Coffey, M. P., J. Hickey, and S. Brotherstone. 2006. Genetic aspects
of growth of Holstein-Friesian dairy cows from birth to maturity.
J. Dairy Sci. 89:322–329.
Cowley, D. E., D. Pomp, W. R. Atchley, E. J. Eisen, and D. HawkinsBrown. 1989. The impact of maternal uterine genotype on postnatal growth and adult body size in mice. Genetics 122:193–203.
Dodenhoff, J., L. D. Van Vleck, S. D. Kachman, and R. M. Koch. 1998.
Parameter estimates for direct, maternal, and grandmaternal
genetic effects for birth weight and weaning weight in Hereford
cattle. J. Anim. Sci. 76:2521–2527.
Drake, A. J., and B. R. Walker. 2004. The intergenerational effects
of fetal programming: non-genomic mechanisms for the inheritance of low birth weight and cardiovascular risk. J. Endocrinol.
180:1–16.
3499
Fuerst-Waltl, B., A. Reichl, C. Fuerst, R. Baumung, and J. Sölkner.
2004. Effect of maternal age on milk production traits, fertility,
and longevity in cattle. J. Dairy Sci. 87:2293–2298.
Gilmour, A. R., B. J. Gogel, B. R. Cullis, S. J. Welham, and R. Thompson. 2002. ASREML User Guide. Release 1.0 VSN International
Ltd., Hemel Hempstead, UK.
Gunn, R. G., D. A. Sim, and E. A. Hunter. 1995. Effects of nutrition in
utero and in early life on the subsequent lifetime and reproductive
performance of Scottish Blackface ewes in two management systems. Anim. Sci. 60:223–230.
Jamrozik, J., J. Fatehi, G. J. Kistemaker, and L. R. Schaeffer. 2005.
Estimates of genetic parameters for Canadian Holstein female
reproduction traits. J. Dairy Sci. 88:2199–2208.
Jansen, J. 1986. Direct and maternal genetic parameters of fertility
traits in Friesian cattle. Livest. Prod. Sci. 15:153–164.
Jones, H. E., I. M. S. White, and S. Brotherstone. 1999. Genetic
evaluation of Holstein Friesian sires for daughter condition-score
changes using a random regression model. Anim. Sci. 68:467–475.
Kadarmideen, H. N., and M. P. Coffey. 2001. Quality and validation
of insemination data for national genetic evaluations for dairy
cow fertility in the United Kingdom. Proc. Annu. Interbull Mtg.,
Budapest, Hungary. Interbull Bull. 27:133–138.
Maniatis, N., and G. E. Pollott. 2003. The impact of data structure
on genetic (co)variance components of early growth in sheep,
estimated using an animal model with maternal effects. J. Anim.
Sci. 81:101–108.
Mousseau, T. A., and C. W. Fox. 1998. Maternal Effects as Adaptations. Oxford Univ. Press, Oxford, UK.
Mrode, R., S. Brotherstone, I. White, G. Swanson, M. Coffey, H. Jones,
and R. Thompson. 2005. Random regression model for the genetic
evaluation of production traits of dairy cattle in the UK. Proc.
Annu. Interbull Mtg., Uppsala, Sweden. Interbull Bull.
33:211–214.
Pryce, J. E., G. Simm, and J. J. Robinson. 2002. Effects of selection
for production and maternal diet on maiden dairy heifer fertility.
Anim. Sci. 74:415–421.
Rhees, B. K., C. A. Ernst, C. H. Miao, and W. R. Atchley. 1999.
Uterine and postnatal maternal effects in mice selected for differential rate of early development. Genetics 153:905–917.
Roseboom, T. J., J. H. P. van der Meulen, C. Osmond, D. J. P. Barker,
A. C. J. Ravelli, J. M. Schroeder-Tanka, G. A. van Montfrans, R.
P. J. Michels, and O. P. Bleker. 2000. Coronary heart disease
after prenatal exposure to the Dutch famine, 1944–45. Heart
84:595–598.
Rutledge, J. J., O. W. Robinson, E. J. Eisen, and J. E. Legates. 1972.
Dynamics of genetic and maternal effects in mice. J. Anim. Sci.
35:911–918.
Schutz, M. M., A. E. Freeman, D. C. Beitz, and J. E. Mayfield. 1992.
The importance of maternal lineage on milk yield traits of dairy
cattle. J. Dairy Sci. 75:1331–1341.
Tsuruta, S., I. Misztal, T. J. Lawlor, and L. Klei. 2004. Modeling final
scores in US Holsteins as a function of year of classification using
a random regression model. Livest. Prod. Sci. 91:199–207.
Van Vleck, L. D., and G. E. Bradford. 1965. Genetic covariances
among relatives for dairy lactation records. Genetics 52:385–390.
Wall, E., S. Brotherstone, J. A. Woolliams, G. Banos, and M. P. Coffey.
2003a. Genetic evaluation of fertility using direct and correlated
traits. J. Dairy Sci. 86:4093–4102.
Wall, E., V. E. Olori, M. P. Coffey, and S. Brotherstone. 2003b. Prediction of UK fertility proofs for foreign bulls. Proc. Annu. Interbull
Mtg., Rome, Italy. Interbull Bull. 31:60–64.
Wang, M. H., and F. S. vom Saal. 2000. Maternal age and traits in
offspring. Nature 407:469–470.
Journal of Dairy Science Vol. 90 No. 7, 2007


© Copyright 2026