
How to Meet the Market Rules and Social Goals for Housing?
COUNTRY MODELS
PA R T I I .
••
••
RENTAL MODEL
RENTAL MODEL
How to Meet the Market Rules
and Social Goals for Housing?
Local Government and Housing in Poland
Ryszard Uchman
Jerzy Adamski
117
H O U S I N G P O L I C Y: A N E N D O R A N E W B E G I N N I N G ?
118
D F I D – L G I
L O C A L
••
PA R T I I
G O V E R N M E N T
P O L I C Y
P A R T N E R S H I P
P R O G R A M
COUNTRY MODELS
••
RENTAL MODEL
Table of Contents
Introduction......................................................................................................... 121
1.
Housing and National Housing Policy During the Transition ..................... 122
1.1 National Housing Policy Objectives and Legislative Changes .............. 122
1.1.1 Housing Allowances .................................................................. 126
1.1.2 The Social Housing Associations (TBS) .................................... 127
1.1.3 Other Programs for Supporting
the Housing Sector with Public Funds ...................................... 131
1.1.4 Privatization of the Housing Stock ............................................ 132
1.1.5 The Main Effects of the National Housing Policy ..................... 133
1.2 The Housing Market and Housing Finance......................................... 136
1.3 Distribution of Housing Policy Tasks
between the State and Local Governments........................................... 137
2.
Efficiency and Effectiveness of Local Government Housing Policies ............ 139
2.1 Local Housing Policy Strategies and Objectives ................................... 141
2.2 Local Government Housing ................................................................ 144
2.2.1 Overview................................................................................... 144
2.2.2 Transfer of Company Apartments to Gminas............................. 148
2.2.3 Municipal Housing Resources and Condominiums................... 149
2.2.4 Management of Municipal Housing Resources ......................... 151
2.2.5 Local Government Housing Spending/Revenues, Rent Policy... 155
2.2.6 Housing Allowances .................................................................. 160
2.2.7 Vacancies, Rent and Utility Charges’ Arrears, Evictions ............. 161
2.2.8 Allocation of Municipal Housing .............................................. 164
3.
Conclusions and Recommendations ............................................................ 165
Endnotes.............................................................................................................. 170
Appendix I ........................................................................................................... 171
Appendix II.......................................................................................................... 178
119
H O U S I N G P O L I C Y: A N E N D O R A N E W B E G I N N I N G ?
120
D F I D – L G I
L O C A L
••
PA R T I I
G O V E R N M E N T
P O L I C Y
P A R T N E R S H I P
P R O G R A M
COUNTRY MODELS
••
RENTAL MODEL
How to Meet the Market Rules
and Social Goals for Housing?
Local Government and Housing in Poland
Ryszard Uchman and Jerzy Adamski
INTRODUCTION
Poland started its transformation process towards a market economy in 1990. This process was initiated during deep crises which were affecting the Polish economy. In 1990,
the GDP decreased by 11.6% compared to that of 1989, investment outlays dropped by
10.1%, real wages fell by 20%, and the average annual rate of inflation reached almost
560%. Economic revival and reversal of downturns finally began in 1992 and considerable economic growth was reported inbetween the years 1995–97 (Table 3.1).
Table 3.1
Basic Macroeconomic Indicators
Indicator
1995
1996
1997
1998
1999
2000
Population [millions]
38.6
38.6
38.7
38.7
38.7
38.6
GDP [USD billions]
126.6
142.8
143.1
157.5
154.1
158.8
6.9
5.9
6.8
4.8
4.1
4.0
GDP per capita [USD]
3,281
3,698
3,702
4,073
3,986
4,108
Consumer price index
(1990 = 100)
556.7
667.5
767.0
857.5
920.1
1,013.0
Unemployment rate [%]
14.9
13.2
10.3
10.4
13.1
15,1
Investment outlays index
(the previous year = 100):
117.1
119.2
122.2
115.3
107.0
103.1
92.7
96.8
117.7
113.3
116.4
—
GDP growth [%]
•
in total
•
capital investments
for housing construction
SOURCE: Polish Agency for Foreign Investment.
121
H O U S I N G P O L I C Y: A N E N D O R A N E W B E G I N N I N G ?
••
PA R T I I
In 1990, the population in Poland amounted to 38.2 million people and the existing
housing stock was about 11,022,100 dwellings. For every 1,000 residents in 1990, there
were 288.7 flats and average usable area per person was 17.5 m2. The deficit of houses
was estimated at 1.4 million dwellings. However, in the first phase of transformation
(between 1990–1995) the level of GDP growth, growth in real wages, and the level of
inflation, badly affected the housing construction dynamics. In 1995, the number of
dwellings completed (67,100) was equal to half the completed housing construction
in 1991. The number of completed dwellings for a population of 1,000 dropped, from
3.6 in 1990, to 1.7 in 1995.
Taking into consideration the results of housing construction during that period,
one may come to the conclusion that housing construction has not had an adequate
share in the growth of the Polish economy. In 2000, the population was 38.6 million
and the housing stock increased up to 11.8 million dwellings. There were 306.5 housing
units (333.1 in urban areas) per 1,000 inhabitants; improvement in housing situation
was very minimal. In fact, the housing deficit was at the same approximate level as it
had been in 1990.
The present housing problems consist of, first of all, the shortage of appropriate housing and, secondly, the bad conditions of the existing stock. About 7.5 million dwellings
currently require repairs and around 700 thousand dwellings should be replaced in the
nearest 5–10 years. Positive changes involve developments in social rental housing and
dynamic development in private construction of houses. These positive changes and
their results have played a significant role in the implementation of new housing policy,
decentralization of housing policy to the local governments level and the introduction
a number of programs, instruments and new institutions.
1.
HOUSING AND NATIONAL HOUSING POLICY
DURING THE TRANSITION
1.1 National Housing Policy Objectives and Legislative Changes
The introduction of a market economy to Poland at the beginning of the 1990s entailed
changing the functions of all the national economic sectors and required the creation
of completely new principles for the housing policy. The resulting market economy
principles have effected the field of housing, first of all, by:
1) Introduction of market interest rates for credits;
2) Introduction of market principles for housing stock management based on
economic calculations;
122
D F I D – L G I
L O C A L
G O V E R N M E N T
P O L I C Y
P A R T N E R S H I P
P R O G R A M
COUNTRY MODELS
••
RENTAL MODEL
3) Increase in housing construction costs and building site prices;
4) Necessity of changes in the system concerning housing construction financing
and in the role of the state and public finance in this field:
•
More efficient management of housing stock (a general withdrawal of direct
subsidies, replacing them with housing allowances);
•
Changing the system of construction financing (new principles and
mechanisms for enjoying credits, new forms and principles for collecting
the financial means for housing construction);
•
More efficient and effective social rental housing construction (with
moderate rents);
•
Settling ownership relations to enable the function of mortgage credits and
the housing market.
The institutional and legal solutions introduced in 1990 have created the basis
for determining the solutions necessary for the functioning of a housing market in
Poland. The system changes that have taken place have subjected housing policy to
the market laws. Some solutions, typically implemented by democratic countries, have
been resituated. During the period discussed1;
•
The state monopoly over the process of construction, financing and housing
usage was liquidated and the primary power to prepare and realize independent
housing policies was given to the gminas (local governments); state budgetary
subsidies were gradually substituted by local governments funding sources and
private capital;
•
The official monopoly of housing cooperatives was lifted, thus creating a basis
for many systems of attainment of a dwelling;
•
Limitations in the area of establishing separate ownership for housing units were
lifted; dwellings became investment goods and the rules for management of
common areas in residential houses were defined (condominium legislation);
•
A reform of rental prices has begun, making it possible for a communal owner
(municipalities) to set rental prices.
The changes required definition of the new housing policy. This was formulated in
an era, during the beginning of the 1990s, of acute economic crisis in Poland. In such
a difficult situation, the consideration of the new housing policy was a long-term process and the main issue was to define the status of housing, either as a market product
or a social commodity. The transformation influenced the housing sector by following
economic changes:
•
Introduction of market interest rates on loans;
•
Increase in housing construction costs;
123
H O U S I N G P O L I C Y: A N E N D O R A N E W B E G I N N I N G ?
•
••
PA R T I I
Introduction of housing stock management on market terms to economize rent
prices, changes in the construction and housing economy financing system
while limiting the financial involvement of the State.
During 1995–1997, the successive amendments to the principles of housing policy
were accepted in order to improve conditions for development of housing construction
and management (administration) of existing housing stock. The implementation of
the new housing policy began with the introduction of a range of legal regulations. The
basic legal Acts directly regulating housing issues were:
•
On Settlement of Credit Relations (1989);
•
On Housing Ownership (1994);
•
On Lease of Dwellings and Housing Allowances (1994);
•
On Amendment of the Act for Cooperative Law (1994);
•
On Some Forms of Support for Housing Construction (1995);
•
On Terms of Transfer of Enterprise Housing Owned by State Enterprises
(1994);
•
On Debentures and Mortgage Banks (1997).
The following legal Acts are also indirectly related to the housing sector:
On Territorial Self Governments (1990)—a part of the state property was
transferred to the ownership of municipalities, including rental housing stock;
•
On Individual Income Tax (1991)—which introduced tax instruments for
stimulation of investments in housing construction (building and renovation
tax exemptions).
•
The first serious problems that appeared after the introduction of new principles
resulted from the adjustment of market interest rates both for new and old credits
(taken up in the previous period). Since January 1990, variable rates of interest had
been introduced. These depended on inflation, which was very high in the time. This
caused a rapid increase in the indebtedness for both housing cooperatives and individual
borrowers. The cooperative housing stock had been completed, thanks to the credits
taken up in the past period included over 2.6 million dwellings. About 35 percent of
the urban population inhabited these dwellings and would unexpectedly face serious
financial problems (at the beginning of 1990, the interest rates for housing credit were
115 percent). Thus, there was an instituted redemption for these interests by the state
budget. Throughout 1990–1994, the principles of this redemption were modified several
times to adapt to the current economic situation (level of inflation) and real possibilities
of servicing the existing debts of housing cooperatives and their inhabitants.
The Act on Housing Ownership restored and unified the principles of separate ownership of dwellings and co-ownership of real estate, defined owners’ rights and obligations,
124
D F I D – L G I
L O C A L
G O V E R N M E N T
P O L I C Y
P A R T N E R S H I P
P R O G R A M
COUNTRY MODELS
••
RENTAL MODEL
as well as the terms for common property management. It also set the foundations for
condominiums.
The Act on Lease of Dwellings and Housing Allowances eliminated the centrally determined rental prices and introduced the principle of regulating rents by communes
(local governments) under guidelines defined by the Act. The Act also regulated various issues related to renting: terms for establishing rental prices, eviction, allocation
of council housing and payment of housing allowances. The rents, in both communal
and private rental stock, are now set by the municipalities themselves (in respect, however, to the central ceiling). The principle that rents should wholly cover maintenance
costs of buildings has been adopted; but so-called regulated rents are obligatory until
2004. The maximum rent ceiling (regulated rent) applied to local government housing
stock (as well as restituted rental stock until 2004) is set at a level of three percent of
an apartment replacement value (costs of construction for a particular flat in current
prices) annually. Within its territory, the local government may modify a rental policy
and social aid. Considering the increase in the tenants’ burden by growing housing
expenditures, a system of housing allowances has been established.
In light of the Housing Cooperative Act, cooperative property received the status
of private property and cooperative flats could be purchased by legal persons, while
individuals became entitled to own more than one flat.
The Act on Some Forms of Support for Housing Construction, passed in 1995, has
constituted the foundations for the launch of a new system of savings connected with
possibility of taking a credit with interest rates lower than that of the market. For this
purpose, the special Housing Saving Banks were established. The German Bausparkasse
model was planned to be introduced too. However, it still hasn’t come into operation.
Saving in this bank allows acquisition of taxation reductions (income tax) or special
premiums from state budget. The Act on Some Forms of Support for Housing Construction has also established conditions for development of rental housing with moderate
rents, i.e. for low-income persons and households, constructed by the Social Housing
Associations (TBS). It established the National Housing Fund that provides qualified
loans for the purpose of new rental housing construction to the Associations.
As a result of the Act on Terms of Transfer of Enterprise Housing Owned by State
Enterprises, companies gained the right to transfer housing estates to local governments
and/or housing cooperatives.
The Act on Territorial Self Government supported one of the key goals of the new
housing policy: the decision-making capacity was shifted from the central authority
to the local governments. Under the Act, a part of the state-owned property, including housing resources owned by the State, was transferred to the ownership of local
governments (communes). Pursuant to the provisions of the Act, the commune was
responsible for catering to the needs of the local community, including the demand for
housing. Gminas (communes) represent the lowest level of territorial self government;
125
H O U S I N G P O L I C Y: A N E N D O R A N E W B E G I N N I N G ?
••
PA R T I I
2,489 gminas have been created, including 318 urban gminas, 567 urban–rural gminas
in smaller towns, and 1,604 rural gminas. As of 1 January 1999, Poland’s local selfgovernment system comprises voivodship governments, district (poviat) governments
and gmina (commune) governments.
The legal Acts created a framework for changes in the housing sector. They provided the new institutions and tools to support the State and local government housing
policies in a market economy environment. Special attention is deserved for following
two programs:
•
The housing allowance system;
•
The social rental housing system.
1.1.1 Housing Allowances
The program for housing allowances addresses how to help the lowest income households
with increasing housing costs (especially in connection with factual rent deregulation
to the level of three percent of flat replacement value). The Act on Lease of Dwellings
and Housing Allowances, adopted in July 1994, settled the general principles of lease of
dwelling premises, the rights and obligations of tenants, the principles for price fixing
and rental payment and the principles for granting assistance in the form of housing
allowances. In order to protect the existing tenants against the effects of radical rental
increases, the concept of “regulated rent” has been introduced. This is where the level
of the rent cannot exceed 3% of the replacement value of the dwelling.
The regulated rent concerned the gminas housing stock, the state housing stock,
restituted private rental housing stock (for running rental contract), and residential
housing for non-profit purposes of specific legal persons2. In other cases, free market
rents were allowed to be introduced.
The Gmina Council establishes (in fact, by the Act, it is obliged to establish) differentiated rent prices, taking into consideration factors such as: location of the building
(downtown, outskirts), position of the dwelling in the building (floor, exposure to the
sun), technical facilities and installations that the dwelling is equipped with and the
general technical condition of the building itself.
However, a considerable number of tenants, especially in urban areas, live in buildings which are privately owned. There, regulated rent was also enforced (restituted
housing). This was a cause of conflict between tenants and owners. Extremely low rents
did not ensure the necessary funds to cover the costs of maintenance and renovation.
Also, in the communal housing stock, the increase in rent did not compensate for the
growth in the maintenance costs. The average level of rent attained actually did not
exceed 1.5% of the flat replacement value though higher increases were allowed by
central legislation. This is partially due to local political populism and partially to the
126
D F I D – L G I
L O C A L
G O V E R N M E N T
P O L I C Y
P A R T N E R S H I P
P R O G R A M
COUNTRY MODELS
••
RENTAL MODEL
duty to compensate the increase through housing allowances paid mainly from gminas’
own budgets.
The basic principles of the present housing allowances system are, as follows:
•
The gminas pay allowances to households that meet the conditions specified in
the Act. Households with the statutorily defined level of income are eligible for
an allowance, depending on the number of household members, irrespective of
tenure
•
Only persons living in dwellings to which they have legal title are entitled to a
housing allowance, provided that the average monthly income, in the period
of the last three months did not exceed 175% of the lowest retirement pension
in a one-person household, and 125% in a multi-person household
•
The amount of the allowance constitutes the difference between the real housing
expenditures falling to the standard (allotted) usable area of the occupied
dwelling (according to the size of household) and the amount of:
1) 15% of the household income —in a one-person household;
2) 12% of the household income—in a 2–4 person household;
3) 10% of the household income—in a 5 persons or more household.
•
The standard usable area (including admissible excess) is, as follows:
1) for 1 person (35 m2 + 30%)—45.5 m2;
2) for 2 persons (40 m2 + 30%)—52.0 m2;
3) for 3 persons (45 m2 + 30%)—58.5 m2;
4) for 5 persons (65 m2 + 30%)—84.5 m2.
•
The provision of housing allowances is obligatory for a commune if the
household in question fulfills the criteria
•
The housing allowance is paid to the building administrator (except the lump
sum for fuel or when the applicant is an owner of a family house)
•
Payment of the housing allowance is the task of gminas, which also receive
subsidies from the state budget for that purpose. The subsidies now cover, on
average, about 44% of total housing allowance expenses
Between 1995–2000, around 6–7% of the total number households received housing allowances.
1.1.2 The Social Housing Associations (TBS)
Rental housing construction, conducted by the non-profit Social Housing Associations,
is a partial solution to the problems of the actual physical lack of housing in Poland.
They allow for the creation of rental housing stock available to medium income households. The legal framework concerning the social housing construction was set in the
127
H O U S I N G P O L I C Y: A N E N D O R A N E W B E G I N N I N G ?
••
PA R T I I
Act on Selected Forms of Support for Housing Construction (1995). The rents set
for Social Housing Associations dwellings are subject to rent regulations, construction
price is controlled by cost limit per square meter of floor area, the dwellings have to be
fully equipped and meet the energy saving requirements with regards to heating and
hot water.
Based on the provisions of the Act, the National Housing Fund (NHF) was
established in 1995 to grant credits for construction of rental and cooperative housing.
The interest on the credits is variable, equal to a half of the rediscount rate of bills of
exchange in the National Bank of Poland. At present, credits from the National Housing Fund can cover up to 70% of an investment’s costs. Moreover, 10% of the costs of
the project may be covered by direct grants from the Fund, if the construction project
has been realized in time and according to the conditions set in the contract between
the Fund and the Association.
Apart from preferential credits from the Fund, the Act also foresees other sources
of funding for coverage of the remaining costs of construction, a so-called participation. The provisions of the Act stipulate that an employer, seeking to obtain dwellings
for his employees, as well as other persons interested in obtaining dwellings via a third
person—employees (i.e. parents indicate children), may reach agreements with the
Association on participation in the construction cost.
At the same time, the Act sets the conditions for establishing Social Housing
Associations (TBS) as non-profit organizations, responsible for building and managing
rental housing for persons with average incomes. The Social Housing Associations may
be established as: limited liability companies, joint stock companies or cooperatives of
legal persons. The main activity for these Associations is the construction of residential
houses and their exploitation under the leasing principles. However, the Associations
may also:
•
Acquire residential buildings on the open market;
•
Carry out renovations and the overhaul of buildings destined for rent, including
renovation/adaptation of buildings for housing purposes;
•
Carry out other activities connected with housing construction and its accompanying infrastructure (even construction of housing sold on the open market
for market prices; in this case they cannot, however, use preferential credits
from the Fund).
The potential surplus (profit) of the Associations may be used exclusively for the
statutory activity. Thus, they are exempted from the corporate income tax. The rents in
the housing stock of the Associations (the rent ceiling is equal to 4% of the flat replacement value in this case) are established based on the housing association’s calculation
and by the Gmina Council decision based on the territory in which the housing stock is
situated. The sum of the rent for all the dwellings, exploited by the Association, should
128
D F I D – L G I
L O C A L
G O V E R N M E N T
P O L I C Y
P A R T N E R S H I P
P R O G R A M
COUNTRY MODELS
••
RENTAL MODEL
be sufficient to cover all the maintenance and renovation costs of the buildings and
repayment of the credit applied to their construction.
Apart from the rent, the lease agreement may stipulate that the tenant must make
a deposit as security for payment of the lease rent outstanding on the day of leaving
the dwelling, in the amount not exceeding 10% of the value of the dwelling. Only
individuals are entitled to lease a dwelling from the housing stock of the Associations.
Other criteria include:
•
Tenants cannot have another dwelling in the given location (city)
•
Income of their households may not exceed 130% of the average monthly salary
in the given voivodship (region) by more than:
— 20% in a single person household;
— 80% in a two-person household;
— an additional 40% per each additional person in a multi-person household.
The Act has been amended several times. The last important amendment concerned
the widening of the scope of sources of financing the National Housing Fund. It created
a possibility for the Fund to:
•
Draw loans both from domestic and foreign banks and give state securities and
guarantees on their repayment;
•
Sell the receivables to mortgage banks under credit facilities granted by the Fund;
•
Obtain state warranties for the issuance of bonds.
In 2002, the Fund was additionally supported by foreign loans. Rental housing provided by new category of investors and administrators (the Social Housing
Associations), introduced by the Act, is now the most dynamically developing form of
investment in the housing economy.
By May 15, 2001, the Minister of Regional Development and Construction and,
presently, the President of the State Office for Housing and Urban Development, have
signed 326 approvals in favor of agreements, statutes or articles determined by the Social
Housing Associations. Among the existing 326 Associations, most (310) are limited liability
companies; others are joint stock companies (10) and legal persons’ cooperatives (6).
The accumulated number of dwellings credited by the National Housing Fund,
up to the end of March 2001, is 23,000 dwellings (in 2000—10,000 dwellings). The
number of dwellings completed during the period 1996–2000 reached almost 15,000
(in 1996, only 24 dwellings were completed). The system has expanded region-wide
but there is a significant differentiation of the number of the Associations in particular
voivodships (from 5 to 34).
The Associations have gained greater acceptance among self-government authorities and industrial circles, taking over the responsibility to meet the housing needs of
local communities.
129
H O U S I N G P O L I C Y: A N E N D O R A N E W B E G I N N I N G ?
••
PA R T I I
Table 3.2
Social Housing Construction in Poland—Examples
Location of TBS
—Name of the City
Number of
Dwellings/Surface [m2]
Amount of Rent
[in % of the
Replacement Value]
Amount ofRent
[PLN/m2]
Słupsk
40/1,736
2.51
4.8
Kraków
44/2,550
3.0
6.2
Szczecin
80/4,314
3.6
6.2
Katowice
16/983
3.2
6.4
Radom
56/3,268
2.1
5.0
Wałbrzych
36/1,807
3.83
6.5
NOTE: Exchange rate USD 1 = PLN 4.09.
SOURCE: BGK–NHF data.
The expenditures that a gmina would bear, to finance the full costs of construction
of municipal dwellings, could serve the construction of three times more rental dwellings, if the preferential credit from the National Housing Fund towards the Association
is properly applied.
The Associations also allow gminas to conduct active shaping of the actual dwelling
structure and support the filtration process (moving of households from gminas housing
stock to the new Social Housing Association dwellings). For example, vacated dwellings can be used by the gmina as “social” dwellings (see below). The Association can also
be a good administrator for residential houses, releasing the gmina of the necessity of
managing them.
Box 3.1
Management of Housing Stock in Radom
The Radom TBS (Social Housing Association), in addition to its construction activities,
manages Radom’s gmina housing and is apparently highly regarded as a management model.
Most importantly concerning rent policy, however, good results in building management
make it possible for the TBS to put pressure on those councilors who are the decision-makers
responsible for approving higher regulated rent levels. The TBS has pushed for rent increases;
this process forges an important link in combining policies for new construction, rehabilitation, and calls for improved subsidy policies. Radom also has an efficient housing allowance
system, which is integrated with overall social assistance programs.
SOURCE: Local Government Rent Policy and Best Practice in Poland, report prepared for USAID (project
180-0034) by Sally R. Merrill and other - Urban Institute, Krakow Real Estate Institute, Housing
Research Institute, 1998.
130
D F I D – L G I
L O C A L
G O V E R N M E N T
P O L I C Y
P A R T N E R S H I P
P R O G R A M
COUNTRY MODELS
••
RENTAL MODEL
The Association, as an administrator of a residential housing stock, acts under the
conditions of the current market competition. This has an influence on the reduction
of costs and increase of the quality of the provided administration services. Taking
into consideration the significant increase in the number of dwellings constructed in
Poland in a short period of time, we ought to evaluate the effects of the program of
rental housing as very positive.
1.1.3 Other Programs for Supporting the Housing Sector with Public Funds
Besides the two programs presented above, other programs supporting the housing
sector have been introduced too. The following programs have been adopted during
the first implementation phase of new state housing policy (1994–1998):
•
Thermal modernization support program is a market-oriented instrument designed
to improve energy properties for housing stock of all types. The essence of the
system consists of co-financing credit, based on the market interest rate—in the
form of its partial repayment—provided that the precisely defined conditions
of realization of the project are met. The basic assumption of this program is
to maximize both the technical and economic efficiency of the project. The
Act concerning this was adopted by the Parliament in 1998. This program is
currently in its implementation phase.
•
Tax relief from the personal income tax is entitled to taxpayers on the grounds
of the expenditures for satisfying their own housing needs. Firstly, the tax
is reduced by construction expenditures or expenditures connected with a
purchase of a newly constructed dwelling (also a plot of land for construction
of a residential building). It is also reduced by regular savings kept in one bank
account specified for running a housing fund and expenditures for renovation
and modernization of buildings and dwelling premises (in accordance with
limits defined in the Act). During the period of operation, there were many
amendments. This should be completed sometime in 2002.
From the point of view of the local government housing policy, the following new
programs are important:
•
The residential buildings renovation support program was a necessary supplement
to the above mentioned programs. The gradual balancing of rental prices to a
realistic level increases the owners’ ability to maintain the buildings. However,
it will not allow for quick accumulation of larger funds necessary for carrying
out larger overhauls. Without such actions, some part of the existing stock
will be irreversibly lost. This program, a credit subsidized by the state, aims at
covering the debt on renovation inherited from years past. The Act concerning
131
H O U S I N G P O L I C Y: A N E N D O R A N E W B E G I N N I N G ?
•
•
••
PA R T I I
this was passed by the Parliament in April 2001, but the program has not yet
been introduced.
Development program for technical infrastructure connected with housing construction
creates possibilities for gminas to draw preferential credits from the National Housing
Fund for construction of the technical infrastructure accompanying all forms of
housing construction. The removal of one of the basic barriers for new housing
investments (the shortage of a sufficient quantity of infrastructure-fitted land for
construction purposes) will significantly contribute to reduction of the costs of
housing construction. This was the result of previous programs amendments.
Own apartment program—The Act on Subsidies to Credits Granted for Own
Dwellings was adopted by the Parliament in April 2001. The “own apartment”
program was addressed to households in the average and higher income range.
The state assistance involves partial financing of interest on long-term loans.
The amount of credit cannot exceed 70% of the cost of purchase or construction
of the house. Subsidies will only be applied when the annual income of
borrower’s household does not exceed given maximum of PLN 109,000 (USD
26,650). The Act specifies three income brackets and corresponding levels of
state support in the form of interest subsidies on credits (10%, 25% or 50% of
interest). Assistance in repayment of interests is available for credits financing
maximum of 50 m2 of the dwelling space. Due to the state budget’s large deficit
in 2001, this program has not yet been introduced.
1.1.4 Privatization of the Housing Stock
Privatization of housing resources was one of the most vital processes related to the
housing policy, the development of housing, and the management of housing stock.
Gmina and company housing was already offered for sale before the beginning of the
transformation process. This trend increased after 1990, but the terms of sale varied and
were regulated by different regulations. For example, the Acts concerning state enterprises in
general, have different provisions regulating housing resources of the State Treasury, the
Polish State Railways, the Military Housing Agency, etc. The priority right of purchase
was offered to sitting tenants who were also entitled to a discount. Discounts varied
from 50% to 80% of the apartment’s market value and various criteria were applied.
Similar terms were applied to gminas. There was no central regulation on privatization prices, scale of privatization, or the right to buy for sitting tenants. The rate of price
discount was not generally influenced by the size of gmina or the location of the apartment. The Act on Housing Ownership, enforced in 1995, introduced condominiums
and supported the privatization of municipal and company resources. In 2000, there were
about 25,000 condominiums in Poland comprising 671.3 thousand apartments.
132
D F I D – L G I
L O C A L
G O V E R N M E N T
P O L I C Y
P A R T N E R S H I P
P R O G R A M
COUNTRY MODELS
••
RENTAL MODEL
The privatization process produced various results. Due to the preferential terms
of purchase, some apartments were bought by persons in the low income bracket who
now find it difficult to cover the utility costs set by the condominium board. The poor
physical condition of many buildings and flats has also had an adverse impact on the
management of condominium resources. On the other hand, those former tenants who
had become apartment owners are now more likely to introduce effective and rational
management methods.
The privatization of housing stock and the establishment of condominiums created a
demand for professional real estate administrators. Licenses for real estate administrators
(physical persons) were introduced under the 1997 Act on Real Estate Management in
view of that demand and to regulate the administrators’ responsibility and the owners’
safety. Around 11,000 licenses had been issued by the President of the State Office for
Housing and Urban Development by the end of 2001. At present, gminas’ resources
are also managed by licensed administrators (physical persons or firms with licensed
administrators on staff).
1.1.5 The Main Effects of the National Housing Policy
The radical changes caused by the process of market transformations, an acute economic
crisis, on one hand, and a deep recession on the housing market and poor housing
conditions, on the other, necessitated new efficient solutions. To what extent have the
implemented measures been effective, if at all? The scope of the housing construction
between 1991–2000, including the new investor structure, is shown in Table A3.9 of
Appendix II.
The changes in financing housing construction significantly altered its structure
as well as the scope. The scope of cooperative housing construction, predominant in
the previous years and which had received massive financial support from the State,
significantly decreased. Municipal construction also witnessed a drop, even though local
governments had become responsible for satisfying the citizens’ housing needs. Local
governments’ status in regards to the provision of housing resources was altered by the
dynamically growing Social Housing Associations (TBS). These are mainly private investors that have a growing share of the housing market and, together with the housing
cooperatives, were responsible for erecting 90% of new apartments in 2000.
The impact of new changes in the investor structure and the privatization of municipal and company housing resources have led to changes in the volume of existing
housing resources. This, along with changes in their ownership structure, technical
condition and furnishing standards, has all lead to an improvement in housing conditions in Poland. Changes in the volume and structure of housing resources are shown
in Tables 3.3 and 3.4.
133
H O U S I N G P O L I C Y: A N E N D O R A N E W B E G I N N I N G ?
••
PA R T I I
Table 3.3
Existing Housing Stock by Tenure
Tenure
Dwelling number total
in thousands within (by %)
1994
1996
1998
1999
2000*
11,433.9
11,547.1
11,667.7
11,173.3
11,844.8
•
cooperatives (including
“ownership” cooperatives)
27.7
27.7
28.5
28.5
28.6
•
gminas (municipalities)
17.8
14.6
13.3
12.4
11.5
•
State (state companies)
11.0
7.9
5.8
5.2
4.6
•
private
47.8
49.7
52.4
53.9
55.3
*
Housing stock in 2000, amounts to 11,844.8 thousand dwellings: 7,953.2 in urban and 3,891.6 in
rural areas.
SOURCE: Central Statistical Office, Housing Economy (1994–2000).
Between 1994 and 2000, the share of privately owned apartments (including
“ownership” housing cooperative apartments and condominiums) increased from
63% to 74%. From the point of view of housing resource management, as well as for
the role played by the State and local governments in the effective management, this
was a crucial change.
The housing deficit in Poland continues to be high and the level is estimated at
1.3–1.5 million apartments. Around 600,000–700,000 apartments are in poor physical
condition and require replacement.
As for housing conditions in Poland, some progress can be noted between 1990
and 2000. Still, the changes are not significant. Only minor improvements have been
made and housing conditions in Poland still rank far behind those of most European
countries.
Table 3.4
Housing Stock Age Structure in 2001 [%]
Period of Construction
Before 1945
1945–1970
1971–1978
1979–1988
After 1989
Total of dwellings
27.1
28.7
17.3
16.9
10.0
Urban areas
24.7
26.1
19.1
18.6
11.5
Rural areas
31.7
34.1
13.5
13.6
7.1
SOURCE: Central Statistical Office, Housing Economy 2000.
134
D F I D – L G I
L O C A L
G O V E R N M E N T
P O L I C Y
P A R T N E R S H I P
P R O G R A M
COUNTRY MODELS
••
RENTAL MODEL
Table 3.5
Selected Indices of the Housing Situation
Specification
1990
1995
2000
Number of apartments per 1,000 residents
288.7
297.6
306.5
Including: urban areas
308.5
320.9
331.1
Persons per 1 apartment
3.40
3.29
3.20
Including: urban areas
3.15
3.03
2.92
Rooms per 1 apartment
3.41
3.45
3.48
Including: urban areas
3.31
3.35
3.37
—
2.83
2.78
Average usable area per apartment
59.6
60.5
61.5
Including: urban areas
54.3
55.2
56.2
—
45.8
45.9
Average usable area per person
17.5
18.4
19.2
Including: urban areas
17.2
18.2
19.3
Including: urban areas within gminas resources
Including: urban areas within gminas resources
SOURCE: Central Statistical Office—Statistical Yearbook 2001 and previous year.
1.2 The Housing Market and Housing Finance
The solutions and instruments introduced at the beginning of the transformation period
as part of the state housing policy were designed to limit state involvement in housing
subsidies and to offer assistance to selected social groups. A set of financial instruments
was developed to support new housing projects. Such financing tools included the
housing deductions from income tax introduced in 1992 and contract loans related to
the housing saving scheme. Preferential loans, with low interest rates, were introduced
to support the construction of social housing.
In the first two instances, the State offered indirect support to the scheme. The
central budget directly supported the development of TBS and subsidizing housing
allowances of the gminas. However, it should be pointed out, that the State offered
assistance to finance and purchase liabilities in housing resources erected before the
transformation period (in the 1980s and earlier). Direct and indirect costs imposed a
substantial burden on the central budget. In particular, at the initial phase of development, which was not directly reflected in the achieved results.
This applies, in particular, to the state’s direct spending which, throughout the entire
period of 1991–2000, was only channeled in part to support new housing projects.
135
H O U S I N G P O L I C Y: A N E N D O R A N E W B E G I N N I N G ?
••
PA R T I I
This situation was altered by the indirect spending related to housing tax relief which,
on the other hand, prevented central authorities from conducting an active housing
policy. In view of the amount of funding devoted to housing projects from the total
budget expenditures, and in relation to GDP, it could be concluded that housing construction has not received adequate state assistance to address its needs and economic
possibilities. The structure of central budget spending on housing is shown in Table
A3.10 in Appendix II.
The limited and declining involvement of public resources for financing of housing
construction has led to a search for other finance resources. Such resources included
bank loans but mostly came from the consumers’ own savings. A imposing barrier in
housing construction development was the late development of mortgage banks and
mortgage loan system in Poland. Specialized mortgage banks appeared only two years
ago and only three such banks now operate in Poland.
Table 3.6
Financing of Housing Investment Outlays [%]
Sources
1994
1996
1998
1999
2000
Private funds
54.8
62.0
62.2
59.5
56.4
Bank Credits
9.5
9.8
10.3
14.0
16.0
35.7
28.2
27.5
26.5
27.6
Public funds (including tax relief)
SOURCE: State Office for Housing and Urban Development.
Expensive and relatively unavailable bank loans, limited resources, and the typically
low average income posed a serious barrier to housing development and the rational
management of housing resources. Despite a greater share of private housing projects,
these problems seriously affected the amount of housing construction, as did the low
rental prices which failed to cover actual maintenance costs.
As a consequence, despite the introduction of new policy plans and the launch of
new programs and instruments, in practice, the housing policy has not been effectively
and conscientiously realized. The division of responsibilities between the State and
local governments, where the latter had very limited means for catering to the local
demand and did not receive adequate state assistance, could not have generated fully
satisfactory results.
136
D F I D – L G I
L O C A L
G O V E R N M E N T
P O L I C Y
P A R T N E R S H I P
P R O G R A M
COUNTRY MODELS
••
RENTAL MODEL
1.3 Distribution of Housing Policy Tasks
between the State and Local Governments
At the onset of the transformation process, Poland was divided into 49 voivodships and
2,483 gminas. This formed the backbone of the local governmental system. This two-tier
division of self-government was in place until the end of the 1998, at which point the
administrative reform was introduced. As of January 1, 1999, a three-tier system was
introduced, comprising 16 voivodships divided into 373 districts (poviats) and 2,489
gminas.
The role of public administration in Poland’s housing sector is defined by Article
7 of the Constitution, which outlines “the policy of public authorities will cater to the
citizens’ demand for housing; public authorities will, in particular, counteract homelessness,
support social housing projects and the citizens’ efforts to purchase private housing.” The
provisions are also addressed in the 1990 Act on Territorial Self Government’s Article
7, sections 1 and 2, which state that the gmina is responsible for catering the collective
needs of the self-governing community.
Gminas’ tasks include the payment of housing allowances and management and
administration of own housing resources. The gmina caters to the housing needs of local residents by providing lower income residents with flats in buildings owned by the
gmina and by enabling the residents to purchase gmina property for the construction
of single-family housing and flat blocks under convenient terms. Under the provisions
stipulated by the Act on Lease of Dwellings and Housing Allowances, the gmina has an
obligation to provide council housing to persons in the lowest income brackets.
“Social” apartments (those owned by gminas) form a special category of municipal
housing. “Social” apartments are mostly apartments with low assessment value, resulting from poor physical standards. They are designed for families in difficult financial
situations; allocated only for a predefined temporary period of time. Rents for such
dwellings are set by the Gmina Council and they are usually lower than the rents in
other gmina housing (around 1/2 of the basic rate). A definition of “social” housing
is provided in the Act.
In regards to the local rent price policy, gmina authorities were assigned a specific
role. Under the provisions of the Act on Lease of Dwellings and Housing Allowances,
gminas have the right, and obligation, to set official rental prices and to grant housing allowances. Official rental prices apply to apartments under the gmina’s housing
resources, the State, companies, and, until the end of 2004, apartments in private housing resources that were occupied in the past. The rental prices set by the gmina, in the
above resources, significantly affect resource management, including the maintenance
and overhaul of flats and buildings.
Housing allowances, granted by the gmina, are designed to protect households from
becoming excessively burdened with housing costs. Gminas paid out a total of 9,087,000
137
H O U S I N G P O L I C Y: A N E N D O R A N E W B E G I N N I N G ?
••
PA R T I I
housing allowances in 2000; allowances were acquired by 7.6% of Polish households.
Recent legal amendments have extended the availability of housing allowances (enabling
persons with higher incomes to also apply for the allowances). This will increase the
number of households taking advantage of this assistance and should contribute to encouragement of the gmina rental policy and the management of its housing resources.
Gmina budgets3 were seriously burdened in respect to benefit payments, especially
considering that the value of central subsidies allocated for the purpose continued to
decrease. In 1995, state subsidies accounted for 55.9% of the total sum of housing
allowances paid. In 1997, state involvement was reduced to 50.2% and then, in
1999, to 39.9%. The shortage of funds in the gmina budget and the obligation to pay
housing allowances could prove to be obstacles for setting the rent prices at a level that
could hinder the rational management of the gminas’ housing resources, including
overhauls.
The gmina is also under an obligation to maintain own housing resources, make decisions on the sale (privatization) of apartments and terms of sale. The former privatization
of municipal resources and the establishment of condominiums, with various degrees of
gmina involvement, significantly influence the method used to manage those resources.
Gminas have found a different method of managing local resources and improving their
technical condition by supporting condominiums. Many municipalities have already
initiated such methods (see the two different case studies, concerning restructuring of
the municipal housing management and maintenance, in the following chapter).
Gminas have the following scope of authority in regards to new construction
projects:
•
Developing municipal apartments;
•
Establishing or participating in the establishment of the Social Housing
Associations and, as part of this scheme, constructing rental apartments;
•
Constructing “social” apartments or adapting the existing resources for this
purpose;
•
Creating favorable conditions for other investors’ housing development by
promoting the availability of land plots via media connections and facilitating
administrative procedures for investors;
•
Shaping land management policy, including the real estate tax rate which is
partially defined by the gmina, to attract investors from outside the gmina.
In view of this, the decentralization of the housing policy has provided local governments with a substantial degree of authority, enabling them to introduce independent
strategies to cater to local housing needs. Over the past decade, the system has been able to
provide effective solutions to housing problems not only encountered at the local level.
The past decade was also fraught with a serious obstacles which detracted from the
effectiveness of the local governmental role:
138
D F I D – L G I
L O C A L
G O V E R N M E N T
P O L I C Y
P A R T N E R S H I P
P R O G R A M
COUNTRY MODELS
RENTAL MODEL
Tasks imposed on local governments were out of proportion to their access to
financial resources and central budget subsidies;
Local governmental officials often lacked the required knowledge, skills,
and experience regarding the available housing policy instruments and new
programs;
Progress made in the state housing policy, accompanied by changes in legal
regulations and procedures, impeded the shaping of housing policy at the local
level;
Political disputes, also observed at the local governmental level, have contributed
to the lack of well-designed housing programs and strategies.
•
•
•
•
2.
••
EFFICIENCY AND EFFECTIVENESS OF
LOCAL GOVERNMENT HOUSING POLICIES
The following statisics have been generated from general statistical sources of the Central
Statistical Office, special surveys realized by the Housing Research Institute and the Local
Government and Housing Survey (LGHS) conducted especially for this project.
The LGHS was carried out in selected cities throughout Poland in December 2001.
The survey questionnaire was addressed to presidents and mayors of cities. According
to the assumptions, the group surveyed in Poland comprised of cities with populations
exceeding 20,000 inhabitants.
The total number of cities in Poland, at the end of 2000, totaled 880. Of these, 651
cities had a population under 20,000 and 229 cities had a population equal or higher
than 20,000. However, of the 229 cities, their population represented 80% of the urban
population and 82% of the municipal housing stock was located in these cities.
Table 3.7
Basic Information Included on the Local Government Housing Survey
The size of Gmina
(by Population)
The Number
of Cities
as of
31.12.2000
Relative
Frequency
[%]
The Number of
Questionnaires
Received
Relative
Frequency
[%]
The Share of
Questionnaires
in Relation
to the Number
of Cities [%]
20,000–49,999
137
60
19
33.9
13.9
50,000—99,999
50
22
18
32.1
36.0
100,000–199,999
23
10
7
12.5
30.4
200,000 and over
19
8
12
21.4
63.2
229
100
56
100.0
24.5
Total
139
H O U S I N G P O L I C Y: A N E N D O R A N E W B E G I N N I N G ?
••
PA R T I I
Almost 25% of the city groups included responded to the questionnaire. The total
number of the population in the city which responded to the questionnaire amounted
to 7.7 million, so in the surveyed cities lives 40% of the population out of the total
population living in this group of cities.
The structure of the cities which responded to the survey differs from the actual
overlying city structure itself. The cities which were best represented were cities with a
population over 200 thousand and the greatest difference in the representation was in
the bracket from 20–49,999 thousand inhabitants.
The majority of questions in the survey were of a qualitative character. However, a
section of the survey concerned quantitative aspects. Therefore, due to differences in the
actual structure within the group surveyed, weighting was applied to the quantitative
results for the particular group of the cities. According to the methodology applied (for
weighing the quantitative results), the weights were accepted on the basis of the actual
number of the cities in a given group.4
Table 3.8
The Weighted Ratios Adjusting the Results
for the Given Number of Population
The Weighted Ratio
The Size of Gmina (Number of Population)
20,000–49,999
1.763
50,000–99,999
0.679
100,000–199,999
0.803
200,000 and more
0.387
In the following sections weighted averages “per municipality” are thus presented.
The data, regarding the share of the gmina housing on total housing stock in the surveyed
cities, turned out to be unreliable. Therefore, after rejecting the extreme values, it may
be concluded that the share ranged in the surveyed cities from 3.5% to 45%.
The total number of rental dwellings in the surveyed group of cities was represented
by 409 thousand dwellings, consisting of an average of 2.7 chambers with the average
living space of 44 square meters. In principle, such a living space defines the average
one-bedroom apartment in Poland. Both the average number of the rooms in the
apartment, as well as the usable floor space, does not significantly differ in the cities of
different sizes. The differentiating feature is the average number of apartments held in
the gmina stock.
140
D F I D – L G I
L O C A L
G O V E R N M E N T
P O L I C Y
P A R T N E R S H I P
P R O G R A M
COUNTRY MODELS
••
RENTAL MODEL
Table 3.9
The Gmina Stock for the Surveyed Cities
The Size
of Gmina
The Average Number
of Gmina Apartments
The Average Usable
Floor Space/m2
The Number
of Rooms
20,000–49,999
1,208
44.7
2.7
50,000–99,999
3,240
43.7
2.6
100,000–199,999
8,079
42.5
2.5
200,000 and more
22,617
44.3
2.8
Weighted average
7,307
44.0
2.7
SOURCE: LGHS.
2.1 Local Housing Policy Strategies and Objectives
Half of the cities surveyed adopted housing policy strategies approved by the Council.
One fourth of the cities are waiting for the adoption of a strategy and another fourth
of the cities have no housing policy strategy at all (this represents more than the half of
the small cities with up to 50 thousand inhabitants).
The definition of the purposes of the housing policy suffers similar proportions.
Around 70% of the cities claim that such goals were clearly defined. However, over
20% of the cities have not formulated such goals. These are the smallest cities, which
have not worked out a housing strategy yet.
Among the major goals of housing policies (ranked according to importance), very
often general cliché phases appear, such as: “improving housing conditions”, “satisfying
the housing needs of the local communities”, “creating better conditions for construction
development”, “the development/intensification of housing construction”, “improving
citizens’ standards of living”. The goal which is at the top of the list, and often articulated,
is “the development of social housing”. This is understood to mean the construction
of new, and the adaptation of existing, “social” housing apartments for families living
in poverty. It is obvious that the cities which have adopted a housing strategy, have
defined more precisely the goals of housing policy. Synthetically, the goals of housing
policy may be formulated as:
•
Satisfying housing needs, especially in the area of “social” housing;
•
Halting the degradation of the existing stock as well as improving effectiveness;
•
Growth in rental housing construction conducted by the Social Housing
Associations.
141
H O U S I N G P O L I C Y: A N E N D O R A N E W B E G I N N I N G ?
••
PA R T I I
Table 3.10
The Adoption of a Strategy/Housing Policy [Number of Cities]
Adopted Strategy
Have a Strategy,
But It Has Not Been
Accepted
Does Not Have
a Strategy
20,000–49,999
7
2
10
50,000–99,999
11
4
3
100,000–199,999
3
3
1
200,000 and more
7
5
—
28
14
14
The Size of Gmina
Total
SOURCE: LGHS.
In principle, there are no goals relating to complex revitalization of the urban area
(only two cases). Moreover, the revitalization of stock as a goal of housing policy is rarely
mentioned. The hierarchy of fixed social goals offered by ourselves, to the respondents,
is listed in Table 3.11.
Prioritizing the goals within the groups of cities does not differ. What is very significant is the lack of conviction toward privatizing stock as an essential social goal, as
well as the neglect towards the problem of social segregation.
The lack of clear definition, in regards to the goals of housing policy, does not
mean that activities that aim to remedy the situation have not been taken. Among the
municipalities, programs which were carried out, very often involving concrete activities, tasks, or undertakings have been stated. These include items, such as, support for
new housing construction conducted by the Social Housing Associations, programs for
the construction of cheap gmina dwellings, programs for the improvement of technical
conditions and standards for gmina flats, programs for privatization of stock and services
related to the management of stock, preparation and development of land, programs
for implementing change to the stock in order to obtain “social” dwellings, programs
for ensuring dwellings for persons brought up in the care of the State (i.e. state homes,
orphanages).
According to the opinion of respondents, among the programs which were the most
effective in fulfilling the goals, the most frequently cited were:
•
Programs for the development of “social” apartments in regards to the new and
old stock (swapping, as well as reclassification, of existing dwellings as “social”
apartments);
•
Programs for the construction of rental housing by the Social Housing Associations, co-financed by means obtained from the National Housing Fund;
•
Modernization, thermo-modernization and repair to the existing gmina stock;
142
D F I D – L G I
L O C A L
G O V E R N M E N T
P O L I C Y
P A R T N E R S H I P
P R O G R A M
COUNTRY MODELS
•
•
••
RENTAL MODEL
Creation of system of housing allowances;
Preparation and development of the land for housing construction.
Among the “interesting” activities to be noted, for example, are credits granted by
the gmina for the repairs of buildings belonging to condominiums.
Table 3.11
Ranking of Goals in Local Government Housing Policies
Goal
Average Priority Mark
the Highest—1; the Lowest—9
Higher affordability of housing for
middle and low income households
2.6
Improvement of housing conditions,
higher quality of housing
3.67
To provide housing for homeless people
4.54
To meet shortage of housing for disabled,
handicapped people
4.75
To meet shortage of housing for elderly people
4.79
Higher labor mobility
5.04
Support for home-ownership and
private housing construction
5.15
Introduction and/or improvement of tenant
participation on housing management
5.62
Maintenance or creation of social mix
preventing social segregation
6.34
SOURCE: LGHS.
2.2 Local Government Housing
2.2.1 Overview
Political transformations in Poland revolutionized the structure of housing resource ownership. The greatest changes concerned changes in municipal (gminas) housing resources,
the legal structure for utilizing cooperative housing and the transfer of ownership rights
in company housing. The number of apartments owned by gminas (municipalities) fell
by 657,000 in the period between 1992–2000 (by about a third).
143
H O U S I N G P O L I C Y: A N E N D O R A N E W B E G I N N I N G ?
••
PA R T I I
On the other hand, as the result of the Act on Housing Ownership, condominiums
were established. This term refers to an apartment block, where a part or all the apartments constitute separate properties owned by individuals as confirmed by an entry
in the Mortgage Register. The number of apartments, represented as the property of
individuals in buildings co-owned by the gmina, increased nearly three-fold. At present,
they stand for nearly 5% of housing resources in Poland, while the share of municipal
housing resources fell to 11.6%.
Table 3.12
Housing Stock Ownership between 1992–2000
Specification
Inhabited apartments
[thousands]
1995
1996
1997
1998
1999
2000
11,491
11,547
11,613
11,688
11,763
11,845
•
housing cooperatives
3,188
3,205
3,263
3,329
3,351
3,387
•
gminas
1,733
1,692
1,630
1,555
1,459
1,371
•
condominiums*
302
359
427
485
542
558
15.1
14.7
14.0
13.3
12.4
11.5
2.6
3.1
3.7
4.1
4.6
4.6
Share of gmina apartments
[%]
Share of condominium
apartments in the buildings
co-owned by gminas [%]
*
Apartments owned by individuals in buildings co-owned by gminas (without company co-owned
buildings).
SOURCE: Central Statistical Office—Statistical Yearbook 2001 and previous years.
Table 3.13
Apartments in Urban Areas, as of 31 December 2000
Number of Apartments
[Thousands]
Size of Gmina
Share in Urban Housing Resources
[%]
Under 10,000
651.2
8.2
10,000–19,999
809.0
10.1
20,000–49,999
1,316.7
16.6
50,000–99,999
1,088.9
13.7
100,000–199,999
1,018.4
12.8
200,000 and higher
3,068.9
38.6
SOURCE: Central Statistical Office—Housing Economy 2000.
144
D F I D – L G I
L O C A L
G O V E R N M E N T
P O L I C Y
P A R T N E R S H I P
P R O G R A M
COUNTRY MODELS
••
RENTAL MODEL
Out of a total of 11,845,000 apartments in Poland, around 7,953,000 are located
in urban areas; the vast majority (82%) are in cities with populations above 20,000.
Gmina housing is situated mainly in urban areas. Out of a total of 1,371,000 of municipal apartments in Poland, 1,227,000 (around 93%) were situated in urban areas. Only
94,000 flats were located in rural areas. The total usable area for municipal apartments
in 2000 reached 63.2 million m2 (including 58.6 million m2 in urban areas).
Gmina housing represents a 16% share of the total number of apartments in urban
areas, while housing from cooperative resources makes up a 42% share. Gmina apartments are located in 187,885 buildings: 102,987 buildings constitute the sole property
of the gminas (54.8%) and 84,898 buildings are only co-owned by the gminas. The
situation varies in regards to the location of housing resources and to whether they are
in urban or rural areas. The internal ownership structure, in relation to the number of
apartments, for 2000 is presented in Table 3.14.
Table 3.14
Buildings, and Apartments within Buildings,
Owned and Co-owned by Gminas in 2000
Specification
Urban Areas
Rural Areas
Number of Buildings
Owned by gminas
75,458
27,529
Co-owned by gminas
78,930
5,968
154,388
33,497
48.9
82.2
Total
Share of buildings owned
by gminas [%]
Number of Apartments
In buildings owned by gminas
514,788
514,788
In buildings co-owned
by gminas
762,190
762,190
1,276,978
94,526
40.3
81.3
Total
Share of gmina flats in buildings
owned exclusively by gminas
(in %)
SOURCE: Central Statistical Office—Housing Economy 2000.
There are also buildings under “obligatory gmina management”. This mainly includes buildings with undetermined legal and ownership status. In 2000, there were
145
H O U S I N G P O L I C Y: A N E N D O R A N E W B E G I N N I N G ?
••
PA R T I I
9,000 such buildings with a total of 77,000 apartments. As a result of restitution of
property to former owners, the volume of this type of housing has been reduced over
the past few years (for instance, there were 11,800 buildings with 101,000 apartments
under obligatory gmina management in 1997).
“Social” apartments form a special category of municipal housing; they are designed
for the lowest income households with the highest social need. The “social” housing
stock for 1995–2000 is, as indicated in Table 3.15.
A section of gmina housing resources remains uninhabited, including the following
types of housing (as classified in accordance with state statistics): apartments not allocated
in new buildings, apartments undergoing capital overhauls, apartments uninhabited as
the result of court or executive proceedings in progress, apartments uninhabited due to
poor technical conditions and apartments temporarily in use for non-residential purposes
such as offices, studios, and doctors’ offices. The number of uninhabited apartments in
gminas resources for the period between 1995–2000 are shown in Table 3.16.
The volume of uninhabited resources is low due to the housing deficit in Poland.
Gminas also possess utility premises. As of 31 December 2000, there were 95,336
utility premises with a total area of 7.6 million m2 in buildings owned or co-owned by
gminas. This is including 41,783 gminas premises in buildings owned solely by gminas
and 38,215 premises in buildings co-owned by gminas. Thus, gminas owned a total of
around 80,000 utility premises with a usable area of 6.5 million m2.
Table 3.15
Share of “Social” Housing in Gmina Resources
Specification
Gmina housing [thousand]
•
including: “social” apartments
Share of social housing [%]
1995
1996
1997
1998
1999
2000
1,733
1,692
1,630
1,555
1,459
1,371
16.4
18.5
19.9
22.6
23.9
29.6
0.9
1.1
1.2
1.5
1.6
2.2
SOURCE: Central Statistical Office—Housing Economy 2000 and previous years.
Table 3.16
Uninhabited Gmina Housing Stock
Specification
1995
1996
1997
1998
1999
2000
Uninhabited flats [thousands]
16.8
17.0
16.4
16.8
17.6
18.4
Share of uninhabited flats [%]
0.9
1.0
1.0
1.1
1.2
1.3
SOURCE: Central Statistical Office—Housing Economy 2000 and previous years.
146
D F I D – L G I
L O C A L
G O V E R N M E N T
P O L I C Y
P A R T N E R S H I P
P R O G R A M
COUNTRY MODELS
••
RENTAL MODEL
The remaining utility premises (around 15,000) are owned by individuals and are
situated in buildings co-owned by the gminas and/or individuals. The right to own
utility premises is of paramount importance at the gmina level for sustaining municipal
housing policies. Most the revenue generated from utility premises management is channeled to finance municipal housing, in particular, for the overhaul and modernization
of existing resources.
The main problems with gmina resources concern low qualitative standards, lack
of basic furnishing and installations and poor technical conditions resulting from the
age of houses and inadequate expenditures provided to refurbish and modernize the
resources. In apartments situated in urban areas, the level of basic facilities provided is
presented in Table 3.17.
Table 3.17
The Level of Provisions by Basic Facilities [% of Total Apartments]
Specification
1990
2000
Water supply
95.3
97.6
Toilet
86.0
90.3
Bathroom
83.5
88.3
Gas
71.8
76.7
Central heating
74.4
80.8
SOURCE: Central Statistical Office—Statistical Yearbook 2001 and previous years.
The figures mentioned above have been calculated reflecting the urban average,
including private resources and improvement in indices resulting mainly from the construction of new apartments. However, the standard of municipal resources is generally
lower than the average. Nearly 190,000 apartments in Polish cities do not have access
to water works and around 800,000 apartments do not have toilets or bathrooms (the
shortages in facilities’ standards apply in a large part to gmina resources).
According to estimates, of the total 1.9 million apartments in buildings owned or
co-owned by gmina, 47% are located in buildings erected before 1945 and another
47% in buildings erected between 1945 and 1970. Only 6% of those apartments are
located in buildings erected after 1970. Thus, it can be said that 94% of gmina resources
date back to over 30 years ago.
The geographic location of municipal housing resources in Poland is determined
by the degree of urbanization in the various regions, as well as by historical factors. The
voivodships, with the highest share of municipal apartments (19% and more) in urban
147
H O U S I N G P O L I C Y: A N E N D O R A N E W B E G I N N I N G ?
••
PA R T I I
housing resources, are situated in the north-west and south-west. They comprise of
Zachodniopomorskie, Pomorskie, Lubuskie, Dolnos´ląskie and Opolskie voivodships,
where real estate was nationalized after World War II. A high number of municipal
apartments (more than 100,000) can be found in highly urbanized voivodships, including Mazowieckie, S´ląskie and Łódzkie. The total share of municipal apartments in
urban areas of five voivodships does not exceed 10%, it reaches the level of 10%–20%
in seven voivodships, and exceeds 20% in four voivodships (refer to the Figure A3.1 and
Table A3.1 in Appendix I).
The majority of municipal apartments are situated in urban areas, but in seven
voivodships more than 10% of municipal resources are utilized in rural areas. These
are poorly urbanized regions in the eastern part of Poland (the Warmin´sko–Mazurskie,
Podlaskie, Lubelskie and Podkarpackie voivodships) as well as regions with well-developed farming sectors (the Kujawsko–Pomorskie, Wielkopolskie voivodships). The only
exception is the Świętokrzyskie voivodship, which has the lowest number of municipal
apartments, with 20% situated in urban areas.
2.2.2 Transfer of Company Flats to Gminas
In the past, companies had managed vast housing resources in Poland. In 1992, companies administered 1,480,000 apartments. Changes in the housing economy prompted
companies to significantly reduce the volume of their housing resources by:
•
Sale to sitting tenants;
•
Transfer to gmina ownership;
•
Transfer to housing cooperative ownership;
•
Sale to private investors.
As a consequence of these changes, the number of company apartments fell to
542,000 in 2000. From the local governments’ point of view, the process of this transfer was crucial. In the period between 1995–2000, gminas took over around 131,000
apartments once managed by companies.
Table 3.18
Transfer of Company Apartments into the Ownership of Gminas [Thousands]
Specification
1995
1996
1997
1998
1999
2000
Company apartments
1,083
911
822
683
617
542
Company apartments transferred to gminas
14.8
24.6
37.9
29.6
14.5
9.9
SOURCE: Central Statistical Office—Housing Economy 2000 and previous year.
148
D F I D – L G I
L O C A L
G O V E R N M E N T
P O L I C Y
P A R T N E R S H I P
P R O G R A M
COUNTRY MODELS
••
RENTAL MODEL
The transfer gave rise a number of problems related to the following issues:
•
Poor technical conditions and lack of economic profitability for the transferred
resources;
•
Incomplete documentation relating to the transferred resources;
•
The fact that transferred resources were co-owned by individuals (former sitting
tenants);
•
The need to administer resources situated outside the operating area of the
managing company;
•
Problems relating to the establishment and provision of power and media, in
many cases previously supplied by companies.
In practice, gminas and housing cooperatives absorbed the new resources relatively
quickly. Problems relating to rental prices accompanied the transfer of company resources to the ownership of private owners. This issue continues to be the subject of
many court disputes.
2.2.3 Municipal Housing Resources and Condominiums
The Act on Housing Ownership, put into effect in 1994, established condominiums in
houses with at least two separate homeowners. This procedure was also applied to municipal
resources in buildings where tenants had acquired ownership rights to their apartments.
A condominium comprises a group of owners whose apartments constitute the given
real estate; it may maintain rights and obligations, it may sue and be sued. The share
of an owner, of a separate apartment, to the common areas of building corresponds
to the relationship between the apartment’s usable area (including the area of its accompanying premises) and the total usable area of all apartments (including accompanying
premises).
Under the provisions of the Act, the real estate management method applied is
defined by the co-owners through a notaries’ deed. If the method of real estate management has not been defined in this mode, the provisions of the Civil Code can be
applied in condominiums comprising up to seven apartments: a condominium board
(with one or more members) should be appointed in this case.
Condominium members are under the obligation to cover the costs of real estate
management, which include:
1) Cost of overhaul and maintenance;
2) Charges related to power, heat, gas, and water works for the common area as
well as collective charges, such as, TV satellites and elevators;
3) Insurance, taxes and other public and legal fees, unless covered directly by
individual owners;
149
H O U S I N G P O L I C Y: A N E N D O R A N E W B E G I N N I N G ?
••
PA R T I I
4) Cost of cleaning services;
5) Remuneration for board members or administrators.
As a member of a condominium, with ownership rights to some flats in a building,
the gmina is under obligation to cover management costs proportionally to its apartments’ share of the total floor area. The gmina pays management costs in advance and
charges rent to those tenants using their apartments. The number of condominiums
established with the participation of gminas and the number of apartments in buildings
which are part of condominiums (apartments owned by the gmina and individuals) is
presented in Table 3.19.
Table 3.19
Total Number of Apartments in Condominium Buildings
(Co-owned by Gminas and Individuals)
Specification
1995
1996
1997
1998
1999
2000
Total number of buildings
201,802
206,009
205,476
200,209
194,301
187,885
Number of condominium
buildings
64,253
69,348
76,733
81,258
84,979
84,898
13.9
17.9
21.9
27.0
31.9
36.4
1,161.1
1,232.1
1,304.8
1,341.0
1,369.9
1,337.8
Share of condominiums with
majority participation by
individual home-owners [%]
Total number of apartments in
condominium buildings [thousands]
•
apartments owned by gminas
[thousands]
858.7
873.1
878.1
855.9
828.3
779.8
•
apartments owned by individual homeowners [thousands]
302.4
359.0
426.7
485.1
541.6
558.0
SOURCE: Central Statistical Office—Housing Economy 2000 and previous year.
Of the 187,000 buildings owned or co-owned by gminas, 45% are condominium
buildings that should be managed in accordance with the Act on Housing Ownership.
Individual owners hold the deciding vote, in regards to management issues, for more
than a third of condominium buildings.
Change in ownership of gmina housing stock has had a great influence on the
management of housing resources and maintenance finance. As it was stated above,
in over one-third of the housing condominiums co-owned by gminas and individual
homeowners, the majority vote belongs to the individual homeowners.
150
D F I D – L G I
L O C A L
G O V E R N M E N T
P O L I C Y
P A R T N E R S H I P
P R O G R A M
COUNTRY MODELS
••
RENTAL MODEL
2.2.4 Management of Municipal Housing Resources
The period of political transformations in Poland also brought changes regarding the methods
of managing municipal housing resources. The following changes were introduced:
•
Transformation of resource managing entities (privatization, restructuring);
•
Establishment of condominiums since 1994.
Prior to the establishment of condominiums, municipal housing resources were
managed by gmina authorities (Housing Departments), state enterprises (operating as
separate entities under the budgetary law) or separate municipal companies.
Box 3.2
Management of Housing Stock in Ostrów Wielkopolski
This gmina has adopted an interesting approach to the privatization of rental housing
management. In 1994, the city established the City Unit of Housing Economy, a housing
management company. The housing resources of the gmina were the city’s initial contribution
to the company and the company is both the owner and administrator of these resources.
Ostrów plans to maintain gmina housing only for lower income households, while the
gmina believes that the most appropriate housing solution for higher income households is
to purchase, or build, a housing unit within the market, without city government assistance.
Overall, this is an important step towards the rationalization of city budgets, increased use
of households own resources, and, ultimately, toward privatization of some portion of the
communal stock.
SOURCE: Local Government Rent Policy and Best Practice in Poland, report prepared for USAID (project
180-0034) by Sally R. Merrill and other—Urban Institute, Krakow Real Estate Institute, Housing Research Institute, 1998.
Following the establishment of condominiums, municipalities—or former entities managing resources on behalf of the municipalities—would call meetings for
condominium members to appoint board members and to assign maintenance and
administration tasks to hitherto managing entities, should the need arise. In view of
gmina members’ fear of getting involved in professional maintenance and administrative
tasks, few condominiums have been able to address those issues independently so far.
The establishment of condominiums in buildings co-owned by the gmina and
individuals necessitated the introduction of completely new real estate administration
methods. A clear distinction should, however, be made between the definition of management in the legal sense (where the owner can transfer his rights to another entity
under an agreement) and management itself, defined as the provision of real estate
maintenance and administration services. The various forms of municipal resource
151
H O U S I N G P O L I C Y: A N E N D O R A N E W B E G I N N I N G ?
••
PA R T I I
management and administration in Poland, including gmina resources in condominium
buildings, are presented in Tables A3.12 and A3.13 in Appendix II. The gmina participation in administrative tasks has been significantly limited over the past few years.
Gminas continue to administer around 170,000 apartment buildings.
Box 3.3
Restructuring Municipal Resource Management in Sopot
The town of Sopot has a population of 43,500. Until 1990, the commune’s housing economy
had been supervised by the Municipal Service Company (also responsible for upkeep and
waste disposal). They employed 355 persons, including management (88), housing resource
maintenance (126), an overhaul department (46), and waste disposal (95). In 1991, the
department responsible for housing resource management became a separate entity, operating under the name of the Municipal Housing Resources Board (ZBM). Repair crews were
privatized. ZBM managed 1,156 buildings with 6,958 flats and 431 utility premises. They
employed a staff of 112 persons. The ZBM operated for three years, but failed to bring the
desired results. The town authorities had to pay an extra PLN 3 for every PLN 1 of the rent.
The share of city budget funds in the ZBM’s budget continued to increase from 18% in
1993 to 25% in 1994 to 35% in 1995. The ZBM employees wages grew rapidly. In light
of these facts, the City Council decided to shut down the ZBM and appoint private building administration selected for tenders in 1994. Three privately owned companies were
created from the former ZBM structures, employing at least 50% of ZBM’s former staff.
The companies participated in the tender and were granted an order. The restructuring
scheme improved the rent collection rate from 75% to 86% and modified the structure of
housing maintenance expenses (repair expenses increased from 30% in 1995 to 46% in
1998 and salaries decreased from 14% in 1995 to 10% in 1998). Ownership supervision continued to be the domain of local authorities. The new management structure also
brought the following results:
• Less full-time employees
• Detailed agreement for housing management, administration and maintenance
• Administrator remunerated on the basis of economic efficiency (increase in the rent
collection rates)
• Maintenance costs remained low (PLN 2.09 per m2 (USD 0,51) before privatization,
PLN 1.56 per m2 (USD 0.38) after privatization)
• Repair expenditure increased and the technical condition of buildings and flats improved
• The private building administrator market in Sopot expanded
SOURCE: Restructuring of Municipal Real Estate Management, M. Tertelis, Local Government Partnership
Program / USAID, Municipum, Warsaw 2000.
The structure of managing gmina housing stock seems rather complicated due to
the emergence of the condominiums, of which gmina is an owner of only a number of
apartments in a block. The condominium takes over the management of the property in
152
D F I D – L G I
L O C A L
G O V E R N M E N T
P O L I C Y
P A R T N E R S H I P
P R O G R A M
COUNTRY MODELS
••
RENTAL MODEL
a legal sense. However, the activities related to day-to-day maintenance (use, administration, upkeep, maintenance works and so on) are still performed by the municipality.
On the other hand, the gradual processes of privatizing a sector of the services related
to the gmina stock management are taking place. This is the emergence of separate, selffinancing companies with the stake held by the gmina or physical persons (for example,
former employees), who receive orders to perform the operational activities.
Up to now, the managers of gmina housing stock were required to have a professional
license to perform such activities. As a result of the training and certification process,
private companies have been created and are run by physical persons, who manage the
property. Yet in practice, such situations may occur in which one city’s different legal
and organizational forms of managing the gmina stock co-exist side by side. However,
the dominant form is the budgetary agency (non-self financing and operating within
the annual budget), as well as private companies with the gmina participation.
Box 3.4
Restructuring of Municipal Resource Management in Krakow
The city of Krakow has a population of 760,000. In 1996, municipal authorities administered 2,626 buildings with 46,589 flats and 3,501 utility premises. A large number of flats
were situated in buildings co-owned by the commune and by individuals (condominiums).
At the beginning of the 1990s, four State-owned housing companies were responsible for
the management of the commune’s housing resources. Total employment in those companies
amounted to 1,993 persons including 603 office employees, 488 maintenance technicians,
718 janitors, 61 service workers and 123 other employees. In 1995, 17 commercial partnerships were created using the organizational structure of those companies and the experience
of their employees. These became responsible for the maintenance of the housing resources
and rendering of related services (repair, transport and construction). City authorities were
released from the obligation to directly administer and to maintain municipal resources, as
well as from the need to employ full-time workers, so they could focus on strategic planning.
The efficiency of housing resource management was improved. For example, ADREM, one
of the newly created companies which administered 24,919 flats, reported 8,300 m2 of flat
area per one administration employee, while the national average hit about 5,200 m2. The
average cost of resource maintenance was approximately 45% below the national average.
This solution generated positive results for city authorities, including an annual savings of
PLN 9 million (USD 2.2 million) in respect of personnel costs, lower maintenance costs,
improved management of vacant flats, a decrease in rent arrears from 4.7% to 3%, and
higher precision in expenditure planning.
Krakow’s condominiums relegate 95% of resource management tasks to the third parties,
such as the above mentioned companies, or private administrators. The city supports the
repair of condominium buildings by granting loans from its own resources.
SOURCE: Restructuring of Municipal Real Estate Management, M. Tertelis, Local Government Partnership
Program/USAID, Municipum, Warsaw 2000.
153
H O U S I N G P O L I C Y: A N E N D O R A N E W B E G I N N I N G ?
••
PA R T I I
Table 3.20
Those Who Manage/Administer the Gmina Housing Stock
[% of Total Number of Municipalities in the Survey]
Administration
by Gmina
Itself
Administration
by the Budgetary
Agency
Administration
by Gmina
Company
20,000–49,999
—
26
63
5
50,000–99,999
6
28
50
28
100,000–199,999
14
57
43
14
200,000 and more
—
58
58
17
4
37
61
16
Size of Gmina
Total
Administration
by Private
Company
SOURCE: LGHS.
The technical conditions and standard of the municipal housing resources requires
massive spending on overhaul and modernization. The number of modernized buildings
and scale of overhaul works are presented in Tables 3.21 and 3.22.
While a total number of 50,609 municipal buildings capital and other overhauls
have been completed in 2000, it should be mentioned that around 28% of municipal
resources were overhauled, in varying degrees, in 2000. Overhaul works were conducted in a total of 50,490 buildings, including woodwork replacement in nearly 40%
of overhauls, roof repairs in 25%, partial or total replacement of installations and roof
repairs in 36%.
Table 3.21
Modernization of Municipal Buildings Owned or Co-owned by Gminas
and Managed by Gminas [Number of Buildings Equipped with New Installations]
Specification
Total number of buildings being modernized
including:
1993
1996
1997
1998
1999
2000
4,724
3,198
3,365
2,924
2,967
2,396
•
water supply modernization
2,214
1,056
1,004
916
699
634
•
sewerage modernization
1,044
1,248
1,377
1,239
1,401
1,085
•
central heating modernization
367
339
398
420
390
371
•
gas supply modernization
874
295
498
287
423
270
SOURCE: Central Statistical Office—Housing Economy 2000 and previous year.
154
D F I D – L G I
L O C A L
G O V E R N M E N T
P O L I C Y
P A R T N E R S H I P
P R O G R A M
COUNTRY MODELS
••
RENTAL MODEL
Table 3.22
Overhaul Works Completed in Municipal Buildings Owned or Co-owned
by Gminas and Managed by Gminas [Number of Buildings]
Specification
1993
1996
1997
1998
1999
2000
Capital overhauls*
•
buildings
•
apartments
1,016
376
273
156
108
119
12,082
6,726
3,363
1,300
1,139
1,353
22,702
27,610
44,308
45,862
49,651
50,490
Other overhauls
•
buildings
*
A capital overhaul is defined as an overhaul conducted to reinstate the real estate’s initial technical
and usable value; the table accounts for buildings where at least 60% of structural and installation
elements have been replaced or thoroughly repaired.
SOURCE: Central Statistical Office—Housing Economy 2000 and previous year.
2.2.5 Local Government Housing Spending/Revenues, Rent Policy
The following Table 3.23 shows the total expenditures incurred by gminas on housing
management and intangible gmina services.
Table 3.23
Local Government Housing Expenditures
1994
1995
1996
1997
1998
1999
2000
Expenditures on housing
management as well as
intangible services
[millions of PLN]
992.3
1,075.7
309.0
1,854.1
2,221.6
245.8
2,667.7
Growth indicator
100.0
108.4
131.9
168.8
223.9
247.7
268.8
SOURCE: State Office for Housing and Urban Development.
The following table shows the structure and division of local government housing
expenditures (for different categories of size of gmina) according to analysis carried out
by the Housing Research Institute within the framework of systematic monitoring.
155
H O U S I N G P O L I C Y: A N E N D O R A N E W B E G I N N I N G ?
••
PA R T I I
Table 3.24
The Share of Housing Expenditures
in the Monitored Local Government Budgets in 1999 [%]
Management/
Maintenance Subsidies
to Municipal Housing
Housing Allowances
New Municipal
Housing Construction
Below 25,000
1.3
4.7
0.8
25,000–100,000
0.4
5.3
2.0
Over 100,000
0.8
2.0
0.6
Size of Gmina
SOURCE: J. Korniłowicz—Housing monitoring for year 1999.
The tendencies characterizing the unit costs of maintaining the gmina stock in the
period between 1991–2000, estimated on the basis of yearly monitoring in the cities
selected, are demonstrated in Table A3.2 in Appendix I. The data regarding the unit
costs in housing cooperative stock were included for comparison. The conclusion may
be drawn that there are lower dynamics in growth for unit costs related to the maintenance of gmina stock between the years 1991–2000. We then apply the very synthetic
division of the total costs related to the maintenance of gmina housing stock (excluding
central heating and hot water) into:
•
Costs of day-to-day operation including administrative costs, water and sewage
systems, waste disposal, keeping order, taxes and others;
•
Costs related to the technical maintenance including repairs, maintenance,
refurbishing and modernization.
The conclusion may be drawn that the highest growth in unit costs, for gmina
housing stock, was observed in the group of costs related to day-to-day operation. This
is the result of price hikes in gmina services (water works, sewage and waste disposal).
The growth indicator of costs expressed in current prices for the years 2000/1991 is
shown in Table 3.25.
In spite of the fact that the costs of central heating operation grew by 5.6 times, the
final charges related to central heating born by the tenants grew by almost 16 times.
This was the result of the rise of energy prices as well as withdrawal of the state subsidies
toward central heating expenses. The most actual housing policy goal should now be
focused on thermo-modernization activities (improvement in insulation).
The Housing Research Institute’s systematic monitoring of housing activities,
carried out by sampling research methods applied within the selected cities, allows for
synthetic presentation of the sources covering the maintenance costs of gmina housing
stock. The main sources are:
•
Profit from business premises leases;
156
D F I D – L G I
L O C A L
G O V E R N M E N T
P O L I C Y
P A R T N E R S H I P
P R O G R A M
COUNTRY MODELS
•
•
••
RENTAL MODEL
Revenues from tenants (rent covers the administrative costs, cleaning, maintenance and repairs as well as charges for water consumption and sewage and
waste disposal, lifts and joint aerials);
Gmina subsidies as well as housing allowances financed partially from the state
budget.
Table 3.25
The Dynamics of Growth in Municipal Unit Housing Costs
Costs
Growth Rate (1991 = 100)
Total maintenance costs (excluding: central heating and hot water)
848
Costs of day-to-day operation
952
Costs of technical maintenance
694
Costs of central heating
564
The data presented in Table A3.7 in Appendix I undoubtedly shows the radical
transformation of the structure of resources serving to cover the costs of maintaining
the stock. The share of charges incurred by tenants grew twofold (from 38% in 1991
to 79% in 2000) simultaneous to a considerable decrease (3.5 times) of budgetary
subsidies (from gmina or state budgets).
Box 3.5
Rent Policy in Selected Polish Cities
Gdynia and Szczecin—Both of these gminas have aggressive rent policies. They are the only
two gminas with average rents higher than two percent of the current replacement flat value.
Gdynia and Szczecin have shown that it is possible to overcome the political and social
opposition to rent increases by carefully involving all housing market stakeholders (council
members, tenants, gmina management companies, and gmina officials) in discussing proposals
for increasing rents toward market levels. Importantly, these gminas have also made rent
increases part of comprehensive, long-term plans for the housing sector.
Gminas act under a wide variety of schemes and approaches to varying the structure of rents
as also required under the 1994 Act. Most have not made any major changes, and have
relied on various schemes. Krakow, in contrast, has initiated the process of establishing rent
price variations through application of a market-based methodology (the so-called hedonic
technique). For most large gminas that are adopting to a market-based rental structure,
this technique could be very helpful with that portion of the stock that the gminas continue
to own and/or for which they continue to set rent polices for.
SOURCE: Local Government Rent Policy and Best Practice in Poland, report prepared for USAID (project
180-0034) by Sally R. Merrill and other—Urban Institute, Krakow Real Estate Institute, Housing Research Institute, 1998.
157
H O U S I N G P O L I C Y: A N E N D O R A N E W B E G I N N I N G ?
••
PA R T I I
Still, the most important source for covering maintenance costs for gmina stock is
the revenues from the business premises. Therefore, the gminas’ ability to initiate repair
and regeneration projects on wider scale is determined, to a large extent, by the size
of the business premise stock in their possession and, naturally, revenues from these
premises.
The gminas in Poland are obliged by law to apply rent differentiation depending on
the location of the building, the technical conditions, the level of installations coverage
and the location of the apartment in the building. The principles applied by the gminas
regarding rent setting allow for other detailed criteria, such as, insulation, exposure to
traffic and so on.
For “social” dwellings the rental price shall not exceed half of the lowest rent price
for usual gmina apartment and for the dwellings with areas exceeding 80 square meters,
the gminas may apply market rents. Also, in relation to the new tenants, the gminas
apply the free market rents.
It can be estimated that, in mid-2001, the share of municipal apartments with the
regulated rent was 98.6%, ranging from 97.9% for the biggest and smallest cities’ group
to 99.5% in the group of cities with the population from 50 to 99 thousand and those
with a population from 100–199 thousand inhabitants. The average share of dwellings,
where free market rents were applied, on total municipal housing stock (in those citites
participating in the LGHS) was 1.4%.
In the majority of cities (71%) under the LGHS, rents had not covered all the
maintenance costs (excluding the costs of modernization and reconstruction). However,
the situation differed depending on the size of the city. The smaller the size of the city,
the higher the level of costs covered by the rent.
Table 3.26
Does Income from Rent Cover the Maintenance Costs of Municipal Housing?
[% of the total municipalities]
Rents Cover Maintenance Costs
Rents Do Not Cover
Maintenance Costs
20,000–49,999
32
68
50,000–99,999
28
72
100,000–199,999
14
86
200,000 and more
8
92
Weighted average
23
77
Size of Gmina
SOURCE: LGHS.
158
D F I D – L G I
L O C A L
G O V E R N M E N T
P O L I C Y
P A R T N E R S H I P
P R O G R A M
COUNTRY MODELS
••
RENTAL MODEL
In 1991, the rent in municipal housing accounted for PLN 0.16/m2/month. Whereas
in 2000, the average rent was equal to PLN 2.82/m2/month. Taking into account other
charges resulting from the tenants use of the gmina dwelling, it may be concluded that
the housing expenditures (excluding the central heating and hot water) grew eighteen
times between 1991–2000 (as expressed in current prices). Whereas, in real prices, the
housing expenditures increased about three times (see Table A3.6 in Appendix I).
Table 3.27
Average Monthly Housing Expenses Expressed in PLN per Person (2000)
Expenses
1.
Households of
Blue-collar Employees
Households of
White-collar Employees
Households in total
The total housing expenses, including:
91.03
142.89
20.12
32.43
•
rent
•
cold water charges
8.17
11.22
•
total energy charges
47.04
67.75
within:
•
electrical energy and gas
24.23
31.44
•
central heating and hot water
17.66
31.22
•
fuel
5.15
5.09
18.3
16.5
222.54
378.47
69.37
130.23
20.9
21.4
Share of the total housing expenses
within the household budget [%]
2.
In one-person households
The total housing expenses, including:
•
rent
Share of total housing expenses in
household budget [%]
NOTE: Exchange rate USD 1 = PLN 4.35.
SOURCE: Central Statistical Office—Statistical Yearbook 2001.
According to the results of a household budget survey in 2000, the average monthly
expenses per person, related to the use of a dwelling and energy consumption, amounted
to a total of PLN 107.21 per person/month (USD 24.6), including:
•
Rent—PLN 19.49 (USD 4.48);
•
Cold water charges—PLN 8.17 (USD 1.88);
159
H O U S I N G P O L I C Y: A N E N D O R A N E W B E G I N N I N G ?
•
••
PA R T I I
Total energy charges—PLN 58.19 (USD 13.37)
including: Electrical energy and gas—PLN 29.14
Central heating and hot water—PLN 17.40
Fuel—PLN 11.66.
2.2.6 Housing Allowances
Table 3.28 shows the average housing allowances according to the research conducted by
the Housing Research Institute in the cities with various population sizes (representing
jointly 10% of the municipal stock in Poland).
Table 3.28
The Average Value of Housing Allowance
[PLN per Month]
Cities
Average Amount of Allowance
1999
2000
Growth
Indicator
1999 = 100
Over 25,000 inhabitants
109
121
111
25,000–100,000 inhabitants
123
120
98
Over 100,000 inhabitants
131
152
116
Total
127
140
110
Note:
Exchange rates 1999: USD 1 = PLN 3.97; 2000: USD 1 = PLN 4.35.
SOURCE: J. Korniłowicz—collective study project relating to housing monitoring between the years
1990–2000.
The largest housing allowances were paid out in big cities. This results from the
higher rents charged in such cities. The share of the housing allowances paid, in comparison to the total number of dwellings, has grown from 6.0% to 7.6% in 1999. In 2000,
about 18% of households living in gminas housing stock received a housing allowance.
The payment of allowance also depends on the size of the city, for instance:
•
In cities with less than 25,000 inhabitants, 28% of households living in gmina
housing receive an allowance;
•
In the cities with 25,000–100,000 inhabitants, 34.8% of households living in
gmina housing receive an allowance;
•
In the cities with more than 100,000 inhabitants, 14.1% of households living
in gmina housing receive an allowance.
160
D F I D – L G I
L O C A L
G O V E R N M E N T
P O L I C Y
P A R T N E R S H I P
P R O G R A M
COUNTRY MODELS
••
RENTAL MODEL
2.2.7 Vacancies, Rent and Utility Charges’ Arrears, Evictions
The share of uninhabited gmina flats was between 0.9% to 1.3% of total gmina housing
stock during the period from 1990 to 2000. This low number results from a general
housing deficit in Poland. However, this situation makes proper management of the
stock impossible (in particular, during the emergency situations, such as, floods, collapses of buildings, fires, and so on). The average number of voids according to the
LGHS was, as follows:
Table 3.29
The Average Number of Voids in the Cities Surveyed5
The size of Gmina
The Average Number of Voids
20,000–49,999
0.4
50,000–99,999
1.1
100,000–199,999
26.3
200,000 and more
71.9
Weighted average
19.2
SOURCE: LGHS.
By comparing the average number of voids within the cities surveyed to the average adjusted number of gmina dwellings, we determine a share of voids on the level of
0.3% of the total gmina housing stock. Therefore, the average rent loss through voids
represented only 0.13% of the total annual rent roll in 2000; whereas, the lowest level
was present in the group of cities with populations ranging from 50 to 99 thousand
(0.02%), and the highest level was in the group of cities with the population ranging
from 100 to 199 thousand inhabitants (0.46%).
The number of tenants with some kind of charge arrears is exhibited in Table 3.30.
The share of tenants with charge arrears amounted to:
•
34% for cooperative housing stock;
•
35% for gmina owned or managed stock;
•
21% for stock belonging to the State (companies);
•
26% for stock belonging to condominiums.
The number of tenants with charge arrears in dwellings owned by gminas in 2000
amounted to 551.2 thousand. Around one-third of the total number of arrears were
long-term (three months or more).
161
H O U S I N G P O L I C Y: A N E N D O R A N E W B E G I N N I N G ?
••
PA R T I I
Table 3.30
The Number of Tenants in Arrears with Rent and/or Charges Resulting
from the Use of a Dwelling [Thousands]
Tenure
1997
1998
1999
2000
1,170
1,118
1,126
1,165
Housing owned or managed by gminas
714
733
688
682
State (company) housing
194
144
142
140
27
47
90
174
Housing cooperatives
Condominium home-ownership
SOURCE: Central Statistical Office—Housing Economy 2000 and previous year.
Table 3.31
The Total Share of Tenants with Some Kind of Arrear in Gmina Housing
[% from Total Number of Municipal Dwellings]
1997
1998
1999
2000
The total share of tenants with arrears
37.7
38.9
38.3
40.2
Including: over three-month arrears
14.6
15.2
15.6
16.7
SOURCE: Central Statistical Office—Housing Economy 2000 and previous year.
According to the LGHS, the average rent loss through rent arrears accounted for
11.6% of the gross rent roll in 2000 (for cities with populations higher than 20,000
inhabitants). However, it varies from city to city.
About 90% of the cases concerning evictions heard in court were dealt with the
charge arrears for dwelling use. Regulations regarding evictions have been subject to
quite frequent amendment and the tangible results of drawn-out eviction proceedings
were fairly modest. This is illustrated by the data in Table 3.33.
In order to improve the efficiency of rent collection and collection of charges for
central heating or hot water consumption, the managers of the gmina housing stock in
all LGHS cities apply standard methods. These include:
•
Reminders, demand for payment, direct enforcement in the tenant’s apartment;
•
Spreading the overdue rent payment over time and allowing repayment by
installments as well as the redemption of the interest;
•
Improving apartments in return for the repayment of rent arrears;
•
Housing allowances;
•
Court orders, enforcement by the debt collector, evictions;
•
Re-location to a flat of a lower standard.
162
D F I D – L G I
L O C A L
G O V E R N M E N T
P O L I C Y
P A R T N E R S H I P
P R O G R A M
COUNTRY MODELS
••
RENTAL MODEL
Table 3.32
Rent Arrears in the Cities Surveyed [% of Gross Rent Roll]
Size of Gmina
The Arrears in 2000 [%]*
The Arrears Anticipated
in the Year 2001 [%]
20,000–49,999
9.3
10.3
50,000–99,999
13.3
14.0
100,000–199,999
13.6
15.8
200,000 and more
15.1
16.6
Weighted average
11.6
—
* Including arrears from previous years.
SOURCE: LGHS.
Table 3.33
The Eviction Activities Against the Tenants in Dwellings
Owned or Under the Management of Gminas
1997
1998
1999
2000
13,727
15,724
16,386
15,389
The number of eviction verdicts given by the court
6,205
6,841
7,672
6,932
The number of enforced evictions
1,642
2,397
3,076
3,364
of these: those resulting from the charge arrears
1,476
2,162
2,746
3,109
The number of pending court proceedings
SOURCE: Central Statistical Office—Housing Economy 2000 and previous year.
In order to better utilize the uninhabited buildings, some gminas offer potential
tenants the option to refurbish the flat at their expense. Their rent is then adequately
adjusted in accordance with cost of refurbishment. However, in practice, the overall
problem of uninhabited buildings is marginal and generally neglected.
2.2.8 Allocation of Municipal Housing
An extremely long waiting period for allocation of a gmina flat, which could be as long
as six or even more years within big cities, is also a reflection of stock turnover. Due
to the shortage of the new gmina flats, only 2% of the stock is rented out annually. In
principle, the gminas do not have any preferences for newly wed couples with children,
163
H O U S I N G P O L I C Y: A N E N D O R A N E W B E G I N N I N G ?
••
PA R T I I
even though a family situation is one of the many criteria used in making selection of a
new tenant. The basic criterion is the number of inhabitants per square meter of their
current dwelling and, sometimes, substandard living conditions or the unstable, and
dangerous, structure of the building.
Table 3.34
Allocations of Dwellings Belonging to Gmina Stock (2000)
Size of Gmina
The Average Waiting Period
in Months*
The Number of Annual Re-lets**
(2000)
20,000–49,999
57
2.0
50,000–99,999
55
2.1
100,000–199,999
52
3.4
200,000 and more
69
1.7
Weighted average
58
2.2
*
For a household including two adults and one child (just born) where only one adult person earns
the average national salary.
** In % from total gmina having stock.
SOURCE: LGHS.
Table 3.35
The Structure of the Newly Concluded Tenancy Agreements [%]
Size of Gmina
“Social” Dwellings
Other
20,000–49,999
34.8
64.9
50,000–99,999
18.9
71.3
100,000–199,999
18.3
74.0
200,000 and more
34,8
64.8
Weighted average
25.4
69.9
SOURCE: LGHS.
For the majority, representing 93% of the cities surveyed, a waiting list was in
place. However, as little as 23% of the cities applied a clearly defined scoring system
for the evaluation of housing needs and, in the big cities, this share was even lower,
amounting to 16%.
Almost 60% of the cities, with the biggest cities occupying a dominant position of
83%, declared that they apply the differentiated policy of flat allocation which takes into
164
D F I D – L G I
L O C A L
G O V E R N M E N T
P O L I C Y
P A R T N E R S H I P
P R O G R A M
COUNTRY MODELS
••
RENTAL MODEL
account various groups of tenants. However, the given examples for such differentiation, are the allocation of flats for persons brought up in the orphanages and persons
released from prison (as prescribed by law).
The gminas also maintain a small margin of dwellings as reserve, in preparation for
unexpected social needs (emergency situations). Within the group of allocated gmina
flats (or to be more correct within the framework of the tenancy agreements), a considerable share goes to “social” dwellings (25%).
3.
CONCLUSIONS AND RECOMMENDATIONS
1) The changes observed in Polish housing policy, during the period of economic
transition between 1990–2000, had the following results:
•
The state direct involvement in financing housing construction and housing
economy became significantly limited;
•
Local governments began to play a vital role in the housing sector;
•
The importance of economic efficiency in housing and housing resource management increased.
The state housing policy created grounds for new institutions (the National Housing
Fund, the Housing Savings Banks, the Social Housing Associations) and new tools
aimed at supporting housing development. These included rent prices regulated at
the local level, housing allowances, preferential housing loans and tax relief within
the income tax system.
2) In view of the above changes, local governments became responsible for catering
to local community housing needs via the application of tools and measures introduced by the national and local housing policies. Such initiatives were launched
in respect to the local rent policy, aiming at rational management of municipal
housing resources, local governments’ active involvement in the development of
social housing projects addressed to low-income households, creation of favorable
grounds for housing developers through the application of suitable land policies
and indirect land development opportunities.
3) The effectiveness of housing resource management was improved by privatizing the
gminas’ (municipality) resources, having been administered by local governments
since 1990.
4) In order to meet the housing demands of the local community, including social
aspects, local governments were placed under the obligation to subsidize housing
165
H O U S I N G P O L I C Y: A N E N D O R A N E W B E G I N N I N G ?
••
PA R T I I
costs and pay housing allowances in accordance with statutory provisions. Local
authorities also became responsible for providing council housing to tenants from
the lowest income bracket as well as to the homeless (“social” housing).
5) Local governments did not receive any direct, or indirect, financial support from
the central budget at the required level to solve the housing problems. In particular, these included the related obligation to create satisfactory groundwork for the
development of housing and the local governments’ direct involvement in various
programs (housing subsidies, the Social Housing Associations, council housing,
development of municipal infrastructure). As a result, many programs were implemented inefficiently and some were even suspended (such as repairs and upgrade
support programs for housing resources or the case that concerned the establishment
of the Busparkasse type housing banks).
6) Due to ineffective methods of municipal housing resource management in the
past, the process of privatizing municipal resources and creating condominiums
was obstructed by financial problems related to the upkeep and upgrading of community resources. The solutions introduced frequently prevented condominiums
from raising the required funds to repair and upgrade their resources by taking out
bank loans on satisfactory terms or acquiring the financial support of local authorities. Thus, the anticipated improvement in housing resource management can not
be observed in practice.
7) According to the results of research and polls conducted in connection with this
project over the past few years, Polish municipalities began to focus on developing
own housing policies and strategies. This enable them to correctly identify the hierarchy of housing needs and formulate the objectives, methods and tools required
to meet those goals. The above stated particularly applies to medium-size and large
cities, 40-50% of which have developed such strategies and programs. Nevertheless, there are very few comprehensive programs and the shortage of suitable tools
and procedures obstructs their implementation. This insufficiency results from the
persistent lack of awareness of the need for system action, the commune’s inability
to develop such programs, and the shortage of funds. Another major obstacle is the
lack of stability in the development and implementation process of state housing
policy. It should also be noted that local authorities with a high share of municipal
resources are more actively involved in the creation and implementation of local
housing strategies.
8) The changes observed in the Polish economy between 1996 and 1998 brought relatively high economic growth. This, however, was not accompanied by an adequate
166
D F I D – L G I
L O C A L
G O V E R N M E N T
P O L I C Y
P A R T N E R S H I P
P R O G R A M
COUNTRY MODELS
••
RENTAL MODEL
support for public funding, including state funding, for housing programs. The
crisis, which surfaced in 2001, including a deficit in the public finance sector, has
led to the suspension of several new housing programs. The future of numerous
programs continues to remain uncertain. The former applies to the “own apartment” program, new housing saving scheme as well as programs on upgrading
of the existing housing resources. The latter concerns the development of social
housing, housing subsidies, development of municipal infrastructure and meeting
the housing needs of tenants from the lowest income group.
9) The present situation poses a new challenge for local governments that now face the
need to develop and implement effective housing policies and also need to initiate
new measures to establish partner relationships within the local community.
10) The state authorities should be responsible for verifying and defining the hierarchy
of the formerly developed housing programs. They should also provide the required
financial support for these programs from the central budget or other state-aided
sources as well as providing local governments with new options for generating such
resources (such as privatization programs).
Following are the main recommendations for both the national and local housing
policies:
1)
National Housing Policy
The income structure of the Polish society, where a definite majority are low- and
medium income households, doesn’t seem to be a favourable phenomenon to solve
the present housing deficit by solely market forces. Hence, apart from activities aimed
at stimulation of demand from the households that can aspire to own their dwelling,
one should promote the development of the rental housing, which is the only way of
meeting the housing needs of most society at present.
One solution should be the continuation of the programme of social housing
construction realized by the Social Housing Associations (TBS). Besides that, housing
cooperatives, prepared to investment activities and exploitation of housing stock, should
have wider access to the funds of the National Housing Fund for construction of rental
flats. The rules and regulations for allocation of funds should consider the experiences
and effectiveness of entities applying for preferential credits; the housing cooperatives
may be such entities.
High deficit in “social” housing for the poorest groups of population should force
the State to increase support for construction and financing of new “social” housing.
167
H O U S I N G P O L I C Y: A N E N D O R A N E W B E G I N N I N G ?
••
PA R T I I
Extending access to housing allowances is necessary now. With simultaneous growth
in rental prices, it should create appropriate conditions for active rent policy, favourable
for revitalisation of communal and private housing stock.
A number of reasons (legal, organizational, and financial) contribute to the bad
condition in the field of housing stock maintenance. It concerns especially gminas
housing stock. The long time of postponement in renovation works resulted in general
overhauls which are costly for tenants. They can only be carried out if special funds
are allocated for this purpose. Significant support from the state budget is necessary in
that situation. Support should be both of direct and indirect types: direct support in a
form of interest subsidies and indirect in a form of tax relief.
The high level of deficit in the field of communal infrastructure has negative impact
on the living condition of the population and constitutes one of the basic barriers to
housing construction as well as to rehabilitation and modernization of existing housing
stock. The level of local government investments does not correspond to the demand
in this respect. The most of cost of investment projects are mainly financed by gminas
own funds. To move that barrier the financial support, at attractive conditions, should
be applied within the framework of the state housing policy.
The crucial element in realisation of housing policy at the local level is the stability,
at least in the medium-term, of state housing policy.
2)
Local Housing Policy
The actions of communes within the scope of housing should be based on strategic
plans, whose objectives should be approved by the Local Councils. A good opportunity
may be a duty of preparation of long-term strategy on housing stock management,
imposed on communes in 2002.
Privatization of communal housing stock should be realised in a well-thought out
and selective manner, enabling the communes to realize their assignments within the
scope of satisfying housing needs of local society.
When restructuring the management of communal housing stock, the market
rules and competition should be taken into account. According to certain opinions,
the commune should not participate in management of real properties forming the
condominiums.
The current budget enterprises, managing the commune-owned housing, are
not effective and competent entities because they are dependent and restricted by the
regulations of the Budgetary Act. In addition to this, they are not a subject to competition pressure, hence, it may be advisable to convert them into independent economic
entities. Based on existing experience, the creation of multilevel managing structures
is not advisable.
168
D F I D – L G I
L O C A L
G O V E R N M E N T
P O L I C Y
P A R T N E R S H I P
P R O G R A M
COUNTRY MODELS
••
RENTAL MODEL
The information received from the Polish local authorities indicate that waiting
lists and explicit systems of living standard evaluation are applied only partially and
that, in principle, no real preferences for the group of needy population (young married
couples with children, disabled persons, elderly, etc.) are determined. When housing
strategy and plan of housing stock management is prepared, it is necessary to take into
consideration legible and socially acceptable clarification of the rules and regulations
determining the access to municipal flats at moderate rents.
The communes should search for new solutions in the field of “social” housing, aimed
at increasing the number of “social” flats (by extension of buildings, loft adaptation,
redemption of flats for debts, etc.). It should be remembered, however, that creation of
“social” housing stock should not lead to the creation of so called social ghettos.
3)
Revitalisation of Urban Areas
Low standard of municipal housing stock requires acceleration of the pending works
on the Act pertaining to housing stock revitalisation (setting legal conditions for public–private partnership in this field).
The problem of revitalisation of urban areas, including communal housing stock,
requires both legislative activity of the State and practical activity of the communes.
Communes should be inspired by the best practices of some Polish cities within this
scope and the experience coming from countries of the European Union. This concerns
mainly planning and financial strategy of such undertakings.
In connection with expected accession of Poland to the European Union, it is
important to identify, adopt, and use the experience of the European Union countries
within the scope of urban planning, housing finance, housing stock management and
revitalisation of housing resources. Local government should be prepared to take advantage of the European Union funds in this area of activity.
169
H O U S I N G P O L I C Y: A N E N D O R A N E W B E G I N N I N G ?
••
PA R T I I
ENDNOTES
1
This period can be divided into two phases (1989–1993)—firstly, in which principal
system changes were made, secondly, a phase (1994–1997) already concentrated
on the investment process in construction, managing of the existing housing stock
and creation condition for its development.
2
New regulations introduced in 2001 (Act on the Tenants Rights and the Municipal
Housing Stock) changed the principles of the increase of rental levels—the term
“regulated rent” is actually not used, but the tempo of the rent level increases are
regulated.
3
Revenues and expenditures of the gminas’ budgets (only urban area) in Poland in
2000 were the following:
a) revenues—own revenues 48%, appropriated allocations (from the state budget
and funds) 20%, general subsidies from the state budget (31%, mainly for
educational tasks).
— in own revenues: share in the income tax (personal and income tax)—36% of
own revenues, real estate tax (23% of own revenue), revenue from property
and services (19% of own revenues), agricultural tax and tax on means of
transport and treasury fee (22%).
b) expenditures—municipal transport (8.7%), municipal economy (13%), education (38%), housing economy and intangible municipal services (5.3%), social
welfare (11%).
4
The level of correctness of the questionnaires returned, differed. The respondents
raised doubts about the way goals were prioritised and the statistical data, regarding
the city’s whole housing stock, seemed patchy. Therefore, the share of gmina stock
was overestimated. In the cases which raised doubts, the data was corrected.
5
The percentage of uninhabited dwellings does not exceed 1.2% of total gmina’s
stock.
170
D F I D – L G I
L O C A L
G O V E R N M E N T
P O L I C Y
P A R T N E R S H I P
P R O G R A M
COUNTRY MODELS
••
RENTAL MODEL
APPENDIX I
Table A3.1
Geographic Location of Municipal Housing in Poland in 2000
Number of Municipal
Flats in Urban Areas
Share of Municipal Flats in Urban
Areas within the Total Number of
Flats in Urban Areas [%]
Share of Municipal Flats in Rural
Areas within the Total Number of
Municipal Flats [%]
Total Number of Council
Flats in 2000
Share of Council Flats within
Total Number of
Municipal Apartments [%]
Dolnos´laskie
702.3
226.5
208.1
29.6
8.1
3.5
1.5
Zachodniopomorskie
380.9
93.8
88.1
23.1
6.1
1.3
1.4
Lubuskie
210.1
49.9
46.3
22.0
7.2
1.0
2.0
Opolskie
184.0
43.0
38.9
21.1
9.5
0.9
2.1
Pomorskie
480.1
96.2
91.2
19.0
5.2
1.3
1.4
Łódzkie
643.4
127.0
121.5
18.9
4.3
3.7
2.9
1,319.6
231.7
226.3
17.1
2.3
4.4
1.9
269.5
48.8
41.8
15.5
14.3
1.4
2.9
1,177.4
178.3
170.1
14.4
4.6
3.9
2.2
Kujawsko–Pomorskie
429.2
67.1
59.4
13.8
11.5
1.4
2.1
Woelkopolskie
613.9
78.8
68.1
11.1
13.6
1.1
1.4
Malopolskie
527.4
56.7
53.6
10.2
5.5
0.8
1.4
Podlaskie
232.7
21.9
19.6
8.4
10.5
0.3
1.4
Podkarpackie
257.5
20.5
18.2
7.1
11.2
0.9
4.4
Lubelskie
328.3
20.9
17.5
5.3
16.3
1.1
5.3
S´wietokrzyskie
196.9
9.8
7.7
3.9
21.4
2.6
26.5
Total Number of Flats
in Urban Areas in 2000
Total Number of Municipal Flats
Voivodship
S´laskie
Warmin´sko–Mazurskie
Mazowieckie
SOURCE: Central Statistical Office—Housing Economy 2000.
171
H O U S I N G P O L I C Y: A N E N D O R A N E W B E G I N N I N G ?
••
PA R T I I
Figure A3.1
Geographic Location of Municipal Housing in Urban Areas
within Poland during 2000
Pomorskie
Warminsko–Mazurskie
Zachodniopomorskie
Podlaskie
Kujawsko–
Pomorskie
Mazowieckie
Lubuskie
Woelkopolskie
Lodzkie
Lubelskie
Dolnoslaskie
Swietokrzyskie
Opolskie
Slaskie
Pokarpackie
Malopolskie
23.1–29.6%
16.7–23.1%
10.3–16.7%
4.0–10.3%
172
D F I D – L G I
L O C A L
G O V E R N M E N T
P O L I C Y
P A R T N E R S H I P
P R O G R A M
COUNTRY MODELS
••
RENTAL MODEL
Table A3.2
Total Unit Costs in Relation to Gminas’ Housing Stock Maintenance,
as Expressed in PLN/m2/month
1991
1992
1993
1994
1995
1996
1997
1998
1999
2000
0.42
0.69
0.82
1.03
1.53
1.77
2.27
2.84
3.29
3.56
The cost growth indicator
100
(1991 = 100) in current prices
164
195
245
364
421
540
676
783
848
Inflation indicator
(1991 = 100)
100
143
193
256
327
392
450
503
540
595
Costs in PLN/m2/month,
base prices in 1991
0.42
0.48
0.42
0.40
0.47
0.45
0.50
0.56
0.61
0.60
The costs growth indicator
(1991=100) in base prices
100
114
100
96
111
107
120
134
145
142
2
Costs in PLN/m /month
NOTE:
Exchange rates 1 USD to PLN, in the years 1991–2000: 1991—1.095; 1992—1.565; 1993—
1.815; 1994—2.273; 1995—2.424; 1996—2.697; 1997—3.281; 1998—3.493; 1999—3.968;
2000—4.346. For the years between 1991–1992, the exchange rate is taken from 31st December
for the coming years’ annual average exchange rate.
SOURCE: J. Korniłowicz—collective study work regarding housing monitoring, 1990–2000.
Table A3.3
Total Unit Costs of Maintaining the Cooperative Housing Stock,
as Expressed in PLN/m2/month (Exclusive of Central Heating and Hot Water)
1991
1992
1993
1994
1995
1996
1997
1998
1999
2000
Costs in PLN per m
0.37
0.59
0.69
0.97
1.20
1.61
1.97
2.59
3.09
3.69
Cost growth indicator
(1991 = 100)
in current prices
100
159
186
262
325
436
532
700
835
997
2
Note:
Exchange rates 1 USD to PLN, between 1991–2000: 1991—1.095; 1992—1.565; 1993—1.815;
1994—2.273; 1995—2.424; 1996—2.697; 1997—3.281; 1998—3.493; 1999—3.968; 2000
—4.346. For the years between 1991–1992, the exchange rate is taken from 31st December
for the coming years’ annual average exchange rate.
Source: J. Korniłowicz—collective study work regarding housing monitoring, 1990–2000.
173
H O U S I N G P O L I C Y: A N E N D O R A N E W B E G I N N I N G ?
••
PA R T I I
Table A3.4
Unit Costs for Day-to-day Operation, as well as Gminas’ Housing Stock Technical
Maintenance, in PLN/m2/month (Exclusive of Central Heating and Hot Water)
1991
1992
1993
1994
1995
1996
1997
1998
1999
2000
Day to day operational costs
[PLN/m2/month]
0.25
0.43
0.53
0.69
1.04
1.21
1.49
1.72
2.17
2.38
The cost growth indicator
(1991=100) in current prices
100
172
212
275
415
481
596
716
868
952
Inflation indicator (1991=100) 100
143
193
256
327
392
450
503
540
595
Technical maintenance costs
[PLN/m2/month]
in current price
0,17
0.26
0.29
0.34
0.49
0.56
0.78
1.05
1.12
1.18
The costs growth indicator
(1991=100) in current prices
100
153
171
200
289
329
459
648
659
694
NOTE:
Exchange rates 1 USD to PLN, in the years 1991–2000: 1991—1.095; 1992—1.565; 1993 —
1.815; 1994—2.273; 1995—2.424; 1996—2.697; 1997—3.281; 1998—3.493; 1999—3.968;
2000 – 4.346. For the years between 1991–1992, the exchange rate is taken from 31st December
for the coming years’ annual average exchange rate.
SOURCE: J. Korniłowicz—collective study work regarding housing monitoring, 1990–2000.
Table A3.5
Unit Costs and Charges for Central Heating
and the Amount Covered by Gmina Housing Stock Tenants
1991
1992
1993
1994
1995
1996
1997
1998
1999
2000
1991
=
100
Costs of central
heating expressed
[PLN/m2/month]
0.48
0.73
0.90
1.12
1.60
1.85
2.25
2.56
2.68
2.71
564
Charges for hot
water expressed
[PLN/m2/month]
0.17
0.46
0.70
1.05
1.54
1.74
2.16
2.43
2.68
2.71 1,594
Amount covered
by tenants’ charges
[%]
35
63
78
94
96
94
96
95
100
100
—
NOTE:
Exchange rates 1 USD to PLN for the years between 1991–2000: 1991—1.095; 1992—1.565;
1993—1.815; 1994—2.273; 1995—2.424; 1996—2.697; 1997—3.281; 1998—3.493;
1999–3.968; 2000—4.346. For the years between 1991-1992, the exchange rate is taken from
31st December for the coming years’ annual average exchange rate.
SOURCE: J. Korniłowicz—collective study work regarding housing monitoring, 1990–2000.
174
D F I D – L G I
L O C A L
G O V E R N M E N T
P O L I C Y
P A R T N E R S H I P
P R O G R A M
COUNTRY MODELS
••
RENTAL MODEL
Table A3.6
Unit Revenues from Dwellings Belonging to Gmina Housing Stock,
as Expressed in PLN/m2/month
(Excluding Costs of Central Heating and Hot Water)
1991
1992
1993
1994
1995
Revenues expressed [PLN/m2/month]
0.16
0.27
0.3
0.33
0.98
Revenue growth indicator
(1991 = 100) in current prices
100
169
188
206
613
Inflation index (1991=100)
100
143
193
256
327
0.160
0.189
0.155
0.129
0.300
100
118
97
81
187
—
293.5
399.5
532.8
702.6
1997
1998
1999
2000
Revenues expressed [PLN/m2/month],
base prices for 1991
The revenues growth indicator
(1991 = 100) in base prices
Gross average monthly salary
published as for the national
economy expressed [PLN]
1996
Revenues expressed
[PLN/m2/month]
1.21
1.59
2.02
2.46
2.82
Revenue growth indicator
(1991 = 100) in current prices
756
994
1,263
1,538
1,763
Inflation index (1991=100)
392
450
503
540
595
0.309
0.353
0.401
0.455
0.474
193
221
251
285
296
873.0
1,061.9
1,239.4
1,706.7
1,923.8
Revenues expressed [PLN/m2/month],
base prices for 1991
The revenues growth indicator
(1991 = 100) in base prices
Gross average monthly salary
published as for the national
economy expressed [PLN]
NOTE:
Exchange rates 1 USD to PLN for the years between 1991–2000: 1991—1.095; 1992—1.565;
1993—1.815; 1994—2.273; 1995—2.424; 1996—2.697; 1997—3.281; 1998—3.493;
1999–3.968; 2000—4.346. For the years between 1991-1992, the exchange rate is taken from
31st December for the coming years’ annual average exchange rate.
SOURCE: J. Korniłowicz—collective study work regarding housing monitoring, 1990–2000.
175
H O U S I N G P O L I C Y: A N E N D O R A N E W B E G I N N I N G ?
••
PA R T I I
Table A3.7
Structure of Resources Covering the Total Dwelling Maintenance Costs
for Gminas’ Stock [%]
The share of the cost
coverage
1991
1992
1993
1994
1995
1996
1997
1998
1999
2000
Revenues from
dwellings (exclusive of
central heating
and hot water)
38
39
37
32
64
68
70
71
75
79
Surplus of
revenues from
business premises
33
32
29
24
20
20
17
14
12
13
Subsidies from
communes and
housing allowances
29
29
34
44
16
12
13
15
13
8
SOURCE: J. Korniłowicz—collective study work regarding the housing monitoring for years 1990–
2000.
176
D F I D – L G I
L O C A L
G O V E R N M E N T
P O L I C Y
P A R T N E R S H I P
P R O G R A M
COUNTRY MODELS
••
RENTAL MODEL
Table A3.8
General Indicators
The rate of inflation [%]
(previous year = 100)
Average costs [PLN/m2 of
new constructed dwelling] in
the third quarter of the year
Index on average cost
[PLN/m2 of new constructed
dwelling] (previous year=100)
The number of m2
of dwelling/average salary
1990
1991
1992
1993
1994
1995
685.8
170.3
143.0
135.3
132.2
127.8
160
354
530
730
810
920
682.0
221.3
149.7
137.7
111.0
113.6
0.64
0.50
0.55
0.55
0.66
0.76
1996
1997
1998
1999
2000
The rate of inflation [%]
(previous year = 100)
119.9
114.9
1118
107.3
110.1
Average costs [PLN/m2 of
new constructed dwelling] in
the third quarter of the year
1,170
1,450
1,900
2,200
2,300
Index on average cost
[PLN/m2 of new constructed
dwelling] (previous year=100)
127.2
123.9
131.0
115.8
104.5
The number of m2
of dwelling/average salary
0.75
0.73
0.65
0.78
0.84
NOTE:
Exchange rates 1 USD to PLN, between the years 1991–2000: 1991—.095; 1992—1.565;
1993—1.815; 1994—2.273; 1995—2.424; 1996—2.697; 1997—3.281; 1998—3.493;
1999—3.968; 2000—4.346. For the years between 1991–1992, the exchange rate is taken
from 31st December for the coming years’ annual average exchange rate.
SOURCE: Central Statistical Office—Statistical Yearbook 2001 and previous years.
177
H O U S I N G P O L I C Y: A N E N D O R A N E W B E G I N N I N G ?
••
PA R T I I
APPENDIX II
Table A3.9
Housing Construction during 1991–2000
Items
1991
1992
1993
1994
Dwellings completed in thousands,
within [%] by
•
cooperatives
•
gminas (municipal)
•
companies
•
rental or for sale
•
social housing associations
•
private individuals
136.8
133.0
94.4
76.1
67.1
61.1
1.9
7.8
—
—
29.2
63.4
2.7
6.2
—
—
27.7
52.9
4.9
6.3
0.5
—
35.4
41.7
4.7
5.0
1.9
—
46.7
40.0
4.9
3.7
4.2
—
47.2
Dwellings completed per
1,000 population
•
1,000 marriages contracted
3.6
587
3.5
612
2.5
455
2.0
366
1.7
324
Average usable floor space/dwelling
completed [m2]
75.0
75.0
81.1
88.5
89.6
105.8
464.9
—
—
—
—
—
—
90.6
537.7
1998
1999
•
Dwellings in thousands
•
started
•
under construction
Items
1996
1997
1995
2000
62.1
73.7
80.6
82.0
87.7
39.6
4.8
2.6
4.3
0.2
48.5
38.1
5.0
1.9
6.9
0.4
47.7
34.8
4.2
1.7
11.2
1.7
46.4
33.5
3.3
1.2
17.3
4.1
40.6
24.4
2.0
1.2
20.7
4.4
39.7
Dwellings completed per
•
1,000 population
•
1,000 marriages contracted
1.6
305
1.9
360
2.1
385
2.1
374
2.3
416
Average usable floor space/dwelling
completed [m2]
92.1
93.3
93.4
87.8
89.7
98.6
576.6
97.8
602.9
93.9
618.8
135.6
672.3
125.8
710.5
Dwellings completed in thousands,
within [%] by
•
cooperatives
•
gminas (municipal)
•
companies
•
rental or for sale
•
social housing associations
•
private individuals
Dwellings in thousands
•
started
•
under construction
SOURCE: On the basis of the Statistical Yearbook of the Republic of Poland 2001 and previous years—
Central Statistical Office.
178
D F I D – L G I
L O C A L
G O V E R N M E N T
P O L I C Y
P A R T N E R S H I P
P R O G R A M
COUNTRY MODELS
••
RENTAL MODEL
Table A3.10
State Budget Expenditures for Housing Purposes
—Level, Structure, and Its Relationships
Items
Total housing spending
•
[million PLN]
•
[%] ( previous year = 100)
Share in total spending
spending created for
new housing demand
•
other spending
•
Relations of housing spending to [%]
state budget expenditure
•
gross domestic product
•
Items
Total housing spending
•
[million PLN]
•
[%] ( previous year = 100)
Share in total spending
spending created for
new housing demand
•
other spending
•
Relations of housing spending to [%]
state budget expenditure
•
gross domestic product
•
1991
1992
1993
1994
1995
1,227
100.0
2,350
191.5
1,923
81.8
2,760
143.5
2,817
102.1
17.0
22.0
23.0
25.0
6.0
83.0
78.0
77.0
75.0
74.0
5.1
1.5
6.1
2.0
3.8
1.2
4.0
1.3
3.1
1.0
1996
1997
1998
1999
2000
3,398
120.6
3,392
99.8
3,297
97.2
3,103
94.1
2,590
83.5
29.0
35.0
36.0
36.0
48.0
71.0
65.0
64.0
664.0
52.0
3.1
0.9
2.7
0.8
2.4
0.6
1.5
0.3
1.7
0.4
NOTE:
Exchange rates 1 USD to PLN, between the years 1991–2000: 1991—1.095; 1992—1.565;
1993—1.815; 1994—2.273; 1995—2.424; 1996—2.697; 1997—3.281; 1998—3.493;
1999—3.968; 2000—4.346 For the years between 1991–1992, the exchange rate is taken from
31st December for the coming years’ annual average exchange rate.
SOURCE: On the basis of State Office for Housing and Urban Development.
179
H O U S I N G P O L I C Y: A N E N D O R A N E W B E G I N N I N G ?
••
PA R T I I
Table A3.11
Housing Allowances Paid to Tenants and Subsidies from the State Budget
Number of paid
allowances [thousands]
Total spending on
housing allowances
[million PLN]
Share of state budget subsidies for financing total
of housing allowances
payments [%]
Average amount of
monthly housing
allowances [PLN]
within housing stock of:
•
gmina (municipal)
•
cooperative
•
company
•
other
1995
1996
1997
1998
1999
2000
6,652.3
7,576.4
7,786.3
8,640.1
8,747.8
9,086.9
410.9
512.2
646
914.2
1,044.4
1,264.4
55.9
51.8
50.2
49.9
39.9
43.5
61.79
67.66
83.26
106.10
119.5
131.4
57.48
63.98
65.92
52.04
62.05
71.42
72.08
57.26
76.82
88.64
87.55
68.76
99.86
111.07
117.20
91.66
116.34
123.15
131.28
104.71
137.3
140.5
131.4
NOTE:
Exchange rates 1 USD to PLN, between the years 1991–2000: 1991—1.095; 1992—1.565;
1993—1.815; 1994—2.273; 1995—2.424; 1996—2.697; 1997—3.281; 1998—3.493;
1999—3.968; 2000—4.346 For the years between 1991–1992, the exchange rate is taken from
31st December for the coming years’ annual average exchange rate.
SOURCE: On the basis of State Office for Housing and Urban Development.
180
D F I D – L G I
L O C A L
G O V E R N M E N T
P O L I C Y
P A R T N E R S H I P
P R O G R A M
COUNTRY MODELS
••
RENTAL MODEL
Table A3.12
Buildings which Constitute the Sole Property of the Municipality,
in View of the Method of Management and Administration
Specification
Managed by the
municipality
1995
1996
1997
1998
1999
2000
135,454
136,661
128,743
118,951
109,322
102,987
2,095
—
—
—
—
—
Administered by
the municipality
135,762
134,300
125,789
116,464
105,902
97,039
Administered
by an individual
165
526
1,466
180
1,170
952
Administered
by other entities
1,622
1,835
1,488
2,307
2,251
4,996
100
98.2
97.7
97.9
96.
94.2
Managed by
other entities
Share of buildings
administrated by
the gmina [%]
SOURCE: Central Statistical Office—Housing Economy 2000 and previous years.
Table A3.13
Buildings Co-owned by the Gminas (Condominiums),
in View of the Method of Management and Administration
Specification
1995
1996
1997
1998
1999
2000
Total number of condominium
buildings
64,253
69,348
76,733
81,258
84,979
84,898
Managed by the gmina
61,297
67,779
71,932
74,527
77,845
72,205
Managed by other entities
2,956
1,569
4,801
6,731
7,134
12,693
Administered by the gmina
61,649
66,023
72,437
76,559
78,715
72,713
Administered by an individual
950
1,285
2,036
1,835
3,380
4,210
Administered by other entities
1,654
2,040
2,260
2,864
2,884
7,975
95.9
95.2
94.4
94.2
92.6
85.6
Share of buildings administrated
by the gmina [%]
SOURCE: Central Statistical Office—Housing Economy 2000 and previous years.
181
H O U S I N G P O L I C Y: A N E N D O R A N E W B E G I N N I N G ?
182
D F I D – L G I
L O C A L
••
PA R T I I
G O V E R N M E N T
P O L I C Y
P A R T N E R S H I P
P R O G R A M


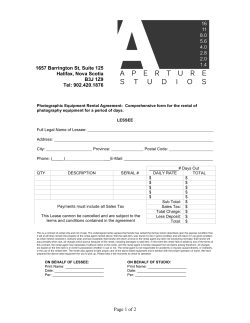

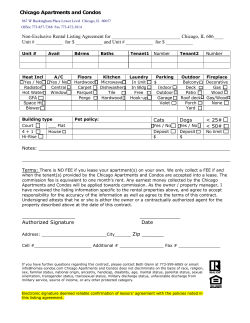

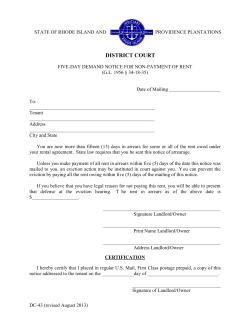


© Copyright 2026