
How to Identify a Bathtub Hazard Rate | IEEE Reliability Paper
IEEE TRANSACTIONS ON RELIABILITY, VOL. R-36, NO. 1, 1987 APRIL
106
How to Identify a Bathtub Hazard Rate
Magne Vollan Aarset
Storebrand Ins. Co., Oslo
Nomenclature
F-1(t)
30
TTT transform: HF1(t)
Key Words-Lifetime data, Hazard rate, Bathtub curve,
Total time on test
Scaled TTT transform: OF(t)
-1
Abstract-The Total Time on Test (TTT) concept is a useful
tool in several reliability contexts. This note presents a new test
statistic, based on the TTT plot, for testing if a random sample is
generated from a life distribution with constant versus bathtubshaped hazard rate.
F(r/N)
0
Empirical TTT transform: HN(r/N)
Scaled empirical TTT transform: kN(r/N)
-HN
Reader Aids-
Purpose: Widen state of art
Special math needed for explanations: Probability and elementary statistics
Special math needed to use results: Same
Results useful to: Reliability analysts and theoreticians
F (u)du.
HF1(t)/HF1(l).
(r/N)/HN'(I)
r
=
(
TN: i
+
1
N
(N- r) TN:/
-
FN(u)du.
Ti.
7
TN:r1
For 0 < t ( 1, Ojv(t) is defined by linear interpolation.
TTT plot: The plot of (r/N, 5Nv(r/N)) (r = 0, 1, ..., N),
where consecutive points are connected by straight
i1
lines.
PN{
V
)
-F(t)
)
{N
for (r - 1)/N < t < r/N, 1 6 r 6 N and TN(O) 0.
Minimax rule: The minimax rule minimizes the maximum
probability of error.
1. INTRODUCTION
2. TOTAL TIME ON TEST
The hazard rate is a basic concept in reliability theory. If
the life distribution is absolutely continuous, which very
often can be assumed, the hazard rate uniquely determines
the life distribution. An important class of life distributions arises when the hazard rate is bathtub-shaped (section 2).
Probability plotting methods are widely used in applied statistics. This paper studies the Total Time on Test
(TTT) plot [4], and shows that the asymptotic distribution
of a test statistic based on the TTT plot under exponentiality has a well known (among statisticians) distribution. This
statistic is one of the very few statistics that is specially
derived for testing exponentiality (constant hazard rate)
against bathtub distributions ll].
The TTT concept was introduced by Barlow et al. [3].
They proved that if F is strictly increasing,
uniformly
on
(0,
1)
with
probability
one
as
t
rIN
OF(t)
and N - oo. Barlow & Campo [4] therefore suggested a
comparison of the TTT plot to graphs of TTT transforms
for model identification. Some properties of the TTT
transform are listed by Bergman & Klefsj6 [7].
An important feature of the TTT transform is that it
gives immediate information about the shape of the hazard
rate. If F is strictly increasing, then
Notation
TiT
random
sample
r
s ffrom a life distribution, i I
N.
TN:i ordered sample from a life distribution, i = 1, .,
N.
F
absolutely continuous Cdf of a life distribution.
EN
empirical Cdf of a life distribution,
h
hazard rate
implies the complement
F1(s) inf{u:F(u) > s}.
=
N
FN1(s) inf{u:FN(u) ~ s}.
ON(rN)
d
't
HF1(t)
= [h(F (t))]-1
(1)
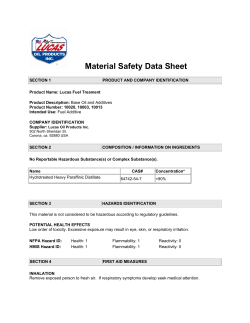
for almost all t E (0, 1). Based on (1), Barlow & Campo [4]
proved that a life distribution has increasing (decreasing)
hazard rate if and only if the scaled TTT transform is concave
(convex) for 0 < t ( 1.1<
cav (cnvx
A class of life distributions can be constructed by
assuming that the hazard rate: 1) decreases during the infant mortality phase, 2) is constant during the so-called
useful life phase and, 3) increases during the wear-out
phase. In reliability literature such hazard rate functions
are said to have a bathtub shape. Eq (1) shows that the
TTT transform of a life distribution with bathtub-shaped
hazard rate is illustrated in figure 1.
fo*
3. A TEST BASED ON THE TTT PLOT
Other, standard notation is given in "Information for
Readers & Authors" at rear of each issue.
Many TTT-based procedures for testing exponentiality
against different classes of life distributions have been
0018-9529/87/0400-0106$01 .00©(B1987 IEEE
AARSET: HOW TO IDENTIFY A BATHTUB HAZARD RATE
107
Nomenclature
Wiener process: A stochastic process { W(t); t > 0} where
(i) W(O) = 0
(ii) { W(t); t > 0} has stationary independent increments
(iii) W(t) is normally distributed with mean t and
variance t for all t > 0.
Brownian Bridge on (0, 1): A stochastic process { U(t); 0 (
t 1} where U(t) = W(t) -- tW(t), 0 < t< 1.
Under exponentiality TN(t) D U(t) when N - o[4.
According to the invariance principle [91, the RN therefore
has the same asymptotic distribution as:
2 ==t
0.0olo
f
Fig. 1. Scaled TTT transform from distributions with form of the
hazard rate as shown on each curve.
U2(t)dt.
Because the Cramer-von Mises statistic also has the property
2
WN
= N i
2
2
[F(t)
-
F(t)] dF(t) D W
suggested [1, 4, 7]. Barlow & Doksum [51 proved that a test the W has been extensively studied. Durbin [10] gives its
which rejects exponentiality in favor of a distribution with Cdf
increasing hazard rate when the signed area between the
TTT plot and the diagonal is large, asymptotically is
2
o
(Zi)272
minimax. A test based on the signed area is poor for Pr{W x} = 1 - (1/¶) E (- 1)
(½i )2T2
jl
discovering a bathtub distribution. But a test based on the
(strictly positive) area might be more powerful. With this
-1
.
/2 -xy/2
in mind, and wishing to benefit from the literature on
y1((- V,)/sin>v3) e dy; x > 0,
goodness-of-fit tests, I propose the test statistic:
a distribution tabulated by Anderson & Darling [2].
=-1
N
RN = l TW(t)dt.
The null hypothesis is rejected when RN is large.
RN can be used to measure discrepancy between observations and an hypothesis in general, but here I derive its
asymptotic distribution under exponentiality only.
Observe that RN is large if the data seem to support a
distribution with, for instance, first increasing hazard rate,
then constant, and finally decreasing hazard rate (the "opposite" of a bathtub curve). If the observations are claims
an insurance company gets after fires, it often seems
realistic to assume that the underlying distribution has
such a hazard rate. If the null hypothesis is rejected, we
therefore study which alternative the TTT plot indicates.
Are the observations generated from a life distribution
with increasing hazard rate, decreasing hazard rate,
bathtub hazard rate, or something else?
Under exponentiality
N
RN = s 4w(r/N)(kN(r/N) - (2r - 1)/N) + N/3.
5.
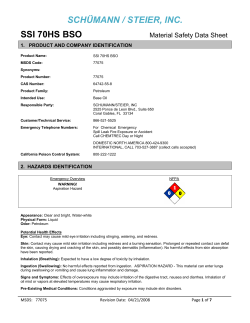
Table 1 contains the times to failure of 50 devices put on
life test at time 0. Now, R50 = 1.3, and according to
Anderson & Darling [2, p 203, table 1] - Pr{Rs0 > 1.3}
< 0.001. That is, the null hypothesis of exponentiality is
rejected at all levels of statistical significance greater than
0.17o. (Remember this is an asymptotic result.) Furthermore,
(figurethe
2) TTT plot indicates a bathtub-shaped hazard rate
TABLE 1
4. THE ASYMPTOTIC DISTRIBUTION OF RN.
Noato
D
convergence in distribution
{U(t); 0 < t < 1}
Brownian Bridge on (0, 1).
{ W(t); t > 0}
Wiener process.
EXAMPLE
Lifetimes of 50 devices
0.1
7
36
67
84
0.2
11
40
67
84
1
12
45
67
84
1
18
46
67
85
1
18
47
72
85
1
18
50
75
85
1
18
55
79
85
2
18
60
82
85
3
21
63
82
86
6
32
63
83
86
IEEE TRANSACTIONS ON RELIABILITY, VOL. R-36, NO. 1, 1987 APRIL
108
(1OFM
0
T. W. Anderson, D. A. Darling, "Asymptotic theory of certain
[2] goodness
of fit criteria based on stochastic processes", Ann. Math.
-
Statist., vol 23, 1952, pp 193-212.
[3] Barlow, Bartholomew, Bremner, Brunk, Statistical Inference Under
Order Restrictions, John Wiley & Sons, 1972, pp 235-272.
[4] R. E. Barlow, R. Campo, "Total time on test processes and applications to failure data analysis", Reliability and Fault Tree Analysis,
ed. Barlow, Fussell, Singpurwalla, SIAM, 1975, pp 451-481.
[5] R. E. Barlow, K. Doksum, "Isotonic tests for convex orderings",
Proc. 6th Berkeley Symp. Math. Statist. and Prob., 1972, pp
293-323.
0,9
0.8 0.7 -
0.6
0.5-
0.4 -
[6]
//
0.3-
0.2 0 l
0.0
0.1
02
____
0.3 0.4
/
-
1___
0.5
0.6
0.7
0.
0.9
1.0
t
Fig. 2. TTT plot based on the 50 observations in table 1.
ACKNOWLEDGMENT
I am pleased to thank N. L. Hjort and A. Hoyland for
their helpful advice and suggestions.
REFERENCES
R. E. Barlow, F. Proschan, Statistical Theory ofReliability and Life
Testing; Probability Models, Holt, Rinehart & Winston, 1981, p 55.
[7] B. Bergman, B. Klefsjo, "A graphical method applicable to agereplacement problems", IEEE Trans. Reliability, vol R-31, 1982
Dec, pp 478-481.
B. Bergman, B.
"The total time on test concept and its use
in reliability theory", Oper. Res., vol 32, pp 596-606.
[9] P. Billingsley, Convergence of Probability Measures, John Wiley &
Sons, 1968, p 72.
[10] J. Durbin, "Distribution theory of tests based on the sample
distribution function", Reg. Conf. Series in Appl. Math., 1973, p
32.
/l[8]
Klefsjo,
AUTHOR
Magne Vollan Aarset; Storebrand Ins. Co.; N-01 14 Oslo 1, NORWAY.
Magne V. Aarset was born in 1955. In 1982 he received a Cand. Real.
in Mathematical Statistics from the University of Oslo, Norway. He was
employed at the Institute of Mathematical Statistics at the University of
Trondheim-NTH, Norway 1980-1983. From 1983 he has been employed
by Storebrand Ins. Co. and primarily works with reliability analysis of industrial risks.
[1] M. V. Aarset, "The null distribution for a test of constant versus
bathtub failure rate", Scand. J. Statist., vol 12, no 1, 1985, pp
55-62.
Manuscript received 1985 September 26; revised 1986 July 26; revised
1986 November 17.
Workshop: R&M in Computer-Aided Engineering
Reflecting Reliability & Maintainability Considerations in Designs
Generated by Computer-Aided Engineering (CAE) Techniques
The IEEE Reliability Society, in cooperation with the IEEE Computer Society, is sponsoring a Workshop aimed at
assuring that R&M concerns are addressed when the capabilities of engineering workstations are being defined. The workshop will bring together R&M engineers and workstation designers to exchange information on the current capabilities of
CAE workstations and the additional capabilities needed to respond to R&M requirements.
Tentative plans and a contact for further information are
Date
Location
1987 Summer
Washington, DC area, USA
Period
Two full days
Further information:
Henry Hartt
VITRO Corporation
14000 Georgia Avenue
Silver Spring, Maryland 20906 USA
phone. 301-231-1431


© Copyright 2026