
Document 193110
Porter, ISBN 978-0-12-381984-0
Chapter 035 (edited file)—"Travel Mode Choice"
1/13/2011, Page 1 of 39, 6 Figure(s), 7 Table(s), 0 Box(es)
[RRH: Chapter 35 Travel Mode Choice]
[LRH: Part 6 Interdisciplinary Issues]
Chapter 35
Travel Mode Choice
Stephen G. Stradling
Edinburgh Napier University, Edinburgh, UK
Abstract
In addition to safety and public health concerns about the number of people killed or seriously
injured in road traffic collisions every year, the seemingly inexorable increase throughout the
world during approximately the past century of driving of fossil-fuel powered vehicles has
become an important environmental research concern. Driving impacts the environment through
greenhouse gas emission, pollution, and land take. When faced with a journey to make, how we
choose among travel modes and what attitude and behavior changes might prompt the choosing
of more sustainable travel modes are explored in this chapter.
Keywords
Climate change, die-hard drivers, environmental attitudes, journey experience, mode choice,
mode shift, mode substitution, transport psychology
1. INTRODUCTION AND SOME HISTORY
Whereas many previous chapters have examined in detail what people do when they drive cars,
this chapter shifts the focus to ―Why do we drive?‖ and how can transport psychology contribute
to encouraging a shift to more sustainable and less planetary damaging modes of transport? It
begins with some conceptual analysis and historical background to human patterns of moving
around; takes as given the need to reduce the impact of fossil fuel-powered transport on the
planetary niche we humans occupy and places the transport changes needed in a larger context of
changes in consumption patterns; summarizes studies on attitudes to travel change in the United
Porter, ISBN 978-0-12-381984-0
Chapter 035 (edited file)—"Travel Mode Choice"
1/13/2011, Page 2 of 39, 6 Figure(s), 7 Table(s), 0 Box(es)
Kingdom; considers the personal costs of such changes in terms of both energy expenditure and
lifestyle patterns; briefly examines the journey experience of three travel modes—car,
motorcycle, and urban bus—to identify what psychological needs different travel mode choices
offer to meet; examines segmentation among people’s attitudes toward car use and the
environment, finding a fourfold typology of die-hard drivers, car complacents, malcontented
motorists, and aspiring environmentalists; considers the feasibility of people substituting car trips
with more sustainable travel modes, distinguishing between those unable to change and those
unwilling to change; and concludes by summarizing current methods for attempting to affect the
necessary changes, some informed by psychological research and theory and some not, before it
is too late to bring about the adaptation and mitigation to natural, managed, and human systems
needed to avoid a warming world with its ―unprecedented combination of climate change,
associated disturbances (e.g., flooding, drought, wildfire, insects, ocean acidification), and other
global change drivers (e.g., land-use change, pollution, overexploitation of resources)‖
(Intergovernmental Panel on Climate Change, 2007, p. 11).
Why do we move around at all? Because we can, because we have to, because we like to is the
simplest formulation dividing out the different kinds of motive forces driving (sic) travel
behaviors and transport choices. All life-forms move, even if only to orient daily toward the sun
while remaining rooted in the earth. Animal life typically requires movement for sustenance,
shelter, and mate selection to enhance individual and species survival. One corollary of this
formulation is that if we want to change individual travel behavior, we need to vary the travel
opportunities, lifestyle obligations, and/or personal inclinations shaping an individual’s activity
space.
The relatively new field of transport psychology examines psychological factors influencing
travel and transport choices and behaviors. Research from this field suggests (at least) three
axioms likely to apply in the consideration of what facilitates or constrains people moving
around—their travel choices:
A1: Travel is an expressive activity; there are affective as well as instrumental components to
travel behavior and choices.
A2: Persons vary in their travel choices and in the perceptions, conceptions, and values that
inform those choices. This variation is both between types of persons (demographic groups and
attitude-based segments) and within individuals in situations with different travel agendas.
A3: People are simultaneously adaptable and resistant to change. They can and do cope with
changing circumstances or operating conditions (new car, car fitted with driver assistance and
vehicle control systems, congestion, fuel crises, and inclement weather); they value the comfort
Porter, ISBN 978-0-12-381984-0
Chapter 035 (edited file)—"Travel Mode Choice"
1/13/2011, Page 3 of 39, 6 Figure(s), 7 Table(s), 0 Box(es)
and convenience of habits and routines, having typically expended some search effort in
acquiring them.
Human beings are large-brained bipeds who, although rarely in possession of perfect
information, make fast, smart-enough choices based on heuristics that save computation time,
avoid frozen stasis, and thus enable action in and on the world. However, we are also, as the title
of Aronson’s standard textbook on social psychology notes, social animals, needing
opportunities for social participation and interpersonal interaction and also support networks to
alleviate the stress of dealing with the slings and arrows of daily hassles and the occasional, but
inevitable, larger misfortunes; we also like the sense of autonomy, feeling in control, when
presenting an identity in public places.
Garling (2005) characterized the core determinants of personal travel behavior as in Figure
35.1. The temporal ordering of travel choices in Garling’s model is as follows:
1. Activity choice
What shall I do?
2. Destination choice Where shall I do it?
3. Mode choice
How shall I get there?
4. Departure time choice
When shall I go?
Activity choice—―What do I need to do next?‖—is primary in this formulation. The emphasis
on ―I‖ here means that the choice of activities reflects—expresses (A1)—the complex biological
and social identities of persons. Travel demand is driven by what people need or want to do and
where they have to go to do it—their perceived travel obligations. The transport system shapes
how they might get there and how much time they should allow—their matrix of travel
opportunities. Some do and some do not enjoy themselves while doing it (A1 and A2; see also
the section on journey experience)—shaping their inclinations to travel by different modes.
Changes—to activity choice, destination choice, mode choice, departure time choice, or the
intelligence of the transport infrastructure—will be perceived as a challenge or an annoyance or
both (A2 and A3). (This analysis applies to personal travel choices. Freight transport, which also
burns much fossil fuel, requires a somewhat different, more instrumental account.)
In 1964, Russian archaeologists found the remains of a wooden ski preserved in the acid soil
of a Siberian peat bog that they dated to approximately 6000 BCE (Woods & Woods, 2000). A
4500-year-old rock carving in Norway shows a skier using a single pole for propulsion on skis
probably 3 m long. Skis may be the earliest example of technological innovation being used to
amplify the speed and distance of individualized land-based travel above our natural endowment
Porter, ISBN 978-0-12-381984-0
Chapter 035 (edited file)—"Travel Mode Choice"
1/13/2011, Page 4 of 39, 6 Figure(s), 7 Table(s), 0 Box(es)
of a long-distance walking speed of approximately 4 mph (6 kph) and short-distance running
speed of perhaps 15 mph (25 kph).
The potters of Mesopotamia, between the rivers, are thought to have invented the wheel—
―wooden discs spun in a horizontal position used to shape lumps of clay into vessels‖ (Woods &
Woods, 2000, p. 34)—at least 5000 years ago. There is evidence of the wheel being rotated from
horizontal to vertical and used on sledges to facilitate freight transport by the Sumerians and also
in India and China soon after 3500 BCE and in Egypt by 2500 BCE. By 1400 BCE, Egyptian
craftsmen were making ―strong, light wheels with separate rims, spokes, and hubs‖ (Woods &
Woods, p. 35) that were used on fast chariots by elite soldiers and wealthy civilians. Thus,
approximately 3500 years ago, technological innovation was driving specialization of form and
function, and access to fast wheeled vehicles was serving as a marker and amplifier of status
differentials.
Transport modes may be classified into three types: wholly self-propelled modes, such as
walking, running, and swimming; augmented modes that amplify bodily effort, such as rowing,
cycling, and skiing, or focus natural resources, such as sailing and paragliding; and fuelled
modes, whether hay-powered such as horse-drawn carriages and farm wagons or motorized
modes such as motorcycle, car, SUV, van, truck, bus, tram, ferry, train, and plane, which
currently deplete natural fossil fuel resources. Technological effort and expertise is currently
being directed at harvesting more of the earth’s natural resources such as biomass, hydrogen,
wind, and solar energy to source sufficient quantities of renewable fuel to continue powering
individual motorized modes in the future.
As successive transport innovations have been introduced—horses, mules, camels, trains,
electric trams, buses, subways, cars, and commercial aircraft, along with their associated
infrastructure—the effective radius of people’s activity patterns has grown with increases in the
speed of transport. However, there seems to be an average annual travel time budget per person
that is relatively constant and has remained so historically and spatially. The UK National Travel
Survey indicates that average travel time has held steady at between 350 and 380 h per person
per year, or approximately 1 h per day, during the past 30 years (Department for Transport
(DfT), 2006, Table 2.1). International compilations of travel time data show that this figure of
approximately 1 h applies across all cultures and states of development for which data may be
discerned (Metz, 2004). Indeed, Metz, following Marchetti (1994), argues that the origins of this
average travel time of 1 h per day may date from the earliest human settlements, where the mean
area of the territory of long-established villages was approximately 20 km2, corresponding to a
Porter, ISBN 978-0-12-381984-0
Chapter 035 (edited file)—"Travel Mode Choice"
1/13/2011, Page 5 of 39, 6 Figure(s), 7 Table(s), 0 Box(es)
radius of approximately 1.6 miles (2.5 km) or approximately 1 h’s walk from the periphery to the
center and back—from farmstead to market and home again—at 4 mph (6 kph).
2. IMPACT OF MOTORIZED TRANSPORT ON THE PLANET
Ponting (2007) asserts that after the agricultural revolution, which gradually but inexorably
facilitated population growth across the planet,
―the second great transition in human history involved the exploitation of the earth’s vast
(but limited) stocks of fossil fuels. It led to the creation of societies dependent on high
energy use. This was a fundamental change—until the nineteenth century every society
across the globe had very few sources of energy and the total amount of energy they could
generate was small. This transformation was at least as important as the development of
agriculture and the rise of settled societies. In its impact on the environment its effects were
far greater and took place over a shorter period of time. Until this transition all the forms of
energy used by human societies were renewable.… The last two centuries have been
characterized not just by the use of nonrenewable fossil fuels (coal, oil, and natural gas) but
by a vast increase in energy consumption. (p. 265)
Direct impacts of motorized transport on the planet include global warming through the
production of greenhouse gases from the burning of fossil fuel; vehicle emissions affecting local
pollution and health; vehicle noise; land take for roads, parking, and other infrastructure;
extraction of materials for manufacture; and waste from scrapped vehicles. To maintain the
habitability of the planet, transport choices need to be smarter choices. Transport psychology, an
applied science, involves understanding and influencing transport choices.
This chapter takes as given that it is true, if inconvenient (Gore, 2006, 2007), that
• the world is warming, and a further rise of 3 or 4°C could be catastrophic for continued
human habitability;
• warming is partly driven by an increase in greenhouse gas (GHG) emissions;
• GHGs are emitted by motorized transport powered by fossil fuels (in addition to the
particulate problem with otherwise more efficient diesel fuel and also the carbon cost of the
manufacture, distribution, and disposal of vehicles and supporting infrastructure, including
future electric vehicles); and
• GHG emissions need to be reduced to maintain the rather narrow habitable planetary niche
to which humans are adapted.
As we enter the era of peak oil, problems with energy security and scarcity generating
diplomatic incidents and oil wars, increased emissions fueling anthropogenic climate change,
Porter, ISBN 978-0-12-381984-0
Chapter 035 (edited file)—"Travel Mode Choice"
1/13/2011, Page 6 of 39, 6 Figure(s), 7 Table(s), 0 Box(es)
increased road congestion, and rapid growth in domestic and international aviation, there is an
urgent need to burn less carbon-based fuel as we go about our daily business (Industry Taskforce
on Peak Oil & Energy Security, 2008; Transform Scotland Trust, 2008).
Table 35.1 shows a ―wish list‖ compilation (Hounsham, 2005) of the behavior changes needed
to reduce anthropogenic GHG emission levels, indicating that changes to transport behavior form
just part of a large array of consumption behaviors needing remediation.
What are the avenues for changing human travel behavior, making it less fossil fuel
dependent? In 2007, the DfT noted that
The [UK] Government fully recognizes the need to tackle the problem of CO2 emissions,
and is taking action to:
encourage more environmentally friendly means of transport;
improve the fuel efficiency of vehicles;
reduce the fossil carbon content of transport fuel; and
increase the care that people take over fuel consumption while driving. (DfT, 2007b, p. 2)
Improving the fuel efficiency of vehicles and reducing the fossil carbon content of transport
fuel (Figure 35.2) are supply-side measures, whereas encouraging use of more sustainable forms
of transport and more fuel-conscious driving, for example, are demand-side measures. In 2010,
Paul Clark, UK Parliamentary Under Secretary of State for Transport, in a speech to the Brake
Best of the Best Fleet Safety Forum Conference in Birmingham, England, noted the following:
The Department’s strategy is firmly focused on reducing CO2.
Passenger cars generate over 58% of greenhouse gases from transport. Nearly 40% of CO2
emissions come from cars on commuting and business journeys. What’s more, these
journeys also have the highest proportion of single car occupancy.
If eco driving becomes part of the periodic training for the Heavy Goods Vehicle Drivers’
Certificate of Professional Competence, a preliminary assessment suggests that up to £300m
in fuel costs—and 600,000 tons of CO2—can be saved annually if 90% are trained and drive
in that manner. That is a telling statistic and we will be consulting shortly on how to achieve
such an uptake.
Where it is necessary to drive, then smarter driving techniques can help reduce emissions
and improve safety in all types of vehicles. This has been clearly demonstrated through
schemes like the Department’s Safe and Fuel Efficient Driving program SAFED.SAFED
Porter, ISBN 978-0-12-381984-0
Chapter 035 (edited file)—"Travel Mode Choice"
1/13/2011, Page 7 of 39, 6 Figure(s), 7 Table(s), 0 Box(es)
trains company van and lorry drivers to use their vehicles more fuel efficiently and more
safely. There are numerous case histories showing that companies can enjoy significant cost
savings by engaging with the scheme.
Unfortunately, as has been noted by several researchers (Midden, Kaiser, & McCalley, 2007;
Vlek & Steg, 2007), the adoption of cleaner cars may still lead to overall increases in
environmental burden through sheer growth in activity volumes as well as through rebound
effects that are the result of successful implementation of a more efficient technology, which
compensates for some of its environmental gains or even negates them entirely by stimulating
additional, unanticipated resource consumption and/or use of the technology.
Thus, supply-side measures such as improving the fuel efficiency of vehicles or reducing the
fossil carbon content of transport fuel may actually stimulate demand by increasing distances
traveled. Indeed, in the worst-case scenario, motorists, given more environmentally friendly cars
and fuel, may believe they can thus drive more frequently, farther, and faster (with self-talk
taking the form, ―If I drive a car that is better for the environment, I can drive it more
frequently/farther/faster without causing any more damage to the environment than I was before.
And if I drive just a little bit more often/farther/faster I’ll still be doing less damage than I was
before.‖). This is akin to the risk compensation or behavioral adaptation drivers show in
consuming car safety benefits as performance benefits (―With ABS and side air bags I will be
more protected from the consequences of driving less safely—and can thus drive less safely!‖)
(Organisation for Economic Co-operation and Development, 1990; Stradling & Anable, 2008).
In his foreword to Moser and Dilling’s (2007) Creating a Climate for Change:
Communicating Climate Change and Facilitating Social Change, Robert W. Kates (2007) writes
the following:
My colleagues Anthony Leiserowitz, Tom Parris, and I have recently argued that at least
four conditions are required for … accelerations in collective action. These include changes
in public values and attitudes, vivid focusing events, an existing structure of institutions and
organizations capable of encouraging and fostering action, and practical available solutions
to the problems requiring change.
This chapter next collates some evidence, from Scotland and the United Kingdom, on the
demand-side changes that are necessary and particularly on motorists’ readiness for reduction in
car use, focusing on the first of Kates’ conditions—changes in public values and attitudes.
Porter, ISBN 978-0-12-381984-0
Chapter 035 (edited file)—"Travel Mode Choice"
1/13/2011, Page 8 of 39, 6 Figure(s), 7 Table(s), 0 Box(es)
3. PUBLIC VALUES AND ATTITUDES ON CAR USE AND CLIMATE CHANGE
IN THE UNITED KINGDOM
A module of questions about public attitudes on climate change and the impact of transport were
included in the Office for National Statistics’ Omnibus Survey of August 2006 (DfT, 2007):
• 81% of UK adults said they were very or fairly concerned about climate change.
• 62% believed that ―Individuals should try to limit their car use for the sake of the
environment.‖
• 44% agreed that ―Air travel should be limited for the sake of the environment.‖
Respondents were asked, ―Which transport modes, if any, do you think are major contributors
to climate change?‖ Overall, 80% said cars, 78% vans and trucks, 75% airplanes, 62% buses and
coaches, 30% motorbikes, 25% ships and ferries, 24% trains, and 1% answered ―None of these.‖
The relative rank ordering of their responses from most to least polluting roughly accords with
the objective evidence, but perhaps most critically, hardly any (1%) thought that ―none of these‖
motorized transport modes were major contributors to climate change.
In terms of readiness to take personal remedial action, 78% of respondents agreed that they
would be prepared to change their behavior in some way to help limit climate change. Those
who were very or fairly concerned about climate change were more likely to say they would
change their behavior than those who were not very or not at all concerned.
The survey asked, ―In the next 12 months which, if any, of the following things are you likely
to do due to concerns about climate change?‖ Overall, 90% said recycle household rubbish; 71%
be careful about using energy at home (e.g., TVs on standby); 66% use energy-saving lightbulbs;
51% walk some of the short car journeys you currently make; 44% buy more energy-efficient
products; 40% cut out some nonessential car journeys; 32% use public transport for some current
short car journeys; 29% share car journeys with others to reduce total journeys made; 18% cycle
some of the short car journeys you currently make; 12% use other forms of transport instead of
flying; and 9% reduce the number of flights you make.
The report summarized this pattern as showing
• propensity for recycling behavior change amongst
90%
• propensity for household energy reduction amongst 89%
• propensity for car-related behavior change amongst 77%
• propensity for plane-related behavior change amongst 17%
Thus, in August 2006 when the survey was undertaken, just prior to the release in the United
Kingdom of An Inconvenient Truth (Gore, 2006) and concomitant substantial media coverage of
Porter, ISBN 978-0-12-381984-0
Chapter 035 (edited file)—"Travel Mode Choice"
1/13/2011, Page 9 of 39, 6 Figure(s), 7 Table(s), 0 Box(es)
the issue, already most (90 and 89%) of the UK public were persuaded of the need to modify
their recycling and household energy use behavior, many (77%) of the need for reduction in car
use, but few (17%) of the need for reduction in flying.
4. THE COSTS OF CHANGE
A transport economist might summarize these findings as showing a readiness for change
conditioned by the costs of changing. What would be the costs to the individual of changing? It
has been suggested (Stradling, 2003, 2005, 2007a, 2007b) that all travel choices involve the
interaction of three overarching factors: obligations (―What journeys do I have to make?‖),
opportunities (―How can I make those journeys?‖), and inclinations (―How would I like to make
those journeys?‖). Changes to travel patterns first require people to articulate these questions
about their current and planned travel—to show ―travel awareness‖—and second will involve
changes to patterns of life (obligations), provision of alternatives (opportunities), and current
preferences (inclinations).
Joseph (2008, p. 15) noted that ―economic appraisal still gives value and priority to small time
savings (even though surveys and businesses say they value reliability more)‖ in the evaluation
of proposed transport infrastructure projects. Transport psychology, when dealing with the costs
of change from the standpoint of individual behavior, might begin by pointing out that all
journeys involve a cost to the individual traveler in the expenditure of calories, concentration,
and concern (Stradling & Anable, 2008), and thus an ―energy cost,‖ as well as the expenditure of
time and money—the availability of all of which will ―condition,‖ in the economist’s sense, the
likelihood of making a journey and of making it in a particular manner.
Three types of ―personal energy costs‖ in trip making have been suggested (Stradling, 2002a,
2007a, 2007b):
1. Physical effort when traveling is used for maintaining body posture in walking, waiting, or
carrying. Comfortable seats will reduce the amount of such effort expended. Negotiating an
awkward interchange while burdened with infants and baggage will increase it. In Scotland, 11%
of adults report difficulty standing for 10 min and 12% difficulty walking for 10 min (Stradling
et al., 2005), constraining their travel mode preferences.
2. Cognitive effort is needed to collect and process information before and during a journey.
Route familiarity will reduce the amount of cognitive effort needed. Habitual journeys typically
impose a lower cognitive load, which is part of the reason why forming travel habits is attractive.
Porter, ISBN 978-0-12-381984-0
Chapter 035 (edited file)—"Travel Mode Choice"
1/13/2011, Page 10 of 39, 6 Figure(s), 7 Table(s), 0 Box(es)
If the journey needs constant monitoring of progress and the seeking out or interpretation of
information, this will tend to increase cognitive load. Both too much and too little cognitive
effort are unattractive, but a Goldilocks amount—just right—will tend to make the journey
interesting and engaging (Stradling, 2001).
3. Nervous energy is expended on worry about whether the journey will be successfully and
safely accomplished. Uncertainty about connection and arrival (―I don’t enjoy it. I’m in a rush
and worry [whether] the bus will be on time, to get [me] to work‖) or personal vulnerability (―I
wouldn’t like to be there after dark—the bus station has a reputation‖) will tend to increase the
amount of emotional spend on a journey (Stradling, 2002a).
This suggests that the reason why ―surveys … say they value reliability more‖ (Joseph, 2008) is
psychological: Service reliability enables travelers to meet their travel plans and obligations—
they can rely on it—whereas an unreliable transport service entails
• uncertainty and worry, and thus additional affective effort;
• making remedial plans, entailing additional mental effort; and
• undertaking remedial actions, requiring additional physical effort.
5. THE JOURNEY EXPERIENCE
5.1. Cars
The actual or anticipated journey experience associated with different travel modes will affect
travel mode choices. Although the disbenefits of car travel and threats to the quality of life from
car traffic are increasingly apparent (Adams, 2000; Engwicht, 1999; Garling, Garling, &
Loukopoulos, 2002; Garling & Steg, 2007; Goodwin, 2001; Litman, 1999; Newman &
Kenworthy, 1999; Royal Automobile Club (RAC), 1995; Semlyen, 2000; Sloman, 2003;
Stradling, 2002b, 2002c), car ownership continues to rise worldwide, despite a growing policy
focus on reducing car dependency and achieving a shift in travel mode choice.
Were the automobile an organism, we would deem it as having been remarkably successful in
carving out an environmental niche and in adapting the behavior of its host to its requirements.
In little more a century, cars have colonized the planet. Future historians may well characterize
the twentieth century as the century of the fossil-fueled car, during which approximately 1 billion
cars were manufactured (Urry, 1999), of which more than 500 million (Shove, 1998) are
currently occupying the streets, garages, car parks, and grass verges of the world.
Porter, ISBN 978-0-12-381984-0
Chapter 035 (edited file)—"Travel Mode Choice"
1/13/2011, Page 11 of 39, 6 Figure(s), 7 Table(s), 0 Box(es)
What is the hold that this most successful of technological developments has over the human
psyche, sufficient to induce ―car dependence‖ (Newman & Kenworthy, 1999; RAC, 1995)? In
the latter half of the past century, the car established itself as the dominant mode of travel in
developed countries, whether measured by distance, frequency, or duration of travel. Even so,
data for Great Britain, indicating that the car is used for approximately 60% of the average 1-h
daily travel time (Stradling, 2001), suggest that the average car is idle for more than 23 h out of
24 h, consuming parking space and inexorably depreciating in value but not actually moving.
However, although stationary for more than 95% of the day, the car while waiting in some
convenient location embodies the potential for travel and for access to distant destinations—―I
could just jump in the car and go, if I wanted to‖—and this potential for spontaneous travel is
one of the psychological attractions of the car (Stradling, 2002a; Stradling, Meadows, & Beatty,
1999, 2000).
A number of studies attest to the car as a symbolic object (Maxwell, 2001; Sachs, 1984) and to
the importance of affective motivation rather than instrumental motives such as availability and
directness in choosing a car over other transport modes (Abrahamse, Steg, Gifford, & Vlek,
2004; Bamberg & Schmidt, 2003; Ellaway, Macintyre, Hiscock, & Hearns, 2003; Exley &
Christie, 2002; Gatersleben, 2004; Gatersleben & Uzzell, 2003; Jensen, 1999; Mann & Abraham,
2006; Maxwell, 2001; Reid, Armitage, & Spencer, 2004; Steg, 2004; Steg & Gatersleben, 2000;
Steg, Geurs, & Ras, 2001a, 2001b; Steg & Tertoolen, 1999; Steg & Uneken, 2002; Steg, Vlek, &
Slotegraaf, 2001; Stradling, 2002, 2003; Stradling, Carreno, Rye, & Noble, 2007; Stradling,
Hine, & Wardman, 2000; Stradling, Meadows, & Beatty, 1998, 2001; Tertoolen, van Kreveld, &
Verstraten, 1998; Wall, Devine-Wright, & Mill, 2004; Wardman, Hine, & Stradling, 2001;
Wright & Egan, 2000) and in influencing driving style (Lajunen, Parker, & Stradling, 1998;
Stradling, 2003).
In the United Kingdom, the future travel behavior intentions of young people between the ages
of 11 and 18 years are dominated by the desire to drive and/or own a car (Derek Halden
Consultancy, 2003; Line, Chatterjee, & Lyons, 2010; Storey & Brannen, 2000), with predrivers
aspiring to the perceived benefits of car driving: ―Like you’re in control of loads of speed aren’t
you?‖ (boy, aged 14 years; Step Beyond, 2006).
A core component apparent from studies of the attractions of the car is the sense of
autonomy—feeling in control. Many car drivers appreciate the autonomy that the automobile
conveys: ―I just like driving … I only go places when I can drive‖; ―One of the reasons I like
driving is because I’m in control‖ (Stradling, 2007a); ―What do you enjoy most about driving?‖
Porter, ISBN 978-0-12-381984-0
Chapter 035 (edited file)—"Travel Mode Choice"
1/13/2011, Page 12 of 39, 6 Figure(s), 7 Table(s), 0 Box(es)
―I suppose it would just have to be the independence, the feeling of freedom it gives and just the
actual feeling of driving yourself, the speed, the cornering.… I just like the feeling of being able
to control a vehicle in a competent manner‖ (Stradling et al., 1998). Many, although not all, users
of public transport lament the lack of autonomy: ―The problem I have with public transport is
that I don’t feel in control‖; ―You don’t feel in control at all on public transport and you’re
worried about connections all the time so you’re having to be aware of what the time is every
moment‖; ―Last year I came in by public transport for about 2 weeks. It was hell. Freezing to
death on platforms waiting for trains that were late. You’re not in control of your life—that’s the
only way I can describe it, you’re just not in control‖ (Stradling et al., 1998).
Young drivers aged 17–24 years score highest on a scale measuring the sense of identity
gained from becoming a driver, a part of the expressive component of driving (A1; Stradling,
2007a), endorsing items such as the following:
Driving a car …
• is a way of projecting a particular image of myself.
• gives me a feeling of pride in myself.
• gives me the chance to express myself by driving the way I want to.
• gives me a feeling of power.
• gives me the feeling of being in control.
• gives me a feeling of self confidence.
• gives me a sense of personal safety. (Stradling, Hine, et al., 2000)
The automobile promises both autonomy and mobility, and the mobility conferred by the car
brings access privileges. In Scotland, 97% of those in the top household income quintile have
access to a car for private use compared to 32% of those in the bottom quintile (Stradling et al.,
2005). Those from households with access to a car travel more often, farther, and for longer
durations, thereby increasing the number and variety of destinations to which they have access.
Ratings of convenience of access from home to local life-support services such as money (bank
or building society), food (supermarkets and local shops), and health (general practice clinic and
hospital outpatient department) are higher for those with a car; they enjoy more frequent social
interactions with their support network of relatives and friends and are thus less likely to suffer
social isolation; more visit sports and cultural facilities; they report better health status, and
fewer of them have disabilities causing difficulties with traveling; they rate themselves higher on
indices of civic participation; more of them live in nicer neighborhoods; and fewer of them had
used the local bus service in the past month (Stradling et al., 2005).
Porter, ISBN 978-0-12-381984-0
Chapter 035 (edited file)—"Travel Mode Choice"
1/13/2011, Page 13 of 39, 6 Figure(s), 7 Table(s), 0 Box(es)
These are just some of the benefits—instrumental, symbolic, and affective (Steg, Vlek, et al.,
2001)—that would be diminished were car use constrained, and they will likely form a central
part of drivers’ calculation of the costs of change.
Of course, such benefit does not come without cost. In an era of highly reliable cars, we grind
toward gridlock as we suffer increasingly from congestion, resulting in unreliable journey times,
and as Featherstone (2004) notes,
Automobility makes possible the division of the home from the workplace, of business and
industrial districts from homes, of retail outlets from city centers. It encourages and
demands an intense flexibility as people seek to juggle and schedule their daily set of work,
family, and leisure journeys … on the calculation of the vagaries of traffic flows. (p. 2)
Also, the task load a driver endures on a car journey in search of the psychological
satisfactions is high. Driving is a skill-based, rule-governed, expressive activity requiring realtime negotiation with co-present transient others with whom the driver is currently sharing the
public highway and seeking safe and timely arrival while avoiding intersecting trajectories.
There are task demands at the strategic, tactical, and control level. Speed is varied to manipulate
perceived task difficulty (Fuller, 2005). Panou, Bekiaris, and Papakostopoulos (2005)
characterized eight operational levels to the driving task, and Table 35.2 adds two more. Driving
is an attractive travel mode choice despite consuming calories, requiring concentration, causing
concern (Stradling & Anable, 2008), and making many demands on the driver.
5.2. Motorcycles
There are a number of important differences between driving a car and riding a powered twowheeler, including the sources of psychological satisfaction and hence the journey experience
(Broughton, 2006, 2007, 2008; Broughton & Walker, 2009; Broughton et al., 2009; Mannering
& Grodsky, 1995). Broughton (2007) showed motorcyclists photographs of various road scenes
and asked them to rate on 5-point scales how risky and how enjoyable riding would be in each.
He identified three types of bikers, shown in Figure 35.3. For a small group, approximately 8%
rated enjoyment increased as rated risk increased and enjoyment peaked at high risk levels. They
were labeled ―risk seekers.‖ Their motivations for riding and while riding were different from
those of the other two, equal-sized groups—risk acceptors (48%; for whom rated enjoyment
peaked at middling levels of rated risk) and risk aversive (48%; for whom enjoyment peaked at
Porter, ISBN 978-0-12-381984-0
Chapter 035 (edited file)—"Travel Mode Choice"
1/13/2011, Page 14 of 39, 6 Figure(s), 7 Table(s), 0 Box(es)
low risk)—both of which, although to differing degrees, ride despite the risks rather than because
of them.
Factor analysis of ratings of features of the photos (Broughton, 2005; Broughton & Stradling,
2005) showed two sources of enjoyment for bikers in general: speed in a straight line and the
mastery challenge of taking the right line through bends (some preferred one, some the other,
and some liked both). Riders readily attest to both speed and bends ―feeling good‖ and to
enjoyment of the ride being a prime motivation for biking, suggesting a high expressive
component (A1) in riding.
5.3. Urban Buses
One barrier to increased bus patronage has been held to be the image of bus services as ―a
transport mode that has become associated with young people … elderly people … and people
on low incomes … i.e., a mode of last resort‖ (Bus Partnership Forum, 2003, p. 9). However, a
study in Edinburgh, Scotland (Stradling et al., 2007), found image to be the factor of least
concern to urban bus users: In descending order of endorsement, the factors that generated
dislike or discouragement of bus use were as follows:
• Feeling unsafe (e.g., ―Drunk people put me off traveling by bus at night‖)
• Preference for walking or cycling (e.g., ―I prefer to walk‖)
• Problems with service provision (e.g., ―No direct route‖)
• Intrusive arousal (e.g., ―The buses are too crowded,‖ ―The seats are too cramped,‖ ―People
using mobile phones,‖ and ―The drivers often brake too harshly‖)
• Cost (e.g., ―The fares are too expensive‖)
• Preference for car use (e.g., ―I feel more in control when I drive‖)
• Disability and discomfort (e.g., ―There are not enough hand rails inside the bus‖)
• Self-image (e.g., ―Traveling by bus does not create the right impression‖)
These factors all show social and affective concerns with the quality of the urban bus travel
experience as well as more instrumental reasons for service dissatisfaction. Drunks and groups of
youths on the bus were perceived as threatening, and the effect was amplified during the hours of
darkness. The uncertainty of waiting for the bus, especially at night, was also a source of anxiety
to some bus users. Such factors may, in the limiting case, induce avoidance behavior: ―I refuse to
travel to Leith or West Edinburgh by bus at night. I don’t feel safe and other passengers can be
very intimidating‖ (female, age 28 years); ―I would like to travel to and from Leith in the
Porter, ISBN 978-0-12-381984-0
Chapter 035 (edited file)—"Travel Mode Choice"
1/13/2011, Page 15 of 39, 6 Figure(s), 7 Table(s), 0 Box(es)
evening, but I don’t because the direct buses are infrequent and I am fearful of the bus stops and
of drunks‖ (female, age 56 years).
One respondent in the study by Stradling et al. (2007) indeed disliked the core premise of
public transport: ―What do you like and dislike about traveling by bus in Edinburgh?‖ ―General
dislike of public transport as have to travel with general public‖ (female, age 26 years).
However, a number of comments revealed that public transport was, for some, an opportunity to
engage in positive interpersonal interactions with fellow passengers—social exchange—whether
with friends, acquaintances, or co-present strangers: ―I enjoy traveling by bus in Edinburgh,
because you can see what is going on and sometimes you can get into conversation with other
passengers‖ (female, age 58 years). Engwicht (1993, 1999), in characterizing cities as inventions
to maximize exchange opportunities and minimize travel, regarded ―streets as a dual space for
both movement and exchange‖ (Engwicht, 1999, p. 19) with ―plenty of opportunities for
spontaneous exchanges on the walk to the public transport stop, and while riding with others‖ (p.
19). However, for the bus, as with other forms of public transportation, there is permanent
tension between the exchange and movement roles. On a bus, the rules of social exchange
including the etiquettes of co-presence apply when ―having to travel with the general public‖ and
endure enforced proximity while respecting private space, whereas for the bus as occupier of a
movement space, destination choice is constrained by routes, service frequency and journey
duration are fixed by timetabling, and fare collection and verification of travel entitlement
govern place and pace of entry.
Russell (1980, 2003) characterized affective states in a typology involving two orthogonal
dimensions—pleasant/unpleasant and activated/deactivated—giving four emotion quadrants. In
describing what they liked about bus travel in Edinburgh, a number of respondents indicated a
state of mind that is in contradistinction to the annoyances and intrusions of ―unwanted arousal‖
and may be the reverie that unwanted distractions intrude on. This state of mind appears to
involve being transported while switched off. It is smooth, tranquil, undisturbed, relaxed,
absorbed, engaged with the moment yet ―elsewhere,‖ and is pleasurable without being ecstatic. It
exemplifies the passive nature of being a passenger.
Figure 35.4 uses Russell’s scheme to suggest possible transitions between pleasant and
unpleasant states (arrows)—between greater and lesser amounts of journey pleasure and thus,
potentially, between greater and lesser amounts of customer satisfaction and repeat patronage.
The ideal urban bus journey experience is pleasant/deactivated, and bus rides that bring about
unpleasant/activated journey experiences are to be avoided.
Porter, ISBN 978-0-12-381984-0
Chapter 035 (edited file)—"Travel Mode Choice"
1/13/2011, Page 16 of 39, 6 Figure(s), 7 Table(s), 0 Box(es)
6. ATTITUDES TOWARD CAR USE AND THE ENVIRONMENT
Current attitudes toward car use in the United Kingdom may be characterized as ambivalent.
Table 35.3 shows results from a number of surveys that demonstrate this ambivalence in
simultaneously espoused attitudes (Dudleston, Hewitt, Stradling, & Anable, 2005; Stradling,
2006; Stradling, Hine, et al., 2000).
Table 35.4, using data from the British Social Attitudes survey collected during the summer of
2006 (Stradling, Anable, Anderson, & Cronberg, 2008), shows both consensus and
differentiation. A substantial majority of both the general adult population (―all adults‖) and
motorists in Britain (―drivers‖) are convinced and concerned about the influence of transport on
climate change. Indeed, two-thirds agree, with only 1 in 10 disagreeing, that ―for the sake of the
environment, everyone should reduce how much they use their cars.‖ Similar numbers agree that
individual efforts should be made and will contribute. However, approximately one-fourth of
both drivers and adults in the United Kingdom still espoused the position that ―people should be
allowed to use their cars as much as they like, even if it causes damage to the environment.‖
More high-mileage drivers, likely to be particularly affected by constraints on car use, support
unlimited car use, with 35%of high-mileage drivers (>10,000 miles/16,000 km a year) agreeing
with the statement compared to 15% of low-mileage drivers (<5000 miles/8000 km a year). Even
so, that means there are many, indeed a majority (62%; 3% responded ―don’t know‖), of highmileage drivers who do not think that people (such as themselves) should be allowed to use their
cars as much as they like, despite the ensuing inconvenience.
From a series of questions on attitudes toward car use and the environment, drawing on work
by Anable (2005), cluster analysis derived four discernibly different groups of motorists
(Dudleston et al., 2005; Stradling, 2007a): die-hard drivers, car complacents, malcontented
motorists, and aspiring environmentalists. The segments differ in the extent to which they exhibit
attachment to the car, are willing to consider alternative modes, are already multimodal, feel
willing and able to reduce their car use, are aware of transport issues, acknowledge the transport
contribution to environmental problems, and say they are prepared to bear additional cost for
continuing car use:
Porter, ISBN 978-0-12-381984-0
Chapter 035 (edited file)—"Travel Mode Choice"
1/13/2011, Page 17 of 39, 6 Figure(s), 7 Table(s), 0 Box(es)
Die-hard drivers (DHD) (~24% of UK drivers) like driving and would use the bus only if they
had to do so. Few believe that higher motoring taxes should be introduced for the sake of the
environment, and many support more road building to reduce congestion.
Car complacents (CC) (29% of drivers) are less attached to their cars but currently see no reason
to change. They generally do not consider using transport modes other than the car, and faced
with a journey to make, they will commonly reach for the car keys.
Malcontented motorists (MM) (23% of drivers) find that current conditions on the road, such as
congestion and the behavior of other drivers, make driving stressful. They would like to reduce
their car use but cannot see how. They say that being able to reduce their car use would make
them feel good, but they believe there are no practical alternatives for the journeys they have to
make. In Scotland, more members of this group live in accessible rural areas.
Aspiring environmentalists (AE) (23% of drivers) are actively trying to reduce their car use,
already use many other modes, and are driven by an awareness of environmental issues and a
sense of responsibility for their contribution to planetary degradation (Anable, 2005; Dudleston
et al., 2005; Stradling, 2007).
Table 35.5 shows examples of differences between the four car driver groups.
Most motorists, especially DHDs and even AEs who are keen to cut car use, like traveling in
cars: Cars are comfortable, convenient, convey autonomy and mobility, and promise the benefits
of speed, which is why cutting car use is a challenge. However, many drivers, except the DHDs
and CCs, find that car use can be stressful and is thus, potentially, to be avoided. Most of the
CCs—and more than in the other segments—do not consider other mode options but simply get
in the car. Although equivalent proportions of MMs and AEs are trying to use the car less, hardly
any of the MMs think it will be easy, unlike the AEs. MMs see themselves as willing but unable;
they have the inclination to cut car use but lack the opportunity.
More of the DHDs and CCs would like more roads built to ease congestion; many more DHDs
support unrestricted car use and the ―right to automobility‖ and also think global warming threats
are exaggerated. On the other hand, more AEs think car users should pay higher taxes, and more
say they are prepared to pay them if the revenue is directed to public transport improvements.
Cluster analysis also identified three types of nondrivers from the third of Scottish households
that do not have access to a car:
Car skeptics (8% of adults) are travel aware, environmentally aware, managing without a car,
and more likely to use bicycles and to support constraints on unfettered car use.
Porter, ISBN 978-0-12-381984-0
Chapter 035 (edited file)—"Travel Mode Choice"
1/13/2011, Page 18 of 39, 6 Figure(s), 7 Table(s), 0 Box(es)
Reluctant riders (7% of adults) tend to be older and less well off, involuntarily dependent on
public transport, and where possible travel as passengers in other people’s cars.
Car aspirers (7% of adults), more of whom are unemployed, from lower social classes, and
environmentally unaware, need better access to destinations than their current high bus use
provides and for this and other reasons aspire to car ownership.
7. SUBSTITUTING MORE SUSTAINABLE MODES FOR CAR USE
Do motorists make all their journeys by car? In asking them to cut their car use and substitute
more sustainable modes, are they being called upon to venture into the unknown? Studies in
Scotland (Stradling, 2005, 2007a) show that although most drivers drive frequently, with 96%
reporting using the car ―once or twice a week‖ or more often, almost half (46%) report traveling
as a passenger in a car with the same frequency, and 9% take a taxi that often. More than half
(56%) have used bus and train, 1 in 6 say they cycle once a month or more often, and 8 of 10 say
they walk for at least 10 min once a week or more often. Indeed, only 1.1% of Scottish drivers
use only one mode and thus do all their traveling by car. Six in 10 report use of—and thus
familiarity with—five or more modes.
In three studies of travel awareness (Dudleston et al., 2005; NFO World Group & Napier
University Transport Research Institute, 2001, 2003), Scottish drivers were asked how often they
undertook various lifestyle maintenance activities and, for those they undertook, how often they
used various travel modes, including car, to access these activities. Those who undertook each
activity by car were then asked whether it would be practical for them to use each of four more
sustainable modes (walk, cycle, bus, and train) for that activity. Table 35.6 shows, for a set of
trip types currently undertaken by car, the percentage of drivers who say they could undertake
such trips by each of four other modes (rows may total more than 100% because some
respondents indicated it would be practical for them to use more than one alternative mode). The
activities are arranged in ascending order by the percentage saying that ―none of these‖ would be
a practical alternative for them, thereby indicating the substitutability of trip types from most
(child escort to school: only one-fourth of parents would not be able to do it otherwise) to least
(supermarket shopping: slightly more than half say they could not do it other than by car, which
leaves 43% who could).
Farrington, Gray, Martin, and Roberts (1998, p. 3) deemed as structurally dependent on the car
―those who are dependent … because there are no viable alternatives‖ and as consciously
Porter, ISBN 978-0-12-381984-0
Chapter 035 (edited file)—"Travel Mode Choice"
1/13/2011, Page 19 of 39, 6 Figure(s), 7 Table(s), 0 Box(es)
dependent on the car ―those who rely on their vehicle but could realistically undertake their
journeys by alternative modes.‖ The former are unable to switch modes, whereas the latter are
unwilling.
Overall, only 11% of car drivers in Scotland indicated that they could not practically use a
bus, train, walk, or cycle for any of their journeys and are thus structurally car dependent. They
see themselves as having no opportunity to do otherwise. Seven percent were consciously car
dependent: They could realistically undertake all the current car trip types about which they were
questioned by more sustainable modes, but they had no inclination to do so. These two figures
establish the ends of the potential modal shift distribution—those who cannot and those who will
not cut car use. The segmentation analysis on driver types detailed previously provides additional
differentiation of the terrain.
8. DEMAND-SIDE BEHAVIOR CHANGE
Transport researchers in the United Kingdom (Cairns, Davies, Newson, & Swiderska, 2002;
Cairns et al., 2004; Government Operational Research Service, 2005; Rye, 2002; Steer Davies
Gleave, 2003) have attempted to estimate the effects of mobility management measures on future
car use. Mobility management measures are techniques that seek to persuade and assist people in
changing travel habits and patterns. Cairns et al. (2004) concluded that if such demand-side
measures were given greater policy priority in the United Kingdom, they have the potential to
achieve a reduction in peak urban traffic of approximately 21% (off peak, 13%) and a UK
nationwide reduction of all traffic of approximately 11%. They suggested that workplace travel
plans could achieve between a 10 and 30% reduction in solo car use, school travel plans between
8 and 15%, and personalized travel planning initiatives between 7 and 15%. On the other hand,
in a meta-analysis, Möser and Bamberg (2008) suggest rather lower effects because, in practice,
transport evaluations typically employ one or more of the following:
• A one-group pre-post test design
• Weak analytical techniques to synthesize the data obtained (e.g., narrative-style analysis)
• Sample sizes too small to allow statistical effects to be established—unrepresentative
samples
• A tendency to report only ―good practice‖ case studies
Researchers in the neighboring domain of health psychology have collated a number of tested
techniques for changing the behavior of individuals (Abraham & Michie, 2008). Such
Porter, ISBN 978-0-12-381984-0
Chapter 035 (edited file)—"Travel Mode Choice"
1/13/2011, Page 20 of 39, 6 Figure(s), 7 Table(s), 0 Box(es)
techniques, which typically go beyond reasoned argument in attempting to inculcate demandside behavior change, might successfully transfer to transport psychology interventions—an
empirical matter germane for investigation. Table 35.7 provides a brief description of 26
techniques of demonstrated effectiveness.
Abraham and Michie (2008) also give the theoretical provenance of each technique. To date,
however, there is no consensus among researchers in transport psychology regarding the best
theoretical framework to explain or inform change in travel mode choice (Anable, Lane, &
Kelay, 2006; Darnton, 2008). Accounts have been proposed using the norm activation model
(Hunecke, Blobaum, Matthies, & Hoger, 2001), theory of planned behavior (Bamberg, Ajzen, &
Schmidt, 2003; Heath & Gifford, 2002), grounded theory (Gardner & Abraham, 2007), the
model of action phases (Bamberg, 2007), and the transtheoretical model (Gatersleben &
Appleton (2007).
The MaxSem model (Carreno, Bamberg, & Rye, 2009), shown in Figure 35.5, attempts to
combine a stage approach with social psychology constructs of the kind listed in Table 35.7,
such as goal intention (technique 4), behavioral intention (technique 10), and implementation
intention (technique 16) (Bamberg, 2000). Each construct is hypothesized to be at its most
applicable at a particular stage in the change process and, indeed, its application at other points
may be otiose or worse. Thus, the model seeks to identify which vectors will press the person
toward forming a goal intention at the precontemplation stage; toward forming a behavioral
intention at the contemplation stage; toward agreeing to an implementation intention at the
preparation/testing stage; and preventing relapse (Table 35.7, technique 23) during the
establishment of a new, more sustainable, travel habit at the maintenance stage.
9. CONCLUSIONS
This chapter discussed in some depth travel mode choices. Travel mode choices vary with person
characteristics such as age, gender, and disability; with household characteristics such as income,
location, and transport availability; with journey purpose; and with attitude/value clusters. They
also vary with environment characteristics, such as land use; the location of trip origins, such as
homes; and trip destinations, such as jobs, shops, and recreations. Travel links the places where
Porter, ISBN 978-0-12-381984-0
Chapter 035 (edited file)—"Travel Mode Choice"
1/13/2011, Page 21 of 39, 6 Figure(s), 7 Table(s), 0 Box(es)
people go to lead their lives and meet their obligations (Stradling, 2002a, 2002b; Stradling,
Meadows, et al., 2000).
The UK data show high levels of public concern; reasonably accurate knowledge of which
transport modes are most to blame; evidence, following the pioneering work of Linda Steg and
colleagues (Steg, 2004; Steg & Gatersleben, 2000; Steg, Geurs, et al., 2001a, 2001b; Steg &
Tertoolen, 1999; Steg & Uneken, 2002; Steg, Vlek, et al., 2001), of the importance of affect in
travel mode choice; different psychological satisfactions (as well as different risks) associated
with different motorized modes; and differentiation among different segments of the population
defined by their attitudes toward car use and the environment.
Although there are barriers to change, with car-dependent places, car-dependent trips, and cardependent people requiring different, detailed remediations from ―hard‖ engineering and
infrastructure measures (e.g., building more dedicated cycle lanes to enhance the opportunities
for cycling) to ―soft‖ psychological measures (e.g., segmenting citizens by their inclination for
change and designing targeted persuasions), there are prospects for demand-side reduction in car
use in the United Kingdom. There seems to be a readiness for change.
Evidence from elsewhere is less heartening. Although many of the world’s population have
long held the inclination to meet their travel obligations by car but have been unable to afford to
do so, increasing affluence in developing countries means that many more now have the
opportunity to own and drive automobiles. The ACNielsen Car Aspiration Index for 2004
(ACNielsen, 2005) showed large countries (e.g., China, India, and the Philippines) with currently
low levels of motorization but high levels of aspiration toward car ownership. Impact equals
population multiplied by consumption (Figure 35.6). The global impact of GHG emissions from
fossil fuel-powered motorized vehicles is the product of the number of such vehicles
(population) multiplied by the average GHG emission rate (consumption). Although supply-side
changes such as increased engine and fuel efficiency are reducing the unit rate of consumption of
fossil fuels and emission of GHGs, these are undermined by rebound effects that offset carbon
gains, and the size of the worldwide fossil-fueled vehicle fleet is increasing inexorably. This is
why the challenge to transport psychology to help the world burn less fossil fuel, and soon, is a
demanding one.
References
Porter, ISBN 978-0-12-381984-0
Chapter 035 (edited file)—"Travel Mode Choice"
1/13/2011, Page 22 of 39, 6 Figure(s), 7 Table(s), 0 Box(es)
Abraham, C., & Michie, S. (2008). A taxonomy of behavior change techniques used in
interventions. Health Psychology, 27(3), 379–387.
Abrahamse, W., Steg, L., Gifford, R., & Vlek, C. (2004). Psychological factors influencing car
use for commuting. Paper presented at the third International Conference on Traffic &
Transport Psychology, Nottingham, UK.
ACNielsen. (2005). http://www2.acnielsen.com/pubs/2005_q1_ap_cars.html Accessed 08.08.08.
Adams, J. (2000, March). Hypermobility. Prospect, 27–31.
Anable, J. (2005). Complacent car addicts or aspiring environmentalists? Identifying travel
behaviour segments using attitude theory. Transport Policy, 12(1), 65–78.
Anable, J., Lane, B., & Kelay, T. (2006). An evidence base review of public attitudes to climate
change and transport. London: HMSO.
Bamberg, S. (2000). The promotion of new behaviour by forming an implementation intention:
Results of a field experiment in the domain of travel mode choice. Journal of Applied Social
Psychology, 30(9), 1903–1922.
Bamberg, S. (2007). Is a stage model a useful approach to explain car drivers’ willingness to use
public transportation? Journal of Applied Social Psychology, 37(8), 1757–1783.
Bamberg, S., Ajzen, I., & Schmidt, P. (2003). Choice of travel mode in the theory of planned
behaviour: The roles of past behaviour, habit and reasoned action. Basic and Applied Social
Psychology, 25(3), 175–187.
Bamberg, S., & Schmidt, P. (2003). Incentives, morality or habit? Predicting students’ car use
for university routes with the models of Ajzen, Schwartz and Triandis. Environment and
Behavior, 35(2), 264–285.
Broughton, P. S. (2005). Designing PTW training to match rider goals. Paper presented at the
second International Conference on Driver Behaviour and Training. Edinburgh, November
15–17, 2005.
Broughton, P. S. (2006). The implication of the flow state for PTW training. In Behavioural
Research in Road Safety: Sixteenth seminar (pp. 158–168). London: Department for
Transport.
Broughton, P. S. (2007). Risk and enjoyment in powered two wheeler use (PhD thesis).
Edinburgh, UK: Transport Research Institute, Napier University.
Broughton, P. S. (2008). Flow, task capability and powered-two-wheeler (PTW) rider training. In
L. Dorn (Ed.), Driver behaviour and training (Vol. 3, pp. 415–424). Aldershot, UK: Ashgate.
Broughton, P. S., Fuller, R., Stradling, S., Gormley, M., Kinnear, N., O’Dolan, C., & Hannigan,
B. (2009). Conditions for speeding behaviour: A comparison of car drivers and powered two
wheeled riders. Transportation Research Part F: Traffic Psychology and Behaviour, 12, 417–
427.
Broughton, P. S., & Walker, L. (2009). Motorcycling and leisure: Understanding the
recreational PTW rider. Aldershot, UK: Ashgate.
Porter, ISBN 978-0-12-381984-0
Chapter 035 (edited file)—"Travel Mode Choice"
1/13/2011, Page 23 of 39, 6 Figure(s), 7 Table(s), 0 Box(es)
Bus Partnership Forum. (2003). Understanding customer needs. London: Author.
Cairns, S., Davies, A., Newson, C., & Swiderska, C. (2002). Making travel plans work. London:
Department for Transport, Local Government and the Regions.
Cairns, S., Sloman, L., Newson, C., Anable. J., Kirkbridge, A., & Goodwin, P. (2004). Smarter
choices—Changing the way we travel. Final report of the research project: The influence of
soft factor interventions on travel demand. London: Department of Transport.
Carreno, M., Bamberg, S., & Rye, T. (2009). MAXimising success: A new approach to the
evaluation of mobility management projects. Paper presented at the European Transport
Conference, October 5–7, Leeuwenhorst, The Netherlands.
Darnton, A. (2008). Practical guide: An overview of behavioural change models and their uses.
London: HMT.
Department for Transport. (2006). Transport statistics Great Britain 2005. London: TSO.
Department for Transport. (2007). Attitudes to climate change and the impact of transport.
London: Author.
Derek Halden Consultancy. (2003). Children’s attitudes to sustainable transport. Edinburgh,
UK: Scottish Executive Social Research.
Dudleston, A., Hewitt, E., Stradling, S., & Anable, J. (2005). Public perceptions of travel
awareness—Phase three. Edinburgh, UK: Scottish Executive Research Unit.
Ellaway, A., Macintyre, S., Hiscock, R., & Hearns, A. (2003). In the driving seat: Psychosocial
benefits from private motor vehicle transport compared to public transport. Transportation
Research Part F: Traffic Psychology and Behaviour, 6, 217–231.
Engwicht, D. (1993). Reclaiming our cities and towns (towards an eco-city). Philadelphia: New
Society.
Engwicht, D. (1999). Street reclaiming. Creating livable streets and vibrant communities.
Annandale: Pluto Press Australia.
Exley, S., & Christie, I. (2002). Off the buses? In A. Park, J. Curtice, K. Thomson, L. Jarvis, &
C. Bromley (Eds.), British social attitudes: The 19th report. London: Sage.
Farrington, J., Gray, D., Martin, S., & Roberts, D. (1998). Car dependence in rural Scotland
(Development Department Research Programme Research Findings No. 53). Edinburgh, UK:
The Scottish Office.
Featherstone, M. (2004). Automobilities. An introduction. Theory, Culture and Society, 21(4/5),
1–24.
Fuller, R. (2005). Towards a general theory of driver behaviour. Accident Analysis and
Prevention, 37, 461–472.
Gardner, B., & Abraham, A. (2007). What drives car use? A grounded theory analysis of
commuters’ reasons for driving. Transportation Research Part F: Traffic Psychology and
Behaviour, 10, 187–200.
Porter, ISBN 978-0-12-381984-0
Chapter 035 (edited file)—"Travel Mode Choice"
1/13/2011, Page 24 of 39, 6 Figure(s), 7 Table(s), 0 Box(es)
Garling, T. (2005). Changes of private car use in response to travel demand management. In G.
Underwood (Ed.), Traffic and transport psychology. Theory and application. Proceedings of
the ICTTP 2004. Oxford: Elsevier.
Garling, T., Garling, A., & Loukopoulos, P. (2002). Forecasting psychological consequences of
car use reduction: A challenge to an environmental psychology of transportation. Applied
Psychology: An International Review, 51, 90–106.
Garling, T., & Steg, L. (Eds.). (2007). Threats from car traffic to the quality of urban life:
Problems, causes and solutions. Oxford: Elsevier.
Gatersleben, B. (2004). Affective, social and instrumental aspects of the commute to work:
Comparing perceptions of drivers, public transport users, walkers and cyclists. Paper
presented at the third International Conference on Traffic & Transport Psychology,
Nottingham, UK.
Gatersleben, B., & Appleton, K. (2007). Contemplating cycling to work; Attitudes and
perceptions in different stages of change. Transportation Research Part A: Policy and
Practice, 41, 302–312.
Gatersleben, B., & Uzzell, D. (2003). Local transport problems and possible solutions:
Comparing perceptions of residents, elected members, officers and organisations. Local
Environment, 8(4), 387–405.
Goodwin, P. B. (2001). Traffic reduction. In K. Button & D. Hensher (Eds.), Handbook of
transport systems and traffic control. Oxford: Elsevier.
Gore, A., Jr. (2006). An inconvenient truth: The planetary emergency of global warming and
what we can do about it. London: Bloomsbury.
Gore, A., Jr. (2007). An inconvenient truth: The crisis of global warming. London: Bloomsbury.
Government Operational Research Service. (2005). Travelling to school initiative. Annexes to the
report on the finding of the initial evaluation. London: Operational Research Unit for
Sustainable Travel Initiatives Branch, Government Operational Research Service.
Heath, Y., & Gifford, R. (2002). Extending the theory of planned behaviour: Predicting the use
of public transportation. Journal of Applied Psychology, 32(10), 2154–2189.
Hounsham, S. (2005). Key thinkers brief for the green-engage project. London: Green-Engage
Project.
Hunecke, M., Blobaum, A., Matthies, E., & Hoger, R. (2001). Responsibility and environment:
Ecological norm orientation and external factors in the domain of travel mode choice
behaviour. Environment and Behaviour, 33, 830–852.
Industry Taskforce on Peak Oil & Energy Security. (2008). The oil crunch. Securing the UK’s
energy future. First report of the UK Industry Taskforce on Peak Oil & Energy Security
(ITPOES). London: Author.
Intergovernmental Panel on Climate Change. (2007). Summary for policymakers. In M. L. Parry,
O. F. Canziani, J. P. Palutikof, P. J. van der Linden, & C. E. Hanson (Eds.), Climate change
Porter, ISBN 978-0-12-381984-0
Chapter 035 (edited file)—"Travel Mode Choice"
1/13/2011, Page 25 of 39, 6 Figure(s), 7 Table(s), 0 Box(es)
2007: Impacts, adaptation and vulnerability. Contribution of working group II to the fourth
assessment report of the Intergovernmental Panel on Climate Change (pp. 7–22). Cambridge,
UK: Cambridge University Press.
Jensen, M. (1999). Passion and heart in transport: A sociological analysis on transport behaviour.
Transport Policy, 6(1), 19–33.
Joseph, S. (2008). Transport’s clash of civilisations. In LTT500. Celebrating 20 years and 500
issues of Local Transport Today magazine. London: Local Transport Today.
Kates, R. W. (2007). Foreword. In S. C. Moser & L. Dilling (Eds.), Creating a climate for
change: Communicating climate change and facilitating social change. Cambridge, UK:
Cambridge University Press.
Lajunen, T., Parker, D., & Stradling, S. G. (1998). Dimensions of driver anger, aggressive and
highway code violations and their mediation by safety orientation in UK drivers.
Transportation Research Part F: Traffic Psychology and Behaviour, 1, 107–121.
Line, T., Chatterjee, K., & Lyons, G. (2010). The travel behaviour intentions of young people in
the context of climate change. Journal of Transport Geography, 18, 238–246.
Litman, T. (1999). The costs of automobile dependency and the benefits of balanced transport.
Victoria, BC, Canada: Victoria Transport Policy Institute.
Mann, E., & Abraham, S. C. S. (2006). The role of affect in UK commuters’ travel mode
choices: An interpretative phenomenological analysis. British Journal of Psychology, 97, 155–
176.
Marchetti, C. (1994). Anthropological invariants in travel behavior. Technological Forecasting
and Social Change, 47, 75–88.
Maxwell, S. (2001). Negotiating car use in everyday life. In D. Miller (Ed.), Car cultures.
Oxford: Berg.
Metz, D. (2004). Human mobility and transport policy. Ingenia, 18, 37–42.
Midden, C. J. H., Kaiser, F. G., & McCalley, L. T. (2007). Technology’s four roles in
understanding individuals’ conservation of natural resources. Journal of Social Issues, 63(1),
155–174.
Möser, G., & Bamberg, S. (2008). The effectiveness of soft transport policy measures: A critical
assessment and meta-analysis of empirical evidence. Journal of Environmental Psychology,
28, 10–26.
Moser, S. C., & Dilling, L. (2007). Creating a climate for change: Communicating climate
change and facilitating social change. Cambridge, UK: Cambridge University Press.
Newman, P., & Kenworthy, J. (1999). Sustainability and cities: Overcoming automobile
dependence. Washington, DC: Island Press.
NFO WorldGroup & Napier University Transport Research Institute. (2001). Public perceptions
of travel awareness. Final report to Central Research Unit. Edinburgh, UK: Scottish
Executive.
Porter, ISBN 978-0-12-381984-0
Chapter 035 (edited file)—"Travel Mode Choice"
1/13/2011, Page 26 of 39, 6 Figure(s), 7 Table(s), 0 Box(es)
NFO World Group & Napier University Transport Research Institute. (2003). Public perceptions
of travel awareness—Stage 2: Final report to Central Research Unit. Edinburgh, UK: Scottish
Executive.
Organisation for Economic Co-operation and Development. (1990). Behavioural adaptations to
changes in the road transport system. Paris: OECD.
Panou, M., Bekiaris, E., & Papakostopoulos, V. (2005). Modeling driver behaviour in EU and
international projects. In L. Macchi, C. Re, & P. C. Cacciabue (Eds.), Proceedings of the
international workshop on modelling driver behaviour in automotive environments, Ispra,
May 25–27. Luxembourg: Office for Official Publication of the European Communities.
Ponting, C. (2007). A new green history of the world. The environment and the collapse of great
civilisations. London: Vintage.
Reid, J. C., Armitage, C. J., & Spencer, C. P. (2004). The theory of planned behaviour applied to
reducing single occupancy driving: A feasibility study. Paper presented at the third
International Conference on Traffic & Transport Psychology, Nottingham, UK.
Royal Automobile Club. (1995). Car dependence (P. Goodwin et al., Eds.). London: Royal
Automobile Club Foundation for Motoring and the Environment.
Russell, J. A. (1980). A circumplex model of affect. Journal of Personality and Social
Psychology, 39, 1161–1178.
Russell, J. A. (2003). Core affect and the psychological construction of emotion. Psychological
Review, 110(1), 145–172.
Rye, T. (2002). Travel plans: Do they work? Transport Policy, 9(4), 287–298.
Sachs, W. (1984). For love of the automobile: Looking back into the history of our desires.
Berkeley: University of California Press.
Semlyen, A. (2000). Cutting your car use. Save money, be healthy, be green! Dartington Totnes,
UK: Green Books.
Shove, E. (1998). Consuming automobility (SceneSusTech discussion paper). Lancaster, UK:
Department of Sociology, Lancaster University.
Sloman, L. (2003). Less traffic where people live: How local transport schemes can help cut
traffic. Machynlleth, UK: Transport for Quality of Life.
Steer Davies Gleave. (2003). Evaluation of first yellow bus. London: Department for Transport.
Steg, L. (2004). Instrumental, social and affective values of car use. Paper presented at the third
International Conference on Traffic & Transport Psychology, Nottingham, UK.
Steg, L., & Gatersleben, B. (2000). A social dilemma analysis of car use: A comparison between
UK and The Netherlands. Paper presented at the second International Conference on Traffic
and Transport Psychology, Bern.
Steg, L., Geurs, K., & Ras, M. (2001a). The effects of motivational factors on car use: A
multidisciplinary modelling approach. Transportation Research Part A: Policy and Practice,
35, 789–806.
Porter, ISBN 978-0-12-381984-0
Chapter 035 (edited file)—"Travel Mode Choice"
1/13/2011, Page 27 of 39, 6 Figure(s), 7 Table(s), 0 Box(es)
Steg, L., Geurs, K., & Ras, M. (2001b). Motives in transport models: Can they be ignored? In D.
Hensher (Ed.), Travel behavior research: The leading edge. Amsterdam: Pergamon.
Steg, L., & Tertoolen, G. (1999). Affective motives for car use. In Transport policy, planning
and practice (pp. 13–27). London: PTRC.
Steg, L., & Uneken, E. (2002). Car use: Lust and must. In J. Rothengatter & D. Huguenin (Eds.),
Traffic and transport psychology: ICTTP 2000 proceedings. Oxford: Pergamon.
Steg, L., Vlek, C., & Slotegraaf, G. (2001). Instrumental-reasoned and symbolic-affective
motives for using a motor car. Transportation Research Part F: Traffic Psychology and
Behaviour, 4, 151–169.
Step Beyond. (2006). Drivers’ attitude study (unpublished report to Midland Safety Camera
Partnership Group). Stone, UK: Author.
Storey, P., & Brannen, J. (2000). Young people and transport in rural areas. Leicester, UK:
National Youth Agency.
Stradling, S. G. (2001). Measuring individual car dependence. Paper presented at the
Universities Transport Studies Group 33rd annual conference, Oxford, January 3–5.
Stradling, S. G. (2002a). Transport user needs and marketing public transport. Municipal
Engineer, 151(1), 23–28.
Stradling, S. G. (2002b). Combating car dependence. In G. B. Grayson (Ed.), Behavioural
research in road safety XII. Crowthorne, UK: Transport Research Laboratory.
Stradling, S. G. (2002c). Persuading people out of their cars. Inaugural lecture, Napier
University, March 27, 2002.
Stradling, S. G. (2003). Reducing car dependence. In J. Hine & J. Preston (Eds.), Integrated
futures and transport choices. Aldershot, UK: Ashgate.
Stradling, S.G. (2005). Readiness for modal shift in Scotland. Scottish Geographical Journal,
120(4), 265–275.
Stradling, S. G. (2006). Cutting down and slowing down: Changes in car use and speeding on
Scotland’s roads. In Behavioural research in road safety: Sixteenth seminar. London:
Department for Transport.
Stradling, S. G. (2007a). Determinants of car dependence. In T. Garling & L. Steg (Eds.),
Threats from car traffic to the quality of urban life: Problems, causes and solutions. Oxford:
Elsevier.
Stradling, S. G. (2007b). Car driver speed choice in Scotland. Ergonomics, 50(8), 1196–208.
Stradling, S. G., & Anable, J. (2008). Individual travel patterns. In R. D. Knowles, J. Shaw, and
I. Docherty (Eds.), Transport geographies: An introduction. Oxford: Blackwell.
Stradling, S. G., Anable, J., Anderson, T., & Cronberg, A. (2008). Car use and climate change:
Do we practise what we preach? In British social attitudes: The 24th report. London: Sage.
Porter, ISBN 978-0-12-381984-0
Chapter 035 (edited file)—"Travel Mode Choice"
1/13/2011, Page 28 of 39, 6 Figure(s), 7 Table(s), 0 Box(es)
Stradling, S. G., Carreno, M., Ferguson, N., Rye, T., Halden, D., Davidson, P., Anable, J., Hope,
S., Alder, B., Ryley, T., & Wigan, M. (2005). Scottish household survey analytical topic
report: Accessibility and transport. Edinburgh, UK: Scottish Executive.
Stradling, S. G., Carreno, M., Rye, T., & Noble, A. (2007). Passenger perceptions and the ideal
urban bus journey experience. Transport Policy, 14, 283–229.
Stradling, S. G., Hine, J., & Wardman, M. (2000). Physical, cognitive and affective effort in
travel mode choices. Paper presented at the Symposium on Travel Mode Choice, Second
International Conference on Traffic & Transport Psychology, Bern.
Stradling, S. G., Meadows, M. L., & Beatty, S. (1998). Psychological benefits and disbenefits of
driving. In G. B. Grayson (Ed.), Behavioural research in road safety VIII. Crowthorne, UK:
Transport Research Laboratory.
Stradling, S. G., Meadows, M. L., & Beatty, S. (1999). Factors affecting car use choices. Report
to the Department of the Environment, Transport and the Regions. Edinburgh: Transport
Research Institute, Napier University.
Stradling, S. G., Meadows, M. L., & Beatty, S. (2000). Helping drivers out of their cars:
Integrating transport policy and social psychology. Transport Policy, 7(3), 207–215.
Stradling, S. G., Meadows, M. L., & Beatty, S. (2001). Identity and independence: Two
dimensions of driver autonomy. In G. B. Grayson (Ed.), Behavioural Research in Road Safety
X. Crowthorne, UK: Transport Research Laboratory.
Tertoolen, G., van Kreveld, D., & Verstraten, B. (1998). Psychological resistance against
attempts to reduce private car use. Transportation Research Part A, 32, 171–181.
Transform Scotland Trust. (2008). Peak oil. Edinburgh, UK: Author.
Urry, J. (1999). Automobility, car culture and weightless travel (draft). Lancaster, UK:
Department of Sociology, Lancaster University.
http://www.lancaster.ac.uk/sociology/soc008ju.html
Vlek, C., & Steg, L. (2007). Human behavior and environmental sustainability: Problems,
driving forces, and research topics. Journal of Social Issues, 63(1), 1–19.
Wall, R., Devine-Wright, P., & Mill, G. (2004). Psychological predictors in context: Travel
intentions among university staff and students. Paper presented at the third International
Conference on Traffic & Transport Psychology, Nottingham, UK.
Wardman, M., Hine, J., & Stradling, S. G. (2001). Interchange and travel choice. Edinburgh,
UK: Scottish Executive Central Research Unit.
Woods, M., & Woods, M. B. (2000). Ancient transportation: From camels to canals.
Minneapolis, MN: Runestone.
Wright, C., & Egan, J. (2000). De-marketing the car. Transport Policy, 7, 287–294.
Porter, ISBN 978-0-12-381984-0
Chapter 035 (edited file)—"Travel Mode Choice"
1/13/2011, Page 29 of 39, 6 Figure(s), 7 Table(s), 0 Box(es)
Figure 35.1 Core determinants of travel behavior. Source: Reproduced with permission from
Garling (2005).
Figure 35.2 Road transport CO2 policy measures in the United Kingdom. Source:
Department for Transport (2007).
Figure 35.3 Rated risk and enjoyment of powered two-wheeler users. Source: Reproduced
with permission from Broughton (2007).
Figure 35.4 Russell’s (1980, 2003) typology of affective states and the urban bus journey
experience
Figure 35.5 MaxSem model of travel mode change. Source: Reproduced with permission
from Carreno et al. (2009).
Figure 35.6 Global GHG emissions from fossil fuel-powered vehicles
Table 35.1 Behavior Changes to Current Human Consumption Patterns Needed
to Reduce Greenhouse Gas Emissions
• Transport: Minimizing use of cars, trying public transport, and walking or cycling to get from
A to B
• Holidays, leisure, and travel: Choosing locations, activities, and transport modes to help the
environment
• Rubbish: Minimizing waste, recycling, composting, and disposing properly of unwanted goods
• Food purchasing: Buying local produce, choosing organic items, avoiding depleted wild
foods, adopting ―seasonality,‖ choosing vegetarianism, and growing food at home
• Energy use in the home: Turning down heating, using low-energy lighting, switching off
appliances, reducing energy demand through less ―home mechanization,‖ insulating, and
sourcing greener energy
• Chemicals: Reducing release of damaging or polluting chemicals through use of detergents,
bleaches, garden chemicals, etc.
• Sourcing materials: Refusing items made from depleted resources (e.g., tropical timber) while
actively seeking those made from recycled materials (e.g., waste paper)
• Water use: Cutting consumption, cutting waste, home gathering, and reusing
• Consumer hardware: Repairing rather than replacing, passing on unwanted goods, and
disposing of items at the end of their life properly
• Green investment: Choosing environmental savings accounts, mortgages, etc.
• Active participation: Donating and joining and taking part in green activities
Porter, ISBN 978-0-12-381984-0
Chapter 035 (edited file)—"Travel Mode Choice"
1/13/2011, Page 30 of 39, 6 Figure(s), 7 Table(s), 0 Box(es)
• Voting: Casting votes on environmental grounds
• Bearing witness: Promoting environmentally friendly behavior to others
Source: Hounsham (2005).
Table 35.2 Ten Components of the Driving Task
1. Strategic tasks
Activity choice and mode and departure time choice. Discern
route alternatives and travel time.
2. Navigation tasks
Find and follow chosen or changed route; identify and use
landmarks and other cues.
3. Road tasks
Choose and keep correct position on road.
4. Traffic tasks
Maintain mobility (―making progress‖) while avoiding
collisions.
5. Rule tasks
Obey rules, regulations, signs, and signals.
6. Handling tasks
Use in-car controls correctly and appropriately.
7. Secondary tasks
Use in-car equipment, such as cruise control, climate control,
radio, and mobile telephone, without distracting from
performance on primary tasks.
8. Speed task
Maintain a speed appropriate to the conditions.
9. Mood management task
Maintain driver subjective well-being, avoiding boredom and
anxiety.
10. Capability maintenance task Avoid compromising driver capability with alcohol or other
drugs (both illegal and prescription), fatigue, or distraction.
Source: Components 1–8 from Panou et al. (2005).
Table 35.3 Ambivalent Attitudes on Car Use in the United Kingdom (n = 656–
791)
Driving a car gives me freedom to go where I want when I want 95%
Driving a car is a convenient way of traveling
93%
I like traveling in a car
84%
BUT
Driving a car is stressful because of congestion on the roads
53%
Driving a car is stressful because of the behavior of other drivers 53%
AND
I am trying to use my car less 43%
I would like to reduce my car use but there are no practical alternatives
57%
Table 35.4 Attitudes on Car Use and the Environment in Britain
All Adults
Drivers
n = 3220 n = 2233
The current level of car use has a serious effect on
climate change.
I am concerned about the effect of transport on climate
Agree
*
Concerned
80%
82%
81%
84%
Porter, ISBN 978-0-12-381984-0
Chapter 035 (edited file)—"Travel Mode Choice"
1/13/2011, Page 31 of 39, 6 Figure(s), 7 Table(s), 0 Box(es)
change.
For the sake of the environment, everyone should
reduce how much they use their cars.
Anyone who thinks that reducing their own car use
will help the environment is wrong—one person
doesn’t make any difference.
People should be allowed to use their cars as much as
they like, even if it causes damage to the environment.
High-mileage drivers (>10,000 miles/16,000 km per
year)
n = 930
n = 541
Agree
Disagree
Disagree
66%
10%
59%
66%
11%
62%
Agree
23%
24%
Agree
35%
*
Agree = strongly agree + agree; concerned = very concerned + fairly concerned; disagree = strongly
disagree + disagree.
Source: Stradling et al. (2008).
Table 35.5 Proportions of Each Driver Type Agreeing with Environmental
Attitude Items
Weighted percentage over four UK samples, n = 3471
Percentage strongly agree + agree
I like traveling in a car.
I find car driving can be stressful sometimes.
I am trying to use the car less.
Reducing my car use would make me feel good.
I would like to reduce my car use but there are no practical
alternatives.
Being environmentally responsible is important to me.
Environmental threats such as global warming have been
exaggerated.
People should be allowed to use their cars as much as they
like, even if it causes damage to the environment.
For the sake of the environment, car users should pay
higher taxes.
I would be willing to pay higher taxes on car use if I knew
the revenue would be used to support public transport.
It is important to build more roads to reduce congestion.
DHD CC
24% 29%
MM
23%
AE
23%
98
25
8
5
49
82
28
29
21
54
82
66
62
65
81
73
67
83
78
46
61
39
76
19
85
20
89
9
48
13
19
7
4
5
17
39
11
9
38
46
72
23
60
30
AE, aspiring environmentalists; CC, car complacents; DHD, die-hard drivers; MM, malcontented
motorists.
Table 35.6 Substitutability of Current Car Journeys: Percentage Who Could
Substitute Current Car Journey by Other Mode
Porter, ISBN 978-0-12-381984-0
Chapter 035 (edited file)—"Travel Mode Choice"
1/13/2011, Page 32 of 39, 6 Figure(s), 7 Table(s), 0 Box(es)
n = 392–1598
Walk
Cycle
Take children to/from school*
Town center shopping
Visit friends or relatives
Evenings out for leisure purposes
Leisure activities during the weekend
Take children to leisure activities*
Go away for a weekend
Travel to work†
Supermarket shopping
59
23
39
26
21
29
<1
15
19
3
2
9
1
9
4
<1
10
3
Bus
16
43
28
34
27
27
20
28
26
Train
<1
13
11
9
12
4
40
9
<1
None of
These
28
31
35
42
48
49
53
55
57
*
Respondents with children in the household.
†
Respondents who travel to work by car.
Table 35.7 Behavior Change Techniques Effective in Health Interventions
Technique
1. Provide information about the
behavior–health link
2. Provide information on
consequences
3. Provide information about others’
approval
4. Prompt intention formation
5. Prompt barrier identification
6. Provide general encouragement
7. Set graded tasks
8. Provide instruction
9. Model or demonstrate the behavior
10. Prompt specific goal setting
Description
General information about behavioral risk, such as
susceptibility to poor health outcomes or mortality risk
in relation to the behavior.
Information about the benefits and costs of action or
inaction, focusing on what will happen if the person
does or does not perform the behavior.
Information about what others think about the person’s
behavior and whether others will approve or disapprove
of any proposed behavior change.
Encouraging the person to decide to act or set a general
goal—for example, to make a behavioral resolution
such as ―I will take more exercise next week.‖
Identify barriers to performing the behavior and plan
ways of overcoming them.
Praising or rewarding the person for effort or
performance without this being contingent on specified
behaviors or standards of performance.
Set easy tasks, and increase difficulty until target
behavior is performed.
Telling the person how to perform a behavior and/or
preparatory behaviors.
An expert shows the person how to correctly perform a
behavior (e.g., in class or on video).
Involves detailed planning of what the person will do,
including a definition of the behavior specifying
frequency, intensity, or duration as well as specification
or at least one context (i.e., where, when, how, or with
Porter, ISBN 978-0-12-381984-0
Chapter 035 (edited file)—"Travel Mode Choice"
1/13/2011, Page 33 of 39, 6 Figure(s), 7 Table(s), 0 Box(es)
11. Prompt review of behavioral goals
12. Prompt self-monitoring of
behavior
13. Provide feedback on performance
14. Provide contingent rewards
15. Teach to use prompts/cues
16. Agree behavioral contract
17. Prompt practice
18. Use follow-up prompts
19. Provide opportunities for social
comparison
20. Plan social support/social change
21. Prompt identification as role
model
22. Prompt self-talk
23. Relapse prevention
24. Stress management
25. Motivational interviewing
whom).
Review and/or reconsideration of previously set goals
or intentions.
The person is asked to keep a record of specified
behaviors (e.g., in a diary).
Providing data about recorded behavior or evaluating
performance in relation to a set standard or others’
performance—that is, the person receives feedback on
his or her behavior.
Praise, encouragement, or material rewards that are
explicitly linked to the achievement of specified
behaviors.
Teach the person to identify environmental cues that
can be used to remind him or her to perform a behavior,
including times of day or elements of contexts.
Agreement (e.g., signing) of a contract specifying
behavior to be performed so that there is a written
record of the person’s resolution witnessed by another.
Prompt the person to rehearse and repeat the behavior
or preparatory behaviors.
Contacting the person again after the main part of the
intervention is complete.
Facilitate observation of non-expert others’
performance (e.g., in a group class or using video or
case study).
Prompting consideration of how others could change
their behavior to offer the person help or (instrumental)
social support, including ―buddy‖ systems, and/or
providing social support.
Indicating how the person may be an example and
influence others’ behavior or providing an opportunity
for the person to set a good example.
Encourage the use of self-instruction and selfencouragement (aloud or silently) to support action.
Following initial change, identify situations likely to
result in re-adopting risk behaviors or failing to
maintain new behaviors and help the person to plan to
avoid or manage these situations.
May involve a variety of specific techniques (e.g.,
progressive relaxation) that do not target the behavior
but seek to reduce anxiety and stress.
Prompting the person to provide self-motivating
statements and evaluations of his or her own behavior
to minimize resistance to change.
Porter, ISBN 978-0-12-381984-0
Chapter 035 (edited file)—"Travel Mode Choice"
1/13/2011, Page 34 of 39, 6 Figure(s), 7 Table(s), 0 Box(es)
26. Time management
Helping the person make time for the behavior (e.g., fit
it into a daily schedule).
Source: Abraham and Michie (2008).
Figure 1. Core Determinants of Travel Behavior (from Garling, 2005)
Activity choice
Travel demand
Spatial organization
of the environment
Transport system
Travel choice
Travel
Porter, ISBN 978-0-12-381984-0
Chapter 035 (edited file)—"Travel Mode Choice"
1/13/2011, Page 35 of 39, 6 Figure(s), 7 Table(s), 0 Box(es)
Figure 2. Road Transport CO2 Policy Measures in the UK (from Department for Transport,
2007)
Porter, ISBN 978-0-12-381984-0
Chapter 035 (edited file)—"Travel Mode Choice"
1/13/2011, Page 36 of 39, 6 Figure(s), 7 Table(s), 0 Box(es)
Figure 3. Rated Risk and Enjoyment in Powered Two-Wheeler Users (from Broughton, 2007)
Porter, ISBN 978-0-12-381984-0
Chapter 035 (edited file)—"Travel Mode Choice"
1/13/2011, Page 37 of 39, 6 Figure(s), 7 Table(s), 0 Box(es)
Figure 4. Russell’s (1980, 2003) Typology of Affective States and the Urban Bus Journey
Experience
DEACTIVATED
PLEASANT
Ideal bus
journey
ACTIVATED
Social exchange
(chatting)
Feeling unsafe
UNPLEASANT
Intrusive arousal
Porter, ISBN 978-0-12-381984-0
Chapter 035 (edited file)—"Travel Mode Choice"
1/13/2011, Page 38 of 39, 6 Figure(s), 7 Table(s), 0 Box(es)
Figure 5 MAXSEM Model of Travel Mode Change (from Carreno et al, 2009)
Porter, ISBN 978-0-12-381984-0
Chapter 035 (edited file)—"Travel Mode Choice"
1/13/2011, Page 39 of 39, 6 Figure(s), 7 Table(s), 0 Box(es)
Figure 6 Global GHG Emissions from Fossil Fuel Powered Vehicles
IMPACT = POPULATION x CONSUMPTION
GLOBAL GHG EMISSIONS FROM FOSSIL FUEL POWERED
MOTORISED VEHICLES
Growing inexorably.
Faster than efficiency gains.
Rebound effects
= POPULATION OF VEHICLES x AVERAGE GHG EMISSION RATE
Engine efficiency gains
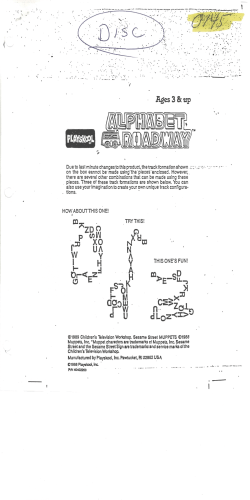
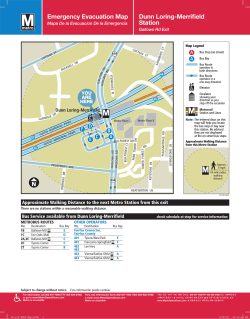


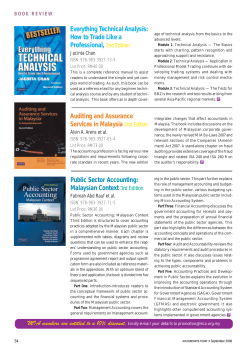


© Copyright 2026