
Supporting RTI, the Common Core, and the Classroom
RTI Toolkit: A Practical Guide for Schools Supporting RTI, the Common Core, and Special Education: How to Collect Data in the Classroom Jim Wright, Presenter 6 December 2013 Eastern Suffolk BOCES Holbrook, NY Jim Wright 364 Long Road Tully, NY 13159 Email: [email protected] Workshop Resources Available at: http://www.interventioncentral.org/es_boces_data 2 ‘How the Common Core Works’ Series © 2013 Jim Wright www.interventioncentral.org 1 How To: Create a Written Record of Classroom Interventions When general-education students begin to struggle with academic or behavioral issues, the classroom teacher will typically select and implement one or more evidence-based intervention strategies to assist those students. But a strong intervention plan needs more than just well-chosen interventions. It also requires 4 additional components (Witt, VanDerHeyden, & Gilbertson, 2004): (1) student concerns should be clearly and specifically defined; (2) one or more methods of formative assessment should be used to track the effectiveness of the intervention; (3) baseline student data should be collected prior to the intervention; and (4) a goal for student improvement should be calculated before the start of the intervention to judge whether that intervention is ultimately successful. If a single one of these essential 4 components is missing, the intervention is to be judged as fatally flawed (Witt, VanDerHeyden, & Gilbertson, 2004) and as not meeting minimum Response to Intervention standards. Teachers need a standard format to use in documenting their classroom intervention plans. The Classroom Intervention Planning Sheet that appears later in this article is designed to include all of the essential documentation elements of an effective intervention plan. The form includes space to document: Case information. In this first section of the form, the teacher notes general information, such as the name of the target student, the adult(s) responsible for carrying out the intervention, the date the intervention plan is being created, the expected start and end dates for the intervention plan, and the total number of instructional weeks that the intervention will be in place. Most importantly, this section includes a description of the student problem; research shows that the most significant step in selecting an effective classroom intervention is to correctly identify the target student concern(s) in clear, specific, measureable terms (Bergan, 1995). Intervention. The teacher describes the evidence-based intervention(s) that will be used to address the identified student concern(s). As a shortcut, the instructor can simply write the intervention name in this section and attach a more detailed intervention script/description to the intervention plan. Materials. The teacher lists any materials (e.g., flashcards, wordlists, worksheets) or other resources (e.g., Internet-connected computer) necessary for the intervention. Training. If adults and/or the target student require any training prior to the intervention, the teacher records those training needs in this section of the form. Progress-Monitoring. The teacher selects a method to monitor student progress during the intervention. For the method selected, the instructor records what type of data is to be used, collects and enters student baseline (starting-point) information, calculates an intervention outcome goal, and notes how frequently he or she plans to monitor the intervention. A completed example of the Classroom Intervention Planning Sheet that includes a math computation intervention can be found later in this article. While a simple intervention documentation form is a helpful planning tool, schools should remember that teachers will need other resources and types of assistance as well to be successful in selecting and using classroom interventions. For example, teachers should have access to an ‘intervention menu’ that contains evidence-based strategies to address the most common academic and behavioral concerns and should be able to get coaching support as they learn how to implement new classroom intervention ideas. References Bergan, J. R. (1995). Evolution of a problem-solving model of consultation. Journal of Educational and Psychological Consultation, 6(2), 111-123. Witt, J. C., VanDerHeyden, A. M., & Gilbertson, D. (2004). Troubleshooting behavioral interventions. A systematic process for finding and eliminating problems. School Psychology Review, 33, 363-383. Jim Wright, Presenter www.interventioncentral.org 2 3 ‘How the Common Core Works’ Series © 2013 Jim Wright www.interventioncentral.org 2 Classroom Intervention Planning Sheet This worksheet is designed to help teachers to quickly create classroom plans for academic and behavioral interventions. Case Information What to Write: Record the important case information, including student, person delivering the intervention, date of plan, start and end dates for the intervention plan, and the total number of instructional weeks that the intervention will run. Date Intervention Student: Interventionist(s): Plan Was Written: Date Intervention is to Start: Date Intervention is to End: Total Number of Intervention Weeks: Description of the Student Problem: Intervention What to Write: Write a brief description of the intervention(s) to be used with this student. TIP: If you have a script for this intervention, you can just write its name here and attach the script to this sheet. Materials What to Write: Jot down materials (e.g., flashcards) or resources (e.g., Internet-connected computer) needed to carry out this intervention. Training What to Write: Note what training--if any--is needed to prepare adult(s) and/or the student to carry out the intervention. Progress-Monitoring What to Write: Select a method to monitor student progress on this intervention. For the method selected, record what type of data is to be used, enter student baseline (starting-point) information, calculate an intervention outcome goal, and note how frequently you plan to monitor the intervention. Tip: Several ideas for classroom data collection appear on the right side of this table. Ideas for Intervention Progress-Monitoring Type of Data Used to Monitor: Existing data: grades, homework logs, etc. Cumulative mastery log Baseline Outcome Goal Rubric Curriculum-based measurement Behavior report card How often will data be collected? (e.g., daily, every other day, weekly): Behavior checklist Jim Wright, Presenter www.interventioncentral.org 3 4 ‘How the Common Core Works’ Series © 2013 Jim Wright 3 www.interventioncentral.org Classroom Intervention Planning Sheet: Math Computation Example This worksheet is designed to help teachers to quickly create classroom plans for academic and behavioral interventions. Case Information What to Write: Record the important case information, including student, person delivering the intervention, date of plan, start and end dates for the intervention plan, and the total number of instructional weeks that the intervention will run. Date Intervention 10 October Student: John Samuelson-Gr 4 Interventionist(s): Mrs. Kennedy, classroom Plan Was Written: 2012 Date Intervention is to Start: M 8 Oct 2012 Description of the Student Problem: Date Intervention is to End: teacher F 16 Nov 2012 Total Number of Intervention Weeks: 6 weeks Slow math computation speed (computes multiplication facts at 12 correct digits in 2 minutes, when typical gr 4 peers compute at least 24 correct digits). Intervention What to Write: Write a brief description of the intervention(s) to be used with this student. TIP: If you have a script for this intervention, you can just write its name here and attach the script to this sheet. Math Computation Time Drill.(Rhymer et al., 2002) Explicit time-drills are a method to boost students’ rate of responding on arithmetic-fact worksheets: (1) The teacher hands out the worksheet. Students are instructed that they will have 3 minutes to work on problems on the sheet. (2) The teacher starts the stop watch and tells the students to start work. (3) At the end of the first minute in the 3-minute span, the teacher ‘calls time’, stops the stopwatch, and tells the students to underline the last number written and to put their pencils in the air. Then students are told to resume work and the teacher restarts the stopwatch. (4) This process is repeated at the end of minutes 2 and 3. (5) At the conclusion of the 3 minutes, the teacher collects the student worksheets. Materials What to Write: Jot down materials (e.g., flashcards) or resources (e.g., Internet-connected computer) needed to carry out this intervention. Use math worksheet generator on www.interventioncentral.org to create all time-drill and assessment materials. Training What to Write: Note what training--if any--is needed to prepare adult(s) and/or the student to carry out the intervention. Meet with the student at least once before the intervention to familiarize with the time-drill technique and timed math computation assessments. Progress-Monitoring What to Write: Select a method to monitor student progress on this intervention. For the method selected, record what type of data is to be used, enter student baseline (starting-point) information, calculate an intervention outcome goal, and note how frequently you plan to monitor the intervention. Tip: Several ideas for classroom data collection appear on the right side of this table. Ideas for Intervention Progress-Monitoring Type of Data Used to Monitor: Curriculum-based measurement: math Existing data: grades, homework logs, etc. computation assessments: 2 minute single-skill probes Cumulative mastery log Rubric Baseline Outcome Goal Curriculum-based measurement 12 correct digits per 2 minute probe 24 correct digits per 2 minute probe Behavior report card Behavior checklist How often will data be collected? (e.g., daily, every other day, weekly): WEEKLY Jim Wright, Presenter www.interventioncentral.org 4 5 ‘How the Common Core Works’ Series © 2013 Jim Wright www.interventioncentral.org 1 How To: Structure Classroom Data Collection for Individual Students When a student is struggling in the classroom, the teacher will often implement an intervention matched to the student's deficient academic skills. However, classroom interventions are incomplete if the teacher is not also collecting data to document whether those interventions are actually benefiting students. Indeed, an intervention can be viewed as ‘fatally flawed’ (Witt, VanDerHeyden & Gilbertson, 2004) if it lacks any one of these 4 data elements: Problem definition. The teacher clearly and specifically defines the presenting student problem(s) needing intervention. If the student problem is not clearly defined, the teacher cannot accurately measure or fix it. Baseline performance. The teacher assesses the student’s current skill or performance level (baseline performance) in the identified area(s) of concern. If the teacher lacks baseline information, he or she cannot judge at the end of the intervention how much progress was actually made. Intervention goal. Before starting the intervention, the teacher sets a specific outcome goal for student improvement. Without a goal in place before the start of the intervention, the teacher cannot judge at the end of the intervention whether it has in fact been a success. Ongoing progress-monitoring. The teacher selects a method to monitor the student’s progress formatively during the intervention. Without ongoing monitoring of progress, the teacher is 'flying blind', unable to judge to judge whether the intervention is effective in helping the student to attain the outcome goal. Bringing Structure to Classroom Data-Collection. The Student Intervention: Monitoring Worksheet. As teachers take on the role of ‘first responder’ interventionist, they are likely to need guidance – at least initially—in the multi-step process of setting up and implementing classroom data collection, as well as interpreting the resulting data. A form designed to walk teachers through the data-collection process-- The Student Intervention: Progress-Monitoring Worksheet—appears at the end of this document, along with a completed example. The Worksheet is a 7-step ‘wizard’ form to show teachers how to structure their progress-monitoring to ensure that their data collection is adequate to the task of measuring the impact of their classroom interventions: Identify the student problem. The teacher defines the student problem in clear, specific terms that allow the instructor to select an appropriate source of classroom assessment to measure and monitor the problem. Decide on a data collection method. The teacher chooses a method for collecting data that can be managed in the classroom setting and that will provide useful information about the student problem. Examples of data collection methods are curriculum-based measurement (e.g., oral reading fluency; correct writing sequences), behavior-frequency counts, and daily behavior report cards. When selecting a data collection method, the teacher also decides how frequently that data will be collected during intervention progress-monitoring. In some cases, the method of data collection being used will dictate monitoring frequency. For example, if homework completion and accuracy is being tracked, the frequency of data collection will be equal to the frequency of homework assignments. In other cases, the level of severity of the student problem will dictate monitoring frequency. In schools implementing Response to Intervention (RTI), students on Tier 2 (standardprotocol) interventions should be monitored 1-2 times per month, for example, while students on Tier 3 (intensive problemsolving protocol) interventions should be monitored at least weekly (Burns & Gibbons, 2008). Jim Wright, Presenter www.interventioncentral.org 5 6 ‘How the Common Core Works’ Series © 2013 Jim Wright www.interventioncentral.org 2 Collect data to calculate baseline. The teacher should collect 3-5 data-points prior to starting the intervention to calculate the student’s baseline, or starting point, in the skill or behavior that is being targeted for intervention. The student’s baseline performance serves as an initial marker against which to compare his or her outcome performance at the end of the intervention. (Also,--because baseline data points are collected prior to the start of the intervention--they collectively can serve as an prediction of the trend, or rate of improvement, if the student’s current academic program were to remain unchanged with no additional interventions attempted.). In calculating baseline, the teacher has the option of selecting the median, or middle, data-point, or calculating the mean baseline performance. Determine the timespan of the intervention. The length of time reserved for the intervention should be sufficient to allow enough data to be collected to clearly demonstrate whether that intervention was successful. For example, it is recommended that a high-stakes intervention last at least 8 instructional weeks (e.g., Burns & Gibbons, 2008). Set an intervention goal. The teacher calculates a goal for the student that, if attained by the end of the intervention period, will indicate that the intervention was successful. Decide how student progress is to be summarized. A decision that the teacher must make prior to the end of the intervention period is how he or she will summarize the actual progress-monitoring data. Because of the variability present in most data, the instructor will probably not elect simply to use the single, final data point as the best estimate of student progress. Better choices are to select several (e.g. 3) of the final data points and either select the median value or calculate a mean value. For charted data with trendline, the teacher may calculate the student’s final performance level as the value of the trendline at the point at which it intercepts the intervention end-date. Evaluate the intervention outcome. At the conclusion of the intervention, the teacher directly compares the actual student progress (summarized in the previous step) with the goal originally set. If actual student progress meets or exceeds the goal, the intervention is judged to be successful. References Burns, M. K., & Gibbons, K. A. (2008). Implementing response-to-intervention in elementary and secondary schools. Routledge: New York. Witt, J. C., VanDerHeyden, A. M., & Gilbertson, D. (2004). Troubleshooting behavioral interventions. A systematic process for finding and eliminating problems. School Psychology Review, 33, 363-383. Jim Wright, Presenter www.interventioncentral.org 6 7 ‘How the Common Core Works’ Series © 2013 Jim Wright 3 www.interventioncentral.org Student Intervention: Progress-Monitoring Worksheet SET-UP Student: ___ Brian Jones__ Teacher: _____ Mrs. Braniff_____ Classroom or Course: Gr 3_____________ A. Identify the Student Problem: Describe in clear, specific terms the student academic or behavioral problem: Need to Become Fluent in Multiplication Facts: 0 to 9___________________________ B. Select a Data Collection Method: Choose a method of data collection to measure whether the classroom intervention actually improves the identified student problem (e.g., curriculum-based measurement, etc.). Curriculum-Based Measurement: 2-Minute Timed Math Computation Probes________________ How frequently will this data be collected?: 1 times per Week C. Collect Data to Calculate Baseline: What method from the choices below will be used to estimate the student’s baseline BASELINE (starting) performance? (NOTE: Generally, at least 3-5 baseline data points are recommended.) From a total of 3 observations, select the median value. From a total of ______ observations, calculate the mean value. Baseline 1. Date: _11_/_14_/2011 Obsv: _31___ 2. Date: _11_/_17_/2011 Obsv: _28___ Other: _____________________________ ___________________________________ 3. Date: _11_/_21_/2011 Obsv: _34___ 4. Date: ____/____/____ Obsv: ______ 5. Date: ____/____/____ Obsv: ______ Baseline Performance: Based on the method selected above, it is calculated that the student’s baseline performance is: _______________ 31 Correct Digits in 2 minutes _____________________________________________________ PROGRESS-MONITORING D. Determine Intervention Timespan: The intervention will last 6 instructional weeks and end on _1_/_13_/2012 E. Set a Performance Goal: What goal is the student expected to achieve if the intervention is successful? At the end of the intervention, it is predicted that the student will reach this performance goal: ______40 Correct Digits in 2 minutes ______________________________________________________________ F. Decide How Student Progress is to Be Summarized: Select a G. Evaluate the Intervention Outcome: method for summarizing student progress (‘outcome’) attained when the intervention ends. Student progress at the end of the intervention is to be summarized by: Selecting the median value from the final ____ data-points (e.g.,3). Computing the mean value from the final 2 data-points (e.g.,3). [For time-series graphs]: Calculating the value on the graph trend line at the point that it intercepts the intervention end date. Progress-Monitoring 1. Date: _12_/_02_/2011 Obsv: _29___ 2. Date: _12_/_09_/2011 Obsv: _34___ 3. Date: _12_/_16_/2011 Obsv: _35___ 4. Date: _12_/_22_/2011 Obsv: _39___ Jim Wright, Presenter At the end of the intervention, compare student progress to goal. If actual progress meets or exceeds goal, the intervention is judged successful. The student’s ACTUAL Progress (Step F) is: 42 The PERFORMANCE GOAL for improvement (Step E) is: 40 5. Date: _01_/_06_/2012 Obsv: _41___ 6. Date: _01_/_13_/2012 Obsv: _43___ 7. Date: ____/____/____ Obsv: ______ 8. Date: ____/____/____ Obsv: ______ 9. Date: ____/____/____ Obsv: ______ www.interventioncentral.org 7 8 ‘How the Common Core Works’ Series © 2013 Jim Wright www.interventioncentral.org 4 Student Intervention: Progress-Monitoring Worksheet SET-UP Student: ___________________ Teacher: _______________________ Classroom or Course: ___________________ A. Identify the Student Problem: Describe in clear, specific terms the student academic or behavioral problem: ________________________________________________________________________________________________________________________________ B. Select a Data Collection Method: Choose a method of data collection to measure whether the classroom intervention actually improves the identified student problem (e.g., curriculum-based measurement, etc.). ______________________________________________________________________________________________________ How frequently will this data be collected?: __________ times per _____________ C. Collect Data to Calculate Baseline: What method from the choices below will be used to estimate the student’s baseline BASELINE (starting) performance? (NOTE: Generally, at least 3-5 baseline data points are recommended.) From a total of ______ observations, select the median value. Other: _____________________________ From a total of ______ observations, calculate the mean value. Baseline 1. Date: ____/____/____ Obsv: _____________ 2. Date: ____/____/____ Obsv: _____________ ___________________________________ 3. Date: ____/____/____ Obsv: _____________ 4. Date: ____/____/____ Obsv: _____________ 5. Date: ____/____/____ Obsv: _____________ Baseline Performance: Based on the method selected above, it is calculated that the student’s baseline performance is: ______________________________________________________________________________________________________ PROGRESS-MONITORING D. Determine Intervention Timespan: The intervention will last _______ instructional weeks and end on ____/____/____. E. Set a Performance Goal: What goal is the student expected to achieve if the intervention is successful? At the end of the intervention, it is predicted that the student will reach this performance goal: ________________________________________________________________________________________________________ F. Decide How Student Progress is to Be Summarized: Select a method for summarizing student progress (‘outcome’) attained when the intervention ends. Student progress at the end of the intervention is to be summarized by: Selecting the median value from the final ____ data-points (e.g.,3). At the end of the intervention, compare student progress to goal. If actual progress meets or exceeds goal, the intervention is judged successful. Computing the mean value from the final ____ data-points (e.g.,3). The student’s ACTUAL Progress (Step F) is: [For time-series graphs]: Calculating the value on the graph trend line at the point that it intercepts the intervention end date. The PERFORMANCE GOAL for improvement (Step E) is: Progress-Monitoring G. Evaluate the Intervention Outcome: 1. Date: ____/____/____ Obsv: _____________ 2. Date: ____/____/____ Obsv: _____________ 3. Date: ____/____/____ Obsv: _____________ 4. Date: ____/____/____ Obsv: _____________ Jim Wright, Presenter 5. Date: ____/____/____ Obsv: _____________ 6. Date: ____/____/____ Obsv: _____________ 7. Date: ____/____/____ Obsv: _____________ 8. Date: ____/____/____ Obsv: _____________ 9. Date: ____/____/____ Obsv: _____________ www.interventioncentral.org 8 9 ‘How the Common Core Works’ Series © 2013 Jim Wright www.interventioncentral.org 5 Student: ___________________________________________________________ Grade: _____________________________ Teacher: School Year: Progress-Monitoring (Cont.) Progress-Monitoring (Cont.) 10. Date: ____/____/____ Obsv: _____________ 11. Date: ____/____/____ Obsv: _____________ 12. Date: ____/____/____ Obsv: _____________ 13. Date: ____/____/____ Obsv: _____________ 14. Date: ____/____/____ Obsv: _____________ 15. Date: ____/____/____ Obsv: _____________ 16. Date: ____/____/____ Obsv: _____________ 17. Date: ____/____/____ Obsv: _____________ 18. Date: ____/____/____ Obsv: _____________ 19. Date: ____/____/____ Obsv: _____________ 20. Date: ____/____/____ Obsv: _____________ 21. Date: ____/____/____ Obsv: _____________ 22. Date: ____/____/____ Obsv: _____________ 23. Date: ____/____/____ Obsv: _____________ 24. Date: ____/____/____ Obsv: _____________ 25. Date: ____/____/____ Obsv: _____________ 26. Date: ____/____/____ Obsv: _____________ 27. Date: ____/____/____ Obsv: _____________ 28. Date: ____/____/____ Obsv: _____________ 29. Date: ____/____/____ Obsv: _____________ 30. Date: ____/____/____ Obsv: _____________ 31. Date: ____/____/____ Obsv: _____________ 32. Date: ____/____/____ Obsv: _____________ 33. Date: ____/____/____ Obsv: _____________ 34. Date: ____/____/____ Obsv: _____________ 35. Date: ____/____/____ Obsv: _____________ 36. Date: ____/____/____ Obsv: _____________ 37. Date: ____/____/____ Obsv: _____________ 38. Date: ____/____/____ Obsv: _____________ 39. Date: ____/____/____ Obsv: _____________ 40. Date: ____/____/____ Obsv: _____________ 41. Date: ____/____/____ Obsv: _____________ 42. Date: ____/____/____ Obsv: _____________ 43. Date: ____/____/____ Obsv: _____________ 44. Date: ____/____/____ Obsv: _____________ 45. Date: ____/____/____ Obsv: _____________ 46. Date: ____/____/____ Obsv: _____________ 47. Date: ____/____/____ Obsv: _____________ 48. Date: ____/____/____ Obsv: _____________ 49. Date: ____/____/____ Obsv: _____________ Jim Wright, Presenter www.interventioncentral.org 9 10 How To: Match a Progress-Monitoring Tool to Every Classroom Problem Whenever teachers put an academic or behavioral intervention in place for a student, they will also want to collect classroom progress-monitoring data to judge whether that intervention is effective (Witt, VanDerHeyden, & Gilbertson, 2004). For teachers, the six most frequent intervention targets are the following: 1. Academics: Acquisition of basic skills 2. Academics: Fluency in basic skills 3. Academics: Complex skills 4. Academics: Survival skills 5. Behaviors 6. Homework The table below is designed as a' look-up' resource to help instructors quickly to select appropriate monitoring tools to track the success of academic and behavioral interventions. Under each intervention target are listed one or more data sources that can measure the target--along with information about how to make or find examples of recommended measurement tools. 1. Academics: Acquisition of Basic Skills What to assess: Basic academic skills are those 'building-block' skills that are the foundation for more advanced learning. When students are just acquiring basic skills, they often are expected to learn a finite set of items--such as letter sounds, multiplication math-facts 0-9, Dolch pre-primer sight word list, or 50 vocabulary terms necessary for success in a biology course. At this acquisition stage of learning, the teacher's measurement objective is to monitor which items the student has mastered from the larger set. How to assess and where to find materials: Cumulative mastery log. The simplest way for the teacher to track which items the student has learned from a larger pool is to maintain a cumulative mastery log. First, the teacher develops objective guidelines for judging that a student has mastered an item: e.g., "to know a math-fact, the student must answer the fact correctly from a flash-card within 3 seconds and repeat the feat twice in a row during a session". Then the teacher conducts a baseline assessment. That is, the instructor (1) reviews with the student all items in the larger pool (e.g., letters; multiplication math-facts 0-9, etc.) Using the previously developed guidelines for judging mastery, the teacher (2) identifies and (3) records those items that the student already knows at baseline. Then during the intervention, whenever the student masters an additional item, the teacher logs the item and date acquired. Over time, this log becomes a cumulative, date-stamped record of items acquired by the student. A tutorial on setting up and using a cumulative mastery log is presented elsewhere in this handout (How To: Use the Cumulative Mastery Log to Record Progress in the Acquisition Stage of Learning) along with a sample form. Jim Wright, Presenter www.interventioncentral.org 10 11 2. Academics: Fluency in Basic Skills What to assess: When a student has acquired basic academic skills, the next goal is often to build fluency in those skills. Examples of fluency goals are increasing a student's oral reading speed and working toward automatic recall of math-facts. In this fluency stage of learning, the instructor's measurement objective is to continue to monitor accuracy while also tracking increasing speed of performance. How to assess and where to find materials: Curriculum-based measurement. A very useful way to assess a student's growing fluency (as well as accuracy) in foundation academic skills is via curriculum-based measurement (CBM) -- a family of quick assessments of basic academic skills. While CBM covers a wide range of different assessments, all are brief; timed; use standard procedures to prepare materials, administer, and score; and include decision rules to help educators to make appropriate instructional decisions (Hosp, Hosp & Howell, 2007). Examples of CBM include oral reading fluency (1-minute passages that the student reads aloud) and math computation (2-minute math-fact worksheets with the student receiving credit for number of digits computed correctly). 3. Academics: Complex Skills What to assess: Teachers often find that they must evaluate a student on higher-level academic skills that are multi-dimensional and complex (Moskal, 2000). For example, the Common Core ELA Standard for grade 5speaking and listening (CCSSELA.5.SL.1) sets the expectation that, in collaborative discussions, the student will come prepared, participate, engage in appropriate turn-taking and follow other discussion rules, etc. Similarly, a standard for grade 4 writing (CCSSELA.4.W.1) presents as a goal that the student will write an opinion essay supporting a specific point of view that includes specific elements such as introductory and concluding statements and supporting details. In both examples, a student may show evidence of at least partial fulfillment of some elements within the standard. So teachers need a flexible evaluation format for rating complex academic skills, one that can handle several dimensions simultaneously, while defining for each dimension a sliding-scale, or continuum, for rating success. How to assess and where to find materials: Rubrics. Rubrics are well-suited for measuring a student on complex tasks. In a rubric, the teacher defines the categories that make up the important dimensions of a task, develops exemplars representing mastery for each dimension, and creates a rating scale to be used in evaluating a particular student's work for each dimension (Schafer, Swanson, Bene', & Newberry, 2001). A detailed description of how to create rubrics for classroom use can be found elsewhere in this handout (How To: Use Rubrics in Student Assessment ) on student assessment. Jim Wright, Presenter www.interventioncentral.org 11 12 4. Academics: Survival Skills What to assess: Academic survival skills are those global 'academic enablers'--such as time management, study skills, homework completion, note-taking--required to support a strong academic performance (DiPerna, 2006). How to assess and where to find materials: Academic survival skills checklists. A global academic survival skill (e.g., study skills) can be made measureable by dividing that overarching category into specific, observable component sub-skills (e.g., maintains clear work space for study; creates a study schedule; allocates adequate time each day for study) to create a checklist. Each element of that checklist can then be verified through direct observation, student interview, and/or examination of student work products. A series of academic survival skills checklists appears elsewhere in this handout (How To: Use Checklists to Measure Academic Survival Skills) on student assessment. Teachers can also create their own customized checklists using a free online application, the Academic Survival Skills Checklist Maker: http://www.interventioncentral.org/teacher-resources/student-academic-success-strategies-checklist-maker 5. Behaviors What to assess: Classroom behaviors are specific, observable behaviors that relate to such categories as general conduct (e.g., remaining in seat, calling out), compliance (e.g., following teacher directives); and academic readiness and engagement (e.g., paying attention to the teacher during a lesson, completing independent seatwork, bringing work materials to class). How to assess and where to find materials: Behavior report card. A behavior report card is a type of rating scale that the teacher fills out on a regular basis-e.g., daily-- to rate targeted student behaviors (Riley-Tillman, Chafouleas, & Briesch, 2007). Behavior report cards have several advantages: They are quick to complete, can be customized by the teacher to measure any observable behavior, and are an excellent vehicle for communicating classroom behavioral expectations to students and parents. A sample behavior report card (RTI Daily Behavior Report: Guidelines for Use) appears elsewhere in this handout. Teachers can create their own behavior report cards using the Behavior Report Card Maker, a free online application: http://www.interventioncentral.org/teacher-resources/behavior-rating-scales-report-card-maker Frequency count. In a frequency count, the teacher keeps count of the number of times that the student engages in a target behavior (e.g., number of call-outs; episodes of non-compliance with teacher requests) during an observation period. If frequency-count data are collected across multiple observation periods of the same duration, the teacher can directly compare the data across those observations to look for trends of improvement. A sample observation sheet for collecting frequent-count data (Student Self-Monitoring: Frequency Count) appears later in this handout. Jim Wright, Presenter www.interventioncentral.org 12 13 6. Homework What to assess: Homework can be evaluated in a number of ways. Depending on the nature of the student's presenting problem(s), the teacher may use one or more of the data sources below to track homework timeliness, completion, accuracy, and/or quality. How to assess and where to find materials: Existing data. If the teacher's focus is on getting homework turned in reliably and on time, that instructor can use existing data, such as gradebook information about homework submission, to monitor this intervention goal. Quality: Percentage of work attempted/grade . If the teacher is monitoring the quality of the submitted homework, two simple but useful metrics are (1) an estimate of the amount of work attempted (presented as a percentage of the entire assignment) and (2) homework grades. Quality: Rubric. Because some homework assignments (e.g., term paper; PowerPoint presentation) are complex and must be rated across several dimensions, the teacher may choose the rubric as an evaluation tool. A detailed description of how to create rubrics for classroom use can be found elsewhere in this handout. References DiPerna, J. C. (2006). Academic enablers and student achievement: Implications for assessment and intervention services in the schools. Psychology in the Schools, 43, 7-17. Hosp, M.K., Hosp, J. L., & Howell, K. W. (2007). The ABCs of CBM. New York: Guilford. Moskal, Barbara M. (2000). Scoring rubrics: what, when and how?. Practical Assessment, Research & Evaluation, 7(3). Retrieved June 3, 2013 from http://PAREonline.net/getvn.asp?v=7&n=3 Riley-Tillman, T. C., Chafouleas, S. M., & Briesch, A. M. (2007). A school practitioner's guide to using daily behavior report cards to monitor student behavior. Psychology in the Schools, 44(1), 77-89. Schafer, W. D., Swanson, G., Bene', N., & Newberry, G. (2001). Effects of teacher knowledge of rubrics on student achievement in four content areas. Applied Measurement in Education, 12(2), 151-170. Witt, J. C., VanDerHeyden, A. M., & Gilbertson, D. (2004). Troubleshooting behavioral interventions. A systematic process for finding and eliminating problems. School Psychology Review, 33, 363-383. Jim Wright, Presenter www.interventioncentral.org 13 14 How To: Use the Cumulative Mastery Log to Record Progress in the Acquisition Stage of Learning During academic interventions in which the student is newly learning a fixed set of academic items (e.g., math facts, spelling words, sight words, vocabulary terms), the instructor can conveniently track the impact of the intervention by recording and dating mastered items in a cumulative log. First, the instructor defines the set of academic items to be taught or reviewed during the intervention (e.g., basic multiplication facts from 1-12; pre-primer sight-word list; vocabulary terms for a biology course). Next, the instructor sets criteria for judging when the student has mastered a particular item from the academic item set. (Example: “A math fact is considered mastered when the student successfully answers that math-fact flashcard within 3 seconds on three successive occasions during a session and repeats this performance without error at the next session.”). To collect baseline information, the instructor initially reviews all items from the academic-item set with the student-and records which items the student already knows. Then, throughout the intervention, the instructor logs and dates any additional items that the student masters. The Cumulative Mastery Log that appears on the following pages structures the task of setting up and using a mastery log to track the cumulative results of an academic intervention. Example: Mrs. Ostrowski, a 1st-grade teacher, decides to provide additional intervention support for Jonah, a student in her class who needs to work on sight-word recognition using a first-grade word list. Definition of mastery. Mrs. Ostrowski defines mastery for sight words as follows: "When shown a sight word, the student will correctly read that word aloud within 3 seconds, will read the word correctly at least 3 times in a row with no errors in a single session, and will repeat this performance in the next session." Baseline data collection. Before starting an intervention, the teacher inventories and records Jonah’s baseline skills by reviewing the 41-item first-grade word list. As seen above, the teacher's definition of mastery of sightwords requires that a word cannot be counted as 'known' until the student reads it correctly multiple times across 2 sessions--so the baseline phase also takes 2 sessions to complete. The teacher finds that Jonah can read 21 of the 41 words correctly at baseline. Intervention goal. The teacher sets as an intervention goal that Jonah will master all remaining items –20 sight-words—within three weeks. Cumulative progress-monitoring. Mrs. Ostrowski then begins the daily intervention: incremental rehearsal of letters using flashcards (Joseph, 2006). Whenever Jonah is able to name a additional previously unknown word from the sight-word list, the teacher records and dates that item in her cumulative mastery log. References Joseph, L.M. (2006). Incremental rehearsal: A flashcard drill technique for increasing retention of reading words. The Reading Teacher, 59, 803-807. Jim Wright, Presenter www.interventioncentral.org 14 15 Academic Skills: Cumulative Mastery Log Student: ____________________________________ School Yr: ______ Classroom/Course: _________________ Academic Item Set: Define the set of academic items to be measured (e.g., basic multiplication facts from 1-12; grade 1 sightword list; vocabulary terms for biology course): ______________________________________________________________________________________________________ ______________________________________________________________________________________________________ Criteria for Mastery: Describe the criteria for judging when the student has mastered a particular item from the academic item set. (Example: “A math fact is considered mastered when the student successfully answers that math-fact flashcard within 3 seconds on three successive occasions during a session and repeats this performance without error at the next session.”): ______________________________________________________________________________________________________ ______________________________________________________________________________________________________ Baseline Skills Inventory: Prior to beginning the intervention, inventory the student’s current level of mastery of the skill being measured. (NOTE: Apply the ‘criteria for mastery’ guidelines written above when completing the baseline skills inventory.) Person completing the inventory: __________________________________________ Date: _____/_____/_______ Item 1: _________________________ Item 11: _________________________ Item 21: _________________________ Item 2: _________________________ Item 12: _________________________ Item 22: _________________________ Item 3: _________________________ Item 13: _________________________ Item 23: _________________________ Item 4: _________________________ Item 14: _________________________ Item 24: _________________________ Item 5: _________________________ Item 15: _________________________ Item 25: _________________________ Item 6: _________________________ Item 16: _________________________ Item 26: _________________________ Item 7: _________________________ Item 17: _________________________ Item 27: _________________________ Item 8: _________________________ Item 18: _________________________ Item 28: _________________________ Item 9: _________________________ Item 19: _________________________ Item 29: _________________________ Item 10: _________________________ Item 20: _________________________ Item 30: _________________________ Jim Wright, Presenter www.interventioncentral.org 15 16 Academic Intervention: Cumulative Mastery Log Student: ____________________________________ School Yr: ______ Classroom/Course: _________________ Cumulative Mastery Log: During the intervention, log each mastered item below with date of mastery. NOTE: Be sure to use the ‘criteria for mastery’ defined on the first page of this form when judging whether the student has mastered a particular item. Item 1: ___________________________ Date: ___/___/___ Item 21: __________________________ Date: ___/___/___ Item 2: ___________________________ Date: ___/___/___ Item 22: __________________________ Date: ___/___/___ Item 3: ___________________________ Date: ___/___/___ Item 23: __________________________ Date: ___/___/___ Item 4: ___________________________ Date: ___/___/___ Item 24: __________________________ Date: ___/___/___ Item 5: ___________________________ Date: ___/___/___ Item 25: __________________________ Date: ___/___/___ Item 6: ___________________________ Date: ___/___/___ Item 26: __________________________ Date: ___/___/___ Item 7: ___________________________ Date: ___/___/___ Item 27: __________________________ Date: ___/___/___ Item 8: ___________________________ Date: ___/___/___ Item 28: __________________________ Date: ___/___/___ Item 9: ___________________________ Date: ___/___/___ Item 29: __________________________ Date: ___/___/___ Item 10: __________________________ Date: ___/___/___ Item 30: __________________________ Date: ___/___/___ Item 11: __________________________ Date: ___/___/___ Item 31: __________________________ Date: ___/___/___ Item 12: __________________________ Date: ___/___/___ Item 32: __________________________ Date: ___/___/___ Item 13: __________________________ Date: ___/___/___ Item 33: __________________________ Date: ___/___/___ Item 14: __________________________ Date: ___/___/___ Item 34: __________________________ Date: ___/___/___ Item 15: __________________________ Date: ___/___/___ Item 35: __________________________ Date: ___/___/___ Item 16: __________________________ Date: ___/___/___ Item 36: __________________________ Date: ___/___/___ Item 17: __________________________ Date: ___/___/___ Item 37: __________________________ Date: ___/___/___ Item 18: __________________________ Date: ___/___/___ Item 38: __________________________ Date: ___/___/___ Item 19: __________________________ Date: ___/___/___ Item 39: __________________________ Date: ___/___/___ Item 20: __________________________ Date: ___/___/___ Item 40: __________________________ Date: ___/___/___ Jim Wright, Presenter www.interventioncentral.org 16 17 ‘How the Common Core Works’ Series © 2013 Jim Wright www.interventioncentral.org 1 How To: Use Rubrics in Student Assessment When a teacher attempts to judge whether a student has attained a particular Common Core State Standard, the instructor must evaluate some aspect of that student's performance. Such a performance may be observed directly or in the indirect form of work products or other artifacts. Some types of schoolwork easily lend themselves to a simple quantitative scoring approach: for example, a solution to a math computation problem is either correct ('1') or incorrect ('0'). Many types of academic performance, however, are more complex and require that the student master several domains that in sum create a quality product. A research paper, for example, can be judged of high quality only if the writer shows skill in such dimensions as word choice, organization, selection and summary of sources, and use of the writing-revising process-among others. Rubrics are a useful classroom method for evaluating complex, multi-dimensional tasks. In education, a widely used type of rubric is the analytic rubric (Moskal, 2000). To develop an analytic rubric, the teacher first describes the global performance task to be assessed. The teacher then defines the categories that make up the important dimensions of that task, develops exemplars representing mastery for each dimension, and creates a rating scale to be used in evaluating a particular student's work for each dimension (Schafer, Swanson, Bene', & Newberry, 2001). Rubrics share similarities with checklists as observational instruments to measure academic performance. A checklist, though, is optimal for binary 'yes/no' situations when the instructor is simply confirming that an element of student performance or work product is either adequate or inadequate--e.g., the student's essay includes a title page/ contains at least 5 paragraphs/ includes 4 research sources. A rubric is the measure of choice when a dimension of academic performance can vary widely in quality from student to student--e.g., the organization of an essay or evidence of preparation for an oral presentation (Allen, 2004). Rubrics have a number of advantages as a classroom assessment tool (Allen, 2004). They allow teachers to develop objective and consistent scoring criteria for complex student tasks, thus speeding assessment and improving the reliability of the evaluation. Rubrics can also provide clear guidance of work-expectations before the student begins the academic task, potentially eliminating confusion and increasing student selfconfidence and motivation. Using a rubric, students can also evaluate their own work, helping them to internalize high standards of excellence and boosting motivation further via immediate performance feedback. As mentioned earlier, rubrics are also criterion-referenced: they set an absolute standard against which all students are to be assessed. In light of the fact that many schools have adopted the expectation that all learners will attain the Common Core State Standards, rubrics are a helpful classroom tool to evaluate on an ongoing basis whether specific students are on track to attain these ambitious learning goals. Creating a Rubric in 4 Steps. Here are the steps to constructing a teacher-made analytic rubric (Allen, 2004; Moskal, 2000): 1. Describe the task. The teacher describes the academic performance task to be evaluated using the rubric. Examples might include an argumentative essay, oral presentation, participation in a discussion group, or conducting and documenting an in-class science experiment. The task description is a straightforward account of what the student is to do (and what product is to be created) but does not include quality indicators. NOTE: The Common Core State Standards contain summaries of academic expectations in English Language Arts and Mathematics tasks that can readily be turned into gradeappropriate rubric task descriptions. Jim Wright, Presenter www.interventioncentral.org 17 18 ‘How the Common Core Works’ Series © 2013 Jim Wright www.interventioncentral.org 2 2. Define the dimensions that make up the task. Next, the important component elements that make up the academic performance task are defined. This step is similar to a task analysis; the teacher lists the important component dimensions that are to be evaluated. For example, a teacher who wants to create a rubric to evaluate short research papers (task) may decide to divide the global writing task into 4 key dimensions: Word Choice, Details, Revision Process, and Use of Sources. 3. Develop a rating scale. The teacher develops a 3-5 level rating scale to evaluate student performance on each of the previously defined dimensions of the rubric. The teacher also devises a plain-English labeling system for the levels: e.g. "Needs work/competent/exemplary"; "Accomplished/average/ developing/beginning". As an option, teachers can include point amounts or point ranges to accompany the rating scale. For example, an instructor may create a rating scale like the following: "Proficient (7-9 pts)/Intermediate (4-6 pts)/Beginning (1-3 pts)" In this rating scheme, each qualitative label is tied to a point range, allowing the instructor discretion regarding the number of points that can be awarded for each dimension. 4. Provide descriptions of each dimension. The teacher writes objective descriptions of student performance on each dimension that match the levels of the rating scale. A rubric for short research papers, for example, includes the dimension Word Choice. The teacher adopts a 3-level rating scale: 'Exemplary', 'Competent', and 'Needs Work'. At the high end of the scale, under 'Exemplary', the teacher describes Word Choice performance as: The essay uses precise language throughout in descriptions and the presentation of ideas. It employs domain-specific vocabulary in most or all instances where appropriate. In contrast, the same teacher describes Word Choice performance at the low end of the scale under 'Needs Work' as: The essay uses general or vague language in descriptions and the presentation of ideas. It seldom or never employs examples of domain-specific vocabulary. Rubric Example: Student Discussion Group. A teacher is interested in assessing students' attainment of the Common Core ELA Speaking and Listening Standard for Grade 5 (CCSSELA.5.SL.1), which outlines expectations for participation in discussion groups. Using this Standard as a starting point, the teacher creates the following analytic rubric with a 3-item scale: Analytic Rubric: 'Student Discussion Group' Example Task: The student will take part in weekly in-class collaborative peer discussions of assigned readings, contributing ideas and responding appropriately to the ideas of others (from CCSSELA.5.SL.1). Dimensions Needs Work (1-3 pts) Competent (4-6 pts) Exemplary (7-9 pts) Has completed the Has completed the Preparation Has not completed the assigned reading(s), brings assigned readings and/or assigned reading(s) and notes of the readings to the brings notes of the does not bring notes of readings to the discussion. discussion, and gives the readings to the evidence of having done discussion.. additional reading/research in the discussion topic. Follows the rules set up for Follows the rules set up for Compliance With Fails to follow the rules the discussion activity. the discussion activity. set up for the discussion Discussion When needed, reminds When assigned a role in activity and/or does not Rules/Roles others to adhere to discussion, adequately adequately carry out the discussion rules. When carries out the responsibilities of an assigned discussion role. responsibilities of that role. assigned a formal role Jim Wright, Presenter www.interventioncentral.org 18 19 ‘How the Common Core Works’ Series © 2013 Jim Wright Contribution to Discussion Does not actively sustain his or her part in the discussion. May pose questions of limited relevance to the discussion topic. May not respond appropriately to the comments of others. www.interventioncentral.org Poses questions relevant to the discussion topic and responds appropriately to the comments of others. Remarks display a willingness to acknowledge the contributions of others in the discussion group, 3 (e.g., discussion leader), fully carries out the responsibilities of that role. Participates fully in the discussion. Poses questions relevant to the discussion topic and responds appropriately to the comments of others. Remarks display a good grasp of the topic and a willingness to acknowledge the contributions of others in the discussion group, Rubrics: Additional Considerations. When developing and using rubrics for student assessment, teachers should keep these additional considerations in mind: 1. Combine rubrics with quantitative academic information. When feasible, consider pairing rubrics with quantitative data to have a more complete picture of academic performance. For example, a teacher working with a reluctant writer develops a rubric to track improvements in the quality of written expression. In addition, though, the instructor charts the word-count for each essay, with the goal of encouraging the student to write longer compositions. 2. When using rubrics, ignore the curve. Traditionally in schools, teachers have often graded on a curve, that is, they have plotted the range of student grade outcomes along a normal curve and awarded only a relative handful of high grades. Rubrics, however, do not fit on a curve, as they are a version of criterion-referenced performance goals that include clear, observable definitions of 'mastery' (Schafer, Swanson, Bene', & Newberry, 2001). It is possible, in fact highly desirable, that most or all students in a class might attain rubric ratings in the 'acceptable' or 'exceptional' range, because they are competing against specific, observable, attainable standards rather than against each other (Allen, 2004). References Allen, M. J. (2004). Assessing academic programs in higher education. Bolton, MA: Anker Publishing. Moskal, Barbara M. (2000). Scoring rubrics: what, when and how?. Practical Assessment, Research & Evaluation, 7(3). Retrieved June 3, 2013 from http://PAREonline.net/getvn.asp?v=7&n=3 Schafer, W. D., Swanson, G., Bene', N., & Newberry, G. (2001). Effects of teacher knowledge of rubrics on student achievement in four content areas. Applied Measurement in Education, 12(2), 151-170. Jim Wright, Presenter www.interventioncentral.org 19 20 ‘Strategies to Teach the Common Core State Standards' Series © 2012 Jim Wright www.interventioncentral.org How To: Use Checklists to Measure Academic Survival Skills Students who hope to achieve success on the ambitious Common Core State Standards must first cultivate a set of general 'academic survival skills' that they can apply to any coursework (DiPerna, 2006). Examples of academic survival skills include the student's ability to study effectively, be organized, and manage time well. When academic survival skills are described in global terms, though, it can be difficult to define them. For example, two teachers may have different understandings about what the term 'study skills' means. A solution is to complete a 'task analysis' of a given global academic-survival skill, dividing that larger skill into a checklist of component subskills (Kazdin, 1989). (Review the set of academic survival skills checklists appearing later in this article for examples of what these component-skills checklists look like.) With a checklist in hand that breaks a global academic survival skill into components, a teacher can judge whether a student possesses those essential building-block strategies that make up a larger global 'survival skills' term. Teachers have access to good sources of information to verify what academic survival skills a student possesses, including direct observation; interviews (of the student, past teacher, or parent); and student work products. TIP: Teachers can access a free web application to create customized student-skill checklists. The Academic Survival Skills Checklist Maker provides a starter set of strategies to address homework, note-taking, organization, study, test-taking, and time management. Teachers can use the application to create and print customized checklists and can also save their checklists online. This application is available at: http://www.interventioncentral.org/tools/academic-survival-skills-checklist-maker Schools can find a number of valuable uses for 'academic survival skills' checklists, including the following: 1. Consistent expectations among teachers. Teachers at a grade level, on an instructional team, or within an instructional department can work together to develop checklists for essential global academic-survival skills. As teachers collaborate to create these checklists, they reach agreement on the essential skills that students need for academic success and can then consistently promote those skills across their classrooms. 2. Proactive student skills training. One excellent use of these checklists is as a classwide student training tool. At the start of the school year, teachers can create checklists for those academic survival skills in which students are weak (e.g., study skills, time management) and use them as tools to train students in specific strategies to remediate these deficiencies. Several instructors working with the same group of students can even pool their efforts so that each teacher might be required to teach a checklist in only a single survival-skill area. 3. Student skills self-check. Teachers can use academic survival-skills checklists to promote student responsibility. Students are provided with master copies of checklists and encouraged to develop their own customized checklists by selecting and editing those strategies likely to work best for them. Instructors can then hold students accountable to consult and use these individualized checklists to expand their repertoire of strategies for managing their own learning. 4. Monitoring progress of academic survival-skills interventions. Often, intervention plans developed for middle and high school students include strategies to address academic survival-skill targets such as homework completion Jim Wright, Presenter www.interventioncentral.org 20 1 21 ‘Strategies to Teach the Common Core State Standards' Series © 2012 Jim Wright www.interventioncentral.org or organization. Checklists are a good way for teachers to measure the student's baseline use of academic survival skills in a targeted area prior to the start of the intervention. Checklists can also be used to calculate a student outcome goal that will signify a successful intervention and to measure (e.g., weekly) the student's progress in using an expanded range of academic survival-skills during the intervention period. For example, a teacher may develop a checklist (like that appearing in Table 1) outlining 11 sub-skills that define her expectations for 'study skills'. Through interview, direct observation, and examination of student work products, the teacher ascertains that the student reliably used 7 of the 11 skills during baseline. She sets the outcome goal that--at the conclusion of a 5-week intervention period--the student will reliably use all 11 of those study sub-skills. Once per week during the intervention, the teacher meets with the student to review the checklist, record which additional study skills-if any--the student is now using, and chart this growth on a simple visual graph. 5. Parent conferences. When teachers meet with parents to discuss student academic concerns, academic survival-skills checklists can serve as a vehicle to define expected student competencies and also to decide what specific school and home supports will most benefit the student. In addition, parents often appreciate receiving copies of these checklists to review with their child at home. When students struggle with global academic survival skills such as study, organization, or time management, those deficits can seem so all-encompassing as to inspire a sense of helplessness. In contrast, targeted and prescriptive checklists (such as those described here) that outline practical strategies to enhance school survival skills can serve as a tool to focus and empower teachers, parents, and students to accomplish the shared goal of turning every student into a effective, self-managing learner. References DiPerna, J. C. (2006). Academic enablers and student achievement: Implications for assessment and intervention services in the schools. Psychology in the Schools, 43, 7-17. Kazdin, A. E. (1989). Behavior modification in applied settings (4th ed.). Pacific Gove, CA: Brooks/Cole. Jim Wright, Presenter www.interventioncentral.org 21 2 22 ‘Strategies to Teach the Common Core State Standards' Series © 2012 Jim Wright www.interventioncentral.org SAMPLE ACADEMIC SURVIVAL SKILLS CHECKLIST: STUDY SKILLS This form includes (1) your selected Academic Survival Skill Checklist items, (2) a column to verify whether the student possesses each survival skill (Y/N), and (3) a column to list the information used to verify each skill (Observation/Interview/Work Product). Academic Survival-Skill Checklist Student Displays Skill? (Y/N) Data Source? (Observation/Interview /Work Product) ❑ MAINTAIN A STUDY SCHEDULE. Maintain a regular (e.g., daily) study schedule with sufficient time set aside to review course content and information. ❑ AVOID DISTRACTERS. When studying, avoid distracters (e.g., cell phone, television, Internet) that can erode study time and divert attention. ❑ CREATE AN ORGANIZED STUDY SPACE. Prepare the study environment by organizing a space and setting out all necessary work materials before beginning study. ❑ SET STUDY GOALS. Prior to a study session, define one or more specific study goals to accomplish (e.g., to review information for an upcoming quiz; to locate key information to include in an essay). ❑ MAKE A STUDY AGENDA. If studying multiple subjects in one session, create a study agenda for that session with a listing of the key information to be reviewed for each subject and the time allocated for that review. ❑ DO THE TOUGH STUDY WORK FIRST. Tackle the most difficult or challenging study objectives first during study sessions, when energy levels and ability to concentrate are at their peak. ❑ VARY ACTIVITIES. Mix up study activities during a study session (e.g., alternating between reading and writing) to maintain engagement and interest. ❑ CHUNK A LARGE STUDY TASK INTO SMALLER UNITS. If studying a large amount of material in a single session, 'chunk' the material into smaller units and take short breaks between each unit to maintain focus. ❑ TEACH CHALLENGING CONTENT. When studying complex or challenging material, Jim Wright, Presenter www.interventioncentral.org 22 3 23 ‘Strategies to Teach the Common Core State Standards' Series © 2012 Jim Wright www.interventioncentral.org assume the role of instructor and attempt to explain or describe the material to a real or imagined listener. Teaching study material is an efficient way to verify understanding. ❑ HIGHLIGHT QUESTIONS. When reviewing notes or completing course readings, use highlighters, margin notes, sticky notes, or other notation methods to flag questions, unknown vocabulary terms, or areas of confusion for later review with teacher or tutor. ❑ SEEK HELP WHEN NEEED. Approach the teacher or tutor for help as needed to answer questions or clear up areas of confusion identified during study sessions. ❑ AVOID CRAM SESSIONS. Stay away from allnight cram sessions before major tests. Cram sessions are ineffective because they are inefficient and often leave students exhausted and unable to perform their best on exams. Instead, distribute study and test-review time across multiple days and consider allocating an upward limit of about 1 hour per study session to maintain focus and energy. Jim Wright, Presenter www.interventioncentral.org 23 4 24 RTI Daily Behavior Report: Guidelines for Use The RTI Daily Behavior Report (RTI-DBR) is a brief form that educators can use to rate student classroom conduct and work-related behaviors on a daily basis. Daily Behavior Reports in general have several advantages that make them idea for use in monitoring student interventions (Chafouleas, Riley-Tillman, & Sugai, 2007): They are familiar and acceptable to most school staff, are a convenient assessment tool for busy teachers, and can be used both to better understand students’ behavioral needs and to track student progress during a classroom intervention. Directions. When finished working with the student each day, the educator responsible for completing the RTI-DBR completes each rating item on the form. There are sufficient rating columns on one form to rate a student each day for an entire instructional week. The rater can also write daily comments on the back of the form. An additional option is for the educator to send a copy of the completed rating form home each week for the student’s parent to review, sign, and return. Tips to Increase the Reliability of Daily Behavior Reports. Daily Behavior Reports can be good sources of teacher information about student behaviors. When an educator’s ratings on Behavior Reports are based solely on subjective impression, however, it is possible that the rater will apply inconsistent standards each day when rating student behaviors (Chafouleas, Riley-Tillman, & Sugai, 2007). This inconsistency in assessment can reduce the usefulness of Daily Behavior Report information. An approach that educators can follow to keep their ratings on the RTI-DBR consistent and objective over time is to come up with specific, objective criteria for rating each behavioral goal. In particular, the rater will want to: Keep in mind student developmental considerations. For example, consider this RTI-DBR item: The student was respectful to the teacher and other adults and complied with their requests in a timely manner. The definition of a student being " respectful to the teacher and other adults” may mean "without throwing a tantrum" for a kindergarten student but mean "without defiant talking-back" for a student in middle school. Tie RTI-DBR ratings to classroom behavioral norms. For each behavioral goal, the teacher may want to think of what the typical classroom norm is for this behavior and assign to the classroom norm a specific number rating. The teacher may decide, for instance, that the target student will earn a rating of 7 ('Usually/Always') each day that the student's compliance with adult requests closely matches that of an 'average' child in the classroom. Reference Chafouleas, S., Riley-Tillman, T. C., & Sugai, G. (2007). School-based behavioral assessment: Informing intervention and instruction. Guilford Press: New York. Jim Wright, Presenter www.interventioncentral.org 24 25 Student Daily Behavior Report Student Name:_________________________________________________ Grade: __________ Person Completing This Report Card: ______________________________________________ Directions: At the end of the school day or class period, rate the student on the behaviors below. Write your ratings into the appropriate box on the right of the page and record the date of each rating. You may also write daily comments about the student’s behavior on the back of this sheet. MON WED THURS TUES FRI __/__/__ __/__/__ __/__/__ __/__/__ __/__/__ Student Behaviors The student got along with classmates and used socially appropriate behaviors. 1 2 3 | 4 5 6 | 7 8 9 Never/Seldom Sometimes Most/All of the Time The student was respectful to the teacher and other adults and complied with their requests in a timely manner. 1 2 3 | 4 5 6 | 7 8 9 Never/Seldom Sometimes Most/All of the Time The student paid attention to teacher instructions and classroom lessons and focused on his/her work assignments. 1 2 3 | 4 5 6 | 7 8 9 Never/Seldom Sometimes Most/All of the Time The student completed and turned in classwork and homework assignments. 0-19% 20-39% 40-59% 60-79% 80-100% (Optional Behavior) ______________________________________ ______________________________________ 1 2 3 | 4 5 6 | 7 8 9 Never/Seldom Sometimes Most/All of the Time Parent Sign-Off (Optional): I have reviewed this Behavior Report Card and discussed it with my child. Parent Signature: ______________________________________ Date: _____________ Jim Wright, Presenter www.interventioncentral.org 25 26 Daily Behavior Report: Optional Comments Monday--Date: __________ Comments: _________________________________________________________________________ _____________________________________________________________________________________ _____________________________________________________________________________________ Tuesday-- Date: __________ Comments: _________________________________________________________________________ _____________________________________________________________________________________ _____________________________________________________________________________________ Wednesday-- Date: __________ Comments: _________________________________________________________________________ _____________________________________________________________________________________ _____________________________________________________________________________________ Thursday-- Date: __________ Comments: _________________________________________________________________________ _____________________________________________________________________________________ _____________________________________________________________________________________ Friday-- Date: __________ Comments: _________________________________________________________________________ _____________________________________________________________________________________ _____________________________________________________________________________________ Jim Wright, Presenter www.interventioncentral.org 26 27 Student Daily Behavior Report: Progress-Monitoring Chart Directions: Plot daily teacher DBRC ratings and summarize notable teacher comments on the progress-monitoring charts below. Student Name: Start Date: Wk 1: ___ / ___ / ___Wk 2: ___ / ___ / ___ Wk 3: ___ / ___ / ___Wk 4: ___ / ___ / ___ M T W Th F M T W Th F M T W Th F M T W Th F The student got along with classmates and used socially appropriate behaviors. 9 Usually/Always 8 7 6 Sometimes 5 4 3 Never/Seldom 2 9 8 7 6 5 4 3 2 1 9 8 Usually/Always 7 6 5 Sometimes 4 3 2 Never/Seldom 1 M T W Th F M T W Th F 1 M T W Th F M T W Th F The student was respectful to the teacher and other adults and complied with their requests in a timely manner. 9 Usually/Always 8 7 6 Sometimes 5 4 3 Never/Seldom 2 9 8 7 6 5 4 3 2 1 9 8 Usually/Always 7 6 5 Sometimes 4 3 2 Never/Seldom 1 M T W Th F M T W Th F 1 M T W Th F M T W Th F The student paid attention to teacher instructions and classroom lessons and focused on his/her work assignments. 9 Usually/Always 8 7 6 Sometimes 5 4 3 Never/Seldom 2 9 8 7 6 5 4 3 2 1 1 M T W Th F Jim Wright, Presenter 9 8 Usually/Always 7 6 5 Sometimes 4 3 2 Never/Seldom M T W Th F 1 M T W Th F www.interventioncentral.org M T W Th F 27 28 Student Name: Start Date: Wk 1: ___ / ___ / ___Wk 2: ___ / ___ / ___ Wk 3: ___ / ___ / ___Wk 4: ___ / ___ / ___ M T W Th F M T W Th F M T W Th F M T W Th F The student completed and turned the following percentage of classwork and homework assignments. 100 % 80% 100 % 80% 100 % 80% 60% 60% 60% 40% 40% 40% 20% 20% 20% 0 % M T W Th F 0 M T W Th F % M T W Th F 0 % M T W Th F [Optional Behavior]: _______________________________________________________ ________________________________________________________________________ 9 Usually/Always 8 7 6 Sometimes 5 4 3 Never/Seldom 2 9 8 7 6 5 4 3 2 1 9 8 Usually/Always 7 6 5 Sometimes 4 3 2 Never/Seldom 1 M T W Th F M T W Th F 1 M T W Th F M T W Th F Summary of Significant Teacher Comments: Date: ____ Comment: _____________________________________________________________ Date: ____ Comment: _____________________________________________________________ Date: ____ Comment: _____________________________________________________________ Date: ____ Comment: _____________________________________________________________ Jim Wright, Presenter www.interventioncentral.org 28 29 Student Name: _______________________ Grade/Classroom: __________________ ‘How the Common Core Works’ Series © 2013 Jim Wright www.interventioncentral.org 1 Student Self-Monitoring: Frequency Count A frequency count is a recording of the number of times that a you engaged in a behavior during a specific time-period (e. g., during a class period). Frequency counts can be used to track behaviors that you want to increase or decrease. How to Use This Frequency-Count Form. With this frequency count form, you record each occurrence of the behavior with a tally-mark ('/'). At the end of the time-period, you add up the tally-marks to get a total sum of behaviors for that observation session. How to Set Up the Frequency-Count Form: Follow these steps to prepare the frequency-count form: Define the Target Frequency-Count Behavior. In the space below, describe the behavior that you will measure using a frequency count. (Here are some examples: "leaving my seat without teacher permission", "completing a math problem", "requesting teacher help", "talking with other students about off-task topics"): Target Behavior to Measure: ___________________________________________________________________ Choose a Schedule for Conducting the Frequency Count. Decide when you will use the frequency-count form to track the target behavior: I plan to conduct the frequency count at the following time(s) and/or during the following activitie(s): __________________________________________________________________________________________. Tally Box: Write a mark ('/') in this box each time the target Total Behaviors behavior occurs: for Session 1 > Date: ___/___/___ 2 Tally Box: Write a mark ('/') in this box each time the target behavior occurs: > Date: ___/___/___ 3 Tally Box: Write a mark ('/') in this box each time the target behavior occurs: Tally Box: Write a mark ('/') in this box each time the target behavior occurs: Tally Box: Write a mark ('/') in this box each time the target behavior occurs: Total Behaviors for Session > Date: ___/___/___ Jim Wright, Presenter Total Behaviors for Session > Date: ___/___/___ 5 Total Behaviors for Session > Date: ___/___/___ 4 Total Behaviors for Session www.interventioncentral.org 29 30 How To: Set Off-Level Academic Goals for Reading Fluency Students with significant deficits in reading fluency can present particular challenges as teachers attempt to match them to appropriate academic interventions. Often, these more intensive interventions are ‘off-level’; that is, they target academic skills that are well below the student’s grade placement. If that student has significant academic delays , it might be a mistake, however, to measure the student using only assessments from the student’s grade of record. The problem with monitoring the progress of an off-level student using only assessments from the current grade level is that these assessments could prove so difficult that they fail to show the true gains that the student is making on the off-level intervention. For students with significant academic delays, then, the school must follow sensible and consistent guidelines for matching those students to appropriate supplemental off-level interventions, for setting performance goals, and for measuring their academic progress that will both benefit the student and accurately reflect actual student growth. The remainder of this article describes how the formulation of academic goals in reading fluency for students who receive 'off-level' supplemental interventions will always contain the four universal goal-setting elements described above—but includes special instructions for estimating typical peer performance and expected weekly progress for this group. Below is a 6-step process adapted from Shapiro (2008) for finding the optimal 'off-level' grade for monitoring a student with substantial reading fluency delays, for setting progress-monitoring goals for that student, and for adjusting periodically the student's intervention and monitoring to reflect growth in student skills: 1. Obtain Research-Derived Academic Screening Norms With Percentile Cut-Points. The process of finding a student’s appropriate off-level placement in academic intervention begins with the school selecting a set of research-derived academic screening norms. These norms should include values for fall, winter, and spring of each grade and should be broken down into percentile cut-offs (e.g., norms at the 10th percentile, 25th percentile, 50th percentile, etc.). Commercially available screening packages such as AIMSweb (http://www.aimsweb.com) provide such norms. Or schools can go to other sources to obtain research norms with percentile cut-points for reading fluency (e.g., Tindal & Hasbrouck, 2005; EasyCBM, 2010) and additional academic areas (e.g., EasyCBM, 2010). Case Example: Mrs. Chandler is a 4th-grade teacher in a school whose district has adopted AIMSweb literacy screening tools. The district selected AIMSweb in part because the product includes national norms spanning elementary and middle-school grades that are divided into percentile cut-offs at each grade level. 2. Determine Cut-Points on Research Norms That Indicate Optimal Instructional Placement. Research norms with percentile cut-offs are essential for deciding a student’s appropriate instructional match for supplemental intervention. When reviewing its research-derived screening norms, the school sets percentile cut-offs that designate appropriate instructional placement and mastery at each grade level. Shapiro (2008) recommends that, when consulting research norms at any grade level: the 25th percentile serve as the cut-point for determining that a student has the minimum academic skills needed to experience success in that material. (Please note, though, that norms from other popular academic screening tools –e.g., easyCBM.com—set the 20th percentile as the minimum-skills cut-point.) Jim Wright, Presenter www.interventioncentral.org 30 31 the 50th percentile should serve as the cut-point for defining that the student has attained ‘mastery’ on the grade-level academic skill. Case Example: Using the AIMSweb norms, Mrs. Chandler's school decides that when assessed on literacy screening tools at any grade level, a student will be considered as falling within the instructional range if he or she performs within the 25th to 49th percentile and as having achieved mastery if he or she performs at or above the 50th percentile. 3. Find the Target Student's Optimal 'Off-Level' Instructional Match Through a ‘Survey-Level’ Assessment. The school must next find the struggling student’s appropriate ‘instructional match’—the level of task difficulty that will allow the student to experience sufficient success on off-level interventions while also ensuring a monitoring plan that can accurately track the student’s true growth on that intervention. The process used to find the student’s instructional match is called a ‘survey-level’ assessment. The school administers to the target student a series of standardized curriculum-based measures (CBMs) in the area of academic concern. These CBMs start at the level of the student’s current grade placement and work downward, testing the student at successively earlier grade levels. For each grade-level CBM administered, the teacher scores that 'off-level' CBM and compares the student results to research norms. If the student performs at or above the 25th percentile with materials drawn from a particular 'off-level' grade, the teacher judges that the student is likely to experience a good match using intervention and assessment materials at this grade level—and the Survey Level Assessment ends here. However, if the student performs below the 25th percentile, it is judged that material at that lower, 'off-level' grade is too challenging for use in monitoring the student's progress on intervention. The teacher instead continues to administer CBMs from successively earlier grade levels, stopping only at the grade-level at which the student performs at or above the 25th percentile according to the research norms. Case Example: In January, Mrs. Chandler reviews her classwide reading fluency screening results. She notes that a student who has recently transferred to her classroom, Randy, performed at 35 Words Read Correct (WRC) on the 1-minute AIMSweb Grade 4 fluency probes. Mrs. Chandler consults AIMSweb reading-fluency research norms and finds that a reasonable minimum reading rate for students by winter of grade 4 (25th percentile) is 89 WRC. Because Randy’s reading fluency rate is so far below the grade-level norms (a gap of 54 WRC), his teacher decides to conduct a Survey Level Assessment to find the student’s optimal grade level placement for supplemental reading instruction. On Grade 3-level probes, Randy attains a median score of 48 WRC. The AIMSweb winter norm (25th percentile) for a 3rd grade student is 69 WRC. The student is still in the ‘frustration’ range and the Survey Level Assessment continues. On Grade 2-level probes, Randy attains a median score of 64 WRC. The AIMSweb winter norm (25th percentile) for a 2nd grade student is 53 WRC. Because Randy's Grade 2 WRC score exceeds the 25th percentile cut-point, the student is now in the ‘instructional’ range and the Survey Level Assessment ends. Jim Wright, Presenter www.interventioncentral.org 31 32 4. Determine an 'Off-Level' Progress-Monitoring Goal Based on Norms. To set an intervention progressmonitoring goal, the teacher looks up and uses the academic performance norm for the 50th percentile at the student’s off-level ‘instructional’ grade level previously determined through the Survey Level Assessment. Case Example: To find the progress-monitoring goal for Randy, his teacher Mrs. Chandler looks up the benchmark Words Read Correct (WRC) for the 50th percentile on the winter screening norms at Grade 2 (Randy's off-level ‘instructional’ grade level)—which is 79 WRC. This becomes the progress-monitoring goal for the student. 5. Translate the Student's Long-Term Progress-Monitoring Goal into Weekly Increments. The teacher’s final task before beginning to monitor the student's progress on intervention is to translate the student’s ultimate intervention goal into ‘ambitious but realistic’ weekly increments. A useful method (Shapiro, 2008) for determining weekly growth rates is to start with research-derived growth norms and to then use a ‘multiplier’ to make the expected rate of weekly growth more ambitious. The teacher first looks up the average rate of weekly student growth supplied in the research norms. If available, a good rule of thumb is to use the growth norms for the 50th percentile at the ‘off-level’ grade at which the student is receiving intervention and being monitored. If a screening tool's academic-performance norms do not also include growth norms, schools can compute the 'typical' rate of weekly progress for any grade-level by (1) subtracting the fall screening results (50th percentile) for the off-level grade from the spring screening results (50th percentile) and (2) dividing the difference by 32--representing the typical 32 weeks that separate fall and spring screenings in most schools. The resulting quotient represents 'average' expected rate of student progress per instructional week on that academic screening measure at that grade level. The teacher then multiplies this grade norm for weekly growth by a multiplier whose value falls between 1.5 and 2.0 (Shapiro, 2008). Because the original weekly growth rate represents only a typical rate of academic improvement, this multiplier is used to boost the target student’s weekly growth estimate to a point at which learning is accelerated and the gap separating that student from peers will likely close if the intervention is successful. Case Example: Randy, the 4th-grade student, is to be monitored on intervention at grade 2. Mrs. Chandler finds—using AIMSweb norms—that a typical student in Grade 2 (at the 50th percentile) has a rate of improvement of 1.1 Words Read Correct (WRC) per week. Based on her own judgment, Mrs. Chandler selects 1.8 as her multiplier—although any figure between 1.5 and 2.0 would be acceptable. She multiplies the 1.1 WRC figure by 1.8 to obtain an ambitious weekly growth goal for Randy of about 2.0 additional WRCs. Randy’s ultimate 'graduation goal' that would allow him to advance beyond grade 2 as his supplemental intervention level is 79 WRC (the 50th percentile norm for grade 2). During the Survey Level Assessment, Randy was found to read 64 WRC at the 2nd grade level. There is a 15-WRC gap to be closed to get Randy to his goal. At a growth rate of 2 additional WRC per week during the intervention, Randy should close the gap within about 8 instructional weeks. Jim Wright, Presenter www.interventioncentral.org 32 33 6. Advance the Student to Higher Grade Levels for Intervention & Progress-Monitoring. The teacher monitors the student’s growth in the target academic skill at least once per week (twice per week is ideal). When, according to the research norms for his or her off-level grade, the student’s performance exceeds the 50th percentile, this triggers a teacher reassessment of the student’s academic skills at the next higher grade, again using the research-based norms. If the student performs at or above the 25th percentile on probes from that next grade level, the teacher can move the student up with confidence and begin to monitor at the higher grade level. The process repeats until the student eventually closes the gap with peers and is being monitored at grade of placement. Case Example: His teacher, Ms. Chandler, notes that after 7 weeks of intervention, Randy is now reading 82 Words Read Correct (WRC)—exceeding the 79 WRC for the 50th percentile of students in Grade 2 (winter norms). So Mrs. Chandler assesses Randy on AIMSweb reading fluency probes for Grade 3 and finds that he reads on average 72 WRC —exceeding the 3rd grade 25th percentile cut-off of 69 WRC. Therefore, Randy is advanced to Grade 3 progress-monitoring and his intervention materials are adjusted accordingly. Recommendations for using this approach: Research norms for student performance and academic growth are the ‘gold standard’ in off-level goal-setting, as they provide fixed, external standards for proficiency that are not influenced by variable levels of student skill in local classrooms. When setting academic goals for struggling students, schools should use research norms whenever they are available. In particular, research norms should be used for high-stakes RTI cases that may be referred at some point to the Special Education Eligibility Team. References EasyCBM: (2010). Interpreting the EasyCBM progress monitoring test results. Retrieved from http://www.easycbm.com/static/files/pdfs/info/ProgMonScoreInterpretation.pdf Hasbrouck, J. & Tindal, G. (2005).Oral reading fluency: 90 years of measurement [Technical report #33]. Eugene, OR: University of Oregon. Jim Wright, Presenter www.interventioncentral.org 33 34 Shapiro, E. S. (2008). Best practices in setting progress-monitoring monitoring goals for academic skill improvement. In A. Thomas & J. Grimes (Eds.), Best practices in school psychology V (pp. 141-157). Bethesda, MD: National Association of School Psychologists. Curriculum-Based Measurement: Reading CBM-Oral Reading Fluency assesses general reading performance, as well as reading speed. In an oral reading fluency assessment, the student reads aloud from a passage for 1 minute. The reading sample is scored for words read correctly (WRC) and errors. Grade Percentile Winter Oral Reading Fluency Norms Weekly Growth Rates (AIMSweb, 2007) (AIMSweb, 2007) 2 3 4 50th% 79 1.1 25th% 53 1.1 10th% 25 0.8 50th% 98 0.9 25th% 69 0.9 10th% 42 0.6 50th% 114 0.8 25th% 89 0.8 10th% 62 0.7 Source: AimsWeb National Norms Table. (2007). Jim Wright, Presenter www.interventioncentral.org 34 35 ‘How the Common Core Works’ Series © 2013 Jim Wright 1 www.interventioncentral.org How To: Measure Letter Knowledge With CBM: Letter Name Fluency (LNF) & Letter Sound Fluency (LSF) Teachers have always known that letter knowledge is a pre-requisite to the acquisition of reading skills. Before students can decode text, they must be fluent in recognizing both letters and their sounds. And recent research confirms that children's ability in primary grades to identify letter names and sounds is a strong predictor of reading readiness and future reading success (Ritchey & Speece, 2006). Efficient, curriculum-based assessments to track student performance and growth in letter knowledge are Letter Name Fluency (LNF) and Letter Sound Fluency (LSF). In each assessment, the teacher administers timed 1-minute fluency probes (assessments) to children and compares the results to research norms to determine whether students are under-performing and therefore at risk for future academic problems. These two measures are time-efficient and the perfect means to track a student's progress in letter-skills instruction or intervention. CBM-Letter Name Fluency/Letter Sound Fluency: How to Access Resources. Teachers seeking to screen their students in foundation letter-knowledge skills can obtain these free CBM-LNF/LSF assessment resources: (1) materials for assessment, (2) guidelines for administration and scoring, and (3) research-based norms. Materials for assessment. Schools can create free mixed-case random-letter lists by accessing the Letter Fluency Generator, an online application: http://www.interventioncentral.org/teacher-resources/letter-name-fluency-generator Guidelines for administration and scoring. Instructions for preparing, administering, and scoring CBM-Letter Name Fluency/Letter Sound Fluency assessments appear later in this document: Research-based norms. Two tables, Curriculum Curriculum-Based Measurement: Letter Name Fluency (LNF) and Curriculum-Based Measurement: Letter Sound Fluency (LSF), are included in this document. The norms include fluency benchmarks and growth norms for grades K-2 (Riverside, 2013). References Ritchey, K. D., & Speece, D. L. (2006). From letter names to word reading: The nascent role of sublexical fluency. Contemporary Educational Psychology, 31, 301-327. Jim Wright, Presenter www.interventioncentral.org 35 36 ‘How the Common Core Works’ Series © 2013 Jim Wright 2 www.interventioncentral.org Curriculum-Based Measurement-Letter Name Fluency (LNF)/Letter Sound Fluency (LSF): Guidelines for Use CBM-LNF/LSF: Description In the CBM-Letter Name Fluency (LNF) task, the student is given a random list of upper- and lower-case letters and has 1 minute to identify the names of as many letters as possible. In the CBM-Letter Sound Fluency (LSF) task, the student is given a random list of upper- and lower-case letters and has 1 minute to identify as many letter sounds as possible. ----------------------------------------------------------------------------------------------------------------------------------------------------------- Directions for Letter Name Fluency: LNF CBM-Letter Name Fluency: Materials The following materials are needed to administer CBM-LNF probes: Student and examiner copies of random list of upper- and lower-case letters Stopwatch CBM-Letter Name Fluency: Preparation Schools can create free mixed-case random-letter lists by accessing the Letter Fluency Generator, an online application: http://www.interventioncentral.org/teacher-resources/letter-name-fluency-generator CBM-Letter Name Fluency: Directions for Administration (adapted from Hosp, Hosp, & Howell, 2007; Ritchey & Speece, 2006) 1. The examiner sits at a table with the student and gives the student a copy of the randomized letter list. 2. The examiner says: "This list contains letters in mixed-up order. When I say 'begin', read the name of each letter aloud, starting from here [the examiner points to the top left of the page]. Read each letter as I point to it. Try your best and keep reading until I tell you to stop. 3. The examiner says: "Begin", starts the stop-watch, and points to the first letter. 4. As the student reads a letter correctly, the examiner immediately points to the next letter. If the student misreads a letter or hesitates for 3 seconds or longer, the examiner points to the next letter. The examiner does not correct student mistakes or provide the correct letter when the student hesitates. 5. At the end of 1 minute, the examiner stops the stop-watch, says: "Stop", and collects and scores the student letter list. 6. Initial Assessment: If the examiner is assessing the student for the first time, the examiner administers a total of 3 letter lists during the session using the above procedures and takes the median (middle) score as the best estimate of the student's letter naming speed. Progress-Monitoring: If the examiner is monitoring student growth in letter-naming (and has previously collected LNF data), only one letter list is given in the session. CBM-Letter Name Fluency: Practice If the student is not yet familiar with the LNF task, the teacher can administer one or more practice LNF probes (using the administration guidelines above) and provide coaching and feedback as needed until assured that the student fully understands the assessment. Jim Wright, Presenter www.interventioncentral.org 36 37 ‘How the Common Core Works’ Series © 2013 Jim Wright www.interventioncentral.org 3 CBM-Letter Name Fluency: Scoring Guidelines The examiner adds up the total number of correct responses, giving the student credit for each correct letter name. The student does not receive credit for letter sounds or for giving correct letter-name responses after hesitations of 3 seconds or longer. ----------------------------------------------------------------------------------------------------------------------------------------------------------- Directions for Letter Sound Fluency: LSF CBM-Letter Sound Fluency: Materials The following materials are needed to administer CBM-LSF probes: Student and examiner copies of random list of lower-case letters Stopwatch CBM-Letter Sound Fluency: Preparation Schools can create free lower-case random-letter lists by accessing the Letter Fluency Generator, an online application: http://www.interventioncentral.org/teacher-resources/letter-name-fluency-generator CBM-Letter Sound Fluency: Directions for Administration (adapted from Fuchs & Fuchs, n.d.; Hosp, Hosp, & Howell, 2007; Ritchey & Speece, 2006) 1. The examiner sits at a table with the student and gives the student a copy of the randomized letter list. 2. The examiner says: "This list contains letters in mixed-up order. When I say 'begin', say the sound of each letter aloud, starting from here [the examiner points to the top left of the page]. Give the sound of each letter as I point to it. Try your best and keep going until I tell you to stop. 3. The examiner says: "Begin", starts the stop-watch, and points to the first letter. 4. As the student gives a correct letter sound, the examiner immediately points to the next letter. If the student gives an incorrect letter sound or hesitates for 3 seconds or longer, the examiner points to the next letter. The examiner does not correct student mistakes or provide the correct letter sound when the student hesitates. 5. At the end of 1 minute, the examiner stops the stop-watch, says: "Stop", and collects and scores the student letter list. 6. Initial Assessment: If the examiner is assessing the student for the first time, the examiner administers a total of 3 letter lists using the above procedures and takes the median (middle) score as the best estimate of the student's letter sound fluency. Progress-Monitoring: If the examiner is monitoring student growth in letter-sound fluency (and has previously collected LSF data), only one letter list is given. CBM-Letter Sound Fluency: Practice If the student is not yet familiar with the LSF task, the teacher can administer one or more practice LSF probes (using the administration guidelines above) and provide coaching and feedback as needed until assured that the student fully understands the assessment. CBM-Letter Sound Fluency: Scoring Guidelines The examiner adds up the total number of correct responses, giving the student credit for each correct letter sound. Both hard and soft sounds for 'c' and 'g' are acceptable. Only the short version of vowel sounds are acceptable (Fuchs & Fuchs, n.d.). ----------------------------------------------------------------------------------------------------------------------------------------------------------- Jim Wright, Presenter www.interventioncentral.org 37 38 ‘How the Common Core Works’ Series © 2013 Jim Wright www.interventioncentral.org 4 References Fuchs, L. S., & Fuchs, D. (n.d.). Using CBM for progress monitoring. National Center of Student Progress Monitoring. Retrieved from http://www.studentprogress.org/ Hosp, M. K., Hosp, J. L., & Howell, K. W. (2007). The ABC's of CBM: A practical guide to curriculum-based measurement. New York: Guilford Press. Ritchey, K. D., & Speece, D. L. (2006). From letter names to word reading: The nascent role of sublexical fluency. Contemporary Educational Psychology, 31, 301-327. Jim Wright, Presenter www.interventioncentral.org 38 39 ‘How the Common Core Works’ Series © 2013 Jim Wright 5 www.interventioncentral.org Curriculum-Based Measurement: Letter Name Fluency (LNF) Norms (Riverside, 2013)* In the CBM-Letter Name Fluency (LNF) task, the student is given a random list of upper- and lower-case letters and has 1 minute to identify the names of as many letters as possible. Grade Percentile Fall LNF (Riverside, 2013) Winter LNF (Riverside, 2013) K 50%ile 20%ile 10%ile 19 5 2 35 45 22 13 1 50%ile 20%ile 10%ile 40 28 20 56 68 42 49 34 42 Spring LNF (Riverside, 2013) 36 29 Weekly Growth (Calculated across 32 Instructional Wks) 0.81 0.97 0.84 0.88 0.66 0.69 Curriculum-Based Measurement: Letter Sound Fluency (LSF) Norms (Riverside, 2013)* In the CBM-Letter Sound Fluency (LSF) task, the student is given a random list of upper- and lower-case letters and has 1 minute to identify as many letter sounds as possible. Grade Percentile Fall LSF Winter LSF Spring LSF Weekly Growth 0.97 0.69 0.50 (Riverside, 2013) (Riverside, 2013) (Riverside, 2013) K 50%ile 20%ile 10%ile 4 1 0 22 9 5 35 23 16 1 50%ile 20%ile 10%ile 29 18 12 40 46 31 36 27 30 0.53 0.56 0.56 References: Riverside. (2013). Interpreting the easyCBM progress monitoring test results. Rolling Meadows, IL: Author. Retrieved from http://www.easycbm.com/static/files/pdfs/info/ProgMonScoreInterpretation.pdf * Reported Characteristics of Student Sample(s) Used to Compile These Norms: Riverside, 2013: Number of Students Assessed: "An average of 12,000 students per test" (Riverside, 2013; p. 3)/Geographical Location: Nationwide/ Socioeconomic Status: Not reported / Ethnicity of Sample: Not reported/Limited English Proficiency in Sample: Not reported. Jim Wright, Presenter www.interventioncentral.org 39 40 ‘How the Common Core Works’ Series © 2013 Jim Wright www.interventioncentral.org 6 Where to Find Materials: Schools can create free random-letter lists by accessing the Letter Fluency Generator, an online application: http://www.interventioncentral.org/teacher-resources/letter-name-fluency-generator Jim Wright, Presenter www.interventioncentral.org 40 41 ‘How the Common Core Works’ Series © 2013 Jim Wright 1 www.interventioncentral.org How To: Assess Reading Speed With CBM: Oral Reading Fluency Passages A student's accuracy and speed in reading aloud is an obvious and readily observable indicator of that student's reading ability. Reading fluency is an essential component of a student's global reading skills (National Institute of Child Health and Human Development, 2000). Furthermore, up through grade 3, reading fluency is arguably the best predictor of future reading success (Hosp, Hosp, & Howell, 2007). The curriculum-based measure to track student reading speed is termed Oral Reading Fluency (ORF). In CBM-ORF, the student is given a grade-appropriate passage and asked to read aloud for one minute. The examiner marks as incorrect any words that the student misreads or hesitates on for 3 seconds or longer. The passage is then scored for Correctly Read Words (CRW). Although CBM-ORF is simple in format and quick to administer, its results are sensitive to short-term student gains in reading skills and predictive of long-term reading success, making this assessment an ideal progress-monitoring tool for classroom use. CBM-ORF: How to Access Resources. Teachers can access a toolkit of resources for CBM-ORF, including: (1) materials for assessment, (2) guidelines for administration and scoring, and (3) research-based norms. Materials for assessment. DIBELS NEXT: Here are 3 sources for free CBM-ORF materials: DIBELS NEXT: Schools can obtain free ORF passages and ORF benchmarks for grades 1-6 from the DIBELS Next website: http://dibels.org/next.html EasyCBM: The easyCBM website (http://easycbm.com/) has collections of CBM-ORF passages (referred to as 'Passage Fluency') for grades 1-8. Teachers can create a free account on this website to access materials and benchmarks. Schools can also make their own CBM Oral Reading Fluency passages in PDF format based on text typed in by the user using the Reading Fluency Passages Generator, a free online application: http://www.interventioncentral.org/teacher-resources/oral-reading-fluency-passages-generator Guidelines for administration and scoring. Instructions for preparing, administering, and scoring CBM-ORF assessments appear later in this document: Research-based norms. A table, Curriculum-Based Measurement: Oral Reading Fluency Norms, is included in this document. The norms include fluency benchmarks for grades 1-8 and accompanying growth norms (Hasbrouck & Tindal, 2005). References Hasbrouck, J., & Tindal, G. (2005). Oral reading fluency: 90 years of measurement. Eugene, OR: Behavioral Research & Teaching/University of Oregon. Retrieved from http://brt.uoregon.edu Hosp, M.K., Hosp, J. L., & Howell, K. W. (2007). The ABCs of CBM. New York: Guilford. National Institute of Child Health and Human Development. (2000). Report of the National Reading Panel. Teaching children to read: An evidence-based assessment of the scientific research literature on reading and its implications for reading instruction (NIH Publication No. 00-4769). Washington, DC: U.S. Government Printing Office. Jim Wright, Presenter www.interventioncentral.org 41 42 ‘How the Common Core Works’ Series © 2013 Jim Wright 2 www.interventioncentral.org Curriculum-Based Measurement-Oral Reading Fluency (ORF): Guidelines for Use CBM-ORF: Description CBM-ORF measures a student's reading fluency by having that student read aloud for 1 minute from a prepared passage. During the student's reading, the examiner makes note of any reading errors in the passage. Then the examiner scores the passage by calculating the number of words read correctly. CBM-ORF: Materials The following materials are needed to administer a CBM-ORF passage: Student and examiner copies of a CBM-ORF passage (the process for creating ORF passages is described below) Stopwatch CBM-ORF: Preparation When assessing a student's Oral Reading Fluency skills, the examiner chooses 3 grade-appropriate passages. For children in the 1st and 2nd grades, each passage should be at least 150 words long, while passages of at least 250 words should be prepared for older students. Passages selected should not contain too much dialog and should avoid an excessive number of foreign words or phrases. In addition, only prose passages should be used in CBM assessments. Poetry and drama should be avoided because they tend to vary considerably and do not represent the kind of text typically encountered by students. For ease of administration, the instructor will want to prepare examiner and student copies of each passage. Ideally, reading passages should be free of illustrations that may help a child to interpret the content of the text. The examiner copy should have a cumulative word total listed along the right margin of the passage for ease of scoring (see Figure 1). It is strongly recommended that teachers use existing collections of well-constructed, reading passages organized by grade-level when conducting Oral Reading Fluency assessments. Here are 3 sources for free CBM-ORF materials: DIBELS NEXT: Schools can obtain free ORF passages and ORF benchmark norms for grades 1-6 from the DIBELS Next website: http://dibels.org/next.html ------------------------------------------------------------------------------------------------------------------------------------------------------------------------------------------------------- Figure 1: Example of CBM Oral Reading Fluency Probe Examiner Copy Student Copy Summertime! How lovely it was in the country, with 9 Summertime! How lovely it was in the country, with the wheat standing yellow, the oats green, and the hay all 20 the wheat standing yellow, the oats green, and the hay all stacked down in the grassy meadows! And there went the stork 31 stacked down in the grassy meadows! And there went the stork on his long red legs, chattering away in Egyptian, for 41 on his long red legs, chattering away in Egyptian, for he had learned that language from his mother. The fields and 52 he had learned that language from his mother. The fields and ------------------------------------------------------------------------------------------------------------------------------------------------------------------------------------------------------- Jim Wright, Presenter www.interventioncentral.org 42 43 ‘How the Common Core Works’ Series © 2013 Jim Wright 3 www.interventioncentral.org EasyCBM: The easyCBM website (http://easycbm.com/) has collections of CBM-ORF passages (referred to as 'Passage Fluency') for grades 1-8. Teachers can create a free account on this website to access materials and benchmark norms. Schools can also make their own CBM Oral Reading Fluency passages in PDF format based on text typed in by the user using the Reading Fluency Passages Generator, a free online application: http://www.interventioncentral.org/teacher-resources/oral-reading-fluency-passages-generator CBM-ORF: Directions for Administration (Hosp, Hosp, & Howell, 2007; Wright, 2007) 1. The examiner and the student sit across the table from each other. The examiner hands the student the unnumbered copy of the CBM reading passage. The examiner takes the numbered copy of the passage, shielding it from the student's view. 2. The examiner says to the student: "When I say, 'begin', start reading aloud at the top of this page. Read across the page [demonstrate by pointing]. Try to read each word. If you come to a word you don't know, I'll tell it to you. Be sure to do your best reading. Are there any questions? [Pause] Begin." 3. The examiner starts the stopwatch when the student says the first word. If the student does not say the initial word within 3 seconds, the examiner says the word and starts the stopwatch. 4. As the student reads along in the text, the examiner records any errors by marking a slash (/) through the incorrectly read word. If the student hesitates for 3 seconds on any word, the examiner says the word and marks it as an error. 5. At the end of 1 minute, the examiner says, "Stop" and marks the student's concluding place in the text with a bracket ( ] ). 6. Initial Assessment: If the examiner is assessing the student for the first time, the examiner administers a total of 3 reading passages during the session using the above procedures and takes the median (middle) score as the best estimate of the student's oral reading fluency. Progress-Monitoring: If the examiner is monitoring student growth in oral reading fluency (and has previously collected ORF data), only one reading passage is given in the session. CBM-ORF: Directions for Practice If the student is not yet familiar with CBM-Oral Reading Fluency probes, the teacher can administer one or more practice ORF probes (using the administration guidelines above) and provide coaching and feedback as needed until assured that the student fully understands the assessment. CBM-ORF: Scoring Guidelines Reading fluency is calculated by first determining the total words attempted within the timed reading probe and then deducting from that total the number of incorrectly read words. The following scoring rules will aid the instructor in marking the reading probe: Words read correctly are scored as correct: Self-corrected words are counted as correct. Repetitions are counted as correct. Examples of dialectical speech are counted as correct. Inserted words are ignored. Words read to the student by the examiner after 3 seconds are counted as errors. Mispronunciations are counted as errors. Example Jim Wright, Presenter www.interventioncentral.org 43 44 ‘How the Common Core Works’ Series © 2013 Jim Wright www.interventioncentral.org 4 Text: The small gray fox ran to the cover of the trees. Student: "The smill gray fox ran to the cover of the trees." Substitutions are counted as errors. Example Text: When she returned to the house, Grandmother called for Franchesca. Student: "When she returned to the home, Grandmother called for Franchesca.” Omissions are counted as errors. Example Text: Anna could not compete in the last race. Student: "Anna could not in the last race." Transpositions of word-pairs are counted as a single error. Example Text: She looked at the bright, shining face of the sun. Student: "She looked at the shining, bright face of the sun." Computing reading-fluency rate in a single passage The scoring of a reading probe is straightforward. The examiner first determines how many words the reader actually attempted during the 1-minute reading sample. On the completed probe in Figure 2, for instance, the bracket near the end of the text indicates that the student attempted 48 words before his time expired. Next, the examiner counts up the number of errors made by the reader. On this probe, the student committed 4 errors. By deducting the number of errors from the total words attempted, the examiner arrives at the number of correctly read words per minute. This number serves as an estimate of reading fluency, combining as it does the student's speed and accuracy in reading. So by deducting the errors from total words attempted, we find that the child actually read 44 correct words in 1 minute. ------------------------------------------------------------------------------------------------------------------------------------------------------------------------------------------------------Figure 2: Example of a scored reading probe Total Read Words = 48 Errors = 4 Correctly Read Words = 44 ------------------------------------------------------------------------------------------------------------------------------------------------------------------------------------------------------- Accommodating omissions when scoring. . . When a student skips several connected words or even an entire line during a reading probe, that omission creates a special scoring dilemma. An omission, after all, is considered to be a single error of tracking, no matter how many words were skipped at one time. However, if all words omitted in a line were individually counted as errors, the student's error rate would be greatly inflated. The solution is for the examiner to subtract all but one of the words in each omission before computing the total words attempted. Let's see how that score adjustment would work. On the completed probe in Figure 3, the student omitted the text of an entire line while reading aloud. The examiner drew a line through all the connected words skipped by the child in that omitted line of text. Because a total of 11 words were omitted, the examiner drops 10 of those words before calculating the total words attempted. Jim Wright, Presenter www.interventioncentral.org 44 45 ‘How the Common Core Works’ Series © 2013 Jim Wright 5 www.interventioncentral.org When calculating the number of words the child attempted to read, the examiner notes that the child reached word 48 in the passage. Ten words are then deducted from the omitted lines to avoid inflating the error count. The adjusted figure for total words attempted is found to be 38 words. The child committed 5 errors (4 marked by slashes and 1 omission). These errors are subtracted from the revised figure of 38 total words attempted. Therefore, the number of correctly read words in this example would be 33. ------------------------------------------------------------------------------------------------------------------------------------------------------------------------------------------------------- Figure 3: A reading probe marked for words omitted Original Total Read Words = 48 Omission Error: 10 of 11 omitted words deducted from Total Read Words Adjusted Total Read Words =38 Minus 5 errors Equals 33 Correctly Read Words ------------------------------------------------------------------------------------------------------------------------------------------------------------------------------------------------------- References Hosp, M. K., Hosp, J. L., & Howell, K. W. (2007). The ABC's of CBM: A practical guide to curriculum-based measurement. New York: Guilford Press. Wright, J. (2007). The RTI toolkit: A practical guide for schools. Port Chester, NY: National Professional Resources, Inc. Jim Wright, Presenter www.interventioncentral.org 45 46 ‘How the Common Core Works’ Series © 2013 Jim Wright 6 www.interventioncentral.org Curriculum-Based Measurement: Oral Reading Fluency Norms (Hasbrouck & Tindal, 2005)* CBM-Oral Reading Fluency assesses general reading performance (Espin et al., 2010), as well as reading speed. In an oral reading fluency assessment, the student reads aloud from a passage for 1 minute. The reading sample is scored for words read correctly (WRC) and errors. Grade Percentile Fall Oral Reading Fluency (Hasbrouck & Tindal, 2005) Winter Oral Reading Fluency Weekly Growth (Hasbrouck & Tindal, 2005) Spring Oral Reading Fluency (Hasbrouck & Tindal, 2005) 23 12 6 53 28 15 1.9 1.0 0.6 (Hasbrouck & Tindal, 2005) 1 50%ile 25%ile 10%ile 2 50%ile 25%ile 10%ile 51 25 11 72 89 42 61 18 31 3 50%ile 25%ile 10%ile 71 44 21 92 62 78 36 48 107 1.1 1.1 0.8 4 50%ile 25%ile 10%ile 94 68 45 112 87 98 61 72 123 0.9 0.9 0.8 5 50%ile 25%ile 10%ile 110 85 61 127 139 99 74 83 6 50%ile 25%ile 10%ile 127 98 68 140 150 111 82 93 7 50%ile 25%ile 10%ile 128 102 79 136 150 109 123 88 98 0.7 0.7 0.6 8 50%ile 25%ile 10%ile 133 106 77 146 151 115 124 84 97 0.6 0.6 0.6 Jim Wright, Presenter www.interventioncentral.org 1.2 1.1 0.6 109 0.9 0.8 0.7 122 0.7 0.8 0.8 46 47 ‘How the Common Core Works’ Series © 2013 Jim Wright www.interventioncentral.org 7 References: Espin, C. Wallace, T., Lembke, E., Campbell, H., & Long, J. D. (2010). Creating a progress-monitoring system in reading for middle-school students: Tracking progress toward meeting high-stakes standards. Learning Disabilities Research & Practice, 25(2), 60-75. Hasbrouck, J., & Tindal, G. (2005). Oral reading fluency: 90 years of measurement. Eugene, OR: Behavioral Research & Teaching/University of Oregon. Retrieved from http://brt.uoregon.edu *Reported Characteristics of Student Sample(s) Used to Compile These Norms: Hasbrouck & Tindal, 2005: Number of Students Assessed: 88167 students in fall norming;97237 students in winter norming; 112118 students in spring norming/Geographical Location: Nationwide/ Socioeconomic Status: Not reported / Ethnicity of Sample: Not reported/Limited English Proficiency in Sample: Not reported. Where to Find Materials: Here are 3 sources for free CBM-Oral Reading Fluency materials: DIBELS NEXT: Schools can obtain free ORF passages and ORF benchmarks for grades 1-6 from the DIBELS Next website: http://dibels.org/next.html EasyCBM: The easyCBM website (http://easycbm.com/) has collections of CBM-ORF passages (referred to as 'Passage Fluency') for grades 1-8. Teachers can create a free account on this website to access materials and benchmarks. Schools can also make their own CBM Oral Reading Fluency passages in PDF format based on text typed in by the user using the Reading Fluency Passages Generator, a free online application: http://www.interventioncentral.org/teacher-resources/oral-reading-fluency-passages-generator Jim Wright, Presenter www.interventioncentral.org 47 48 ‘How the Common Core Works’ Series © 2013 Jim Wright 1 www.interventioncentral.org How To: Assess Reading Comprehension With CBM: Maze Passages A student's ability to comprehend text requires the presence of a bundle of component reading skills, including strong reading vocabulary, fluent decoding, and use of efficient and effective 'fix-up' strategies when encountering unknown words (National Institute of Child Health and Human Development, 2000). Motivation and attentiveness also play important roles in reading comprehension. While a student's understanding of text depends on many factors, however, teachers need a simple, time-efficient method both to screen students for reading-comprehension problems and to monitor the progress of any student who is receiving an academic intervention to improve text comprehension. Curriculum-Based Measurement-Maze is a tool ideally suited to assess student reading comprehension (Parker, Hasbrouck, & Tindal, 1992). The student is given a specially formatted sample of text. The first sentence of the Maze passage is left intact. In the remainder of the passage, every seventh word is selected to be incorporated into a response item that consists of the original word plus two foils (words that would not make sense if substituted in the passage in place of the original, correct word). These three choices are randomly arranged and inserted back into the text. When reading the Maze passage, the reader reviews each response item and circles the word from the three choices that best restores the meaning of that segment of the passage. Maze passages have been found to be better predictors of future reading performance than CBM oral reading fluency probes for students in grades 4 and higher (Hosp, Hosp & Howell, 2007). CBM-Maze: How to Access Resources. Teachers can access a toolkit of resources for CBM-Maze, including: (1) materials for assessment, (2) guidelines for administration and scoring, and (3) research-based norms. Materials for assessment. Schools can access free Maze assessments with accompanying benchmarks for grades 2-6 at the DIBELS Next website: http://dibels.org/next.html Note: Users must create an account before they can download materials. Using the Maze Passage Generator, a free online application, teachers can generate their own CBM maze passages in PDF format from text typed in by the user: http://www.interventioncentral.org/tools/maze-passage-generator Guidelines for administration and scoring. Instructions for preparing, administering, and scoring CBM-Maze assessments appear later in this document: Research-based norms. A table, Curriculum-Based Measurement: Maze Passage Fluency Norms, is included in this document. The norms include fluency benchmarks for grades 2-6 (Jenkins & Jewell, 1993; Graney, Missall, Martinez, & Bergstrom, 2009) and accompanying weekly growth norms (Fuchs et al., 1993). References Hosp, M.K., Hosp, J. L., & Howell, K. W. (2007). The ABCs of CBM. New York: Guilford. National Institute of Child Health and Human Development. (2000). Report of the National Reading Panel. Teaching children to read: An evidence-based assessment of the scientific research literature on reading and its implications for reading instruction (NIH Publication No. 00-4769). Washington, DC: U.S. Government Printing Office. Parker, R., Hasbrouck, J. E., & Tindal, G. (1992). The maze as a classroom-based reading measure: Construction methods, reliability, and validity. Journal of Special Education, 26 (2), 195-218. Jim Wright, Presenter www.interventioncentral.org 48 49 ‘How the Common Core Works’ Series © 2013 Jim Wright www.interventioncentral.org 2 Curriculum-Based Measurement-Maze: Guidelines for Use CBM-Maze: Description CBM-Maze passages are timed (3-minute) reading comprehension assessments with a multiple-choice response format. The student reads and completes the passage silently. CBM-Maze can be administered to a single student, a small group, or an entire class (Espin et al., 2010). CBM-Maze: Materials The following materials are needed to administer CBM-Maze passages: Student and examiner copies of CBM Maze passage (the process for creating Maze passages is described below) Stopwatch Pencils for students CBM-Maze: Preparation Before administering CBM-Maze, the teacher creates or obtains a Maze passage, using these guidelines (Espin et al., 2010): Passages used for Maze should provide sufficient reading material to occupy students for 3 minutes of silent reading. Samples should be at least 300 words in length. The first sentence of the Maze passage is left intact. In the text following the first sentence, every seventh word is selected to be incorporated into a response item that consists of the original word plus two foils (words that would not make sense if substituted in the passage in place of the original, correct word). These three choices are randomly arranged and inserted back into the text. Here is a sample of a Maze response item: The rain (sang, cement, fell) on the garden. Schools can obtain free Maze passages and Maze benchmarks for grades 2-6 from the DIBELS Next website: http://dibels.org/next.html Schools can also obtain their own CBM Maze passages in PDF format based on text typed in by the user by accessing the Maze Passage Generator, a free online application: http://www.interventioncentral.org/teacher-resources/test-of-reading-comprehension CBM-Maze: Directions for Administration (adapted from Sarasti, 2009) 1. The examiner distributes copies of CBM Maze probes to all the students in the group. 2. The examiner says: "When I say 'begin', start reading the story silently. Wherever you come to a group of 3 word-choices, circle the word that makes sense. Work as fast as you can but do your best work. If you finish the first page, go to the next page and continue working until I tell you to stop." 3. The examiner says: "Ready? Begin" and starts the stopwatch. 4. After 3 minutes, the examiner stops the stopwatch and says:"Stop. Pencils down". 5. These directions are repeated for each Maze passage administered in a session. The examiner then collects and scores the passages. 6. Initial Assessment: If the examiner is assessing the student for the first time, the examiner administers a total of 3 Maze probes during the session, using the above procedures and takes the median (middle) score as the best estimate of the student's reading-comprehension skills. Progress-Monitoring: If the examiner is monitoring student growth in computation (and has previously collected Maze data), only one Maze probe is given in the session. Jim Wright, Presenter www.interventioncentral.org 49 50 ‘How the Common Core Works’ Series © 2013 Jim Wright 3 www.interventioncentral.org CBM-Maze: Directions for Practice If students are not yet familiar with the Maze, use the Maze practice page and accompanying examiner directions appearing later in this document to ensure student understanding of the activity before administering the assessment. CBM-Maze: Scoring Guidelines The examiner adds up the total number of correct responses, giving the student credit for each Maze choice-item in which the correct word is circled. References Espin, C. Wallace, T., Lembke, E., Campbell, H., & Long, J. D. (2010). Creating a progress-monitoring system in reading for middle-school students: Tracking progress toward meeting high-stakes standards. Learning Disabilities Research & Practice, 25(2), 60-75. Sarasti, I. A. (2009). An investigation of the reliability and validity of curriculum-based measurement maze probes: A comparison of 1-minute, 2-minute, and 3-minute time frames. Unpublished doctoral dissertation, Temple University, Philadelphia, PA. Jim Wright, Presenter www.interventioncentral.org 50 51 ‘How the Common Core Works’ Series © 2013 Jim Wright 4 www.interventioncentral.org CBM-Maze: Directions for Practice (adapted from Sarasti, 2009) If students are not yet familiar with the Maze, use the Maze practice page and these examiner directions to ensure student understanding of the assessment activity: 1. The examiner hands out copies of the Maze practice page to students. 2. The examiner says: "We will practice a story together. Look at the practice page. Read the first sentence to yourself while I read it aloud: The rain (sang, cement, fell) on the garden. The three choices are sang, cement, fell. The rain sang on the garden. That sentence does not make sense. The rain cement on the garden. That sentence does not make sense. So the correct word to circle is fell." [The examiner scans the group to ensure that all students circle the correct word before continuing.] 3. The examiner says: "Now go to the next sentence on the practice page. Read it to yourself while I read it aloud: The teacher walked (quickly, blue, trust) down the hall. Which word is the correct choice to complete the sentence? [Ensure that students chorally give the correct response before continuing.] That's right: The teacher walked quickly down the hall is correct, so circle the word quickly." 4. The examiner says: "Now read the next sentence on your practice page to yourself. Raise your hand when you have the answer. [When students are ready, the examiner reads the practice sentence with correct answer: The ship sailed (blank, toward, eight) the port.] Yes, the correct sentence is The ship sailed toward the port. Now that you have chosen the correct word, what do you do?" [The students should say "Circle it." The examiner ensures that all students fully understand the Maze response task.] Yes, you circle the correct word. You are ready to do the next story on your own." Jim Wright, Presenter www.interventioncentral.org 51 52 ‘How the Common Core Works’ Series © 2013 Jim Wright www.interventioncentral.org 5 CBM-Maze: Practice Page 1. The rain (sang, cement, fell) on the garden. 2. The teacher walked (quickly, blue, trust) down the hall. 3. The ship sailed (blank, toward, eight) the port. Jim Wright, Presenter www.interventioncentral.org 52 53 ‘How the Common Core Works’ Series © 2013 Jim Wright 6 www.interventioncentral.org Curriculum-Based Curriculum-BasedMeasurement: Measurement:Maze MazePassage PassagesFluency (Reading Norms Co CBM-Maze assesses basic student comprehension. In a Maze assessment, student is given a (Fuchs, Fuchs, Hamlett, Waltz, &reading Germann, 1993; Graney, Missall, Martinez,the & Bergstrom, 2009; passage in which every seventh word hasJenkins been selected as a1993)* choice item. The student reads the passage & Jewell, CBM-Maze assesses basic student reading comprehension. In a Maze assessment, the student is given a passage in which every seventh word has been selected as a choice item. The student reads the passage silently. Each time the student comes to a choice item, the student chooses from among 3 replacement words: the correct word and two distractors. The student circles the replacement word that he or she believes best restores the meaning of the text. The Maze is timed: while the length of Maze assessments can vary, the most common time-standard is 3 minutes (Graney et al., 2009). Grade 2 Grade Fall Maze (≈16th%ile to 84th%ile) 6 1↔11 (Jenkins & Jewell, 1993) Fall Maze (Graney et al., 2009) 3 4 5 Grade 6 Fall:+/-1 SD 13 14 18 (≈16th%ile to 84th%ile) Spring: +/-1 SD 15 7↔23 (Jenkins & Jewell, 1993) Weekly Growth (Fuchs et al., 1993) 0.40 Fall:+/-1 SD Winter Maze Winter: +/-1 SD Spring Maze Spring: +/-1 SD (≈16th%ile to 84th%ile) (Fuchs et al., 1993) 7↔19 9↔19 11↔25 14 21 22 8↔20 12↔30 14↔30 15 20 26 9↔21 12↔28 18↔34 0.40 0.40 0.40 (≈16th%ile to 84th%ile) (Graney et al., 2009) Fall Maze (≈16th%ile to 84th%ile) 33 22↔44 (Jenkins & Jewell, 1993) Jim Wright, Presenter Spring Maze Fall:+/-1 SD (≈16th%ile to 84th%ile) (Graney et al., 2009) Spring Maze (≈16th%ile to 84th%ile) 39 26↔52 (Jenkins & Jewell, 1993) www.interventioncentral.org Spring: +/-1 SD Weekly Growth Weekly Growth (Fuchs et al., 1993) 0.40 53 54 ‘How the Common Core Works’ Series © 2013 Jim Wright www.interventioncentral.org 7 References: Fuchs, L. S., Fuchs, D., Hamlett, C. L., Waltz, L., & Germann, G. (1993). Formative evaluation of academic progress: How much growth can we expect? School Psychology Review, 22, 27−48. Graney, S. B., Missall, K. N., Martinez, R. S., & Bergstrom, M. (2009). A preliminary investigation of within-year growth patterns in reading and mathematics curriculum-based measures. Journal of School Psychology, 47, 121142. Jenkins, J. R., & Jewell, M. (1993). Examining the validity of two measures for formative teaching: Read aloud and maze. Exceptional Children, 59, 421-432. *Reported Characteristics of Student Sample(s) Used to Compile These Norms: Fuchs et al., 1993: Number of Students Assessed: 257 students across grades 2-6/Geographical Location: Upper Midwest: Sample drawn from 5 elementary schools/ Socioeconomic Status: 33%-55% rate of Free & Reduced Lunch across participating schools/ Ethnicity of Sample: Not reported/Limited English Proficiency in Sample: Not reported. Graney, 2009: Number of Students Assessed: Average of 444 students in each year of this 2-year study.; Grade 3: 151; Grade 4: 149; Grade 5: 144/Geographical Location: Midwest: Sample drawn from grades 3-5 in one rural school: 8 classrooms in grade 3; 7 classrooms in grade 4; 7 classrooms in grade 5/ Socioeconomic Status: 31% Free & Reduced Lunch/ Ethnicity of Sample: 93% White; 4% Multiracial; 2% African-American; 1% Latino/Limited English Proficiency in Sample: Not reported. Jenkins & Jewell, 1993: Number of Students Assessed: Grade 2: 47; Grade 6: 125/Geographical Location: Pacific Northwest: Sample drawn from grades 2 & 6 in two elementary schools/ Socioeconomic Status: 33% Free & Reduced Lunch/ Ethnicity of Sample: Not reported/Limited English Proficiency in Sample: Not reported. Where to Find Materials: Schools can access free Maze assessments with accompanying benchmarks for grades 26 at the DIBELS Next website: http://dibels.org/next.html Note: Users must create an account before they can download materials. Teachers can also create their own CBM Maze passages in PDF format based on text typed in by the user using the Maze Passage Generator, a free online application: http://www.interventioncentral.org/tools/maze-passage-generator Limitations of These Research Norms: Norms generated from small-scale research studies--like those used here-provide estimates of student academic performance based on a sampling from only one or two points in time, rather than a more comprehensive sampling across separate fall, winter, and spring screenings. These norms also have been compiled from a relatively small student sample that is not fully representative of a diverse 'national' population. Nonetheless, norms such as these are often the best information that is publically available for basic academic skills and therefore do have a definite place in classroom instruction decision-making. These norms can be useful in general education for setting student performance outcome goals for core instruction and/or any level of academic intervention. Similarly, these norms can be used to set performance goals for students with special needs. In both cases, however, single-sample norms would be used only if more comprehensive fall/winter/spring academic performance norms are not available. Jim Wright, Presenter www.interventioncentral.org 54 55 ‘How the Common Core Works’ Series © 2013 Jim Wright www.interventioncentral.org 1 How To: Assess Early Math Difficulties in the Primary Grades With CBM In the early elementary grades, students' success in mathematics can be predicted by assessing their acquisition and use of foundation numeracy skills (Gersten, Jordan, & Flojo, 2005). The term number sense is often used as short-hand to describe a child's emerging grasp of fundamental mathematical concepts such as what numbers mean, how sets of objects can be described in numerical terms, counting, and simple operations of mental arithmetic (Chard et al, 2005). Number sense is difficult to define with precision because the descriptor encompasses a wide range of early math skills (Clarke & Shinn, 2004). By the time a student has entered kindergarten or 1st grade, however, this term can be framed more concretely as a student's ability to access and use a mental number-line. In the primary grades, the Common Core State Standards in Mathematics are built on the assumption that the successful math student can rapidly access a mental number line for use in such applied mathematical tasks as counting, making accurate comparisons between number, and estimating amounts. For example, a Kindergarten Counting & Cardinality standard (CCSM.K.CC.2) states that a student will "count forward beginning from a given number within the known sequence (instead of having to begin at 1)." (National Governors Association Center for Best Practices et al., 2010; p. 11). Similarly, a Grade 1 standard for Number & Operations in Base 10 (CCSM.1.NBT.1) sets as a student goal to "count to 120, starting at any number less than 120. " (National Governors Association Center for Best Practices et al., 2010; p. 15). Clearly, these and other math standards for the early grades must depend on students' ability to envision and mentally manipulate an internal number-line. Early Math Fluency Measures: What They Are. Teachers at the primary level have a pressing need for screening tools that can quickly identify those students who require additional instructional support to address deficient number-sense skills. Early Math Fluency measures are one useful means to assess the strength of a young student's 'number sense' (Chard, et al., 2005) and serve as good predictors of mathematical readiness at Kindergarten and Grade 1. Early Math Fluency measures are examples of Curriculum-Based Measurement (Hosp, Hosp, & Howell, 2007) and include Quantity Discrimination, Missing Number, and Number Identification. All Early Math Fluency assessments have an administration time of 1 minute. Here are brief descriptions for three of these measures: Quantity Discrimination: The student is presented with pairs of numbers randomly sampled from 1-20 and must identify the larger number in each pair. Missing Number: The student is presented with response items consisting of 3 sequential numbers with one of those numbers randomly left blank. (Each 3-number series is randomly generated from the pool of numbers 1-20.) The student attempts to name the missing number in each series. Number Identification: The student is presented with a randomly generated series of numbers ranging from 1-20 and names as many of those numbers aloud as time allows. Early Math Fluency Measures: How to Access Resources. Teachers who would like to screen their Kindergarten and Grade 1 students for possible number-sense delays can obtain these free Early Math Fluency assessment resources: (1) materials for assessment, (2) guidelines for administration and scoring, and (3) research-based norms. Materials for assessment. Schools can create their own CBM Early Math Fluency assessment materials at no cost, using NumberFly, a free online application: Jim Wright, Presenter www.interventioncentral.org 55 56 ‘How the Common Core Works’ Series © 2013 Jim Wright www.interventioncentral.org 2 http://www.interventioncentral.org/tools/early-math-fluency-generator Guidelines for administration and scoring. The following sets of instructions for preparing, administering, and scoring Early Math Fluency assessments appear later in this document: o o o Early Math Fluency/Quantity Discrimination: Guidelines for Use Math Fluency/Missing Number: Guidelines for Use Math Fluency/Number Identification: Guidelines for Use Research-based norms. A table, Curriculum-Based Measurement: Early Mathematics Fluency Norms, is included in this document. These fluency benchmarks were researched by Chard et al. (2005) and provide Fall/Winter/Spring screening norms for Quantity Discrimination, Missing Number, and Number Identification. References Chard, D. J., Clarke, B., Baker, S., Otterstedt, J., Braun, D., & Katz, R. (2005). Using measures of number sense to screen for difficulties in mathematics: Preliminary findings. Assessment for Effective Intervention, 30(3), 3-14. Clarke, B., & Shinn, M. (2004). A preliminary investigation into the identification and development of early mathematics curriculum-based measurement. School Psychology Review, 33, 234–248. Gersten, R., Jordan, N. C., & Flojo, J. R. (2005). Early identification and interventions for students with mathematics difficulties. Journal of Learning Disabilities, 38, 293-304. Hosp, M.K., Hosp, J. L., & Howell, K. W. (2007). The ABCs of CBM. New York: Guilford. National Governors Association Center for Best Practices & Council of Chief State School Officers. (2010). Common core state standards for mathematics. Washington, DC: Authors. Retrieved from http://www.corestandards.org/ Jim Wright, Presenter www.interventioncentral.org 56 57 ‘How the Common Core Works’ Series © 2013 Jim Wright www.interventioncentral.org 3 Early Math Fluency/Quantity Discrimination: Guidelines for Use This introduction to the Quantity Discrimination probe provides information about the preparation, administration, and scoring of this Early Math CBM measure. Additionally, it offers brief guidelines for integrating this assessment into a school-wide ‘Response-to-Intervention’ model. Quantity Discrimination: Description (Clarke & Shinn, 2004; Gersten, Jordan & Flojo, 2005) The student is given a sheet containing pairs of numbers. In each number pair, one number is larger than the other. The numbers in each pair are selected from within a predefined range (e.g., no lower than 1 and no higher than 20). During a one-minute timed assessment, the student identifies the larger number in each pair, completing as many items as possible while the examiner records any Quantity Discrimination errors. Quantity Discrimination: Preparation The following materials are needed to administer Quantity Discrimination (QD) Early Math CBM probes: Student and examiner copies of a QD assessment probe. (Note: Customized QD probes can be created conveniently and at no cost using Numberfly, a web-based application. Visit Numberfly at http://www.interventioncentral.org/php/numberfly/numberfly.php). A pencil, pen, or marker A stopwatch Quantity Discrimination: Directions for Administration 1. The examiner sits with the student in a quiet area without distractions. The examiner sits at a table across from the student. 2. The examiner says to the student: “The sheet on your desk has pairs of numbers. In each set, one number is bigger than the other.” “When I say, 'start,' tell me the name of the number that is larger in each pair. Start at the top of this page and work across the page [demonstrate by pointing]. Try to figure out the larger number for each example.. When you come to the end of a row, go to the next row. Are there any questions? [Pause] Start. “ NOTE: If the student has difficulties with speech production, the examiner can use this alternate wording for directions: “When I say, 'start,' point to the number that is larger in each pair” 3. The examiner begins the stopwatch when the student responds aloud to the first item. If the student hesitates on a number for 3 seconds or longer on a Quantity Discrimination item, the examiner says, “Go to the next one.” (If necessary, the examiner points to the next number as a student prompt.) 4. The examiner marks each Quantity Discrimination error by marking a slash (/) through the incorrect response item on the examiner form. 5. At the end of one minute, the examiner says, “Stop” and writes in a right-bracket symbol ( ] ) on the examiner form after the last item that the student had attempted when the time expired. The examiner then collects the student Quantity Discrimination sheet. Jim Wright, Presenter www.interventioncentral.org 57 58 ‘How the Common Core Works’ Series © 2013 Jim Wright www.interventioncentral.org 4 6. Initial Assessment: If the examiner is assessing the student for the first time, the examiner administers a total of 3 QD probes during the session using the above procedures and takes the median (middle) score as the best estimate of the student's QD skills. Progress-Monitoring: If the examiner is monitoring student growth in QD (and has previously collected QD data), only one QD probe is given in the session. Quantity Discrimination: Directions for Practice If the student is not yet familiar with QD probes, the teacher can administer one or more practice assessments (using the administration guidelines above) and provide coaching and feedback as needed until assured that the student fully understands the assessment. Quantity Discrimination: Scoring Guidelines Correct QD responses include: Quantity Discriminations read correctly Quantity Discriminations read incorrectly but corrected by the student within 3 seconds Incorrect QD responses include: The student’s reading the smaller number in the QD number pair Correct QD responses given after hesitations of 3 seconds or longer The student’s calling out a number other than appears in the QD number pair Response items skipped by the student To calculate a Quantity Discrimination fluency score, the examiner: 1. counts up all QD items that the student attempted to answer and 2. subtracts the number of QD errors from the total number attempted. 3. The resulting figure is the number of correct Quantity Discrimination items completed.(QD fluency score). Quantity Discrimination Probes as Part of a Response to Intervention Model Universal Screening: To proactively identify children who may have deficiencies in development of foundation math concepts, or ‘number sense’ (Berch, 2005), schools may choose to screen all kindergarten and first grade students using Quantity Discrimination probes. Those screenings would take place in fall, winter, and spring. Students who fall below the ‘cutpoint’ of the 35th percentile (e.g., Gersten, Jordan & Flojo, 2005).of the grade norms on the QD task would be identified as having moderate deficiencies and given additional interventions to build their ‘number sense’ skills. Tier I (Classroom-Based) Interventions: Teachers can create Quantity Discrimination probes and use them independently to track the progress of students who show modest delays in their math foundation skills. Tier II (Individualized) Interventions. Students with more extreme academic delays may be referred to a school-based problem-solving team, which will develop more intensive, specialized interventions to target the student’s academic deficits (Wright, 2007). Quantity Discrimination probes can be used as one formative measure to track student progress with Tier II interventions to build foundation math skills. Jim Wright, Presenter www.interventioncentral.org 58 59 ‘How the Common Core Works’ Series © 2013 Jim Wright www.interventioncentral.org 5 Quantity Discrimination: Measurement Statistics Test-Retest Reliability Correlations for Quantity Discrimination Probes Time Span Correlation Reference 13-week interval 0.85 Clarke & Shinn (2004) 26-week interval 0.86 Clarke & Shinn (2004) Predictive Validity Correlations for Quantity Discrimination Probes Predictive Validity Measure Correlation 0.67 Curriculum-Based Measurement Math Computation Fluency Probes: Grade 1 Addition & Subtraction (Fall Administration of QD Probe and Spring Administration of Math Computation Probe) 0.79 Woodcock-Johnson Tests of Achievement: Applied Problems subtest (Fall Administration of QD Probe and Spring Administration of WJ-ACH subtest) Number Knowledge Test 0.53 Reference Clarke & Shinn (2004) Clarke & Shinn (2004) Chard, Clarke, Baker, Otterstedt, Braun & Katz.(2005) cited in Gersten, Jordan & Flojo (2005) References Chard, D. J., Clarke, B., Baker, S., Otterstedt, J., Braun, D., & Katz, R. (2005). Using measures of number sense to screen for difficulties in mathematics: Preliminary findings. Assessment For Effective Intervention, 30(2), 3-14. Clarke, B., & Shinn, M. (2004). A preliminary investigation into the identification and development of early mathematics curriculum-based measurement. School Psychology Review, 33, 234–248. Gersten, R., Jordan, N.C., & Flojo, J.R. (2005). Early identification and interventions for students with mathematics difficulties. Journal of Learning Disabilities, 38, 293-304. Berch, D. B. (2005). Making sense of number sense: Implications for children with mathematical disabilities. Journal of Learning Disabilities, 38, 333-339.. Wright, J. (2007). The RTI toolkit: A practical guide for schools. Port Chester, NY: National Professional Resources, Inc. Jim Wright, Presenter www.interventioncentral.org 59 60 ‘How the Common Core Works’ Series © 2013 Jim Wright www.interventioncentral.org 6 Early Math Fluency/Missing Number: Guidelines for Use This introduction to the Missing Number probe provides information about the preparation, administration, and scoring of this Early Math CBM measure. Additionally, it offers brief guidelines for integrating this assessment into a school-wide ‘Response-to-Intervention’ model. Missing Number: Description (Clarke & Shinn, 2004; Gersten, Jordan & Flojo, 2005) The student is given a sheet containing multiple number series. Each series consists of 3-4 numbers that appear in sequential order. The numbers in each short series are selected to fall within a predefined range (e.g., no lower than 1 and no higher than 20). In each series, one number is left blank (e.g., ‘1 2 _ 4’).During a one-minute timed assessment, the student states aloud the missing number in as many response items as possible while the examiner records any Missing Number errors. Missing Number: Preparation The following materials are needed to administer Missing Number (MN) Early Math CBM probes: Student and examiner copies of a MN assessment probe. (Note: Customized MN probes can be created conveniently and at no cost using Numberfly, a web-based application. Visit Numberfly at http://www.interventioncentral.org/php/numberfly/numberfly.php). A pencil, pen, or marker A stopwatch Missing Number: Directions for Administration 1. The examiner sits with the student in a quiet area without distractions. The examiner sits at a table across from the student. 2. The examiner says to the student: “The sheet on your desk has sets of numbers. In each set, a number is missing.” “When I say, 'start,' tell me the name of the number that is missing from each set of numbers. Start at the top of this page and work across the page [demonstrate by pointing]. Try to figure out the missing number for each example.. When you come to the end of a row, go to the next row. Are there any questions? [Pause] Start. “ NOTE: If the student has difficulties with speech production, the examiner can give the student a pencil and use this alternate wording for directions: “When I say, 'start, write in the number that is missing from each set of numbers.” 3. The examiner begins the stopwatch when the student reads the first number aloud. If the student hesitates on a number for 3 seconds or longer on a Missing Number item, the examiner says the correct number aloud and says, “Go to the next one.” (If necessary, the examiner points to the next number as a student prompt.) 4. The examiner marks each Missing Number error by marking a slash (/) through the incorrect response item on the examiner form. Jim Wright, Presenter www.interventioncentral.org 60 61 ‘How the Common Core Works’ Series © 2013 Jim Wright www.interventioncentral.org 7 5. At the end of one minute, the examiner says, “Stop” and writes in a right-bracket symbol ( ] ) on the examiner form after the last item that the student had attempted when the time expired. The examiner then collects the student Missing Number sheet. 6. Initial Assessment: If the examiner is assessing the student for the first time, the examiner administers a total of 3 MN probes during the session using the above procedures and takes the median (middle) score as the best estimate of the student's MN skills. Progress-Monitoring: If the examiner is monitoring student growth in MN (and has previously collected MN data), only one MN probe is given in the session. Missing Number: Directions for Practice If the student is not yet familiar with MN assessments, the teacher can administer one or more practice MN probes (using the administration guidelines above) and provide coaching and feedback as needed until assured that the student fully understands the assessment. Missing Number: Scoring Guidelines Correct MN responses include: Missing numbers read correctly Missing numbers read incorrectly but corrected by the student within 3 seconds Incorrect MN responses include: Missing numbers read incorrectly Missing numbers read correctly after hesitations of 3 seconds or longer Response items skipped by the student To calculate a Missing Number fluency score, the examiner: 1. counts up all MN items that the student attempted to read aloud and 2. subtracts the number of MN errors from the total number attempted. 3. The resulting figure is the number of correct Missing Number items completed.(MN fluency score). Missing Number Probes as Part of a Response to Intervention Model Universal Screening: To proactively identify children who may have deficiencies in development of foundation math concepts, or ‘number sense’ (Berch, 2005), schools may choose to screen all kindergarten and first grade students using Missing Number probes. Those screenings would take place in fall, winter, and spring. Students who fall below the ‘cutpoint’ of the 35th percentile (e.g., Gersten, Jordan & Flojo, 2005).of the grade norms on the MN task would be identified as having moderate deficiencies and given additional interventions to build their ‘number sense’ skills. Tier I (Classroom-Based) Interventions: Teachers can create Missing Number probes and use them independently to track the progress of students who show modest delays in their math foundation skills. Tier II (Individualized) Interventions. Students with more extreme academic delays may be referred to a school-based problem-solving team, which will develop more intensive, specialized interventions to target the student’s academic deficits (Wright, 2007). Missing Number probes can be used as one formative measure to track student progress with Tier II interventions to build foundation math skills. Missing Number: Measurement Statistics Jim Wright, Presenter www.interventioncentral.org 61 62 ‘How the Common Core Works’ Series © 2013 Jim Wright Test-Retest Reliability Correlations for Missing Number Probes Time Span Correlation 13-week interval 0.79 26-week interval 0.81 Predictive Validity Correlations for Missing Number Probes Predictive Validity Measure Correlation 0.67 Curriculum-Based Measurement Math Computation Fluency Probes: Grade 1 Addition & Subtraction (Fall Administration of MN Probe and Spring Administration of Math Computation Probe) 0.72 Woodcock-Johnson Tests of Achievement: Applied Problems subtest (Fall Administration of MNF Probe and Spring Administration of WJ-ACH subtest) Number Knowledge Test 0.61 www.interventioncentral.org 8 Reference Clarke & Shinn (2004) Clarke & Shinn (2004) Reference Clarke & Shinn (2004) Clarke & Shinn (2004) Chard, Clarke, Baker, Otterstedt, Braun & Katz.(2005) cited in Gersten, Jordan & Flojo (2005) References Chard, D. J., Clarke, B., Baker, S., Otterstedt, J., Braun, D., & Katz, R. (2005). Using measures of number sense to screen for difficulties in mathematics: Preliminary findings. Assessment For Effective Intervention, 30(2), 3-14. Clarke, B., & Shinn, M. (2004). A preliminary investigation into the identification and development of early mathematics curriculum-based measurement. School Psychology Review, 33, 234–248. Gersten, R., Jordan, N.C., & Flojo, J.R. (2005). Early identification and interventions for students with mathematics difficulties. Journal of Learning Disabilities, 38, 293-304. Berch, D. B. (2005). Making sense of number sense: Implications for children with mathematical disabilities. Journal of Learning Disabilities, 38, 333-339.. Wright, J. (2007). The RTI toolkit: A practical guide for schools. Port Chester, NY: National Professional Resources, Inc. Jim Wright, Presenter www.interventioncentral.org 62 63 ‘How the Common Core Works’ Series © 2013 Jim Wright www.interventioncentral.org 9 Early Math Fluency/Number Identification: Guidelines for Use This introduction to the Number Identification probe provides information about the preparation, administration, and scoring of this Early Math CBM measure. Additionally, it offers brief guidelines for integrating this assessment into a school-wide ‘Response-to-Intervention’ model. Number Identification: Description (Clarke & Shinn, 2004; Gersten, Jordan & Flojo, 2005) The student is given a sheet containing rows of randomly generated numbers (e.g., ranging from 1 to 20). During a one-minute timed assessment, the student reads aloud as many numbers as possible while the examiner records any Number Identification errors. Number Identification: Preparation The following materials are needed to administer Number Identification (NID) Early Math CBM probes: Student and examiner copies of a NID assessment probe. (Note: Customized NID probes can be created conveniently and at no cost using Numberfly, a web-based application. Visit Numberfly at http://www.interventioncentral.org/php/numberfly/numberfly.php). A pencil, pen, or marker A stopwatch Number Identification: Directions for Administration 1. The examiner sits with the student in a quiet area without distractions. The examiner sits at a table across from the student. 2. The examiner says to the student: “The sheet on your desk has rows of numbers.” “When I say, 'start,' begin reading the numbers aloud. Start at the top of this page and read across the page [demonstrate by pointing]. Try to read each number. When you come to the end of a row, go to the next row. Are there any questions? [Pause] Start. “ 3. The examiner begins the stopwatch when the student reads the first number aloud. If the student hesitates on a number for 3 seconds or longer, the examiner says, “Go to the next one.” (If necessary, the examiner points to the next number as a student prompt.) 4. The examiner marks each Number Identification error by marking a slash (/) through the incorrectly read number on the examiner form. 5. At the end of one minute, the examiner says, “Stop” and writes in a right-bracket symbol ( ] ) on the examiner form from the point in the number series that the student had reached when the time expired. The examiner then collects the student Number Identification sheet. 6. Initial Assessment: If the examiner is assessing the student for the first time, the examiner administers a total of 3 NID probes during the session using the above procedures and takes the median (middle) score as the best estimate of the student's NID skills. Progress-Monitoring: If the examiner is monitoring student growth in NID (and has previously collected NID data), only one NID probe is given in the session. Jim Wright, Presenter www.interventioncentral.org 63 64 ‘How the Common Core Works’ Series © 2013 Jim Wright www.interventioncentral.org 10 Number Identification: Directions for Practice If the student is not yet familiar with NID assessments, the teacher can administer one or more practice NID probes (using the administration guidelines above) and provide coaching and feedback as needed until assured that the student fully understands the assessment. Number Identification: Scoring Guidelines Correct NID responses include: Numbers read correctly Numbers read incorrectly but corrected by the student within 3 seconds Incorrect NID responses include: Numbers read incorrectly Numbers read correctly after hesitations of 3 seconds or longer Numbers skipped by the student To calculate a Number Identification fluency score, the examiner: 1. counts up all numbers that the student attempted to read aloud and 2. subtracts the number of errors from the total of numbers attempted. 3. The resulting figure is the number of correct numbers identified.(NID fluency score). Number Identification Probes as Part of a Response to Intervention Model Universal Screening: To proactively identify children who may have deficiencies in development of foundation math concepts, or ‘number sense’ (Berch, 2005), schools may choose to screen all kindergarten and first grade students using Number Identification probes. Those screenings would take place in fall, winter, and spring. Students who fall below the ‘cutpoint’ of the 35th percentile (e.g., Jordan & Hanich, 2003).of the grade norms on the NID task would be identified as having moderate deficiencies and given additional interventions to build their ‘number sense’ skills. Tier I (Classroom-Based) Interventions: Teachers can create Number Identification probes and use them independently to track the progress of students who show modest delays in their math foundation skills. Tier II (Individualized) Interventions. Students with more extreme academic delays may be referred to a school-based problem-solving team, which will develop more intensive, specialized interventions to target the student’s academic deficits (Wright, 2007). Number Identification probes can be used as one formative measure to track student progress with Tier II interventions to build foundation math skills. Number identification: Measurement Statistics Test-Retest Reliability Correlations for Number Identification Probes Time Span Correlation 13-week interval 0.85 26-week interval 0.76 Jim Wright, Presenter www.interventioncentral.org Reference Clarke & Shinn (2004) Clarke & Shinn (2004) 64 65 ‘How the Common Core Works’ Series © 2013 Jim Wright Predictive Validity Correlations for Number Identification Probes Predictive Validity Measure Correlation 0.60 Curriculum-Based Measurement Math Computation Fluency Probes: Grade 1 Addition & Subtraction (Fall Administration of MN Probe and Spring Administration of Math Computation Probe) 0.72 Woodcock-Johnson Tests of Achievement: Applied Problems subtest (Fall Administration of NID Probe and Spring Administration of WJ-ACH subtest) Number Knowledge Test 0.58 www.interventioncentral.org 11 Reference Clarke & Shinn (2004) Clarke & Shinn (2004) Chard, Clarke, Baker, Otterstedt, Braun & Katz.(2005) cited in Gersten, Jordan & Flojo (2005) References Chard, D. J., Clarke, B., Baker, S., Otterstedt, J., Braun, D., & Katz, R. (2005). Using measures of number sense to screen for difficulties in mathematics: Preliminary findings. Assessment For Effective Intervention, 30(2), 3-14. Clarke, B., & Shinn, M. (2004). A preliminary investigation into the identification and development of early mathematics curriculum-based measurement. School Psychology Review, 33, 234–248. Gersten, R., Jordan, N.C., & Flojo, J.R. (2005). Early identification and interventions for students with mathematics difficulties. Journal of Learning Disabilities, 38, 293-304. Jordan, N. C. & Hanich, L. B. (2003). Characteristics of children with moderate mathematics deficiencies: A longitudinal perspective. Learning Disabilities Research and Practice, 18(4), 213-221. Berch, D. B. (2005). Making sense of number sense: Implications for children with mathematical disabilities. Journal of Learning Disabilities, 38, 333-339.. Wright, J. (2007). The RTI toolkit: A practical guide for schools. Port Chester, NY: National Professional Resources, Inc. Jim Wright, Presenter www.interventioncentral.org 65 66 ‘How the Common Core Works’ Series © 2013 Jim Wright 12 www.interventioncentral.org Curriculum-Based Measurement: Early Mathematics Fluency Norms (Chard, Clarke, Baker, Otterstedt, Braun, & Katz, 2005)* CBM-Early Mathematics Fluency measures assess the strength of a student's 'number sense' (Chard, et al., 2005) and are good predictors of mathematical readiness at Kindergarten and Grade 1. Early Math Fluency measures include Quantity Discrimination, Missing Number, and Number Identification. All Early Math Fluency assessments have an administration time of 1 minute. Quantity Discrimination (QD): 1 Minute: The student is presented with pairs of numbers randomly sampled from 1-20 and must identify the larger number in each pair. Grade Fall QD (Chard et al., 2005) K 1 15 23 Fall:+/-1 SD (≈16th%ile to 84th%ile) Winter QD (Chard et al., 2005) Winter: +/-1 SD Spring QD Spring: +/-1 SD Weekly Growth 8↔22 16↔30 20 30 8↔32 21↔39 23 37 12↔34 28↔46 0.25 0.44 (≈16th%ile to 84th%ile) (Chard et al., 2005) (≈16th%ile to 84th%ile) Missing Number (MN): 1 Minute: The student is presented with response items consisting of 3 sequential numbers with one of those numbers randomly left blank. (Each 3-number series is randomly generated from the pool of numbers 1-20.) The student attempts to name the missing number in each series. Grade Fall MN (Chard et al., 2005) K 1 3 9 Fall: +/-1 SD (≈16th%ile to 84th%ile) Winter MN (Chard et al., 2005) Winter: +/-1 SD Spring MN Spring: +/-1 SD Weekly Growth 0↔7 3↔15 10 17 3↔17 11↔23 14 20 7↔21 14↔26 0.34 0.34 (≈16th%ile to 84th%ile) (Chard et al., 2005) (≈16th%ile to 84th%ile) Number Identification (NID): 1 Minute: The student is presented with a randomly generated series of numbers ranging from 1-20 and names as many of those numbers aloud as time allows. Grade Fall NID (Chard et al., 2005) K 1 14 34 Fall: +/-1 SD (≈16th%ile to 84th%ile) Winter NID (Chard et al., 2005) Winter: +/-1 SD Spring NID Spring: +/-1 SD Weekly Growth 0↔28 18↔50 45 53 27↔63 36↔70 56 62 38↔74 46↔78 1.31 0.88 (≈16th%ile to 84th%ile) (Chard et al., 2005) (≈16th%ile to 84th%ile) Reference: Chard, D. J., Clarke, B., Baker, S., Otterstedt, J., Braun, D., & Katz, R. (2005). Using measures of number sense to screen for difficulties in mathematics: Preliminary findings. Assessment for Effective Intervention, 30(3), 3-14. *Reported Characteristics of Student Sample(s) Used to Compile These Norms: Number of Students Assessed: Kindergarten: 168; Grade 1: 207/Geographical Location: Pacific Northwest: Sample drawn from 7 elementary schools in one district of 5500 students/ Socioeconomic Status: Students qualifying for free and reduced lunch: Range of 27% to 69% across 7 participating schools/Ethnicity: District population: 13% minorities/ELLs: District Population: 4% English Language Learners Where to Find Materials: Schools can create their own CBM Early Math Fluency assessment materials at no cost, using NumberFly, a free online application:http://www.interventioncentral.org/tools/early-math-fluency-generator This program generates printable student and examiner assessment sheets for CBM Quantity Discrimination, Missing Jim Wright, Presenter www.interventioncentral.org 66 67 ‘How the Common Core Works’ Series © 2013 Jim Wright www.interventioncentral.org 13 Number, and Number Identification. From this site, the user can also download guidelines for administering and scoring these Early Math Fluency measures. Jim Wright, Presenter www.interventioncentral.org 67 68 ‘How the Common Core Works’ Series © 2013 Jim Wright www.interventioncentral.org 1 How To: Assess Mastery of Math Facts With CBM: Computation Fluency Computation Fluency measures a student's accuracy and speed in completing 'math facts' using the basic number operations of addition, subtraction, multiplication, and division. Computation fluency in the elementary grades is a strong predictor of later success in higher-level math coursework (Gersten, Jordan, & Flojo, 2005). For students to attain 'computational fluency', however, they must be both accurate and speedy in solving basic math facts--ideally through automatic recall (VanDerHeyden & Burns, 2008). In an influential report, the National Mathematics Advisory Panel (2008) stressed the need for students to become proficient in math facts, calling on schools to make it a priority to "develop automatic recall of addition and related subtraction facts, and of multiplication and related division facts." (p. xix). The Common Core Standards also recognize the importance of computation fluency. For example, a 4thgrade math standard in Number and Operations in Base Ten (CCSM.4.NBT.4) states that the student will "fluently add and subtract multi-digit whole numbers using the standard algorithm" (National Governors Association Center for Best Practices et al., 2010; p. 29). However, the challenge for teachers is to define specifically what level of performance is required to identify a student as fluent in compuation. CBM-Computation Fluency is a brief, timed assessment that can indicate to teachers whether a student is developing computation fluency and is thus on track to master grade-appropriate math facts (basic computation problems). This assessment can be administered to an individual student or to larger groups. The student is given a worksheet containing math facts and is given 2 minutes to answer as many problems as possible. The worksheet is then collected and scored, with the student receiving credit for each correct digit in his or her answers. Teachers can then compare any student's performance to research norms to determine whether that student is at risk because of delayed computational skills (Burns, VanDerHeyden, & Jiban, 2006). Computation Fluency Measures: How to Access Resources. Teachers who would like to screen their students in grades 1 through 6 for possible delays in computation skills can obtain these free Computation Fluency assessment resources: (1) materials for assessment, (2) guidelines for administration and scoring, and (3) research-based norms. Materials for assessment. Schools can customize their own CBM Computation Fluency assessment materials at no cost, using the Math Worksheet Generator, a free online application: http://www.interventioncentral.org/teacher-resources/math-work-sheet-generator This program generates printable student and examiner assessment sheets for CBM Computation Fluency. Guidelines for administration and scoring. Instructions for preparing, administering, and scoring CBMComputation Fluency assessments appear later in this document: Research-based norms. A table, Curriculum-Based Measurement: Computation Fluency Norms is included in this document. The table contains fluency benchmarks for grades 1-6, drawn from several research studies (e.g., Burns, VanDerHeyden, & Jiban, 2006). References Jim Wright, Presenter www.interventioncentral.org 68 69 ‘How the Common Core Works’ Series © 2013 Jim Wright www.interventioncentral.org 2 Burns, M. K., VanDerHeyden, A. M., & Jiban, C. L. (2006). Assessing the instructional level for mathematics: A comparison of methods. School Psychology Review, 35, 401-418. Gersten, R., Jordan, N. C., & Flojo, J. R. (2005). Early identification and interventions for students with mathematics difficulties. Journal of Learning Disabilities, 38, 293-304. Hosp, M.K., Hosp, J. L., & Howell, K. W. (2007). The ABCs of CBM. New York: Guilford. National Governors Association Center for Best Practices & Council of Chief State School Officers. (2010). Common core state standards for mathematics. Washington, DC: Authors. Retrieved from http://www.corestandards.org/ National Mathematics Advisory Panel. (2008). Foundations for success: The final report of the National Mathematics Advisory Panel. Washington, DC. U.S. Department of Education. Retrieved from http://www2.ed.gov/about/bdscomm/list/mathpanel/index.html VanDerHeyden, A. M., & Burns, M. K. (2008). Examination of the utility of various measures of mathematics proficiency. Assessment for Effective Intervention, 33, 215-224. Jim Wright, Presenter www.interventioncentral.org 69 70 ‘How the Common Core Works’ Series © 2013 Jim Wright www.interventioncentral.org 3 Curriculum-Based Measurement-Computation Fluency: Guidelines for Use CBM-Computation Fluency: Description CBM-Computation Fluency measures a student's accuracy and speed in completing 'math facts' using the basic number operations of addition, subtraction, multiplication, and division. CBM-Computation Fluency probes are 2-minute assessments of basic math facts that are scored for number of 'correct digits'. There are 2 types of CBM math probes, single-skill worksheets (those containing like problems) and multiple-skill worksheets (those containing a mix of problems requiring different math operations). Singleskill probes give instructors good information about Figure 1: A Sampling of Math Computational students' mastery of particular problem-types, while Goals for Addition, Subtraction, Multiplication, multiple-skill probes allow the teacher to test children's and Division (from Wright, 2002). math competencies on a range of computational objectives during a single CBM session. Addition Two 1-digit numbers: sums to 10 Both types of math probes can be administered either Two 3-digit numbers: no regrouping individually or to groups of students. The examiner 1- to 2-digit number plus 1- to 2-digit number: hands the worksheet(s) out to those students selected regrouping for assessment. Next, the examiner reads aloud the directions for the worksheet. Then the signal is given to Subtraction start, and students proceed to complete as many items Two 1-digit numbers: 0 to 9 as possible within 2 minutes. The examiner collects the 2-digit number from a 2-digit number: no worksheets at the end of the assessment for scoring. regrouping 2-digit number from a 2-digit number: regrouping CBM-Computation Fluency: Materials The following materials are needed to administer CBMMultiplication Computation Fluency: Multiplication facts: 0 to 9 2-digit number times 1-digit number: no Student and examiner copies of CBM Computation regrouping Fluency Probes 3-digit number times 1-digit number: regrouping Stopwatch Pencils for students Division CBM-Computation Fluency: Preparation After computational objectives have been selected, the instructor is ready to prepare math probes. The teacher may want to create single-skills probes, multiple-skill probes, or both types of CBM math worksheets. The teacher will probably want to consult the Common Core State Standards for Mathematics or district math curriculum when selecting the kinds of problems to include in the single- or multiple-skill probe. Division facts: 0 to 9 2-digit number divided by 1-digit number: no remainder 2-digit number divided by 1-digit number: remainder Wright, J. (2002) Curriculum-Based Assessment Math Computation Probe Generator: MultipleSkill Worksheets in Mixed Skills. Retrieved from http://www.interventioncentral.org/ teacher-resources/math-work-sheet-generator Creating the single-skill math probe. As the first step in putting together a single-skill math probe, the teacher will select one computational objective as a guide. The worksheet, then, will consist of problems randomly constructed that conform to the computational objective chosen. Jim Wright, Presenter www.interventioncentral.org 70 71 ‘How the Common Core Works’ Series © 2013 Jim Wright 4 www.interventioncentral.org For example, the instructor may select any of the computational objectives in Figure 1 as the basis for a math probe. The teacher would then construct a series of problems that match the computational goal, as in Figure 2. In general, single-skill math probes should contain between 80 and 200 problems, and worksheets should have items on both the front and back of the page. Adequate space should also be left for the student to show his or her work, especially with more complex problems such as long division. ------------------------------------------------------------------------------------------------------------------------------------------------------------------------------------------------------- Figure 2: Example of a single-skill math probe: Three to five 3- and 4-digit numbers: no regrouping + + | | | | | 105 600 293 2031 + 531 + 2322 | | | | | + + 111 717 260 | | | | | 634 + 8240 + 203 | | | | | ------------------------------------------------------------------------------------------------------------------------------------------------------------------------------------------------------- Creating the Multiple-skill Math Probe. To assemble a multiple-skill math probe, the instructor will first select the range of math operations and of problem-types that will make up the probe. Once the computational objectives have been ------------------------------------------------------------------------------------------------------------------------------------------------------------------------------------------------------- Figure 3: Example of a multiple-skill math probe: Division: 3-digit number divided by 1-digit number: no remainder Subtraction: 2-digit number from a 2-digit number: regrouping Multiplication” 3-digit number times 1-digit number: no regrouping Division: Two 3-digit numbers: no regrouping 9/431 | | | | | 20 -18 | | | | | 113 2 x | | | | | + + + 106 172 200 600 | | | | | ------------------------------------------------------------------------------------------------------------------------------------------------------------------------------------------------------- chosen, the teacher can make up a worksheet of mixed math facts conforming to those objectives. Using our earlier example, the teacher who wishes to estimate the proficiency of his 4th-grade math group may decide to create a multiple-skills CBM probe. He could choose to sample only those problem-types that his students have either mastered or are presently being taught. Figure 3 shows four computation skills with matching sample problems that might appear on a worksheet of mixed math facts. NOTE: Schools can customize their own CBM Computation Fluency assessment materials at no cost, using the Math Worksheet Generator, a free online application: http://www.interventioncentral.org/teacher-resources/math-work-sheet-generator CBM-Computation Fluency: Directions for Administration 1. The examiner distributes copies of math probes to all the students in the group, face down. (Note: These probes may also be administered individually). The examiner says to the students: "The sheets on your desk are math facts." 2. If the students are to complete a single-skill probe, the examiner says: "All the problems are [addition or subtraction or multiplication or division] facts." Jim Wright, Presenter www.interventioncentral.org 71 72 ‘How the Common Core Works’ Series © 2013 Jim Wright www.interventioncentral.org 5 If the students are to complete a multiple-skill probe, the examiner then says: "There are several types of problems on the sheet. Some are addition, some are subtraction, some are multiplication, and some are division [as appropriate]. Look at each problem carefully before you answer it." 3. The examiner then says: "When I say 'begin', turn the worksheet over and begin answering the problems. Start on the first problem on the left on the top row [point]. Work across and then go to the next row. If you can't answer a problem, make an 'X' on it and go to the next one. If you finish one side, go to the back. Are there any questions? ". 4. The examiner says 'Start' and starts the stopwatch. While the students are completing worksheets, the examiner and any other adults assisting in the assessment circulate around the room to ensure that students are working on the correct sheet and that they are completing problems in the correct order (rather than picking out only the easy items).. 5. After 2 minutes have passed, the examiner says, "Stop" and collects the CBM computation probes for scoring. 6. Initial Assessment: If the examiner is assessing the student for the first time, the examiner administers a total of 3 computation probes during the session using the above procedures and takes the median (middle) score as the best estimate of the student's computation fluency. Progress-Monitoring: If the examiner is monitoring student growth in computation (and has previously collected CBM-Computation Fluency data), only one computation probe is given in the session. CBM-Computation Fluency: Directions for Practice If the student is not yet familiar with CBM-Computation Fluency probes, the teacher can administer one or more practice computation probes (using the administration guidelines above) and provide coaching and feedback as needed until assured that the student fully understands the assessment. CBM-Computation Fluency: Scoring Guidelines Traditional approaches to computational assessment usually give credit for the total number of correct answers appearing on a worksheet. If the answer to a problem is found to contain one or more incorrect digits, that problem is marked wrong and receives no credit. In contrast to this all-or-nothing marking system, CBM assigns credit to each individual correct digit appearing in the solution to a math fact. On the face of it, a math scoring system that awards points according to the number of correct digits may appear unusual, but this alternative approach is grounded in good academic-assessment research and practice. By separately scoring each digit in the answer of a computation problem, the instructor is better able to recognize and to give credit for a student's partial math competencies. Scoring computation problems by the digit rather than as a single answer also allows for a more minute analysis of a child's number skills. Imagine, for instance, that a student was given a CBM math probe consisting of addition problems, sums less than or equal to 19 (incorrect digits appear in boldface and italics): ------------------------------------------------------------------------------------------------------------------------------------------------------------------------------------------------------Figure 4: Example of completed problems from a single-skill math probe + + 105 600 293 988 | | | | | 2031 + 531 + 2322 4884 | | | | | + + 111 717 260 1087 | | | | | 634 + 8240 + 203 9077 | | | | | ------------------------------------------------------------------------------------------------------------------------------------------------------------------------------------------------------- Jim Wright, Presenter www.interventioncentral.org 72 73 ‘How the Common Core Works’ Series © 2013 Jim Wright www.interventioncentral.org 6 If the answers in Figure 4 were scored as either correct or wrong, the child would receive a score of 1 correct answer out of 4 possible answers (25 percent). However, when each individual digit is scored, it becomes clear that the student actually correctly computed 12 of 15 possible digits (80 percent). Thus, the CBM procedure of assigning credit to each correct digit demonstrates itself to be quite sensitive to a student's emerging, partial competencies in math computation. The following scoring rules will aid the instructor in marking single- and multiple-skill math probes: Individual correct digits are counted as correct. Reversed or rotated digits are not counted as errors unless their change in position makes them appear to be another digit (e.g., 9 and 6). Incorrect digits are counted as errors. Digits that appear in the wrong place value, even if otherwise correct, are scored as errors. Example "873" is the correct answer to this problem, but no credit can be given since the addition of the 0 97 pushes the other digits out of their proper placex9 8730 value positions. The student is given credit for "place-holder" numerals that are included simply to correctly align the problem. As long as the student includes the correct space, credit is given whether or not a "0" has actually been inserted. Example 55 x 82 110 4400 4510 In more complex problems such as advanced multiplication, the student is given credit for all correct numbers that appear below the line. Example 33 x 28 264 660 924 Since the student correctly placed 0 in the "placeholder" position, it is given credit as a correct digit. Credit would also have been given if the space were reserved but no 0 had been inserted. Credit is given for all work below the line. In this example, the student earns credit for 9 correct digits. Credit is not given for any numbers appearing above the line (e.g., numbers marked at the top of number columns to signify regrouping). Example 1 46 + 39 85 Jim Wright, Presenter Credit is given for the 2 digits below the line. However, the carried "1" above the line does not receive credit. www.interventioncentral.org 73 74 ‘How the Common Core Works’ Series © 2013 Jim Wright Jim Wright, Presenter www.interventioncentral.org www.interventioncentral.org 7 74 75 ‘How the Common Core Works’ Series © 2013 Jim Wright www.interventioncentral.org 8 Curriculum-Based Measurement: Computation Fluency Norms (Burns, VanDerHeyden, & Jiban, 2006; Deno & Mirkin, 1977; Fuchs & Fuchs, 1993; Fuchs & Fuchs, n.d.)* CBM-Computation Fluency measures a student's accuracy and speed in completing 'math facts' using the basic number operations of addition, subtraction, multiplication, and division. Computation fluency in the elementary grades is a strong predictor of later success in higher-level math coursework (Gersten, Jordan, & Flojo, 2005). CBM-Computation Fluency probes are 2-minute assessments of basic math facts that are scored for number of 'correct digits'. Grade End of Year Benchmark: Correct Digits per 2 Mins 2 3 4 5 Grade 6 Jim Wright, Presenter Weekly Growth: 'Ambitious' (Fuchs & Fuchs, n.d.) (Fuchs & Fuchs, 1993) (Fuchs & Fuchs, 1993) 20 0.3 0.5 1 Grade Weekly Growth: 'Realistic' Performance Level Mastery Instructional Frustration Mastery Instructional Frustration Mastery Instructional Frustration Mastery Instructional Frustration Performance Level Mastery Instructional Frustration Correct Digits per 2 Mins (Burns, VanDerHeyden, & Jiban, 2006) More than 31 14-31 Less than 14 More than 31 14-31 Less than 14 More than 49 24-49 Less than 24 More than 49 24-49 Less than 24 Correct Digits per 2 Mins (Deno & Mirkin, 1977) More than 79 40-79 Less than 40 www.interventioncentral.org Weekly Growth: 'Realistic' Weekly Growth: 'Ambitious' (Fuchs & Fuchs, 1993) (Fuchs & Fuchs, 1993) 0.3 0.5 0.3 0.5 0.75 1.2 0.75 1.2 Weekly Growth: 'Realistic' Weekly Growth: 'Ambitious' (Fuchs & Fuchs, 1993) (Fuchs & Fuchs, 1993) 0.45 1.0 75 76 ‘How the Common Core Works’ Series © 2013 Jim Wright www.interventioncentral.org 9 References: Burns, M. K., VanDerHeyden, A. M., & Jiban, C. L. (2006). Assessing the instructional level for mathematics: A comparison of methods. School Psychology Review, 35, 401-418. Deno, S. L., & Mirkin, P. K. (1977). Data-based program modification: A manual. Reston, VA: Council for Exceptional Children. Fuchs, L. S., & Fuchs, D. (n.d.). Using curriculum-based measurement for progress monitoring in math. National Center on Student Progress Monitoring. Retrieved from http://www.studentprogress.org Fuchs, L. S., & Fuchs, D. (1993). Formative evaluation of academic progress: How much growth can we expect? School Psychology Review, 22, 27-49. Gersten, R., Jordan, N. C., & Flojo, J. R. (2005). Early identification and interventions for students with mathematics difficulties. Journal of Learning Disabilities, 38, 293-304. *Reported Characteristics of Student Sample(s) Used to Compile These Norms: Burns, VanDerHeyden, & Jiban, 2006: Number of Students Assessed: 434 students across grades 25/Geographical Location: Southwest: Sample drawn from 1 elementary school/ Socioeconomic Status: 15% rate of Free & Reduced Lunch/ Ethnicity of Sample: 74% Caucasian-non-Hispanic; 17% Hispanic or Latino; 6% African-American; 3% Asian-American; 1% Native American/Limited English Proficiency in Sample: 2% of students. Deno & Mirkin, 1977: Number of Students Assessed: Not reported/Geographical Location: Sample drawn from 1 elementary school; location not reported/ Socioeconomic Status: Not reported/ Ethnicity of Sample: Not reported/Limited English Proficiency in Sample: Not reported. Fuchs & Fuchs, n.d.: Number of Students Assessed: Not reported/Geographical Location: Not reported/ Socioeconomic Status: Not reported/ Ethnicity of Sample: Not reported/Limited English Proficiency in Sample: Not reported. Fuchs & Fuchs, 1993: Number of Students Assessed: Year 1: 177 students in grades 1-6; Year 2:1208 students across grades 1-6/Geographical Location: Upper Midwest: Sample drawn from 5 elementary schools/ Socioeconomic Status: 33%-55% rate of Free & Reduced Lunch across participating schools/ Ethnicity of Sample: Not reported/Limited English Proficiency in Sample: Not reported. Where to Find Materials: Schools can create their own CBM Computation Fluency assessment materials at no cost, using the Math Worksheet Generator, a free online application: http://www.interventioncentral.org/teacher-resources/math-work-sheet-generator This program generates printable student and examiner assessment sheets for CBM Computation Fluency. Limitations of These Research Norms: Norms generated from small-scale research studies--like those used here-provide estimates of student academic performance based on a sampling from only one or two points in time, rather than a more comprehensive sampling across separate fall, winter, and spring screenings. These norms also have been compiled from a relatively small student sample that is not fully representative of a diverse 'national' population. Nonetheless, norms such as these are often the best information that is publically available for basic academic skills and therefore do have a definite place in classroom instruction decision-making. These norms can be useful in general education for setting student performance outcome goals for core instruction and/or any level of academic intervention. Similarly, these norms can be used to set performance goals for students with special needs. In both cases, however, single-sample norms would be used only if more comprehensive fall/winter/spring academic performance norms are not available. Jim Wright, Presenter www.interventioncentral.org 76 77 ‘How the Common Core Works’ Series © 2013 Jim Wright 1 www.interventioncentral.org How To: Track Growth in Written Expression in the Elementary Grades With CBM The act of writing is complex. Translating thought into written expression requires that the student master a host of foundation writing skills, including the physical production of text; and mastery of rules of capitalization, spelling, punctuation, and syntax (Robinson & Howell, 2008). Tracking student growth in emerging writing skills can be confusing and time-consuming for teachers. However, Curriculum-Based Measurement-Written Expression (CBM-WE) is an efficient, reliable method of formative student assessment that yields numeric indicators that are instructionally useful--such as total words written, correctly spelled words, and correct writing sequences (Gansle et al., 2006). CBM-WE probes are group-administered writing samples with an administration time of about 4 minutes. CBM-Written Expression is therefore a powerful means to monitor a student's progress in the mechanics and conventions of writing. CBM-Written Expression: What It Measures. Teachers have several assessment options to choose from when using CBM-Written Expression (Gansle et al., 2006; Wright, 1992): Total Words Written (TWW): This measure is a count of the total words written during the CBM-WE assessment. Teachers might select Total Words Written as a progress-monitoring target if the student needs to focus on writing fluency (getting more words onto the page). Correctly Spelled Words (CSW): This measure is a count of correctly spelled words written during the CBM-WE assessment. If poor spelling is a blocker to student writing, the teacher may select this monitoring target. Correct Writing Sequences (CWS): This measure is a tabulation of correct 'writing sequences' written during the CBM-WE assessment. One Correct Writing Sequence is scored whenever two adjacent units of writing (e.g., two words appearing next to each other) are found to be correct in their punctuation, capitalization, spelling, and syntactical and semantic usage. When the student is expected to have mastered the basic mechanics and conventions of writing, Correct Writing Sequences are a useful method to track this group of interrelated skills. CBM-Written Expression Fluency Measures: How to Access Resources. Teachers who wish to screen their students in basic writing skills can obtain these free CBM-Written Expression assessment resources: (1) materials for assessment, (2) guidelines for administration and scoring, and (3) research-based norms. Materials for assessment. Schools can create their own CBM Written Expression Fluency assessment materials at no cost, using the Written Expression Probe Generator, a free online application: http://www.interventioncentral.org/tools/writing-probe-generator This program allows the user to customize and to generate printable story-starter worksheets in PDF format. Guidelines for administration and scoring. Instructions for preparing, administering, and scoring CBM-Written Expression assessments appear later in this document: Research-based norms. A table, Curriculum-Based Measurement: Written Expression Fluency Norms, is included in this document. The norms include fluency benchmarks for grades 1-6 (Malecki & Jewell, 2003) and growth norms for grades 1-4 (Tadatada, 2011). References Jim Wright, Presenter www.interventioncentral.org 77 78 ‘How the Common Core Works’ Series © 2013 Jim Wright 2 www.interventioncentral.org Gansle, K. A., VanDerHeyden, A. M., Noell, G. H., Resetar, J. L., & Williams, K. L. (2006). The technical adequacy of curriculum-based and rating-based measures of written expression for elementary school students. School Psychology Review, 35, 435-450. Malecki, C. K., & Jewell, J. (2003). Developmental, gender, and practical considerations in scoring curriculum-based measurement writing probes. Psychology in the Schools, 40, 379-390. McMaster, K., & Espin, C. (2007). Technical features of curriculum-based measurement in writing: A literature review. Journal of Special Education, 41(2), 68-84. Robinson, L. K., & Howell, K. W. (2008). Best practices in curriculum-based evaluation & written expression. In A. Thomas & J. Grimes (Eds.), Best practices in school psychology V (pp. 439-452). Bethesda, MD: National Association of School Psychologists. Tadatada, A. (2011). Growth rates of curriculum-based measurement-written expression at the elementary school level. Unpublished master's thesis, Western Kentucky University, Bowling Green. Wright, J. (1992). Curriculum-based measurement: A manual for teachers. Retrieved September 23, 20011, from http://www.jimwrightonline.com/pdfdocs/cbaManual.pdf Jim Wright, Presenter www.interventioncentral.org 78 79 ‘How the Common Core Works’ Series © 2013 Jim Wright 3 www.interventioncentral.org Curriculum-Based Measurement-Written Expression: Guidelines for Use CB-Written Expression: Description (McMaster & Espin, 2007) CBM-Written Expression probes are simple to administer and offer several scoring options. Written-expression probes may be given individually or to groups of students. The examiner prepares a lined composition sheet with a story-starter sentence or partial sentence at the top. The student thinks for 1 minute about a possible story to be written from the story-starter, then spends 3 minutes writing the story. The examiner collects the writing sample for scoring. Depending on the preferences of the teacher, the writing probe can be scored in several ways, as explained below (from Wright, 1992). CBM-Written Expression: Materials The following materials are needed to administer CBM-Written Expression probes: Student copy of CBM writing probe with story-starter (the process for creating story-starters is described below) Stopwatch Pencils for students CBM-Written Expression: Preparation Before administering CBM-Written Expression, the teacher selects a 'story starter' (a brief introductory sentence or partial sentence) to serve as a prompt to elicit student story writing. The teacher selects a story-starter and places it at the top of a lined composition sheet. The story-starter should avoid wording that encourages students to generate lists. It should also be open-ended, requiring the writer to build a narrative rather than simply to write down a "Yes" or "No" response. Schools can create their own CBM Written Expression Fluency assessment materials at no cost, using the Written Expression Probe Generator, a free online application: http://www.interventioncentral.org/tools/writing-probegenerator This program allows the user to customize and to generate printable story-starter worksheets in PDF format. The CBM writing probe in Figure 1 is an example of how a such a probe might be formatted. (This particular probe was used in a 5th-grade classroom.): ------------------------------------------------------------------------------------------------------------------------------------------------------------------------------------------------------- Figure 1: Example of a CBM writing probe CBM Writing Probe Name: _______________________ Grade: ______ Date: ______________ One day, I was out sailing. A storm carried me far out to sea and wrecked my boat on a desert island. ____________________________________________________ __________________________________________________________________________ __________________________________________________________________________ ------------------------------------------------------------------------------------------------------------------------------------------------------------------------------------------------------- Jim Wright, Presenter www.interventioncentral.org 79 80 ‘How the Common Core Works’ Series © 2013 Jim Wright www.interventioncentral.org 4 CBM-Written Expression: Directions for Administration 1. The examiner distributes copies of CBM writing probes to all the students in the group. (Note: These probes may also be administered individually). 2. The examiner says to the students: I want you to write a story. I am going to read a sentence to you first, and then I want you to write a short story about what happens. You will have 1 minute to think about the story you will write and then have 3 minutes to write it. Do your best work. If you don't know how to spell a word, you should guess. Are there any questions? For the next minute, think about . . . [insert story-starter]. 3. The examiner starts the stopwatch. At the end of 1 minute, the examiner says, Start writing. 4. While the students are writing, the examiner and any other adults helping in the assessment circulate around the room. If students stop writing before the 3-minute timing period has ended, monitors encourage them to continue writing. 5. After 3 additional minutes, the examiner says, Stop writing. CBM writing probes are collected for scoring. 6. Initial Assessment: If the examiner is assessing the student for the first time, the examiner administers a total of 3 CBM:WE probes during the session, using the above procedures and takes the median (middle) score as the best estimate of the student's CBM:WE skills. Progress-Monitoring: If the examiner is monitoring student growth in computation (and has previously collected CBM:WE data), only one CBM:WE probe is given in the session. CBM-Written Expression: Directions for Practice If the student is not yet familiar with CBM:WE assessments, the teacher can administer one or more practice CBM:WE probes (using the administration guidelines above) and provide coaching and feedback as needed until assured that the student fully understands the assessment. CBM-Written Expression: Scoring Guidelines The instructor has several options when scoring CBM writing probes. Student writing samples may be scored according to the: 1. Total Words Written (TWW), 2. Correctly Spelled Words (CSW), or 3. Correct Writing Sequences (One Correct Writing Sequence is scored whenever two adjacent units of writing (e.g., two words appearing next to each other) are found to be correct in their punctuation, capitalization, spelling, and syntactical and semantic usage.) Scoring methods differ both in the amount of time that they require of the instructor and in the type of information that they provide about a student's writing skills. Advantages and potential limitations of each scoring system are presented below. Total Words Written (TWW). The examiner counts up and records the total number of words written during the 3minute writing probe. Misspelled words are included in the tally, although numbers written in numeral form (e.g., 5, 17) are not counted. Calculating total words is the quickest of scoring methods. A drawback, however, is that it yields only a rough estimate of writing fluency (that is, of how quickly the student can put words on paper) without examining the accuracy of spelling, punctuation, and other writing conventions. A 6th-grade student wrote the CBM writing sample in Figure 2. Using the total-words scoring formula, this sample is found to contain 45 words, including misspellings. Jim Wright, Presenter www.interventioncentral.org 80 81 ‘How the Common Core Works’ Series © 2013 Jim Wright www.interventioncentral.org 5 --------------------------------------------------------------------------------------------------------------------------------------------------------------------------------------------------- Figure 2: CBM writing sample scored for Total Words Written: I woud drink water from the ocean 7 words and I woud eat the fruit off of 8 words the trees. Then I woud bilit a 7 words house out of trees, and I woud 7 words gather firewood to stay warm. I 6 words woud try and fix my boat in my 8 words spare time. 2 words Total=45 words ------------------------------------------------------------------------------------------------------------------------------------------------------------------------------------------------------- Correctly Spelled Words. The examiner counts up only those words in the writing sample that are spelled correctly. Words are considered separately, not within the context of a sentence. When scoring a good rule of thumb is to determine whether--in isolation--the word represents a correctly spelled term in English. If it does, the word is included in the tally. Assessing the number of correctly spelled words has the advantage of being quick. Also, by examining the accuracy of the student's spelling, this approach monitors to some degree a student's mastery of written language. As seen in figure 3, our writing sample is contains 39 correctly spelled words. --------------------------------------------------------------------------------------------------------------------------------------------------------------------------------------------------- Figure 3: CBM writing sample scored for Correctly Spelled Words I woud drink water from the ocean 6 correctly spelled words and I woud eat the fruit off of 7 correctly spelled words the trees. Then I woud bilit a 5 correctly spelled words house out of trees, and I woud 6 correctly spelled words gather firewood to stay warm. I 6 correctly spelled words woud try and fix my boat in my 7 correctly spelled words spare time. 2 correctly spelled words Total=39 correctly spelled words ------------------------------------------------------------------------------------------------------------------------------------------------------------------------------------------------------- Correct Writing Sequences. When scoring correct writing sequences, the examiner goes beyond the confines of the isolated word to consider units of writing and their relation to one another. Using this approach, the examiner starts at the beginning of the writing sample and looks at each successive pair of writing units (writing sequence). Words are Jim Wright, Presenter www.interventioncentral.org 81 82 ‘How the Common Core Works’ Series © 2013 Jim Wright 6 www.interventioncentral.org considered separate writing units, as are essential marks of punctuation. To receive credit, writing sequences must be correctly spelled and be grammatically correct. The words in each writing sequence must also make sense within the context of the sentence. In effect, the student's writing is judged according to the standards of informal standard American English. A caret (^) is used to mark the presence of a correct writing sequence. ------------------------------------------------------------------------------------------------------------------------------------------------------------------------------------------------------- Figure 4: An illustration of selected scoring rules for correct writing sequences Since the first word begins the sentence correctly, it is marked as a correct writing sequence. ^It^was^dark^.^Nobody ^could seen the^trees^of ^the forrest. Misspelled words cannot be counted as correct writing sequences. Because the period is considered essential punctuation, it is joined with the words before and after it to make two correct writing sequences. Grammatical or syntactical errors cannot be counted as correct writing sequences. ------------------------------------------------------------------------------------------------------------------------------------------------------------------------------------------------------- Jim Wright, Presenter www.interventioncentral.org 82 83 ‘How the Common Core Works’ Series © 2013 Jim Wright 7 www.interventioncentral.org The following scoring rules will aid the instructor in determining correct writing sequences: Correctly spelled words make up a correct writing sequence (reversed letters are acceptable, so long as they do not lead to a misspelling): Example ^Is^that^a^red^car^? Necessary marks of punctuation (excluding commas) are included in correct writing sequences: Example ^Is^that^a^red^car^? Syntactically correct words make up a correct writing sequence: Example ^Is^that^a^red^car^? ^Is^that^a^car red? Semantically correct words make up a correct writing sequence: Example ^Is^that^a^red^car^? ^Is^that^a read car^? If correct, the initial word of a writing sample is counted as a correct writing sequence: Example ^Is^that^a^red^car^? Titles are included in the correct writing sequence count: Example ^The^Terrible^Day Not surprisingly, evaluating a writing probe according to correct writing sequences is the most time-consuming of the scoring methods presented here. It is also the scoring approach, however, that yields the most comprehensive information about a student's writing competencies. While further research is needed to clarify the point, it also seems plausible that the correct writing sequence method is most sensitive to short-term student improvements in writing. Presumably, advances in writing skills in virtually any area (e.g., spelling, punctuation) could quickly register as higher writing sequence scores. Our writing sample in Figure 5 is found to contain 37 correct writing sequences. Jim Wright, Presenter www.interventioncentral.org 83 84 ‘How the Common Core Works’ Series © 2013 Jim Wright www.interventioncentral.org 8 --------------------------------------------------------------------------------------------------------------------------------------------------------------------------------------------------- Figure 5: CBM Writing sample scored for Correct Writing Sequence (Each correct writing sequence is marked with a caret(^)). (^)) ^I woud drink^water^from^the^ocean 5 correct writing sequences ^and^I woud eat^the^fruit^off^of 6 correct writing sequences ^the^trees^.^Then^I woud bilit a 5 correct writing sequences ^house^out^of^trees, ^and^I woud 6 correct writing sequences gather^firewood^to^stay^warm^.^I 6 correct writing sequences woud try^and^fix^my^boat^in^my 6 correct writing sequences ^spare^time^. 3 correct writing sequences Total = 37 correct writing sequences ------------------------------------------------------------------------------------------------------------------------------------------------------------------------------------------------------- References McMaster, K., & Espin, C. (2007). Technical features of curriculum-based measurement in writing: A literature review. Journal of Special Education, 41(2), 68-84. Wright, J. (1992). Curriculum-based measurement: A manual for teachers. Retrieved September 23, 20011, from http://www.jimwrightonline.com/pdfdocs/cbaManual.pdf Jim Wright, Presenter www.interventioncentral.org 84 85 ‘How the Common Core Works’ Series © 2013 Jim Wright www.interventioncentral.org 9 Curriculum-Based Measurement: Written-Expression Fluency Norms (Gansle, VanDerHeyden, Noell, Resetar, & Williams, 2006; Malecki & Jewell, 2003; Tadatada, 2011)* CBM-Written Expression assessments measure the mechanics and conventions of writing and can yield numeric indicators such as total words written, correctly spelled words, and correct writing sequences (Gansle et al., 2006). CBM-Written Expression probes are group-administered writing samples with an administration time of about 4 minutes. Total Words Written (TWW): This measure is a count of the total words written during the CBM-WE assessment. Grade 1 2 3 4 5 6 Fall TWW (≈16th%ile to 84th%ile) 8 24 36 41 51 44 3↔13 14↔34 23↔49 30↔52 34↔68 31↔57 (Malecki & Jewell, 2003) Fall:+/-1 SD Spring TWW (≈16th%ile to 84th%ile) Spring: +/-1 SD 14 31 36 46 67 58 7↔21 19↔43 24↔48 30↔62 43↔91 44↔72 (Malecki & Jewell, 2003) Weekly Growth (Tadatada, 2011) 0.45 0.43 0.35 0.25 --- Correctly Spelled Words (CSW): This measure is a count of correctly spelled words written during the CBM-WE assessment. Grade 1 2 3 4 5 6 Fall CSW (≈16th%ile to 84th%ile) 5 20 32 38 48 42 1↔9 10↔30 19↔45 26↔50 31↔65 29↔55 (Malecki & Jewell, 2003) Fall:+/-1 SD Spring CSW (≈16th%ile to 84th%ile) Spring: +/-1 SD 10 27 33 44 65 56 3↔17 15↔39 21↔45 29↔59 42↔88 41↔71 (Malecki & Jewell, 2003) Weekly Growth (Tadatada, 2011) 0.45 0.46 0.37 0.26 --- Correct Writing Sequences (CWS): This measure is a tabulation of correct 'writing sequences' written during the CBM-WE assessment. One Correct Writing Sequence is scored whenever two adjacent units of writing (e.g., two words appearing next to each other) are found to be correct in their punctuation, capitalization, spelling, and syntactical and semantic usage. Grade 1 2 3 4 5 6 Fall CWS (≈16th%ile to 84th%ile) 2 15 28 38 46 41 0↔4 5↔25 14↔42 25↔51 28↔64 27↔55 (Malecki & Jewell, 2003) Jim Wright, Presenter Fall:+/-1 SD Spring CWS (≈16th%ile to 84th%ile) 7 24 31 42 63 54 1↔13 11↔37 18↔44 26↔58 40↔86 37↔71 (Malecki & Jewell, 2003) www.interventioncentral.org Spring: +/-1 SD Weekly Growth (Tadatada, 2011) 0.36 0.44 0.35 0.22 --- 85 86 ‘How the Common Core Works’ Series © 2013 Jim Wright www.interventioncentral.org 10 References: Gansle, K. A., VanDerHeyden, A. M., Noell, G. H., Resetar, J. L., & Williams, K. L. (2006). The technical adequacy of curriculum-based and rating-based measures of written expression for elementary school students. School Psychology Review, 35, 435-450. Malecki, C. K., & Jewell, J. (2003). Developmental, gender, and practical considerations in scoring curriculumbased measurement writing probes. Psychology in the Schools, 40, 379-390. Tadatada, A. (2011). Growth rates of curriculum-based measurement-written expression at the elementary school level. Unpublished master's thesis, Western Kentucky University, Bowling Green. * Reported Characteristics of Student Sample(s) Used to Compile These Norms: Malecki & Jewell, 2003: Number of Students Assessed: 946 Total; Grade 1: Fall:133 -Spring:123; Grade 2: Fall:200 -Spring:156; Grade 3: Fall:168 -Spring:109; Grade 4: Fall:192 -Spring:182; Grade 5: Fall:127 -Spring:120; Grade 6: Fall:57 -Spring:54/Geographical Location: Northern Illinois: Sample drawn from 5 suburban and rural schools across three districts/ Socioeconomic Status: Not reported/Ethnicity of Sample: Not reported/English Language Learners in Sample: Not reported. Tadatada, 2011: Number of Students Assessed: 1,004 Total; Grade 1: 207; Grade 2: 208; Grade 3: 204; Grade 4: 220; Grade 5: 165/Geographical Location: Bowling Green, KY: Sample drawn from 5 elementary schools in single district/ Socioeconomic Status: Not reported/Ethnicity of Sample: 64% White; 18% African-American; 13% Hispanic; 3% Asian; 3% Other/Limited English Proficiency in Sample: 19%. Where to Find Materials: Schools can create their own CBM Written Expression Fluency assessment materials at no cost, using the Written Expression Probe Generator, a free online application: http://www.interventioncentral.org/tools/writing-probe-generator This program allows the user to customize and to generate printable story-starter worksheets in PDF format. Limitations of These Research Norms: Norms generated from small-scale research studies--like those used here-provide estimates of student academic performance based on a sampling from only one or two points in time, rather than a more comprehensive sampling across separate fall, winter, and spring screenings. These norms also have been compiled from a relatively small student sample that is not fully representative of a diverse 'national' population. Nonetheless, norms such as these are often the best information that is publically available for basic academic skills and therefore do have a definite place in classroom instruction decision-making. These norms can be useful in general education for setting student performance outcome goals for core instruction and/or any level of academic intervention. Similarly, these norms can be used to set performance goals for students with special needs. In both cases, however, single-sample norms would be used only if more comprehensive fall/winter/spring academic performance norms are not available. Jim Wright, Presenter www.interventioncentral.org 86


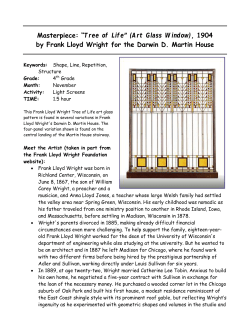


© Copyright 2026