
HOW TO INCREASE EMPLOYEE’S DISCIPLINARY IN FACULTY OF MEDICINE
HOW TO INCREASE EMPLOYEE’S DISCIPLINARY IN FACULTY OF MEDICINE OF DIPONEGORO UNIVERSITY THESIS Developed by : RETNO SETYOWATI NIM. C4A099144 MAGISTER MANAGEMENT PROGRAM POSTGRADUATE PROGRAM OF DIPONEGORO UNIVERSITY SEMARANG 2012 1 THESIS APPROVAL We, undersigned, stated that the following thesis : HOW TO INCREASE EMPLOYEE’S DISCIPLINARY IN FACULTY MEDICINE OF DIPONEGORO UNIVERSITY Developed by Retno Setyowati, NIM : C4A099144, had been approved to be defended in front of the Advisory Committee of Magister Management of Diponegoro University on March th , 2012 and accepted as to have met all the criteria and requirements Primary Advisory, Secondary Advisor Dr. Sugiarto PH. Y, SU Dra. Retno Hidayati, MM 2 THESIS LEGITIMATION We, undersigned, stated that the following thesis : HOW TO INCREASE EMPLOYEE’S DISCIPLINARY IN FACULTY MEDICINE OF DIPONEGORO UNIVERSITY Developed by Retno Setyowati, NIM : C4A099144, had been defended in a presentation in front of the Advisory Committee of Magister Management of Diponegoro University on March 31, 2012 and accepted as to have met all the criteria and requirements Primary Advisory, Secondary Advisor Dr. Sugiarto PH. Y, SU Dra. Retno Hidayati, MM Semarang, March 31, 2012 Diponegoro University Postgraduate Program Magister Management Program The Head of the Program Prof. Dr. Sugeng Wahyudi, MM 3 Certification Hereby I certify that this is the origin thesis of mine. The thesis has never been presented before in order to get degree acknowledgement in the Magister Management Program or any other institution. The thesis is genuinely my work and I will be responsible for it. Semarang, March 2012 Retno Setyowati 4 Abstract Human Capital plays an important role in organization. It is the heart of the organization strategy. Many factors embeded in it. Public Service employees as government human capital instead of the contract employees. The quality of the Public Service Employee has recently become a major issue. It is widely known that Public Service employee is lacking of disciplin. The issue discuss most in Public service employee‟s disciplinary is absentheeism. This study presents factors that influence the Public Service employee‟s disciplinary in Faculty of Medicine of Diponegoro University. This research purposes will support the decision – making process to increase the Faculty of Medicine of Diponegoro University employee‟s disciplinary, this study proposing some models analyzed by SEM. The study population is administration staffs in Faculty of Medicine of Dipnegoro University for both Public Service employees and contract employees. The respondents are 120 employees whose given some questionaires related to the study. The result of the data analysis shows that the human capital is influenced by knowledge sharing, empowerment and workplace environment. Whilst human capital influences employee‟s disciplinary positively. Keywords : public service empoyees, knowledge sharing, empowerment, workplace environment, human capital, disciplinary. 5 ACKNOWLEDGEMENTS I would like to express my sincere gratitude for Allah SWT for blessing me. My deep gratitude to every person for giving me a great support to overcome this research. I would like to express my gratitude to deepest gratitude to Prof. Dr. dr. Anies, M.Kes, PKK for giving me a fabulous opportunity to experienced the study, this achievement is yours. Your words of wisdom will always be in my heart. My gratitude to Dr. Y. Sugiarto PH, SU and Dra. Retno Hidayati, MM for supervised me in conducting the research. I‟m indebted because of their knowledge and experiences, great ideas, generous support and guidence in directing this research from the first page. I would like to express my appreciation to Prof. Dr. R. Benny Riyanto, SH, CN, M.Hum for his support. Prof. Dr. Sugeng Wahyudi, MM as the Head of the Magister Management of Diponegoro University, and Dr. Syuhada Sufian, MSIE, lecturer of Strategic concentration of Magister Management of Diponegoro University. Dik Tika, thank you for teaching me the numbers. My dearest parent, my sisters and my brothers, thank you for the love, patience and understanding you have been giving. Your sincere pray, love and support embededd in my heart and encourage me always. My lovely friends at Medical Faculty and Post Graduate Program of Diponegoro University, thank you for your support. 6 Contents Page Cover .................................................. ....................................................... i Thesis proposal approval .................. ....................................................... ii Thesis legitimation …………………. ………………………………… iii Certification ....................................... ...................................................... iv Abstract .............................................. ...................................................... v Acknowledgement ............................. ...................................................... vi Contents ............................................ .................................................... vii Tables .................................................... xii Pictures ………………………………… xvi Attachments .................................................... xiv CHAPTER I. INTRODUCTION ..................................................... 1 1.1.Background ..................................................... 1 1.2.Research problem ................................................... 11 1.3.Research problem formulation .................................................... 16 1.4.Research questions .................................................... 18 1.5.Research goal and purposes .................................................... 18 1.5.1. Research goals .................................................... 18 1.5.2. Research purposes .................................................... 19 1.6. Thesis Outline .................................................... 19 CHAPTER II. LITERATURE REVIEW AND ...................................... 21 2.1. Literature review .................................................... 21 7 2.1.1. Knowledge sharing .................................................... 21 2.1.2. Empowerment .................................................... 25 2.1.3. Workplace environement .................................................... 33 2.1.4. Human Capital .................................................... 35 2.1.5. Employee’s disciplinary .................................................... 43 2.2. Previous researches .................................................... 47 2.3. Hypotheses .................................................... 49 2.3.1. Hypotheses .................................................... 54 2.3.2. Variables dimensions .................................................... 55 CHAPTER III. RESEARCH METHOD ................................................. 62 3.1. Sample and population .................................................... 62 3.2. Data collecting method .................................................... 64 3.3. Analysis technique .................................................... 66 3.4. Validity test and data reliability .................................................... 77 test 3.4.1. Validity test .................................................... 77 3.4.3. Data Reliability test .................................................... 77 CHAPTER IV. RESULT AND DISCUSSION ........................................ 78 4.1. General issue about Faculty Medicine of Diponegoro University …………………………………. 78 4.2 General picture of respondents …………………………………. 80 4.3. Index review …………………………………. 82 4.3.1 Knowledge Sharing Variable ………………………………… 82 4.3.2. Empowerment Variable .................................................... 85 8 4.3.3. Workplace environment variable .................................................... 88 4.3.4. Human Capital variable .................................................... 91 4.3.5. Employee’s disciplinary variable .................................................... 92 4.4. Instrument test .................................................... 93 4.4.1. Reliablity test .................................................... 93 4.5. Data Analysis process and Research Model Test ……………………………….... 95 4.5.1. Step 1: The Development of Theoretical Model .................................................... 95 4.5.2. Step 2 : Path Diagram .................................................... 96 4.5.3. Step 3 : Conversing the Path Diagram in to Equation .................................................... 96 4.5.4. Step 4 :Choosing Matrix .................................................... 97 Input and Estimation Technique 4.5.4.1. Exogenous Construct .................................................... 97 Confirmatory Factor Analysis 4.5.4.2. Confirmatory Factor .................................................. 100 Analysis of Endogenous Construct 4.5.4.3. Structural Equation Model .................................................. 103 4.5.5. Step 5 : Valuing the Problem .................................................. 107 Identification 4.5.6. Step 6 : The Evaluation of .................................................. 107 Goodness of Fit criteria 4.5.6.1 The Normality Data test .................................................. 107 4.5.6.2.Univariate Outlier evaluation .................................................. 109 4.5.6.3. Multivariate Outlier Evaluation .................................................. 110 9 4.5.64. Multikolinearitas and .................................................. 111 Singularitas Evaluation 4.5.6.5. Proprietary test a nd statistic .................................................. 112 test 4.5.6.6. Direct Effect, Indirect Effect, .................................................. 112 and Total Effect Analysis 4.5.7. Step 7 : Intepretation and .................................................. 112 Model Modification 4.6. The research hypothesis test ……………………………….. 112 4.6.1. Hypothesis I test ................................................. 113 4.6.2. Hypothesis II test ................................................. 113 4.6.3. Hypothesis III test ................................................. 113 4.6.4. Hypothesis IV test ................................................. 114 4.7. ………………………………..115 Direct Effect, Indirect Effect, and Total Effect Analysis CHAPTER V. CONCLUSION AND POLICY’S ................................ 117 IMPLICATION 5.1. The Summary ………………………………. 117 5.2. General Conclusions of hypothesis Hypothesis conclusions ………………………………. 120 5.2.1. The knowledge sharing is ................................................ 120 positive and significant influences the human capital 5.2.2. The empowerment positively and significantly influences human capital ............................................... 121 5.2.3. Workplace environment positively and significant influences human capital. ................................................ 122 10 5.2.4. The human capital influences positively and significant to employee’s disciplinary ................................................ 123 5.3. Conclusion of particular hypothesis ................................................. 123 5.4. Implications ………………………………. 124 5.4.1. Theoretical implications ................................................ 124 5.4.2. Managerial implications ................................................ 125 5.5. The limitations ……………………………… 129 5.6. The future research agenda ………………………………. 130 Refferences ......................................... ................................................ 131 11 TABLES Table 1.1. FMDU employee‟s map .................................................................................. 3 Table 1.2. The FMDU‟s employees data ......................................................................... 4 Table 1.3 The Education background of FMDUs employees ........................................... 10 Table 1.4 Absenteeism chart ............................................................................................ 12 Table 1.5. The Research Gap ........................................................................................... 14 Table 2.1 Tangible VS Intangible Asset ........................................................................... 26 Table 2.2 Previous researches .......................................................................................... 47 Table 2.3. The techniques used for disseminating Knowledge ........................................ 51 Table 2.4. Variable dimensional table .............................................................................. 55 Table 3.1 Variables and indicators table .......................................................................... 69 Table 3.2. Measurement model ........................................................................................ 71 Table 3.3. Model‟s examination index ............................................................................. 76 Table 4.1. Research respondent identity data ................................................................... 81 Table 4.2. Knowledge sharing index ............................................................................... 81 Table 4.3. Knowledge sharing descriptive index ............................................................. 81 Table 4.4. Empowerment Index ....................................................................................... 83 Table 4.5. Empowerment descriptive index ..................................................................... 84 Table 4.6. Workplace environment index ........................................................................ 86 Table 4.7. Workplace environment descriptive index ..................................................... 86 Table 4.8. Human capital index ....................................................................................... 89 Table 4.9. Human Capital descriptive index .................................................................... 89 12 Table 4.10. Employee‟s disciplinary index ...................................................................... 91 Table 4.11. Reliability Test .............................................................................................. 92 Table 4.12. Structural Equation Model ............................................................................ 93 Table 4.13.The result of exogenous confirmatory factor construct model test ................ 94 Table 4.14.Confirmatory factor of exogenous construct Regression Weights ............... 96 Table 4.15. The confirmatory endogenous construct model test ..................................... 99 Table 4.16 Endogenous Construct Confirmatory Factor Regression Weights ................. 99 Table 4.17 The Full model test result ............................................................................... 101 Table 4.18 Endogenous Construct Confirmatory Factor Regression Weights ................. 102 Table 4.19 The Full Model Test Result ........................................................................... 104 Table 4.20 Regression Weights of Structural Equation Modeling Analysis ................... 105 Table 4.21 Normality Data Test ....................................................................................... 108 Table 4.22 Descriptive Statistics ...................................................................................... 109 Table 4.23 Hypothesis Test ............................................................................................... 113 Table 4.24 Hypothesis Conclusion .................................................................................. 114 Table 4.25 Standardized Direct Effect ............................................................................. 115 Table 4.26 Standardized Indirect Effect ........................................................................... 115 Table 4.27 The Standardized Total Effect ....................................................................... 116 13 ATTACHMENTS 1. Quetionnaires 2. Quetionnaire result 3. Data analysis result 14 CHAPTER I INTRODUCTION 1.1 Background The economic global changes had emerged the readiness of businessmen to compete in the industry they are dealing with. Such certain and special competitive advantages are needed to win the competition. Businessmen should adjust themselves along with the economy robust changes and developing environment development, such as technology government development, regulation thus the industrial paradigm environment changes on implementation and management process. To be able to compete, businessmen should also allign their strategy due to changes and business development. Hence the increasing of foreigner competitor as free trade policy impact, Indonesian organizations are promoted to be more effective and modern for both manufacture and service organizations. These robust changes and development of the economic growth environment promoted by innovation, speed, quality and customer satisfaction based on the importance of the intangible assets such as brand, knowledge, innovation and especially the Human Resources capital (Brian E. Becker, et al ; 2001). This has recently become a new paradigm of the business environment. If we blast from the past over few decades ago, performance was only focused on financial aspects (Kaplan et al, 2001). Despite of financial indicators, performances at the present also focused on brand, knowledge and Human Resources. Researches and 15 empirical studies conducted by both academic and professional has proven that a good Human Resources Management able to promote firm performance. Human Resources concern of a strategic role within an organization. Thus it plays as an intellectual capital of the organization. Nowadays, resistant and superior performances must be supported by flexibility, innovation and market entry speed, competitive advantage especially in Human Resources and internal organization, personal capabilities including the company ability in order to develop and keep the capable and committ employees (Brian E. Becker, et al ; 2001). It shows the importance position of HR in organization in order to support other intangible assets. Due to the world economic changes, the education field also changes and develops as well. Government must provide good education for people in order to be able to win the worldwide competition. The education in Indonesia starts from basic education of 9 years up to a higher education (University). Alligning with its programs, the government has provided the best education facilities. Moreover, government provides free education for the unlucky people. This free education starts form basic education up to higher education. The program conducted by national education institution. The Indonesian free to choose the education program they want to fill in according to their ability and talent. Indonesia possesses some worldwide qualified Universities. One of it is Diponegoro University. Faculty of Medicine of Diponegoro University (FMDU) is one of some qualified faculties in Diponegoro University. 16 The medicine education history has proven that Indonesian doctor is no longer doubted for their skills and knowledge. Many of Indonesian graduated doctors are well accepted to study abroad and even working abroad. Despite of studying and working abroad, Indonesian doctors are also acknowledged as lecturer and also consultant. It is noted that since 2007 up to July 2010, Indonesian Medicine Council (KKI) established the Letter of Good Standing to 108 Indonesian doctors. Thus this shows the Indonesian doctor quality. The quality of the education institution depends on its structure. In this case HRM is prior. Despite of the establishment of good and qualified curriculum, HR acts an important role in implementing the curriculum policy. The government regulation of UU No. 29 in 2004 about doctor practices has emerged the improvement and development in medical education competition. Then supported with the National Education Department program of new medicine education paradigm in Indonesia. The FMDUs employee‟s structures consist of Public Service Employee and contract employee. Here is the FMDU employment data. PROGRAM Table 1.1 FMDU employee’s map LECTURER ADMINISTRATION MEDICAL DOCTOR (MD) 237 210 NUTRITION 16 17 NURSING 30 20 TOTAL 283 247 Source : FMDU’s human resource department - 2011 17 The Table 1.1 shows the map of the FMDU employees, for both lecturer and administration staff. The detail data of FMDU employee are listed below: Table 1.2 The FMDU’s employees data NO. DEPARTMENT Public Service Contract Empl Employee 1 Anesthesiology 2 0 2 Anatomy 2 2 3 Surgery 1 3 4 Biochemistry 2 1 5 Biology 1 0 6 Pharmacology 1 1 7 Pharmacy 2 1 8 Biochemistry 1 0 9 Physiology 1 2 10 Dentology 1 0 11 Histology 1 3 12 Interna 1 4 13 Ophtalmology 0 2 14 Pediatrics 1 3 15 Public health 2 0 16 Forensic 0 2 17 Nutrition 0 1 18 Chemistry 3 0 19 Dermathology 0 4 20 Microbiology 4 5 21 Neurology 0 3 22 Obsgyn 0 4 23 Paracitology 4 1 24 Anatomy Pathology 2 2 18 NO. DEPARTMENT Public Service Contract Empl Employee 25 Clinical Pathology 1 4 26 Psichiatry 1 1 27 Radiology 0 2 28 Neck 0 2 29 Cardiology & Medical Vascular 0 2 30 Rehabilitation 0 1 31 Central Office 56 47 32 Laboratory 8 4 33 P2UKM Mlonggo 0 5 34 Nursing Program 20 0 35 Nutrition Program 5 12 123 124 Ear, Nose, Throat, Head & Phisic and Medical TOTAL Source : FMDU’s human resource department - 2011 Table 1.2 shows employee‟s structure among departments in the FMDU. Based on the table above the difference of employee amount between government employee and contract employee are known. Furthermore, for the next 5 years there will be changes on employee‟s structure, some of the Public Service Employees are going to enter the pension time. Public Service Employees are recruited by national recruitment conducted by the University 19 and also based on the length of working as the University employee (5 years minimum). Contract employees recruited by FMDU selection consist of administration selection, academic potential test and interview test. The recruitment based on the proposal of the faculty or the program study. For the next five years (2016) there will be 45% of government employees entering the pension time. On the contrary, contract employees recruited are mostly in the age of 20 years old. There are two groups on the FMDU employee‟s structure, public service employees and contract empoyees. The Public Service Employees consists of senior employees with more than 10 years of dedication. The contract employees consists of younger employee with at least 20 years old. These differences have made a long distant between each generation, especially the senior and the junior ones. The obvious difference seen in the working place is the manner and the ability to deal with technology. Some important department such as treasury dept, HRD, managers secretary, laboratory, public affair and asset management dept and most of the department in FMDU are handled by contract because of their ability to dealth with technology. The contract employees are young, they are willing to take any task with high difficulty. FMDU enthusiastically welcomes the robust technology development and its speed. Due to this condition, FMDU conducts trainings for both lecturers and clerical employees. The training held in order to improve the quality of the FMDUs lecturers and employees. The training held in the internal space of FMDU or sending its lecturers and employees outside of the FMDU and even 20 abroad (mostly lecturers). The internal training conducted are : Pekerti, Applied Approach, E-learning, siaga bencana, research methodology and some more training held by University such as Dosen Wali training, etc. These training are periodically held in every year. Meanwhile, the training held for the administration employees are computerize training inparticular MS Office, personality training and motivation training. Despite of those trainings, the FMDU management also sends some of its employees to follow some training outside the institution. Both lecturers and clerical employees are suggested to participate in the training. The lecturer must follow the trainings especially for the new recruitment lecturers. Both lecturers and administration employees are expected to be able to manage and handle the technology development well. The purposes of the training conducted are to develop employee‟s ability so that will increase their performance. The effectiveness and the efficiency of performances are the main goal of those activities. During the training, there were some senior employees were absent and seem to have less enthusiasm in following it. They thought why bother following the training while there is so much young generation who more capable. “It is useless”, they said. But on the working situation, whenever they have problem with the computerized system they will directly ask their junior to fix and thus finish the task. The junior will always do what their senior asked because they are affraid and unable to neglect the order. The seniors feel that they are more experienced, so 21 they feel more superior. The „yes sir‟ behavior of the junior is mostly because of the working place culture. It is a must to honor and give respect the older. According to the tradition, the younger must honor and respect the older. This culture influences the FMDUs environment especially to the Human Resources. The senior dominate more, even they are not in the manager position. The younger generation is carried away with the culture. They are affraid to build a relationship with the senior and feel awkward to communicate to them. This condition emerged the senior dominating behavior and indirectly makes them feel that they never make mistake. Since its establishment in 1961, FMDU is under the same area with dr. Kariadi Hospital. The mutual cooperation has been conducted for about 50 years. dr Kariadi hospital is the FMDU‟s main education hospital. The cooperation is including researches, clinical practice and mostly for education. Together, Kariadi and FMDU developing medical knowledge for a better future in health. Instead of this mutual cooperation, some departments of FMDU and dr Kariadi‟s are under the same office. Some departments consist of both Kariadi and FMDU‟s employees. Some problems occur because of this situation. The FMDU employees sometime must work under pressure, because of the Kariadi‟s dominant behavior. The head of the department is sometimes Kariadi‟s staff, even though their major task is dealing with the FMDU. Both of FMDU and Kariadi‟s employees are sometime confused in dealing with their tasks. The FMDU‟s sometime handle the Kariadi‟s task. 22 The working place phenomena mentioned above does not promote the performance improvement. Employees are not comfortable enough in doing their tasks. A research conducted by Rose et al in 2006 showing that the Human Resources Management contributes the firm success. Human Resource Management as differentiation strategy by selective recruitment, less control to employees, holding more training and development, giving suitable rewards. As an organization asset, employees must develop themselves in order to be able to compete with others. Aligning with the recent technology, a major number of the senior are unable to operate it. They prefer using a manual hardware to do the task, though it is more efficient by using computer. The management facilitates the office with best software and hardware to its employee in order to gain faster and accurate result in tasks. On the contrary, the ability of using this sophisticated tools is a must have skill for contract employees. The recruitment conditioning the ability to operate computer and its programs thus able to fix the technical problem occur. Li-An Ho in 2010 conducted research that shows the impact of spiritual experiences due to its readiness to Self Directed Learning (SDL) of the employee. SDL directly impacts the organization innovation whereas it directly impacts the organization performance. The senior usually more religious because they feel old and they are going to die. So, they are improving their spirituall activities. This way of thinking has led them in to a thought that they do not have to work harder as they did before. They think 23 that it is useless to learn anything especially when entering their retirement period. Higher education institution nor other organization that put the knowledge management as prior will be well succeed when it is supported by technological aspect on its knowledge management system aligned with strategies that will lead the employees willingness to work together under the same roof. A good support on the employee network can be a succeeded strategy which will reward both organization and employees based on knowledge management inside their workplace environment. Based on the background above it is concluded that in order to improve their performance, employees must be able to adjust themselves due to changes for both technology and culture. A good Human Resource Management can be a barrier to entry in order to win the competition. A collaborative action in HRM strategy and technology may become an organization competitive advantage. Based on the FMDU employee‟s data, there are some education background differences in both Public Service Employees and contract. The data presented as seen below in table 1.3. Table 1.3 The Education background of FMDUs employees Public Service NO Education level 1 Post Graduate / Magister 1 - 2 Bachelor 30 33 3 Diploma 3 13 47 Employees 24 Contract Public Service NO Education level 4 Diploma 1 1 - 5 High school 58 31 6 Junior high school 14 2 7 Elementary school 4 12 Employees Contract Source : FMDU’s human resource department - 2011 Based on the table above, there are some differences seen on both Public Service Employees and contract. There is only one Public Service Employee with master degree. For bachelor degree, there are 3 persons in difference among Public Service Employees and contract. The contracts consist of 34 people more than Public Service Employees for Diploma degree. The Public Service Employees consist of 27 people more than the contract for high school degree thus also consist of 12 peoples more for the junior high school degree compare to contract. There are 8 persons difference in elementary school degree between Public Service Employees and contract. Based on the data presented by the table, we can conclude that the contract human resources are more educated. It consists of more bachelors and diploma degrees compared to the Public Service Employees. 1.2 Research problem The FMDU consists of Public Service Employees and contract employees. The management uses a certain evaluating procedure in order to evaluate their performance. There is DP3 form for Public Service Employees and the contract will be evaluated using a similar form. The evaluation 25 consists of loyalty, problem solving, responsibility, cooperation, discipline, initiative, honesty and leadership. The evaluation conducted by the managers or head of the department. It is annually reported and regularly conducted. Due to the contract, the evaluating form is also a mean to decide whether the institution will prolong the contract or on the contrary. In accordance to promote disciplinary among its employees, the FMDU management established the working hour starts from 7 am up to 2 pm. The FMDU is conducting 6 days of work. Practically employees come arround 8 am and leave the office at 2 pm. According to the spread department in the FMDU, the supervission for the employees is less than perfect. The automatic presence machine is applied in order to supervise the employees disciplinary and located in places whereas reachable for employees. Nevertheless some indisciplinary still occur. Here is the chart of absenteeism in FMDU : Table 1.4 Absenteeism chart Public Service Employee Contract sickness Short term absence for important reason 12 47 11 17 173 155 Absence for duty 143 45 Reason Long term absence for important reason Absence with no reason 126 Source : FMDU’s human resource department - 2011 26 91 Picture 1.1. The absenteeism in FMDU ABSENTEEISM IN FMDU - 2011 Public Service Employee 173 155 Contract 143 126 91 47 12 11 Long term absence for important reason 45 17 sickness Short term absence for important reason Absence for Absence with no duty reason Source : FMDU’s human resource department – 2011 The table 1.4 illustrates the number of absence among FMDU‟s employees. The number of long term absence for important reason is 12 days for public service employees and 11 days for contract employees. While absence because of sickness shows 47 days for public service employees and 17 days for contract employees. The short term absence for important reason shows 173 days for public service employees and 155 days for contract employees. Meanwhile a significant differenciation of number occurs in absence for duty, 143 for public service employees and 45 for the contract one. Absence with no reason shows 126 days for public service employees and 91 for contract employees. The graphic above illustrates the absence frequency table among FMDU‟s employee. According to the illustration above, it is found that public service employees take more absence compared to the contract one. In addition to this 27 matter, researcher has observed the attendance frequency among the FMDUs employees. Most of the employees are attending late to the office. The late atttendance aproximated from 15 up to 60 minutes. Moreover, some employees even attend the office 2 hours late. In accordance to the developing technologies, some of the FMDUs employees are unable to operate computers. Especially the public service employees. During 2008 to 2011, there was no training for operating computer among employees. There were only motivation training and personal building training. Some employees with potential capability are encouraged to follow some training held by others. Researches had found some new concepts for management. Those research findings will be used to define and strengthen the theoretical concepts in this research. Those findings showed in the research gap such as seen on table 1.5. Table 1.5 The Research Gap No Article’s title Researcher 1 Rose et al 2006 The Influence of Organizational and Human Resource Management strategies to Organizational Performance Method MRA 28 Research result Note Firm that adopts the high – involvement in strategy tends to have better performance. High – involvement in organizational strategies are still relevant and effective facets of Human Performance Technology work. Causal relationship remains unaddressed. This may further be improved by conducting SEM analysis through statistical software No Article’s title Researcher Method The Longitudinal Effect of Human Resource Management Effectiveness and Dynamic Innovation Performance on Organizational Performance in Taiwan Wang et al, 2009 SEM 3 The inevitable role of spirituality in the workplace Bosch, 2009 Qualitative research 4 Meditation , learning, organizational innovation and performance Li – An Ho, 2010 Regression 2 29 Research result Note There was a linear growth that significant due to innovation and firm‟s performance aligned with individual status differences and the subsequent growth. The HRM effectivity directly impacts the firm‟s performance growth. The R&D expenses directly impact the HR productivity rate and significantly influenced the organization‟s performance growth. A form of spiritual intelligence exists and affect the growth and develop and management and workers in the workplace It is found that there is no significant relationship between initial status and subsequent growth for labor productivity. This study was limited on manufacturing industry. Employee‟s spiritual experiences significantly influenced employee‟s Self Directed Learning (SDL), organization‟s innovation capability and organization‟s performance. Possible biases or preferences such as learning styles, communication method and social preferences may exist due to different personal experiences, family or educational background the qualitative method does not allow for the wide array of statistical and scientific tools that could give gtreater legitimacy and weight to the study. No Article’s title Researcher 5 A Framework for Knowledge Management System Implementatio n in Collaborative Environmental for Higher Learning Institution 8 Knowledge sharing among workers : a study on their contribution through informal communicati on in Cyberjaya, Malaysia Method Research result Note Abdullah et al, 2005 Qualitative study Higher Learning Organization or any organization that pursue knowledge management policy, is more likely to succeed if they implement technological aspect of Knowledge Management System development colaborated with the strategies which allow people to work together at any time and any place. There was no survey in community practice to evaluate the effectiveness of the knowledge management framework Azudin et al, 2010 Descriptiv e research Informal communication builds trust and strengthens relationship between participants. People in Malaysia see knowledge sharing as a threat or burden. The research was restricted only 50 people. This number can be increased for better result. 1.3 Research Problem Formulation Based on the phenomena shown in the background above the research problem formulas are: Faculty of Medicine of Diponegoro Univesity consists of two groups of employee. There are Public Service employee and the contract employee. 30 Some of the public service employees are entering the retirement phase. This has emerged some differences in the working atmosphere consists of employee‟s skill, knowledge and competency. The public service employees are not empowered well because the lacking of their skill. Furthermore,contract employees are holding some important sectors such as financial department, human resource department and academic department. Some departments require certain skill such as operating computer with speciffic programs. Employees with no computer skill will rely on other friend who capable of it to finish their tasks. Yet some other employees are trying to help by giving tutorial about computer. The public service employees conducted more absence rather than the contract employees. This shows the lacking of disciplinary among public service employees. FMDU office consists of some departments which are separate from the main office of FMDU. Some departments location are under the same building/room with dr. Kariadi‟s hospital (i.e interna, anestesiology, obsgyn, cardiology, etc). Other departments such as pre-clinic departments are located in Gunung Brintik area which is far from the FMDU building. This situation promotes less supervision for FMDUs employees. The obvious factor seen is desciplinary. The employees at Gunung Brintik are often come late and go home earlier. Meanwhile the employees at the dr. Kariadi‟s hospital and the FMDU‟s main office are always go home late. 31 The lacking of skill in some employees become a concern. Some major problems sometime occur during the task work. Employees with less skill will ask the skilled employees for a help. Being noticed or not, a knowledge sharing is applied. Under a separated office, employees at Gunung Brintik feel like they got less attention from the management. The lacking absence is one of the indisciplinary action. This is a big problem in the employee‟s performance. According to the picture 1.1 the number of absenteeism occur more on to Public Service employees. This will effect the employee‟s performance. The workplace setting also promotes the absenteeism. How to increase the employee‟s deisciplinary? 1.4 Based on the problem background, the research questions are : 1. What is the effect of the knowledge sharing to the employee‟s disciplinary? 2. What is the effect of the empowerment to the employee‟s disciplinary? 3. What is the effect of the workplace environment to the employee‟s disciplinary? 4. What is the effect of the human capital in increasing the influence employee‟s disciplinary? 1.5 Research Goals and Purposes 1.5.1 Research goals 1. To analyze the influence of knowledge sharing to employee‟s disciplinary 2. To analyze the influence of empowerment to employee‟s disciplinary 32 3. To analyze the influence of workplace environment to employee‟s disciplinary 4. To analyze the influence of the human capital to employee‟s disciplinary 1.5.2 Research Purposes 1. The theoretical purpose of this research is that hopefully it will become an additional literature for the next strategic researches. 2. The result of this research hopefully will imply the management human resources in FMDU, thus become a new perspective in the workplace environment. 3. The result of the reserarch will give different perspective about the disciplinary performance of the FMDU‟s employees. 4. The result will give contribution for the decision maker in order to increase the employee‟s performance. 1.6 Thesis Outline This thesis outline aimed to deliver a complete picture of this research. The complete structures are: Chapter I is introduction, consists of the research background, hypotheses, research goal, research beneficiary and research outline. Chapter II is literature review and research model development about business strategy factors, HR control factors and firm performance continued with previous researches, framework design, dimensional and operational definition of variable and hypotheses. 33 Chapter III is research method , it‟s explaining the data type & data source, sample and population, collecting method and data analysis technique. Chapter IV is a part of data analysis which explaining the general point of view of respondent, processes and data analysis result thus hypotheses test. Chapter V is conclusion and the implication of the policy that determining the conclusion itself and the research problems, theoretical managerial implications and thus limitation and future directions. 34 CHAPTER II LITERATURE REVIEW AND EMPIRICAL MODEL DEVELOPMENT 2.1 Literature review Recent studies notified that there are many factors that promote performance‟s value. Service is now become a major issue as performance factor. Customers are no longer pay attention on product only but also how the product is served. In education field, higher education institution products are services. During the study, students will be helped by both lecturer and administration staff. Human resources had become an important role in business operation. It is a most critical resource in an organization because it can either bring organization successes or failure. Human resource also plays as the organizational capital. It plays as Human Capital (HC) and as Intellectual Capital (IC). In order to deliver good and qualified services, it is necessary for the organization to manage human resources. Managing human resources is indeed full of challenges. Therefore, an organized strategy must be applied in managing human resources. 2.1.1 Knowledge Sharing Many studies stated that HR plays an important role on organizational performance achievement. As human being, the quality of HR depends on knowledge. Knowledge is what human being embedded 35 of. In HR issue knowledge can be considered as the most important strategic resources for ensuring an organization‟s long-term success and survival, because it is unique and difficult to imitate (Grant, 1996; et al). According to the knowledge-based view of the firm, an organization‟s ability to create knowledge is a source of competitive advantage (Conner & Prahalad, 1996; et al). Mitchell, R & Nicholas, S (2006) found that new knowledge is created through interactive processes based on the sharing and integration of previously unshared knowledge. Psychosocial variables, in particular the norms of members, are critical in determining the success of knowledge sharing efforts. When individual members believe in freedom of expression and value the understanding and utilization of diverse viewpoints, their groups engage in behavior that are more effective in creating knowledge. This research revealed that the concept of open mindedness norms has at least three dimensions, are: the belief that others should be free to express their views, the determination to investigate and recognize the value of others knowledge and objectives, the will to utilize the best of others ideas. A research conducted by Li-An Ho in 2010 found that employee‟s spiritual experience influences its Self Direct Learning (SDL) , whereas it directly influences organization innovation thus organization performance. Guglielmino‟s SDL attitude (1977), which assessed continuous learning behaviors triggered by active self-learning, includes six factors namely, 36 effective learning, fondness for learning, learning motivation, active learning, independent learning and creative learning. Furthermore, SDL readiness scale which evaluates individuals continuous learning behaviors on their own initiative, including eight factors namely, open to learning opportunities, self-concept as an effective learner, initiative and independence in learning, informed acceptance of responsibility for one‟s own learning, love for learning, creativity, positive orientation to the future, and ability to use basic study skill and problem-solving skills (Bonham, 1989). Dealing with nowadays-tight competitive situation, hard and deep stresses will rise up. Stress is the body‟s natural response to enhance such a competitive situation. Benson (2005) found that stress does not only affect people‟s productivity, but also their physical and mental health. Spiritually close to God is one of the ways out to pass the stress such as meditation. Chowdhury (2006) stated that one of the most challenging barriers hindering its wider adoption is people need to trust each other for knowledge sharing to happen spontaneously and efficiently, but in Asia, people basically do not trust each other and the knowledge they each posses. People are also lack of confidence to share and exchange expertise. Another factor is the fear of being punished. This perhaps should be considered as the most challenging barrier to wider implementation of knowledge management in Asia. 37 For some reason people are sometimes unwilling to share their expertise and their knowledge because they are fear that they might lose their position. Knowledge sharing will be a threat for them. There is no knowledge transfer among employees. This situation brings less open competition among employee thus the knowledge gap will be seen. According to Azudin, et al, knowledge sharing through informal communication among Malaysians is still new. Although it is a part of our lives but it was not being discussed or realized. The culture itself does not emphasize more on its historical. People see knowledge sharing as a threat or burden, frightened of losing face, credibility or their position in organization. Knowledge transfer thought to be a formal discussion especially in organization. Informal communication like conversation during lunch hour builds trust and strengthens relationships between participants despite of just story telling session. Through informal communication people are freely express their feeling because of it is held outside the office, people will be able even to think outside of the box. The more employees share their knowledge the more they will get from others. The informal mechanism is remarkably effective, as up to 70% of workplace learning occurs in it. It is not only helps organizations in developing new knowledge, but also increase worker‟s knowledge level while maintaining their informal relationship with each other. New tacit knowledge is now available for sharing with others so the knowledge of the organization increases, providing potentially greater 38 competitive advantage. Organization managed knowledge effectively should understand their strategic knowledge requirements, devised a knowledge strategy appropriate to the firm‟s business strategy, implemented an organizational and technical architecture appropriate to the knowledge processing needs of the organization, apply maximum effort and commitment to creating explicating, sharing , applying and improving their knowledge. Firms can derive significant benefits from consciously, proactively and aggressively managing their explicit and explicable knowledge. Doing this in coherent manner requires aligning the firm‟s organizational and technical capabilities and capabilities with its knowledge strategy (Michael H. Zack, 1999). H1 : The knowledge sharing positively influences the Human Capital. 2.1.2 Empowerment A firm‟s success largely depends on the capabilities of its employees. Despite of capital and technology, HR will also help the firm to face the global challenges. Both technology and HR can be generated. But in order to be able to face the coming challenges, organization should propel HR appropriately. Organization must encourage its employee‟s motivation and commitment. Human resources played a strategic role in an organization thus intellectual capital of an organization. Nowadays superior and sustainable performances need flexibility, innovation and speed of entering market, based on human resources 39 competitive advantage and internal individual‟s competency, including the organization ability to keep the commit and capable human resources (Becker, et al, 2001). This has shown the HR roles in organization which support the other intangible assets. The table below presents the role of tangible and intangible assets. Table 2.1 Tangible VS Intangible Asset TANGIBLE ASSET INTANGIBLE ASSET Able to see Unable to see Countable Uncountable Part of the Balance Sheet Can‟t be trace Predictable income Assumption based assessment Duplicable Inimitability Depreciated when it is used Appreciation when it is used Limited applications Unlimited application without depreciation Managed by rareness mentality Managed by over whelm mentality Controlling to leverage Aligning to leverage Able to accumulate and to keep Short term, when it is not used Sources : Hubert Saint-Onge, Conference Board presentation, Boston, MA, 17 Oktober 1996. (HR Scorecard; Brian E. Becker, Mark A Huselid, Dave Ulrich ; 2001) The table 2.1 shows differences between tangible and intangible assets. This table explains how to manage both assets. Some of the intangible values such as inimitability and mass application without depreciated are able to become company‟s barrier to entry. When it is well managed this will become company‟s competitive advantage. A company will try to achieve its competitive strategy and above rate profitability. There are two main models that must be taken by company in order to gain a higher profit (Hitt, et al – 1995): 40 a. Industrial organization model, said that external environment is a main determining factor when company entering the industry. In particularly cost leadership strategy or differentiation strategy. b. Resources based model assumes that every company is a sum of some resources and unique abilities. Company uses valuable, rare, specific and irreplaceable capabilities (core competency). In order to be able to survive, a company must maintain its focus in internal and external strategy. A better performance must perform well by a company among its competitors and maintain its development above the competitors (Patrovi, 1994; Biesda, 1992; Vaziri, 1992) It is no doubt that the rising HRM strategy is now focusing on the intangible asset roles and intellectual capital in the recent economy. The sustainable and superior business performance enhances the company to sharp its competitive action over and over again. Traditionally, it will become barrier to entry in the industry, patent protection, and government regulation. The study conducted by Rose et al, reported that an organization of which its management strongly values HRM and people as a source of competitive advantage is more likely to use high-involvement of HRM strategies. The managing people pursuing differentiation strategy with high-involvement of HRM strategies that involve selective staffing, giving employees more discretion, using minimal controls, providing training and development, appraising fairly, 41 and rewarding accordingly. The implementation of differentiation strategies and high-involvement of HRM strategies ensures firm‟s performance. The organizational HRM values, source of competitive advantage (differentiation and speed), SHRM (training, empowerment, selective staffing, performance evaluation, and performance-based pay), and firm performance are significantly related. Contingency perspectives entail that an organization needs to adopt specific HR policies and practices for different strategies. Thus to be effective, an organization‟s HR policies must be consistent with other aspect of the organization. By having appropriate HR policies and practices in place, organizations can elicit employee‟s behaviors that are consistent with an organization‟s strategy. This study shows that a firm that adopts the high-involvement of strategy tends to have better performance. Hence, it is appropriate to conclude that despite of the changing of organizational environment, high-involvement of organizational strategies are still relevant and effective facets of Human Performance Technology (HPT) work. Wang, et al (2009) found that the HRM effectiveness degree was higher than the extent to which dynamic research intensity affected labor productivity. In order to increase the firm‟s operational performance, they need to enhance HRM effectiveness and innovation performance. Aligning the firm‟s competitive strategy with HRM strategy would increase HRM effectiveness sequentially. 42 HRM practices include recruiting, selection, performance measurement, training, and the administration of compensation and benefits. Reflecting the high level of knowledge and expertise associated with these practices are occupational specializations for those who carry out these practices, professional criteria for judging the effectiveness of these practices and professional certification programs for those who carry them out (Baron et al; 1988). Huselid, Jackson and Schuler in 1997 stated that other strategic HRM activities include team-based job designs, flexible workforce, quality improvement practices, employee empowerment, studies designed to diagnose a firm‟s strategic needs and planned development of the talent required to implement competitive strategy and achieve operational goals. Nezakati et al, stated that the advantages of empowerment are: a. Higher employee, customer, client satisfaction b. Positive feelings among employees about themselves and their job c. Utilizing employee capabilities and competence to increase their performance d. Increased feelings of commitment and attachment among employees e. Achieving organizational objectives with ease f. Increased feelings of job ownership among employees g. Reduced wastage and cost h. Lowered direct supervision on employee performance i. Lowered job tension, accidents and incidents 43 j. Change of attitude among employees from having to wanting k. Better communication between management and employees Whilst requirements for employee empowerment process are : a. Clarity of objectives, responsibilities and authorities in an organization. Employee should have complete knowledge of their job description and responsibilities, organization mission and objectives, operational procedures and processes. b. Organization should take the efforts to update employee‟s technical and professional information and enrich their job description thus also utilize job rotation. c. Organizations should respect their employees and try to help them solve their personal problems. Management should create a suitable environment to promote creativity and innovation by employee. d. Organization should create a positive and friendly environment and increase the trust between management and employees. e. Organization should provide appropriate employee welfare. f. Organization should accommodate employee‟s suggestions and ideas in decision making, employee participation in suggestions for better performing job duties. g. Easy access of employees to managers and supervisors, clarity of work relationships among managers, supervisors and employees, employee information about organizational tasks as they related to their jobs. 44 h. Clarity of and information circulation in organization, documentation of work procedures, periodic reviews, improvement and simplification of work procedure. i. Existence of facilities to develop job skills, opportunities for effective and efficient training, technical and professional information related to positions in the organization. Positions in the organization. Empowerment takes place when employees have appropriate trained, job related information are provided to them, all necessary tools are available to them. Employees are completely involved in their work, participate in decision-making and receive sufficient rewards for good results. Katou et al (2007) noted that an important implication for their study was that oraganizational performance depends on correct decision making focusing on human reseources as a source of competitive advantage. Recruitment, training, promotion, incentives, involvement and health and safety HRM policies had significant main effects on overall organizational performance. According to Ugboro (2006), there are statistically significant correlation between measures of employee empowerment (impact, meaningfulness and competence) and constructive and hopeful responses to structuring and downsizing. Organizational commitment, empowerment and job redesign have received considerable attention in the organizational behavior literature, their integration into the emerging downsizing and 45 restructuring survivor literature needs more attention. Managers are, therefore, encouraged to formulate and implement empowerment policies that encourage employees to respond to work related problems and to provide them the resources and authority to do so. These policies according to Colzon (1987) in Ugboro, should free employees from rigorous control by instruction, policies and orders and give them the freedom to take responsibility for their ideas, decisions and actions, while releasing hidden resources to them. If survivor affective commitment enhanced we can expect it to positively reflect on morale, sense of job security and productivity. There is a direct positive relationship between job enrichment and loyalty. Mediated by employee perceptions of job enrichment, there is an indirect relationship between empowerment practices and loyalty. Building loyalty involves more than managerial support and activity. Loyalty oriented behaviors from employees emerged more from job redesign perception as autonomy, task identity, and other job characteristics than the empowering practices of managers. Job characteristics brought about increased meaningfulness of the job, felt responsibility for outcomes and knowledge of results. As the job becomes more meaningful and felt responsibility for outcomes increases, along with greater knowledge of results, employees may feel that their own instrumentality for the organization is increased (Niehoff et al, 2001). H2: empowerment positively influences human capital 46 2.1.3 Workplace environment Related to HRM strategy and non financial performance, Wattanasupachokes found that only positive character of the employee will significantly influences the organization‟s strategy and financial performance. Team working skills are important to generate smooth cooperation in the company. An organization contains differences, such as age, culture, educational background and economy status. In this research differences seen are age, culture, education background and employment status dimensions. Age differentiation indicates the politeness perspective from each individual. Culture background shows the effect of workplace environment to individuals which are from many region. Educational background represented individuals IQ and skill and also their behavior. The employee‟s status shows individual‟s career history and career certainty and also individual convinienceness. According to Guidroz, et al; (2005-2009) study, departments with a strong culture involvement were also perceived as effectively managing workplace diversity by their employees which are from countries with high power distance nor low in power distance, individualistic or collectivistic. They also found that involvement culture may be important for managing workplace diversity. A feeling that all employees are being developed and empowered within the workplace, not just those employees who contribute to diversity, is needed for the effective management of workplace management. The organizational culture may be the key to 47 uncovering positive effects of diversity on workplace performance. Organizational culture as a potential moderator of the often diversityperformance relationship has been shown to have a consistent relationship with organizational performance. This study had also found a relationship between organizational culture and firm performance. According to this study, there are some actions that organizations can do to maximize the benefit of diversity in workplace and successfully integrate a diverse workforce. 1) Frame the diversity management initiative as an opportunity for integration and learning 2) Ensure senior management commitment and accountability 3) Articulate how diversity is important to the overall functioning of the business 4) Emphasize the value of diversity of all employees 5) Emphasize solidarity with the team or department 6) Evaluate the effectiveness of diversity management programs through established metrics Certain cultural and institutional forces lead MNCs to adapt practices conforming to local norms up to a point. Certain HRM practices are more locally and affected by the host country‟s cultural and institutional environment (Myloni,et al; 2004). This study was using specific selections and recruitment, compensation and performance appraisal practices in MNC subsidiaries and Greek firms allows for a 48 clearer picture of HRM transfer. For culture and institutional interactions with control variables are industry, age and size. A study conducted by Mia, et al in 2007 found that the Chinese managers due to their cultural values are likely to have „internal‟ type personality, while the Javanese managers are more „external‟. These differences reflected in their level participation in budgeting and job satisfaction. There were same score for both Chinese and Javanese managers in the groups mean scores but on job satisfaction it was significantly different. Ethnic culture influences employee involvement in control system process and behavior at work. The top management in firms may considers to recognize its employee‟s ethnic culture in the workforce and adapting organizational governance (rules and systems) to the diversity is one way. H3: The workplace environment positively influences human capital 2.1.4 Human Capital Scarcity (uniqueness) and value of intellectual capital, in general and of human capital in particular, are explicit drivers of potential benefits linked to the specific set of resources targeted by human resource department interventions. Not only the nature or essence of the human capital about to be developed, but also the expected benefit to be achieved from the intervention on that particular human capital category, should be considered in such situations (Cornachione; 2010). 49 Human capital is important because it is renewable innovation and strategy sources whether they come from the research laboratory, new processes reengineering or increasing personal skill. Human capital contains the individual intelligence in the organization (Bontis, 1998). Human capital is an important input for organizations especially for employees continous improvement mainly on knowledge, skills, abilities. Thus the definition of human capital is referred to as “the knowledge, skills, competencies, and attributes embodied in individuals that facilitate the creation of personal, social and economic well-being (Organization for economic Co-Operation and Development or OECD, 2001 : 18). Human capital is generally perceived as a distinctive approach to managing people that seeks to achieve competitive advantage through the strategic development of a highly committed and capable workforce (Huselid, 1995; Yound et al, 1996). Becker‟s (1993) argues that there are different kinds of capitals that include schooling, a computer training course, expenditure on medical care. Lectures on the virtues of punctuality and honesty are capital too. In the true sense, they improve health, raise earnings, or add to a person‟s appreciation of literature over a lifetime. 50 Hayton (2005) stated that organization with higher intellectual capital including human capital, customer capital and structural capital promote higher innovation. Youndt (2005) found that based on the US Directory of Corporate Affiliation, in 919 organizations chosen showed that intellectual capital negatively influences the innovation capability. Garavan et al (2001) described that human capitals have four key attributes as follow : a. Flexibility and adaptability b. Enhancement of individual competencies c. The development of organizational competencies d. Individual employability According to Babalola (2003), the rationality behind investment in human capital is based on three arguments: a. The new generation must be given the appropriate parts of the knowledge which has already been accumulated by previous generation b. New generation should be taught how existing knowledge should be used to develop new products, to introduce new processes and production methods and social services c. People must be encouraged to develop entirely new ideas, products, processes and methods through creative approaches. 51 Ayara (2002) reported that educational capital has gone into privately remunerative but socially unproductive activities. There has been slow growth in the demand for labor. The education has failed, such that schooling provides few (or no) skills. Human capital enhancing human resource management practices in terms of staffing, training, performance appraisal and compensation systems , are distinctive ways to create highly empowered and committed employees. Companies are more likely to improve employee‟s knowledge, skills and abilities, enhance motivation, retain competent employees and reduce turnover and absenteeism. Transformational CEOs are more likely to adopt human capital enhancing human resource management. It is strongly imply that the enhancement of CEO transformational leadership may provide a competitive advantage and it is one of the most important sources of human capital enhancing human resource management (Zhu et al, 2005). Based on Olaniyan et al (2008), to contribute significantly to economic growth and development, education must be of high quality and also meet the skill – demand needs of the economy. Government, in its employment policies, should lay more emphasis on specialization and competence rather than paper qualification and ill-gotten certificates. 52 A company will try to achieve its competitive strategy and above rate profitability. There are two main models that must be taken by company in order to gain a higher profit (Hitt et al, 1995): Industrial Organization model, said that external environment is a main determining factor when company entering the industry. In particularly cost leadership strategy or differentiation strategy. Resources based model, assumed that every company is a sum of some resources and unique abilities. Company using valuable, rare, specific and irreplacable capabilities (core competency). According to Barney (1991, 1995), there are four conditions for an organization to have in order to make the resource become a sustainable advantage. There are: a. Value. Resources must be able to exploits the opportunity and thus become a neutralizer of the organizational external threats. A success resource will be valuable when its able to promote the organization to develop nor implement strategies which will improve, fix and or increase the efficiency and effectiveness. b. Rareness. Resources must unique , it means that its existence is rare under the competition conducted or the potential to face off. c. Imperfect inimitability. A potential sustainable competitive advantage resource must be difficult to imitate. Resources will cost a lot to be imitate. The organization resource will be difficult to imitate when it has : 53 A unique historical condition A casually ambiguous, difficult to trace its causal relationship. Socially complex d. Subtituteability. Resources must be difficult to subtitute , it should have no similar substitution because it will be matter. Whether it is a valuable but it is certainly not a rare resource and it is not even easy to imitate. According to Hearn, et al (1996) study about professional competencies that are categorized as competencies: a. Problem solving, b. Others orientation, c. Professional involvement, d. Internal frame of reference, e. Emotional competence, f. Influencing, g. Organizational knowledge, h. Proactive, i. Client orientation Rare human capital is only likely to apply to a segment of an organization‟s work force is inescapable. All workers in the firm have such rare skills and develop sophisticated organizational processes (Lepak et al 1999). As Wilkinson et al (2001) noted in their study, workers with high levels of generic, technical or professional skills who do not require 54 unique, firm specific knowledge to practice have more boundaryless identities requiring mora market based as opposed to commitment based HR. Scarcity (uniqueness) and value of intellectual capital, in general, and of human capital in particular, are explicit drivers of potential benefits to the specific set of resources targeted by human resources department interventions. Not only the nature of essence of the human capital about to be developed, but also the expected benefit to be achieved from the intervention on that particular human capital category, should be considered in such situation (Cornachione, 2010). Indonesia‟s Public Service employees (PNS) are hired up to 55 years old. This condition is causing company to hire and retain older workers. The lower participation rates and the higher disability rates seen by employers today, demonstrate that the work demands do not fit the changing characteristics of the aging workforce. One consequence is that productivity cannot be optimal, if the skills and experiences of aging workers cannot be sufficiently utilized. Minimizing the 'performance gap' between the job demands and the workers' capabilities will obviously ensure greater productivity and lower risk of injuries. The 'performance gap' created by having jobs with demands that are higher than the capacity of the workers will ultimately create problems and concerns that must be deal with by companies if they desire workplaces that are complementary to their workers. 55 In business, the goals of productivity often increase the demands of the job and push the limits of the workers capabilities. These business goals will be further challenged by the fact that the workforce is aging. With aging, worker capabilities will change. Despite of these changes, the demands of the job will no doubt remain the same, unless attention is afforded to redesigning the job demands. Changing the demands to a better match the inevitable change in the work forces , that will occur with aging, is crucial to the success of companies and businesses. Coke found that as highlighted by resource-based perspective, it is the non-imitable capabilities and routines embedded in complex social system at work that provide the greatest opportunities for organization‟s to create sustainable advantage. Organization‟s that pursue HRM workplace emphasize will face more difficult time than other replicating capabilities and routines across borders. But the true effect of this replicate sustainable advantage on the choice of the HRM workplace emphasis is more impossible to empirically ascertain since any such advantage (as defined by the resource-based asset perspective) actually cannot be measured. Zhu et al (2005) found that human capital enhancing HRM plays a mediating role in relationship between CEO leadership and organizational outcomes. This finding opens the “black box” between CEO transformational leadership and organizational outcomes and suggests that human capital enhancing HRM is possible mechanism by means of which 56 transformational CEO‟s affect organizational outcomes and reduce absenteeism Allee (2000), Sveiby (1997) and Guthrie et al (2000) conluded human capital as individual competency and experience, leadership and motivation (Mayo, 2000). Human capital also stated as individual genetic combination, education, experience, and perspective on live and business (Hudson, 1993).. H3: Human Capital positively influences employees disciplinary 2.1.5 Employee’s disciplinary Firm consists of employees with vary in individuality. Employee‟s behavior plays an important role in employee‟s daily activity at work. Organization establishes rules in order to be able to manage their HR and it must be obeyed by any of its HR. Dealing with its implementation, there are sometimes indisciplinary actions reveals. HR daily‟s indiciplinary actions usually shows in HR absenteeism. Recent companies are using developed technology in absenteeism. The finger print machine is a precise and personal absenteeism technoloy. HRD directly connected to the machine will automatically record the HR absenteeism daily. There are many factors influencing absenteeism in organizatoin such as late attendance, leave early, failure to notify, absence without leave, illness, etc. Organization applies some penalties due to the abseinteeism in HR, 57 eliminating daily incentives up to hard penalty that cause the employee loosing their job. Consistence with the economic theory there is a fact that absenteeism is not only determined by individual characteristics but also affected by the working environment the workers face. A worker who is not satisfied with his or her working environment is taking more sickleaves and its more so with the state-owned sector. Absence is one of the few way to express the dissatisfaction thus its manifest the incentive problem the state-owned firms faced (Gong). A study conducted by Avey et al in 2010 found that developing Psychological Capital (PsyCap) presents potential competitive advantages to firm as they seek to leverage human capital for a competitive advantage. This study divided absenteeism separated in to voluntary and involuntary components. Voluntary absenteeism is a reasonably avoidable absence from the workplace including vacation and is potentially due to unnecessary personal reason. Involuntary absenteeism is an absence from the workplace that, under normal circumstances is unavoidable by the employee such as physical or psychological illness. There is a unique relationship between PsyCap and involuntary absenteeism, a behaviour that has typically been ignored as an unmanageable aspect of absenteeism behaviour. PsyCap is a mean to manage and control some of the costs associated with absenteeism within an organization. 58 Government is placing much emphasis on ensuring that public services become more accountable and quality driven, and in Local Government terms, provide Best Value to users of services. The needs of employees who have experienced long-term sickness should not be neglected. The value of adequate service provision should bot outweigh the value of the individual employees who provide that service. Given existing evidence that the return to work process can intimidate or place pressure on employees, would seem that there might be a need for additional prtection for those employees who are absent from work through long-term sickness. Government must set policies and practices within the organiations themselves. Coordination of functions is needed most. Inherent tension between discipline and support needs to be addressed as well. Employees need to be reassured that they are indeed a valuable resource and that the underlying aim is not to dismiss them but to return them to the workforce (Dibben et al, 2001). There are principles that are correlated with the psychological requirements for productive work, the principles are : 1. Elbow Room, optimal autonomy in decision making 2. Continual learning for which there must be a. Some room to set goals b. Receipt of accurate and timely feedback 3. Variety 59 4. Mutual support and respect, helping out and being helped out by others without request, respect for contribution rather than IQ for example 5. Meaningfullness which consists of a. Doing something with social value b. Seeing the whole product or service to which the individual contributes 6. A desirable future, not having a dead end job These criterias provide reliable measure of intrinsic motivation regardless of the purpose or nature of the organization (Emery, 1993). Absenteeism is a function of personal and job characteristics such as gender, yearly gross wages, contractual arrangements and unit-size. Females and individuals obtaining lower wages show higher absence rate, while subjects under probation and working in smaller unit tend to be less absent. A positive relationship between individual absenteeism and peer group absenteeism suggest that absence is more likely to be due to shirking rather than to sickness. Individuals who work in the same place and have daily interactions are H4: The human capital positively influence employee’s disciplinary 60 2.2 Previous research Table 2.2 Previous researches Article’s title Researcher Meditation , learning, organizational innovation and performance Li – An Ho 2010 The Influence of Organizational and Human Resource Management strategies to Organizational Performance Raduan Che Rose, PhD & Naresh Kumar, PhD 2006 The Longitudinal Effect of Human Resource Management Effectiveness and Dynamic Innovation Performance on Organizational Performance in Taiwan Dan-Shang Wang and Chi-Lih Shyu 2009 Year 61 Research result Method Employee‟s spiritual experience Regression significantly influenced employee‟s Self Directed Learning (SDL), organization‟s innovation capability and organization‟s performance. The HRM contributes the MRA organization‟s success, whereas the HRM role integrated to organization‟s strategic plan. The HRM plays as differentiation strategy through selecting individual‟s high skill, giving employees more discretion, using minimal controls, making a greater investment in HR, providing more resources for experimentation, allowing and even rewarding occasional failure and appraising performance for long-run implications. . The speed significantly related to firm‟s performance. In Korea speed is not significantly related to HRM strategy thus to firm‟s performance. There was a linear growth that SEM significant due to innovation and firm‟s performance aligned with individual status differences and the subsequent growth. The HRM effectiveness directly impacts the firm‟s performance growth. The R&D expenses directly impact the HR productivity rate and significantly influenced the organization‟s performance growth. Article’s title Researcher A Framework for Knowledge Management System Implementation in Collaborative Environmental for Higher Learning Institution Rusli Abdullah; Mohd Hasan Selamat 2005 Host country specific factors and the transfer of HRM practices in Multinational Companies Barbara Myloni, Anne-Wil K Harzing, Hafiz Mirza 2000 Absence management in the Public Services : Recent Evidence from the UK Pauline Dibben, Philip James, Ian Cunningham 2001 Year 62 Research result Method Higher Learning Organization Descriptive or any organization that pursue knowledge management policy ,is more likely to succeed if they implement technological aspect of Knowledge Management System development with the collaborated strategies which allow people to work together at any time and any place. The encouragement of employee‟s network seems to be successful strategy to provide both employees and the company with rewards from knowledge management within their workspace. Performance related pay is a Descriptive much more important determinant of employee basic pay than seniority. HR manager in both MNC subsidiaries and Greek firms revealed that the young generation, as well as these who have studied and worked abroad are more flexible and willing to change, innovate and initiate/accept new practices. Government pressure is sufficient to bring substantial Descriptive change. Such guidence might include a number of actions to develop best practice guidelines that focus on the return to work process. The findings drawn the effectiveness of the pilot project on job retention and return to work. Article’s title Researcher Year Workplace diversity : Is National or Organizational Culture predominant? Guidroz,et al 20052009 Absenteeism and Peer Interaction Effects : Evidence from an Italian Public Institute De Paola, Maria 2008 Research result Method Involvement culture may be HLM important for managing workplace diversity, employee are being developed and empowered within the workplace. Employees contributes to diversity are needed for the effective management of workplace diversity. Organizational culture may be the key to uncovering positive effects of diversity on workplace performance. The workplace diversity impacts on organization‟s performance, but that impact would be in best realized when organizational put a high involvement of its culture. The organizational culture is more important to consider for effectively managing diversity. Absenteeism is a function of Regression personal and job characteristics such as gender, yearly gross wages, contractual managements and unit-size. Females and individuals obtaining lower wages show higher absence rates, while subjects under probation and working in smaller units tend to be less absence. Individual health condition and then suggest that absence occur for valid reasons, others, such as unit-size and contractual arrangement, may hide employee shirking behavior. Source : developed by researcher 2.3 Hypotheses The recent situation of performance demands a focus on services due to customer satisfaction. This has lead organization across the world 63 increases their competitive advantage. Previous studies found that intellectual capital plays important role due to this demand. In term of service organization especially in higher education, the HR management becomes a major issue to its success. Despite of HR, there are many factors influence the organization sustainable advantage due to its HR. It was broadly agreed that an organization‟s performance was influenced by the set of HRM practices as the implementation of strategic HRM. Delaney et al (1996) indicated that organization‟s HRM practices significantly impacts employee‟s skill and ability also motivation and performance. Contingency theory (Miles et al, 1984; Porter 1985, Schuler et al 1987) indicated that an organization‟s HRM strategies must be combined with specific competitive business strategies. According Wang et al (2009), structural capital of HRM effectiveness was the effectiveness of HRM that could facilitate to build up organization‟s human capital, which includes organization convention, mechanism and structure that could establish organization‟s HR thus consolidates and increases the organization‟s human capital which includes recruitment procedures, selection procedures, employee training and development, job security, and labor management relations. Wang et al study in 2009 also found that there was a significant linear growth in innovation and organizational performance, along with significant individual differences in initial status and subsequent growth. HRM 64 effectiveness had directly impacts on the initial and growth level of organization‟s performance. Recent HR in an organization consists of many differences. Geographical and cultural differences will enhance as the impact of this mixed atmosphere. Among these differences, team working is inevitable. Each member should involved and be cooperated to another member of the organization to work together. Abdullah et al (2005) found that the Knowledge Management System (KMS) can disseminate knowledge in a collaboration environment essentially into four ways, depending on whether the communication method is synchronous or asynchronous or combination of both. These techniques, neither in real time or not, are shown in table below. Table 2.3 : The techniques used for disseminating Knowledge Techniques Applications Synchronous techniques (ST) Asynchronous techniques (AST) Meeting room; Discussion; Forum Bulletin Board System; Notice Board; Agent Based Distributed Video conferencing; Synchronous teleconferencing; Collaboration (DSC) chatting Distributed e-mail; short messaging Synchronous system (SMS); voice Collaboration (DSC) mail; fax machine; agent based Source : Abdullah, et al (2005) 65 Mode of involvement Same time, same place Different time, same place Same time, different place Different time, different place There are many benefits of Knowledge Management when it is designed well. The KM will save more time and the organization effort to get knowledge. There are many factors for organizations to maximizing the benefit of diversity in the workplace and successfully integrate a diverse workforce (Guidroz et al, 2005-2009). a. Frame the diversity management initiatives as an opportunity for integration and learning. Emphasizing a learning and integration perspective has a motivating effect on both management and employees and can ensure the long-term success of the diversity program. b. Ensure senior management commitment and accountability. Senior management needs to demonstrate their commitment to workplace diversity and hold themselves and other accountable to see that diversity policies are successfully implemented within organization. c. Articulate how diversity is important to the overall functioning of the business. Consideration should be given to how the new diversity strategy will benefit the company. d. Emphasize the value of the diversity of all employees. Valuing the diversity of all employees will unite employees under one common banner. e. Emphasize solidarity with the team or department. Engage workgroups in team-building exercises that help to facilitate communication and 66 integration of work activity as well as create pride in one‟s work group or organization. f. Evaluate the effectiveness of diversity management programs through established metrics. Evaluating the effectiveness of the diversity program and monitor them periodically. People are increasingly well educated, sophisticated and independent. They are increasingly less likely to accept the authoritarianism thus less likely to tolerate managers assuming they are inadequate human beings. The redundancy part, concerned of more people parts rather than are required performed task at any given time. In this part responsibility for coordination and control is located above where the work, learning or planning is being done. The redundancy part structures produce sick, turned off people, high turnover and absenteeism thus communication problems. Training people in communication skills is not going to solve any communication problems cause by redundancy part. While redundancy function structures produce motivation, health, innovation, productivity and quality. The interest of individuals are best served by looking out themselves, they are not concerned to communicate information that could be benefit for others. Competition also explains the adversarial nature of communication, each step of communication chain represents a difference in status and therefore a difference in the interest of the individuals. Misinforming or failing to inform is a powerful way of 67 waging organizational war vertically as well as horizontally (Emery, 2010). Based on the research problems and supported by literature review, the research model proposed is: Picture 2.1. The research model Knowledge Learning sharing Empowerme nt H 1 H 2 Workplace environment Human Capital H 4 Employee‟s diciplinary H 3 Source : developed by researcher 2.3.1 Hypotheses H1: The Knowledge sharing positively influence s the human capital H2: The Empowerment positively influences the human capital H3: The Workplace environment positively influences the human capital H4: The human capital positively influences employee‟s diciplinary. 68 2.3.2 Variable dimensions Based on the literature review and according to the hypotheses, the variable dimensional of the thesis are as follows. Table 2.4. Variable dimensional table No. 1 2 3 Variable Knowledge sharing Empowerment Workplace environment Concept Mitchell, R & Nicholas, S (2006) found that new knowledge is created through interactive processes based on the sharing and integration of previously unshared knowledge. Psychosocial variables, in particular the norms of members, are critical in determining the success of knowledge sharing efforts. Huselid, Jackson and Schuler in 1997 stated that other strategic HRM activities include team-based job designs, flexible workforce, quality improvement practices, employee empowerment, studies designed to diagnose a firm‟s strategic needs and planned development of the talent required to implement competitive strategy and achieve operational goals. According to Ashley M. Guidroz, et al; (2005-2009) study, found that involvement culture may be important for managing workplace diversity. A feeling that all employees are being developed and empowered within the work place, is needed for the effective management of workplace management. 69 - - - Indicators Competencies development (X1) Innovation learning (X2) Formal communication (X3) Informal communication (X4) Spirituality in the workplace (X5) Recruitment (X6) Employment status (X7) Education background (X8) Team work (9) Job rotation (10) Culture differentiation (X11) Workplace ownership (X12) Attitude (X13) Workplace design (14) No Question 1 2 3 4 5 6 7 8 9 10 11 12 13 14 No. 4 5 Variable Human Capital Indicators Concept Hayton (2005) stated that organization with higher intellectual capital including human capital , customer capital and structural capital promote higher innovation. Employee‟s disciplinary De Paola , 2008 stated absenteeism is a function of personal and job characteristics such as gender, yearly gross wages, contractual managements and unit-size. Females and individuals obtaining lower wages show higher absence rates, while subjects under probation and working in smaller units tend to be less absence. - Competencies (X15) Non-imitable skill (X16) Social system (X17) Capabilities (X18) Absence for illness (X19) Absence for duty (X20) Absence for important reason (21) Absence for no reason (22) No Question 15 16 17 18 19 20 21 22 The explanation of the variables dimensional mentioned on the table above: 1. Knowledge sharing Mitchell, R & Nicholas, S (2006) found that new knowledge is created through interactive processes based on the sharing and integration of previously unshared knowledge. Psychosocial variables, in particular the norms of members, are critical in determining the success of knowledge sharing efforts. Based on the research mentioned, the knowledge sharing indicators are: X1: Competencies development (Rose et al, 2006) X2: Innovation learning (Guglielmino,1997) X3: Formal communication ( Chandrasekar, 2011) 70 X4: Informal communication ( Azudin et al ) X5: Spirituality in the workplace (Bosch) Picture 2.2. The knowledge sharing variable model X1 X2 X3 Knowledge sharing X4 X5 Source : Abdullah et al (2005) 2. Empowerment Huselid et al in 1997 stated that other strategic HRM activities include team-based job designs, flexible workforce, quality improvement practices, employee empowerment, studies designed to diagnose a firm‟s strategic needs and planned development of the talent required to implement competitive strategy and achieve operational goals. X6: Recruitment (Brian E Becker et al) X7: Employment status (Chandrasekar) X8: Educational background (Olaniyan et al, 2008) X9: Team Work (Rose et al) 71 X10: Job rotation (Niehoff et al, 2001) Picture 2.3. The empowerment variables model X6 X7 Empowerment X8 X9 X10 Source : Brian E. Becker, Mark A Huselid, Dave Ulrich ; 2001 3. Workplace environment Team working skills are important to generate smooth cooperation in the company. The indicators are: X12: Culture differentiation (Mia et al , 2007) X13: Workplace environment (Chandrasekar) X14: Workplace ownership (Binyaseen) X15: Attitude (Chandrasekar) 72 CHAPTER III RESEARCH METHOD 3.1. Sample and Population Population is a group of research objects which has at least one similar characteristic (Cooper and Emory, 1995). Ferdinand (2006) stated that population is a combination of elements in phenomena, matter or person with similar characteristic that become researcher‟s attention as a whole research. This research population are 125 employees of in Faculty of Medicine of Diponegoro University. Sample is a subset of population, consists of some part of the population. In some cases, it is impossible to research the whole population. Therefore we will form a representative population called sample (Ferdinand, 2006). According to Hair, et al (1995), appropriate sum of samples for SEM approximated from 100 up to 200 respondents. Thus the amount of samples gained fulfills the sample amount for SEM. The sampling for this research will be purposive random sampling. SEM analysis will need at least 5 times of indicators to be used in a research sample. A research with 20 indicators needs sample for about 20 x 5 or 100 samples. Especially in a chi-square test of SEM model which is sensitive to samples, a good sample to be taken is 100-200 samples for maximum likelihood 73 estimation (Ferdinand, 2006).There are four conditions affected SEM measurement samples (Hair, et.al; 1998:604-605) to be fulfilled: 1. Misspecification model It is the error specification development model. The sample measurement divines the model which estimate correctly (valid result) and identify error (possible error level). 2. Appropriate model measurement Sample measurement to take will depend on the variable indications weight. Each indicator weigh is five up to ten (5-10) respondents per parameter. 3. Based on normal data Under multivariate normality, respondent and parameter ratio are at least accepted by respondents for each parameter. 4. Meet the Estimation procedures demand Regular procedure for estimation is MLE (Maximize Likelihood Estimation). Hair (1995) explained that whether the sample is less than 50 it is still provide valid result, but it is not recommended. The proper sample data for SEM is 100 – 200. Samples to be taken in this research will be the employees of Faculty of Medicine of Diponegoro University with at least 3 years employed and diploma 74 graduated. The respondent will be both public service employee (PNS) and the contract employee. There are 125 persons that match the criteria. Finally there were only 120 valid questionnaires returned out of 125 questionnaires given to the respondents. 3.2.Data collecting method The collecting data method uses primary data, by questionnaire and secondary data by literature study. 1. Primary data Primary data is data gained directly which is specifically collect and connected to the problem to researched (Cooper & Emory , 1998). This research consists of 22 indicators which are divided into primary data of Knowledge Sharing (5 data); Empowerment (5 data); Workplace environment (4 data); Human Capital (4 data); employee‟s disciplinary (4 data). This research primary data will be directly collected from sources under surveillance by giving questionnaire. The questions arranged then be answered by respondents. Questionnaire (data list) is a collecting data procedure for respondents in order to get the sufficient answer due to the research. The questionnaire consists of both general and specific questions. 75 2. Secondary data Secondary data is data which indirectly obtained. It supports the primary data. The researcher obtains these data by literature study connected to the research to conduct (Cooper and Emory, 1998). The secondary data in this research will only be used on to the phenomena‟s as the background issue of the research. The secondary data of this research were taken form the FMDU‟s human resources department such as employee‟s data and absenteeism data. Likert scale will be used in measuring behavior, opinion, individual perception or social phenomenon. This is a bipolar continuum scale. The lower score (left side) represents negative answers and the higher score (right side) represents positive answers. Likert scale also called as summated scale, because it uses more than one questions to explain a construct and then summated the answers. The neutral answer codified as “0” (Ferdinand, 2006). The dimensional data of analyzed variables in this research is using 1 – 5 agree – disagree scale as shown below : 1 2 3 4 5 Very disagree Disagree Moderately agree Agree Very agree VD D M A VA 76 3.3.Analysis technique This research uses The Structural Equation Modeling (SEM) from statistic software called AMOS in developing the model and hypothesis test. AMOS is familiar to marketing and strategic researches. The analysis applied for this research: Confirmatory Factor Analysis to confirm dominant factors within a group of variable. a. Regression Weigh to analyze how much the variable will influence each other. According to Ferdinand (2002), the SEM application consists of seven (7) steps: 1. Theoretical Model Development In developing the model, some empirical exploratory must be taken through literature review to justify the theoretical model developed. 2. Path diagram development In Path diagram the theoretical model developed described so it will be easier to see the causalities tested. SEM presenting construct which mean is a basic theoretical of concepts that explains the form of connections. The path will be determined of the causal construct that will be taken thus variables to measure construct will also be determined (Ferdinand, 2002). Construct represented by arrow line. Straight line means direct causalities of one to another construct. Curve line to each construct 77 shows correlations of constructs. Types of construct under Path Diagram: a. Exogenous construct It is also called as variable source, represented by one point arrow line. b. Endogenous construct Is factors predicted by either one or some constructs. Endogen constructs able to predict another constructs, either way endogen constructs can only be causally connected to endogen construct. The next table presents this research Path Diagram. Its purpose is to present the research model as it's analyzed by using SEM. Picture 3.1 presents path diagram and the variables – indicators will be presented in table 3.1. The table shows the research model to proposed by using SEM program. 78 Picture 3.1. Path Diagram model e1 e2 1 e3 1 x1 e4 1 x2 e5 1 x3 1 x4 x5 1 Knowledge sharing 1 e6 x6 e7 1 1 x7 1 e8 z2 z1 1 x8 Employee’s disciplinary Human Capital Empowerment 1 e9 x9 1 e10 x15 x10 x16 1 Workplace environment e15 1 e16 1 x11 1 e11 1 1 1 x12 1 e12 x13 1 e13 x14 1 e14 Source : Developed for the research 79 x17 1 e17 x18 1 e18 x19 1 e19 x20 1 e20 x21 1 e21 x22 1 e22 Table 3.1 Variables and indicators table No 1 2 3 4 5 Variables Indicators Symbol - Competencies development X1 - Innovation learning X2 - Formal communication X3 - Informal communication X4 - Spirituality in the workplace X5 - Recruitment X6 - Employment status X7 - Education background X8 - Team work X9 - Job rotation X10 Workplace - Culture differentiation X11 environment - Workplace ownership X12 - Attitude X13 - Workplace design X14 - Competencies X15 - Non-immitable skill X16 - Social system X17 - Capabilities X18 Employee‟s - Absence for illness X19 disciplinary - Absence for duty X20 - Absence for important reason X21 - Absence for no reason X22 Knowledge sharing Empowerment Human Capital Source : Developed for the research 80 3. Conversing the diagram path into equation Based on the theoretical model developed and described on to path diagram, the researcher then is able to converse the specification model into equation formula. The equation for this research are : a. Structural Equation It is to describe the causality relationship among constructs. This structural equation formulated based on : Measurement Equation Endogen Variable = ExogenVariable + Endogen Variable + Error Human capital = α1 knowledge sharing + α2 Empowerment + α3 workplace environment + Z1 Employee’s disciplinary = β human capital + Z2 b. Measurement model This equation determines indicator (manifest variable) thus matrix groups which shows the construct and variable correlation. The measurement components identify the latent variable. The structural components evaluate the causal correlation among variables in the causal model. Thus shows the complete test of all hypotheses of the research. 81 Table 3.2. Measurement model Exogenous concept Endogenous concept Knowledge sharing variable Human Capital variable X1 = λ1 knowledge sharing + e1 X15 = λ15 Human Capital + e15 X2 = λ2 knowledge sharing + e2 X16 = λ16 Human Capital + e16 X3 = λ3 knowledge sharing + e3 X17 = λ17 Human Capital + e17 X4 = λ4 knowledge sharing + e4 X18 = λ18 Human Capital + e18 X5 = λ5 knowledge sharing + e5 Empowerment variable Employee‟s disciplinary variable X6 = λ6 empowerment + e6 X19 = λ19 Empl Disciplinary + e19 X7 = λ7 empowerment + e7 X20 = λ20 Empl Disciplinary + e20 X8 = λ8 empowerment + e8 X21 = λ21 Empl Disciplinary + e21 X9 = λ9 empowerment + e9 X22 = λ22 Empl Disciplinary + e22 X10 = λ10 empowerment + e10 Workplace environment variable X11 = λ11 workplace environment + e11 X12 = λ12 workplace environment + e12 X13 = λ13 workplace environment + e13 X14 = λ14 workplace environment + e14 Source : Developed for the research 82 4. Choosing input matrix and estimated technique model There are five estimation technique applied in AMOS (Ferdinand,2006) : a. Maximum Likehood Estimation (ML) b. Generalized Square Estimation (GLS) c. Unweighted Last Square Estimation (ULS) d. Scale Free Last Square Estimation (SLS) e. Asyctically Distribution-Free Estimation (ADF) This research using Maximum Likehood Estimation (ML) because of its samples are small (100-200) and the normality assumption fulfilled. SEM uses only variance/covariance or correlation matrix as an input data due to its whole estimation. Covariance matrix promotes a better valid comparison among population or samples which are different and unable to be presented by correlation. 5. Measuring Identification Problems Identification matter is basically a problem of the model‟s developed unable to find its unique estimation. Whenever estimation problems occur, a new model need to be considered by developing more constructs. 83 6. Evaluating Goodness of Fit To evaluate the model‟s prosperity, some criterias need to be done : goodness-of-fit. The first move is evaluating whether the data fulfills the SEM assumptions, such as sample size, normality, linearity, outliers, multicolinearity and similarity. Then to evaluating the goodness of fit and cut-off-value in order to examine whether the model is accepted or rejected (Ferdinand, 2006). The goodness of fit index is: a. χ2 Chi-Square Statistic Model considered as a good or satisfying one when its Chi-square is low. The lower its χ2 the better the model to be accepted based on its probability‟s cut-off-value as p>0,05 (Hair et al., 1995 in Ferdinand, 2006). b. RMSEA (The Root Mean Square Error of Approximation) It is showing the Goodness-of-Fit Index value expected when the model estimated in its population (Hair et al., 1995 in Ferdinand, 2006). The RMSEA value which is ≤ 0,08 as an index to accept model shows the model close fit based on degrees-of-freedom. c. GFI (Goodness-of-Fit Index) It is a non statistical measurement with 0 (poor fit) – 1,0 (perfect fit) of value. A higher value of 1,0 is a better fit (Ferdinand, 2006). d. AGFI (Adjusted Goodness-of-Fit Index) Acceptable degree to be recommended is when AGFI is ≥ 0,9 84 e. CMIN/DF The minimum sample discrepancy function divided by degree of freedom. CMIN/DF is a chi square statistic divided with its df thus called χ2 relative. χ2 value which is relatively less than 2,0 or less than 3,0 indicates acceptable fit among models and data (Arbuckle, 1997 in Ferdinand,2006). f. TLI (Tucker Lewis Index) An incremental fit index comparing a model tested due to a baseline model whereas the recommended value for a model to be accepted is ≥ 0,95 (Hair et al., 1995 in Ferdinand, 2006) . The value to almost one indicates a very good fit (Arbuckle, 1997 in Ferdinand, 2006). g. CFI (Comparative Fit Index) The index range is 0 up to 1, whereas approaching 1 indicating the highest very good fit (Arbuckle, 1997 in Ferdinand, 2006). 85 Table 3.3 Model’s examination index Goodness-of-Fit Index Cut-off Value χ2 Chi-Square Statistics < χ2 Table (degree of freedom calculation and its probability) Significance Probability ≥ 0,05 RMSEA ≤ 0,08 GFI ≥ 0,90 AGFI ≥ 0,90 CMIN/DF ≤ 2,00 TLI ≥ 0,95 CFI ≥ 0,95 Source : Ferdinand (2006) 7. Interpretation and modification model A model after being estimated, the residual must stay small or approaching 0 and the residual covariance frequency distribution must be symmetric. A good model is having a small standardized residual variance. 1,96 is a value limit allowed to be interpreted to be statistically significant on to 5% level and indicating substantial prediction error for 86 a pair of indicators. Calculated modification index can be used to ease the the modification model for each estimated variable correlation. 3.4. Validity test and Data Reliability test 3.4.1 Validity tests The revealed power of questionnaire can be shown by doing Validity test. It confirms each questionnaire to be classified under construct validity. If a question is able to reveal what is to be measured then it is valid. Validity test is by comparing rcount value to rtable value. Whenever rcount > rtable while r is positive then it is valid. 3.4.2 Reliability test It is to measure respondent‟s answers consistency, how stable it is through time. If respondents consistent to his/her answer than it is reliable. The validity and reliability tests using SPSS program by cronbach alpha (α) statistical test. A reliable construct or variable is when its SPSS statistical test shows α > 0,60 (Ghozali, 2005) Picture 2.4. The workplace environment variable model X12 X13 X14 Workplace environment X15 Source : Wattanasupachokes 87 4. Human Capital Scarcity (uniqueness) and value of intellectual capital, in general, and of human capital in particular, are explicit drivers of potential benefits to the specific set of resources targeted by human resources department interventions. Not only the nature of essence of the human capital about to be developed, but also the expected benefit to be achieved from the intervention on that particular human capital category, should be considered in such situation (Cornachione, 2010). The human capital indicators are: X15: Competencies (Hearn et al ,1996) X16: Non-immitable skill (Mahoney et al, 1992) X17: Social system (Barney (1991, 1995) X18: Capabilities (Barney (1991, 1995) Picture 2.5. The Human capital variable model X15 X16 Human Capital X17 X18 Source : William N Coke 88 5. Employee‟s disciplinary The employee‟s disciplinary related to absenteeism. Absenteeism is a function of personal and job characteristics such as gender, yearly gross wages, contractual arrangements and unit-size. The employee‟s disciplinary indicators are : X19: Absence for illness X20 : Absence for duty X21 : Absence for important reason X22 : Absence for no reason Picture 2.6. The Employee’s disciplinary variable model X19 6 X20 Employee‟s disciplinary X21 X22 Source : developed by researcher 89 90


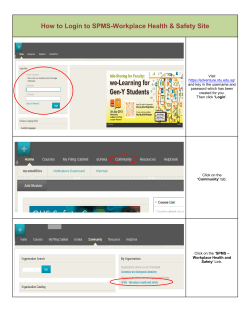


© Copyright 2026