
amounts of white space between lines also make reading
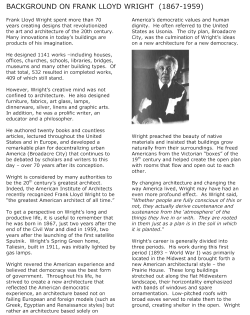
MEDICAL RECORDS
Medical records
How to limit clinical errors in interpretation of data
Patricia Wright, Carel Jansen, Jeremy C Wyatt
We all assume that we can understand and correctly interpret what we read. However, interpretation is a
collection of subtle processes that are easily influenced by poor presentation or wording of information. This
article examines how evidence-based principles of information design can be applied to medical records to
enhance clinical understanding and accuracy in interpretation of the detailed data that they contain.
The previous paper1 showed how careful design can
make information within records easier to find. The
focus in this paper is on how design can assist correct
interpretation and thereby limit clinical errors.
Unfortunately, repeated encounters with medical
records have desensitised doctors to the poor
presentation of information. For example, in one study
clinicians considered their records satisfactory even
when objective measures, such as speed in retrieving
specific details of patients, indicated much room for
improvement.2
The ease with which written materials can be used to
check details or make decisions is strongly influenced by
the way the content is visually presented,3,4 and in many
professional domains errors result from poor
information design.5–7 Errors in interpretation of words,
tables, or graphs result from the cognitive processes of
perception, attention, and memory, which operate in
similar ways for everyone.8 So, although some of the
evidence we cite comes from studies unrelated to
medical care, it applies equally to use of medical
records.
Perception, attention, and memory
A familiar example of interpretation difficulties resulting
from perception is illegible handwriting or type on
computer screens or printouts.9 These perceptual
difficulties can lead to confusion over drug names (for
example, Norflex and Norflox10). Type is usually more
legible than handwriting, but this advantage can be lost
if the writer uses too many different fonts, colours, or
embellishments such as italics, all capital letters, or
underlining.11 Reading speed increases with letter size
up to an optimum, then gradually declines as the letters
become larger. The optimum varies with visual acuity,
and hence age, but lies between 2 mm and 6 mm for the
x-height of the letter (ie, the height of a letter “x”).12
The faded printing or excessive line length of some
computer printouts can slow readers, as can printing
with even right-hand and left-hand margins, unless the
printing system permits a sophisticated distribution of
space both within and between words.13 Greater
Lancet 1998; 352: 1539–43
School of Psychology, Cardiff University, PO Box 90, Cardiff,
CF1 3YG, UK (P Wright PhD); Business Communication, University
of Nijmegen, Netherlands (C Jansen PhD); and School of Public
Policy, University College London, London, UK (J C Wyatt DM)
Correspondence to: Dr Patricia Wright
(e-mail: [email protected])
THE LANCET • Vol 352 • November 7, 1998
amounts of white space between lines also make reading
easier.4
Lapses of attention can result in failure to give due
weight to some detail in a mass of data. Use of
appropriate visual cues to highlight important data items
reduces the chance of critical details being overlooked.
The cue chosen—a mark in the margin, coloured text,
or something else—matters less than the designer’s
consistent use of the cue and recognition that doctors’
attention must be guided so that they take account of all
relevant data.
Memory processes influence interpretation whenever
a clinical decision requires the doctor to remember
details from one place in the record (eg, the blood
pressure in a referral letter) for comparison with data
elsewhere (further blood-pressure readings and details
of therapy). Such comparisons involve the subsystem of
working memory, which we intuitively exploit by
repeating things to ourselves.14 This memory subsystem
yields two kinds of errors—substitution and
transposition. Most substitutions are items that sound
alike, so an English clinician may read “five” in a string
of numbers but remember it as “nine” by the time he or
she has found the data for comparison. For a Dutch
clinician, substitutions are more likely to occur between
seven (pronounced saiven) and nine (naigen).
Transposition occurs when the reader resequences
adjacent characters near the middle of a sequence (eg,
51839 may be misremembered as 51389). The
frequency of both these errors can be decreased by
separation of the numbers into visual groups. If the
number is written as 51–839, readers will tend to
remember “fifty-one, eight thirty-nine” instead of trying
to remember “five, one, eight, three, nine”. Group sizes
of two, three, and four digits are all beneficial,15 so the
grouping can be made clinically meaningful.
Memory lapses can lead to recoding of erroneous
details by the clinician, and memory becomes
increasingly fallible with age.16 Details of consultations
that took place earlier in the day tend to be forgotten.17
One solution is to format records so that all information
can be recorded as soon as it is elicited.
Memory generates distortions as well as omissions.
For example, a recent encounter with a patient who has
thyrotoxicosis can bias the clinician to overdiagnose this
disorder in subsequent underweight patients.18 Welldesigned records that allow clinicians to check whether
the disorder has previously been excluded will help
reduce the impact of such bias. Differential reliance on
long-term memory may underlie the urban/rural
difference in record-keeping observed among general
1539
MEDICAL RECORDS
Panel 1: Design features that facilitate interpretation of data
in medical records
Little visual structure — a single heading and
numerical data (nnn) included within continous text
Sample clinical questions
XXXXXXX XXXXX XXX XX XXXXXXXX
When was the fracture
last X-rayed?
Helpful design features
●
●
Is the rate of recovery
satisfactory?
●
●
●
Is this patient accident prone?
●
●
●
Appropriate document structure,
including informative headings
Consistent location for specific
categories of information—eg,
dates, laboratory results
Verbal summaries of non-verbal
data
Consistency in data formats
Time-lines
Positive wording
Highlighting of relevant data
List of patient’s previous
diagnoses
practitioners in the Netherlands, where doctors in urban
practices found information in their records more easily
than did doctors in rural practices.19 Those in rural
practices are probably happier not to record
consultations in full detail because they have fewer
patients and the population is more static.
Interpretation of textual data
Visual factors
Records can be structured by means of informative
headings, columns, and vertical and horizontal space or
lines. Visual structure, discussed in the previous paper,
makes data easier to find.1 It also aids interpretation
because record structure provides a context that makes
data less ambiguous (panel 1).20 Enhanced visual
structure benefits printed or electronic documents
containing either textual or numeric data: figure 1
shows how data become easier to interpret as the
amount of visual structure increases.
Clarity of language
Text entries in medical records must be succinct, but
must also avoid ambiguity. The note, “Pain in left
knee—not sitting” may be concise and clear to the
writer, but to other readers it could mean that the pain
disappears when the patient sits or that, because of pain,
the patient is not sitting. If, while entering data, writers
anticipate the needs of readers, there can be benefits in
speed and accuracy for future users, including the
original writer.
Ambiguities can also arise with quantifiers such as
“sometimes” or “often”, because these convey different
meanings to patients and clinicians, with patients
tending to attribute higher frequencies.21 Ambiguity is
lessened if frequency is explicitly specified—for
example, as “once a month”.22 Similarly, use of illdefined words (eg, large, likely) to quantify size or
probability, is best avoided. The different interpretation
by doctors of alternative, equivalent measures of drug
efficacy, such as absolute and relative difference,23 is a
further warning that words matter.
People are more error-prone when text involves
negatives, whether the negative is explicit (not, un-, ex-)
or implicit (less, shorter, smaller).24 Because of the way
language skills develop from infancy, people find
comparisons phrased positively—“the lesion on the left
is longer than that on the right”— easier to understand
than those phrased negatively—“the lesion on the right
1540
afghj dlkafgh jdlkafghj nnn dlk afghjd lkafghjdlkaf ghj dlkaaafg hjdlk
kld afghj nnn dlkafghjdl kaf ghjdlk afghjdlkafg hjdkl afghfdlk fghjdl
ghjaf ghjdlkaf gh jdlk afghjdlkafghjd lkafg hjdl ka nnn fghjdlkaafghjdlk
af ghjdlka fghjdl kafghj dlkaf ghjdlkafg hjdlk afghj dlka afghjdlk
fghj dlk afghjdl kafghj dl kafg hjdlka fghjdlk afghjdlk fghjdlk afghjdl
a nnn afghjdl kafghjdlkaf ghjdlka fgh dl kagh jdlkafg hjdlka afgh jdlk.
Visual structure given by segmentation, subheadings, spatial
alignment for specific data (eg, numerical values), and the
visual cue** for abnormal values
XXXXXXX XXXXX XXX XX XXXXXXXX
yyyyyyy
afghj dlkafgh jdlkaf ghjbhn dlk afghjd lkafghj
dlkaf ghj dlkaaafg hjdlk kld afghj nnn
yyyyyyyyyyyy
dlkafghjdl kaf ghjdlk afghjdlkafg hjdkl afghfdlk fghjdl
ghjaf ghjdlkaf gh jdlk afghjdlkafghjd lkafg hjdl ka gjd
fghjdlka afghjdlk af ghjdlka fghjdl kafghj dlkaf gh
dlkafg hjdlk afghj dlka afghjdlk
yyyy yyyyyy
fghj dlk afghjdl kafghj dl kafg hjdlka fghjdlk afg
hjdlk fghjdlk afghjdl.
nnn
nnn
nnn
**nnn
Figure 1: Effect of visual structure on ease of finding and
interpretation of data
The four numerical values (nnn) that appear in each of the examples
are easier to find and interpret as more visual structure is introduced
into the record.
is shorter than that on the left”. In many cases the
positive information is also more succinct (“Still
smoking” rather than “Has not stopped smoking”).
The safest way to use negatives in records is to denote
an exception25 (eg, “Headache; paracetamol not
effective”).
Another example of how wording can generate bias is
the “framing effect”,26 which resembles the shift in
perception from judging a glass to be half-full to judging
it half-empty. The reality is unchanged, but the different
perspective encourages different actions. In a study of
researchers given simulated interim results of a clinical
trial,27 the same data were presented to some researchers
as treatment failure rates and to others as success rates;
the proportion who made the correct decision about
whether to stop the trial early was twice as high when
the data were presented as failure rates. In terms of
medical records, when a progress note reads “The
oedema has gone down”, the implied action may be to
do nothing further. However, if the note reads
“Significant oedema remains”, a change in the
treatment may seem appropriate. Although not as
succinct, presentation of both perspectives “The
oedema has gone down but significant oedema remains”
can reduce errors of interpretation.
Interpretation of numeric data
Numeric data occur frequently in medical records, so
should be segregated in a separate column (figure 1). If
there are many numeric data, from multiple
investigations or repeated observations, a table or graph
will help. Graphs make trends more explicit, and welldesigned tables make location of specific data items
easier.28–30 However, doctors differ in how they define
data items such as duration of illness, which may be
THE LANCET • Vol 352 • November 7, 1998
10
10
9
9
8
8
Dilation of cervix
Dilation of cervix
MEDICAL RECORDS
7
6
5
4
3
7
6
5
4
3
2
2
1
1
0
0
0 1 2 3 4 5 6 7 8 9 10
Duration of labour (h)
0
1
2
3
4
5
6
7
Duration of labour (h)
8
9
10
Figure 2: Effect on interpretation of dilation rate of choice of scale
Adapted from Cartmill and Thornton.34 The dilation rate appears slower in the right-hand plot, which has a bigger scale on the time axis.
measured from symptom onset, clinical diagnosis, start
of treatment, or laboratory confirmation.31 Also,
clinicians do not all share conventions for the order of
data in a table or form; options include ordering by
date, by test type, or by test result. Use of columns and
rows in tables with explicit headings removes the risk of
misunderstanding.
For laboratory reports that show data in a table or
graph, errors can arise when their design violates
readers’ expectations about how the data are
organised.32 Graphs with missing or unclear axis labels
will cause errors. People make fewer errors in reading
data values off a graph when the scale divisions are
multiples of two or ten than when other multiples are
used.33 Differences in the proportions or aspect ratio of
graphs can also influence interpretation. This effect was
studied in obstetricians; the same cervical dilation data
were plotted against time on partograms that had
different aspect ratios (figure 2).34 The flatter graph
(right-hand plot, aspect ratio 1·5) gave the visual
impression that cervical dilation was taking place very
slowly; doctors would have decided to intervene in twice
as many patients (44 vs 19% of patients) as when the
same data were shown on the taller graph (left-hand
plot, aspect ratio 1·0). This was a careful laboratory
study, but doctors had been trained with the taller
Figure 3: Medical record summary formatted as a time-line for interventions and progress notes
Symbols can be expanded to a report or diagram. Modified and reproduced with permission from Plaisant and colleagues. 36
THE LANCET • Vol 352 • November 7, 1998
1541
MEDICAL RECORDS
Panel 2: Six principles of information design that can aid
interpretation of medical record data
Set the context
eg, Give the date and main purpose of the consultation.
Write informative headings
Rather than a generic heading “Symptoms”, use a more specific
heading, “Eating problems”, to aid interpretation and future
retrieval.
Limit the information given under each heading
Records with more subheadings, and fewer data under each, will be
more easily used than the reverse.
Include signposts and landmarks within the records
These can be specific locations for certain kinds of information, or
marking of abnormal values or adverse reactions with highlighter or
marginal symbol.
Organise information to meet the needs of more than one profession
Visual separators, such as lines or boxes, can distinguish
instructions to other professionals, such as clinic nurses, from data.
Make the organisation of the material visually explicit
Vertical space between sections and horizontal indents helps to
signal the relation between different parts of a medical record.
format. A later randomised trial studied actual use of
such partograms and confirmed the effect, even in
doctors trained with the flatter graphs.35
For comparison of similar data items collected at
different times, consistency in data display is important.
For example, if time is increasing from left to right in
one data-set, this ordering should be maintained in
other related data-sets. Similarly, the scale, origin, and
aspect ratio of graphs should remain consistent because,
as the partogram study showed, there is a risk that
doctors will interpret curves before checking such details.
When there is a set of complex data such as a series of
radiographs or battery of lung-function tests, inclusion
of a prose interpretation will save future readers’ time in
regenerating the original interpretation—or making an
incorrect one. The interpretation of data-sets is faster
when they are labelled with their message rather than
their content. Consider which would be easier for a
junior doctor browsing a complex table in the middle of
the night—one labelled “White-cell counts during April,
1998” or one labelled “White-cell count has fallen
throughout April, 1998”.
Use of computers to aid interpretation
Graphs and tables are easily produced by a computer,
especially when data are already in electronic form, such
as laboratory-test results. Data can be viewed on-screen
in wards or clinics, or a printout can be filed in the
paper record. However, the use of a computer is not a
substitute for good design. There are many examples of
poorly designed graphs and tables in commercial and
locally developed computer records, some of which
almost belong in a collection of parodies.13
Computers allow easy rearrangement of data to help
clinicians make comparisons. Thus, researchers have
designed record summaries as time-lines (figure 3) with
symbols that can be expanded into reports or
diagrams,36 as multiple small aligned plots,37 fish-eye
views,38 and even a “data wall”.39 These offer very high
data density, but may require clinicians to be trained in
their use; none has been tested in clinical use.
Computers also offer an expanded range of
opportunities for flagging and automatic, “intelligent”
1542
interpretation of numeric data, which extend well
beyond the capabilities of the handwritten record.40 For
example, automated electrocardiogram interpreters now
process more than 100 million electrocardiograms per
year with great accuracy.41,42 However, as with other
design changes to records, the impact of such decisionsupport systems on clinical decisions and actions needs
to be assessed.43
Conclusions
In clinical practice, we need the right data on the right
patient at the right time and in the right place. To
interpret the data correctly, however, we also need the
data in the right format and language. The format and
language depend partly on how clinicians enter data in
the record and partly on how documents such as
laboratory reports are designed. Improved record design
will enable faster searches and more accurate
interpretation, thereby improving outcomes for patients
and reducing the costs of health care. Although the
importance of many of the design factors we have
discussed in this paper has been known for a long time,
these factors seem to have had little influence on
medical-record format and language. Panel 2
summarises six principles of information design44 that
can enhance data interpretation. Fuller discussion of
how these and other principles can enhance medical
communication are available.11
The last paper in this series will examine the
advantages and disadvantages of computerisation of
medical records. Where does the balance currently lie?
Do computer-based records benefit clinicians and
patients, or interpose drawbacks and new design
demands?
References
1
2
3
4
5
6
7
8
9
10
11
12
13
14
15
16
17
18
Nygren E, Wyatt JC, Wright P. Helping clinicians find data and
avoid delays. Lancet 1998; 352:1462–66.
Tange HJ. The paper-based patient record: is it really so bad? Comp
Meth Programs Biomed 1995; 48: 127–31.
Fries JF. Alternatives in medical record formats. Med Care 1974; 12:
871–81.
Hartley J. Designing instructional text. London: Kogan Page, 1994.
Jansen C, Steehouder M. Forms as a source of communication
problems. J Tech Writing Commun 1992, 22: 179–94.
Schriver KA. Dynamics in document design, New York: Wiley,
1997.
Tufte ER. Visual explanations: images and quantities, evidence and
narrative. Cheshire, Connecticut: Graphics Press, 1997.
Wright P. Document-based decision-making. In: Rouet J-F,
Levonen JJ, Biardeau A, eds. Using complex information systems:
cognitive, ergonomic and educational perspectives. London: Taylor
and Francis (in press).
Poulton EC. Letter differentiation and rate of comprehension in
reading. J Appl Psychol 1965; 49: 358–62.
Pincus JM, Ike RW. Norflox or Norflex? N Engl J Med 1992; 236:
1030.
Simmonds D, Reynolds L. Data presentation and visual literacy in
medicine and science. Oxford: Butterworth Heinemann, 1994.
Aberson DH, Bouwhuis DG. Silent reading as determined by age
and visual acuity. J Res Reading 1997; 20: 184–204.
Wainer H. How to display data badly. Am Statistician 1984; 38:
137–47.
Baddeley AD. Your memory: a user’s guide. London: Wiley, 1996.
Cohen, G. Memory in the real world, 2nd edn. Milton Keynes:
Psychology Press, 1996.
Maylor EA. Older people’s memory for the past and future.
Psychologist 1996; 9: 456–59.
Verheijen E. Speech technology for medical reporting: consequences
for the correction process. PhD thesis, Eindhoven University of
Technology, Eindhoven, 1997.
Medin D, Alton MW, Edelson SM, Freko D. Correlated symptoms
THE LANCET • Vol 352 • November 7, 1998
MEDICAL RECORDS
and simulated medical classification. J Exp Psychol 1982; 9: 607–25.
19 Meyboom WA. Verslaglegging van huisartgenesskundig handelen.
PhD thesis Katholieke Universiteit te Nijmegen, Netherlands. 1991.
(Synopsis available in English).
20 Bransford JD, Johnson MK. Contextual prerequisites for
understanding: some investigations of comprehension and recall.
J Verbal Learning Verbal Behav 1972; 11: 717–26.
21 Pander Maat H, Klaassen R. Side effects of side effect information in
drug information leaflets. J Tech Writing Tech Commun 1994; 24:
389–404.
22 Sunderland A, Harris J, Baddeley A. Assessing everyday memory
after severe head injury. In: Harris J, Morris P, eds. Everyday
memory, actions and absentmindedness. London: Academic Press,
1984: 191–201.
23 Cranney M, Walley T. Same information, different decisions: the
influence of evidence on the management of hypertension in the
elderly. Br J Gen Pract 1996; 46: 661–63.
24 Wright P, Barnard P. Effects of “more than” and “less than”
decisions on the use of numerical tables. J Appl Psychol 1975; 60:
606–11.
25 Wason PC. The contexts of plausible denial. J Verbal Learning Verbal
Behav 1965; 4: 7–11.
26 Tversky A, Kahneman D. The framing of decisions and the
psychology of choice. Science 1981; 211: 453–58.
27 Elting LS, Rubenstein EB, Cantor SB. Stop the trial, I may want to
get off: the influence of data display on physician investigators’
decisions to stop clinical trials. BMJ (in press)
28 Wright P. Research in brief: understanding tabular displays. Visible
Language 1973; 7: 351–59.
29 Ehrenberg ASC. Rudiments of numeracy. J R Stat Soc series A 1977;
140: 277–97.
30 Fries JF. Alternatives in medical record formats. Med Care 1974; 12:
871–81.
31 Wyatt JC, Altman DG. Prognostic models: clinically useful, or
quickly forgotten? BMJ 1995; 311: 1539–41.
THE LANCET • Vol 352 • November 7, 1998
32 Wright P, Threlfall SM. Readers’ expectations about format
influence the usability of an index. J Res Commun Studies 1980; 2:
99–106.
33 Chapanis A. Man-Machine Engineering. London: Tavistock
Publications, 1965.
34 Cartmill RSV, Thornton JG. Effect of presentation of partogram
information on obstetric decision-making. Lancet 1992: 339:
1520–22.
35 Tay SK, Yong TT. Visual effect of partogram designs on the
management and outcome of labour. Aust NZ J Obstet Gynaecol
1996; 36: 395–400.
36 Plaisant C, Rose A. Exploring lifelines to visualise patient records.
In: Cimino J, ed. Proceedings of Annual Fall Symposium of
American Medical Informatics Association. Philadelphia: Hanley
and Belfus, 1996: 884.
37 Powsner SM, Tufte ER. Graphical summary of patient status. Lancet
1994; 344: 386–89.
38 Furnas GW. Generalized fisheye views. In: Mantei M, Orberton P,
eds. Proceedings of CHI’86: Human Factors in Computing Systems.
New York: ACM, 1986:16–23.
39 Marcus A, van Dam A. User interface developments for the
Nineties. IEEE Computer. September, 1991: 49–57.
40 Heathfield HA, Wyatt J. Philosophies for the design and
development of clinical decision-support systems. Meth Inform Med
1993; 32: 1–8.
41 Drazen E; Mann N; Borun R; Laks M; Bersen A. Survey of
computer-assisted electrocardiography in the United States.
J Electrocardiol 1988; 21 (suppl): S98–104.
42 Willems JL, Abreu-Lima C, Arnaud P, et al. The diagnostic
performance of computer programs for the interpretation of
electrocardiograms. N Engl J Med 1991; 325:1767–73.
43 Friedman C, Wyatt J. Evaluation methods in medical informatics.
New York: Springer-Verlag, 1997.
44 Redish JC, Battison RM, Gold ES. Making information accessible to
readers. In: Odell L,Goswami D, eds. Writing in non-academic
settings. Guilford, NY: Guilford Press, 1985: 129–53.
1543


© Copyright 2026