
Why data visualization matters White Paper ®
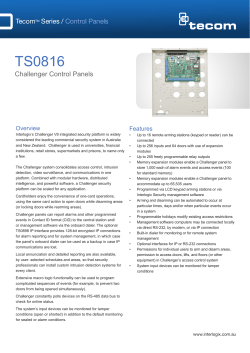
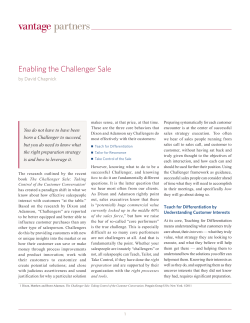
®
White Paper
Why data visualization matters
and how to visualize HR data in today’s world?
®
White Paper
Why data visualization matters and how to visualize HR data in today’s
world?
The amount of data in daily business is growing and therefore everybody needs
to process more data in less time. We literally need to crawl through tons of data
to peel out the information we need for our daily business decisions. Additionally,
compared to other departments, data from HR are often not visualized at all.
Endless Microsoft Excel lists; often with cryptically content and reports that only
experts can understand are dominating the scene. To improve the quality of data
representation and the quality of our business decisions we need to look for new
ways!
I still remember...
I still remember it as it just was yesterday, being a boy at the age of eleven watching
the Challenger launch on TV. Being a boy at this age I was thrilled by the notion that
there is a rocket carrying a shuttle into space with passengers aboard. I was especially
impressed of Christa McAuliffe, supposed to be the first teacher in space. I do remember
very well the seconds before takeoff: The excitement I was in, the astonishment and then
the countdown - five, four, three, two, one - liftoff!
I literally can see Challenger lifting off – and then, only seventy-three seconds after the
liftoff, all my excitement was suddenly replaced by sheer disbelieve - Challenger was history.
The only thing I remember then were the faces of spectators and relatives of the Challenger
crew, expressing deep misbelieve and grief – those pictures are still sticking in my head.
The “Challenger” catastrophe – also
a matter of data misinterpretation…
That’s what I remember of the Challenger
catastrophe today, twenty-five years later.
The aftermath with all the investigations
of that accident didn’t bother me as a kid;
hence I don’t have specific memories about
it. It all just came back to my mind when a
colleague of mine came up with the idea to
write an article about data visualization.
For this he provided some really interesting
insights of that accident, which illustrates
really good how bad data visualization
may affect our decisions we make.
As we know today, this all was caused
by a small O-ring used for the rocket
joints. It came out that the unusual low
temperatures of the launch day caused
some O-ring to get porous and therefore
it got leaky – and so the catastrophe took
its course. The investigations later on
showed that this issue was actually known
and had been investigated before the
accident happened. The chart on the right
side, which was presented to decision
makers at NASA before the launch, shows
historical O-ring damages in coherence
with the temperature.
Source Image: http://en.wikipedia.org/wiki/File:Challenger_explosion.jpg
Source Image: http://history.nasa.gov/rogersrep/v5p896.htm
®
White Paper
As it easily can be seen, it is very complex
and it is hard to get the message visualized
in this chart. The bottom line actually is:
As colder it gets as higher the likelihood
of O-ring damages.
The chart below contains the same
message but much better visualized:
The Right Way to Visualize Data
But it is also very important to visualize in
an appropriate and comprehensible way and it is of course also important not to
mix-up cause and effect as the following
example demonstrates…
Pirates fight Global Warming – or how
to visualize data in a proper way…
The same colleague who brought up the
Challenger issue also tried to convince
me of a correlation between the number
of pirates and the average temperature
on the planet - and he ‘proved’ it with the
following chart:
72 hours after exposure we
remember 65% of the information, if
we received it visually, but only 10%
if we received it auditory.
- humans can comprehend
information ten times
faster when it’s presented
visually
- vision is our most
dominate sense
Source Image: Tufte, Edward. Visual Explanations: Images and Quantities, Evidence and Narrative, p. 44
There it is much easier to conclude
that the likelihood of O-ring damages
increases immensely as the temperature
decreases. This is a very good example
for the benefit of visualizing data in a
more appropriate and understandable
way – the second chart tells the whole
story in a nutshell. Of course, it would
be too simple and also disrespectful
assuming only bad data visualization
had led to this accident. Nevertheless,
it shows how important it can be to
visualize data in a more graspable way it definitely helps to peal out the bottom
line of tons of data. Fortunately most of
us don’t have to deal with those serious
implications in our daily business. Data visualization really matters! We
can comprehend information ten times
faster when it is presented visually.
Vision is our most dominate sense; it
takes about 50% of our brains resources!
Visual Facts
- vision takes about 50% of
our brains resources
Source Image: http://www.venganza.org
The chart itself and underlying data
clearly show that as more pirates on earth
as lower the average temperature on the
planet. So, the conclusion is clear and
simple: We just need more pirates to fight
global warming!
This is another good example for misuse
and misinterpretation of data. It is true that
the average temperature has risen over
the last 200 years whereas the number of
pirates has decreased, so both variables
are correct. Nevertheless, that doesn’t
prove a correlation between both variables
– so be very aware of how you use data
and which conclusions can be drawn from.
(By the way, my colleague eventually gave
up his plan to join a pirate gang to fight
global warming and decided instead to
spend some more time on his analysis…)
®
White Paper
Lessons learned:
• Don‘t visualize only to visualize
• Assume that the audience is intelligent
• Be aware of the conclusions that
can be drawn from your
visualization
Visualizing HR Data – Why
Now?
- outputs need to be
understandable for the
business side and HR
• Easy to comprehend, but:
“An explanation should be as
simple as possible, but no
simpler.” [Einstein]
- the amount of data has
increased
- the complexity of data has
increased
- we need to transport
information more quickly
and more frequently
- other business functions
are already visualizing
their data differently
Let’s have a look on the ‘tools’ we currently
use in many HR departments on a daily
basis. First of all we see great HR systems
like SAP® ERP HCM that helps to store,
organize and manage our data. But does
it necessarily also broaden our basis of
information? Just think about a very basic
and simple task – creating a headcount
report. Of course we get the data quickly
out of the system by just running a
report (provided the system and data are
properly maintained) and extracting the
data into an Excel file. Now we have the
data, but how’s about the information or
moreover the insight?
Usually we then start to crawl
through endless lists and tables, very
often with cryptically headers that
only experts can understand, trying to
get the answer to a simple question:
Where do we have vacancies, in which
business unit do we have the most
vacancies, people, positions, etc. and
what are the positions we need to fill first?
The ‘HR data world’ today…
We learned that data representation really
matters and could lead to both, good and
bad decisions. So let’s turn the spot now
on today’s business world and especially
on the ‘HR data world’ we are facing today
in many companies.
If you think of the HR department
twenty years ago, the most important
issues were payroll and staffing. HR
wasn’t so much considered as an equally
strategic approach as Marketing was
for example. Fortunately HR has made
its way from a more administrative and
‘necessary’ part of the company to an
important strategic piece embedded in the
company’s strategic framework. Today we
recognize that all success depends a great
deal on the people and so HR is the key
to it. But the increasing number of duties
comes along not only with a growing
amount of data we need to process
every day, it also comes with a higher
complexity. Besides that, we also hear
very often that HR is kind of ‘backwards’
when it comes to data visualization,
especially when you compare it with other
departments like Finance or Marketing.
As the picture above indicates, we surely
do have any data we need for our analysis
- but we need literally pealing out the
information or insight we are looking for.
This is actually not what we have in mind
when we think about the easiness to
comprehend and the help we need for
good decisions. It demonstrates the need
for tools that help us turn all the data
into relevant and easy to comprehend
information. It is something comparable
to the chart of the O-ring damages above:
We have all data but no insight…
®
White Paper
A great old and new way to visualize
HR data…
Imagine someone is asking you about the
location of your position in the company’s
structure. In a small organization it might
be not too difficult to explain, for example:
“I am the guy who is responsible for the
HR IT and I am reporting to the HR Director
who directly reports to our CEO”. Now,
let’s assume you are working in a globally
operating company which is organized
in several business units and by a matrix
organization. Now it is probably not so
easy anymore to explain your position’s
location, provided you are not the CEO on
the top of this organization (good for you
if you are ;-).
In HR we already do have a great tool
that makes it very easy to comprehend
even very complex structures on a first
glance – the ‘good old’ org chart!
where are positions that need to be filled
soon and so on. Just to give you a simple
example it could look like the picture below:
Ingentis org.manager is
the ideal tool for fullyautomated organizational
chart creation
- no manual organizational
chart creation efforts
- current and generally
available organizational
charts
- already used by more than
700 major companies
What else could be visualized in an
org chart? Just think about work items,
trainings
received
by
employees,
absence data, diversity analysis by
departments,
potential
successors,
talent data… – the large variety of
possibilities is only limited by your ideas:
Unlimited design of your
organizational charts
- comprehensive display
types and freely definable
colors, patterns and lines
- integration of photographs and other graphics
The org chart provides a quick overview
of even a very complex situation, in this
regards an organizational structure.
Without such a visualization tool it is a
very complex formation to describe - with
a proper visualization it is not so complex
anymore. So, why not use this great
tool also for visualizing our HR KPI’s as
well? Most of our HR data are anyways
somehow related to either org units,
departments, positions or employees, and
therefore the org chart is a great basis
to visualize and publish those HR data.
Coming back to our headcount
report, it could be visualized right in
the org chart and so it quickly gets
clear where we do have vacancies,
- target-group-specific
layout profiles
These are just some examples of how
you could visualize your HR KPI’s in an
understandable and easy to comprehend
way by using your org chart as a basis.
®
White Paper
How to actually work with the charts
within my organization?
As anybody of us knows, visualizing data
is just one side of the medal; the other is
how to present and to actually work with it?
Using a tool like Ingentis org.manager,
you are not only able to create
automatically those org charts right out
of your SAP system, you also are capable
to publish the charts in many different
ways in order to actually work with them.
For example, you can export them as
images, PDF-files or you just print it. On
top of it, you also are able to publish those
charts as dynamic HTML and integrate
them into any existing Intranet Portal.
So everybody in your organization could
access it if you don’t limit the access
to certain people for specific charts.
Especially the integration into your
Intranet Portal provides a huge variety of
additional functionality. You could ‘jump’
right from the org chart (org unit, position,
employee etc.) into another website or into
a specific transaction in your HCM system.
You even could build a whole
‘information system’ around it with
additional ‘tabs’ containing additional
information to org units or employees, all
that in your own corporate design and ‘look
and feel’. Once you have gone the way so
far, why not using the org chart also as a
great basis for a corporate wide directory?
Ingentis org.manager also at home in the web
- platform independent
- permanent, worldwide
access to current
organizational charts
- seamless integration in
your company portal and
your corporate design
- no additional plug-ins
necessary
- server version for the
generation of HTML pages
available at runtime
- no HTML expertise
necessary
As you can see, there are so many ways
to visualize and to work with HR data
in an innovative way, that just your
ideas limit the possibilities. There is an
aphorism once stated by Marcel Proust,
that really conveys the message that I
wanted to bring across: “The real voyage
of discovery consists not in seeking new
landscapes, but in having new eyes.”
Thorsten Gorny is Director of Business Development & Sales NA at Ingentis. After
he had studied business administration he continued his academic education by
earning a diploma in marketing where he focused on marketing-strategy and customer
relationship management.
His professional career is characterized by different positions where he developed
and implemented successful marketing and sales strategies, CRM- and reorganization
projects in companies from different industries. Thus his experience reaches from
strategy- over marketing- to administrative-functions like human resource management.
At Ingentis he is responsible for Business Development and Sales focusing on the North American
market. In that position he has been helping customers from different industries worldwide to
improve their HR data management and HR data visualization.
Thorsten Gorny was born in Germany and he currently lives in the San Francisco Bay Area .
For more information...
please visit www.ingentis.com or use
our service hotline: +49 (911) 98 97 59-0.
Ingentis Softwareentwicklung GmbH
www.ingentis.com - [email protected]
Corporate Headquarters
Raudtener Str. 7
D-90475 Nuremberg
Germany
Tel: +49 (911) 98 97 59 - 0
Fax: +49 (911) 98 97 59 - 99
org.manager is a registered trademark of Ingentis Softwareentwicklung GmbH in the European Union and the United States of
America, copyright © since 1999. All other company, product and service names are trademarks of their respective companies.
Seamless integration in
your system environment
- fully certified
SAP ® integration
- PeopleSoft ® , Oracle ®
and P&I ® interfaces
- high-performance ODBC,
CSV and LDAP interfaces


© Copyright 2026