
LESSON 1: How to Use Patented, Independent Life Insurance Pricing and
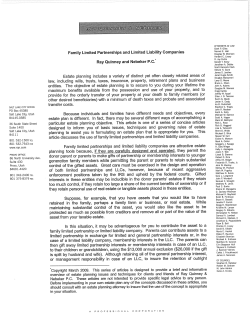
LESSON 1: How to Use Patented, Independent Life Insurance Pricing and Performance Research in Your Year End Planning to Create Immediate Bankable Results in Your Practice Prepared for: Research Accepted by NFP Prepared by Steven Zeiger XRAY YOUR LIFE INSURANCE SERVICES 1120 Avenue of the Americas New York, NY Tel 917 750 6201 [email protected] i @ lif i For presentation by a licensed Insurance Banking Center® © 2009 XRAYYOURLIFEINSURANCE.COM All rights reserved Patented Independent Research Reports P t t 6,456,979 Patents 6 456 979 & 7,698,158 Endorsed Provider NJBA and NYBSCO XRAY is a licensed IBC How To Apply THIS Patented, Independent Research for Bankable Results Now © 2010 XRAY YOUR LIFE INSURANCE SERVICES LLC All rights reserved Agenda Items 1. Education- learn how to use Patented Pricing and Performance Research in year end planning Case study: • Male age 54 • $29,791,472 life insurance in force • Best Available Rates and Terms- written warranty • www.Policypricingcalculator.com 2. Sample Monte Carlo Simulation Case Study • $25,000,000 life insurance in force • Determine the probability of a premium call, or policy lapse 3. Sample Consulting Opportunity • Uninsurable Case Study 4. Which clients to begin with—Triaging 5. Mining- “No one comes to mind” from your partners, business is slipping away from your clients. Prevent competitors from eating your lunch 6. Commission and Consulting Trigger Opportunities for 2010. Time is of the essence. 7. Cochran vs KeyBank © 2010 XRAY YOUR LIFE INSURANCE SERVICES LLC All rights reserved Let’s Learn About Pricing and Performance Research • A 36 page life insurance illustration • 426 numbers • Summarized pictorially on one page • Independent • Multiple patents • Multiple endorsements © 2010 XRAY YOUR LIFE INSURANCE SERVICES LLC All rights reserved Why Utilize Pricing and Performance Research? •CPAs- E & O, 6694 Penalty for undervaluation of an asset such as for a hedge, for estate and gift tax purposes, Circular 230 for nondisclosure of risk and remediation •CPACPA as trusteet t UPIA PIA UPIA, PIA, UPMIFA UPMIFA, ERISA •CPA- E & O, advising non professional trustees. Vicarious liability when referring to p trustee. corporate •CPA- licensed to sell life insurance: more revenue, more independent, research does the selling •CPA/PFS- Fiduciary, new business opportunities. © 2010 XRAY YOUR LIFE INSURANCE SERVICES LLC All rights reserved What You Always See Typical Product Comparison 54 male male, Preferred Non Non-Smoker, Smoker $12,200,000 $12 200 000 death benefit A typical life insurance illustration on a 54 year old will have over 364 numbers that are impossible to compare Quick Compare Report - Premium Solve – 1035 rollover = $806,000 $806 000 Initial Initial Premium Company/ Death Annual Pay Name Class State Product Benefit Premium Years AG - American General Life Companies Prospect M54 P NY 12,200,000 157,090 12 ContinUL Allstate Life of New York Prospect M54 P NY 12,200,000 170,518 12 Legacy Secure NY 2007 Aviva Life and Annuity Company of NY Prospect M54 P NY 12,200,000 114,601 12 Empire Solution Series II 2008 GLICNY G C Fixed ed Life e ( (formerly o e y AML) ) P Prospect t M54 P NY 12 200 000 12,200,000 172 049 172,049 12 GenGuard UL NY GLICNY Fixed Life (formerly AML) Prospect M54 P NY 12,200,000 187,946 12 Lifetime Protector SG II NY ING Life Prospect M54 P NY 12,200,000 173,519 12 ING GDBUL II NY John Hancock Prospect M54 P NY 12,200,000 170,856 12 Protection UL-G 10 Lincoln Financial Group Prospect M54 P NY 12,200,000 163,060 12 Lincoln LifeGuarantee UL 2009 Metlife Investors Prospect M54 P NY 12,200,000 159,916 12 Guarantee Advantage UL (2001 CSO) Nationwide Prospect M54 P NY 12,200,000 153,654 12 YourLife No-Lapse Guarantee UL Principal Life Prospect M54 P NY 12,200,000 157,753 12 Universal Life Protector III Prudential Prospect M54 P NY 12,200,000 176,808 12 PruLife UL Protector (2001 CSO) Sun Life Prospect M54 P NY 12,200,000 172,278 12 Sun Universal Protector [2010] Transamerica Prospect M54 P NY 12,200,000 197,989 12 TransACE CV Thi report This t is i for f agent t use only. l These Th values l are not t guaranteed t d and d actual t l results lt may be b greater t or less l than th those th shown. These values are not valid unless accompanied or preceded by a source ledger for each policy illustrated. Refer to the source ledger for guaranteed elements and other important information. Sex Age WHAT’S MISSING FROM THIS PRESENTATION?? 1. 2. 3. 4. Independence Hundreds of other companies Cash Value Performance Insurer Ratings 5. 6. 7. Internal Costs Pricing Stability Historical Performance of the Underlying Assets Probability of Premium Call How Effective Will Your Decision Be Without This Information? Financial Strength & Claims Paying Ability Financial strength and claims paying ability: (1 Star) - Insurer's financial strength and claims paying ability ranks on the top decile (top 10% all pq quartile 25% ) insurers)) ( ½ star for top - High ratings and low cost is considered more appropriate than otherwise. - Insurer's ratings g and rankings g by y the four leading g rating g services using g a composite p index. -Financial strength is not related to investment performance, or future investment performance - Lengthy period of risk exposure/front end/back end fees/health issues © 2010 XRAY YOUR LIFE INSURANCE SERVICES LLC All rights reserved Cost Competitiveness Cost Competitiveness: - Cost structure and premium that is more competitive than the relative benchmark- top decile. - Low premiums that are the result of a low cost structure, attributable to some demonstrable operating underwriting or marketing advantage are considered more appropriate than otherwise operating, otherwise. -Note: cash values are confiscated at death. Low COIs associated with high cash values (low amount at risk) must be compared with the present value cost of forfeiting those cash values at death Creating value vs. death. vs destroying value value. -For every dollar that you save in expenses, that is one dollar less to pay in premium and 50% less to pay in gift tax. -www.xrayyourlifeinsurance.com click pricing calculator © 2010 XRAY YOUR LIFE INSURANCE SERVICES LLC All rights reserved Pricing Stability Pricing Stability: i i S bili ‐ Pricing on all life insurance policies is a function of three variables: (1.) cost of insurance charges, (2.) policy expenses, (3.)actual earnings on policy cash values. ‐ Pricing for the policy under evaluation is adequate and reasonable. COI charges an policy expenses purely based on actual claims and operating experience. ‐ Insurer Insurer'ss retention capacity allows it to exercise substantial control over pricing. retention capacity allows it to exercise substantial control over pricing ‐ The pricing for the policy under evaluation is based on interest assumptions, which are in line with historic returns for the asset classes corresponding to the asset types, for which the cash value is invested. Or, they are unrealistic ‐ No way of predicting whether a policy will perform as illustrated, however the system does consider whether the values illustrated are consisted with the insurer's historical experience. ‐ How potential changes and experience might impact future performance. And if this experience has been fully disclosed. ‐To be considered suitable, the pricing must be adequate to meet future claim T b id d it bl th i i tb d t t tf t l i obligations and expense obligations of the insurer © 2010 XRAY YOUR LIFE INSURANCE SERVICES LLC All rights reserved Cash Value Liquidity Relative Policy Value: - Cash value liquidity for this policy is greater than the representative benchmarks. - The cash value liquidity can be less relevant in certain plan designs, policies with higher cash values and greater liquidity are generally considered more appropriate than policies with lower cash and limited access. -Judged on short, medium and long term (1, 10 and 20 years) -Higher cash values give more planning options, exit strategies, greater flexibility © 2010 XRAY YOUR LIFE INSURANCE SERVICES LLC All rights reserved Historical Performance Historical Performance: - Historical yield on the insurer's general account supporting illustrated cash values is roughly the same as the average historical net yield for all the insurers insurers. - By law, insurers are invested in predominately declared rate investments, such as bonds and mortgages. - Policy credit rates may be higher or lower than the insurer's net portfolio yield at a given time. - Over time, policy credit rate must correlate with the yield on the insured's general account. - Higher historical net yields are generally considered more appropriate than policies whose cash values are invested in general accounts and with lower historical net yield. © 2010 XRAY YOUR LIFE INSURANCE SERVICES LLC All rights reserved Compare Dis‐similar Products •Gross rate- return applied before expenses •Net N t ratet return t applied li d after ft deduction d d ti ffor iinvestment t t related l t d expenses •Net net return- return applied after all expenses © 2010 XRAY YOUR LIFE INSURANCE SERVICES LLC All rights reserved Product Rating • • • • • • • Product Rating: ( example: 4 1/2 stars out of 5 stars) Product Type: WL (UL, VL, SWL, SUL, SVL, GUL, SGUL, GVL, SVL, COLI, BOLI) Premium Type: Fixed (Flexible) Min. Face Amount: $10,000 Optimal Funding Strategy: Mixed (Minimum Premium, Maximum Accumulation) Pricing Style: Retail Institutional Experience- Rated Net Portfolio yield: Policy under evaluation 6.89% 5-yr Avg. Net Portfolio Yield* all policies 6.53% © 2010 XRAY YOUR LIFE INSURANCE SERVICES LLC All rights reserved Premium Comparison vs. Benchmark •Calculates the minimum level annual premium required over 7 years to endow the policy •Assuming a 6.25% average net policy earnings rate •Assuming current expense assumptions for a policy issued to a •For a policy issued to a 54 year old male Non‐Smoker Preferred + risk. •$12 $12,200,000 face amount 200 000 face amount Policy Under Evaluation I tit ti Institutional l Pricing Pi i B Benchmark h k Benchmark for All Policies © 2010 XRAY YOUR LIFE INSURANCE SERVICES LLC All rights reserved Internal Costs vs. Benchmark C t off Insurance Cost I Charges Ch Policy Expenses Premium Loads 1. Policy Under Evaluation 2. Institutionally Priced Policies 3. Retail Policies Policy Expense Breakdown •Measures the present value cost per $ of Death Benefit of the individual cost components • Policy expenses, premium loads, COI (Cost of Insurance) •Assumes A id identical ti l ffunding di amounts t and d ffunding di patterns tt •Policy issued to a 54 year old male Non-Smoker Preferred + risk. © 2010 XRAY YOUR LIFE INSURANCE SERVICES LLC All rights reserved Hypothetical Policy Cash Value Growth vs. Benchmark 1. This graph shows how different policy charges effect policy value and death benefit. 2 Hypothetical2. Hypothetical may not be used project actual policy performance or tax treatment treatment. 3. Assumes $260,330 is deposited with the current insurer and all others Policy Under Evaluation Institutional Pricing Benchmark Benchmark for All Policies © 2010 XRAY YOUR LIFE INSURANCE SERVICES LLC All rights reserved Policy Expense Breakdown COI- deductions for claims COI Policy expenses- Mortality and expense charges, other account value based charges Premium loads- state tax, Fed DAC tax, admin, distribution and operating expenses © 2010 XRAY YOUR LIFE INSURANCE SERVICES LLC All rights reserved Case Study: P t t d Lif I Patented Life Insurance Pricing and Performance Research Pi i dP f R h • • • • Male physician age 54. Male physician age 54. Issued Preferred and Preferred plus Obt i d 9 li i / Obtained 9 policies / past 12 years (3 ½ ‐ t 12 (3 ½ 4 ½ stars) 4½ t ) $29,791,472 current Life Insurance • “Constantly hit over the head by life insurance agents” • Trustee/attorney “intrigued” by independent view / y g y p • Signed limited power of attorney • GO TO THE PDF pages 1‐7 GO TO THE PDF pages 1 7 © 2010 XRAY YOUR LIFE INSURANCE SERVICES LLC All rights reserved Prepared for: REDACTED Joel Kassimir, MD “Best of Breed”i Individual Life Products Summary of Policy Costsii,iii (per $1M of Death Benefit) Policy Holding, 1 Suitability Star Ratings , Asset Allocation Profile & Assumed/Expected Rate of Return Public Insurer NY@ 6.25% ½ WeightedAverage Annualized iv Death Benefit $13,160,381 NON-Guaranteed Inforce Holding(s) v Very Conservative @ 6.62%? $11,314 NON-Guaranteed 1 “Best of Breed” 5 Very Conservative @ 6.62% 6 $11,314 © 2010 XRAY YOUR LIFE INSURANCE SERVICES LLC All rights reserved Fully-Guaranteed 1 “Best of Breed” 5 Very Conservative @ Guaranteed $11,314 vi Warranty- Best Available Rates and Terms Policy Holding, Suitability Star Ratings1, Asset Allocation Profile & Assumed/Expected Rate of Return PUBLIC INSURER NY@ 6.25% ½ PUBLIC INSURER NY @ 6.60% MUTUAL INSURER NY@ 6.79% ½ NON-Guaranteed Inforce Holding(s) Very Conservative[ii] @ 6.62%? NON-Guaranteed “Best of Breed”1 Very Conservative5 @ 6.62% Fully-Guaranteed “Best of Breed”1 Very Conservative5 @ Guaranteed $13,160,381 $11,314 $11,3146 $11,314[iii] $1,152,341 $16,070 $12,563 $14,368 $1,203,652 $21,628 $12,358 $14,682 WeightedAverage Annualized Death Benefit[i] [i] Death benefits are expressed as the weighted-average annualized death benefit with any changes in death benefits from year-to-year being weighted for the time-value-of-money using a discount rate equal to the assumed policy earnings rate indicated. [ii] A Very Conservative Risk Profile is appropriate for policyholders whose primary objective is preservation of cash values and who require stable growth and/or a high level of income, access to p policy y cash values within 3 y years, and are highly g y risk averse and p prepared p to accept p lower returns to p protect capital p without regard g to the negative g effects of inflations, and where cash values are allocated predominantly to high-grade corporate and government bonds and government-backed mortgages which together are expected to produce returns ranging between -2.22% and 16.58% and average at least 6.0% or more over time (Source: Morningstar). Actual results may vary. [iii]Existing policy holding(s) where insurer representations as to future policy costs are equal to or less than best-available rates and terms, and are therefore shown to be maintained in the “best-of-breed” portfolios. However, to the extent existing policy holding(s) are maintained in “best-of-breed” portfolios, such existing policy holdings may not allow for diversification of invested assets underlying policy cash values and thus may not perform like other holding(s) in the non-guaranteed “best-of-breed” portfolio, and/or may not include premium/death benefit guarantees and thus may not behave like other holding(s) in fully-guaranteed “best-of-breed” portfolio. © 2010 XRAY YOUR LIFE INSURANCE SERVICES LLC All rights reserved Reduced Life Expectancy/ U i Uninsurable Case Study bl C St d Reduces Cost/ Increase Death Benefits with Internal Adjustments From which p policy? y Into which p policy? y When? How to? Why y not? ™ 62 year old, uninsurable, $25M portfolio, sub-portfolio of 10 whole life policies $5M DB,, premium p of $165k $ p plus $ $33,6k , interest p plus $ $33.6k conditional recognition g cost equal $232K annually. 1. Repaid $542k loan internally, generates a savings of $27,000 of interest plus $33,600 conditional recognition cost, Savings equal 60K. 2. Switch $119k of dividends from “paid up additions” to reduce premiums. Generated savings of $46,000 plus $6,000 (i) plus $6,000 (CR) equals $58,000. 3. Switched $155,000 loans charging 8% percent to 5% savings of $4,679. 4. Switch premium from quarterly to annual, saving $6,800. 5. Increased death benefit by taking loans taken vs surrendering additions. Death benefits projected to increase $924k on $4.83mm sub portfolio and $1.7mm- 10 yrs. Grand total savings of $130,000 including gift tax $195,000 a year which is $2.9M time value of money for life expectancy (10 years) Sample Monte Carlo Simulation Case Study Sample Monte Carlo Simulation Case Study • • • • • • Female age 55 issued preferred Female age 55 issued preferred Policy year 7 Death Benefit $25 000 000 Death Benefit $25,000,000 Annual premium $191,462 $25 000 000 P j t d $25,000,000 Projected cash at age 100 @ 8% h t 100 @ 8% Client asks “what are my risks?” – Insurer raises cost of insurance charges – Policy underperforms expectations – Will premium be paid Will i b id • LOOK AT THE PDF Insurance Portfolio Repurposing Timely Year End 2010 Estate Planning Tools Pushback: Lack of Funds / Liquidity / Need The Funds/ Mortality Risk/ Impact on Natural Death Up Front: At Inception Throughout Term At End Of Term q Need Adequate Income to Pay Annuity/ May Need Liquidity / Need Tax Money ( on cg in nongrantor) CLAT ™ Risk of Premature Death Impact on Gifted Asset At Natural Death Income Tax Deduction Recapture in Grantor CLAT Carryy Over Basis IDGT Need Seed Money (10%) Need Installment Money Or: Need Balloon Payment Money Income Tax vs. Gift Tax /Loss of Seed Money Carry Over Basis Intra-Family Loans Need Money Need Installment Moneyy Or: Need Balloon Payment y Moneyy Income Tax vs. Gift Tax Carry Over Basis GRAT Need Funds For Reinvestment/ Income Need Adequate Income to Pay Annuity GRAT Fails Carry Over Basis Roth IRA Conversion Need Tax Money May Need Liquidity During 5 Year Blackout Period Risk That the Tax Free Distributions Law May Change Bad Outcome Prior to Crossover Period Copyright 2010. All Rights Reserved. Confidential and Proprietary to Intergenerational Wealth Preservation, Inc. Next Steps Next Steps 25

© Copyright 2026