
HOW TO MONITOR INDICATORS IN LOCAL TRANSPORT PLANS AND Contents: 1.
HOW TO MONITOR INDICATORS IN LOCAL TRANSPORT PLANS AND
ANNUAL PROGRESS REPORTS - 2002 UPDATE
Contents:
1. Introduction
2. Core indicators
3. Defining objectives, indicators and targets
4. Types of Indicators – input, output and outcome
5. Indicators in common use in LTPs and APRs
6. Developing a cost-effective Monitoring Strategy
7. Statistical reliability
8. Where to go for further information
9. Menu of recommended indicators
10. Detailed guidance on the core and recommended indicators
Annex 1 - National sources of information
Annex 2 - Statistical reliability
Annex 3 - Measurement of congestion
Annex 4 - The floating car method of monitoring traffic speeds
Transport Statistics Personal Travel
DTLR
April 2002
1
Introduction
1.1 This guidance replaces the guidance which was issued in Februa ry 2001. It is
intended to help Local Authorities monitor progress against the indicators and
targets in their Local Transport Plans and Annual Progress Reports. The
guidance has been updated following a round of seminars held in October 2001,
which were attended by Local Authorities involved in the Local Transport
Planning process. The guidance has also been discussed in the Working Group 1
reporting to CLIP-TS.
1.2 The guidance now includes a set of core indicators (see section 2 below). We
would expect that the core indicators will be relevant to local authorities’ own
objectives and targets, and all authorities will be expected to report against
the core indicators .
1.3 The guidance also includes a further menu of indicators which are recommended
(see section 9 below). The previous guidance stressed that it was not the
intention to trigger a general data collection exercise in local authorities. For
the non-core indicators, this is still the case - the guidance should be used to help
authorities bring together the necessary data in the most cost-effective manner.
Authorities may choose to use other recommended indicators only where they
correspond to their own objectives. Existing sources of data should be used
wherever possible. Only if no existing source is available should authorities
consider collecting new data. See paragraph 9.5 for the menu of recommended
indicators.
1.4 The advice given here reflects current knowledge and practice within authorities.
CLIP-TS would be interested to receive comments on the guidance and its
application within authorities so that good practice and experience can be shared;
we would also like to hear of additional or alternative ind icators which
authorities find useful.
2
Core Indicators
2.1 There are nine core indicators, reflecting the most important high- level transport
targets that the Government has set itself. These comprise Public Service
Agreement targets and 10 Year Plan targets and indicators; because of their
fundamental importance, we expect all authorities to report progress against
these core indicators (or reassure us that they are collecting baseline data). If an
authority chooses not to report progress on any of these core indicators, it should
state the reasons why it does not consider them to be relevant.
2.2 We recognise that some authorities may not have baseline data on the core
indicators against which they can record progress in their second APRs. But we
envisage that over time, the data can be aggregated to build up a national picture
of progress, and that this will help us quantify progress made by authorities
towards the national targets and outcomes.
2.3 The Core indicators are:
1
The Working Group comprises representatives from DTLR, the LGA, individual LAs and GOs, and the Audit Commission. It
reports to CLIP – Transport Statistics (CLIP-TS), a subgroup of the Central and Local Information Partnership (CLIP). This
subgroup comprises representatives from DTLR, LAs and the LGA. One of the aims of CLIP-TS is to act as a point of contact
between local authorities and DTLR on statistical matters of common concern, including the statistics needed for the monitoring of
Local Transport Plans, Best Value Indicators, Regional Statistics and other relevant matters.
1
(a) Core indicators on which information should be reported by local authorities
Area
Indicator
Road Maintenance
Road Condition
Public transport - bus
Number of bus passenger journeys
Bus passenger satisfaction2
Cycling
Number of cycling trips
Road safety
Number of deaths and serious injuries (all ages)
Number of children killed and seriously injured
Light rail passenger journeys 3
Light Rail
Accessibility
4
% of rural5 households within 13 minutes walk of an hourly or better
bus service6
(b) Core indicator on which information will be provided by DTLR
Area
Indicator
Road Traffic
Congestion - Average time lost per vehicle kilometre
This core indicator is only applicable to large urban areas - these are defined as the
conurbations for which there is a PTA and urban areas with population greater than
250,000 i.e. Blackpool, Bournemouth, Brighton, Bristol, Hull, Leicester,
Middlesborough, Nottingham, Plymouth, Portsmouth, Southamp ton and Stoke.
Baseline data for congestion in 2000 will be published by DTLR in Summer 2002,
and thereafter on a two year cycle. Authorities are therefore not required to collect
data independently at present.
3
Defining objectives, indicators and targets
3.1 It is useful to clarify some of the terms commonly used – objectives, indicators,
and targets:
2
This information was collected for BVPI 104 for 2000/01 - authorities which have data for 2001/02 should also report that data
Only applicable to authorities with light rail lines
4
Indicators in this part of the framework will need to be reviewed in the light of the recommendations of the SEU study of
Transport and Social Exclusion
5
Rural households are households living in settlements of less than 3,000 population (as defined in the Census of Population
6
This indicator in measured at national level using a time band of 8 to 13 minutes, as noted in the 10YP
3
2
An objective is a statement of intent - what we want to achieve – for example,
fewer children going to school by car.
An indicator is the (usually) quantifiable measure which is used to monitor this
objective – for example, the number of pupils going to school by car, expressed
as a percentage of all pupils.
A target is a specific point which we want to reach by a stated time – for
example, for the proportion of pupils going to school by car to fall to 30 per cent
by 2003.
It is important to also give the baseline against which the target is being
compared – usually an earlier date, or a national or regional average or norm.
3.2 There is a lot of literature available about what makes a good indicator (e.g. the
Audit Commission website 7 , and the FABRIC framework published by HMT8 ).
Of most importance:
•
it must be meaningful;
•
it must reflect what it is intended to measure (and not be open to
manipulation);
•
if it is to be monitored over time, its measurement must be consistent and
replicable;
•
it must be measurable without excessive costs (see also section on designing
a cost-effective monitoring strategy).
It is therefore important to be precise in defining the terms used: in the examples
above, do we mean school children resident in the area, or children going to
school in the area? The time(s) of year, when the measurement is taken should be
replicated in future surveys, to minimise the possibility of seasonal variation
affecting the results. The choice of definition may often be pragmatic – it is
probably cheaper to survey schools than to survey households, which suggests
using school population rather than resident population. In most cases it will
make little difference which is used, but the authority must be consistent over
time and state what has been done. Using standard definitions and methodology
as recommended in the section on detailed guidance below will allow
comparison with other authorities and national targets and norms.
4
Types of Indicators - input, output and outcome
4.1 Monitoring arrangements need to be considered as an integral part of LTP
development. The Guidance on Full Local Transport Plans states that plans
should show a clear link between objectives, measures (i.e. actions taken) and
outputs, and that authorities might find it useful to use a causal chain diagram
which links measures to objectives. This should help authorities clarify what rôle
they have in helping to achieve each outcome. This logical approach also applies
to the different types of indicators:
7
http://www.audit-commission.gov.uk/publications/brtarget.shtml
http://www.hmtreasury.gov.uk/Documents/Public_Spending_and_Services/Performance_Information/pss_perf_pisfabric.cfm
8
3
Outcome
fewer children travelling to school by car
?
Output
?
school travel plans, safer routes to school
?
Input
?
more resources (staff and money)
Note that this is a simplification - there is not always a one to one relationship inputs and outputs may each contribute to more than one outcome.
4.2 Authorities will probably wish to monitor all of these types of indicators. Indeed
it is often easier and cheaper to monitor inputs and outputs, these are likely to be
more directly under the authority’s control and to change more quickly than
outcomes – but it is important not to lose sight of the desirable outcomes, and to
monitor them directly where possible. This guidance concentrates on the
outcome type indicators. Generally, input and output information will be
available from administrative systems within the LA or from transport operators
etc.
5
Indicators in common use in LTPs and APRs
5.1 During 2001 DTLR commissioned a consultancy to produce a database of
indicators contained within LTPs. The result of this project was an ACCESS
database which has been distributed to all LTP authorities. The database was
introduced to authorities at the series of regional seminars which were held in
October 2001. The purpose of this database was twofold. Firstly, to identify
which indicators were in common use by authorities, and thus to enable DTLR to
target their advice to authorities. Secondly, to make available to authorities
information about which other authorities were working on similar indicators to
themselves. This information was intended to allow authorities to share
experiences and to learn from each other. The database was based on the original
LTPs. Some authorities have reported errors and omissions in the lists of
indicators, but generally the database provides a broad guide to the types of
indicators which were used in the original LTPs.
5.2 DTLR are developing a revised database which will record the indicators
contained in the first Annual Progress Reports. Generally, authorities have
increased the number of indicators they are using and this will be reflected in the
revised database. The indicators will also be recorded in more detail than they
were in the original database, and targets will be included. This new database
will be made available to all LTP authorities as soon as it is available (probably
at the end of April).
6
Developing a cost-effective Monitoring Strategy
6.1 Monitoring can be expensive, so it is important to ensure that it is carried out as
efficiently and cost-effectively as possible. We generally advise against carrying
out household surveys because they can be very expensive to do properly and
4
may not in fact measure accurately the things in which authorities are interested.
The section and annex on statistical reliability explain this in more detail.
6.2 There is an inherent statistical problem with any monitoring which is based on a
sample of the population being studied, whether this is people, schools, or
vehicles. The sample size needed to get a result with a given level of reliability is
(almost totally) independent of the size of the population from which the sample
is being drawn. The implication of this is that a small unitary would need the
same size sample as a large metropolitan county to achieve the same level of
reliability for the estimates derived from the sample. In particular, a large (and
costly) sample is needed if estimates are needed for activities which are not
common e.g. cycling. A further complicating and costly factor is that generally
authorities will want to measure changes over time. If estimates are surrounded
by a large margin of possible error, then it is not possible to detect with certainty
a relatively small change over time (see the section on statistical reliability).
6.3 Outcomes can be measured or estimated in a number of different ways. For
instance, many authorities have proposed objectives and indicators in relation to
mode share, but it is difficult to monitor overall mode shares directly, except
through a household survey involving a diary of every trip (as in the National
Travel Survey), which many authorities will find too expensive. Similarly,
estimating overall walking and cycling activity presents problems.
6.4 However, it is possible to monitor much more cheaply a shift in modes used for
key journeys like journeys to work or to school, or to popular destinations like
major retail or leisure facilities (see relevant sections of this guidance). These
measures in conjunction with traffic counts or traffic flow information, together
with information on patronage of public transport, would be sufficient to
demonstrate whether there has been a shift in mode share, particularly at peak
times of day when achieving a shift in travel patterns matters most.
6.5 To be more specific - if school surveys showed that fewer children were arriving
at school by car and bus patronage had increased and traffic in the morning peak
had reduced, then one could be fairly confident in saying that there a been a
change in the modal split pattern - certainly at that time of day.
6.6 Where possible, authorities should make use of existing sources of information.
The National Travel Survey is being expanded from January 2002 to around
10,000 responding households, so that more subnational data can be produced
(see Annex 1 on National Sources). The Department may be able to offer some
authorities the opportunity to pay for a boost to the NTS sample in their area (see
"Boosts to NTS" at http://www.clip.gov.uk/groups/transport/sub_transport.htm).
If this is too expensive, authorities might consider combining data from two or
more years from the NTS, or combining with neighbouring authorities to pay for
a boosted sample for a slightly wider geographical area. Small Unitary
authorities in particular might consider joining with neighbouring authorities
covering their key travel to work areas.
6.7 If, however, authorities do decide that a household survey is necessary then
advice is available - see the section on statistical reliability below (and Annex 2)
and "Monitoring Personal Travel for Local Transport Plans" at
http://www.clip.gov.uk/groups/transport/sub_transport.htm.
5
7
Statistical Reliability
7.1 Some larger LAs have run their own household travel surveys in the past, and
others are considering conducting surveys to monitor LTPs. This is not a
requirement for LTPs, because effective household surveys are expensive,
particularly if a travel diary is used. Large samples are needed in order to detect
reliably the changes in travel patterns that the LTP aims to achieve, although
obtaining some indication of travel patterns is not quite as demanding.
7.2 To illustrate, the 1997/99 NTS estimated that 39.4% of trips were made by car
drivers. This was based on a sample of over 21 thousand people, recording a
total of about 350 thousand trips in their travel week. In 1992/94, the estimate
was 36.6%. This change was statistically significant at the 95% level. However,
such a change found in a small scale survey of, say, 1,000 households in a
particular county, would not give a statistically significant change, and such a
survey would then be of limited value in monitoring car travel in the area.
7.3 These issues are complex technically, and are dealt with more fully in Annex 2.
If an LA is considering commissioning a household survey to monitor change,
the consultants should be required to show that the survey design suggested
could actually measure progress towards the required target at an appropriate
level of statistical significance.
8
Where to go for Further Information
8.1 Generally, the detailed guidance on each individual indicator contains details of
where to get further information, and where relevant, contact points. Any general
queries should be addressed to Mike Haslam, TSPT3, DTLR (tel: 020 7944
4746): e- mail [email protected]). If authorities have queries on
sample design then they should in the first instance talk to Mike Haslam, who
will either provide the advice, or put them in touch with a more specific contact.
9
Menu of Recommended Indicators
9.1 Local authorities have been encouraged to set their own objectives and targets,
according to local priorities and circumstances. However, it is important that
these should reflect national priorities, as set out in the DTLR’s Public Service
Agreement targets, and the 10 Year Plan. Therefore authorities will be expected
to report against the core indicators set out in paragraph 2.3.
9.2 During the Autumn seminars, many authorities agreed that it would be useful to
move towards using common methods for monitoring a common set of
indicators. Supported by common methodologies for compiling the data, these
indicators can help build up a consistent and comprehensive picture of progress,
and can facilitate benchmarking.
9.3 We have therefore prepared a menu of recommended performance indicators.
Across the key transport objectives the 'menu' identifies, in addition to the core
indicators described in paragraph 2.3 above, 53 other recommended indicators.
These represent the most frequently used LTP outcome and output performance
indicators. Authorities are not expected to report against all of these indicators,
6
but are advised to use those that are appropriate for their circumstances and
priorities.
9.4 Authorities should use the preparation of their second and subsequent APRs as an
opportunity to review their indicators and targets.
9.5 The recommended indicators are:
Area
Indicator
Road Traffic
Road traffic by type of vehicle and road
Parking provision
Road Maintenance
Number of road improvement schemes
Number and type of highway maintenance schemes
Expenditure on road maintenance
Streetlights not working
Mode of travel
Modal share
Public transport - bus
Satisfaction with bus information
Age of bus fleet
Bus reliability
Bus punctuality
Bus kilometres per year
Bus priority lanes (km)
Urban bus challenge schemes
Rural bus challenge schemes
Assaults on bus staff
Quality partnerships
Buses with CCTV
Public transport - rail
Rail passenger journeys (numbers arriving/departing at stations in
area)
Rail passenger satis faction
Satisfaction with rail information
Accreditations under "secure stations" scheme
7
Travel to work
Mode of travel to work
Employers with effective travel plans
Employees covered by travel plans
Travel to school
Mode of travel to school
Primary and secondary schools with effective travel plans
Primary and secondary schoolchildren covered by travel plans
Safe routes to school
Cycling
People who think it is easy and safe to cycle in their area
Length of cycling network
Safety training
Walking
Number of pedestrian trips
People who think it is easy and safe to walk in their area
Condition of footway
Road safety
Number of pedestrian deaths and serious injuries
Rate of slight injuries
Number of vehicles involved in road accidents (car, HGV/PSV)
Mode of road casualty
Number of Home Zones
Number of 20mph Zones
Light Rail
Accessibility
Light rail route length/number of lines
9
% of all households within 13 minutes walk of an hourly or better bus
service
People finding access to services difficult
Accessibility of transport facilities for older or disabled people.
Percentage of bus fleet fully accessible for wheelchair users
Provision of community transport
Disabled facilities at signalled pedestrian crossings
9
Indicators in this part of the framework will need to be reviewed in the light of the recommendations of the SEU study of
Transport and Social Exclusion
8
Provision of dropped kerbs and tactile paving or facilities for disabled
people
Freight
Rail freight
Environment
Number of days of air pollution
People rating the level of transport-related noise as unacceptable
Extent of quieter road surfaces
9.6 As last year, we are also expecting authorities to report progress towards all of
their other local performance indicators contained in their LTP (that are not
covered by the menu of indicators), regardless of whether they are authoritywide, area-based, or mode-specific.
9
Detailed Guidance on the Core and Recommended Indicators
CORE INDICATORS
Road traffic
Congestion - average time lost per vehicle kilometre
This core indicator is only applicable to 18 large urban areas - these are defined as the
conurbations for which there is a PTA (six authorities) and 12 urban areas with
population greater than 250,000 i.e. Blackpool, Bournemouth, Brighton, Bristol, Hull,
Leicester, Middlesborough, Nottingham, Plymouth, Portsmouth, Southampton and
Stoke.
Baseline data for congestion in 2000 is being collected as part of the national
monitoring system, and this will be published by DTLR in Summer 2002, and thereafter
on a two year cycle. Authorities are therefore not required to collect data independently,
at present.
Although authorities are not required to monitor this indicator, they may choose to do
so. Such authorities may find it useful to read the information about the "Floating Car"
technique used by DTLR for measuring traffic speed, which is described in Annex 3 and
Annex 4. Enquiries about this should be directed to Andrew Ledger
([email protected] ).
Road Maintenance
Road Condition
Currently most Local Authorities provide information to the Department for use in the
National Road Maintenance Condition Survey (NRMCS). Survey data received
includes information on the skidding resistance of road surfaces (SCRIM), expenditure
and lengths of roads treated as part of the NRMCS Carriageway Return as well as
random visual surveys of 100 metre stretches of road as part of the main NRMCS
survey. Over the next two years the main NRMCS survey is changing to a new format,
which will rely on information that Local Authorities are currently asked to provide on
an annual basis as part of the Best Value performance indicators. These are
BV96 - condition of principal roads (% where structural maintenance should be
considered);
BV97a - condition of non-principal classified roads (% where structural
maintenance should be considered);
BV97b - condition of unclassified roads (% where structural maintenance should
be considered).
In addition, from 2002/03 authorities will be asked to provide:
BV186a - the percentage of the principal road network where major structural
treatment is not considered necessary divided by the authority's average
structural expenditure over the past 3 years
BV186b - the percentage of the non-principal road network where major
structural treatment is not considered necessary divided by the authority's
average structural expenditure over the past 3 years
BV187 - Condition of footway (see fuller description under this heading in
walking section)
10
This Best Value information should be used as the basis for indicators monitoring road
condition.
Public transport - bus
Number of bus passenger journeys
It is important to distinguish between bus passenger journeys and bus passenger
kilometres (the latter takes account of the distance travelled by passengers). The DTLR
PSA target is in terms of bus passenger journeys and bus passenger journeys is also a
Best Value Performance Indicator (BVPI102).
The best source of information on bus passenger journeys is the operators themselves.
In the guidance on Best Value Performance Indicators Local Authorities are advised to
contact bus operators to obtain the required information. In order for LAs to have an
input into the development of buses in their area they need to have a good working
relationship with the operators. Part of this relationship should be the provision of
information by the operators. If the data cannot be obtained through a good working
relationship, Clause 143 of the Transport Act 2000 gives LAs the powers to demand this
information.
DTLR collect information from a sample of bus operators but this information cannot
normally be disaggregated to Local Authority level as the sample is not designed to
provide information at this level. In addition there are problems with operator
confidentiality requirements if there is a single dominant operator in an area.
If information cannot be obtained from operators an alternative is to carry out passenger
counts on buses.
Bus passenger satisfaction
Passenger Satisfaction is a Best Value Performance Indicator (BVPI104). Details of the
recommended survey procedure can be found on the DTLR website at http://www.localregions.dtlr.gov.uk/bestvalue/indicators/bvaudit/vol1/35.htm. Authorities will have
supplied data for Best Value for year 2000/01, and the next survey is due in 2003/04.
Since views change relatively little from year to year, it is probably not worth carrying
out surveys annually.
Cycling
Number of cycling trips
This indicator is very difficult to measure on an authority wide basis without the use of
a large scale household survey, which is likely to be prohibitively expensive. It will be
more cost effective to look at cycling to particular destinations such as work, schools
and shopping/leisure centres. This information combined with traffic count information,
which can include bicycles, may indicate changes in the level of cycle use. Simpler
measures such as counts of bicycles parked at cycle racks at key destinations can also
indicate changes in the level of use.
As indicated in the section on Developing a cost-effective Monitoring Strategy it might
be feasible for authorities to combine their resources to pay for a boosted NTS sample
for a larger geographical area which might be large enough to show changes in cycle
use across this wider area. However, because cycling is generally a minor mode the
sample size needed to obtain reliable estimates can be quite large. Nationally, only 2%
of journeys are made by bicycle; 7.5% of men and 3% of women used a bicycle during
11
the NTS survey week. DTLR can advise on the appropriate sampling sizes which are
need to obtain reliable results (see section on Statistical Reliability). However, it is
likely that the sample size needed to obtain reliable results would be prohibitively large.
If an authority is running a household survey without a travel diary it would be possible
to include a question on cycling e.g. Have you made a journey by bicycle in the last
week (a) to work (b) for leisure or social purposes (these are the most common
purposes) or (c) any other purpose. But, unless the response is obtained from at least
2,000 households, the numbers replying positively are likely to be too small to give any
reliable indication - in particular any difference measured in subsequent surveys is
likely not to be statistically significant.
Guidance on monitoring cycling at the local level is given in Traffic Advisory Leaflet
1/99 - Monitoring Local Cycle Use - (April 1999) which is available on the DTLR
website (www.local-transport.dtlr.gov.uk). This leaflet contains information about using
existing data, collecting new information, contact details for technical enquiries and
references to other material on the subject.
A wide range of Traffic Advisory Leaflets on cycling provides advice on cycle audit
and review, cycle lanes, toucan crossings, advanced stop lines and cycle parking.
Road safety
Number of deaths and serious injuries (all ages)
Number of children killed and seriously injured
Road casualty numbers are available from the police or within your own local authority.
To calculate accident rates the relevant denominator (vehicle-kilometres) can be
obtained from DTLR traffic census division. Estimates at local authority level are in the
process of being produced. Advice on the use of accident data can be obtained from the
road accident statistics branch in DTLR ([email protected] ). Telephone
contact: 020 7944 3078.
Light rail
Light rail passenger journeys
This core indicator is only relevant for authorities in which light rail operates.
Information on the number of light rail passenger journeys can be obtained from the
appropriate operator (or their Annual Report).
Accessibility
% of rural households within 13 minutes walk of an hourly or better bus service
Nationally, this information is based on information collected in the National Travel
Survey, which asks the respondent "How long would it take ME (i.e. the interviewer) to
walk from here to the NEAREST bus stop (or place where I could get on a bus?" and
"How often would I be able to get a bus from that stop during the day?". This
information is combined to produce the indicator. The information in the NTS is
collected in time bands - 0 - 7 minutes, 7 to 13 minutes (to allow for the fact that many
people will say "about 5 minutes" or "about 10 minutes"). A rural household is defined
12
as one in a settlement of less than 3,000 population (using Census of Population data).
Locally, this information could be collected by adding the above questions to an
existing household survey such as those being carried out for Best Value (if the sample
size and response rate are large enough), or by using GIS techniques to map populations
adjacent to bus stops with an hourly or better bus service.
13
OTHER RECOMMENDED INDICATORS
Road Traffic
Road traffic by type of vehicle and road
Care should be taken in distinguishing between indicators of vehicle kilometres, which
ignore vehicle occupancy, and those of passenger kilometres which reflect vehicle
occupancy.
Data on traffic volumes on major roads (i.e. principal and trunk) are available at local
authority level from the Traffic Statistics branch of the DTLR. Separate information is
available for built- up and non built- up areas. (Motorway traffic would normally be
excluded as this carries mostly national not local traffic).
Traffic volume is calculated as traffic flow multiplied by road length and expressed in
terms of vehicle kilometres or vehicle miles. For major roads it can be provided by two
broad groups of vehicle:
•
cars
•
other motor vehicles
Minor roads account for 86 per cent of the road length in England and have very
variable traffic flows. Accurate estimates of minor road traffic by lo cal authority cannot
be readily produced. DTLR are producing some indicative estimates, based on regional
traffic estimates broken down to local authority level; results should be available
shortly. Traffic data for minor roads will be available only for all motor vehicles.
National data are published in quarterly bulletins and annual reports available from
DTLR Traffic Statistics branch (TSR 2 Division, Zone 2/16, Great Minster House, 76
Marsham Street, London SW1P 4DR, Tel. 020 7944 3095, E-mail
[email protected]). The latest quarterly bulletins are also available on the
web site under www.transtat.dtlr.gov.uk.
Detailed information on individual roads may also be available but there is normally a
charge for supplying this.
Local authorities will already be monitoring traffic flows for the requirements of the
Road Traffic Reduction Act. A number of authorities carry out their own traffic counts,
mostly using simple automatic, volumetric counters. These can be useful for carrying
out special surveys. For example they can be used for cordon surveys of urban areas, or
where before and after surveys are needed to assess the impact of specific local
measures being undertaken. General guidance on Monitoring Local Traffic Levels is
available
on
the
CLIP
web
site
(http://www.clip.gov.uk/groups/transport/sub_transport.htm).
It may be most appropriate to use this information, which is clearly related to specific
local traffic management objectives, to produce locally relevant indicators.
Parking provision
This indicator should be specified in terms of the number of spaces available in the
following categories: off street (LA - paid), off street (private - paid), off street (free),
on street (paid), on street (free). This information may already be available from local
authority records, or from an inventory of available parking spaces.
14
Road Maintenance
Number of road improvement schemes
This information will be available from authority records.
Number and type of highway maintenance schemes
This information will be available from authority records.
Expenditure on road maintenance
This information will be available from authority records.
Streetlights not working
This indicator "% of street lights not working as planned" is a Best Value indicator
(BVPI98).
Mode of travel
Modal share
Many authorities have objectives and indicators referring to achieving a shift in modal
share. However, this is very difficult and expensive to monitor directly, if expressed as
the share of overall passenger journeys or passenger km by different modes.
Indeed, although achieving a shift in modes used is an ultimate objective of most LTPs,
it is not possible for authorities to influence it directly. Instead, they will be seeking to
influence how people get to particular destinations, or how easy it is to use public
transport, and to manage traffic flows. For most authorities, it will be much more costeffective to monitor these components of their plan directly, than to seek to monitor
overall mode share (see also section on Developing a cost-effective monitoring
strategy).
The only direct way of measuring overall mode share is through a household diary type
survey, like the National Travel Survey, which requires individuals to record each trip
made over a period of days (the NTS uses a 7-day diary, but 2 or 3 day diaries would
not be much cheaper to administer). This covers all modes, including walking, cycling,
bus, rail and car trips, but most authorities would find it prohibitively expensive to
mount such a survey. The minimum number of participating households we would
recommend is 500, but even then the coverage of minority modes like cycling is too
small to be reliable. The Department may be able to offer some authorities the
opportunity to pay for a boost to the NTS sample in their area (see "Boosts to NTS" at
http://www.clip.gov.uk/groups/transport/sub_transport.htm).
An indication of mode share can, however, be derived more indirectly through a number
of alternative methods.
Journeys to work (19% / 30%), for shopping and personal business (31% / 20%), for
leisure (6% / 6%), to get to school (11% / 4%) account for the majority of travel (figures
in brackets are the percentage of trips / percentage of miles from the NTS, nationally).
Guidance is given elsewhere on how authorities might monitor these destinations.
15
Information on bus patronage, and vehicle flows will also help to inform a more general
picture of modal share.
General guidance on monitoring personal travel for Local Transport Plans is available
on the CLIP website at www.clip.gov.uk/groups/transport/sub_transport.htm.
Public transport - bus
Satisfaction with bus information
Satisfaction with Public Transport Information is a Best Value Performance Indicator
(BVPI104). Details of the recommended survey procedure can be found on the DTLR
website at www.local-regions.dtlr.gov.uk/bestvalue/indicators/bvaudit/vol1/35.htm.
Age of bus fleet
Age of the bus fleet reflects a national target, which is to reduce the average age of the
fleet to eight years. Passengers are likely to be more attracted to using buses if they are
modern, comfortable and reliable. Information on the age of the local bus fleet can be
obtained from the local bus operators. See the section on bus passenger journeys for
further information on how this might be obtained.
Bus reliability
This indicator is the percentage of scheduled mileage lost because of factors within the
operators' control. These factors include: staffing problems (including strike action),
mechanical problems, vandalism, assaults, and predictable peak time traffic congestion.
There is a national target of losing no more than 0.5% of scheduled mileage. This
information can be obtained from the local bus operators. See the section on bus
passenger journeys for further information on how this might be obtained.
Bus punctuality
Traffic Commissioners have defined new standards that 95% of buses should arrive in a
window of time between one minute early and five minutes late. This information may
be available from the local bus operators. See the section on bus passenger journeys for
further information on how this might be obtained. Alternatively a sample of routes can
be monitored against the published timetable. However, this can be very resource
intensive activity. The local Traffic Commissioner may have information available in
this area, but this may not be comprehensive since the Traffic Commissioners will only
monitor punctuality following a complaint.
Bus kilometres per year
Information on both scheduled service kilometres and kilometres actually run (this is
linked to the bus reliability indicator above) should both be available from the local bus
operators. See the section on bus passenger journeys for further information on how this
might be obtained.
Bus priority lanes (km)
This information will be available from local authority records and is supplied on the
LTOP-F4 form.
16
Urban bus challenge schemes
This indicator is the number of urban bus challenge schemes which have been
implemented. This information will be available from local authority records.
Rural bus challenge schemes
This indicator is the number of rural bus challenge schemes which have been
implemented. This information will be available from local authority records.
Assaults on bus staff
This indicator is the number of staff assaulted during the course of a year. This
information can be obtained from the local bus operators. See the section on bus
passenger journeys for further information on how this might be obtained. National
information on this topic is published in the Bulletin of Public Transport Statistics
which is available from Paul O'Hara (paul.o'[email protected]), or on the DTLR
web-site (http://www.transtat.dtlr.gov.uk/index.htm#topics).
Quality partnerships
This indicator is the number of such partnerships which the authority has with local
operators. This information will be available from local authority records.
Buses with CCTV
This information can be obtained from the local bus operators. See the section on bus
passenger journeys for further information on how this might be obtained.
Public transport - rail
Rail passenger journeys (numbers arriving/departing at stations in area)
Rail passenger kilometres is a National PSA, but is not applicable at local authority
level. However, authorities with targets to encourage more rail use might wish to
monitor numbers of rail passenger journeys from stations in their area. This information
is available from the local train operating companies. If authorities experience
difficulties obtaining the required information the Strategic Rail Authority
(www.sra.gov.uk) may be able to help. Alternatively counts of passengers entering
and/or leaving stations could be carried out by local authorities. Advice on an
appropriate sampling scheme for this can be obtained from DTLR.
Rail passenger satisfaction
Household surveys will not pick up sufficient numbers of people who travel by rail, so
Passenger Satisfaction can only be collected via a survey of rail passengers. This can be
done by surveying passengers as they enter or leave the station. The questions used in
the Best Value survey for bus passenger satisfaction could be adapted for such a survey.
Satisfaction with rail information
Satisfaction with rail information can be collected (for rail users) by surveying
passengers as they enter or leave the station.
Accreditations under "secure stations" scheme
This information will be available from the local train operating companies.
17
Travel to work
Mode of travel to work
Travel to work accounts for about 19% of all journeys and about 30% of mileage, so it
is highly significant. Nevertheless, authorities are finding it hard to monitor directly,
since destinations are so diverse.
Large employers, including the authority itself, are being encouraged to develop travel
plans. Each travel plan should include a survey of how their employees and visitors
travel to the site before the plan is introduced, and on a regular basis afterwards to
monitor changes. This also engages large local businesses in sustainable development
issues. As a minimum for this indicator, surveys will need to identify staffs’ current
main mode of travel to and from work, and how far they travel to work. However, to
encourage a switch from car to more environmentally- friendly modes, it is also useful to
know whether they may be willing to use another mode, and which measures would be
most likely to encourage them to do so. Sample survey forms and advice on carrying out
a survey are given in chapter 3 of ‘A travel plan resource pack for employers’ available
on DTLR's website at www.local-transport.dtlr.gov.uk/travelplans/index.htm, or free
from the government's Energy and Environment Helpline on Freephone 0800 585794.
It is not possible to infer anything about the total employee population from surveys of a
few large employers. Nevertheless, this may be a useful indicator if it covers a
significant proportion of the workforce. Changes over time will only be valid if the same
employers/locations are included in the two years.
A more comprehensive picture of travel to work may be obtained from a household
survey. It is not recommended that a specific survey should be carried out for this
purpose alone, but, questions could be added to an existing local household survey, such
as those being conducted for Best Value. Guidance on the reliability of estimates
obtained from such a survey is given in the Annex on Statistical Reliability and on the
CLIP website: www.clip.gov.uk/groups/transport/sub_transport.htm.
The following format of possible questions is based on the National Travel Survey. The
information might be asked of a selected person in the household, or about all adults in
the household:
18
Question 1: How do you usually travel to work (i.e. the means of
travel you use for the main part of your journey, by distance)?
(or possibly, How did you travel to work today?, which can cause less
confusion if people travel differently on different days)
Tick one box only for the longest part, by distance, of your usual
journey to work.
Work mainly at or from home
Underground, metro, light rail, tram
Train
Bus, minibus or coach
Motor cycle, scooter or moped
Driving a car or van
(can be split between driving alone or with passengers)
Passenger in a car or van
Bicycle
On foot
Other
If an authority is especially interested in cycling: since a bicycle is
often used as only one stage of a longer journey (e.g. to the station
prior to catching a train), this could be supplemented by a question
such as "Do you use a bicycle for any part of your journey to work?".
Similarly, a question could be asked about walking stages.
Question 2: What is the distance in miles between your home and your
usual place of your work?
0 – work is at home
No usual place of work
Less than 1 mile
1 to less than 2 miles
2 to less than 5 miles
5 to less than 10 miles
10 to less than 25 miles
Over 25 miles
Organisations developing work travel plans are encouraged to monitor their impact on a
regular basis – probably annually. It is unlikely that a household survey would be worth
repeating more frequently than every 2 to 3 years.
Employers with effective travel plans
This indicator is only meaningful if it refers to the number of employers who have a
travel plan in place and have carried out a travel survey.
Employees covered by travel plans
This is the number of employees covered by the effective travel plans referred to above.
It is probably best expressed as a percentage of the total number of employees in the
area.
19
Travel to school
Mode of travel to school
Local authorities are being encouraged to implement School Travel Strategies and
Plans. All School Travel Plans should involve schools carrying out surveys of their
students to find out how pupils travel before the plan is introduced, and to monitor
progress towards modal shift targets. This engages pupils, teachers and parents with
sustainable development issues – a key part of the School Travel Plan process.
As a minimum for this indicator, surveys will need to identify children's main mode of
travel to and from school. Evidence from the National Travel Survey suggests that
there is a different modal split for the return journey (children dropped by parents on
their way to work by car may go home by a different mode e.g. walk or bus). However,
to encourage a switch from travel to and from school by car to more environmentallyfriendly modes, it is also useful to know how far they travel to school, whether they (or
their parents) may be willing to use another mode, and which measures would be most
likely to encourage them to do so.
Sample survey forms and advice on carrying out a survey are given in DTLR's 'School
Travel
Resource
Pack'
available
at
www.localtransport.dtlr.gov.uk/schooltravel/index.htm or free from DTLR free publications, Tel.
0870 1226 236. It includes a simple tutor- led form which gives a quick head-count of
numbers of children in the class using each mode of travel, and a more detailed form for
use by individual pupils, covering attitudes to different modes and other issues.
Once authorities have results from surveys in schools in their area, they may wish to
infer an overall proportion by aggregating the results together. Careful thought needs to
be given to grossing. Patterns of travel will depend on the location of the school. There
are also differences between modes used by primary and secondary school children. It is
also likely that there will be differences between local authority schools and private
schools - the latter are likely to have larger catchment areas (this may also apply to
denominational schools). Schools with travel plans are likely to have different patterns
from those without. So, in attempting to estimate changes from one year to another, it is
necessary to stratify school results by at least: primary/secondary, LEA/private,
with/without travel plans (2 x 2 x 2 = 8 strata). Changes can then be estimated within
each stratum, and an overall estimate for all children can be derived by weighting
together results from each stratum, according to the total number of pupils in the
stratum. However, care still needs to be taken if, within a stratum, different schools are
included from one year to the next, since the inclusion of one new school may distort
results significantly. Some authorities are using a panel of schools approach i.e. in order
to estimate the overall trend between year 1 and year 2, they only include results from
the same schools in both years.
Advice on sampling and grossing can be obtained from Mike Haslam at DTLR
([email protected]).
Questions on travel to school may be added to an existing local household survey, such
as those being conducted for Best Value. Guidance on the reliability of estimates
obtained from such a survey is given in the Annex on Statistical Reliability and on the
CLIP website: www.clip.gov.uk/groups/transport/sub_transport.htm.
20
The following format is consistent with sample survey forms for schools. The questions
gather data on the mode of transport used for the journey to and from school. Later
questions can ask about the distance travelled. This means that it is possible to assess
how far pupils are travelling according to their mode of transport. For example it may
be calculated that walkers travel an average of 1 mile, car users travel an average of 2.5
miles and so on. The questions might be asked about a selected child in the household,
or about each child in the household.
Question 1: How does the child usually get to school?
(Tick one box only for the longest part, by distance, of the
usual journey to school).
Walk
Cycle
School Bus
Other Bus
Train
Car
Other
A similar question can be asked for the journey home from school - this may be
important in that evidence from the National Travel Survey suggests that there is a
different modal split for the return journey (children dropped by parents on their way to
work by car may go home by a different mode e.g. walk or bus).
Schools developing school travel plans are being encouraged to monitor their impact on
a regular basis - at least annually. It is unlikely that a household survey would be worth
repeating more frequently than every 2 to 3 years.
There may be seasonal travel patterns e.g. differences between Autumn/Winter and
Spring/Summer, so surveys should be repeated at the same time of the year to ensure
comparability of the results (Spring or Autumn are the suggested times).
Primary and secondary schools with effective travel plans
The numbers of primary and secondary schools (recorded separately) with travel plans
in place and which have carried out a trave l survey.
Primary and secondary schoolchildren covered by travel plans
The numbers of children in primary and secondary schools with effective travel plans
referred to above. This is probably best expressed as a percentage of the school
populations in the two sectors. See the section on mode of travel to school above.
Safe routes to school
The numbers of primary and secondary schools covered by safe routes to school, which
have been implemented by the authority.
Cycling
People who think it is easy and safe to cycle in their area
This information can be collected via an existing household survey such as those being
carried out for Best Value. The question used in the British Crime Survey about the
safety of walking (see section on walking safety) could be adapted for this purpose. If
21
the information is collected in this way it would be useful to stratify the sample
according to frequency of cycle use and cycle ownership. Information could also be
collected by interviewing cyclists at key destinations. This latter approach will not of
course capture information from those who do not cycle because they think that it is too
dangerous.
Length of cycling network
This information will be available from authority records and is reported on the LTP-F4
form.
Safety training
The road safety department in an authority will be able to provide information on the
amount and type of training which is being carried out or planned the indicator could be
the number of people who have passed a proficiency test and/or the number who have
attended training courses.
Walking
Number of pedestrian trips
This indicator is very difficult to measure on an authority wide basis without the use of
a large scale household survey, which is likely to be prohibitively expensive. It will be
more cost effective to look at walking to particular destinations such as work, schools
and shopping/leisure centres. This information combined with pedestrian counts at key
access points would provide a good indication of changes in the level of walking.
Walking is a very common activity, especially as part of a longer journey by public
transport, or after parking a car. It is therefore important to measure individual stages,
not just overall journeys. For instance, travel to work or school may involve a walking
stage at both ends of a longer public transport stage. If an authority is interested in
walking as part of longer journeys then the questions on journey to work and school
could be modified to ask those who travel by public transport whether they walked for
any part of their journey (say for more than 10 minutes).
Guidance on monitoring walking at the local level is given in Traffic Advisory Leaflet
6/00 - Monitoring Walking - (June 2000) which is available on the DTLR website
(www.local-transportdtlr.gov.uk). This leaflet contains information about using existing
data, collecting new information, contact details for technical enquiries and references
to other material on the subject.
People who think it is easy and safe to walk in their area
This information can be collected via an existing household survey such as those being
carried out for Best Value or by interviewing pedestrians at key destinations. This latter
approach will not of course capture information from those who do not walk because
they think that it is too dangerous. The British Crime Survey
(http://www.homeoffice.gov.uk/rds/bcs1.html) contains the following general question
about walking alone after dark:
How safe do you feel walking alone in this area after dark? Would you say you
feel...READ OUT
NOTE: IF RESPONDENT NEVER GOES OUT ALONE AT NIGHT, PROBE
How safe WOULD you feel?
22
1.
2.
3.
4.
Very safe
Fairly safe
A bit unsafe
or very unsafe?
Condition of footway
This indicator is the Best Value indicator BV187. The indicator will be based on the
collection and analysis of Detailed Visual Inspection (DVI) measurements, using the
national Rules and Parameters for UKPMS, to provide the percentage length of the
footway network with a Footway Condition Index greater than a defined threshold value
for deficiency. These rules cover different footway types and the defects associated with
the type of footway (e.g. bituminous, flags) on different footway categories
(hierarchies).
The indicator measures the percentage length of the footway network with a Footway
Condition Index greater than a threshold value indicating treatment need, based on
Detailed Visual Inspection (DVI) surveys of the whole network on a cycle of 15% per
year, covering the entire footway network within seven years. For the calculation of the
Indicator value, the results from the latest survey of 15 % of the network should be
used.
The indicator is calculated separately for:Part (a) Categories 1, 1a and 2 footways Part
(b) Categories 3 and 4 footways Where the footway categories are as defined in the
Local Authority Code of Practice for Maintenance management (2001).
Threshold values are applied using the Variable Length Merge method set out within
UKPMS through the approved set of Rules and Parameters and may be different for Part
(a) and Part (b). This may also reflect the variety of characteristics across the national
footway network and provide a basis to assist in more detailed benchmarking.
The total length of footway in each category is required for the calculation of this
indicator.
Road safety
Number of pedestrian deaths and serious injuries
Rate of slight injuries
Number of vehicles involved in road accidents (car, HGV/PSV)
Mode of road casualty
Road casualty numbers are available from the police or within your own local authority.
To calculate accident rates the relevant denominator (vehicle-kilometres) can be
obtained from DTLR traffic census division. Estimates at local authority level are in the
process of being produced. Advice on the use of accident data can be obtained from the
road accident statistics branch in DTLR ([email protected] ). Telephone
contact: 020 7944 3078.
23
Number of Home Zones
Number of 20mph Zones
These zones will have been designated by the authority and so the information should
be readily available. It is also reported on the LTP-F4 form.
Light Rail
Light rail route length/number of lines
This information will be available from the light rail operator.
Accessibility 10
% of all households within 13 minutes walk of an hourly or better bus service
Nationally, this information is based on information collected in the National Travel
Survey, which asks the respondent "How long would it take ME (i.e. the interviewer) to
walk from here to the NEAREST bus stop (or place where I could get on a bus?" and
"How often would I be able to get a bus from that stop during the day? ". This
information is combined to produce the indicator. The information in the NTS is
collected in time bands - 0 - 7 minutes, 7 to 13 minutes (to allow for the fact that many
people will say "about 5 minutes" or "about 10 minutes"). Locally, this information
could be collected by adding the above questions to an existing household survey such
as those being carried out for Best Value (if the sample size and response rate are large
enough), or by using GIS techniques to map populations adjacent to bus stops with an
hourly or better bus service.
People finding access to services difficult
This indicator is one of the national Sustainable Development Indicators (see Quality of
Life
Counts
http://www.sustainabledevelopment.gov.uk/sustainable/quality99/index.htm). This indicator is the proportion
of people who find access to various services such as public transport, health care
education etc. difficult. The information can only be collected through a household
survey, and there may be problems with sample sizes because the groups of people
having difficulties may be quite small (see section on statistical reliability). In any
survey asking about this topic it is important to establish whether people have a car
which they can use. The national indicator in "Quality of Life Counts" used information
from
the
Survey
of
English
Housing.
(http://www.housing.dtlr.gov.uk/research/seh/index.htm). The questions in this area
which could be used were:
From here (the respondent's home), how easy is it for you to get to the following
using your usual form of transport?
a) a corner shop
b) a medium to large supermarket
10
Indicators in this part of the framework will need to be reviewed in the light of the recommendations of the SEU study of
Transport and Social Exclusion
24
c) a post office
d) a doctor
e) a local hospital
In each case the respondents were asked to answer "Very Easy", Fairly Easy", Fairly
Difficult" or "Very Difficult".
Accessibility of transport facilities for older or disabled people.
The local public transport operators will be able to provide information on transport
facilities which are provided either on vehicle/trains or at bus stops/garages or stations.
Percentage of bus fleet fully accessible for wheelchair users
This is the proportion of the bus fleet to which there is access for wheelchair users either by means of a ramp or directly onto a "kneeling" bus. This information will be
available from the local bus operators. See the section on bus passenger journeys for
further information on how this might be obtained.
Provision of community transport
This indicator is the number of people using community transport services provided by
the authority or voluntary bodies. This information will be available within the authority
or from the voluntary bodies providing the services.
Disabled facilities at signalled pedestrian crossings
This indicator is the proportion of signalled pedestrian crossings which have disabled
facilities. This information should be available within the authority.
Provision of dropped kerbs and tactile paving or facilities for disabled people
This indicator is the number of such facilities which exist. This information should be
available within the authority.
Freight
Rail freight
This indicator is the amount of freight carried by rail. This will be available from the
local rail operators. From 2003 a proposed new EU Rail Statistics Regulation will
require member states to produce rail statistics (freight and passengers) by region.
Authorities may be able to make use of this data for monitoring purposes.
Environment
Number of days of air pollution
This is a local indicator of sustainable development. The indicator is the average
number of days per site when air pollution is moderate or higher for NO2 , SO2 , O3 , CO
or PM10 . Data for this indicator are available from AEA NETSEN
(www.aeat.co.uk/netcen/airqual/ ), or the local environmental health department. To
calculate an average figure across monitoring sites it is recommended that data from at
least four sites should be used. If this is not feasible then individual sites could be
reported separately. It is advisable to collect and present urban and rural sites separately,
as in most areas a limited range of pollutants is measured at rural sites.
25
People rating the level of transport-related noise as unacceptable
This indicator can be produced from the results of a household survey such as those
being carried out for Best Value. A question which has been used in the ONS Omnibus
Survey is:
Thinking about your local area, please tell me how you would rate:
•
The level of noise from traffic
(very good, fairly good, neither, fairly poor, very poor, don't know)
Extent of quieter road surfaces
This indicator is the proportion of the authority's roads in the area which have been
resurfaced with material to produce less traffic noise - the information will be available
from the road maintenance department in the authority.
26
Annex 1 - National Sources of information
1. The National Travel Survey (NTS) is a household survey of personal travel, which
collects data from a seven day diary of all travel, and background information on
individuals and vehicles. It is designed to be representative for Great Britain as a
whole - with, up to 2001, an achieved sample of about 10 thousand households over
any three year period. The most recently available dataset is for 1998/2000. Full
survey
details
are
available
in
annual
Technical
Reports
(http://www.transtat.dtlr.gov.uk/personal/index.htm). From 2002 the sample size has
been tripled so that more detailed annual data can be made available.
2. The survey is also designed to be representative at Government Office Region level.
In addition, the survey is designed to be representative of varying sizes of urban and
rural settlements (based on population densities from the 1991 Census), and also
representative of areas with varying levels of car ownership (also using 1991 Census
data).
3. However, the NTS (even with the increase in sample size) is not designed to be
representative at county or Unitary Authority (UA) level, and sample sizes are too
small to give useable information at this level.
4. The NTS can be used to give a general indication of travel in a local area by
considering travel patterns in the region, taking into account how urban the area is,
and also its level of car ownership.
5. Overall, over 60% of trips are made by car. Not surprisingly, this proportion is
strongly related to levels of car ownership. In general low levels of car use are
associated with higher levels of bus use, although rail plays an important part in
London. Bicycles are only used for 2% of trips nationally, but more in flat areas
particularly in eastern England.
6. In addition to details of travel by different modes, the NTS includes details of the
purpose of travel, and so can be used to look specifically at travel to work, to school,
to the shops, for leisure purposes and so on. It is also possible to look at trips by
mode and purpose, although the usual problems of small samples can restrict the
analysis possible. Further details are available in NTS factsheets and the annual
NTS bulletin. These are available free from DTLR, or on the transport statistics
website - see references above.
7. Two other national data sets provide information on usual mode of travel to work.
Data from the 1991 Census are available for small areas, both on a residential and
workplace basis. Most local authorities have access to these figures, although these
are becoming dated. Similar data will be available from the 2001 Census early in
2003.
8. A similar question is also asked each year on the Labour Force Survey (LFS), which
has a large sample size (60 thousand households), so annual regional data are
available. Annual figures are published by region in Tables 1.7 and 1.8 of
‘Transport Statistics Great Britain’ (TSGB). And in Table 1.9 in Regional Transport
Statistics (RTS). To give some idea of change since 1991, the Census recorded 65%
of people who usually travelled to work by car. The 1999 LFS recorded 70%.
9. The Integrated Transport Economics and Appraisal Division (ITEA) of DTLR has
commissioned some software known as the ‘Census Matrix Toolkit’, which adjusts
the Census data (using NTS data) to make it more closely comparable to data
27
usually used for transport modelling, estimating actual rather than usual travel to
work. The Toolkit then uses annual Labour Force Survey data to estimate changes
in travel to work since 1991. Data are available for UAs and counties (contact
[email protected] for further information).
10. Data on car ownership are also available from the Census for small areas. As car
ownership data are available from other large Government surveys, DTLR
aggregate raw data to obtain annual figures by region, which are also published in
TSGB (Table 3.14). Car ownership figures from the NTS are also published in RTS
(Table 1.7).
11. ITEA maintain the National Trip End Model, of car ownership and car traffic in
local areas (both estimates and projections) and software (TEMPRO) to access these
figures. The model is currently being developed to become multi- modal.
28
Annex 2 - Statistical reliability
1. In the example in paragraph 7.2 the proportion of trips by car had apparently
increased between the two time periods quoted. How sure could we be from these
statistics? By chance, we might have been unlucky with our samples, and chosen
too few car drivers in 1992/94 and too many in 1997/99. According to statistical
theory, we can be ‘95% confident’ that the 1992/94 proportion was actually between
36.0% and 37.2%, and that the 1997/99 was between 38.7% and 40.1% 11 . In simple
terms, since these ranges do not overlap, we can say that there has been a
‘statistically significant’ change in car use at the 95% level12 over this period.
2. The simple rule is that the width of the confidence interval is inversely proportional
to the square root of the sample size, so doubling the sample size reduces the
interval by a factor of 0.7 (1 divided by Ö2).
3. Table 1 shows some confidence intervals for different sample sizes. Suppose an
authority wanted to estimate what proportion of households owned a bicycle, and
wanted to see if this proportion changed over time. In year 1, using a simple
random sample of 1,000 households, this figure was estimated to be 40%. Table 1
shows that this estimate was within the 95% confidence interval of 37% to 43%. In
year 2, a similar survey reported an increase to 45%, with a range of 42% to 48%
(Table 1). In simple terms, since the year 1 and year 2 intervals overlap, the rise
from 40% to 45% was not ‘statistically significant’. However, if this same change
had been estimated using a sample of 2,000, the change would have been
statistically significant, as the confidence intervals are narrower with the larger
sample.
11
Many other samples could have been chosen, all of which would have given different estimates. It is possible to calculate that
95% of these estimates would have been within the limits shown, provide that the sample was random. The range is known as a
‘95% confidence interval’. The calculations are straightforward for a simple random survey, but much more difficult for a survey
with a complex design like the NTS.
12
The 95% level is most commonly used in testing ‘statistical significance’. A 90% level of significance is sometimes appropriate
when a less rigorous test is required, or a 99% level of significance may be used when particular rigour is needed, for example in
drug trials.
29
Table 1: Examples of 95% confidence intervals obtained from different household sample sizes 1
Sample size
Sample size
Sample size
Proportion
measured2
5%
10%
15%
20%
25%
30%
35%
40%
45%
50%
55%
60%
65%
70%
75%
80%
85%
90%
95%
3.6%
8.1%
12.8%
17.5%
22.3%
27.2%
32.0%
37.0%
41.9%
46.9%
51.9%
57.0%
62.0%
67.2%
72.3%
77.5%
82.8%
88.1%
93.6%
1,000
to
to
to
to
to
to
to
to
to
to
to
to
to
to
to
to
to
to
to
6.4%
11.9%
17.2%
22.5%
27.7%
32.8%
38.0%
43.0%
48.1%
53.1%
58.1%
63.0%
68.0%
72.8%
77.7%
82.5%
87.2%
91.9%
96.4%
4.0%
8.7%
13.4%
18.2%
23.1%
28.0%
32.9%
37.9%
42.8%
47.8%
52.8%
57.9%
62.9%
68.0%
73.1%
78.2%
83.4%
88.7%
94.0%
2,000
to
to
to
to
to
to
to
to
to
to
to
to
to
to
to
to
to
to
to
6.0%
11.3%
16.6%
21.8%
26.9%
32.0%
37.1%
42.1%
47.2%
52.2%
57.2%
62.1%
67.1%
72.0%
76.9%
81.8%
86.6%
91.3%
96.0%
4.3%
9.1%
13.9%
18.8%
23.7%
28.6%
33.5%
38.5%
43.5%
48.5%
53.5%
58.5%
63.5%
68.6%
73.7%
78.8%
83.9%
89.1%
94.3%
4,000
to
to
to
to
to
to
to
to
to
to
to
to
to
to
to
to
to
to
to
5.7%
10.9%
16.1%
21.2%
26.3%
31.4%
36.5%
41.5%
46.5%
51.5%
56.5%
61.5%
66.5%
71.4%
76.3%
81.2%
86.1%
90.9%
95.7%
1
Assuming local authority population over 16,000, and simple random sampling
2
Household variable, such as proportion of households with no car
4. The population of the area does not affect these intervals, (above a lower limit of
about 16 thousand), so the same absolute sample sizes are needed whatever the total
authority size, which makes surveys comparatively more expensive in smaller areas.
5. The example given in paragraph 7.2 is applicable where a sample is a simple
random sample, where all households in an area are equally likely to be chosen. In
practice, such a survey design is not usually practical when an interviewer is used,
as households may be widely scattered, considerably increasing interviewers’
travelling time and the costs of the survey.
6. In order to reduce interviewers’ travelling costs, a ‘clustered’ design is usually
chosen, starting by picking a number of small areas, and then choosing a fixed
number of addresses at random within each area. For the NTS, these areas are
postcode sectors, and the addresses are chosen from the Postcode Address File
(PAF) for small users. Census enumeration districts (EDs) might also be used, but
Electoral Rolls are less suitable, as these are more likely to be out of date, and are
more likely to introduce bias. It is usually then advisable to ‘stratify’ the sample, to
ensure that the areas chosen are characteristic of the area as a whole. An appropriate
‘stratifier’ for a travel sur vey (used for the NTS) would be the proportion of
household without a car, available from the 1991 Census for small areas.
7. Measuring change in, say, the proportion of trips made by bicycle adds another layer
of complication. Even if the households themselves form a simple random sample,
the trips made by individuals within them will be clustered. People repeat the same
trips many times (particularly to work or school), and members of a household
travel together (for example to the shops, or for leisure).
8. All these deviations from the simple random survey tend to widen the confidence
intervals illustrated in Table 1. The combined effect is known as the ‘design effect’.
30
Estimates can be made of this effect, and a few examples taken from the 1997 NTS
Technical Report13 are shown in Table 2 below.
Table 2 Examples of design factor effects
Proportion estimated
(NTS 1995/97)
Sample
size
Estimate
(%)
Households without a
car
9,688
30.6
Adult driving licence
holder
17,754
68.5
67.8
375,623
38.3
38.1
Journey main mode
car driver
13
Confidence
interval for
simple random
sample
(%)
29.7
31.5
Design
factor
Actual
confidence
interval
(%)
1.16
29.5
31.7
69.2
1.38
67.6
69.4
38.5
4.26
37.6
39.0
NTS Technical reports are available on the DTLR transport statistics website at http://www.transtat.dtlr.gov.uk/personal/index.htm
31
Annex 3
Measurement of Congestion
Background
1.
The 10 Year Plan published in July 2000 announced a commitment in the form
of a Public Service Agreement (PSA) on the part of the Government to "reduce road
congestion on the inter-urban network and in large urban areas in England below
current levels by 2010 by promoting integrated transport solutions and investing in
public transport and the road network" (for details of the plan, see
http://www.DTLR.gov.uk/trans2010/plan/index.htm). Congestion is to be monitored by
DTLR in terms of average time lost per vehicle compared to speeds that could be
achievable in the absence of congestion.
2.
Inevitably the plan has lead to many different work programmes and this
includes a requirement to monitor levels of congestion such that the PSA target can be
assessed and progress towards it can be followed. The work programme builds largely
upon existing surveys although additional data collection has had to be planned and
some amendments made to the surveys. The work is being guided by two groups whose
remit includes monitoring for the PSA target. The first of these groups is the Congestion
Benchmarks Working Group, formed from the Department, Highways Agency,
Government Office Regions and Local Authority representatives. The work of this
group is in turn guided by a high level departmental Steering Group.
Plans for overall congestion monitoring
Existing speed surveys
3.
These have been carried out in London for a number of years and, more recently,
on the trunk roads network and in other large urban areas. The technique is relatively
simple; a survey car is driven along a predefined route in such a way that it maintains an
average speed. The main way of doing this is to ensure that as far as safely possible, the
number of vehic les overtaken by the survey car is equal to the number of vehicles
overtaking it. The survey cars are fitted with equipment that collect data on distance
travelled every 2 seconds and consequently huge amounts of detailed data are
generated. The surveys are designed to capture typical average speeds, and
consequently have not previously surveyed at weekends, night-time, during school
holiday periods or during the Monday morning or Friday evening peaks. Further details
of the 'floating car' method are given in Annex 4.
Alternative data sources
4.
Although floating car surveys generate considerable amounts of data and
provide reliable results at an aggregate level, the results they give are constrained by the
nature of a sample survey. Results cannot be reliably provided at detailed geographical
areas and surveys take time to prepare, operate and provide results. The Department is
keen to explore alternative techniques for provision of suitable data. This includes
Global Positioning Satellite data, TrafficMaster data on the trunk roads and data from
other Intelligent Transport Systems. However, in the short term it seems that the
floating car surveys are the only method that can provide sufficient reliable data. In the
longer term, it is likely that monitoring will move away from these surveys towards a
more technologically based solution. As a piece of research the latest speed survey
contract will include an option for contractors to collect GPS data alongside traditional
data in order to attempt to assess its potential.
32
Estimating Reference speeds
5.
This is something that existing surveys do not attempt to do. However, in order
to monitor congestion in terms of time lost per vehicle, it is necessary to refer to a speed
that would be achievable in the absence of congestion. The proposed approach for
estimating such hypothetical speeds is different depending on the network in question.
6.
For urban areas, one approximation is to collect speeds from night-time surveys.
However, uncongested speeds achievable during the day would be different from these
in reality due to the presence of other legitimate road users - such as pedestrians,
parking or unloading vehicles and buses in daytime bus lanes. It would be possible to
make some kind of adjustment to the night-time speeds based upon the type of urban
area in question, but such adjustments would essentially be arbitrary.
7.
For major inter-urban trunk roads, the favoured approach is to use speed limits.
Running a night-time survey would be costly and mostly unnecessary while other
methods tend to be either too generalised or increasingly complex.
Estimating a baseline
8.
Another basic requirement of the PSA target is to have a baseline figure for the
level of congestion in 2000, which can be compared against results from later years. As
well as reference speeds as described above, this requires data on actual average speeds
for 2000. Because the existing surveys do not run every year this is not entirely
straightforward. However, a lot of the data were collected in 2000 and the remainder
can be derived by using data from other surveys. For example, the trunk roads survey
was run in 1998 and is being repeated this year. A 2000 estimate for each road link will
be calculated by interpolation between the 1998 and 2001 results (weighted to take
account of the fact that 2001 is likely to be a better estimate).
Ongoing surveying
9.
The existing surveys as described above collect enough data to meet most of the
needs of the monitoring exercise. However, there are certain changes that are now being
made. Firstly, the cycle of surveys is being accelerated with urban areas and inter urban
routes surveyed every other year rather than the previous 3-year cycle. This lessens the
need either to use old data or to make estimates in calculating levels of congestion.
Also, the coverage of existing surveys is being extended. To get a complete picture of
congestion, surveys are now being run at weekends and on Monday mornings and
Friday evenings and are designed to generate eno ugh data at these time periods for each
different road class to enable reliable monitoring over time.
Presentation of results
10.
The presentation of results is quite a difficult issue. While the main policy
interest is in the change in congestion, there will inevitably be interest in the absolute
level. Interested parties will take estimated figures for time lost per vehicle kilometre
and gross up in an attempt to put a value on the time lost due to congestion. Ideally
measures of congestion would concentrate on index numbers, comparing congestion in
a given year to a baseline of 100 in 2000, but, to be realistic, absolute congestion is of
interest. It is therefore important to explain carefully the choice of indicator and to
explain the significance of reference speeds and, in presenting results over time, to
provide a commentary that attempts to identify contributory factors.
33
11.
There is also a need for indicators to resonate with the public experience.
Departmental research has shown that there is a need for additional indicators to reflect
issues such as reliability and work is underway in trying to identify data sources that
could be of use and ways in which results could be presented in an understandable way.
Monitoring at local areas
12.
Most of the discussions so far on congestion monitoring have concentrated on
overall monitoring needed to assess the PSA target. A further area of work is the extent
to which monitoring is needed at local levels. This would be in addition to the
monitoring programme run by the DTLR in large urban areas discussed above and
could cover any individual area. Firm decisions have not been made so far but
discussions are likely to focus on whether benchmarks should be established for
different types of urban areas or at the individual authority level. This would involve
areas being categorised according to certain characteristics and benchmarks being
established on this basis. This would be with a view towards helping local authorities to
monitor their own progress in meeting congestion targets and would be designed to
supplement existing individual monitoring arrangements for LTPs. It is likely that some
kind of local modelling would be needed as an input since the main central modelling
tool, the National Traffic Model, does not go to this level of detail. The Congestion
Benchmark Work Group is examining these issues, and plans to publish
recommendations based upon the National Transport Model this year.
34
Annex 4
The Floating Car Method of Monitoring Traffic Speeds
1. The DTLR for many years has run speed surveys of urban areas and of the English
trunk roads network. The ‘floating car’ method is used, whereby a specially
equipped vehicle travels around the network with the traffic stream, making the
necessary observations of distance and journey time as it goes. The main
considerations in the operation of these surveys are as follows:
Network details
2. The precise definition of the network that is to be surveyed should be agreed in the
early stages of planning. This will give an indication of the scale of the survey
work.
3. The first step in filtering out the roads to be included is to select those with average
daily traffic flow above a certain level. This should leave all A-roads and some key
B- and lower class roads. Once these roads are established, other routes, which are
considered to be of strategic importance, may be added.
4. The network should be split into ‘links’, one link being typically the stretch of road
between two controlled junctions. Ideally the link will ha ve traffic flow data unique
to it, as when results are aggregated to give an average speed for the whole network,
the speed for each link is flow-weighted. If unique flow figures are not available,
one will need to be estimated from data for adjacent links.
5. At this stage, any links which are one-way, should be flagged as such to aid route
planning later.
Time of surveying
6. Before routes are planned, the length of time available in which to complete them
should be decided upon. For example, a 75- mile route on roads with expected
average speed of 25mph could not be surveyed in a two-hour period.
7. The day should be split into morning and afternoon periods, and each of these into a
peak and an off-peak. The periods used in the 1999 Urban Areas Speed Survey and
in earlier surveys are as follows:
•
AM peak – 0730 - 0930
•
AM off-peak – 1030 - 1230
•
PM off-peak – 1330 - 1530
•
PM peak – 1630 - 1830
8. It may be that in some areas, the definition of these time periods could be different,
but for consistency, it would be best to use these times unless there is good reason
not to. Ideally, at least 30 minutes should be left between periods to ensure clear
separation between the peak and off-peak times.
35
Routes
9. Once the network and the timing for the survey are established, routes should be
planned which may each be achieved within one time period. Both directions
(where applicable) of every link should be covered at least once in each time period
over the course of the surveying, although preferably not on the same day, to ensure
as far as possible that correlation between surveyed links is kept to a minimum.
10. Depending on the size of the network, some links may need to be covered more than
once in order to reduce variability of results; smaller areas need extra survey runs in
order to yield overall estimates of similar precision to those from larger urban areas.
The Department's surveys have always covered at least 4 full days of surveying in
order to give a reasonable level of accuracy. A minimum of 4 days surveying gives
an estimated precision of +/- 1 mph in a given time period. In other words, this level
of surveying provides estimates that should be accurate to this degree 95 per cent of
the time.
11. It is useful to have an idea of what the average speed is likely to be before devising
the route, to work out the distance likely to be attainable within a time-period. The
average speed for the urban areas covered by the DTLR survey in 1999 was 21mph
at peak times and 25mph at off-peak times.
12. Efficiency of coverage is important. Whilst there is no harm in covering the same
link several times, this will mean more survey time and hence greater cost. Once a
first draft of the routes to be used is completed, a count of the number of times each
link is covered in each direction will reveal where improvements can be made to
efficiency.
13. For the purposes of DTLR speed surveys, roadworks are regarded as part of the road
situation and DTLR does not specifically seek to avoid them, unless major works
which are likely to be highly disruptive are planned. The local authority will know
where and when any major roadworks are due to take place and so may wish to plan
routes to avoid them. In this way it can be ensured that comparisons are meaningful
from year to year.
Methodology
14. The measurement of average speeds should be by means of the ‘floating car’
method whereby the driver of the survey car seeks to maintain an average speed in
relation to the traffic stream. Specifically, this method involves attempting to
equalise the number of vehicles being overtaken by the survey car with the number
of vehicles overtaking the survey car. However, in doing this, the driver must
always give due consideration to the safety of other road users, pedestrians and the
survey team. Safety is the overriding constraint and takes priority over attempts to
balance the vehicles being overtaken or overtaking.
15. The survey includes elements of navigation, observation of surrounding traffic,
entry of information to a laptop computer and competent driving ability and
appropriate driving experience. Previous surveys have used two- man teams,
comprising a driver and an observer.
16. The survey car will need to be fitted with equipment capable of recording distances
and times at specific locations wherever a link ends or begins. The measurement of
36
distance and time must be synchronised and commence at the point of emergence
form successive nodes. The Department records cumulative distances to an
accuracy of 1/1,000th mile, taken every two seconds, but a lower level of detail than
this would still be capable of producing reliable results. The main requirement is to
measure the time and distance for every link to a good level of accuracy.
17. The in-car observer should also record relevant ‘events’. These should cover the
crossing of a link node – where the car ends one link and begins another. Also the
number of vehicles overtaking or being overtaken by the survey car and also
incidents such as ‘accident’ or ‘roadworks’ should be recorded. This helps to
interpret the data at a later stage.
Results and analysis
18. For every link surveyed, the average time and distance will be needed. If a link is
covered more than once, it is important to calculate and use the averages for that
link, rather than including data more than once and biasing the final results. As well
as times and distances for each link, there needs to be a traffic flow figure (as
described above) so that results can be weighted together. A simple example, for a
given time period is given below:
Link A: average time 200 seconds; average distance 2000 metres; traffic flow
2000 vehicles per hour
Link B: average time 600 seconds; average distance 2000 metres; traffic flow
1000 vehicles per hour
Overall average speed = overall average distance (flow weighted) / overall
average time (flow weighted):
= [(2000*2000)+(2000*1000)] / [(200*2000)+(600*1000)]
= 6,000,000 / 1,000,000 = 6 metres per second
= 21.6 kmh
19. Similar calculations can be carried out for the whole network for each time period,
or for all time periods combined. This should be possible using a spreadsheet
package, or alternatively specialist software exists that can be used.
20. The results of the most recent survey of speeds in urban areas can be found at:
http://www.transtat.dtlr.gov.uk/tables/2000/urban/urban00.htm
21. For further details on speed survey methodology, please contact:
[email protected]
37
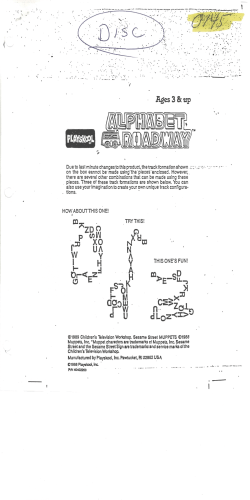

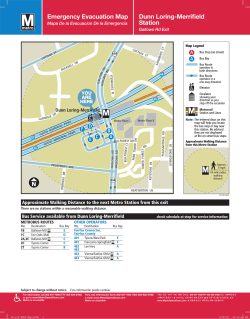
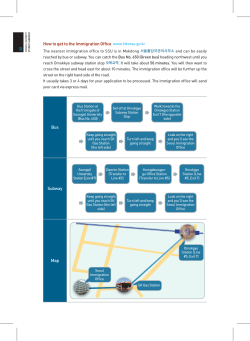


© Copyright 2026