
How to make money on mobile applications Thomas Moltke-H Tveten
How to make money on mobile
applications
Thomas Moltke-H Tveten
Master of Science in Communication Technology
Submission date: June 2014
Supervisor:
Harald Øverby, ITEM
Norwegian University of Science and Technology
Department of Telematics
i
Problem Description
How to Make Money on Mobile Application
The number of applications on mobile devices have had an extreme increase the last two years.
Apps in App Store have increased from 140,000 in January 2010, to over one million in January
2014. Google’s Google Play have witnessed an even greater increase, with 100,000 applications
available in October 2010, to more than one million in July 2013. Applications have begun to
take a larger part in people’s life, and by introducing Firefox OS in developing countries, this is
likely to continue. It is a highly profitable market, and every day new applications compete to
get the consumers’ attention. One example of a huge success is Snapchat. Last year, Snapchat
turned down a 3 billion dollars offer from Facebook, and a 4 billion dollars offer from Google.
The main research question for this thesis is to analyze the money-earning logic for mobile device applications. A case study of a self-developed application for both Android and iOS will be
performed. In particular, the following issues will be analyzed:
• Background study of the economic markets for mobile device applications and their history, with emphasis on indie applications.
• Present and analyze a complete business model for the case study application, using Osterwalders business model ontology.
• Analyze different income models, using available sale statistics.
• General analysis of how the application is influenced by network effects, positive feedback
and other digital economic key aspects.
ii
Preface
This master thesis concludes my master’s degree in Communication Technology with emphasis in telecommunications economy at the Norwegian University of Science and Technology
(NTNU), department ITEM. The thesis was carried out during the spring semester of 2014. It is
a customized thesis based on an idea about obtaining an in-depth understanding of the application market through an analysis of a self developed application.
Trondheim, 2014-06-18
Thomas M. Tveten
iii
Acknowledgment
I would like to thank the following persons for their great help during the time I wrote this thesis.
I would like to thank my supervisor, Harald Øverby, for comments and suggestions throughout
the semester. I will also thank Harald for the guidance he provided me when the workload appeared over-ambitious.
I would like to thank the CEO of Dirtybit, Nicolaj Broby Petersen, for providing helpful information in my interview with him.
Last I would like to thank everyone that downloaded my app, tested it and contributed to enough
data for me to analyze in this thesis.
T.T.
iv
Sammendrag
Antall mobilapplikasjoner vokser eksponensielt med over 1,000 nye applikasjoner utgitt hver
dag, og allerede 1 million tilgjengelig. Konkurransen mellom applikasjoner er hard, men applikasjonene som blir populære genererer store inntekter. Et eksempel er WhatApp som ble
kjøpt opp av Facebook i 2014 for 19 milliarder dollar. Applikasjonsmarkedet er et vinneren tar
alt marked, som alle kan delta i ved å utvikle sin egen applikasjon. Det er ingen kostnader i
form av penger for å utvikle en applikasjon, og utviklere trenger derfor bare å riskere sin egen
tid. Formålet med denne masteroppgaven er å øke forståelsen av mobil applikasjonsmarkedet,
og å analysere det fra et forretningsmessig perspektiv. Det er spesielt et emne masteroppgaven
utdyper, og det er analysen av den egenutviklede applikasjonen i forbindelse med applikasjonsmarkedet. Tre er tre hovedteamer som blir analysert assosiert med dette emnet, og er som
følger.
1. Utviklingen og markedsføringen av mobilapplikasjoner
2. En fullstendig forretningsmodell for mobilapplikasjoner
3. Graden nettverkseksternaliteter påvirker mobilapplikasjoner
1. For å kunne gjøre en grundig analyse av hovedfaktorene som påvirker applikasjoner, utviklet
og analyserte jeg min egen mobilapplikasjon. Under utviklingen fikk jeg erfaringer av den enorme
mengden av tid og krefter som ligger bak utviklingen av applikasjoner, og faktorene som må
være tilstede for å møte brukerenes behov. Da applikasjonen var ferdig, gjennomførte jeg en
omfattende markedsføring gjennom reklame på Facebook. Under markedsføringen ble applikasjonen rangert som den 26. mest populære applikasjonen på den norske App Store, og
som det 2. mest populære ordspillet. På grunn av applikasjonens popularitet, ble jeg intervjuet av avisen Byavisa, TV-kanalen TV2, og i boken Mobile App Growth Hacks. Masteroppgaven
gir en analyse av effekten fra markedsføringen og de ulike intervjuene, samt effekten fra andre
markedsføringer kanaler benyttet. Primær funnet i forhold til dette temaet, er den store effekten markedsføring har på aplikasjonens popularitet og applikasjonens evne til å tilegne seg nye
brukere. Dette indikerer viktigheten for applikasjoner som strever med å bli lagt merke til.
v
2. Masteroppgaven presenterer en fullstendig forretningsmodell for den egenutviklede applikasjonen ved bruk av Osterwalders forretningsmodell ontologi. Forretningsmodellen undersøker hvordan applikasjoner skaper verdi for målgruppen deres, og gir en grundig analyse av
den egenutviklede applikasjonens kostnadsstruktur og hvordan den genererer inntekter. Hovedfunnene i forhold til forretningsmodellen, er den store innvirkningen applikasjonens brukeraktivitet har på inntektene, og at inntektene subsidiererer kostnadene i en stor grad.
3. En omfattende analyse av nettverkseksternalitetene som påvirker den egenutviklede applikasjonen er utført. Analysen viser til den store påvirkningen nettverkseksternaliteter har på
applikasjonens evne til å opprettholde eksisterende brukere og tilegne seg nye. På grunn av
nettverkseksternalitetene, kan det føre til en eksponensiell økning eller reduksjon i applikasjonens popularitet. Ved å avvende en modifisert epidemiologisk modell på den egenutviklede applikasjonen, er applikasjonens nettverkseksternaliteter modelert. Modellen er beregnet basert
på applikasjonens brukeraktivitet og effekten fra nettverkseksternalitetene, og gir dermed matematiske ligninger som kan bli brukt av utviklere for å få mer kontroll over effektene.
Det er tre andre funn i masteroppgaven verdt å merke seg. For det første, psykologien i applikasjoner er en av de viktigste faktorene for å øke applikasjonens brukeraktivitet, og dermed
inntektene. Applikasjonens psykologi øker brukernes ønske om å fortsette å bruke apllikasjonen, ved å fokusere på brukernes følelser og atferd. For det andre, det er fem nøkkelindikatorer
som analyserer applikasjonens styrker og svakheter for å kunne øke brukernes engasjement, og
dermed øke applikasjonens inntekter ved å fokuksere på de mest lønsomme brukerne. For det
tredje, applikasjonens popularitet er hovedsakelig bestemt av applikasjonens omfanget av Jungeltelegraf konseptet. Jungeltelegrafen er i utgangspunktet formidling av informasjon fra person
til person ved muntlig eller digital kommunikasjon. I applikasjonsmarkedet, oppstår dette når
personer deler deres mening om en applikasjon til andre. Effekten fra konseptet er stor, og må
være tilstede for at en applikasjon skal kunne opprettholde sin popularitet.
vi
Abstract
The number of mobile applications grows exponential fast with 1,000 new applications published each day, and 1 million already available. The competition among applications is fierce,
but the applications that become popular generates large revenues. One example is WhatsApp,
which was acquired by Facebook in 2014 for $19 billion. The application market is a winnertake-all market, that everyone can participate in by developing their own application. There is
no cost in terms of money to develop an application, and thus developers only need to risk their
own time. The aim of this thesis is to gain an understanding of the mobile application market,
and to analyze it from a business perspective. It is especially one topic this thesis elaborates,
and that is the analysis of the self-developed application in relation to the application market.
There are three main subjects that are analyzed associated with this topic, and are as followed.
1. The developing and marketing of mobile applications.
2. A complete business model for mobile applications
3. The impact of network externalities influencing mobile applications.
1. In order to do an in-depth analysis of the main factors influencing applications, I developed
and analyzed my own mobile application. During the development I obtained experiences of
the vast amount of time and effort behind the development of applications, and the factors
that need to be present in order to meet the users’ needs. When the application was finished, I
conducted an extensive marketing through advertising on Facebook. During the marketing the
application became ranked as the 26th most popular application on the Norwegian App Store,
and the 2nd most popular word game. Due to the application’s popularity, I was interviewed by
the newspaper Byavisa, the TV channel TV2, and in the book Mobile App Growth Hacks. The thesis presents an analysis of the effect from the marketing and the various interviews, along with
the effect from other marketing channels utilized. The primary finding in relation to this topic,
is the large effect marketing has on the application’s popularity and the application’s ability to
acquire new users. This indicates the importance of marketing for applications that struggle to
be noticed.
vii
2. The thesis presents a complete business model for the self-developed application by using
Osterwalder’s business model ontology. The business model examines how applications create
value to their target customers, and provides an in-depth analysis of the self-developed application’s cost structure and how it generates revenue. The main findings in relation to the business
model, is the large impact the application’s user activity has on the revenue generated, and that
the revenue subsidizes the costs to a large extent.
3. An extensive analysis of the networks externalities influencing the self-developed application
is performed. The analysis presents the large influence network externalities have on applications’ ability to maintain existing users, and acquire new. Due to the network externalities, this
may lead to an exponential increase or decrease in the application’s popularity. By applying a
modified epidemiological model on the self-developed application, the application’s network
externalities are modeled. The model is calculated based on the application’s user activity and
the effect from the network externalities, and thus provides mathematical equations that can be
used by developers to gain more control over the effects.
There are three other findings in this thesis worth noting. First, the psychology in applications
are one of the key factors to increase applications’ user activity, and thus the revenue. The application’s psychology increases users’ desire to continue using the app, by focusing on users’
emotions and behavior. Second, there are five key performance indicators that analyze the application’s strengths and weaknesses in order to increase users’ engagement, and thus increase
the application’s revenue by focusing on its most profitable customers. Third, the application’s
popularity are primarily determined by the application’s extent of the Word of Mouth concept.
Word of Mouth is basically passing of information from person to person by oral or digital communication. In the application market, this occurs when people share their opinion about an
application to others. The effect from the concept is large, and has to be present in order for an
application to maintain its popularity.
Contents
Problem Description . . . . . . . . . . . . . . . . . . . . . . . . . . . . . . . . . . . . . . . .
i
Preface . . . . . . . . . . . . . . . . . . . . . . . . . . . . . . . . . . . . . . . . . . . . . . . .
ii
Acknowledgment . . . . . . . . . . . . . . . . . . . . . . . . . . . . . . . . . . . . . . . . . .
iii
Sammendrag . . . . . . . . . . . . . . . . . . . . . . . . . . . . . . . . . . . . . . . . . . . .
iv
Abstract . . . . . . . . . . . . . . . . . . . . . . . . . . . . . . . . . . . . . . . . . . . . . . . .
vi
1 Introduction
1
1.1 Background and Motivation . . . . . . . . . . . . . . . . . . . . . . . . . . . . . . . . .
1
1.2 Problem Formulation . . . . . . . . . . . . . . . . . . . . . . . . . . . . . . . . . . . .
2
1.2.1 Objectives . . . . . . . . . . . . . . . . . . . . . . . . . . . . . . . . . . . . . . .
3
1.3 Limitations . . . . . . . . . . . . . . . . . . . . . . . . . . . . . . . . . . . . . . . . . . .
3
1.4 Contributions . . . . . . . . . . . . . . . . . . . . . . . . . . . . . . . . . . . . . . . . .
5
1.5 Structure of the Report . . . . . . . . . . . . . . . . . . . . . . . . . . . . . . . . . . . .
6
2 Background
8
2.1 History . . . . . . . . . . . . . . . . . . . . . . . . . . . . . . . . . . . . . . . . . . . . .
9
2.2 App Categories . . . . . . . . . . . . . . . . . . . . . . . . . . . . . . . . . . . . . . . .
14
2.2.1 Social network . . . . . . . . . . . . . . . . . . . . . . . . . . . . . . . . . . . . .
14
2.2.2 Photography . . . . . . . . . . . . . . . . . . . . . . . . . . . . . . . . . . . . . .
15
2.2.3 Communication . . . . . . . . . . . . . . . . . . . . . . . . . . . . . . . . . . .
16
2.2.4 Games . . . . . . . . . . . . . . . . . . . . . . . . . . . . . . . . . . . . . . . . .
16
2.3 App Valuation . . . . . . . . . . . . . . . . . . . . . . . . . . . . . . . . . . . . . . . . .
18
2.4 Related Work . . . . . . . . . . . . . . . . . . . . . . . . . . . . . . . . . . . . . . . . . .
20
viii
CONTENTS
3 Methodology
ix
22
3.1 Part 1 - The fundamentals . . . . . . . . . . . . . . . . . . . . . . . . . . . . . . . . . .
22
3.2 Part 2 - Case Study Application . . . . . . . . . . . . . . . . . . . . . . . . . . . . . . .
23
4 Business Concepts
26
4.1 The Long Tail . . . . . . . . . . . . . . . . . . . . . . . . . . . . . . . . . . . . . . . . .
27
4.2 Value Creation . . . . . . . . . . . . . . . . . . . . . . . . . . . . . . . . . . . . . . . . .
28
4.2.1 Value Chain . . . . . . . . . . . . . . . . . . . . . . . . . . . . . . . . . . . . . .
29
4.2.2 Value Network . . . . . . . . . . . . . . . . . . . . . . . . . . . . . . . . . . . . .
33
4.3 Network Externalities . . . . . . . . . . . . . . . . . . . . . . . . . . . . . . . . . . . . .
34
4.3.1 Network Effects . . . . . . . . . . . . . . . . . . . . . . . . . . . . . . . . . . . .
35
4.3.2 Positive Feedback . . . . . . . . . . . . . . . . . . . . . . . . . . . . . . . . . . .
37
4.3.3 irSIR Models . . . . . . . . . . . . . . . . . . . . . . . . . . . . . . . . . . . . . .
37
5 Business Strategy
46
5.1 Pricing Strategy . . . . . . . . . . . . . . . . . . . . . . . . . . . . . . . . . . . . . . . .
47
5.1.1 Freemium . . . . . . . . . . . . . . . . . . . . . . . . . . . . . . . . . . . . . . .
47
5.1.2 Paid . . . . . . . . . . . . . . . . . . . . . . . . . . . . . . . . . . . . . . . . . . .
51
5.1.3 What To Choose . . . . . . . . . . . . . . . . . . . . . . . . . . . . . . . . . . . .
52
5.2 Apps Key Performance Indicators (KPI) . . . . . . . . . . . . . . . . . . . . . . . . . .
54
5.2.1 KPI #1 - Customer Acquisition Cost . . . . . . . . . . . . . . . . . . . . . . . .
54
5.2.2 KPI #2 - Usage . . . . . . . . . . . . . . . . . . . . . . . . . . . . . . . . . . . . .
55
5.2.3 KPI #3 - Retention Rate . . . . . . . . . . . . . . . . . . . . . . . . . . . . . . .
55
5.2.4 KPI #4 - ARPU, ARPPU, and ARPDAU . . . . . . . . . . . . . . . . . . . . . . .
57
5.2.5 KPI #5 - Lifetime Value . . . . . . . . . . . . . . . . . . . . . . . . . . . . . . . .
57
5.3 Marketing . . . . . . . . . . . . . . . . . . . . . . . . . . . . . . . . . . . . . . . . . . .
58
5.3.1 Word of Mouth . . . . . . . . . . . . . . . . . . . . . . . . . . . . . . . . . . . .
60
5.3.2 Psychology . . . . . . . . . . . . . . . . . . . . . . . . . . . . . . . . . . . . . . .
61
6 Osterwalder’s Business Model Ontology
65
6.1 Ontology . . . . . . . . . . . . . . . . . . . . . . . . . . . . . . . . . . . . . . . . . . . .
66
6.1.1 Offer . . . . . . . . . . . . . . . . . . . . . . . . . . . . . . . . . . . . . . . . . .
67
CONTENTS
x
6.1.2 Customer . . . . . . . . . . . . . . . . . . . . . . . . . . . . . . . . . . . . . . . .
68
6.1.3 Infrastructure . . . . . . . . . . . . . . . . . . . . . . . . . . . . . . . . . . . . .
70
6.1.4 Finance . . . . . . . . . . . . . . . . . . . . . . . . . . . . . . . . . . . . . . . . .
71
7 Guess This Sound - The Case Study Application
72
7.1 The Game . . . . . . . . . . . . . . . . . . . . . . . . . . . . . . . . . . . . . . . . . . .
72
7.1.1 Main Menu View . . . . . . . . . . . . . . . . . . . . . . . . . . . . . . . . . . .
73
7.1.2 Menu View . . . . . . . . . . . . . . . . . . . . . . . . . . . . . . . . . . . . . . .
75
7.1.3 Game View . . . . . . . . . . . . . . . . . . . . . . . . . . . . . . . . . . . . . . .
76
7.1.4 Guess The Word View . . . . . . . . . . . . . . . . . . . . . . . . . . . . . . . .
77
7.1.5 Recording View . . . . . . . . . . . . . . . . . . . . . . . . . . . . . . . . . . . .
78
7.2 The Business Model . . . . . . . . . . . . . . . . . . . . . . . . . . . . . . . . . . . . .
79
7.2.1 Offer . . . . . . . . . . . . . . . . . . . . . . . . . . . . . . . . . . . . . . . . . .
79
7.2.2 Customer . . . . . . . . . . . . . . . . . . . . . . . . . . . . . . . . . . . . . . . .
83
7.2.3 Infrastructure . . . . . . . . . . . . . . . . . . . . . . . . . . . . . . . . . . . . .
87
7.2.4 Finance . . . . . . . . . . . . . . . . . . . . . . . . . . . . . . . . . . . . . . . . .
89
7.3 Marketing . . . . . . . . . . . . . . . . . . . . . . . . . . . . . . . . . . . . . . . . . . .
96
7.3.1 Web Page . . . . . . . . . . . . . . . . . . . . . . . . . . . . . . . . . . . . . . . .
96
7.3.2 Twitter and Instagram . . . . . . . . . . . . . . . . . . . . . . . . . . . . . . . .
97
7.3.3 Facebook . . . . . . . . . . . . . . . . . . . . . . . . . . . . . . . . . . . . . . . .
98
7.3.4 Other . . . . . . . . . . . . . . . . . . . . . . . . . . . . . . . . . . . . . . . . . . 102
7.4 The App’s Network Externalities . . . . . . . . . . . . . . . . . . . . . . . . . . . . . . 104
7.4.1 Psychology . . . . . . . . . . . . . . . . . . . . . . . . . . . . . . . . . . . . . . . 107
7.4.2 Negative Network effects . . . . . . . . . . . . . . . . . . . . . . . . . . . . . . 108
7.4.3 irSIR model . . . . . . . . . . . . . . . . . . . . . . . . . . . . . . . . . . . . . . 109
7.5 Guess This Sound’s KPI . . . . . . . . . . . . . . . . . . . . . . . . . . . . . . . . . . . . 113
7.5.1 Customer Acquisition Cost KPI #1 . . . . . . . . . . . . . . . . . . . . . . . . . 113
7.5.2 Usage KPI #2 . . . . . . . . . . . . . . . . . . . . . . . . . . . . . . . . . . . . . . 114
7.5.3 Retention Rate KPI #3 . . . . . . . . . . . . . . . . . . . . . . . . . . . . . . . . 114
CONTENTS
8 Experiences and Challenges
xi
116
8.1 Users’ Requirements . . . . . . . . . . . . . . . . . . . . . . . . . . . . . . . . . . . . . 116
8.2 What Does It Take . . . . . . . . . . . . . . . . . . . . . . . . . . . . . . . . . . . . . . . 118
8.3 My Experience . . . . . . . . . . . . . . . . . . . . . . . . . . . . . . . . . . . . . . . . . 121
9 Conclusion
122
9.1 Conclusion . . . . . . . . . . . . . . . . . . . . . . . . . . . . . . . . . . . . . . . . . . . 122
9.1.1 The Economic Perspective . . . . . . . . . . . . . . . . . . . . . . . . . . . . . 122
9.1.2 The Influence Of Network Externalities . . . . . . . . . . . . . . . . . . . . . . 124
9.1.3 Requirements And Challenges . . . . . . . . . . . . . . . . . . . . . . . . . . . 125
9.2 Recommendations for Further Work . . . . . . . . . . . . . . . . . . . . . . . . . . . . 126
9.2.1 Super Users . . . . . . . . . . . . . . . . . . . . . . . . . . . . . . . . . . . . . . 126
9.2.2 Word of Mouth . . . . . . . . . . . . . . . . . . . . . . . . . . . . . . . . . . . . 127
A Guess This Sound - irSIR Model
128
B Interview With Byavisa
132
C Interview In Mobile App Growth Hacks
134
List of Figures
2.1 The Game Snake on a Nokia Mobile Phone [43] . . . . . . . . . . . . . . . . . . . . .
9
2.2 The Number Of Available and Downloaded Apps on App Store [44] . . . . . . . . .
11
2.3 Smartphone OS Global Market Share 2012 [40] . . . . . . . . . . . . . . . . . . . . . .
12
2.4 Average Revenue From Downloaded Apps [41] . . . . . . . . . . . . . . . . . . . . . .
13
2.5 Pictures of Draw Something [45] . . . . . . . . . . . . . . . . . . . . . . . . . . . . . .
17
4.1 The App Market Long Tail . . . . . . . . . . . . . . . . . . . . . . . . . . . . . . . . . .
27
4.2 Mobile Application Value Chain . . . . . . . . . . . . . . . . . . . . . . . . . . . . . .
29
4.3 The Mobile Application Store Value Network [61] . . . . . . . . . . . . . . . . . . . .
34
4.4 Fun Run ranking on App Store. Red = USA, Green = Norway [77] . . . . . . . . . . .
36
4.5 SIR Model. Blue = Susceptible, Green = Infected, Red = Recovered [47] . . . . . . . .
38
4.6 irSIR model for MySpace [38] . . . . . . . . . . . . . . . . . . . . . . . . . . . . . . . .
41
4.7 irSIR model for Myspace and Facebook respectively [38] . . . . . . . . . . . . . . . .
42
4.8 The Network Effect Concept . . . . . . . . . . . . . . . . . . . . . . . . . . . . . . . . .
43
4.9 Number of Daily Active Users in Draw Something [49] . . . . . . . . . . . . . . . . .
44
5.1 Different Pricing Strategies in the App Market [32] . . . . . . . . . . . . . . . . . . . .
49
5.2 Revenue from the Different Sources [34] . . . . . . . . . . . . . . . . . . . . . . . . .
51
5.3 Increase In Downloads When Switching From Paid To Free [35] . . . . . . . . . . . .
52
5.4 Revenue Increase When Switching From Paid to Free [35] . . . . . . . . . . . . . . .
53
5.5 Retention Rate in the Different App Categories [52] . . . . . . . . . . . . . . . . . . .
56
5.6 The Potential Reach On Facebook Ads [53] . . . . . . . . . . . . . . . . . . . . . . . .
59
5.7 The Addiction In Angry Birds [76] . . . . . . . . . . . . . . . . . . . . . . . . . . . . .
62
xii
LIST OF FIGURES
xiii
5.8 Nir Eyal’s Desire Engines [75] . . . . . . . . . . . . . . . . . . . . . . . . . . . . . . . .
63
6.1 Osterwalders Building Blocks [18] . . . . . . . . . . . . . . . . . . . . . . . . . . . . .
66
6.2 Customer Buying Cycle [96] . . . . . . . . . . . . . . . . . . . . . . . . . . . . . . . . .
69
7.1 Guess This Sound Main Menu View . . . . . . . . . . . . . . . . . . . . . . . . . . . .
74
7.2 Experience Needed To Achieve a New Level . . . . . . . . . . . . . . . . . . . . . . .
75
7.3 Shop View and Menu View . . . . . . . . . . . . . . . . . . . . . . . . . . . . . . . . .
76
7.4 Game Views . . . . . . . . . . . . . . . . . . . . . . . . . . . . . . . . . . . . . . . . . .
77
7.5 Guess The Word View . . . . . . . . . . . . . . . . . . . . . . . . . . . . . . . . . . . .
78
7.6 Record The Sound View . . . . . . . . . . . . . . . . . . . . . . . . . . . . . . . . . . .
79
7.7 Guess This Sound - Cost and Revenue Stream . . . . . . . . . . . . . . . . . . . . . .
89
7.8 The Increase of Twitter Followers . . . . . . . . . . . . . . . . . . . . . . . . . . . . . .
98
7.9 Increase In Number of Downloads Period 1 . . . . . . . . . . . . . . . . . . . . . . . .
99
7.10 Number of Downloads on App Store. . . . . . . . . . . . . . . . . . . . . . . . . . . . 102
7.11 Comparison Number of Downloads With Ranking on App Store . . . . . . . . . . . 105
7.12 The App Marked’s Positive Feedback Loop . . . . . . . . . . . . . . . . . . . . . . . . 106
7.13 Daily Active Users . . . . . . . . . . . . . . . . . . . . . . . . . . . . . . . . . . . . . . . 109
7.14 irSIR modeling of Guess This Sound. . . . . . . . . . . . . . . . . . . . . . . . . . . . . 110
7.15 Retention Rate Parce.com . . . . . . . . . . . . . . . . . . . . . . . . . . . . . . . . . . 115
A.1 The numbers used to calculate the irSIR model to Guess This Sound . . . . . . . . . 130
A.2 Numbers calculated for the original activity and the irSIR model . . . . . . . . . . . 131
B.1 My Interview With Byavisa . . . . . . . . . . . . . . . . . . . . . . . . . . . . . . . . . . 133
C.1 My Interview Part 1 . . . . . . . . . . . . . . . . . . . . . . . . . . . . . . . . . . . . . . 135
C.2 My Interview Part 2 . . . . . . . . . . . . . . . . . . . . . . . . . . . . . . . . . . . . . . 136
List of Tables
7.1 Expected Revenue . . . . . . . . . . . . . . . . . . . . . . . . . . . . . . . . . . . . . .
90
7.2 Parse’s Pricing Structure . . . . . . . . . . . . . . . . . . . . . . . . . . . . . . . . . . .
92
7.3 The Server Cost Increase . . . . . . . . . . . . . . . . . . . . . . . . . . . . . . . . . . .
92
7.4 The Market Cost Allocation . . . . . . . . . . . . . . . . . . . . . . . . . . . . . . . . .
94
7.5 Expected Time Used To Develop An App . . . . . . . . . . . . . . . . . . . . . . . . .
95
7.6 Number of Downloads From Three Most Efficient Marketing Approaches . . . . . . 103
7.7 Number of Downloads Compared To The Case Study App’s Rank . . . . . . . . . . . 106
xiv
Acronyms
App Application
OS Operating System
IAPs In-App Purchases
NTNU Norwegian University of Science and Technology
ARPD Average Revenue Per Download
ARPU Average Revenue Per User
ARPPU Average Revenue Per Paying User
ARPDAU Average Revenue Per Daily Active User
CAC Customer Acquisition Cost
KPI Key Performance Indicator
LTV Customer Lifetime Value
CTR Click-Through Rate
CPM Customer Per Thousand
xv
Chapter 1
Introduction
This chapter presents the background and motivation behind writing this thesis, and the problem formulation based on the motivation. Later on, the main objectives in this thesis are discussed and the thesis’ limitations in relation to the objectives given. At the end the structure of
the report is provided.
1.1 Background and Motivation
The number of applications (apps) on mobile devices have had an extreme growth the last two
years. Apps on Apple’s App Store have increased from 140,000 in January 2010, to over one million in January 2014 [70]. The growth on Google’s Google Play is even bigger, from 100,000 apps
available in October 2010, to more than one million in July 2013 [71]. Apps have begun to take
a larger part in people’s life, and by introducing Firefox OS in developing countries, this is likely
to continue.
With approximately 1,000 new apps released every day [22], the competition is fierce, and apps
struggle to compete with the enormous amount of other apps available. It is a winner-take-all
market, where popular apps become highly valuable, one example is Snapchat. Last year (2013),
Snapchat turned down a $3 billion offer from Facebook, and a $4 billion offer from Google [72].
A large percentage of students in technological environments have begun to take part in this
1
CHAPTER 1. INTRODUCTION
2
new market, and already at NTNU two very successful apps have their origin; Fun Run and
Wordfeud. In the beginning of 2013, NTNU established Applab1 , in order to create an environment for developers at NTNU. This resulted in an increase of interest to develop apps among the
students. There are papers written about the app market with the emphasis on its growth and
future potential, but since data from available apps are limited, assumptions are usually done.
In order to avoid this, I created my own app to obtain a deeper understanding of the app market.
Thus, the thesis differentiate itself from other papers, because it provides an in-depth analysis
of the fundamentals influencing apps through the study of a self-developed application. The
thesis therefore presents an analysis of the app market from both a technological research perspective, and a developer’s perspective.
To obtain enough data from the case study application in the limited time it was available on
the app stores, an extensive marketing was conducted. During the marketing, the app became
ranked as the 26th most popular app on the Norwegian App Store, and the 2nd most popular
word game. By reaching out to the media after the app had gained popularity, I was interviewed
three times. The first interview was conducted by the American company Serenity App Solutions in its book Mobile App Growth Hacks, see Appendix C. The interview’s goal was to give
the readers an understanding of the requirements related to developing and marketing apps.
The second interview was performed by the newspaper Byavisa and became the headline in the
business section from May 13th to May 20, see Appendix B. The interview’s topic was concerned
with the factors behind apps’ popularity. The third interview was conducted by the tv channel
TV2 and was sent every hour on May 30th, on the news channel TV2 Nyhetskanalen. The interview’s topics was the case study app’s popularity. Through the interviews, I obtained outreach
experience and a deeper understanding of media’s effect on apps’ popularity.
1.2 Problem Formulation
The main research objective in this thesis is to analyze the money-earning logic for mobile device apps. In order to encounter the objective, a background study of the economic markets for
1
Applab is a place where the students at NTNU can meet, discuss and work in team to develop apps for both iOS
and Android.
CHAPTER 1. INTRODUCTION
3
mobile device apps and their history is provided. Later on, a case study of a self-developed app
is performed. The thesis presents and analyze a complete business model for the case study
app, using Osterwalders business model ontology. Thereafter, an analysis of the effect from
the different distribution channels in relation to the case study app is performed. Later on, a
general analysis on how the app is influenced by network effects, positive feedback and other
digital economic key-aspects are discussed. Then, the thesis provides an overall analysis of the
challenges developers encounter during the developing and marketing of apps. In the end, the
conclusion and recommendation for further work are given.
1.2.1 Objectives
The main objectives of this master thesis are collected and elaborated from the problem formulation. An extensive analysis of the app market, and an in-depth study of a self-developed application provides answers to the objectives. Due to the limited time the case study app had been
available on the app stores, it did not generated enough sufficient data to analyze its revenue
stream, and thus two of the economic key-aspects in relation to revenue are not of relevance.
However, as few apps ever generate revenue, the thesis rather provides the requirements and
challenges related to developing and marketing apps. The main objectives this thesis aims to
answer are as followed.
1. What are the costs related to apps, and how do they generate revenue? Are there any digital
economic key-aspects relative to apps?
2. To what extent are apps influenced by network externalities? Are there ways to model
these effects, and thus learn how to benefit from them?
3. What are the requirements and challenges in relation to developing and marketing apps?
What does it take for an app to become successful?
1.3 Limitations
The thesis focuses on the app market as a business from the perspective of independent app developers and small developer teams. This limits the available funds the team has to hire design-
CHAPTER 1. INTRODUCTION
4
ers, developers, people with marketing skills or invest large amounts of money in advertising.
These options are therefore not elaborated to the same extent as the options relative to developers with a limited budget.
The main focus of this thesis is the case study app Guess This Sound. The thesis presents a business model and a business strategy for the case study app, by using Osterwalder’s business ontology and other business strategy key concepts. The business model is therefore representative
for independent developers or teams consisting of few individuals, and not large enterprises.
Due to the limited time the app was available on the app stores, the analysis was done based
on the data available on that time. Since the app did not generate any revenue, only the cost
structure is evaluated. Thus it was not possible to calculate two of the apps’ key performance
indicators; lifetime value and ARPU, ARPPU and ARPDAU. However, in terms of network externalities, the data analyzed gives an in-depth analysis of the app’s network effects and shows that
a modified epidemiological model (SIR model) can be successfully applied in order to model
these effects.
The thesis is limited by only one in-depth study of an app in the app category game, considering the vast amount of apps in this category and the total amount of available apps. Due to
the limited time, I had to focus on developing the app, and later do an extensive marketing to
obtain enough sufficient data. My main focus was therefore to analyze the developing and marketing of the app, and the large amount of factors that influence the app on different levels.
These factors are studied and explained in advanced in the chapters before the elaborating of
the case study app. Examples of the factors studied are network externalities, pricing strategies,
economic key-aspects, marketing, Osterwalder’s business model ontology and other business
concepts. However, because of the limited time, they are not elaborated to a large extent, and
are only explained on a general level. They are however analyzed in conjunction with the case
study app which provides a sufficient analysis of these factors in relation to this particular app.
In other words, the thesis presents these factors on an overall level, an thereafter analyze them
in relation to the case study app which is the in-depth study in this thesis.
CHAPTER 1. INTRODUCTION
5
The app had to be done before writing this thesis, and thus because of the limited time, not all
desirable approaches have been feasible. The thesis therefore assumes in the less elaborated
cases that others’ research are sufficient. For example, the app’s price was not switch back and
forth from paid to free to see the effect Thomas Carter explained in 5.1.3. I neither had the
money or time to see if I could avoid the app’s user activity to rapidly decline, by preventing the
irSIR Equation 4.7 to be satisfied.
1.4 Contributions
The contributions in this thesis are as followed.
• Chapter 2 presents a detailed study of the app market in general with the main focus on
its evolvement, based on a composition of different studies and analysis.
• Chapter 4 provides a qualitative analysis of the app market in relation to its ecosystem and
the network externalities influencing it. The analysis is carried out based on studies and
research written by other individuals.
• Chapter 5 gives a detailed study of the app market from a business perspective with main
focus on the different pricing strategies, economic key indicators and the marketing. The
study is composed of extensive studies from numerous different sources.
• In order to analyze the key factors in the app market in-depth, I developed a self-developed
app during the time I wrote this thesis.
• Chapter 7 presents an extensive study of the self-developed app’s business model using
Osterwalder’s business model ontology framework. The ontology is thoroughly described
in the thesis in chapter 6. The study further presents an analysis of the self-developed app
in relation to the main factors in the app market, such as marketing, network externalities
and economic key indicators. The study provides an in-depth analysis of the case study
app’s network effects by applying a modified epidemiological model (SIR model).
• Finally, a composition of the experiences obtained through the development and marketing of the self-developed app is provided in chapter 8.
CHAPTER 1. INTRODUCTION
6
1.5 Structure of the Report
The report is structured as follows.
Chapter 2 provides the necessary background information of the app market in general, from
the beginning to its current state.
Chapter 3 explains the methods and approaches used to acquire and process relevant data for
the qualitative analysis in this thesis, both in relation to the research studies and the case study
app.
Chapter 4 presents the app market from a business perspective by looking on different concepts such as the long tail, value creation and network externalities. The concepts are later used
in the analysis of the case study app. The section irSIR Models uses epidemiological modeling
to model and analyze the app market’s network effects.
Chapter 5 describes the different business strategies in relation to apps, such as pricing strategies and apps key performance indicators. Further, the chapter examines different marketing
channels with emphasis on the Word of Mouth concept and the psychology within apps.
Chapter 6 describes Osterwalder’s business model ontology which is later used to analyze and
present a complete business model for the case study app.
Chapter 7 presents a brief description of the case study app and later a complete business model
by using Osterwalder’s business model ontology. Further the chapter provides an analysis of the
different marketing channels and their effect. Later on, the chapter analysis the case study app’s
network externalities and model them by applying a modified SIR model. At the end, the chapter analyze the different key performance indicators in relation to the case study app.
Chapter 8 discuss the challenges and requirements developers face when developing and mar-
CHAPTER 1. INTRODUCTION
7
keting apps. The chapter later describes key factors developers should be aware of, in order to
increase the probability for the app to become popular. At the end, the chapter presents a collection of the most important experiences I obtained during the developing and marketing of
the self developed app.
Chapter 9 provides the conclusion and recommendation for further work.
Appendix A contains the calculation of the case study app’s irSIR model.
Appendix B contains the interview with the newspaper Byavisa.
Appendix C contains the interview in the book Mobile App Growth Hack.
Chapter 2
Background
This chapter provides background information about the mobile app market in general with an
overview on how this marked has evolved from the beginning. In addition a description of the
different app categories is provided, and later a valuation of digital products and popular apps
from an economic perspective is given. At the end, the related work is presented.
Before presenting the apps’ history and a description of this new market, it is necessary to provide an elaboration of what an app is. App is short for application and are basically a software
that runs on top of the computer’s operating system. According to Techopedia [110], apps are
generally small, individual software units with limited function, that are downloaded from the
app stores (digital distribution platforms for mobile apps) through the phone or the Internet.
According to [42], the difference between an app and general software is that software is the OS
and all its associated programs installed in the computer in order to run the hardware. Apps on
the other hand are also a piece of software, but they are designed to help the user perform various
of tasks on the OS, and are usually an add-on on top of the OS. Apps are not limited to handset
devices, they are developed for a vast amount of other electronic devices such as cars, refrigerators and TVs [50]. However, the thesis’s scope is limited to apps running on mobile devices.
8
CHAPTER 2. BACKGROUND
9
2.1 History
In the beginning the most popular functions in mobile phones were calling and sending text
messages. Back then, the competition among the mobile phone companies was fierce, and the
secrets were closely guarded. In order to not expose the secrets of the phones, the software were
developed in-house (first-party) resulting in a very limited amount of functionalities inside the
software [5]. At the end of the twentieth century, the company Nokia became famous for including the game Snake (see Figure 2.1) in some of the company’s first mobile phones. Other
companies followed and added games such as Tetris, and Tic-Tac-Toe. The games were developed in-house and were part of the mobile phone operating system (OS). Therefore, they are
not considered as apps. However, this was the first step towards implementing apps on mobile
devices.
Figure 2.1: The Game Snake on a Nokia Mobile Phone [43]
Mobile phones became cheaper and more commonly used, and thus more functionalities were
added to the phones. Already in 1993, IBM introduced its mobile phone IBM Simon which was
the world’s first smartphone. It included a calendar, address book, clock, calculator, notepad,
email and a touchscreen with a QWERTY keyboard1 . However, due to limited storage, processor
capacity, and low battery time, the mobile phone never became a success [80]. In 1991 2G2 was
introduced. 2G technology allowed mobile data services, and later in 1998 the first downloadable content was sold on mobile phones; ring tones. Later in 1999 Nokia released their mobile
1
2
QWERTY keyboards are the standard keyboard on all computers
2G (or 2-G) is short for second-generation wireless telephone technology [81]
CHAPTER 2. BACKGROUND
10
phone Nokia 7110, which was the first mobile phone with an WAP3 browser [79].
3G4 was commercially opened for businesses in Europe, by Telenor in December 2001. The
technology continued to spread and in June 2007, the same month as the first iPhone was introduced, 200 million subscribers in total were connected. Although mobile phones long had the
ability to access data networks such as the Internet, people did utilize it until the widespread of
good quality 3G coverage [83].
In 1998, Nokia became the largest mobile phone company in the world, and held the position
until 2012. Nokia still has 9 of 10 mobile phones on the top 10 list of most selling mobile phones
ever, the number one is Nokia 1100 with 250 million units sold [84]. Unfortunately for Nokia,
Apple had a new mobile phone concept, and in June 2007, the iPhone 1G was released. iPhone
1G made it possible and easy to do more than just call and send text messages. With the iPhone,
people could listen to music, upload photos to the Internet or browse the Internet with the Safari
web browser. These new functionalities, also referred to as apps, quickly became very popular.
Apple saw this opportunity, and encouraged developers to program web-based apps that would
behave like native apps5 . However few good web apps were developed, and Apple later opened
up for third-party developers to develop native apps by releasing the iOS SDK6 in March 2008.
This gave everyone the opportunity to develop apps for iPhone’s operating system iOS, resulting
in a large increase of number of apps created. The day after, Apple released App Store, a digital
distribution platform containing every iOS app. This made it easy for everyone to share their
apps and create a business around them.
On July 10 2008, only few month after the iOS SDK was released, Steve Jobs (the former CEO
of Apple) announced that App Store contained 500 third-party apps to iPhone and iPod Touch,
and of these 25% of them were free. When App Store opened the day after, 10 million apps were
3
Wireless Application Protocol (WAP) is a technical standard for accessing information over a mobile wireless
network [78]
4
3G, short for third Generation, is the third generation of mobile telecommunications technology [82]
5
Native apps, are apps which are developed for one operating system such as iOS, Android, or Windows
6
SDK is short for Software Development Kit, which allows developers to create apps for a certain operating system.
CHAPTER 2. BACKGROUND
11
downloaded the first weekend. Only half a year later in January 2009, Apple announced that
500 million apps had been downloaded, and the billionth app was downloaded on April 23rd,
2009 [2]. On Apple’s annual iPad event in 2013, Tim Cook (the CEO of Apple) announced that
more than 60 billion apps had been downloaded from App Store, and that 1 million apps were
available [3]. Figure 2.2 shows the increase in number of apps on App Store.
Figure 2.2: The Number Of Available and Downloaded Apps on App Store [44]
The enormous success with iPhone and iPad, made Apple in 2012 the most valuable company
in history in terms of market capitalization, taking the throne from their old rival Microsoft[4].
Other companies witnessed Apple’s success, and decided to join the market. In September 2008,
more than a year after the first iPhone was introduced, Google’s OS Android was released, and
only one month later, Google Play (formerly Android Market). Google Play is exactly the same as
App Store; a digital distribution platform for Android apps developed by first- and third-party.
CHAPTER 2. BACKGROUND
12
Google entered the mobile app business later than Apple, but has enjoyed an even greater increase in amount of available and downloaded apps. This is due to the fact that Android is a free
OS that every smartphone manufacture company can utilize, and thus faster distributed compared to iOS which is limited to Apple’s products. Figure 2.3 shows the global OS market share
in percentage, in the end of 2012.
Figure 2.3: Smartphone OS Global Market Share 2012 [40]
Figure 2.3 shows that Android had 68.4% of the global OS market share, and sold in 2012 more
than 700 millions smartphones. Compared to Android, iOS had only 19.4% in 2012 [40]. With
an almost equal amount of available apps on App Store and Google Play, one would think that
Google generates more revenue in this market compared to Apple. However, due to complete
different business models, this is not the case. In 2013 the total revenue in the app market was
$26 billion, where Android stood for $5.2 billion and iOS $19.24 billion [54], Figure 2.4 shows
this in percentage.
CHAPTER 2. BACKGROUND
13
Figure 2.4: Average Revenue From Downloaded Apps [41]
This is because Android was developed to increase Google’s largest revenue stream, advertising.
On the other hand, Apple focus on generating money on in-app purchases (IAPs), in-ads, and
priced apps. iPhones are also more expensive than most Android phones, and people with more
money tend to use more than people with less. This is only an assumption, but studies [41] show
that iOS users are spending a lot more on apps, even when they are downloading fewer of them
overall.
Other companies that compete for the market share are Microsoft, and Mozilla with Firefox OS.
Microsoft had only 3.6% of the globally smartphone market share the third quarter of 2012, but
there are claims that Microsoft actually will surpass Apple’s globally OS market share in approximately three years. The assumptions might be overestimated, but as the numbers show, Microsoft gain market share while its competitors lose [85]. Further, Microsoft acquired Nokia’s
phone business for $7.2 billion the first quarter of 2014 [87], and tries to compete with Android
by allowing smartphone manufactures to utilize Windows OS for free [86]. Firefox OS aims to
attract users in developing countries that can not afford a high-end mobile device. The smartphone costs $25, and thus several compromises in relation to the processor performance were
necessary in order to create the phone. The first Firefox OS smartphone was launched in July
2013, and have already expanded into 15 markets. Firefox OS is predicted to become prevalent
in this part of the market in the years to come [114]. However, Google and Apple are currently
in control of this market as they are by far the largest smartphone OS distributors in the world,
CHAPTER 2. BACKGROUND
14
and the thesis therefore focus on those two companies in relation to the app market.
In 2010 Apple secured the trademark for the iPhone-promoting phrase there is an app for that
[51], and by looking on the exponential growth of apps in Figure 2.2 this might be true. However,
as technology continue to evolve significantly fast, will apps continue to be a large part of peoples’ life or will they be replaced by new technologies? For most technologies this is inevitable,
however apps are not just a technology product, they are a type of software. The large mobile
device manufactures will never have enough manpower or resources to develop everything the
customers desire. Thus, to fulfill the customers’ needs, the mobile device software must have
the ability to add additional software developed by a third-party (i.e. apps).
When the 1 million app threshold on App Store breached on December 17th 2013, they came
from 262,000 different publishers and a high percentage of them were indie developers7 . Hence,
there are a large variations of the quality of apps. Fortunately, Google and Apple remove apps
they find as low quality apps and currently a total of 370,000 apps are removed [22]. An app
is considered as an low quality app if the percentage of users downloading the app and later
delete it is high. As of March 24th 2014, there are 1,185,734 available apps on Google Play, where
the percentage of low quality apps are 21% (249,004 apps) [23]. In order to obtain a deeper
understanding of the different apps available, a description of the different categories is needed.
2.2 App Categories
There are a vast amount of categories and subcategories in the app market, which separate apps
on slight differences. To not to describe them all, this subsection provides a brief description of
the most popular categories on both Google Play and App Store in 2013 [115].
2.2.1 Social network
The Social Network category represents apps used to communication and information sharing
at on single place. They are usually developed based on the company’s already existing service
7
Indie developers refers to apps developed by one independent developer, or a small team up to 10 persons.
CHAPTER 2. BACKGROUND
15
on Internet. Social network apps are for example, dating apps like Badoo, or a place to share
short messages such as Twitter. The most successful app in this category is however Facebook,
with 945 million mobile users of its 1.23 billion users on Internet. Developers usually integrate
Facebook in their apps, to let the users share the app’s content on the social network [7]. This
increases Facebook’s value, since a large number of apps use it as a distribution channel in order
to benefit from its network effects. Social networks are highly influenced by network effects, and
the thesis later analyze Facebook in relation to these effects, presenting a less bright future for
the large company.
2.2.2 Photography
The category Photography includes apps that have a photographic concept, such as editing
or sharing of pictures and videos. Two very popular apps in this category are Instagram and
Snapchat. Instagram let the users take a picture or a video with the phone, add effects to it, and
later publish it on their Instagram profile. People can see others’ pictures by following their profile. Instagram was published in October 2010, and in April 2012, the app had 100 million active
users. Later that month Facebook acquired the app for approximately $1 billion [8].
Instagram is a huge success, but an even larger success is Snapchat. In Snapchat, users basically
take a photo or a short video with their phone and send it to friends in the app. The persons
that receive the picture or video can watch it up to ten seconds depending on what the sender
choose, after that it disappears forever. Even with this simple idea, people tend to love it. This is
because Snapchat does not expose its users with many unnecessary functionalities, it provides
an easy way for users to share small events in their daily life through pictures or videos. Snapchat
was released September 2011 and had in December 9th 2013, 60 million downloads with 30 million monthly active users. With more than 400 million messages sent every day, Snapchat has an
estimated value of $800 million in relation to in-ads [9]. However, when Facebook made an offer
of $3 billion to acquire the company [10], and Google offered $4 billion [11], Evan Spiegel (owner
and creator of Snapchat) still declined to sell it. What Instagram and Snapchat have in common,
without the fact that they are highly popular, is that they do not generate any revenues. The high
estimated value is based on the potential revenue the apps could generate if advertising was im-
CHAPTER 2. BACKGROUND
16
plemented. People clearly believe in this potential, and only in June 2013, Snapchat raised $60
million from investors [12].
2.2.3 Communication
The category Communication, represents apps used to communicate through texting and calling. With emphasis on large numbers, it is particular one communication app which has become incredible successful; WhatsApp. WhatsApp’s users can send text messages, images and
videos to each other. It works almost the same as the message app implemented in the phone’s
OS, where people communicate by sending SMS and MMS. However, with WhatsApp users do
this by using data traffic, leaving no telecommunication fees except the data traffic fee itself.
With free Wi-Fi almost everywhere or at a very low price, the app is perfect for people who want
to save money. With more than 400 million users, and 1 million new registered every day, it is
no surprise that the app is highly valued. So valuable that Facebook bought it for $19 billion in
February 2014, making WhatsApp the largest app acquisition of all time.
2.2.4 Games
One of several app categories that have gained the consumers’ attention is the category Game.
As every other category, the game category has several subcategories (18 in total) to differentiate
what kind of game it is. Every game has also different game modes, such as single player mode,
multiplayer mode and survival mode. The most common game modes are single player mode
and multiplayer mode. Single player mode is where the players play the game alone and try
to complete different stages while playing, for example winning a car race. Multiplayer mode
is where the players play with other players on the same team or against each other. This can
happen in-game where the players can play simultaneously, or turned based where the players
are waiting in turn.
A vast amount of games have been very popular, for example Draw Something, Flappy Bird and
Angry Birds. In 2013, Rovio (the company behind Angry Birds) reported that Angry Birds had
more than 1.7 billion downloads and 263 million monthly active users, which generated a to-
CHAPTER 2. BACKGROUND
17
tal revenue of $200 million in 2012. The game is so popular that it has its own theme park in
Finland and stuffed animals and electronic devices all around the world for sale. Angry Birds
is highly successful, but it is not the game to be highlighted. The game this thesis emphasis is
Draw Something. This is because of the similarities it has in relation to the case study app.
Draw Something was developed in February 2012, by the company Omgpop. After five weeks,
the game had been downloaded 20 million times with 15 million daily active users. Already in
the end of March 2012, the company Zynga acquired Omgpop with Draw Something for more
than $200 million [6]. Draw Something is very similar to the case study app, and thus a wider
description of the game is given. It is a turned based game where two users play against each
other. The player with the turn, picks a word among three random words (see Figure 2.5 to the
left), and draws a drawing based on that word. When the player is pleased with the drawing, he
sends it to the other player. The other player receives the drawing, and tries to guess the word
the other player picked by looking on the drawing (see Figure 2.5 in the middle). If the player
guess the correct word, he needs to create a drawing based on a new word and send the drawing
back to the other player. When players guess the correct word, both players earn coins based on
the difficulty of the word. If the word is hard to guess, the player can use a “bomb” that removes
letters that are not part of the word, and thus make it easier to guess the word.
Figure 2.5: Pictures of Draw Something [45]
CHAPTER 2. BACKGROUND
18
The Figure 2.5 to the right shows the shop in the game, where players can buy bombs or new
colors to use in drawings. With the opportunity to log in and play against friends on Facebook,
the game benefits from Facebook’s network effects. Before describing the case study app Guess
This Sound, the thesis presents an analysis of the app market from a business perspective.
2.3 App Valuation
Highly valued apps have become a common phenomena. They are usually valued based on the
potential revenue they can generate rather than what they are currently making. They are normally free, and thus generate revenue from advertises or purchases of virtual goods inside the
app. Hence, they share similarities with other free digital services that generate revenue through
advertises, such as social networks. Twitter and Facebook are examples of highly valued social networks, and by analyzing their market capitalization can give a deeper understanding on
apps’ valuation.
Twitter has not generated any revenue, but its stocks continues to rise, and the firm has a marked
value of $24.5 billion [13]. On the other hand, Facebook however struggles to not lose market
value. Facebook was highly overvalued before it entered the Nasdaq stock exchange, and only
three months after it was published on May 18th 2012, the market value shrunk as much as $50
billion [14]. In 2011 the year before Facebook entered Nasdaq, the company made $3.7 billion
in revenue, and had a market value of $104 billion [15]. The market value was 28.12 times bigger
than their annually revenue, and in comparison to other business areas this is highly unusually.
For example, Exxon Mobil had in January 2013 a market value of $416.9 billion and a revenue
of $428.38 billion, thus the company’s market value is almost equal to the revenue [16]. Another example is Telenor, which had a revenue of NOK 104 billion, and a market capitalization
twice as much (NOK 223 billion) in 2013 [17]. Hence, there are uncertainty on how to estimate
an accurate market value on digital services, such as social networks. WhatsApp was acquired
by Facebook for $19 billion, and Nokia’s handset business was acquired by Microsoft for $7.2
billion. Thus, WhatsApp was acquired for more than twice the amount compared to Nokia.
Further, WhatsApp had only 55 employees [105] compared to the 25,000 employees in Nokia’s
CHAPTER 2. BACKGROUND
19
handset business [116]. This raises speculations in how valuable WhatsApp actually is, and how
companies calculate the value of these highly popular apps.
According to Leo Polovets, Partner at Susa Ventures [104], investors analyze several factors when
they value a pre-revenue company or product, such as apps. There are primarily four key factors that are analyzed to evaluate the app. The first one is the team behind the app, and for how
long they will continue to work with the app after the app is acquired. If the team consists of
individuals with little or no experience to grow the business further, the company is worth less
compared to a team consisted of individuals with experience or high university degrees. The
second factor is the user’s lifetime value (LTV), which is the estimated average revenue a user
generates during the app’s lifetime. LTV is used to estimate the app’s potential total revenue,
by looking on the percentage of growth in terms of app downloads, and the app’s user activity.
This provides information on how fast the return of the investment could be expected. LTV is
also used in relation to the third factor; market size. By estimating the maximal number of consumers the app is expected to acquire, an estimation of the total revenue based on the LTV can
be calculated. The last factor is the competition. If the app has several competitors especially
with similar ideas, the risk is higher for the app to become popular and thus the value of the app
decline. However, the risk depends on the popularity of the competitors’ apps, and the probability that a fierce competition occurs. Another factor with impact on the company’s value is
the market force. It does not matter what a company is worth, if investors all think it is worth $7
million, that is what the market value will be.
Instagram and WhatsApp are highly valuable apps because of the factors described, but the
main reason why Facebook acquired them was due to the potential value they could achieve in
combination with Facebook. According to [105], WhatsApp continues to obtain 1 million users
a day, and thus absorbs up user messaging and connection time that once could have belonged
to Facebook. To avoid this, Facebook acquired the company and thus reduced the risk of losing
its customers, and increased the value through collaboration with WhatsApp. This is also why
Facebook bought Instagram in 2012 [106]. Thus, apps are valued based on the revenue they
potential can generate, and the value they can provide other companies.
CHAPTER 2. BACKGROUND
20
The quality and the overall value of companies that you invest in becomes more important than your ability to calculate their economic valuations to the nearest dollar.
Leo Polovets, Partner at Susa Ventures.
2.4 Related Work
There are several papers with similar studies as the topics described in this thesis. The research
Hacking App Store Pricing [35], by Thomas Carter is especially interesting. The research analyze
the different price strategies and price methods relative to apps, based on a self-developed app.
By changing the app’s price, back and forth from free to paid, he obtains enough information
to present a preferred pricing strategy for the app. The research concludes that freemium with
in-ads and IAPs is the optimal price strategy as it results in more revenue.
The next paper of interest is Epidemiological Modeling For Online Social Network Dynamics [38],
written by John Cannarella and Joshua A.Spechler at Princeton University. The paper analyze
network effects in online social networks by using a modified epidemiological modeling (SIR
models). The model is adopted to analyze the impact networks effects have on the case study
app, and proves to be very applicable.
Mobile Application Ecosystem from the Application Developers’ Perspective [57], written by Myryam
Roshan Kokabha at Aalto University, provides a description of the ecosystem surrounding the
app market with focus on Google Play and App Store. The paper is however slightly beyond this
thesis scope, and was only used as a guidance for the app market’s value chain and the two-sided
market effect. The paper Mobile App Value Network [61], written by Felix Cuadrado at Queen
Mary University of London, presents the mobile app value network and an analysis comparing
App Store and Google Play from a business perspective. Business Model Analysis [73], written
by Xiangqian Kong at Helsinki School of Economics, analyze different business models. I took
advantage of this paper in the thesis in order to describe Osterwalder’s business ontology.
McKinsey provides a deeper understanding of the Word of Mouth effect, through its analysis A
CHAPTER 2. BACKGROUND
21
new way to measure word-of-mouth marketing [68]. Nir Eyal explains through his research in
psychology, How to manufacture desire [75], how to create desire in the users in order to create super users. Studies collected from Capptain, presents the apps key performance indicators
used to analyze the strength and weaknesses in apps, and focus on the most profitable customers to increase the revenue. The studies can be found in [27], [29], [30] and [31]. Other
sources I have exploited are Forbes and Mashable. Forbes has provided information regarding
apps’ revenue and how to determine their value.
Chapter 3
Methodology
This chapter presents the methods and approaches I used to acquire and process relevant data
for the qualitative analysis in this thesis, and thus provided sufficient answers to the thesis’s objectives. This chapter is divided into two parts. The first part describes the methods I used to
collect information relative to the fundamentals in the app market. The fundamentals represents general background information about the app market and from a business perspective.
The second part provides the methods I utilized to obtain and evaluate the data from the case
study app.
3.1 Part 1 - The fundamentals
In order to obtain information about the app market’s fundamentals, I analyzed papers and
literatures based on extensive studies of these fundamentals. This provided a deeper understanding of the app market from a business perspective, and thus the revenue, cost and other
digital economic key-aspects relative to apps. In order to perform an in-depth analysis of these
factors, they were later analyzed in relation to the case study app. I exploited papers and articles
written by developers, to obtain information about their experience and knowledge related to
the app market from a developers’ perspective.
To analyze network externalities in relation to apps, I searched for background information on
the topic and studied apps that had benefit from these effects. I interviewed a successful app
22
CHAPTER 3. METHODOLOGY
23
developer, the CEO of Dirtybit, Nicolaj Broby Petersen, to understand the factors behind his success. I studied the spread effect in epidemiological modeling (SIR model), and later compared
it to the network effects influencing apps to see if they had similarities. Thereafter, I modeled
the network effects in the case study app by applying a modified SIR model. After I had studied the app market from a research perspective, I analyzed the obtained information with the
self-developed app. Thus, I obtained information about the app market from a developer’s perspective.
3.2 Part 2 - Case Study Application
In order to obtain a deeper understanding of the app market without being limited to the available information from apps, I developed my own app. To achieve enough data from the case
study app to analyze, I conducted an extensive marketing through advertising on Facebook,
reached out to the media, and utilized other marketing channels such as Twitter and Instagram.
In order to analyze the impact the app stores’ ranking lists have on apps’ popularity, one of my
main objectives during the marketing was to achieve a good rank for the app. This succeeded,
and the app became ranked as the 26th most popular app on the Norwegian App Store, and
the 2nd most popular app in the app category word game. This was impressive considering the
short time the app had been available. I reached out to several media sources, in order for them
to create a case about the app. This resulted in three interviews. The first interviewed was performed by the newspaper Byavisa, and became the headline in the paper’s business section. The
second interview was conducted by the American company, Serenity App Solutions, regarding
their book Mobile App Growth Hacks. The last interview was performed by the TV channel TV2,
and was sent every hour on their news channel TV2 Nyhetskanalen. I analyzed the effect from
the interviews and the marketing, in order to obtain information about their impact on apps’
popularity, and to determine the most cost-efficient way to market an app.
To retrieve data from the app, I used especially two sources. First, I collected data from the server
company Parse1 to analyze the app’s user activity and the number of daily downloads. This was
1
Parse is a web service that provides an easy way for developers to establish communication from their apps to
CHAPTER 3. METHODOLOGY
24
later used to analyze the app’s network effects and its potential revenue. Parse stores all the data
sent between the server and the app, and provides an easy way for developers to analyze the
app’s growth in relation to downloads, activity and server performance. Parse is a free service if
the app’s communication does not exceeds the free limits. The case study app did not exceed
these limits, and thus did not generate any server cost. However, I utilized Parse’s price structure
in order to calculate the potential server costs in relation to the communication the app already
generated.
Second, I exploited the web service App Annie2 to analyze the effect the app’s rank had on the
number of daily downloads. App Annie presents orderly statistics for the app’s progress in relation to its revenue, rank and downloads. These statistics was analyzed in relation to marketing,
in order to determine the effect from the different distribution channels utilized. The case study
app did not generate any revenue, and this is therefore not analyzed. The information from App
Annie and Parse were exploited in order to analyze the case study app’s networks externalities.
When the app’s popularity increased due to the extensive marketing, I was able to analyze the
network externalities related to the app’s rank. Further, by applying the modified SIR model, I
was able to model the app’s user activity, in relation to the network effects influencing it.
I created a complete business model for the case study app by using Osterwalder’s business
model ontology. In order to provide information about apps from a business perspective, I analyzed the case study app in relation to this model and the data collected from the first part of
this methodology. Thus, I obtained information about how economic key-aspects can increase
the app’s popularity and thus revenue. Through the development and marketing of the case
study app, I experienced the challenges and requirements developers encounter and the enormous amount of time and effort behind apps. Together with the studies of the fundamentals in
the app market in part one of the methodology, I obtained sufficient information about the app
market from both a technological research perspective and a developer’s perspective. This gave
me a deeper understanding for what it takes for an app to be successful, and and thus the thesis
servers that store information information from the app.
2
App Annie is a web service that collects data about the submitted app in relation to the app’s revenue, number
of downloads, rank and costs.
CHAPTER 3. METHODOLOGY
25
provides a guidance for new developers to avoid pitfalls and increase the probability for their
app to become popular.
Chapter 4
Business Concepts
This chapter presents the business concepts in relation to the app market, and is divided into
three sections; The Long Tail, Value Creation and Network Externalities. The first section provides an overall description of apps distribution in the long tail concept in relation to their popularity. The value creation section presents tree concepts; value chain, value network and value
shop. The last section, network externalities, explains the different network externalities relative
to apps such as network effects and positive feedback. The section later provides an analysis of
network effects relative to apps and social networks by applying a modified epidemiological
model (SIR model1 ).
Number of apps increases exponential fast. On App Store, 25,000-30,000 apps are published
every month [22], and Google Play registered around 80,000 new apps only in January 2014 [23].
The competition is fierce, but research [55] shows that apps that succeed, can generate huge
revenues. Only 25 of the 262,000 different app publishers account for 50% of the total revenue
on App Store and Google Play. Apps’ revenue depends on their popularity, and because there
are only a few percentage that ever become popular, the market can be analyzed as a long tail
market.
1
SIR models are used to model the epidemiology spread in large populations.
26
CHAPTER 4. BUSINESS CONCEPTS
27
4.1 The Long Tail
Before App Store and Google Play were established, apps were developed by the large mobile
phone manufacturing companies and not the general public. The companies did not have the
resources to build every app the users wanted, which resulted in basic apps such as calendars,
calculators, mail, and a few games. Today, this has changed, everyone can develop their own app
using existing framework and available source code from the Internet. Several online tutorials
make it easier for inexperienced developers to create apps, and Google’s and Apple’s official
developer guides continue to improve to attract new developers. For people that do not have the
time or the skills required to develop apps, other solutions are available on the Internet, such as
the web service Appsbar.com. Apps Bar let people with no knowledge of coding, create their own
app in three easy steps. The apps’ quality is however very low, and it is unlikely that they ever
will become popular. However, such solutions are on the rise and will most likely experience
large improvements in the years to come. With the large number of different ways to develop an
app, and the vast amount of different publishers, it is a huge variation of apps being developed.
Figure 4.1 illustrates the distribution of apps in the app market relative to their popularity by
using the long tail concept.
Figure 4.1: The App Market Long Tail
According to [102], approximately 10% of all apps obtain more than 500 daily downloads, and
only 0.01% generates large amounts of money. The 10% represents the head of the long tail
where the popular apps are located, for example Snapchat, Draw Something and Facebook.
CHAPTER 4. BUSINESS CONCEPTS
28
Apps located in the head usually aim to fulfill most users’ needs, and thus have a high percentage of the general public as their target customers. The long tail contain apps that are less
popular in terms of downloads, and thus represents 90% of all apps. Long tail apps are either
low quality apps, apps created for a smaller part of the population, or apps that have not experienced a large number of downloads. Figure 4.1 provides three examples of long tail apps,
DNB, Meny and I Am Rich. DNB is the The Norwegian Bank’s official app, and provides a mobile
solution for the bank’s already existing customers based on the bank’s originally services. The
app will always be in the long tail, due to the limited number of target customers. The app Meny
is similar, since it is developed for the already existing customers to the Norwegian grocery store
company Meny. However, the app is also developed to attract more customers since everyone
can use it, and thus aims at a larger audience than the DNB app. Compared to the DNB app,
Meny has less downloads and is therefore placed more to the right in the long tail. The objective
for the apps Meny and DNB are to create loyal customers, and not to generate revenue. The last
example of an app in the long tail is I Am Rich. In the few days it was available on App Store, it
aimed at a very low percentage of the market; people with too much money. It had in total eight
downloads, but since it was priced for $999.99 and had no functionality, it is considered to be a
popular app among the few target customers it tried to attract. The long tail concept illustrates
that the app market is a winner-take-all market, where only a low percentage of apps become
extremely popular.
4.2 Value Creation
There are three main business concepts in relation to creating value; value chain, value network
and value shop. A value chain is a chain of activities that a firm performs in order to deliver a
valuable product or service to the market. The goal is to deliver maximum value for the minimum possible cost. Value chain is normally used by manufacturing companies turning input
of raw material into output (value) through a step by step process [58]. A value network is a set
of connections between organizations and individuals that interact to benefit the entire group.
Each member in the network relies on the others to foster growth and increase the value. The
more people connected, the higher the value of the network [59]. A value shop is an organization
CHAPTER 4. BUSINESS CONCEPTS
29
designed to solve customer or client problems rather than creating value by producing output
from an input of raw materials. Compared to value chain, there is no sequential fixed set of
activities or resources utilized to create value. Activities and resources are allocated specifically
to cater the one problem in question. The company tailor products for specific needs and tries
to accommodate them [60]. From the app market perspective, value shop is not that relevant.
Hence, the thesis focus on value chain and value network.
4.2.1 Value Chain
The app market’s value chain starts with an idea, which is developed further to an complete idea
while the team is assembled. The thesis focus on indie apps2 , therefore parts of the value chain
is different comparing to the value chain of big established corporations with large investment
funds available. Figure 4.2 contains the factors in the value chain from a developer’s perspective, which fit into wider categories that almost follow Porter’s value chain (i.e. Inputs for App
Development, Application Development, Application Delivery and Marketing and Sale).
Figure 4.2: Mobile Application Value Chain
2
Indie (short for independent) apps are developed by one individual or a small team
CHAPTER 4. BUSINESS CONCEPTS
30
The inputs for application development stage is where the idea generation find place. The idea
is shaped to a complete idea and the target customer is defined. It is important to keep room for
changes, as the final product might change relative to changes in the concept during the development. In this stage, competition, challenges and the market get evaluated based on the target
customer already defined.
The application developer stage describe the team consisting of developers and designers that
develop the app and customize its design. The team is usually the center of the value chain,
since the team members continue to have an important role even after the release of the app.
Indie developers are usually the idea inventor themselves, and choose programming languages
based on their current skills. If the app becomes popular the team normally hire developers
with the required skills needed. If the goal is to be in the head of the long tail, developers need
to choose carefully regarding the mobile platform the app should be supported on. A common strategy is to develop the app for iOS in the beginning and later consider to develop it on
Android. This is because iOS apps generate more revenue compared to Android [18], and the
download rate is usually higher in the beginning. Apps are normally developed native3 , but the
popularity of hybrid4 apps is on rising. In order to develop an hybrid app, developers use the
web programming language Javascript interacted with a framework that connects the Javascript
code with the native code. Hybrid apps (or HTML5 apps) are usually combined with frameworks
such as PhoneGap, Bootstrap and Jquery. Phonegap is the framework that combines the native
programming language and the Javascript. Bootstrap and Jquery are frameworks that give developers a way to shape and design GUI5 elements within the app by altering the CSS3 code.
CSS3 is a programming language used to change the appearance and the design of the elements
within the app. For example, if a developer want to change the color of a button, he will edit
the CSS3 code. HTML5 apps can be used on every smartphone OS with just small adjustments
in the code, and can also utilize the native device APIs6 . If the app is developed native, it can
3
Native apps are apps developed specific to that platform. For example, iOS develop apps in Objective-C while
Android develop their apps in Java.
4
Hybrid apps are web apps developed in Javascript and CSS3, and can be used on every mobile OS.
5
A graphical user interface (GUI) is a human-computer interface (i.e. a way for humans to interact with
computers)[97]
6
API (Application Programming interface) specifies a set of functions that accomplish a specific task or are allowed to interact with a specific software component [19]
CHAPTER 4. BUSINESS CONCEPTS
31
only be used on the specific platform it was developed for. Hence, it is more time consuming
to develop the app in two different programming languages to support both Android and iOS,
compared to develop it as a HTML5 app. However, the HTML5 code is transformed into native
code before it can run on a device, and thus the app suffers a reduction in both security and
performance. It is also a reduction in user experience, since the app is developed to meet the
requirements of all the platforms, rather than just one. Therefore, it is recommended to develop
native apps rather than HTML5 apps, especially if the app is complex [20]. Another important
part in the app developer layer is the testing. There are two ways to test an app; Black Box Testing
and White Box Testing.
Black Box Testing is a method often known as behavioral testing, because the areas being tested
is not known to the tester. When applying black box testing, the target customers are the ones
that should test the app. This gives the developers a better understanding on how they interact
with it, and how to improve the app. The different levels of black box testing are unit testing (i.e.
the tester clicks on an element), integration testing (i.e. the tester do a small task combined with
several unit tests), system testing (i.e. the tester tests the whole system by going through different tasks), and acceptance testing (i.e. the last test before accepting the app to be published)
which focus on the business’s requirements. The advantages of black box testing is that the tests
are done from a user’s perspective and expose discrepancies in the specifications, by letting the
target customer interact with the design and functionalities within the app. The tests therefore
provide an objective perspective and avoiding developer-bias. The disadvantages of using black
box testing is that only a small number of inputs can be tested, and several paths is therefore
left untested. The tests can only take place in a later stage, when most of the functionalities and
design are implemented [89].
White Box Testing is a software testing method in which the items being tested is known to the
tester. Developers can utilize this method by creating automated tests for every function in the
code. Automated tests can be created by adding a correct or incorrect value as input in a function, and then check if the output is what to be expected. They are called automated because
developers can run them continuously all together to see if any of them breach. If a test breach,
CHAPTER 4. BUSINESS CONCEPTS
32
the developer knows where to look and can easily fix the error. The tests could either be a unit
test (i.e. test one function at a time), an integration test (i.e. test more than one function combined, and see how they interact), and a system test (i.e. test the whole app; run the tests all
together). The advantage with white box testing is that it can be commenced at an early stage,
and do not need to wait for the design or all of the functionality to be implemented. With thorough testing, the tests can cover most of the paths in the code. The disadvantage with white box
testing is that it requires a lot of time to write all the automated tests, or to go through the code
manually [90].
The application delivery stage is concerned with reaching customers through available channels; distribution channels. The most common distribution channels to utilize when marketing
apps are social networks, such as Facebook and Twitter. Because of limited resources, TV and
radio-commercials are often too costly. In order to see how the target customers welcome the
app, a good approach is to hand out flyers. Another factor in the application delivery stage, is
where to publish the app. This depends on the platform choice done in the application developer stage. iOS apps are published on App Store, through Apple’s developer site Itunes Connect.
Itunes Connect is a web page where developers can manage, publish and test their apps. After
the app is published, it needs to be reviewed by Apple which takes 5-8 days. The app is reviewed
based on its content, where Apple looks for inappropriate things such as pornography. If the
app passes its review, it is published on App Store. If not, the developers need to change the
app according to the feedback on the review, and start the review process again. Android apps
are published on Google Play, through Google’s developer site Google Play Console. Google Play
Console works the same way as Itunes Connect. After the app is published on Google Play, it
takes maximum 8 hours before it is available. Hence, it is more convenient for developers to
publish apps on Google Play compared to App Store, because if the published Android app has
any bugs7 (i.e. flaws), developers can fix them and publish a new version of the app in a short
time. However, it is an advantage for the users on App Store that apps have a long review time,
because developers are then more thoroughly with what they publish.
7
A software bug is an error, flaw, failure or fault in a computer program or system that causes it to produce an
incorrect or unexpected results [21]
CHAPTER 4. BUSINESS CONCEPTS
33
The market and sales stage is an continuation of the application delivery stage. In this stage developers can usually see the potential of the app, and therefore a larger investment in terms of
money should be considered. If the app does not generate enough revenue in order to cover the
expenses related to server costs and marketing, financial support is needed. The team should
create a thorough marketing plan in combination with the costs and revenue, and then reach
out to investors that are experienced with marketing of digital goods.
The two final stages in Figure 4.2, are the end user stage and the support stage. They are done in
parallel together with either the market and sales stage, or the application delivery stage. The
end user stage is as the name suggest, the users of the app.
The support stage is connected to the end user stage and represents the app’s user support, for
example error fixing and maintaining the customer relationship through support channels. This
stage is usually referred to as the phase where the real work starts. Even with an extensive test
phase before the app is published, there are always flaws in the app that need to be fixed. The
app also needs to improve with new features and new design, which is important in order to
maintain the existing users and acquire new.
4.2.2 Value Network
The initial mobile content business was strict, because the mobile phone operators had complete control of the value chain. However, after App Store was launched, this has been significantly changed and is now an open environment. The established relationships in the new
market are more complex, and the number of actors are significantly larger. A value chain is
therefore no longer suitable for analyzing the whole network, hence a value network is more
convenient. Figure 4.3 shows the relation between the different actors that provide value to the
ecosystem8 [56].
8
Ecosystem is a community supported by a foundation of interacting organizations and individuals - the organism of the business world. The community produces goods and services of value to customers, who are themselves
members of the ecosystem [56]
CHAPTER 4. BUSINESS CONCEPTS
34
Figure 4.3: The Mobile Application Store Value Network [61]
The connections (i.e. relations) between the actors show value or information exchanged. The
highlighted circles are the central pieces of the ecosystem (i.e. Application Consumers, Mobile
Application Stores and Application Providers). The value of the app stores is proportional to
the apps they contain and the customers they attract. Application providers are the suppliers
to the ecosystem, and are the key to the success of this model as they fill the market with apps
to be acquired. Multiple profiles of app providers coexists, from amateur developers to large
enterprises. They develop apps to the different app stores and maximum their value through
the value chain described earlier. On the other end of the value network, resides the application consumers; the end users. They access the app stores and consume the developed apps,
and become the center of the ecosystem by interacting with a large number of different developers through social networks and app stores. The app stores combine the traditional roles of
content aggregator and distributor, and constitute a direct link between the developers and the
consumers. In principle, the app stores are an open market, where every competitor has equal
chance to succeed. The app stores provide value to the developers through the integrated billing
function in the middle of Figure 4.3, and value to the consumers through the apps available [61].
4.3 Network Externalities
The app market works as a two-sided market, with the app stores at one side and developers
at the other. The difference between a two-sided market and a traditional market, is that the
CHAPTER 4. BUSINESS CONCEPTS
35
value moves from left to right (from cost to revenue) in a traditional market, while in a twosided market the value exists on both sides. In a two-sided market the cost and revenue are
present on both sides, and the members on each side benefit from the members on the other
side. Network effects can occur on the same side or cross-side. Network effects on the same side
are present if an increase in the number of users on one side, influence the value of the network
for the users on that side. With cross-side network effects, an increase in the number of users
on one side, influence the value of the network for users on the other side [57]. In relation to
the app market, the platform providers offer a technological platform where they try to attract
a larger number of developers and consumers in order to make their app store profitable. The
app market experiences both cross-side and one side network effects, for example the more
developers developing iOS apps, the more users will be attracted to use iPhone to get access
to all the apps, and the more iPhone users the larger the incentive to develop iOS apps will
be. Apps’ popularity are influenced by especially two network externalities; Network Effects and
Positive Feedback.
4.3.1 Network Effects
Network Effect is the effect a user of a product has on the value of the product, i.e. the value
of the product is dependent on the number of other using it. In relation to apps, users create
value by downloading the app, and as the app’s popularity increases, more users are motivated
to download it. Word of Mouth is one of the network effects in the app market with biggest influence. Word of Mouth is a common concept for passing of information from person to person
by oral communication. However, Word of Mouth is also present through digital channels such
as social networks. In the app market, Word of Mouth occurs when people share their opinion
about an app, and the more people that talk about it, the larger the impact and spread become.
Word of Mouth is further described in 5.3.1
The app Fun Run developed by Dirtybit, a Norwegian company founded by 2 students at the
Norwegian University of Science and Technology (NTNU), is an example of an app that made
it big due to network effects. Fun Run is a game where players race to reach the finished line
first, and on the way pick up different weapons to use on their competitors to slow them down.
CHAPTER 4. BUSINESS CONCEPTS
36
According to Dirtybit’s own blog [77], the app’s success started when they launched their Twitter competition on November 25th 2012. The players were asked to tweet their username and
#funrun to get a chance to win 10,000 in-game coins. The competition resulted in twice as many
downloads that day, and users started to recruit their friends by writing #funrun on social networks such as Facebook and Instagram. The game climbed fast on App Store’s ranking list, and
in December 11th 2012 it was ranked as the number one app on the American App Store. Figure
4.4 shows how rapidly Fun Run climbs in rank on both the Norwegian and American App Store .
When the game was launched it had no integration with Facebook, and thus players had a hard
time adding their friends’ username in the game. However, it turned out to be a good thing,
because the players used other ways to broadcast their username to friends, such as tweeting
“Add me [username] #funrun”. Due to the Word of Mouth effect the users created on Twitter, the
game became incredibly popular in a short time. According to the interview with Nicolaj Broby
Petersen, COO and Co-Founder of Dirtybit, Fun Run spread extremely fast when it got popular
in USA.
Figure 4.4: Fun Run ranking on App Store. Red = USA, Green = Norway [77]
We went from thousands daily downloads in September to more than 100,000 each
day in December. At the most we had more than 500,000 daily downloads, and 100,000
active users every second.
CHAPTER 4. BUSINESS CONCEPTS
37
Nicolaj Broby Petersen.
According to Nicolaj, no investment in marketing was conducted, because it quickly spread the
day it was introduced at NTNU. Hence, the app became popular because of the Word of Mouth
effect. Figure 4.4 illustrates the big influence network effects have on apps’ popularity.
4.3.2 Positive Feedback
Positive feedback is a process in which the effects of a small disturbance on a system, results in
an increase on the magnitude of the disturbance. For example the number of cattle running
increases the overall level of panic, which again increase the number of cattle running. Positive
feedback is mathematically defined as a positive loop, and the effect can lead to a rapid or even
exponential growth over a period of time. An example of a positive feedback effect in the app
market, is the app stores ranking lists. Google Play and App Store have the same set of rules in
relation to the apps’ rank; one can not pay for a better rank. An app’s rank is determined based
on two criteria; number of daily downloads and average rating. When a user download an app,
he can rate it 1-5 stars depending on how satisfied he is with the app. The app’s rating and its
number of daily downloads have a large impact on its rank, which then again works as a positive
feedback loop. The more daily downloads an app gets, the higher it is ranked, and a higher rank
results in more daily downloads. This is because a higher rank makes the app more visible and
enticing on the app stores, and thus more people download it. The more users downloading the
app, the more revenue it generates, which makes it a continuous competition for the best rank.
The app’s rank can result in an exponential increase or decrease in number of daily downloads,
and developers must therefore try to control it or maintain it. The positive feedback loop is
further analyzed in relation with the case study app in 7.4.
4.3.3 irSIR Models
One way to analyze network effects is by using an epidemiological model (SIR models) [37]. SIR
models describe the probability for a human to be infected with a disease by looking on the percentage of the population that are already infected. Likewise, the model gives the probability for
a human to be recovered, based on the percentage of the population that are already recovered.
CHAPTER 4. BUSINESS CONCEPTS
38
In the SIR model, S is the amount of susceptible, I the number of infectious, and R is the number of recovered. The number of susceptible falls rapidly as more of them are infected, and thus
enter the infectious compartments. Each member of the population typically goes from susceptible to infectious, to recovered, which Figure 4.5 illustrates. The x-axis in Figure 4.5 represents
the time and the y-axis represents the total number people in the population.
Figure 4.5: SIR Model. Blue = Susceptible, Green = Infected, Red = Recovered [47]
Figure 4.5 illustrates that when the amount of infected increases, the amount of susceptible decreases, and the amount of recovered increases. This is because when a person gets infected, he
leaves the susceptible compartment and joins the infected compartment, and later leaves the
infected compartment by joining the recovered compartment. When a person is recovered, the
person becomes immune and can no longer be infected with the same decease again. When
the amount of recovered increases, the probability that a person can be infected becomes lower
because the amount of susceptible and infected becomes smaller, and thus the infected rate declines [38]. The infection rate is influenced by network effects related to the number of people
infected and the number of susceptible left in the population. In other words, the higher percentage of the population infected and the lower the percentage of the population recovered,
the higher the infection rate is.
SIR models can also be used to analyze network effects in social networks, by looking on the
users joining and leaving the network. Joining the network is analogous to infection, and leaving
CHAPTER 4. BUSINESS CONCEPTS
39
the network is analogous to recovery. The susceptible population is equal to potential users
joining the network. The time interval from when the user joins the network to leaving it, is
analogous to the retention rate. Retention rate is how long a user stays in a network after joining
it, and is described further in 5.2.3. Users join the network because their friends have joined it,
likewise they leave the network if their friends leave or if they lose interest. Mathematically the
formula for the SIR model in a given timeframe is S + I + R = N, where N is the entire population.
This can be transformed into three equations that give the rate of each category; susceptible,
infected and recovered.
S0 = −
I0 =
βI S
N
(4.1)
βI S
− γI
N
(4.2)
R 0 = γI
(4.3)
Equation 4.1 gives the rate at which the susceptible population becomes infected S’, which is
proportionate to the infection rate β, the susceptible population S, and the fraction of the infected population
I
N.
In other words, the disease is transferred through interaction between the
susceptible and the infected population with the infection rate β. Likewise, Equation 4.3 gives
that the rate at which the infected population recovers R’, is proportional to I and the recovery
rate γ. Equation 4.2 gives the infection rate I´ which is equal to how fast the susceptible population S gets infected minus how fast the infected population recovers from the infection.
However, it is differences between social network effects and epidemiological spread. Users that
leave the network (recover), leave it because their friends leave it or they lose interest, which
gives the same spread effect as when they join the network (get infected). The equations need
to be modified to match these requirements, and the infectious recovery SIR (irSIR) model is
therefore created. To incorporate this spread, the recovery rate in the equations above need to
be modified to be proportionate to the recovered population fraction
R
, similar to the infection
N
I
N
in Equations 4.1. This is
spread which is proportionate to the infected population fraction
CHAPTER 4. BUSINESS CONCEPTS
40
achieved by multiplying the γI terms in Equations 4.2 and 4.3 by
R
,
N
the new equations are
represented as followed.
S 0 = −βS
I 0 = βS
I
N
(4.4)
I
R
− γI
N
N
(4.5)
R
N
(4.6)
R 0 = γI
The new equations show that the amount of users leaving the network which is R, have an impact on how fast people leave. This is the same effect as when people join the network. By
setting the left side of Equation 4.5 equals 0, Equation 4.7 can be created.
S γ
<
R β
(4.7)
If Equation 4.7 is satisfied, I’ will always be less or equal to 0, meaning it will be more users leaving the network rather than joining it. Since network effects amplify each other, it is important
to avoid Equation 4.7 to be satisfied. The report [38], studied the irSIR model in relation to network effects by applying it on two popular social networks; MySpace, and Facebook. To obtain
the data needed to analyze and estimate the irSIR model on social networks, the author used
available historical Google search queries. This method is advantageous compared to using
registration or membership data from the social networks. That is because the search queries
measure the level of web traffic from the given social network, thus representing the level of user
activity within that network. The search query data obtained is presented in arbitrary units of
weekly search query frequency which are normalized such that the maximum data point in the
selected time period corresponds to a value of 100, see Figure 4.6.
CHAPTER 4. BUSINESS CONCEPTS
41
Figure 4.6: irSIR model for MySpace [38]
The red line in Figure 4.6 is how the irSIR model ordinary looks like when calculating the infection and recovery rate by using the Equation 4.5. The blue line shows the user activity collected
from MySpace. MySpace is a good example to apply the irSIR model on, because it was one of
the largest social networks in history, and all the data from its full life cycle (from rise to fall) is
available. The blue line in Figure 4.6 fits in most cases very good with the irSIR model, showing
that it is similarities between epidemiological irSIR modeling and the networks effects in social
networks. In other words, the irSIR model can be successfully applied to analyze the network
effects in social networks. Another example analyzed by applying the irSIR model is Facebook.
According to the analysis in [38], Facebook’s popularity will decline and later disappear in 2020
at the latest, see Figure 4.7 to the left.
CHAPTER 4. BUSINESS CONCEPTS
42
Figure 4.7: irSIR model for Myspace and Facebook respectively [38]
Figure 4.7 to the left only predicts what will happen with Facebook by applying the irSIR model.
However, by looking on the two figures in Figure 4.7, the pattern is surprisingly similar to MySpace’s pattern in Figure 4.6. That Facebook no longer will be used in 2020 is difficult to comprehend, but as news about Facebook struggles to not lose customers flourishes on the Internet, it
is worth taken into consideration. Still, Facebook has a significant larger user base compared to
what MySpace had, thus it will take long time before it is possible to see if Facebook experiences
the same fate as MySpace [38]. Network effects have a large impact on apps and social networks,
and to get a better understanding of the effects, Figure 4.8 is provided.
CHAPTER 4. BUSINESS CONCEPTS
43
Figure 4.8: The Network Effect Concept
Figure 4.8 illustrates how network effect causes social networks to rapidly decline in amount of
users. The nodes illustrate the users, and the connection between them represents the value
they provide each other. When one user leaves the network, the connections to that user disappears, as Figure 4.8 B illustrates. The effect becomes bigger as more users leave, which is
illustrated in Figure 4.8 C, especially if the users are super users (have a large number of connections). Another factor illustrated in Figure 4.8, is that the value the social network provides,
decreases for users that lose connections. If the social network only provides value to users with
more than one connection, the green nodes are the only users left in the network, see Figure 4.8
C. This is important because the fewer connections a user has, the less value the social network
provides that user, and thus the incentive to leave the network becomes bigger. This creates a
positive feedback loop which can differentiate between the rise and fall of the network.
The paper [38] analyze social networks by applying the irSIR model, but the irSIR model is also
applicable to the app market especially for apps that are sensitive to network effects. One example is Draw Something, which is very similar to the case study application Guess This Sound.
When a player stops using the app, all the player’s games can no longer be played, as it requires
two players to play a game. This is analogous to losing a connection in 4.8. Therefore when
a player leaves, the value the app provides users connected to that player decreases. When the
CHAPTER 4. BUSINESS CONCEPTS
44
value decreases, the incentive for continue using the app becomes smaller, which results in even
more users leaving. Figure 4.8 is later used to illustrate the network effects for the case study app
in 7.4.3. Figure 4.9 shows the daily active users in Draw Something which is equivalent of the
activity within the app.
Figure 4.9: Number of Daily Active Users in Draw Something [49]
Figure 4.9 has not the same gradient as the irSIR model, but an app could never achieve the
same network effects as a social network due to the fact that social network are build on network
effects. Nevertheless, the pattern has similarities with the irSIR model, indicating that the irSIR
model can be applied to some extent on apps influenced by network effects. According to Forbes
[74], Draw Something had 10 million daily active users in May 2012 after losing 5 million users
in only one month. The number of daily active users is probably lower today, but since Draw
Something still is a popular game, it has not experienced the same fate as MySpace. Research
[94], shows that only 5% use an app more than 30 days. Hence, popular apps increase in amount
of active users until it peaks, and then drop rapidly when the number of people leaving the app
becomes bigger than the number of active users within it. The irSIR model analysis of the case
study app (provided in 7.4.3) strengthen this theory, since the model has the same pattern as
the pattern shown in Figure 4.6. It is especially one factor that differentiate epidemiological
modeling from the modeling of network effects; freedom of action. Individuals do not decide
to be infected, but they decide whether they download an app or not. However, when they
CHAPTER 4. BUSINESS CONCEPTS
45
download an app, it increases the probability for other users to download it. Thus, the download
rate is proportional with the network effects related to number of downloads the app achieves.
Chapter 5
Business Strategy
The company’s business strategy and business model shape the company’s business and have
a large impact on the determination of the company’s future. These two concepts are however
not the same, and to differentiate them a description is given. The business strategy describes
how the company engages competitors, identify and segment customers, and respond to the
market environment. Business models describe how a company is structured and its methods
for maximizing revenues and profits. The business model is independent of competitors and
the current state of the market, which is where the strategy comes in. Two companies employing the exact same business model may experience a completely different future, based on their
different business strategies [98]. MySpace and Facebook are examples of two companies with
equal business model (i.e. focus on building a large network of users), but due to different business strategy only Facebook is still active. By looking on Figure 4.7 one can argue that MySpace’s
downfall was caused by Facebook’s increased popularity, and thus that MySpace’s users chose
to leave the network in favor of Facebook. According to [98], Facebook is still active because
it had an open business strategy which allowed for new growth, while MySpace focused on a
niche audience limited to the users’ interests of music. Facebook’s business strategy evolved
and facilitated for a larger audience while MySpace did not, which resulted in complete different outcomes for the two companies. MySpace decrease in user activity, initialized the network
effects that resulted in that MySpace no longer exists. Facebook has witnessed the same effect
from popular apps obtaining its user activity, and as discussed in 2.3, this is one of the main
reasons why Facebook acquired WhatsApp and Instagram.
46
CHAPTER 5. BUSINESS STRATEGY
47
This chapter describes apps’ different pricing strategies, and provide an optimal strategy based
on an extensive case study. The chapter further provides five key performance indicators for
apps, and at the end a description on how to market an app with emphasis on key concepts
like Word of Mouth and the psychological inside apps. The next chapter presents the business
model concept in relation to the topics described in this chapter.
5.1 Pricing Strategy
With over one million available apps, the competition is fierce and apps struggle to get noticed
among the vast amount of other apps. The app’s pricing strategy is therefore crucial for lowering
the barriers for users to choose the app instead of the competitors’, which is why most apps are
free. Revenues are usually no longer generated by an installation fee, they are rather generated
by the users’ interaction with the app such as in-app purchases (IAPs) and in-ads.
In the end of 2013, 62% of apps were free. Apps with a price of $0.99 had the second highest
percentage, and represented 19% of all apps. Nevertheless, there are apps that chooses to use a
whole different price strategy. In 2013 there were approximately 50 apps to a price of $999.99,
and one of them was I Am Rich [22]. The only functionality the app I Am Rich had, was that when
it was opened on the phone, the phone’s screen changed to a glowing red gem and displayed the
text “I Am Rich, I deserve it, I am good, healthy successful”. App Store removed the app few days
after it was released, but in the meantime eight people bought it. This shows that even an app
that does nothing and cost a fortune, can make money by hitting the right market and using the
right price strategy.
5.1.1 Freemium
Freemium is a new price strategy, which has become very popular for digital services and goods.
The word freemium is made up from the words free and premium, and is basically to give a core
product away for free and sell the premium product for a flat fee. The usage of computers are
becoming increasingly pervasive, and the cost is declining. Moore’s law describes the exponen-
CHAPTER 5. BUSINESS STRATEGY
48
tially decreasing in computing costs and observes that the amount of computer power one can
buy today for a certain cost, doubles every 18 months. The effect is that the computer production is very inexpensive, and digital products can be duplicate at almost no cost. Therefore, only
a small percentage of the consumers need to buy the product, to make the freemium strategy
profitable.
The freemium strategy was not possible when the goods were non-digitally and costed money to
produce. For example, it did not make sense to distribute 100 free CDs in order to sell 2 concert
tickets, because the cost of producing and distributing the CDs would be too high compared to
the revenue from the concert. However, today when computers can create mp3 files and distribute them for almost nothing, it becomes profitable. In other words, freemium is a suitable
pricing strategy for companies that can deliver their services digitally, and not for companies
that depend on non-digital services [63].
In relation to the app market, research [24] shows that it is relatively hard to make money from
Android apps relying on a one-off installation fee. Only 20% of the free apps and 80% of the paid
apps are never downloaded on anyone’s device. 52% of all free Android apps are downloaded
less than 1000 times, and only 5.6% are downloaded between 50,000 and 500,000 times. For
paid Android apps, the numbers are even worse. Only 0.1% of paid apps have ever seen 50,000
downloads, and 5% are downloaded between 1,000 and 50,000 times. This makes the strategy
for Android apps clear, freemium is the optimal choice. It is a huge difference between apps
on App Store and Google Play. According to research [111], on App Store, the popular free apps
are downloaded 15 times more than popular paid apps. On Google play, popular free apps are
downloaded 82 times more. This strengthen the statement that iOS users spend more money
on apps compared to Android users.
Freemium is by far the most popular pricing strategy among apps. This is because the download
rate increases, and thus the total revenue becomes bigger since the revenue from in-ads and
IAPs increases. Figure 5.1 shows that freemium with IAPs is the most common strategy to utilize.
Categories like music, entertainment, education, productivity and navigation normally have an
CHAPTER 5. BUSINESS STRATEGY
49
installation fee. This is because the apps are usually more complex, or need to pay money to a
third-party that provide them with the data needed. For example, Spotify (a music service) pays
the artist 0.6 cents per song played, which accounts for 70% of the total gross revenue [32].
Figure 5.1: Different Pricing Strategies in the App Market [32]
Premium
Premium is used in combination with freemium. The apps have a free version, but users can pay
extra for a better version; the premium version. The premium version can for example contain
more functionality, nicer design or be free from advertises. The main objective when utilizing
the freemium pricing strategy, is to get users to love the app, which increases the probability
for them to purchase the premium version. Spotify is free to desktop and mobile phones, but
only the premium users can play music without network connection and advertises stopping
the music. These features attract users, and is the main reason why 25% (6 million) of Spotify’s
users are premium users, paying $20 every month.
CHAPTER 5. BUSINESS STRATEGY
50
In-Ads
The most common ways to display ads in apps, are as a fullscreen pop up picture between sessions or as a banner at the bottom. The fullscreen pop up picture is typically displayed a few
seconds, while the banner usually is displayed all the time in specific views. There are two ways
to generate revenue from in-ads; Click-Through Rate (CTR) and Cost Per Thousand (CPM). CTR
is the revenue generated when a user clicks on an ad and thus open the page where a product
is advertised. CPM refers to the passive impressions an ad receives, regardless of whether users
click on it. According to Hochman Consultants [108], each ad impression generates on average
$0.0047. The average CTR is 0.5%, where each click generates $0.92. A rough calculation of the
average total revenue generated by a 1,000 impressions is $9.3. In other words, an app needs
high user activity to generate sufficient revenue.
In-App Purchases
IAPs is a common pricing method especially for apps in the category games. In U.S. the revenue
from IAPs in apps in the category game increased from 1% in 2008, to 34% in 2010. Further,
according to Distimo, 98% of Google Play revenues and 92% of App Store revenues in November
2013 came from free apps that offered in-app items for purchase [107]. In 2012, 71% of all IAP
transactions were below $10, and generated 31% of the total revenue from IAPs. 18% of the total
revenue was generated by transactions from $10 to $20, and 51% was generated by transactions
greater than $20. However, most users do not pay for virtual goods, in 2012 it was only 3% that
spent money in freemium games [33]. Nevertheless, as Figure 5.2 shows, IAP has become the
largest revenue source, representing 76% of the total revenue on App Store in the U.S. market.
CHAPTER 5. BUSINESS STRATEGY
51
Figure 5.2: Revenue from the Different Sources [34]
With an Average Revenue Per Download (ARPD) of $0.99 from IAPs in both U.S. and Europe and
$3 in Japan, IAP is definitely a monetization method every developer should consider regardless
of whether the app is free or not [34].
IAPs is by far the largest revenue stream in Fun Run, in-ads are more of a side thing
we have.
Nicolaj Broby Petersen, CEO Dirtybit
5.1.2 Paid
Users need to pay a flat fee in order to download a paid app. Paid apps are normally in the
categories navigation, productivity and education. In other words, more complex apps with
less competition. Paid apps are different from premium apps, because they do not have a free
version users can try before deciding if they want to pay money for the app. Paid apps can
also have premium versions, where the users need to pay more to get the extra features, this
is however very unusually. IAPs is a more common monetization method in paid apps, but as
Figure 5.2 shows, it only represents 5% of the total revenue on App Store. This is because paid
apps have far less users compared to free apps.
CHAPTER 5. BUSINESS STRATEGY
52
5.1.3 What To Choose
The app market is currently in favor of free apps, but developers should still consider which
pricing strategy to use. It is harder to increase the price, rather than lower it. To get a deeper understanding of the price strategies and their effect on downloads, Thomas Carter developed the
iOS app Alpha Combat and changed the price back and forth to see the effect [35]. Alpha Combat is in the category Game, and the game is about shooting down planes to defend a military
base. Figure 5.3 shows the number of daily downloads the game had after it was released.
Figure 5.3: Increase In Downloads When Switching From Paid To Free [35]
The first time the app went free, it was picked up by several websites that make a living of aggregating all the apps that became free or dropped in price that day [35]. Figure 5.3 shows that the
number of daily downloads increased from around 100 to more than 7,000 the day after the app
became free, and approximately 8,000 downloads the day after that. The download rate then declined, and the app was switched back to paid once again. The second time the app went free,
it became ranked as one of the top 10 most popular game apps on App Store in Japan, resulting
in a large increase of downloads once again. The counter-argument for choosing the free price
strategy is that it is a loss in revenue, because users no longer need to pay a flat fee to download
the app. However, when the app is free more users download it, and the total revenue becomes
bigger because the revenue from IAPs and in-ads increase, which is illustrated in Figure 5.4.
CHAPTER 5. BUSINESS STRATEGY
53
Figure 5.4: Revenue Increase When Switching From Paid to Free [35]
Figure 5.4 shows the change in revenue when the price is switched back and forth from paid to
free. The revenue had an exponential growth the first time the app became free, and continued
to grow after the second time it became free. The revenue increased because the app received
more downloads and thus more IAPs and in-ads impressions. However, not all app categories
are suited for this method. Thomas Carter tried the same method on another app in the app
category Lifestyle, but it did not work. He concludes, that it is because the game category has
more average downloads per app, than the lifestyle category. Therefore, more users are looking for free apps in the category game compared to the category lifestyle. Alpha Combat had
more than 80,000 downloads in only the first two months after the app was released in the end
of 2012. However, statistics from App Annie [113] shows that the app’s popularity has decreased
significantly, since it is no longer ranked on the overall ranking list. [35].
Figure 5.4 shows that the total revenue increased when the app was free, which is something the
majority of app developers experience and therefore choose the free pricing strategy. According
to an analysis from Gartner [62], the percentage of free apps will only increase and in 2015 account for 92% of the total apps available. However, with fewer paid apps, it takes less downloads
for an paid app to achieve a good rank compared to a free app. According to Distimo’s research
CHAPTER 5. BUSINESS STRATEGY
54
[36], it requires 4,000 daily downloads for paid apps to be ranked in App Store’s top 10 list, versus
70,000 for free apps. To be ranked in the top 50 list, it only requires 950 daily downloads for paid
apps, versus 23,000 for free apps. This could be a motivation for developers to chose the paid
price strategy, because apps can achieve a good rank with less downloads, and thus benefit from
the ranking list’s network effects. However, developers experience that it is relatively hard to get
a large number of downloads with an installation fee [36], which makes the free pricing strategy
the one in favor.
5.2 Apps Key Performance Indicators (KPI)
A large number of downloads does not necessarily imply that an app is popular or successful.
Obviously downloads are one of the key metrics for developers, but downloads means nothing if
the other factors are not present. There are several key factors that are important when it comes
to the app’s success; Customer Acquisition Cost (CAC), Usage, Retention Rate, Average Revenue
Per User (ARPU), Average Revenue Per Paying User (ARPPU), Average Revenue Per Daily Active
User (ARPDAU), and Lifetime Value [26].
Downloads only enable an app to succeed, they do not indicate actual success.
Brant DeBow, EVP of technology at BiTE Interactive [26]
5.2.1 KPI #1 - Customer Acquisition Cost
The first app Key Performance Indicator (KPI) is Customer Acquisition Cost (CAC). CAC is the
total cost of acquiring a new user to the app, and with high positive network effects this cost
can be as low as 0. To calculate the CAC, the business needs to tally all the advertising and
marketing expenses for a given time period, and divide it on the number of customers acquired
in that period.
C AC =
Total Costs of Advertising & Marketing
# of Customers Acquired
(5.1)
CAC is a good indicator for the marketing team to estimate which marketing strategy that has
the lowest CAC, and thus the most cost-efficient approach to acquiring new customers [29].
CHAPTER 5. BUSINESS STRATEGY
55
5.2.2 KPI #2 - Usage
To be successful with an app, it is crucial to identify the app’s Usage, the target customers and
the market surrounding them. Important factors in this KPI are, who (i.e. the users of the app),
where (i.e. where the app is used), and when (i.e. when the app is used). With a better understanding of the app’s usage, it is possible to differentiate between the app’s weaknesses and
strengths and locate the most profitable users. Hence, developers can allocate resources to the
most efficient distribution channels in relation to these users, and thus increase the app’s user
activity and thereafter the revenue.
5.2.3 KPI #3 - Retention Rate
Retention Rate is the percentage of users using the app after downloading it, the more frequently
they use it, the higher the value. Snapchat and WhatsApp are highly valued because of their large
number of active users, and thus the high retention rate. An app can have infinite number of
downloads, and still be worth nothing due to extremely low retention rate. Figure 5.5 shows the
average retention rate for each app category. The categories with the highest average retention
rate are messaging (i.e. WhatsApp), games (i.e. Draw Something), social (i.e. Facebook and
Twitter), and photo/video (i.e. Snapchat).
CHAPTER 5. BUSINESS STRATEGY
56
Figure 5.5: Retention Rate in the Different App Categories [52]
Retention is one of the biggest challenges of apps today, as 65% of users stop using the app three
months after the installation [26]. It is far more expensive to acquire new customers rather to
retain existing ones (studies shows six to seven times more expensive [28]), and thus retention
rate has a large impact on the app’s success. To understand how retention rate is calculated, an
example is provided. If an app has 100 customers on the beginning of the week, and in the end
of the week only 10 of the original 100 customers use the app, the retention rate is 10%.
Back in July 2011, in the beginning of the mobile app era, Fred Wilson of Union Square Ventures
made the “30/10/10” retention rule for mobile apps, which is even today fairly accurately. According to the rule, 30% of all users will use the app each month. 10% of the monthly users will
use the app each day, and 10% of the daily users will use the app concurrently. The rule can
be used as a good basis in the beginning, but developers should notice that these numbers can
vary a lot depending on the mobile platform the app is running on and the app’s category. Methods to increase the retention rate, are for example to use in-app currency, push notifications 1
1
Push Notifications are short messages sent to the user’s phone through the app (via a badge, alert or pop up
message) even when the app is not in use
CHAPTER 5. BUSINESS STRATEGY
57
and tutorials to make it easier for the users to understand the app. However, the retention rate
remains low if common factors like design, user experience, usability and performance are not
present [30].
5.2.4 KPI #4 - ARPU, ARPPU, and ARPDAU
ARPU, ARPPU, and ARPDAU are important business metrics analyzed in order to grow the total revenue, normally by scaling up profitable services and products the customers like. ARPU
(Average Revenue Per User) is estimated by dividing the total revenue by the number of users
in the app, which is used to understand the baseline value of an active user in a period of time.
ARPPU (Average Revenue Per Paying User) is especially useful in the freemium model, where
the free version and the revenue is driven by premium purchases and IAPs. ARPPU is normally
in the range of $5 to $20.
A high percentage of users download apps and forget about them, the ARPDAU (Average Revenue Per Daily Active User) is one of the key indicators that provides a understanding on how
successful an app really is. ARPDAU gives developers a sense on how their app is performing
on a daily basis. An ARPDAU of $0.05 is a good benchmark, but as the daily active users (DAU)
increase, the ARPDAU normally decreases. However, over the long run, apps with good monetization can achieve an ARPDAU in between of $0.15 and $0.25 [31].
5.2.5 KPI #5 - Lifetime Value
The last app KPI is Lifetime Value (LTV). Customer Lifetime Value is the average revenue a user
generates over the entire time using the app. LTV makes it easier to locate the customers that are
the most profitable, and thus focus the marketing on them rather than trying to reach everyone
[27]. LTV is directly related to the ARPU, and the average total time customers tend to use the
app, which is 1 divided by the churn rate. The churn rate is the opposite of the retention rate, it
represent the rate of users leaving the app. More specifically the formula for customer lifetime
value is given in Equation 5.2.
CHAPTER 5. BUSINESS STRATEGY
LT V = ARPU ∗
58
1
Churn Rate
(5.2)
LTV should be estimated based on the areas important for the specific app. For example, a music
app is interested in the amount of time each user listening to music, especially if they have ads
in between of the songs. While a game app rather pay attention to the number of ad impressions
per player or the ads’ click rate. By comparing the different users and how they interact with the
app, one can analyze the different trends for the most valuable users and customize the app
to meet their requirements. LTV is therefore one of the most important metrics to allocate the
marketing funds, and to improve the app to meet the most profitable customers’ needs.
5.3 Marketing
By analyzing the app’s KPIs, developers have narrowed the marketing scope to the most profitable customers, this section describes how to reach them. The approach can be very different
depending the target customer’s attributes, such as age, interests and gender. The most common way to market an app is through social networks. Without spending money, developers
can easily spread information about the app to all their acquaintances and they might spread
it further. The most popular social networks for this purpose are Facebook, Twitter and Instagram. However, in order to create a hype around the app, developers need a large network of
friends or followers, if not it can be difficult to get enough publicity around the app due to the
limited audience. Fortunately, Facebook has several different ways to market apps for a very low
price. Developers can create a like page 2 on Facebook, where they can add pictures, videos and
information about the app. When people like the page, they receive information posted in the
page. In this way, developers can inform their users with information about the app, such as
new updates. By connecting the Facebook page to Twitter and Instagram, it creates an easy way
for users to follow the app on these channels as well. Thus, by increasing the amount of likes on
the Facebook page, it also increase the probability of increasing the number of users on Twitter
and Instagram.
2
A like page on Facebook is similar to a homepage. People can like the page and will then receive information
on Facebook posted on the like page
CHAPTER 5. BUSINESS STRATEGY
59
Facebook has an enormous user base, and with its large number of advertisings, opportunities
it is a great place to start the marketing. Every ad can be customized to reach the target customers by changing the ad’s settings, such as age, language, gender and location. When the ad
is customized, Facebook estimates the potential reach based on the customization, see Figure
5.6.
Figure 5.6: The Potential Reach On Facebook Ads [53]
Figure 5.6 shows the customized Facebook ad I used when marketing the case study app to my
target customers. The ad was visible in the largest cities in Norway, for users in the age of 25 and
younger, and that understand English. Facebook calculated the potential reach for the ad to be
154,000 people, which is a good balance between a specific and broad audience according to
Figure 5.6. When all the pictures and information about the app are added in the ad, developers
need to set the ad’s budget and for how long the ad campaign shall last. The shorter it last and
the larger the budget, the faster and larger the average result becomes.
There are several different ways to advertise in order to obtain people’s attention, especially if
CHAPTER 5. BUSINESS STRATEGY
60
the budget is large. Popular TV programs, blogs and radio stations can have a large impact on
the number of downloads, and are often exploited by large enterprises. However, indie apps
usually struggle with a strict budget, and need to look on other opportunities to attract people’s
attention. Regardless the marketing budget, the best way to advertise an app is by making the
users do it for you; Word of Mouth. To get people to talk about the app, they either need to
think it is interesting or it needs to capture their attention. Ways to capture users’ attention is by
handing out flyers, hang up posters and do stunts where the target customers are located. For
example, if the target customers are teenagers from the age of 13 to 18 years, a good approach
could be to visit schools during recess. This approach takes time, but it is cheap and provides
insight in how the target customers welcome the app.
5.3.1 Word of Mouth
Word of Mouth is originally a term for passing information from person to person by oral communication [65]. However, in present time people tend to spread information more digitally,
especially through social networks. According to ComScore [64], more than half of the time
spent on social networks is done via mobile devices. In 2012, Facebook reached 3 out of every 4
smartphone users, and 60% of Twitter’s users accessed the site through mobile. Therefore, marketing apps through these channels does not only reach a large number of smartphone users,
it is also easier for the users to download the app while they already are using the phone. The
main reason why Word of Mouth is considered as one of the most efficient ways of marketing, is
because users are more apt to make a purchase or download an app based on the recommendation of someone they know. The impact of Word of Mouth depends on which channels the
word was spread, and from whom. According to Nielsen research [66], 92% of people trust recommendations from friends and family more than all other forms of marketing. Market Force
research [67] argue that, 81% of U.S. online consumers’ purchase decisions are influenced by
their friends’ social media posts. Analysis from Harris Interactive [69] shows that an average of
71% say that family and friends influence their purchase decisions and 45% say that friends or
people they follow on social networks may influence them.
An analysis from McKinsey [68] shows that 8 to 10 percent of consumers are influentials, whose
CHAPTER 5. BUSINESS STRATEGY
61
common factor is trust and competence. Influentials typically generate three times more Word
of Mouth messages than non-influentials, and each message has four times more impact on a
recipient’s decision. About 1 percent of influentials are digital influentials, such as bloggers. The
analysis later argue that recommendations within a tight, trusted network have less reach, but
greater impact than those circulated through dispersed communities. This is because there is
usually a high correlation between options from people the users trust and the network members they most value. According to the analysis, it is up to 50 times more likely that a customer
trigger a purchase when the product is recommended by a trusted person. Further, Word of
Mouth is the primary factor behind 20 to 50 percent of all purchasing decisions. This illustrates
the impact of Word of Mouth, and the importance of obtaining it to a large extent. According to
[68], Word of Mouth can be obtained in two ways; experiential or consequential. Consequential is when marketing activities trigger Word of Mouth, which occurs when consumers directly
are exposed to traditional marketing campaigns and pass on the information to others. This
effect is usually stronger than the effect from the advertises. Experiential is the most common
and powerful form of Word of Mouth, and typically accounts for 50 to 80 percent of Word of
Mouth activities. It occurs when users try the product and pass on information to others based
on their experience. Users that share their positive experiences in relation to apps are usually
super users3 . Super users in apps are of great importance as they are the largest contributors in
terms of revenue and marketing. However, since apps usually have a small percentage of super
users, the real challenge is how to obtain them.
5.3.2 Psychology
Nir Eyal, the founder of two startups and advisor to several Bay Area companies, claims to know
how to create super users [75]. According to Nir, a company that forms strong user habits, creates internal triggers in users. Internal triggers makes the user use or talk about the app without
any external promoting. To create internal triggers, the app needs to attach its services to the
users’ daily routines or emotions. For example, an app that collects all food products from every
grocery store and compare them to see which grocery stores that are the cheapest, can quickly
become a habit for users when they are grocery shopping. An app that became popular due
3
An app’s super users, are the users with highest activity and thus use the app more then an average user.
CHAPTER 5. BUSINESS STRATEGY
62
to the users’ motions (i.e. addiction) is Angry Birds. According to a survey about Angry Birds
[76], 24% of the users feel irritation, 39% mastery, and approximately 50% feel joy and relaxation
when using the app, see Figure 5.7.
Figure 5.7: The Addiction In Angry Birds [76]
Rovio, the company behind Angry Birds focused on the players emotions when they developed
the game. The game can be difficult and the players feel irritation when they fail to complete
a level, and thus feel mastery and joy when they finally manage to complete it. In this way,
the players continue to play the game because they desire to accomplish new levels. Another
addictive app is Flappy Bird. Flappy Bird is a simple game where the goal is to fly a bird between
obstacles, by tapping the finger on the screen to make the bird fly. The game looks very easy, but
it is not as the bird is very difficult to fly. This makes the players in the game frustrated because
they struggle to accomplish something they though they would master. Due to its addictiveness
it reached the top lists on both Google Play and App Store, and generated $50,000 daily only on
in-ads. However on February 11th 2014, Dong Nguyen the creator of Flappy Bird, removed the
app on both App Store and Google Play because it became too addictive, as a large number of
players were playing for hours at the time. One of the app’s reviews, collected from App Store is
as followed [99].
I would, in a heartbeat, sell my soul to Satan just to have never downloaded this app.
A player of Flappy Bird, App Store.
CHAPTER 5. BUSINESS STRATEGY
63
According to Nir, companies manufacture desire by guiding users through a series of experiences designed to create habits, and thus addiction. These experiences are called Desire Engines,
and the more users iterate through them, the more likely they are to self trigger the experiences.
Figure 5.8 illustrates Nir’s desire engine.
Figure 5.8: Nir Eyal’s Desire Engines [75]
The Desire Engine is initialized either by an external- or internal trigger. At the beginning,
the company utilize external triggers such as advertising, to start the Desire Engine. When
users continuously cycle through successive desire engines, they begin to form internal triggers through their existing behavior and emotions. When the users are internally triggered by
their own behavior or emotions, the internal triggers become part of their routine behavior.
Action is the second phase in the cycle and exploits two parts of the human behavior; motivation and ability. To increase the probability of a user taking the intended action, the designers
makes the action as easy as possible. This boost the user’s motivation, ensuring that the user act
as the designer intends through a user friendly design.
Nir continues, “What separates the desire engine from a plain vanilla feedback loop is the engine’s
CHAPTER 5. BUSINESS STRATEGY
64
ability to create wanting in the users, the predictable feedback loops do not create desire”. Hence,
by adding variability in the loop, creates a desire to continue the loop to see what the new result
might be. Variable reward is the third phase in the cycle, and describes how to add variable
rewards to create a frenzied hunting state in the user. This hunting state suppresses the areas of
the brain associated with judgment and reason while activating the parts associated with wanting and desire. Research shows that levels of dopamine surge, when the brain is expecting a
reward, hence variable rewards is one of the most powerful tools to hook the users. An classic
example is slot machines and lotteries, but variable rewards can also be present in technologies.
For example, an app’s users can receive rewards if they complete different stages while playing,
and thus continue to play in order to see the next reward.
The last phase in the desire engine cycle is the commitment, where the user is asked to do a bit of
work. The phase has two goals. First, to increase the probability that the user will make another
pass through the desire engine when presented with the next trigger. Second, make the user
give a combination of time, data, effort or money before trigger a new cycle. The commitment
phase is not about generating revenue, it is rather about actions that improve the app for the
next cycle, for example invite friends to the app. The actions improve the app for the user, and
thus make the trigger phase more engaging and the action phase easier. By analyzing the Desire
Engine, companies can trigger an addiction or habit in the users, and hence create super users
that may promote the app through Word of Mouth.
Chapter 6
Osterwalder’s Business Model Ontology
The definition of a business model vary depending on whom you ask, and there are several different descriptions flourishing on the Internet. This thesis uses Osterwalder’s definition of a
business model, and further his approach and framework to present a business model for the
case study app, Guess This Sound. An overall description of a business model is, a representation of how a company buys and sells goods and services, and the cost and revenue related to
this. To be more specific the definition of Osterwalder’s business model ontology is as followed,
“a conceptual tool that contains a set of elements and their relationships that allows expressing
a company’s logic of earning money. It is a description of the value a company offers to one or
several segments of customers and the architecture of the firm and its network of partners for creating, marketing and delivering this value and relationship capital, in order to generate profitable
and sustainable revenue streams” [73].
The definition is based on his extensive studies through work within the field, and resulted in
a complete business model ontology combining what he found to be the most important and
necessary areas in his studies. This thesis focus on his business model ontology, because it gives
a well defined and understandable way to present and analyze business models, covering most
of the important aspects. This chapter provides an overall description of Osterwalder’s business
ontology. The ontology is presented in-depth in relation to the case study app.
65
CHAPTER 6. OSTERWALDER’S BUSINESS MODEL ONTOLOGY
66
6.1 Ontology
Osterwalder’s research provide a framework for companies to analyze and present their business
model, in other words an ontology used to accurately describe the company’s business [73]. The
business model ontology consists of nine building blocks (i.e. core capabilities, partner network,
value configuration, value proposition, customer relationship, distribution channel, target customer, cost structure and revenue streams), which is categorized into four areas; Infrastructure,
Offer, Customer and Finance, this is illustrated in Figure 6.1.
Figure 6.1: Osterwalders Building Blocks [18]
According to Osterwalder, the four areas are the fundamental elements in a business model, and
are presented as followed [73].
• Offer: Represents what type of business the company operates in, and the products and
value propositions it offers to the market.
• Infrastructure: Represents how and with whom the company efficiently perform logistical or infrastructural tasks.
• Customer: Defines the company’s target customers, how to build a strong relationship
with them, and how to deliver products and services to them.
• Finance: Describe the cost structure and revenue stream; the business model’s sustainability.
CHAPTER 6. OSTERWALDER’S BUSINESS MODEL ONTOLOGY
67
6.1.1 Offer
The first area of the business model ontology is Offer. It covers all services and products the
company offers to its customers, i.e. the company’s livelihood, and thus the most important
area in the ontology. The offer area contains one element; Value Proposition.
Value Proposition, is the collection of products and services a business offers to meet the need
of its customers. According to Osterwalder, a company’s value proposition is what distinguishes
the company from its competitors. The value proposition provides value through different attributes such as performance, design, cost reduction, newness, risk reduction, price and usability. By analyzing these attributes, the company obtains a clear overview of its product’s value
and can compare it to its competitors. The company will also gain insight in the product on a
more detailed level, and thus see new opportunities to improve it.
Performance is how well the product or service perform. The criteria for what a good performance is, depends on what kind of product or service to be assessed. For example, computers
must be fast and reliable, while a banking software focus on the security and trustworthy.
Design is basically how the product looks like, for some product this has not a large impact on
the customers’ value, while other products such as cloths it is very important.
Cost reduction is the case when value is created by reducing the customer’s cost after purchasing the product. The cost reduction does not need to be a reduction in money spent, it can also
be a reduction in effort or time. For example the product can offer tasks that is less time consuming compared to the tasks that needs to be done without it, such as vacuum cleaners.
Newness is to which extent the product differ from existing products. In other words, why
should customers buy the product compared to other existing products. The company needs
to convince the customers, that its product is different and better than the products already
available.
CHAPTER 6. OSTERWALDER’S BUSINESS MODEL ONTOLOGY
68
Risk reduction is the case when value is created by reducing the customer’s risk. For example,
by introducing an electronic payment system on a web page, the customer’s risk is reduced during a purchase, due to the secure money transferring.
The price attribute describes the product’s price model, and its price. 5.1 presents the three
price strategies related to apps which is freemium, premium and paid. Other price methods
implemented are IAPs and in-ads.
Usability is the last attribute and defines how user friendly the product or service is. Where,
when and how to use it, are important criteria to analyze when creating the product. Apps are
particularly vulnerable to this attribute, because users can delete the app if it is difficult to use
or does not meet their expectations.
6.1.2 Customer
The Customer area is the second area in the ontology, and defines the relation between the company and its customers. This area provides the understanding on whom the target customers
are, which distributions channels to utilize in order to reach them, and how the company maintains its relationship with them.
Target customer is the most important element in the customer area, and has a large influence on the whole business model. The target customers must be carefully analyzed with no
or little misinterpretation. Misinterpretations can lead to inefficient distribution channels, miscalculations in the value proposition such as wrong pricing strategy or usability, or even wrong
focus when developing the product. The target customers can either be consumers or other
businesses. In relation to consumers as the target customers, different criteria are for example
needs, gender, age, location and interests.
In order to reach the target customers through marketing, the company must utilize channels,
i.e. Distribution Channels. The channels connect the company’s value proposition with the target customers in order to generate value between them. The target customers are approached
CHAPTER 6. OSTERWALDER’S BUSINESS MODEL ONTOLOGY
69
either directly through sales team, or indirectly through third-party sellers. Distribution channels are used to trigger the Customer Buying Cycle, which contains the different phases a customer visits before and after a purchase. The company’s Customer Buying Cycle represents how
it interacts with the customer in different phases, and are as followed Awareness, Pre-Purchase,
Purchase, Implementation and Post-Implementation [96], see Figure 6.2.
Figure 6.2: Customer Buying Cycle [96]
Awareness refers to the phase when the customer becomes aware of the product or service
through the distribution channels. Pre-Purchase is the phase when the customer compare what
the company offers with other competing products or services. To capture the customer’s attention, the company needs to have sufficient information about the product easily available for
the customers.
Purchase refers to the phase when the customer has decided to pay for the product or service.
Because of the amount of information and security in a purchase, it is important to let customers choose between different payment options. Electronic billing systems, could lower the
barrier by making it safe and easy for the customers to complete a purchase.
Implementation is the delivery phase of the product or service. In smaller deals the customers
can simply pick up the product, whereas in larger deals the implementation process can take
several months. For some businesses, this is very important because it builds brand satisfaction
CHAPTER 6. OSTERWALDER’S BUSINESS MODEL ONTOLOGY
70
and a satisfied user base. However, in the app market this phase is not relevant, because the
customers receive the app the second they download it.
Post-Implementation phase is where the customers are using the product. This phase is about
maintaining the customer relationship, i.e. solve problems and provide support through support channels. The phase is also concerned with acquiring new customers.
Customer Relationship is the third element in the customer area, and describes the relationship between the company and its customers. The goal is to optimize the acquisition of new
customers, retain the existing ones and gain profits from sales over time. Since it is less expensive to retain customers rather than acquire them, the company must focus on providing good
support and create a good relationship with its customers to increase the probability that they
stay.
6.1.3 Infrastructure
Infrastructure is the third area in the business model ontology, and describes how a company
creates value in order to provide value proposition and maintain the customer area. The infrastructure area contains three building blocks; Partnership Network, Value Configuration and
Core Capabilities.
The Partnership Network represents the partnerships a company involves itself with, and how
the resources are distributed amongst them. Examples of partnerships are investors and business to business agreements.
Value Configuration describes how the company configures its resources and activities in order
to create its value i.e. Value Proposition. The main attribute in value configuration is configuration type, which describes the type of configuration used to create value. The three different
configuration types that Osterwalder presents are discussed in 4.2; value chain, value shop and
value network. Value configuration is divided into activities, where each activity is a specific task
that the company perform. Activities have different levels to make the company distinguish be-
CHAPTER 6. OSTERWALDER’S BUSINESS MODEL ONTOLOGY
71
tween its primary activities and its support activities. All the activities are connected through
the value configuration, where they collaborate to generate value.
Core Capabilities is the last building block in the infrastructure category. It describes how the
company use their assets to create, produce and offer products and services to the market,
normally in repeatable actions. The company provides its value proposition to its target customers by using their capabilities. The core capabilities can be divided into different resource
types which is humans, tangible and intangible. Human resources is available through peoplebased skills and employees in general, and are usually the most important resource. Tangible
resources are equipment or other physical values within the company, such as interior, product
equipment and decoration. Intangible resources are non-physical values, such as patents and
brands.
6.1.4 Finance
Finance is the final area in Osterwalder’s business model ontology, and consists of the revenue
streams and cost structure of the company. The area is the basis for running a business, and
the outcome of the configuration in the other areas explained. It represents how the company
intends to make money and survive as a business. The Revenue Stream building block measures the company’s ability to transform its value proposition into revenue. The building block
describes the company’s pricing strategy and how to increase the revenue. The Cost Structure is
the final building block, and measures all the costs related to creating, marketing and delivering
products to the customers.
Chapter 7
Guess This Sound - The Case Study
Application
This chapter provides an overall description of the case study app, Guess This Sound, and later
a complete business model for the app based on Osterwalder’s business model ontology. Afterwards, the chapter presents an analysis of the different marketing approaches utilized and their
effect. Further, an analysis of the case study app’s network effects is provided, and the modified
epidemiological model (SIR model) is successfully applied. At the end the app is analyzed in
relation to the key performance indicators.
7.1 The Game
Guess This Sound is the case study application in this thesis. It is developed based on the same
idea as Draw Something except a few differences, players make a sound of the word they pick
instead of a drawing. If the player choose the word lion, he records a sound he associates with
a lion. He sends the sound to his opponent, that tries to guess the word picked (i.e. lion) based
on the sound recorded. In Draw Something he had drawn a lion instead of recording a sound.
Players in Draw Something can use bombs to remove letters in order to make it easier to guess
the word, in Guess This Sound players can use notes. When a note is used, every second letter in
the word are correctly filled in, making it easier to guess it. If the player guesses the correct word
before the time runs out, he receives experience (i.e. points) which is determined by the time
72
CHAPTER 7. GUESS THIS SOUND - THE CASE STUDY APPLICATION
73
he used and the number of rounds played with the opponent. When players receive enough
experience, they gain a new level and might achieve a higher ranking among their friends in the
game.
If the word is correctly guessed, the player that sent the sound receives coins depending on the
difficulty of the word chosen to record the sound of. In Draw Something, players can use their
coins to buy new drawing colors or bombs. In Guess This Sound players can buy experience,
levels, notes or already recorded sounds. Players receive extra coins if they invite friends or
share their sounds on Facebook, and thus Facebook’s network effects are utilized. To give the
reader a deeper understanding on how the game works, figures and descriptions of the app are
provided in the next subsections. In some of the subsections, there are two pictures of the same
view in the app, this is to show how the app’s design has changed during its development.
7.1.1 Main Menu View
The Main Menu View appears when a user correctly logs in. This is where the player creates
a new game, or navigate to other views by clicking on the buttons Games or Menu. Figure 7.1
shows how the Main Menu View has changed in design.
CHAPTER 7. GUESS THIS SOUND - THE CASE STUDY APPLICATION
74
Figure 7.1: Guess This Sound Main Menu View
If the player clicks on Friends, New Game or Random, a new game is created with a friend or a
random player. When the button Games is clicked, the Game View appears, which contains the
player’s current games. If the Menu button is clicked, the Menu View appears, where the player
can change the game settings, open the game’s shop, compare his rank with friends, or log out
of the game. In Figure 7.1, the players coins are represented in the top left corner, and the notes
in the top right corner. The player’s profile picture is located in the circle under the game’s logo,
Figure 7.1 shows the game’s default picture. By clicking on the profile picture, players can upload
their own picture. Below the profile picture, the player’s level and experience are represented.
The experience is calculated based on the time used to guess the correct word multiplied with
the amount of rounds completed. Equation 7.1, calculates the experience achieved from the
rounds completed, by dividing the rounds on 10 and plus the result with 1. The result is multiplied with the remaining time to guess the correct word, see Equation 7.2. Hence, the player
receives more experience the more games he and his opponent have played. Players have 100
seconds to guess the correct word, and when the time is up the game is over.
CHAPTER 7. GUESS THIS SOUND - THE CASE STUDY APPLICATION
Round Experience = 1 +
Completed Rounds
10
Total Experience = Round Experience ∗ T i me
75
(7.1)
(7.2)
When enough experience is earned, the player achieves a new level. To make it harder to achieve
new levels as the player levels up, I created an algorithm which is represented in Equation 7.3.
Next Level = XP Last Level + (Current Level + 1) ∗ 100
(7.3)
Equation 7.3 calculates the experience needed to achieve a new level. This is calculated by taking the player’s current level plus 1, and then multiply it with 100. Thereafter, add the result to
the experience needed for the last level. The algorithm increases the difficulty to achieve a new
level proportionally with the players’ current level, which is illustrated in Figure 7.8.
Figure 7.2: Experience Needed To Achieve a New Level
7.1.2 Menu View
When the player clicks on the button Menu in Figure 7.1, the Menu View appears, shown in the
middle of Figure 7.3. The picture to the left in Figure 7.3, was the previous design of Menu View.
If the Settings button in the figure in the middle is clicked, a window appears where the user can
change email address and profile picture. The player can click on the Ranking button, in order
to compare his experience with his friends in the game. By clicking on Shop, a new view appears
CHAPTER 7. GUESS THIS SOUND - THE CASE STUDY APPLICATION
76
which contains the different items players can buy with the coins earned from playing, shown to
the right in Figure 7.3. In this view, the players can also buy more coins with real money, through
IAPs connected to Google Play and App Store.
Figure 7.3: Shop View and Menu View
7.1.3 Game View
If the player clicks on the button Games in Figure 7.1, the Game View appears. This view presents
the player’s current games, see Figure 7.4 to the left. The view has two lists, one containing
the games waiting for the player to play; Your Turn, and one containing the games waiting for
the opponents to play; Their Turn. If the player clicks on a game in Your Turn, two things can
happen. First, the Pick a Word window in the middle of Figure 7.4 appears, if it is the player’s
turn to record a sound. This is where the player picks a word between the tree random words
displayed, and then record a sound based on that word. If the words are too difficult, the player
can click on the New Words button in total three times, and receive three new words for each
click. Second, the Coin View window to the right in Figure 7.4 appears, if it is the player’s turn
to guess the opponent’s sound. The player receives coins because the opponent guessed the
CHAPTER 7. GUESS THIS SOUND - THE CASE STUDY APPLICATION
77
correct word.
Figure 7.4: Game Views
7.1.4 Guess The Word View
In the Guess The Word View, the player tries to guess the word by listening to the sound the
opponent recorded, see Figure 7.5. The player has 100 seconds to guess the correct word, and
can use a note to make it easier. In Figure 7.5 to the right, the guess is incorrect, but the player
still has 56 seconds left to try other words (the correct word is eagle). When the time decreases,
letters that are not part of the word disappears (four in total), which makes it easier for the player
to guess the correct word. The two pictures in Figure 7.5 show how the design in the game has
changed due to feedback from users. Figure 7.5 to the right is more intriguing than the figure to
the left, thus it illustrates the importance of having a great design in order to increase the user
experience.
CHAPTER 7. GUESS THIS SOUND - THE CASE STUDY APPLICATION
78
Figure 7.5: Guess The Word View
7.1.5 Recording View
When the player choose a word in the Pick a Word view, in the middle in Figure 7.4, the Recording
View appears. In this view the player records the sound associated with the word picked, shown
to the left in Figure 7.6. When the player clicks on the microphone, the circle starts counting
down from 7 while the player makes the sound. When the sound is recorded, the player can
listen to it, share it on Facebook, or send it to the opponent. When the sound is sent, a window
appears with a fun fact. The fun facts are included in the app to “hide” the loading time if the
network connection is bad.
CHAPTER 7. GUESS THIS SOUND - THE CASE STUDY APPLICATION
79
Figure 7.6: Record The Sound View
7.2 The Business Model
Guess This Sound is a self-developed app, created for the purpose of obtaining the necessary
data to analyze the app market in-depth. This section presents a complete business model for
the app by using Osterwalder’s business model ontology, the areas discussed are as followed
Offer, Customer, Infrastructure and Finance
7.2.1 Offer
This section covers the products and values a company offer to its customers, through the Value
Proposition.
Value Proposition
Value Proposition is the collection of products, services or value covering the customer’s needs.
The case study app provides two elements in the collection, the product (the game itself ) and
the support through the app’s website, Facebook page and Twitter profile.
CHAPTER 7. GUESS THIS SOUND - THE CASE STUDY APPLICATION
80
Element One - The Game The first element is the game itself, which is the core value offered
to the customers. The game offers entertainment through the gameplay where players send
sounds to each other, and later try to guess the word based on the recorded sound. The game
also offers educational value to the users, since they need to type in the correct word for the
sound, and thus practice spelling. The relevant attributes in the value proposition for element
one are design, newness, price and usability. These attributes are what distinguish the app from
other apps in the market.
When I developed the app, design was something I emphasized. The design had to be simple
to make it user friendly, but also intriguing. Since the app is in category game, it was very important to create the design in a way that users felt like they were playing a game. Every detail,
such as the buttons’ design, the different fonts, and the gaming sounds were carefully considered. When developing an app alone, it is easy to overestimate its user friendliness, and thus
feedback from the users are very important. The app has undergone a huge change due to feedback, which is evident by comparing the figures in 7.1. Because of limited experience on how
to create a design, I hired a designer to design the background and the icons in the app. This
made a large difference on the app’s appearance, and developers with less experience in design
should consider this.
Newness refers to the uniqueness of the app idea, and what distinguishes it from already available apps on the market. There exists a large number of apps with different word game concepts,
but it is only one app that has the exact same concept as the case study app, which is Make a
Sound. Make a Sound is however not functional, which makes the concept to Guess This Sound
unique. To be the first app with an unique idea is a great advantage, because people tend to
download the most popular apps when searching for new apps.
The third attribute in the value proposition is price. Guess This Sound is currently free, with
no premium version available. The app’s price has not been changed back and forth from free
to paid as the example in 5.1.3. This is because of the limited time the app has been available,
which made the free price strategy a necessity in order to obtain enough downloads and thus
CHAPTER 7. GUESS THIS SOUND - THE CASE STUDY APPLICATION
81
enough data to analyze. In-ads and premium version are scheduled to be implemented later, if
the app gains popularity. IAPs are implemented, and are analyzed in 7.2.4.
Usability is the last attribute for this element in the value proposition. The app’s design has a
large impact on how user friendly the app is. It is important to set the position of every button
and text in relation to what users are accustomed to and how the human mind perceive things.
The functionalities are also important, because the app must behave like the users expect it to.
When the app was launched, a number of users complained about features they missed in the
game. For example, when players guessed the correct word, they needed to continue the game
by choosing a new word, record a sound of it and send the sound back to the opponent. If not,
the game would not be updated on the servers, and thus the players had to start the game from
the beginning and guess the word again. This limited the places players would play the game,
because most players were not comfortable by making strange sounds among others. This was
later fixed and it is now possible to guess the correct word, quit the game and send a sound back
later. After adding this feature, the app’s user activity increased significantly.
The three criteria in the usability attribute are where, when and how. The app is used on places
where players can create sounds without finding it embarrassing, hence in their own comfort
zone. Thus, the when criterion is when the players are in their own comfort zone. In the first version of the app this was a large barrier, because players had to record a sound after they guessed
the correct word, and thus limited the app’s usage to the players’ comfort zone. However, after
creating the feature that made it possible for players to guess the correct word and later send
a sound back, it became possible to use parts of the app outside the comfort zone. For example, players could now guess their opponents’ sounds and later when they entered their comfort
zone create sounds and send them back. This removed some of the app’s limitations, and thus
increased the activity within the app.
How users use the app is the last criterion. In order to make the users interact with the app as I
intended them to do, I created a tutorial. The tutorial provides a guide for first-time users of the
app, to make them quickly understand how to interact with it. The design is also carefully im-
CHAPTER 7. GUESS THIS SOUND - THE CASE STUDY APPLICATION
82
plemented to maximize the app’s usability. However, the sounds users record are limited to their
own imagination, and players do not enjoy the game if the sounds they receive are boring. In
order to increase the probability for users to create good sounds, the random words they could
choose from had to be fun and easy. Based on information gathered from the target customers,
I was able to identify the four most popular sound topics; musicians, celebrities, human sounds
and animal sounds. I collected in total 1,000 words that the players can choose from.
Element Two - Support The second element is the support I give to the users through my support channels; Facebook, the website, email and Twitter. The website1 has a limited amount of
functionalities. Its primary objective is to direct users to the rest of the support channels, and
make it easy for them to download the app by clicking on either the Google Play icon or the App
Store icon. Hence, the website is not a place to share information, rather a place that connects
the support- and distribution channels. On the other hand, the Facebook like page Guess This
Sound, is a place where users can post and receive information. When a user like the page, he
can post and receive information from the page.
The Twitter profile @GuessThisSound has similarities with the Facebook page; users that follow
the profile receive the messages posted in it, or can write messages that will appear in the profile.
It is however two main differences between the Twitter profile and the Facebook page. Firstly, I
can use the Twitter profile to follow others’ profile, and it is approximately 15% chance that they
will follow me back. Hence, the Twitter profile has the potential to gain a bigger audience than
the Facebook page, because it is not possible to invite people you do not know to the Facebook
page. Secondly, it is a limited amount of information and pictures the Twitter profile can be
customized with, and thus it is harder to make an impression on people following the profile.
Facebook and Twitter provide the app’s users different value, and developers should therefore
consider utilizing both. The last support channel is my email, and is used to answer direct complains about the app. The relevant attributes in element two are design, price and usability.
Design describes the design of the website, the Twitter profile and the Facebook page. To make
1
The case study app’s webpage is www.GuessThisSoundApp.com
CHAPTER 7. GUESS THIS SOUND - THE CASE STUDY APPLICATION
83
people understand the app’s concept without too much information, the support channels need
to contain the best pictures of the app and a succinctly description. The website’s design is simple with a large picture of the app’s logo and icons that direct the users to the other channels.
The Twitter profile has the app’s logo as the profile picture, a brief description of the app and a
link to the website. The Facebook page has more information about the app, the app’s logo as
the profile picture, pictures from the game and links to the other channels.
The price of the support channels is free to the users, because their feedback is crucial for further
improvements of the app. The support channels’ usability is important, in order to provide an
easy way for users to give feedback. The usability also improves the users’ first impression of the
support channels.
7.2.2 Customer
This section describes the target customers in Guess This Sound, the distribution channels used
to reach them and how to build and maintain the relationship with them.
Target Customers
When developing the game, the main focus was to make it fun and user friendly. The game’s
design and its functionalities needed to be facilitated in relation to the users it tries to attract.
Therefore, I created the criteria for the game’s target customers, in order to develop the game
based on these criteria. The criteria are listed as followed.
• Age: From 13 to 25.
• Gender: Both male and female.
• Language: Understand English.
• Location: Places where people understand English, first of all Norway.
• Need: The need of having an app to use in the spare time.
CHAPTER 7. GUESS THIS SOUND - THE CASE STUDY APPLICATION
84
I decided to focus on users in the age of 13 to 25, because they are usually interested in apps in
the category game. I chose to develop the app in English, because I aimed to attract users inside
and outside of Norway. The location is therefore limited to places where people understand English, and with Norway as the primary location, because it is easier to marketing from my own
location. Users in the age of 13 to 25 do normally have a need of an app in their spare time,
usually to pass time. Regarding the long tail concept in relation to the app’s target customers,
the app aims at the bottom of the head (i.e. the body) where Draw Something is placed in Figure
4.1. It is uncertain where the app eventually ends up, but currently it is in the long tail, approximately the same place as the Meny app.
When I developed the app suited for the criteria, I used friends and family that matched the target customer in order to receive inputs from a user’s perspective. To attract the target customers,
I made the app look like a fun game, where the buttons are skewed and randomly jumps up and
down when hitting other buttons. The colors in the game are usually blue, white and red. About
70% of the design is blue, because according to research [88] blue is the most popular color. Soft
blues calm the mind and aid concentration, while the red color gives a physical reaction. White
stands for about 15% of the colors in the game, and is usually used on text and icons. White
symbolize simplicity and clarity, but is also a very good combination with the blue color, and
makes it look even softer. The last color commonly used in the game is red. According to [88],
red grabs the users’ attention first because it appears to be nearer than the other colors and is
commonly used to signal danger. I therefore used red on buttons that delete or quit the game,
making the users think twice before clicking on it. Buttons that continue the game have the
color green. The app’s sound effects from buttons and achievements in the game, are carefully
picked out to strengthen the user experience. I studied popular games such as Mario and Draw
Something to get inspiration for the sound effects to use in the app. An example of a sound effect in the app, is if a user guess the correct word a sound is played to emphasis that the guess
was correct. The last think I was especially concerned with, was to integrate Facebook in the
app. A high percentage of the target customers are active on Facebook, and this would let users
invite friends or share the sounds recorded on the popular social networks. Thus, the app could
benefit from Facebook’s network effects.
CHAPTER 7. GUESS THIS SOUND - THE CASE STUDY APPLICATION
85
Distribution Channels
The target customers had a large impact on the determination of the distribution channels, and
the conclusion was that the primary distribution channels to utilize were social networks, such
as Facebook, Twitter and Instagram. The app’s Facebook page and its profile on Twitter and Instagram were created and promoted before the app was released. The channels were effectively
utilized before the release, in order to create a hype around the app for the day it was published.
Other distribution channels I used to reach out to the target customers were app review sites,
face to face and the media. Review sites usually write about apps they find interesting or drop
in price, which Thomas Carter took advantage of in the paid to free analysis in 5.1.3. However,
there are review sites where developers can submit their apps for free and get an honest review.
The review sites have normally a large number of followers, and is an efficient approach to gain
more downloads. The review’s waiting time is however long, and developers must be prepared
for a bad review.
When the app was published, I marketed the app through face to face by handing out flyers to
the target customers on schools and shopping malls. Right after an app is released, the app has
few downloads and people need more persuasion before downloading it. Therefore, face to face
is a great way to promote an app at an early stage, and can give developers valuable feedback on
how the target customers welcome the app. However, promoting face to face is time consuming and the number of people one can reach is limited. Therefore, I only exploited this approach
actively at an early stage, and later focused on distribution channels with a larger reach i.e. Facebook.
Developers should consider to use bloggers or celebrities to promote the app, since they can
have a big impact on the app’s popularity. They usually have a large number of followers, that
are interested in their daily lives. Hence, they influence people to a larger extent than normal
marketing. However, they are usually expensive and the waiting time long. I experienced this
myself, when I tried to make a friend with a popular blog to write about the app, it never hap-
CHAPTER 7. GUESS THIS SOUND - THE CASE STUDY APPLICATION
86
pened.
The app’s Customer Buying Cycle is rather simplified compared to the description in 6.1.2. The
customers get aware of the app through the distribution channels described, and continue to
App Store or Google Play if they become interested. The next phase is the Pre-Purchase, and this
is where the app needs to attract the customers’ attention in order to sell itself. To do this, I uploaded the maximum amount of pictures from the highlights in the app and wrote a succinctly
interesting description of the app in both English and Norwegian. The Norwegian description
is only visible on the Norwegian market. Afterwards, I created and added a tutorial video of the
app, to easily illustrate the app’s concept. The customers’ first impression of the app is through
the description and pictures on the app stores, and it is therefore important that developers
carefully consider the type of information in this area. If the app’s impression do not attract the
customers’ attention, they do not download the app, even if the app is a perfect match for what
they are looking for. If they do download the app, they enter the Purchase phase. The case study
app is free, and customers do only need to accept the app’s requirements before downloading it. If they are accepted, the customers continue to the Implementation phase. This phase
is not relevant for apps, because apps are delivered to the users the second they download it.
Hence, the customers are now in last phase, the Post-Implementation phase. The customers are
now users of the app and can provide useful feedback through the support channels. Feedback
is highly valuable, because it provides insight in the app from a user’s perspective. The PostImplementation phase is also concerned with improvements in the app such as new design and
functionalities.
Customer Relationship
Customer Relationship focus on acquiring new customers, and to maintain the app’s current
customers. It is important to maintain the current customers, because loyal customers generate
more money through IAPs and in-ads, than new customers. It is also far more expensive to
acquire new customers. I maintain the customer relationship through my support channels, by
replying on feedback, remove bugs, and provide users with information about the app, such as
updates. To build customer relationship, I utilized my distribution channels. The impact from
CHAPTER 7. GUESS THIS SOUND - THE CASE STUDY APPLICATION
87
each channels is described in 7.3.
7.2.3 Infrastructure
The Infrastructure area describes how Guess This Sound as a business can create value, in order to provide value proposition and maintain the customer area. This is done through the tree
building blocks Partnership Network, Value Configuration, and Core Capabilities.
Due to the limited time I had to develop the app, I partnered up with two friends to make the job
easier. The task allocation was evident, I developed the app and they were concerned with the
marketing. We made a verbal agreement to share the app’s profit among us three. Unfortunately,
because of the lack of work ethics the partnership did not turn out as expected. The team consist
now of me and one of my friends, but this will most likely change since I am still doing most of
the work. No investors are currently acquired, but it could be relevant if the app becomes very
popular. The Value Configuration for Guess This Sound as a business, is based on the Value
Chain concept.
Value chain
The inputs for application is the first stage in the value chain, and is concerned with the app’s
idea generation and market evaluation. I had two criteria in my idea generation. Firstly, the app
had to be in the category game, because the category has a high average download rate and it is
easy to create virtual goods and thus implement IAP. IAPs were important in order to analyze the
app from an economic perspective. Secondly, the app’s concept had to be similar to a previously
popular app. In this way, I could use the popular app as a guidance for the self-developed app.
I came up with the idea of creating Guess This Sound, based on the concept of the popular app
Draw Something. Then, I evaluated the market potential and decided the target customer for
the app. The target customers represent a large part of the potential app marked, and thus the
app could potential end up in the head of the long tail concept. Further, I searched for potential
competitors to determine how I could differentiate my app from others. It was only one app
with similar idea; Make a Sound. I tested the app and quickly discovered that it did not work.
Competition from apps with the same concept was therefor strictly limited, and I continued to
CHAPTER 7. GUESS THIS SOUND - THE CASE STUDY APPLICATION
88
identify other challenges. The main challenge was the time I had to develop the app, because I
had to release it no later than April 1st, in order to obtain enough data to analyze.
The application development stage is concerned with the app’s development and testing phase.
I hired a friend with digital design experience to create the app’s design, which had a large improvement of the app’s appearance. I decided to develop an HTML5 app by using the programming language Javascript, with PhoneGap, Bootstrap and Jquery Mobile as frameworks. I developed the app in HTML5, because I had experience with HTML5 and the app could then run on
both Android and iOS. I took advantage of both Black Box Testing and White Box Testing. However, I did not create automated tests, because from previous experience I knew it was very time
consuming. I was rather thoroughly when I tested the app, and used several approaches to see
how the code behaved. To get inputs from a users’ perspective, I made friends and others test
the app, which gave me useful information regarding how they interacted with it. However, I
regret that I did not spend more time testing the app, since I had to correct several bugs after it
was published.
The application delivery stage refers to the phase when developers publish the app, and reach
out to the target customers through distribution channels. Before the app was available, I promoted it via the distribution channels to create a hype around it. When it was published on both
App Store and Google Play, I utilized the distribution channels in different time periods in order
to analyze their effect separately, the analysis is presented in 7.3.
The market and sales stage is the last stage in the app’s value chain, and represents a larger investment in terms of money. Currently, this stage is not entered as only small investments have
been performed. If the app becomes very popular, I will consider reaching out to investors to
obtain funds to marketing and to develop a backend database2 for the app. The support layer
in the value chain represents my support channels, and the end user layer is my target customer.
2
A back-end database is a database that is accessed by users indirectly through an external app, rather than
accessing the data stored on the app itself [91]
CHAPTER 7. GUESS THIS SOUND - THE CASE STUDY APPLICATION
89
The Core Capabilities is the last building block in the infrastructure category, and describe the
app’s resources (human, tangible and intangible). The resource type human, represents my experience in relation to developing HTML5 apps and my limited marketing knowledge acquired
through different jobs. Through the research in my thesis, I also gained insight in how the app
market works, which I utilized regarding the case study app. The resource type tangible represents the physical values in the app’s business, such as the computer I develop the app on,
the servers storing the app’s data, and my team member’s father’s copy center used to print free
posters and flyers. The business has only one intangible resource; the name of the app.
7.2.4 Finance
Finance is the final category of Osterwalder’s business model ontology, and contains the building blocks revenue stream and cost structure. Figure 7.7 illustrates the overall cost and revenue
streams for Guess This Sound as a business.
Figure 7.7: Guess This Sound - Cost and Revenue Stream
CHAPTER 7. GUESS THIS SOUND - THE CASE STUDY APPLICATION
90
The revenue streams represents how I intend to generate money in Guess This Sound. Guess
This Sound is currently a free app with no ads or premium version available. The only potential
revenue comes from IAPs, but if the app becomes more popular I will display an ad for each
time a player sends a sound. If Guess This Sound becomes very popular, a premium version
will be considered, but this is currently not in focus. IAPs represent 76% of the total revenue on
App Store in USA, and is the largest revenue stream in apps. Therefore, I chose to not ruin the
user experience by adding in-ads, before the app became popular enough for users to be okay
with it. The current total revenue from IAPs is only $2.58, but this increases proportionally with
the app’s user activity, and thus the number of downloads. According to research [93], only 3%
of the users spend money in popular apps, and they spend on average $14. Table 7.1 provides a
rough estimation of the increase in potential revenue for the case study app’s entire lifetime. The
numbers used in the calculation is collected from the servers, where I store all the data collected
from the communication between the app and the server.
# Users
Push Notifications
$ from in-ads
$ from IAPs
Total $ From Lifetime
7,000
11,436
$106.3
$2.58
$1,278.84
70,000
114,360
$1,106.3
$5,418
$18,693.6
700,000
1,143,600
$11,063
$54,180
$186,936
7,000,000
11,436,000
$110,630
$541,800
$186,960
70,000,000
114,360,000
$1,106,300
$5,418,000
$1,869,600
Table 7.1: Expected Revenue
The app has not generated any revenue except the $2.58, which makes the calculation somewhat speculative. Therefore, Table 7.1 do only provides an understanding of the factors that
contribute to the revenue generated, and thus should not be viewed as a stipulated calculation
for apps in general. I utilized the collected numbers from the server in relation to the 7,000
downloads Guess This Sound had on May 5h, to calculate the potential revenue relative to the
user growth. With 7,000 users on May 5th, there were 11,436 notifications sent from April 5th to
May 5th. In other words, there were 11,436 games played. In-ads (in the future) are displayed
when a game is played, resulting in 11,436 ad impressions. Numbers from studies in 5.1.1, show
that 1,000 ad impressions account for $9.3 in revenue. 11,436 impressions therefore account for
CHAPTER 7. GUESS THIS SOUND - THE CASE STUDY APPLICATION
91
$106.35. The IAP revenues listed in Table 7.1 represents the total revenue from IAPs in the app’s
entire lifetime, where 3% of the users purchase goods in the game for $2.58 each. The revenue
calculated from in-ads is the revenue that CPM and CTR generate every month. The total revenue calculated from both in-ads and IAPs in Table 7.1, is based on the app’s lifetime of one year,
and thus 12 months with advertising. The revenue from IAPs will most likely be higher than the
calculations in Table 7.1, because they are calculated based on an average of $2.58, and not $14
which is the average according to [93]. However, due to limited data obtained in relation to the
app’s revenue, I chose to use $2.58.
There are two other revenue streams in Figure 7.7 not discussed; sponsors, investors and cofounders. Currently no money from sponsors have been collected, but I am waiting for response
on my application to Spark3 and Ungdomsfondet 4 . There are neither any investors obtained,
and if this becomes necessary depends on the app’s popularity. The money invested from the
co-founders (me) is the substitute of the total cost; NOK 21,121.
The cost structure is the last of all building blocks in the ontology. Apps are digital goods, and
thus the marginal cost for producing an extra entity is equal to 0. The costs in relation to developing apps is the time used, and optional cost such as design and sound effects. Developers
must pay a registration fee in order to publish the app on App Store and Google Play, which is
NOK 675 and NOK 150 respectively. App Store and Google Play also take 30% of the app’s revenue, which is together with the registration fee, represented with the red arrow to App Store
and Google Play in Figure 7.7. Hence, the costs are primarily related to maintaining servers and
marketing the app.
The uppermost red arrow in Figure 7.7 represents the cost for maintaining and expanding the
server capacity. The cost is usually minimal at the beginning, but increases proportionally with
the app’s user activity. I did not have the experience to develop a back-end database, and therefore utilized a service that did it for me, the service is provided by the company Parse. Parse
3
Spark is a support organization at NTNU that helps students starting up their own business
Ungdomsfondet is a support organization in Norway that helps adolescent starting up their own business or
realization of an idea
4
CHAPTER 7. GUESS THIS SOUND - THE CASE STUDY APPLICATION
92
offers a free solution for developers that do not have the time or the skills to create their own
back-end database. Developers can easily integrate Parse in their app, and let Parse handle all
the communication between the app and the server. The service is free as long the server communication limitations are not exceeded. With the free version, the app can each month store
in total 20GB of data on the server, transfer 2TB of data between the server and the app, send
a total of 1 million push notifications, and the server handles 30 requests (communication between the app and the server) per second. Table 7.2 shows Parse’s pricing structure if the free
limits are exceeded, the numbers are collected from [109].
Service
Price
File Storage
$0.03/GB extra
Data Transfer
$0.10/GB extra
Push Notifications
$0.05 per 1000 extra
Request per second
$100 per 10 request/second extra
Table 7.2: Parse’s Pricing Structure
By utilizing the service Parse provides, developers can create apps and see if they become popular without investing too much money. If an app becomes popular, the revenue stream easily
subsidize the server costs, which is illustrated by comparing Table 7.1 and Table 7.3. By using
the numbers collected from the server, an estimation of the increase in cost in relation to the
user growth can be calculated (see Table 7.3).
Users
File Storage
Data Transfer
Notifications
Request/S
Total to pay
7,000
700MB (Free)
40MB (Free)
11,436 (Free)
0.017 R/S (Free)
$0
70,000
7GB (Free)
400MB (Free)
114,360 (Free)
0.17 R/S (Free)
$0
700,000
70GB ($1.5)
4GB (Free)
1,143,600 ($7.2)
1.7 R/S (Free)
$8.7
7,000,000
700GB ($20.4)
40GB (Free)
11,436,000 ($521.8)
17 R/S (Free)
$542.2
70,000,000
7,000GB ($209.4)
400GB (Free)
114,360,000 ($5668)
170 R/S ($1400)
$7307.4
Table 7.3: The Server Cost Increase
The numbers calculated in Table 7.3 are somewhat speculative, especially request/seconds.
CHAPTER 7. GUESS THIS SOUND - THE CASE STUDY APPLICATION
93
However, Table 7.3 illustrates the two server cost bottlenecks, number of push notifications sent
and the file storage capacity. The file storage is a bottleneck, because the servers stores the
sounds in the game. A sound is approximately 110KB large, and with an average of 3 games per
player, each player contributes with 330KB. With 7,000,000 users this is in total 231GB of storage. Push notifications are the main server cost bottleneck, and represents the majority of the
server costs in 7.3. However, a large number of push notifications sent, results in a large number
of in-ad impressions. The cost for every 1,000 push notifications sent is $0.05, but the revenue
generated is $9.3 from in-ads.
The red arrow pointing at the design icon in Figure 7.7, represents the cost related to the design
and sound effects in the app. Guess This Sound has 10 sound effects purchased from the Internet, for a total cost of NOK 375. The sound effects were purchased at www.pond5.com where the
average price per sound is $2. The total cost of the design was NOK 2,200, and then the designer
created the app’s icons, background pictures and GIFs5 . The red arrow at the bottom in Figure
7.7, represents the cost for hiring new developers. Currently this has not been an option, but
could be of interest if the app becomes popular.
The last red arrow in Figure 7.7, represents the cost stream for marketing the app and is the
largest cost so far. This section does not describe in detail what the money went to, only provide
an overall description of the allocation of the money in the different marketing areas, shown
in Table 7.4. Section 7.3 provides the cost structure in detail, and analyze the effect of each
approach.
5
GIF short for Graphics Interchange Format, is basically many pictures that are shown very fast to make it all
look like an animation.
CHAPTER 7. GUESS THIS SOUND - THE CASE STUDY APPLICATION
Marketing Service
Total Costs
Facebook
NOK 12,658
Twitter
NOK 150
App Review Sites
NOK 620
Fiverr
NOK 840
Flyers and Banners
NOK 0
Others
NOK 2,750
Total
NOK 17,018
94
Table 7.4: The Market Cost Allocation
Table 7.4 shows that Facebook accounts for 74.4% of the total marketing cost, but it has also been
the most cost-efficient approach. The biggest cost in term of time is however the development
of the app.
Time Consuming
I used in total four months (from December to April) to develop Guess This Sound, where I
worked on average 11 to 12 hours a day, hence between 1,320 to 1,440 hours in total. When developing an app alone it is easy to overlook flaws and become dependent on own limited knowledge. Thus by having more than one developer on the team, contributes to more manpower
and a broader area of knowledge to utilize. My experience before I developed Guess This Sound
was obtained through five years of school, in my spare time and at work. At NTNU I had three
programming courses, which provided me knowledge regarding the fundamentals in programming languages. I also achieved experience through two summer internships where I learned
to develop HTML5 apps. After the first internship, I started to develop small and less complex
HTML5 apps on my own. After the second summer internship in August 2013, I continued to
develop a couple of days a week until I started to develop Guess This Sound in December the
same year. Based on my former knowledge, I presume I was a place between little and average
experienced when I began developing the app. However, now when it is finished I assume I am
above average experienced. To give the reader a better understanding of the time required to
develop an app Table 7.5 is provided.
CHAPTER 7. GUESS THIS SOUND - THE CASE STUDY APPLICATION
Experience
Team
Total Hours
Total Days (8 hours each day)
Low
No
2,640 hours
330 days
Average (Me)
No
1,320 hours
165 days
High
No
924 hours
115.5 days
Low
Yes
2,376 hours
297 days
Average
Yes
1,188 hours
148.5 days
High
Yes
831.6 hours
104 days
95
Table 7.5: Expected Time Used To Develop An App
Table 7.5 shows the expected time used to develop an app in relation with different levels of
experience, and if the app is developed by one or two persons. The experience level low represents developers with little or no experience of developing apps, and limited experience with
programming languages. Because of the large amount of information and knowledge developers need to understand before developing an app, I estimated the total time they would use to
be twice the time I used. The experience level high, represents developers with wide experience
from developing apps and are familiar with other programming languages. To calculate the expected time for developers with a high level of experience, I multiplied the time I used with 70%.
This is because it takes time to establish the fundamentals in an app and there are usually delays
because of the design. To calculate the impact an extra team member has, I multiplied the total
time with 90%. 90% is a good assumption, because the team members can utilize each others
experience and knowledge, and reduce the number of bugs by having an extra pair of eyes on the
code. More time can be saved if the work can be done in parallel, however this is not elaborated
because it would result in too much speculations on the percentage of tasks that could been
performed in parallel. Working in parallel has also several disadvantages, for example merging
the code tend to create complications.
The time estimated in Table 7.5 is calculated based on a HTML5 app. If the app had been developed specific to Android or iOS, it would take shorter time because HTML5 apps require several
tweaks to make them suitable for both Android and iOS. If the app had been developed native
for both Android and iOS it would take longer time, because then the work had to be done twice
CHAPTER 7. GUESS THIS SOUND - THE CASE STUDY APPLICATION
96
with two complete different programming languages. However, there is no correct answer for
how long time it takes to develop an app, because it depends on the app’s complexity and the
developer team. Table 7.5 therefore only provides guidance to the reader, in order to illustrate
the large workload behind apps. According to a survey of 100 developers [112], it takes 18 weeks
for a team to develop a native app. Guess This Sound took 33 work weeks (divide 165 by 5) to
develop, which is almost twice the time compared to the survey. However, the survey addresses
developers that develop native apps in a team consisting of other developers with a high level
of experience. Thus by multiplying 33 weeks with 70% (highly experienced) and 90% (work in
team), the result is 20.8 weeks. This prove that the calculations presented in 7.5, is not too speculative.
7.3 Marketing
This section provides an analysis of the effect from the different distribution channels used to
marketing the case study app. Before the app was released, I created a marketing plan that
determined the cost allocation for each channel. I was concerned about building a hype before
the app was released, and concentrated on making the support channels well known before
marketing the app. This section provides an analysis of the distribution channels; the web page,
Twitter and Instagram, Facebook, and other
7.3.1 Web Page
The app’s web page works as a support channel that ties together the other support- and distribution channels. The web page is the first thing that appears when a user search for the app on
the Internet. In order to create the web page, I bought the domain www.GuessThisSoundApp.com
for NOK 68 from the web service goddady.com. After the web page was developed, I paid GoDaddy NOK 400 for hosting it one year. The impact the web page has on the amount of downloads is difficult to estimate, but it is probably low. However, it is important as it connects the
support- and distribution channels.
CHAPTER 7. GUESS THIS SOUND - THE CASE STUDY APPLICATION
97
7.3.2 Twitter and Instagram
Twitter and Instagram are popular marketing channels for apps, and if the Word of Mouth concept is obtained, the app’s popularity can increase significantly through these channels. I focused on increasing the number of users on both Instagram and Twitter, in order to increase
their impact on the marketing. My team member had the control of the Instagram profile while
I managed the Twitter profile. Sadly, he gave no effort and the Instagram profile remained unchanged. Therefore, I do only have enough data to analyze the Twitter profile.
Twitter
Twitter is a great way to share information through short messages. The messages are however
limited to the profile’s followers, and thus the effect depends on the number of followers the
profile has. Acquiring followers can be rather difficult if you are not a famous person, but it is
one method that significantly increases the number of followers. The method is simple; follow
many people and they might follow you back. From my experience about 15% of the profiles I
followed, followed me back, and thus rapidly increase the amount of followers I had. However, it
is only possible to follow 1,000 new users a day, and in the beginning no more than 2,000 in total.
The upper limit of people to follow, increases with a secret rate multiplied with the number of
followers your own profile have. Therefore, in order to follow 1,000 new profiles a day without
reaching the upper limit, you have to unfollow the users that do not follow you back.
I utilized this method to increase the amount of followers on the app’s Twitter profile. However it is very time consuming to follow and unfollow almost 2,000 profiles a day, and I therefore purchased a service from the web service Tweepi. The service let me follow and unfollow
100 profiles in just one click. The service costs NOK 40 each month, and can be purchased at
www.tweepi.com. Figure 7.8 shows follower growth in a time period of five weeks, from April
16th to May 21st.
CHAPTER 7. GUESS THIS SOUND - THE CASE STUDY APPLICATION
98
Figure 7.8: The Increase of Twitter Followers
Figure 7.8 shows the effect of the method, resulted in an average of 100 new followers a day. The
blue line shows the number of new followers, while the red line shows the profile’s total number
of followers.
It is hard to calculate the impact Twitter had on the number of downloads, because I did not
witness any increase when I promoted the app through messages on Twitter. However, Twitter
provides an easy way to communicate with users, and if the Word of Mouth concept is obtained,
the app could benefit largely from it. Fun Run, and Flappy Bird are examples of apps that became popular due to Word of Mouth on Twitter. Thus, developers should consider to utilize
Twitter as a distribution channel.
7.3.3 Facebook
In order to create a hype around the app, I created an agreement with one of Oslo’s most popular
nightclubs, Raspoutine. I created a release party for the app at the nightclub and invite everyone
I knew. I received 50% of the money from the entrance fee, the people I invited paid, and could
promote the app with banners and flyers at the nightclub. I created an event on Facebook, invited all my friends to it, and made them do the same. The number of invited quickly increased
and the total amount became 14,000 people. However, many invitations do not necessarily results in many arrivals, and only 200 attended. However, I earned in total NOK 6,000, which was
later used on marketing. The Facebook event still exists, which I utilized to reach out to the
CHAPTER 7. GUESS THIS SOUND - THE CASE STUDY APPLICATION
99
14,000 invited users during the marketing of the app. The event created a hype around the app,
and when the app’s Facebook page became available the next day, 143 liked the page. When a
user likes the Facebook page, he joins it and thus receives information from it. The next day,
April 1st, the app was published. Figure 7.9 shows the increase in total downloads from April 1st
to April 14th.
Figure 7.9: Increase In Number of Downloads Period 1
In the beginning, the download rate was low with an average of 21 daily downloads. In order
to increase the publicity around the app, I created a competition on the app’s Facebook page
with an iPad mini as the reward. The competition was scheduled to start April 7th and last to
April 30th. To join the competition, people had to share the competition further on their own
Facebook profile, hence making it visible for all their friends. Their friends could also join the
competition by sharing it further, and thus create a positive network effect. However, only users
that liked the app’s Facebook page would receive information about the competition when it
was initialed, and thus I had to increase the number of likes. I promoted the app’s Facebook
page through ads on Facebook from April 2nd to April 7th. I paid in total NOK 5,000 which resulted in 560 new likes (NOK 8.93 per like), and thus an average of 112 likes a day. I customized
the ad with the target customer criteria shown in Figure 5.6. The potential reach of the ads were
154,000 people.
CHAPTER 7. GUESS THIS SOUND - THE CASE STUDY APPLICATION
100
To achieve a large number of people sharing the competition on Facebook, I created a marketing plan. First, my friend behind an app called Mattilbud with more than 130,000 downloads,
took part in the competition. Thus, we could share the cost of the iPad Mini, and benefit from
each other’s network to promote both apps. He advertised the competition in Mattilbud, on
Twitter and on Mattilbud’s Facebook page. I spread information about the competition once a
week through Facebook, Twitter, Instagram and push notifications in the app. Instagram and
Twitter had however no effect, and are therefore not analyzed. I joined a large number of popular groups on Facebook, and shared the competition in these groups once a week. There were
an average of 20,000 members in each group, and by posting the competition in 10 groups each
week, it became visible for a large number of people. The effect of posting the competition in
these groups was good, and resulted in an average of 20 new users joining the competition every
time. On April 7th, when the competition was released, I managed to get a Norwegian celebrity
to post the competition on Instagram to his 34,000 followers. This resulted in 290 downloads
that day, and from the whole week after a total of 601. This is an average of 86 downloads a day,
and thus an increase of 497% compared to the week before. 30 users did also join (i.e. share) the
competition that week.
Facebook offers an opportunity to spread messages posted in the app’s Facebook page further
for a small cost. By paying NOK 30, the message will reach 650 to 1,700 more users, which increases for each purchase. I took advantage of this service on the most important messages I
posted. For example, I paid in total NOK 100 to make the competition reach out to 1,435 extra Facebook users. Another approach utilized to reach out to users regarding the competition
was push notifications. Push notifications had a great effect on the number of people joining
the competition. By sending push notifications with information about the Facebook competition, to all the case study app’s users (approximately 7000), 30 new users joined the competition.
From April 18th to April 23rd, I handed out flyers and hung up posters where the target customers where located, such as schools and shopping malls. Thereby, I could inform them about
the app and the competition on Facebook. The result was good, with a total of 53 users joining
CHAPTER 7. GUESS THIS SOUND - THE CASE STUDY APPLICATION
101
the competition and 200 new downloads. When the competition was finished April 30th, 281
users had shared it on Mattilbud’s Facebook page, and 174 on Guess This Sound’s. Through the
174 shares, 10,732 people saw the competition and thereby the information and pictures of the
app. It is hard to calculate the exact effect the competition had on the number of downloads,
because I utilized installation ads on Facebook twice during the time period. However, I did not
utilize installation ads in the time intervals April 7th to April 14th, and April 18th to April 23rd,
and thus can calculate the effect in these periods. The number of downloads in the first time
interval, were 601 with an average of 86 daily downloads. The number of downloads in the second time interval were 200, with an average of 40 daily downloads. Combined, the competition
contributed to 801 downloads, and thus an average of 57 daily downloads. The competition was
therefore a great way to achieve more downloads and to promote the app to the general public.
Installation Ad Campaign
On April 14th, I initialized the first installation ad campaign on Facebook. Installation ads are
only visible on Facebook through the users’ phone, and not from the computer. This makes it
possible for a user to click on the install button on the ad, and then be redirected to App Store or
Google Play depending on the OS running on the phone. I customized the ad with the settings
in Figure 5.6, and chose Android to be the platform the ad should appear on. I set the duration
of the campaign to be from April 14th to April 18th, with a budget of NOK 1,500. The result
was average, with 389 total downloads where 161 of them were paid (users clicked on the ad),
which is NOK 9.31 per download. The average daily downloads was 78, and thus an decrease
of 4.9% from the week before. Therefore, I decided to try an extensive advertising campaign,
to see if I could breach a threshold for the app to market itself through Word of Mouth. The
campaign started on April 23rd and lasted to April 29th. The goal was to achieve a good rank
for the app, and thus benefit from the App Store’s network effects. I customized the ad with the
target customer attributes and the platform iOS. I invested NOK 5,500 that one week, and thus
created an extensive advertising where the daily budget was NOK 785.7. This had an huge effect
on the amount of downloads, see Figure 7.10.
CHAPTER 7. GUESS THIS SOUND - THE CASE STUDY APPLICATION
102
Figure 7.10: Number of Downloads on App Store.
Figure 7.10 shows the number of daily downloads on App Store from April 10th, to May 10th. The
average number of daily downloads on App Store before the campaign, was 28, while during the
campaign it was 562, with a peak of 731 downloads on April 27th. The total number of downloads from the campaign was 3,932. The ad campaign stood for 1,972 downloads, and thus the
cost was NOK 2.78 per download. Hence, 1,951 downloads were not from the campaign which is
an average of 279 daily downloads. This is an increase of 896.4% free downloads from the week
before, which is due to the good rank the app achieved during the campaign. The reason for
the large decrease in number of daily downloads after the campaign ended, was because I completely stopped the marketing in order to see the effect from the app’s rank, which is analyzed in
7.4.
7.3.4 Other
When the app gained popularity, I approached the media in order for them to create a case
about the app, this was successful and I conducted three interviews. The newspaper Byavisa,
interviewed me regarding this thesis, see Appendix B. The interview became the headline in
the newspaper’s business section, and was a great way to promote the app and gain outreach
CHAPTER 7. GUESS THIS SOUND - THE CASE STUDY APPLICATION
103
experience. The effect the interview had on the download rate was rather small. Later on, I
was interviewed by the American company Serenity App Solutions about their book Mobile App
Growth Hacks. The interview’s topic was about the life of an developer, and the challenges in relation to developing apps, see Appendix C. The book has so far not contributed to any increase
in download rate. The last interview I conducted was with the Norwegian TV channel TV2. The
interview’s topic was the case study app and this thesis, it was sent every hour on May 30th
on their news channel TV2 Nyhetskanalen. The interview had more effect than the others, and
both the download rate and the app’s user activity increased that day and the next week. The
app gained in total 1,068 downloads that week, with an average of 153 daily downloads and a
peak of 228 downloads the day the interview was sent. Compared to the week before when only
a total of 111 downloaded the app, the number of downloads increased 862.16%. The app’s rank
also increased, from an overall rank of 1,405, to be ranked as the 108th most popular app on the
Norwegian App Store.
Table 7.6 shows the three most efficient marketing approaches in terms of number of downloads. First, the Norwegian celebrity’s post on Instagram. Second, the interview with TV2. Third,
the last installation ad campaign on Facebook.
Marketing Approach
# Total Downloads
# Average Daily Downloads
Norwegian Celebrity
601
86
TV2 Interview
1,068
153
Installation Ad Campaign
3,932
583
Table 7.6: Number of Downloads From Three Most Efficient Marketing Approaches
By comparing the interview with the Norwegian celebrity’s post, the interview had an increase
of 77.91% in daily downloads. Further, the Facebook ad campaign had an increase of 267.3%
in daily downloads compared to the interview, and 577.9% compared to the Instagram post. In
other words, the ad campaign on Facebook was the most efficient marketing approach I conducted.
Other marketing approaches conducted were through app review sites and a web page called
CHAPTER 7. GUESS THIS SOUND - THE CASE STUDY APPLICATION
104
Fiverr. The effect from these approaches is however low and will not be discussed, only a brief
description of them is given. App review sites are as the name implies, a website containing a
large number of followers that are looking for new apps. By having the app in these websites
can increase the download rate if the app receives a good review. I submitted my app on several review sites, which I recommend since they are a cheap and could attract new users. Fiverr
(www.fiverr.com) is a web page that collects cheap (usually $5) services people offer. I paid in
total NOK 500 for services that promoted my app through different channels, such as Facebook
and Twitter. For example, I paid $40 to make a person promoted my app 10 times one week,
through messages on his school’s Twitter profile with 260,000 followers. However, the service
did not result in any large increase of downloads.
7.4 The App’s Network Externalities
The more daily downloads an app has, the higher the app is ranked, and the higher the rank the
more daily downloads it receives. The main objective for the last ad campaign on Facebook, was
to achieve a good rank on App Store Norway in order to analyze the effect. With 334 downloads
the first day (April 23rd) and 514 the day after, the app climbed fast in rank, see figure at the top
of Figure 7.11.
CHAPTER 7. GUESS THIS SOUND - THE CASE STUDY APPLICATION
105
Figure 7.11: Comparison Number of Downloads With Ranking on App Store
The app went up from an overall ranking of 917 April 23rd, to be ranked as the 64th most popular
app on the Norwegian App Store on April 25th. The best result the app achieved, was to be
ranked as the 26th most popular app on the Norwegian App Store, on April 28th. That day, it was
also ranked as the 2nd most popular word game. When the app increased in rank, more people
saw it and downloaded it. The blue graph to the left in the figure at the bottom in Figure 7.11
shows the number of downloads that were not paid for during the campaign. By comparing the
two other figures, one can see the impact the rank has on the number of daily downloads. When
the ad campaign ended April 29th, the number of daily downloads was 490, before it suddenly
dropped down to 163 on May 2nd and on May 5th only 14 downloads. Table 7.7 shows the rank
in relation to daily downloads when the app’s popularity began to decline.
CHAPTER 7. GUESS THIS SOUND - THE CASE STUDY APPLICATION
106
Date
Overall Rank
Word Game Rank
Daily Downloads
29.04 (End of Campaign)
31
2
490
30.04
34
2
464
01.05
59
2
408
02.05
108
2
163
03.05
202
4
72
04.05
453
16
20
05.05
764
20
14
Table 7.7: Number of Downloads Compared To The Case Study App’s Rank
Table 7.7 shows that the number of daily downloads was high while the app had a good overall rank, while the rank in the category word game had less impact. By looking on the overall
rank, it almost doubled each day from April 30th, while the number of downloads was more
than halved. By looking on Table 7.7 from the opposite perspective, a double in amount of daily
downloads increases the app’s overall rank almost twice as good. This illustrates the importance
of a good overall rank, because users tend to look for new popular apps in the overall top lists
rather than a specific category list, such as word games. It is difficult to know whether it exist a
threshold for number of daily downloads or rank the app needs to achieve, in order to promote
itself through Word of Mouth without investing money on marketing. However, if the app obtains enough daily downloads in order to reach a good overall rank, it will benefit from it and
create a positive feedback loop, which is illustrated in Figure 7.12.
Figure 7.12: The App Marked’s Positive Feedback Loop
CHAPTER 7. GUESS THIS SOUND - THE CASE STUDY APPLICATION
107
The plus and the minus sign in Figure 7.12 illustrates the positive and negative effect from an
increase or decrease in daily downloads, the app’s overall rank and the app’s user activity. A
small change in one of the areas results in an increased change in the other areas. This loop
does not last forever, as the effect can rapidly change from being positive to negative and vice
versa. Thus, the positive feedback loop illustrates the lack of stability in the app’s popularity.
In order to make the positive feedback loop continue positive without investing too much on
marketing, the app relies on Word of Mouth. Since super users are the largest contributors to
Word of Mouth, I decided to exploit a desire engine to increase the probability to create more
super users.
7.4.1 Psychology
To trigger the users, I utilized my distribution channels to attract their attention, and thus make
them download the app. When they open the app, they enter the action phase. In this phase,
the user creates a new player and logs in. When the user is logged in, a tutorial is displayed to
guide the user through the app. This increases the probability that the user will use the app as
intended. After the tutorial is displayed, the user will in most cases click to play with a random,
and the window Pick A word in Figure 7.4 appears. When a word is chosen and the sound is
recorded and sent, a push notification is sent to the random player. The push notification works
as a external trigger, because it notifies the player that he needs to open the app and guess the
word. If the guess is correct, the player is rewarded with experience while the other player is
rewarded with coins. This is the variable reward phase, where the reward (experience) depends
on the amount of time used to guess the word and the number of rounds completed. The next
phase is the commitment phase, which is where the player must contribute to increase the value
of the desire engine. In relation to Guess This Sound, this is usually by continuing the game and
send a sound back, and thus trigger the other player with a push notification. Other commitment work is to invite friends from Facebook or share the sound recorded. This increases the
app’s value, and the player receives extra coins when he does it. When a player receives a push
notification it works as an external trigger, and thus trigger the first phase in the desire engine.
Internal triggers are created when the player opens the app by own initiative. This self-trigger
occurs when a player has evolved an addiction or habit through successful iterations through
CHAPTER 7. GUESS THIS SOUND - THE CASE STUDY APPLICATION
108
the desire engine cycle.
Numbers from Parse’s servers show that there are approximately 100 of the 7,000 users (0.7%)
in the app that have reached level 5 in only two weeks. In other words, they have played a large
amount of games in a short time period, and can be categorized as super users. Every super
users have invited on average four friends, which is in total 400 new users. This indicates the
impact super users have on the app’s number of downloads, and thus popularity. By improving
the desire engine, one can increase the probability for a user to addicted, and thus create more
super users.
7.4.2 Negative Network effects
The thesis has explained the positive network effects behind the app’s rank and super users, but
not the negative effects from players leaving the game. The app has a large weakness; the opportunity to play with a random person. Although this is a great feature, because new users tend
to play several rounds with a random player before they decide if they like the app or not. The
way this works, is that if a player clicks to play with a random, the player is added to a list on the
server and is listed until another player is added. When another player is added, a new game is
created between the players and they are both deleted from the list, making the list empty. In
this way, only the players that want to play with a random, can create games with each other.
This works perfectly when there are a large number of users that are searching for randoms to
play with, because games are then created instantly. Thus, when few users do it, it takes longer
time before a game is created. Users usually have limited patience when downloading an app,
and will most likely delete the app if the waiting time before a game is created is too long.
Another weakness is the app’s network effects. If a user stops using the app, all the games to that
user can no longer be played, because it takes two players to play a game. The effect is illustrated
in Figure 4.8. When a user leaves, all the connections (games) to other users are useless, and thus
reduce or even remove the value for other users connected to that user. Therefore, only users
that still have games with other active users will continue to play until they lose interest, which
is illustrated in Figure 4.8. According to the definition of network effects, the value of the app
CHAPTER 7. GUESS THIS SOUND - THE CASE STUDY APPLICATION
109
from a user’s perspective is dependent on the number of others using this. In other words, if the
activity within an app declines, the value do too. This is important because the less connections
a users has, the less value the app provides that user, and thus the incentive to leave becomes
bigger. This creates a positive feedback loop which can determine the app’s popularity. Guess
This Sound’s user activity is shown in Figure 7.13.
Figure 7.13: Daily Active Users
Figure 7.13 shows that the average number of users still playing the game is 110, which is almost
the same number of super users calculated in 7.4.1. Figure 7.13 illustrates the importance of
marketing, especially if the app has not exceeded enough users to promote itself through Word
of Mouth. The figure also illustrates how rapidly the app’s user activity increases and decreases,
due to the network effects from people joining and leaving the game. This can be modeled by
applying the irSIR model.
7.4.3 irSIR model
Figure 7.13 is surprisingly similar to the irSIR model in Figure 4.6. To check if the irSIR model
applies to the case study app, the app’s user activity has to be analyzed by using Equation 4.5.
Because of the extend of the analyze, the equation is presented again.
CHAPTER 7. GUESS THIS SOUND - THE CASE STUDY APPLICATION
I 0 = βS
I
R
− γI
N
N
110
(7.4)
Equation 7.4 deserves a brief description in the light of the app. The β represent the rate of
acquiring new users, which is the average percentage of users joining the app from when the
activity in Figure 7.13 started to increase on April 20th. The S represent the total number of potential users downloading the app, which is the total number of downloads the app had from
April 20th to May 10th, hence 4,700 users. This number declines as the number of users downloading the app increases.
I
N
is the fraction of active users (the average retention rate) from the
total amount of potential users N. N is equal to S, hence 4,700.
I
N
is the network effect related
to active users in the app, and the higher the retention rate (the number of active users) the bigger the effect. On the other side of the subtraction sign in Equation 7.4 is the users leaving the
app, hence no longer active users. γ is the average number of users leaving the app; the average
churn rate. I represents the number of users still active, and by multiplying I with γ, we get the
number of users leaving that particular day. This is multiplied with the percentage of users that
have stopped using the app, which is
R
.
N
Equation 7.4, therefore calculates the app’s user activity
rate by applying the irSIR model, which the red line in Figure 7.14 illustrates. The blue line in
Figure 7.14 is the original activity, similar to Figure 7.13. The numbers used to plot Figure 7.14
are collected from the calculations in Appendix A.
Figure 7.14: irSIR modeling of Guess This Sound.
The variables N (the total number of potential users) is 4,700, and β (the average acquiring rate)
CHAPTER 7. GUESS THIS SOUND - THE CASE STUDY APPLICATION
111
is 4.76%. All the potential users will finally be acquired (100%), and thus the average acquiring rate can be calculated by dividing 1 by the number of days in the time period which is 21,
and this equals 4.76%. The variable γ (the average churn rate) is calculated by dividing the total churn rate by the number of days. The total churn rate is 100% minus the total retention
rate. The total retention rate is the number of users that remains active at the end of the period,
divided by the total users downloading the app which is 4,700. The number of active users on
May 10th is 103, and thus the total retention rate in this period is 2.19%. The total churn rate is
therefore 97.81%, and the average churn rate is 4.66%.
The equation calculates the app’s user activity rate I’ in relation to the potential number of users
downloading the app, the retention rate and the churn rate. This will either be an increase or
decrease in percentage of the app’s user activity, which is then normalized and used to plot the
red line in Figure 7.14. To normalize the results in the range of 0% to 100%, Equation 7.5 was
used. N I 0j in Equation 7.5, represents the normalized activity rate of I’. This is calculated by
using the activity rate I’ at day j, minus the minimum activity rate from the whole time period,
which then divided by the variance of the activity rates.
N I 0j
=
I 0j − mi n(I 0 )
max(I 0 ) − mi n(I 0 )
(7.5)
The normalized original activity within the app is illustrated with the blue line in Figure 7.14.
The blue line has almost the same pattern as the irSIR model (the red line). They do not overlap to the same extent as MySpace did in Figure 4.6, but this was rather not excepted as it is a
higher degree of network effects in social networks compared to apps. However, the two lines
in Figure 7.14 do have similarities, which indicates that irSIR models can be used in order to
analyze network effects in apps. In Figure 7.14, the app’s user activity declines on April 27th.
This is the first time the fraction of users leaving the app
active users
I
.
N
R
N , becomes bigger than the fraction of
In other words, there are more users leaving the game than playing it, which is
the same effect illustrated in the SIR model in Figure 4.5, where the number of infected and recovered tangent. This clearly shows the impact network effects have on the case study app, and
that the irSIR model can be successfully applied. Therefore, the key factor for preventing the activity to decrease and thus the popularity of the app to exponentially decline, is to always have
CHAPTER 7. GUESS THIS SOUND - THE CASE STUDY APPLICATION
112
the number of active users larger than the the number of users leaving in relation to the total
amount of potential users. This is obviously, because if more users leave the app compared to
the users still using it, the curve declines. However, what is not obviously is the large impact this
has on the rapidly decrease in the percentage of active users. Developers should therefore try to
minimize this effect by reducing the number of users leaving, which illustrates the importance
of maintaining the acquired users. The threshold for an app to spread through Word of Mouth,
is therefore not necessary only relied on the number of downloads it gets, rather more dependent on the app’s user activity. Equation 7.6, represents the break point from where the activity
within the app (retention rate) gets lower than the number of users leaving the app (churn rate).
S γ
<
R β
(7.6)
If Equation 7.6 is satisfied, I will be less or equal to 0, meaning it is more users leaving the app
rather than using it. By dividing the average churn rate γ by the average acquiring rate β, we get
0.98. The calculations in Appendix A, shows that
S
R
is bigger than
γ
β
until April 28th, which is the
same day the number of active users starts to decline. From April 28th, Equation 7.6 is satisfied
and the app’s user activity rapidly declines. According to [38], when Equation 7.6 is satisfied for
social networks, the acquiring rate I can never increase. Thus the social network’s user activity
declines until it no longer exists. This is not the case for apps, because their popularity are not
determined based on the market trend to the same extent as social networks. It is however more
difficult to make the app’s user activity increase more than once, especially for apps that already
have obtained a large percentage of the target users. According to [48], the first two weeks of
an app’s life are crucial and will likely determine its future visibility in the app stores. The most
popular apps develop popularity within two weeks of release, and since apps have a tendency
to drop in rank position over time, the quicker the marketing starts, the bigger the impact. In
other words, the difficulty for an app to become popular increases with time. Numbers from
Appendix A, show that the average increase in the app’s user activity from April 22nd to April
26th is 32.66%, with a peak of 47.43% on April 24th. The average decrease in activity from April
28th to May 2nd is 22.69%, and with a peak of 30.43% on April 30th. This shows how quickly the
app goes from having a large number of active users, to reduce the number significant in a few
days with a percentage change in activity of 55%.
CHAPTER 7. GUESS THIS SOUND - THE CASE STUDY APPLICATION
113
Developers have to set the number of potential users themselves when using Equation 7.4, and
thus it can be hard apply the irSIR model. However, Equation 7.6 shows that the more people
leaving the app, the smaller the left side of the equation will be and the larger the right side.
Therefore the number of people leaving the app has the largest impact on whether Equation 7.6
is satisfied or not. This is the main reasons why Guess This Sound had the extreme decrease
in activity from April 27th, because the number of users leaving became too big, which caused
Equation 7.6 to be satisfied. If the ad campaign had lasted longer, the app would obtain a larger
number of active users and thus reduce the right side of Equation 7.6. This could make the app
grow even further and perhaps diminished the decrease in activity within the app. Although it is
possible for the app’s user activity to increase again, it is much more difficult and cost inefficient
compared to the first time.
7.5 Guess This Sound’s KPI
This section provides an analysis of the case study app in relation to the general app Key Performance Indicators (KPIs) described in 5.2. The KPIs analyzing the revenue generated from
apps will not be discussed, since the case study app has not generated any revenue and it would
be too speculative to use the hypothetical revenue calculated in 7.2.4. The KPIs presented are
therefore Customer Acquisition Cost (CAC), Usage and Retention Rate.
7.5.1 Customer Acquisition Cost KPI #1
CAC is the average cost to acquire a new user, and is calculated by using the total marketing cost
in a given time period and divide it by the number of users acquired that period, see Equation
5.1. Because of the limited time the app was available, two cases are presented. The first case
analyze the CAC when no paid advertising was exploited, which is from when the app was released on April 1st to April 14th, and from April 19th to April 23rd. The second case is the time
period when the ad campaigns were used, which is from April 14th to April 18 and from April
23rd to April 29th. This case includes the number of downloads after the campaign until May
5h, because they aroused due to the network effect from the campaign.
CHAPTER 7. GUESS THIS SOUND - THE CASE STUDY APPLICATION
114
The number of downloads in the first case is 921, and was obtained through Twitter, Fiverr, App
Review Sites, flyers and posters, and the other distribution channels discussed in 7.3.4. They
accounted for a total cost of NOK 4,360, and thus the CAC in the first time period is NOK 4.73.
The number of downloads in the second case is 4,828, and was obtained through the installation
ad campaign on Facebook and its network effects. The total cost was NOK 7,000, which results
in a CAC of NOK 1.45. If the downloads obtained after the last campaign ended are excluded,
the number of downloads was 3,932, and thus a CAC of NOK 1.78. The CAC from the first case
is more than twice the size compared to the second case, and thus the strategy of choice is the
installation ad campaign on Facebook.
7.5.2 Usage KPI #2
This KPI is a combination of the Usability attribute in Osterwalder’s ontology, and the app’s target customers. To describe the KPI, a brief summary of the usability attribute and the target customer is presented. The target customers are users in an age of 13 to 25 that understand english.
The app is normally used in the users’ comfort zone, and they can potential use it whenever
they are in this zone and have a need of an app to pass the time. This KPI was helpful in order to
achieve a greater understanding of the app’s usage, and thus develop new functionalities within
the app to strengthen it from the target customers’ usage perspective. The functionalities added
are described in 7.2.1.
7.5.3 Retention Rate KPI #3
Retention rate is the last KPI analyzed in relation to the case study app. As Figure 5.5 shows, the
app category games has an average retention rate on 30%. However, by looking on the retention
rate in Figure 7.15 collected from Parse, my app has not experienced the same rate.
CHAPTER 7. GUESS THIS SOUND - THE CASE STUDY APPLICATION
115
Figure 7.15: Retention Rate Parce.com
Figure 7.15 shows the percentage of active users on the number of days after they downloaded
the app. For example on May 9th, there were 11 users that downloaded the app, and 9,1% of
them were active on May 10th (1 user). The best retention rate the app had in relation to the
number of users downloading it on a particular day, was on April 23rd. Then 251 downloaded
the app, and 52 of them were active the day after (20.7%). However, the retention rate quickly
shrunk to 10,8% (27 active users) the next day, and then 4.0% (10 active users). The overall retention rate from all the users in Figure 7.13, is fortunately a lot better. From April 1st to May 5th,
the average overall retention rate was 17.7%. The best retention rate was on April 28th where
39.97% of the 4,151 total users were active, thus 1,659 active users.
Chapter 8
Experiences and Challenges
This chapter presents the different experiences and challenges developers encounter during the
developing and marketing of apps. The chapter’s objective is to give developers a guidance, in
order to increase the probability for their apps to become popular. This chapter presents three
sections. First, the requirements relative to developing apps. Second, criteria for what it takes
for an app to become popular. Third, a collection of my experiences in relation to developing
and marketing the case study app.
8.1 Users’ Requirements
Several challenges occur due to high user requirements, and since apps easily can be downloaded and deleted, they have to work perfectly and provide a good first impression. The criteria
required are [95]; User Interface, Network Connection, Performance, Flaws and Error Handling
and Security.
The User Interface criterion describes how the app is perceived by its users. The important factors in this criterion are design, navigation, screen sizes and screen rotation. Design is important
for the app’s user friendliness, and developers should spend time to create the design easy to
understand and interesting to interact with. The design needs to be thoroughly tested, to see if
the users interact with it as the developers intend them to do. The next factor is navigation. The
app needs to behave as the users expect it to do, if not it might lead to confusion and irritation
116
CHAPTER 8. EXPERIENCES AND CHALLENGES
117
which make them delete the app. A tutorial can be of great help to make the users understand
the app’s navigation and design. The last factor in the user interface is related to the design and
is how the app appears on different screen resolutions and if the the screen is rotated. If the design is not modified to support screen rotation, this feature must be disabled as the app’s design
will change dramatically. This factor is especially important for Android developers as it exists a
large number of different screen sizes and screen resolutions.
The Network Connection criterion is concerned with how the app utilize the network connection. If the app needs network connection to function, developers must take this in consideration when developing the app. The strength of the connection vary depending on the user’s
location. Thus, if the connection is slow, a loading icon or an informative message must appear,
to make the users understand that the network connection is slow and not the app. This is important in Guess This Sound, because it can take seconds to uploaded the recorded sound to
the server if the network connection is bad.
The Performance criterion is concerned with the responsiveness, memory usage and code optimization. The app needs to be responsive, if not users will find it slow. Therefore, it is important
to make the app do the heavy work in the background, while things appear in the foreground.
Hence, developers need to think carefully about the order of the code, because by changing it
the app might seem faster than it really is. Another way to increase responsiveness is to remove
animations and heavy design, and replace them with less fancy design and functionalities. The
app’s responsiveness and performance are more important for the users than the design, because it does not matter how nice the app looks, if it does not work properly. Memory usage is
normally not a problem, because smartphones today have a large storage and RAM. If the app is
very memory consuming, developers can release the app’s memory usage with only a few lines
of code. When developing less complex native apps, code optimization is not an important factor. However, it is important for HTML5 apps because the Javascript code is slower than the
native code.There are several ways to optimize the code in different programming languages,
and developers should consider this if the app is slow on older phones. I spent several hours
optimizing the Javascript code in Guess This Sound, and improved the performance approxi-
CHAPTER 8. EXPERIENCES AND CHALLENGES
118
mately 150%.
The Flaws and Error Handling criterion refers to the testing of the app, and the informative
messages sent to users if errors occurs. It is no need to emphasis the importance of testing
again, but developers must remember to use good time in this area because the app’s first impressions is everything. If the app has several bugs, it can lead to bad reviews, which makes it
harder for the app to achieve a good rank when the bugs are fixed.
Security is the last criterion and is importance for apps with sensitive user information, such as
bank apps. These apps must encrypt the information and have a secure channel to transfer it
on. Guess This Sound does not need security and it would only cause lack of performance if it
was implemented. However, developers that develop apps with sensitive information must take
this into account, as the consequences can be huge.
8.2 What Does It Take
This section presents what it takes for an app to become popular, if the requirements provided
in the last section are present. I created an app with a great design, good performance and followed every requirement listed in 8.1. I studied the app market and how to efficiently marketing
an app, before I marketed Guess This Sound. However, I was not able to maintain the app’s
popularity after it peaked. There are several factors that have an impact on the app’s popularity,
such as the right timing, the target customers, the app idea etc. However, it is especially one
factor this thesis emphasis which needs to be present in order for the app to become popular;
Word of Mouth. If an app experience a large degree of Word of Mouth, it will benefit from the
network effects related to this concept and spread without any further investment in marketing.
Word of Mouth can be obtained through oral or digital communication. However, digital has the
largest reach, especially through social networks. Fun Run is an example that became incredible
popular due to digital Word of Mouth on Twitter. In order to increase the probability to obtain
the concept, developers must be aware of the following criteria; uniqueness and the psychology.
CHAPTER 8. EXPERIENCES AND CHALLENGES
119
To obtain users’ attention an app has to be unique, if not the users rather download another app
which is more popular. However, it is not the app’s idea that needs to be unique, it is the app’s
concept. Apps are usually developed based on existing ideas, and in order to become unique
and thus interesting, they need to change the existing concept and increase the usability. For
example, the idea about Twitter is that users can post short messages that their followers can
see. This is exactly the same concept as Facebook’s posting of status. However, Twitter is centered around this one idea, and creates a more simple and easier way for users to post their
interests without all the others functionalities. Thus, Twitter fulfills users’ needs by providing a
unique service based on an already existing idea. Flappy Bird is another example that is built
upon an already existing idea; Helicopter Game, developed by David McCandless in 2000. Helicopter Game never generated any revenue, but other apps like Flappy Bird have copied the idea
and generated large revenues [100]. Flappy Bird was published on App Store on May 24th 2013,
but did not enter the top 10 list in US before January 10th 2014.
Flappy Bird became popular due to people’s addiction through their irritation. People posted
hateful messages on Twitter saying that the app was miserable and that people should stare
away from it [101]. Hence, Flappy Bird is an app that got popular and later deleted due to the
psychology in the game; addiction. The psychology factor also refers to apps that have a purpose
of adapting the users’ daily routines. In order to do so, the app needs to solve a user’s need which
can be everything from grocery shopping (i.e. Mattilbud), a simple picture app (i.e. Snapchat),
or to pass the time, for example games. To adapt the users’ daily routines, the app has to create
a desire for the users to continue using the app. Desire can be created by utilizing the desire engine described in 5.3.2. The desire engine’s objective is to exploit the users’ emotions or habits,
in order to create this desire.
The users’ requirements in 8.1 and the criteria listed in this section, increases the probability
for an app to obtain the Word of Mouth concept. However, apps that are influenced by network
effects such as the case study app, also rely on the app’s user activity. In relation to the case study
app, if users struggle to create new games with others due to low user activity within the app,
they will most likely never use the app again. Hence, the app needs to exceed a certain thresh-
CHAPTER 8. EXPERIENCES AND CHALLENGES
120
old of daily active users in order to create games immediately when players click to play with a
random. The threshold is hard to estimate, but one efficient approach to obtain a large number of users rapidly, is to exploit the positive feedback effect from the top ranking lists. Guess
This Sound was ranked as the 26th most popular app on the Norwegian App Store, which had
a great effect on the number of downloads. However, if an app is ranked in the top 10 list it becomes visible at the front page of App Store, and thus attracts a lot more users. In order to test
the app’s viability, developers could therefore focus on an extensive marketing where the goal
is to achieve a rank in the top 10 list. In this way, the app obtains a large number of users, and
thus several super users that increases the probability for the app to be spread further through
Word of Mouth. If this approach fails, the app will most likely never achieve a sufficient Word
of Mouth effect. Developers should thus return to a marketing at a much lower level, and hope
that the app gain popularity as time passes.
According to Forbes [102] only 0.01% of all available apps become extremely popular, and are
normally developed by large enterprises. If an app manage to defy the odds, the time is of the
essence as the app’s average lifetime is 1 to 1.5 years. A metaphor that can be used to describe
the app’s life cycle is the mayfly concept, which is as followed [103]. Mayflies live most of their
lives (2 years) in the water as nymphs, where they evolve slowly to mayflies. During this time,
they are exposed to threats from fish and other larva-eating species, as well as the temperature
in the water. Few of them survive this process, but the ones that do becomes a subimago1 . The
subimago phase is very short (about 24 hours), and they are during this phase exposed to birds
and fish depending on if the subimagos are on land or on the water surface. When this phase is
finished the subimagos left become mayflies. The mayflies live only one day before they circle
back to a water where they lay their eggs and die in the process. This is analogous to the app
market, because developers use several weeks on developing the app, which is analogous to
the nymphs phase in the mayfly’s life. When the app is finally published it competes among a
large number of other apps, where the probability to become popular is extremely low. There
are several factors in this phase that determine the app’s popularity, this is analogous to the
subimago phase. The last phase is when the app has become popular, and is analogous to the
1
The second-to-last stage in the development of a mayfly. The subimago has wings, but is not sexually mature.
CHAPTER 8. EXPERIENCES AND CHALLENGES
121
last phase in the mayfly’s life; the mayfly phase. If an app becomes popular, it has a short time to
exploit the benefits from a large number of active users, and thus generate substantial revenues.
The app’s KPIs are therefore important to analyze in this period, in order to locate the app’s
strength, increase the users’ engagement, and thus maximize the monetization and thereafter
the profit.
8.3 My Experience
This section summarize the most important experiences I have obtained, excluded the ones already discussed in this chapter. First, be selective when choosing team member, look for the
right knowledge, experience and work ethic. This may have a large impact later in the process. Create a Desire Engine in the app by examining user’s daily routines and emotions. This
increases the probability to create super users, who are the main users in terms of revenue generated and marketing through Word of Mouth. Implement push notifications to increase the
retention rate, and trigger the desire engine. Decide the target customers early in the process
and develop the app in relation to their needs and requirements. When the target customers are
defined, it is easier to determine the most efficient distribution channels. Consider to publish
the app for a flat fee the first weeks and then switch to free, this might increase the downloading
rate as several web pages promote apps that drop in price. When the app becomes free, implement IAPs if possible and less intrusive in-ads. Thus, if the app never becomes popular, it still
generates a small portion of revenue in its most popular period. Choose an extensive marketing
strategy in a short time period, to increases the number of daily downloads and thus the app’s
rank. When the app has achieved a good rank, reduce the marketing and try to maintain the
rank. Be aware of Equation 7.6 when the popularity increases, in order to avoid strong negative
network effects.
Chapter 9
Conclusion and Recommendations for
Further Work
This chapter presents the conclusion and thereafter recommendation for further work.
9.1 Conclusion
This section presents a brief summary of the main results from this thesis, and a conclusion
for the objectives described in 1.2.1. The case study app did not generate any revenues or server
costs in the time of writing this thesis. This part of the conclusion is therefore based on extensive
studies and analysis of the app market. The objectives are provided in the beginning of each
subsection.
9.1.1 The Economic Perspective
1. What are the costs related to apps, and how do they generate revenue? Are there any digital
economic key-aspects relative to apps?
Applications (apps) are digital goods, and thus the marginal cost for producing an extra entity
is 0. The main cost is in terms of time, which is the time developers use to create the app (on
average 18 weeks). Costs in terms of money depends on the app, and can be equal to 0 if no
122
CHAPTER 9. CONCLUSION
123
marketing is utilized and the app does not communicate with a server. If the app communicates with a server, it generates costs based on the amount of communication where the main
factor is the app’s user activity. The revenue increases proportional with the user activity, and
thus easily subsidizes the generated costs. Hence, the app market from an economic perspective
is a win-win situation where developers only risk their own time. Costs in relation to marketing
depends on how much developers are willing to pay for promoting of the app. The desired objective with marketing is to obtain the Word of Mouth concept, in order to spread the app for
no costs through the app’s users. This concept eventually determines if the app becomes popular or not. Word of Mouth is basically passing of information from person to person by oral or
digital communication. Another cost which is related to the revenue, is that Google and Apple
collects 30% of the app’s revenue.
Apps can generate revenue through a flat installation fee (paid apps), paid premium versions,
advertisings (in-ads) or purchases of virtual goods in the app (IAPs). The app market is in favor
of free apps (no installation fee), and studies in 5.1.3 indicates that this will continue as free apps
will represents 92% of all apps in 2015. There are two main reasons why most developers choose
the free pricing strategy. First, customers do not pay to download an app if they can find a similar free app, thus free apps achieve a larger percentage of downloads. Second, due to the larger
percentage of downloads, free apps generate more revenue than paid apps. This is because the
revenue generated from IAPs and in-ads, exceeds the revenue from the installation fee. Thus,
the optimal monetization for apps is no installation fee with IAPs and in-ads implemented.
Digital economic key-aspects relative to apps, are for example the key performance indicators
(KPIs) elaborated in 5.2. They are used to analyze the app’s strength and weaknesses in order to
increase the user’s engagement and thus maximize the revenue by focusing on the most profitable customers. The KPIs are also concerned with apps ability to maintain and acquire new
users, by utilizing the most efficient distribution channels.
CHAPTER 9. CONCLUSION
124
9.1.2 The Influence Of Network Externalities
2.To what extent are apps influenced by network externalities? Are there ways to model these effects, and thus learn how to benefit from them?
There are especially two network externalities that influence apps’ popularity to a large extent;
network effects and positive feedback loops. Word of Mouth is the main factor in relation to
network effects, and usually determines if the app becomes popular or not. It is too costly to
market an app to millions of users, and thus developers rely on users marketing the app for
them through Word of Mouth. Studies in 5.3.1, shows Word of Mouth additionally influence
people to a larger extent than all other marketing.
The top lists on the app stores are influenced by a positive feedback loop. When the app’s number of daily downloads increases, it achieves a higher rank. When the rank improves, the app
becomes more enticing and thus increases the download rate. This again increases the app’s
rank. Hence, apps benefit greatly from a good rank, because the number of downloads increases
proportionally with the revenue and the probability to achieve Word of Mouth to a larger extent.
The case study app experienced this effect and enjoyed an exponential increase in number of
daily downloads until it peaked as the 26th most popular app in Norway. However, the app did
not gain enough daily downloads to maintain the rank, and thus due to the positive feedback
loop it resulted in an exponential decrease in both downloads and rank.
Apps’ network effects can be modeled and analyzed by applying a modified epidemiological
model (SIR model). From studies in 4.3.3 and the analysis of the case study app in 7.4.3, the
thesis presents an in-depth examination of network effects from a mathematical perspective
by applying a modified SIR model. The model provides equations that can be used get more
control of the network effects, and thus learn how to benefit from them.
CHAPTER 9. CONCLUSION
125
9.1.3 Requirements And Challenges
3. What are the requirements and challenges in relation to developing and marketing apps? What
does it take for an app to become successful?
There are numerous of challenges and requirements in relation to apps, and it continues to
grow as users’ expectations increases proportionally with the number of apps available. Apps
are deleted if they do not satisfy the users’ expectations, thus the app’s first impression is everything. During the development, developers need to emphasis especially four criteria. First, the
app has to be user friendly. If users do not understand how to interact with the app, they become
confused and irritated, and then delete the app. Second, the app has to be responsive and have
good performance. Users have limited patience and will quit the app if it too slow. Third, the app
must be thoroughly tested. Errors leads to unsatisfied customers and reduce the first impression, even if everything else is perfect. Fourth, the app must solve a need of the users in order
to create desire, and thus take part of the users’ daily routines through their emotions or behavior. The app can increase the probability to create desire by utilizing a desire engine within the
app. Desire engines are elaborated in 5.3.2 and analyzed in relation to the case study app in 7.4.1.
Challenges in relation to marketing apps, are centered around one concept; Word of Mouth.
Word of Mouth has to be present in order for the app to increase and maintain its popularity.
Word of Mouth is usually created by the apps’ most active users (i.e. super users), and the concept has the biggest effect when it occurs digitally, for example through social networks. Apps’
average lifetime is 1 to 1.5 years, and thus the concept has a limited time to arise in order for the
app to generate revenue worth the investment. To increase the probability for an app to obtain
Word of Mouth, marketing is a common approach. However, marketing only boost the app’s
popularity, it does not maintain it. Therefore, developers rely on the users to spread the app
further via Word of Mouth. To increase the probability for Word of Mouth to occur, the requirements regarding the app’s development, especially the app’s ability to create desire, needs to be
present. The desire increases the app’s user activity, and thus the revenue.
In order for an app to become successful, it needs to have a large number of active users and an
CHAPTER 9. CONCLUSION
126
efficient monetization method implemented. An app can have a large number of downloads,
but still be worth nothing if the activity is extremely low. However, if the activity is low, developers can utilize the key performance indicators to increase the users’ engagement, and thus the
revenue.
9.2 Recommendations for Further Work
The thesis has a broad scope as it analyze every important factor in relation to the case study
app and apps in general. Therefore, only an overall description is given on some of the topics.
Hence, this sections presents the topics that are less elaborated, and thus recommended for
further work.
9.2.1 Super Users
This thesis emphasis the importance of super users as they are the biggest contributors in relation to revenue generated and the marketing through Word of Mouth. This is obvious as they
are the most active users, and thus increase the revenue from in-ads and IAPs. However, the
thesis does not analyze the impact or the importance they have on digital goods in-depth, and
the topic is therefore recommended for further work. The objectives are listed as followed:
• What impact do super users have on digital goods with emphasis on their ability to spread
information about them.
• Are there ways to simulate or model this behavior?
One way to approach these objectives is to create a simulation and differentiate between normal
users and super users. One can distinguish the simulated users by using different values in
relation to the impact they have on marketing and revenue. By creating different scenarios, the
student can analyze the impact a large number of super users have on digital goods in relation
to revenue and marketing.
CHAPTER 9. CONCLUSION
127
9.2.2 Word of Mouth
Word of Mouth is a common concept in the app market, and developers usually referred to the
concept as the most important factor when marketing an app. This thesis acknowledge the
importance of Word of Mouth through analysis of the case study app, and from other research
materials obtained. However, similar to the super user topic described, the effect is not analyzed
in-depth. The two topics share some similarities, and thus they can be combined if desired. The
objectives are listed as followed:
• What is the impact from Word of Mouth?
• Do this concept need to be present in order for a digital goods to become popular?
• The concept is known from as communication between individuals, has the social digital
world affected this to an extent?
One way to approach these objectives is to do an extensive search for studies that analyze the
concept. Word of Mouth can also be simulated or modeled by using the same method described
in the super user topic. Social networks such as Twitter can be analyzed to see the effect messages about a specific product have on the product’s popularity. Fun Run is an app that became
very popular due to Word of Mouth through Twitter, and the student should approach the developers to gain more insight.
Appendix A
Guess This Sound - irSIR Model
The first table in this appendix uses Equation 7.4 to calculate the irSIR model for the case study
app, which is later used to plot the red line in Figure 7.14. The blue line in Figure 7.14 is collected
from the second table in this appendix. In order to make the reader understand the numbers
calculated in the first table, a short description is given. The variables N (the total number of
potential users) is 4,700, and β (the average acquiring rate is) 4.76%. β is 4.76% because all the
potential users will finally be acquired (100%), and thus the average acquiring rate can be calculated by dividing 1 by the number of days in this time period which is 21, this equals 4.76%.
The variable γ (the average churn rate) is calculated by dividing the total churn rate by the number of days. The total churn rate is 100 minus the total retention rate. The total retention rate
is the number of users that remains active at the end of the period, divided by the number of
downloads that period which is 4,700. The number of active users on May 10th is 103, and thus
the total retention rate in this period is 2.19%. The total churn rate is therefore 97.81%, and the
average churn rate is 4.66%.
The result of the equation gives the user activity rate I’ within the app in relation to the potential
number of users downloading the app, the retention rate and the churn rate of these users.
This will either be an increase or decrease in percentage of the activity within the app, which is
normalized and used to plot Figure 7.14. To normalize the results in the range of 0% to 100%,
Equation A.1 was used. N I 0j in Equation A.1 represents the normalized activity rate of I’, and is
calculated by using the activity rate I’ at day j minus the minimum activity rate from the whole
128
APPENDIX A. GUESS THIS SOUND - IRSIR MODEL
129
time period, which is then divided by the variance of the activity rates.
N I 0j
=
I 0j − mi n(I 0 )
max(I 0 ) − mi n(I 0 )
(A.1)
At the end of the first table the Graph Numbers are calculated and later normalized to plot the
red line in Figure 7.14. The Graph numbers are calculated by using the I’ from the day before
plus the I’ for the next day. The first table shows that Equation 7.6 is satisfied on April 28th,
which is when the app’s activity starts to decline drastically. The second table contains the irSIR
numbers calculated from the first table, and the normalized activity within the app. The activity
is collected from Figure 7.13 and later normalized by using Equation A.1. The result is used to
plot the blue line in Figure 7.14.
Figure A.1: The numbers used to calculate the irSIR model to Guess This Sound
APPENDIX A. GUESS THIS SOUND - IRSIR MODEL
130
Date
4/19/2014
4/20/2014
4/21/2014
4/22/2014
4/23/2014
4/24/2014
4/25/2014
4/26/2014
4/27/2014
4/28/2014
4/29/2014
4/30/2014
5/1/2014
5/2/2014
5/3/2014
5/4/2014
5/5/2014
5/6/2014
5/7/2014
5/8/2014
5/9/2014
5/10/2014
4/19/2014
4/20/2014
4/21/2014
4/22/2014
4/23/2014
4/24/2014
4/25/2014
4/26/2014
4/27/2014
4/28/2014
4/29/2014
4/30/2014
5/1/2014
5/2/2014
5/3/2014
5/4/2014
5/5/2014
5/6/2014
5/7/2014
5/8/2014
5/9/2014
5/10/2014
Active Users
0
114
118
583
1022
1405
1335
1486
1371
1659
1243
1062
666
469
270
349
195
142
115
103
104
104
0.000
0.007
0.010
0.308
0.591
0.837
0.792
0.889
0.815
1.000
0.733
0.616
0.362
0.235
0.107
0.158
0.059
0.025
0.008
0.000
0.000
0.000
5/10/2014
Normalized
IrSir
Figure A.2: Numbers calculated for the original activity and the irSIR model
Original Activity Rate Active users rate (irSIR)
0.000
0
0.707
1
0.964
5
30.848
19
59.062
42
83.676
70
79.177
87
88.882
99
81.491
100
100.000
92
73.265
77
61.632
60
36.183
46
23.522
34
10.733
28
15.810
19
5.913
15
2.506
11
0.771
8
0.000
5
0.000
3
0.000
0
Date
0
0.01
0.05
0.19
0.42
0.7
0.87
0.99
1
0.92
0.77
0.6
0.46
0.34
0.28
0.19
0.15
0.11
0.08
0.05
0.03
0
APPENDIX A. GUESS THIS SOUND - IRSIR MODEL
131
Appendix B
Interview With Byavisa
This Appendix provides the interview I had with the newspaper Byavisa in relation to the case
study app and this thesis.
132
APPENDIX B. INTERVIEW WITH BYAVISA
20
133
13. mai 2014 | Nr. 18 | byavisa
Masteroppgave om mobilapplikasjoner
Oppskrift for å
lykkes med mobilapp
Innovasjon: NTNU har etablert sin egen
AppLab. Flere applikasjoner som Fun
Run og Wordfeud er blitt unnfanget i
og rundt dette miljøet. – Jeg analyserer
app-markedet og hvordan man kan tjene
penger.
Tekst: ODD RAGNAR MYHR
E-post: [email protected]
– I forbindelse med masteroppgaven har jeg lagd appen «Guess This Sound», for å kunne innhente data
jeg trenger for å gå i dybden. Og kanskje tjene noen
kroner i tillegg, sier Thomas M. Tveten.
Han er snart uteksaminert siving ved NTNU, på
studieprogrammet kommunikasjonsteknologi.
APP-STYRT LIVET. Vi omgir oss med apper i større grad enn det vi trolig er klar over: Til parkering,
bussbillett, banktjenester – og til avkobling i form
av spill. En strømløs mobil legger store hindringer
i hverdagslivet…
Men mange apper dør fort ut. Ideen kan være
god, men responsen blant mobilbrukerne laber. To
forhold melder seg hvis app skal slå an.
– Enten må den være underholdene eller inneha en
hverdagsverdi lik appen «Mattilbud» eller «Smartpark». Når det gjelder spill er de gjerne adskillig
vanskeligere enn førsteinntrykk tilsier. Lik Flappy
Bird, sier Tveten.
Fenomenet Flappy Bird ble fjernet fra App Store
av utvikleren selv grunnet samvittighetskvaler for
– Hvis en
app som
tidligere
har kostet
penger
blir gratis, øker
popularitet og
omtale
raskt
folks avhengighet. Han skal daglig ha tjent 300.000
kroner på reklamer i appen.
JUNGELTELEGRAFEN GJELDER. Det er to måter
å tjene penger på hva mobilapplikasjoner gjelder.
– Enten krever utvikleren betaling for nedlasting
av appen. Eller den er gratis, men åpen for reklame.
Selv om det dreier seg om noen få kroner, viser det
seg at forbrukere er skeptisk til å kjøpe apper, sier
masterstudent Tveten.
De som koster gjøre det ofte dårligere, og genererer
dermed mindre inntekter.
– De fleste suksessrike apper har spredt seg
organisk, via jungeltelegrafen. For å skape ekstra
akselerasjon knytter mange av appene seg opp til
sosiale nettverk, hvor de frister med ekstra poeng
eller andre tilleggstjenester for at appen skal spre
seg fortere.
FRA EKSKLUSIV TIL ALLMENN. I bakgrunnsmaterialet til masteroppgaven har han sett hvordan
enkelte mekanismer fungerer.
– Hvis en app som tidligere har kostet penger blir
gratis, øker popularitet og omtale raskt. Enkelte apper har gjentatte ganger vekslet mellom å ta betalt og
å være vederlagsfri. Da ser man ser at populariteten
ofte restartes. Dog på et mindre nivå enn ved første
runde, forteller Tveten.
MÅ PUSHES FREM. Hanna Aase (30) mottok
600.000 kroner fra Innovasjon Norge til å videreutvikle «Wonderloop»; en mobilapp som lar brukeren
laste opp 20 sekunder lang videosnutt av seg selv.
Samtidig investerer rederfamilien Ugland et tilsvarende beløp.
How to. Mastergradstudent ved
NTNU, Thomas
M. Tveten har
sett på hvordan
lansere og tjene
penger på mobilapplikasjoner.
– Selv om jungeltelegrafen er viktig, ser jeg fra lansering av egen app at popularitet faller fort hvis man
ikke lengre promoterer produktet, gjennom nett og
nettverk, sier Tveten.
Han anslår at gjennomsnittlig levetid for en app
ligger fra ett til halvannet år.
– Skal du tjene penger på en app, har du det travelt.
Utbredelsen skjer ofte fort og eksplosivt, før den faller dramatisk igjen.
– Skal du tjene penger på an app,
har du det travelt. Utbredelsen
skjer ofte fort og eksplosiv
HOW-TO-OPPSKRIFT. Etter å ha sanket inn data,
ser han et soleklart moment av rulett i det å lansere
en app.
– Du må treffe med timingen. Hva folk ønsker å
spille, eller apper de føler forenkler hverdagen – er
svært vanskelig å forutse.
Han tror masteroppgaven kan være nyttig lesestoff
for app-utviklere, før de lanserer. produktet
– Oppgaven følger en how-to-oppskrift: Prosessen
bak utviklingen av en app, og hvordan markedsføring og andre strategivalg (gratis eller betalende)
påvirker appens potensielle utbredelse og inntjening, avslutter Tveten.
Appendix C
Interview In Mobile App Growth Hacks
This Appendix contains my interview from the book Mobile App Growth Hacks written by Michelle
Nunez, the CO-founder of the American company Serenity App Solutions.
134
APPENDIX C. INTERVIEW IN MOBILE APP GROWTH HACKS
Developer Name:
Thomas M. Tveten
Most Successful App(s) to Date:
Guess This Sound
How long have you been developing apps and how did you get
started?
I have developed apps for about two years. I started to develop an
HTML5 app when I worked at Cisco as a summer internship in 2012,
and another HTML5 app when I worked at a Norwegian company called
Visma as a summer internship in 2013. After the summer 2013, I
started to develop some basic stuff on my own, until I started
developing Guess This Sound in December.
What do you love most about being an app developer?
The things I love the most is that I can decide my own work hours,
promoting something I have created myself and see the effect of it.
The learning curve is also exponential, at least at the beginning, which
is very cool except of course the days when you really hit the wall. I
would say that the one thing I love the most is that you can see other
people actually love what you have created.
Figure C.1: My Interview Part 1
135
APPENDIX C. INTERVIEW IN MOBILE APP GROWTH HACKS
What's the biggest challenge you face when trying to market
your app(s)?
The biggest challenges when it comes to market is to gain a user base
fast with a very strict budget. This is my first app which I really try to
promote, and by starting on scratch with 0 user on the like page on
Facebook, few followers on Twitter, and a limited budget it is really
hard to spread the word especially in Norway which is not that large
and people tend to be very skeptical to new things.
Is there anything you would like to see changed or done
differently in the App Store?
The developing guide to App Store is chaos, it is an inception of
documents and it is very hard to get started there. I recommend
searching for other tutorials. App Store also has a review process on
approximately 1 week, this is of course good for the users because
they carefully review the apps, but for developers this is sometimes
very annoying. Especially when you develop an app all alone, one need
to be very carefully when submitting the app, since bugs cannot be
fixed before a week after.
Any advice you would give to developers who may just be
starting out?
When developing an app, make it user friendly. It is very easy to get
blind on your own design and functionalities, thinking that it is much
easier to use than it really is. Create an tutorial to be sure all the users
understand it. The other thing as I mentioned above is to be very
carefully when submitting the app. Users hate bugs, and they will
delete your app and/or give it bad rating if it does not meet their
expectations. One thing to remember is that users tend to rate the app
1 star or 5 star. From the first day the app gets published on App
Store, start the marketing aggressively, the longer it is on App Store
with few downloads, the harder it is to get the users attention.
Therefore, if the app has many bugs or it is not user friendly, it could
actually be very destructive for your app in the future.
Figure C.2: My Interview Part 2
136
Bibliography
[1] Buster Hein, Cult of Mac (2013) The Evolution of iOS. http://www.cultofmac.com/
191340/the-evolution-of-ios-from-iphone-os-to-ios-6-gallery/
[2] Tech Crunch (2014) Apple’s App Store: 1 Billion Served. http://techcrunch.com/2009/
04/23/apples-app-store-1-billion-served/
[3] The
apps
Verge,
in
Nathan
App
Ingraham
Store.
(2013)
Apple
announces
1
million
http://www.theverge.com/2013/10/22/4866302/
apple-announces-1-million-apps-in-the-app-store
[4] Frobes
tory.
(2012)
Apple
the
most
valuable
company
in
his-
http://www.forbes.com/sites/benzingainsights/2012/08/21/
apple-now-most-valuable-company-in-history/
[5] Mashable (2013) Angry Birds company doubles annual revenue. http://mashable.com/
2013/04/03/angry-birds-2012-earnings-report/
[6] Phone Arena (2012) Draw Something creators sold. http://www.phonearena.com/news/
Draw-Something-creator-sold-for-180-million_id28313
[7] The Next Web (2014) Facebook passes 1.23 billion monthly active users, 945 million mobile users, and 757 million daily users. http://thenextweb.com/facebook/2014/01/29/
facebook-passes-1-23-billion-monthly-active-users-945-million-mobile-users-757-millio
[8] Tech Hive (2013) Instagram has 90 million active users. http://www.techhive.com/
article/2025801/facebooks-instagram-says-it-has-90-million-monthly-active-users.
html
137
BIBLIOGRAPHY
138
[9] CNBC (2013) Why Snapchat is worth 800 million. http://www.cnbc.com/id/100911089
[10] WSJ
fer
Snapchat
(2013)
from
Facebook.
spurned
3
billion
acquisition
of-
http://blogs.wsj.com/digits/2013/11/13/
snapchat-spurned-3-billion-acquisition-offer-from-facebook/?mg=
blogs-wsj&url=http%253A%252F%252Fblogs.wsj.com%252Fdigits%252F2013%252F11%
252F13%252Fsnapchat-spurned-3-billion-acquisition-offer-from-facebook
[11] Techno Buffalo (2013) Snapchat allegedly rejected 4B buyout offer from Google. http://
www.technobuffalo.com/2013/11/15/snapchat-4-billion-google-offer/
[12] ABC News (2013) Snapchat does not make any money. http://abcnews.go.com/blogs/
business/2013/11/snapchat-doesnt-make-any-money-why-is-it-worth-so-much/
[13] ABC News (2013) Twitter closes at 44.90 per stock. http://abcnews.go.com/blogs/
business/2013/11/smooth-day-for-twitter-ipo-as-twtr-closes-at-44-90/
[14] Daily
Mail
Facebook
(2012)
lion.
has
lost
more
than
50
bil-
http://www.dailymail.co.uk/news/article-2198464/
Facebook-lost-50bn-share-value--MORE-Lehman-Brothers-did-year-meltdown.
html
[15] Money MSN (2012)
Inside Facebook’s money machine.
http://money.msn.com/
technology-investment/post.aspx?post=869a1b6c-0bb7-47b3-ac0a-25d10f6a5404
[16] Ycharts (2012)
Exxon Mobile Market Cap.
http://ycharts.com/companies/XOM/
market_cap
[17] Oslo Stock Exchange (2014) Oslo Stock Exchange Telenor. http://www.oslobors.no/ob_
eng/markedsaktivitet/stockList?newt__menuCtx=1.1
[18] Apple
enue
insider
per
(2013)
download.
Apple’s
iOS
brings
developers
5x
more
rev-
http://appleinsider.com/articles/13/11/27/
apples-ios-brings-developers-5x-more-revenue-per-download-than-android
[19] The Geek (2014) What is an API ?. http://theegeek.com/what-is-an-api/
BIBLIOGRAPHY
139
[20] Tapsense (2013) Hybrid Apps vs Native Apps. http://tapsense.com/blog/2013/09/30/
hybrid-apps-vs-native-app-the-verdict-is-in-go-native-and-give-your-users-something-t
Software bugs.
[21] Princeton (2014)
http://www.princeton.edu/~achaney/tmve/
wiki100k/docs/Software_bug.html
[22] Forbes (2013) App Store about to hit 1 million apps. http://www.forbes.com/sites/
chuckjones/2013/12/11/apples-app-store-about-to-hit-1-million-apps/
[23] AppBrain (2014) Number of Apps on Google Play. http://www.appbrain.com/stats/
number-of-android-apps
[24] Bianor (2011) Which are the most downloaded mobile app?. http://www.bianor.com/
blog/which-are-the-most-downloaded-mobile-apps/
[25] Mixpanel (2013) The new standards for mobile app retention. https://mixpanel.com/
blog/2013/11/04/trends-report-the-new-standards-for-mobile-app-retention/
[26] Mashable (2013)
9 Mobile App KPIs to know.
http://mashable.com/2013/09/04/
mobile-app-metrics/
[27] Capptain (2014) Mobile Apps KPI 4 - Customer Lifetime value. http://fr.capptain.com/
2014/03/20/mobile-apps-kpi-4-customer-lifetime-value/
[28] Spoken Communications (2010) Cost to acquire a new customer. http://blog.spoken.
com/2010/10/cost-of-acquiring-a-new-customer-6-to-7-times-more-than-keeping-exisiting
html
[29] Capptain (2014) Customer Acquisition Cost. http://www.capptain.com/2014/02/06/
mobile-apps-kpi-1-customer-acquisition-cost/
[30] Capptain
(2014)
Retention
Rate.
http://fr.capptain.com/2014/02/20/
mobile-apps-kpi-2-retention-rate/
[31] Capptain (2014) ARPU, ARPPU, and ARPDAU. http://www.capptain.com/2014/03/14/
mobile-apps-kpi-3-arpu-arppu-and-arpdau/
BIBLIOGRAPHY
140
[32] Slate (2013) Spotify pays the artist per song. http://www.slate.com/blogs/business_
insider/2013/12/05/how_much_does_spotify_pay_artists_in_royalties.html
[33] Founders Space (2013)
In-app purchasing data.
http://www.foundersspace.com/
business/in-app-purchasing-on-ios-and-android-freemium-games/
[34] Techcrunch (2013)
In-app purchases.
http://techcrunch.com/2013/03/28/
in-app-purchase-revenue-hits-record-high-accounts-for-76-of-u-s-iphone-app-revenue-90
[35] Thomas Carter (2012) Hacking App Store Pricing. http://www.bluecloudsolutions.
com/blog/hacking-app-store-pricing/
[36] Tech Crunch (2013) Paid apps versus free apps . http://techcrunch.com/2013/10/02/
its-over-for-paid-apps-with-a-few-exceptions/
[37] Springer Link (2014) Journal of Mathematical Biology. http://link.springer.com/
article/10.1007%2FBF00163027
[38] John Cannarella and Joshua A. Spechler, Princeton University (2014) Epidemiological modeling for online social network dynamics. http://arxiv.org/pdf/1401.4208v1.pdf
[39] The Guardian (2012) Draw Something gets more social. http://www.theguardian.com/
technology/appsblog/2012/apr/18/draw-something-social-features
[40] Codenametech (2013) Smartphone OS global market share. http://codenametech.com/
?p=11140
[41] Ed Sutherland (2013) Android vs iOS in revenue. http://www.idownloadblog.com/2013/
04/17/apple-ios-still-revenue-champ/
[42] Difference between(2013)
Difference between an app and software.
http://www.
differencebetween.info/difference-between-software-and-application
[43] Organic Chemistry (2012) Snake the first mobile phone game. http://ochemclothing.
com/way-back-whensdays-snake-the-first-mobile-phone-game/
BIBLIOGRAPHY
[44] Online
lion
141
Marketing
Trends
Downloads.
Apple
(2011)
Apps
Store
Reaches
10
Bil-
http://www.onlinemarketing-trends.com/2011/01/
apple-apps-store-reaches-10-billion.html
[45] Ultraunboxing (2012)
Pictures of Draw Something.
http: // ultraunboxing. com/
wp-content/ uploads/ 2012/ 06/ IMG_ 0159. png
[46] mLearning (2012)
The long tail.
http: // blog. commlabindia. com/ elearning/
elearning-and-mlearning
[47] Wikipedia (2014) SIR model. http: // en. wikipedia. org/ wiki/ File: Sirsys-p9.
png
[48] Mashable (2011) 8 Best Practices for Deploying a Top-Ranked Mobile App. http: //
mashable. com/ 2011/ 08/ 23/ mobile-app-ranking-tips/
[49] The Guardian (2012) Draw Something gets more social. http: // www. theguardian.
com/ technology/ appsblog/ 2012/ apr/ 18/ draw-something-social-features
[50] Inc (2012)
Future of Mobile Apps:
4 Predictions .
http: // www. inc. com/
christina-desmarais/ developers-predict-future-of-mobile. html
[51] PC Mag (2010) Apple Trademarks ’There’s an App for That’. http: // www. pcmag. com/
article2/ 0,2817,2370650,00. asp
[52] Mixpanel(2013) Retention rate mobile applications. https: // mixpanel. com/ blog/
2013/ 11/ 04/ trends-report-the-new-standards-for-mobile-app-retention/
[53] Facebook Service Purchase (2014)
needed).
The ad’s potential reach on Facebook (access is
https: // www. facebook. com/ ads/ create/ ?fbid= 550808031693062&ref=
promoted_ like&act= 346660486
[54] Gartner (2013) Total revenue app market. http: // www. gartner. com/ newsroom/ id/
2592315
[55] Catalyst
(2012)
One
percentage.
http: // www. canalys. com/ newsroom/
top-25-us-developers-account-half-app-revenue#
BIBLIOGRAPHY
142
[56] Slinger Jansen, Michael A. Cusumano and Sjaak Brinkkemper (2013) Software Ecosystems: Analyzing and Managing Business Networks in the Software Industry https: //
play. google. com/ store/ books/ details? id= 1PD_ DB_ -kBAC&rdid= book-1PD_ DB_
-kBAC&rdot= 1&source= gbs_ vpt_ read&pcampaignid= books_ booksearch_ viewport
[57] Myryam Roshan Kokabha, Aalto university, school of Economics (2012) Mobile application
Ecosystem from the Application Developers’ Perspective. http: // epub. lib. aalto. fi/
en/ ethesis/ pdf/ 12912/ hse_ ethesis_ 12912. pdf
[58] The Economic Times (2012) Value Chain. http: // economictimes. indiatimes. com/
definition/ value-chain
[59] Investopedia (2012)
Value Network.
http: // www. investopedia. com/ terms/ v/
value-network. asp
[60] Charles Wankel (2009) Encyclopedia of Business in Today’s World. http: // knowledge.
sagepub. com/ view/ businesstoday/ n962. xml
[61] Felix Cuadrado, Queen Mary University of London (2012) Mobile App Value Network.
http: // oa. upm. es/ 16744/ 1/ INVE_ MEM_ 2012_ 136570. pdf
[62] Gartner (2012) The percentage of free apps is increasing. http: // www. gartner. com/
newsroom/ id/ 2153215
[63] Freemium.org (2012)
The Concept of Freemium.
http: // www. freemium. org/
wp-content/ ebook-101. pdf
[64] Comscore (2013) 2013 Mobile Future in Focus. http: // www. comscore. com/ Insights/
Presentations_ and_ Whitepapers/ 2013/ 2013_ Mobile_ Future_ in_ Focus
[65] Study Mode (2010)
Word of Mouth.
http: // www. studymode. com/ essays/
Word-Of-Mouth-515948. html
[66] Nielsen (2014)
Global Trust in Advertising.
http: // www. nielsen. com/ us/
en/ reports/ 2012/ global-trust-in-advertising-and-brand-messages. html?
__ hstc= 124833621. 2c00ae87e00a2ae7b54cbb588da8be54. 1391065234934.
BIBLIOGRAPHY
143
1391065234934. 1391145932500. 2&_ _hssc= 124833621. 1. 1391145932500&_ _hsfp=
3906698412
[67] Market
Force
(2012)
Market
Influenced.
http: // www. marketforce.
com/ press-releases/ item/ research-social-media-influence/ ?_ _hstc=
124833621. 2c00ae87e00a2ae7b54cbb588da8be54. 1391065234934. 1391065234934.
1391145932500. 2&_ _hssc= 124833621. 1. 1391145932500&_ _hsfp= 3906698412
[68] McKinsey (2010)
A new way to measure word-of-mouth marketing.
http:
// www. mckinsey. com/ insights/ marketing_ sales/ a_ new_ way_ to_ measure_
word-of-mouth_ marketing
[69] Harris Interactive(2010) Word Of Mouth Influence. http: // www. harrisinteractive.
com/ NewsRoom/ HarrisPolls/ tabid/ 447/ mid/ 1508/ articleId/ 403/ ctl/
ReadCustom% 20Default/ Default. aspx
[70] About.com (2013)
Number of apps on App Store.
http: // ipod. about. com/ od/
iphonesoftwareterms/ qt/ apps-in-app-store. htm
[71] Wikipedia (2014) Number of apps on Google Play. http: // en. wikipedia. org/ wiki/
Google_ Play
[72] News.com (2014)
Snapchat turn down offers.
http: // www. news. com. au/
technology/ online/ yahoo-trashes-google-apple-and-snapchat-at-ces/
story-fnjwnhzf-1226797530150
[73] Xiangqian Kong Master Thesis Helsinki School of Economics (2009) Business Model Analysis.
http: // epub. lib. aalto. fi/ fi/ ethesis/ pdf/ 12191/ hse_ ethesis_ 12191.
pdf
[74] Forbes
Purchase.
(2012)
Draw
Something
Loses
5M
Users
a
Month
After
Zynga
http: // www. forbes. com/ sites/ insertcoin/ 2012/ 05/ 04/
draw-something-loses-5m-users-a-month-after-zynga-purchase/
[75] Nir Eyal (2012) How to manufacture desire. http: // techcrunch. com/ 2012/ 03/ 04/
how-to-manufacture-desire/
BIBLIOGRAPHY
144
[76] Aytm (2012) Angry Birds Addiction. https: // aytm. com/ blog/ research-junction/
angry-birds-addiction/
[77] Dirtybit (2013)
Dirtybit history.
http: // dirtybit. com/ blog/ 2013-09-13_ The_
history_ of_ Fun_ Run/ #. U2Ikil7dV8s
[78] Microsoft Developer Network (2014) Wireless Application Protocol (WAP) API. http: //
msdn. microsoft. com/ en-us/ library/ aa920063. aspx
[79] Mobile phone history (2013)
The first phone with WAP.
http: // www.
mobilephonehistory. co. uk/ nokia/ nokia_ 7110. php
[80] Microsoft (2012) First smartphone. http: // research. microsoft. com/ en-us/ um/
people/ bibuxton/ buxtoncollection/ detail. aspx? id= 40
[81] 2G Prod (2014) 2G Technologies. http: // www. 2gprod. com
[82] Techopedia (2014) Third Generation Wireless (3G). http: // www. techopedia. com/
definition/ 2918/ third-generation-wireless-3g
[83] Phone Evaluation (2014)
History of Mobile Phones Evoluation.
http: //
phoneevolution. wordpress. com/ author/ ainaanna/
[84] BusinessTect (2013) Top selling mobile phones. http: // businesstech. co. za/ news/
mobile/ 45406/ top-selling-mobile-phones-of-all-time/
[85] Nasdaq (2013) Apple is the king bit Microsoft is a threat. http: // www. nasdaq. com/
article/ apple-is-still-king-of-us-smartphone-market-but-globally-microsoft-is-a-threa
[86] Extreme Tech (2014) Windows gives away free phones. http: // www. extremetech. com/
computing/ 178435-microsoft-starts-giving-away-windows-phone-for-free-to-compete-with[87] The Verge (2013) Microsoft acquire Nokia phones. http: // www. theverge. com/ 2013/
9/ 2/ 4688530/ microsoft-buys-nokias-devices-and-services-unit-unites-windows-phone
[88] Colour Affects (2012) Psychological Properties Of Colors. http: // www. colour-affects.
co. uk/ psychological-properties-of-colours
BIBLIOGRAPHY
[89] Software
145
testing
fundamentals
(2012)
Black
Box
testing.
http: //
Testing.
http: //
softwaretestingfundamentals. com/ black-box-testing/
[90] Software
testing
fundamentals
(2012)
White
Box
softwaretestingfundamentals. com/ white-box-testing/
[91] Wikipedia (2014) Back-end Database. http: // en. wikipedia. org/ wiki/ Back-end_
database
[92] Small
Business
Mobile
App
(2012)
How
create.
Much
in
Advertising
Can
a
http: // smallbusiness. chron. com/
much-advertising-revenue-can-mobile-app-generate-76855. html
[93] Flurry Research (2011) Average IAPs Per User. http: // www. flurry. com/ bid/ 67748/
Consumers-Spend-Average-of-14-per-Transaction-in-iOS-and-Android-Freemium-Games#
.U2q0PF7dVQU
[94] TechCrunch (2009) Average Shelf Life of Apps. http: // techcrunch. com/ 2009/ 02/ 19/
pinch-media-data-shows-the-average-shelf-life-of-an-iphone-app-is-less-than-30-days/
[95] App Quality Alliance (2013) Best Practice Guide. http: // www. appqualityalliance.
org/ files/ AQuA_ best_ practices_ doc_ v2_ 3_ final_ june_ 2013. pdf
[96] Sticky Branding (2010) Customer Buying Cycle. http: // www. stickybranding. com/
have-a-problem-study-your-customers/
[97] Linfo (2004) GUI Definition. http: // www. linfo. org/ gui. html
[98] Digital
Business
Business
Strategy.
Model
(2013)
Difference
Between
Business
Models
and
http: // www. digitalbusinessmodelguru. com/ 2013/ 02/
difference-between-business-models-and. html
[99] The Wall
Because
Street Journal
of
Addiction.
(2014)
Flappy Bird’s Creator Pulled The Game
http: // online. wsj. com/ news/ articles/
SB10001424052702303874504579376323271110900
BIBLIOGRAPHY
146
[100] Mashable (2014) The Man Behind ’Helicopter Game,’ the Original ’Flappy Bird’. http:
// mashable. com/ 2014/ 02/ 09/ flappy-bird-helicopter-game/
[101] Mashable (2014) 28 Days of Fame: The Strange, True Story of ’Flappy Bird’. http: //
mashable. com/ 2014/ 02/ 10/ flappy-bird-story/
[102] Forbes
(2014)
ers.
Mobile
Apps
Won’t
Lead
To
Riches
For
Most
Develop-
http: // www. forbes. com/ sites/ connieguglielmo/ 2014/ 01/ 13/
mobile-apps-may-not-pave-the-way-to-developer-riches-sales-average-less-than-1250-a-d
[103] Texas Agrilife Extension (2013) Mayfly. https: // insects. tamu. edu/ fieldguide/
aimg3. html
[104] Forbes
(2014)
How
panies?.
Do
Investors
Value
Pre-Revenue
Com-
http: // www. forbes. com/ sites/ quora/ 2014/ 01/ 24/
how-do-investors-value-pre-revenue-companies/
[105] Business Insider (2014)
Everyone Who Thinks Facebook Is Stupid To Buy What-
sApp For $19 Billion Should Think Again.
http: // www. businessinsider. com/
why-facebook-buying-whatsapp-2014-2
[106] Business Insider (2012) Facebook Buys Instagram For 1 Billion Dollar. http: // www.
businessinsider. com/ facebook-buys-instagram-2012-4
[107] Forbes (2013) Paid Apps Having A Bad Time, Almost All Revenue Is From In App Purchases In Free Apps.
http: // www. forbes. com/ sites/ timworstall/ 2013/ 12/ 30/
paid-apps-having-a-bad-time-almost-all-revenue-is-from-in-app-purchases-in-free-apps/
[108] Hochman Consultants (2013) The Cost of Pay Per Click (PPC) Advertising-trends and
Analysis COST OF PAY-PER-CLICK (PPC) ADVERTISING—TRENDS AND ANALYSIS. http:
// www. hochmanconsultants. com/ articles/ je-hochman-benchmark. shtml
[109] Parse (2014) Parse Pricing Structure. https: // www. parse. com/ plans
[110] Techopedia (2013) Mobile Application (Mobile App). http: // www. techopedia. com/
definition/ 2953/ mobile-application-mobile-app
BIBLIOGRAPHY
[111] Inside
load
Mobile
15
app
147
free
Apps
apps
(2012)
for
store.
Distimo:
every
paid
app
U.S.
consumers
purchased
in
the
downiPhone
http: // www. insidemobileapps. com/ 2012/ 09/ 18/
distimo-u-s-consumers-download-15-free-apps-for-every-paid-app-purchased-in-the-iphon
[112] Read
Native
Write
(2013)
Mobile
How
Long
App?.
Does
It
Take
To
Build
A
http: // readwrite. com/ 2013/ 01/ 09/
how-long-does-it-take-to-build-a-native-mobile-app-infographic# awesm=
~oGkO2v9vwGFBnM
[113] App Annie (2014)
Alpha Combat’s Rank History.
http: // www. appannie. com/
apps/ ios/ app/ 467315152/ rank-history/ #vtype= day&countries= NO,US&start=
2014-04-01&end= 2014-06-10&view= grossing&lm= 3
[114] New Vision (2014) Firefox aims to power $25 smartphone. http: // www. newvision.
co. ug/ news/ 652892-firefox-aims-to-power-25-smartphone. html
[115] Wamda (2013) What are the most popular mobile app categories worldwide?. http:
// www. wamda. com/ 2013/ 11/ popular-mobile-app-categories-worldwide
[116] ZDNet
ness;
(2014)
acquires
Microsoft
25,000
new
takes
control
employees.
of
Nokia’s
phone
busi-
http: // www. zdnet. com/
microsoft-takes-control-of-nokias-phone-business-acquires-25000-new-employees-7000028


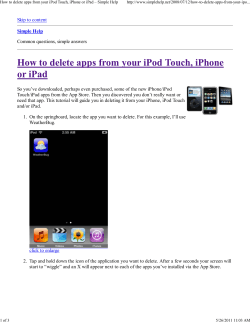

© Copyright 2026