
Document 219193
JANUARY 6, 2014 HOW TO LIVE FOREVER: A STUDY OF ANTIOXIDANTS IN FRUIT AUDREY NORRIS MNG RAEMIBUEHL, 4D Supervisor: Lorenz Marti Audrey Norris, 4d Abstract: Though antioxidants are vital to healthy eating, as they protect the cell against cell aging, they are widely misrepresented in modern media. This over-embellishment of their properties piqued my interest. Through this project, I attempted to determine which of several fresh fruits and fruit juices contained the most antioxidants. First, I needed to determine what an antioxidant was, and what the best method for measuring their activity would be. After research, and consulting with Dr. Elisabeth Janssen, my mentor in Professor Kris McNeil’s laboratory at ETH Zurich, I found a viable option: the ORAC assay. Using this method, I was able to determine the antioxidant capabilities of several varieties of fresh fruits and fruit juices, including both green and purple grapes, blueberries, and cherries, among others. After collecting the data, I compared the results of the assay to determine which fruit was the “healthiest”, in the sense of having the highest antioxidant capacity. I found that of all the tested fruits, cherries had the highest antioxidant capacity and that most antioxidants are to be found in the skin of the fruit. Of the fruit juices tested, the store-bought Tropicana Antioxidant juice had the highest antioxidant capacity, with the fresh pomegranate juice having the second highest. 1 Audrey Norris, 4d Table of Contents 1. Introduction ............................................................................................................................................. 4 1.1. Motivation ........................................................................................................................................ 4 1.2. Hypotheses ....................................................................................................................................... 4 2. Theory ..................................................................................................................................................... 6 2.1. Antioxidant Definition ...................................................................................................................... 6 2.2. Measuring Antioxidant Activity ....................................................................................................... 7 2.2.1. HAT-Assays .............................................................................................................................. 7 2.2.2. The ORAC Assay ...................................................................................................................... 8 2.3. Essential Substances for the ORAC Assay ....................................................................................... 9 2.3.1. AAPH ........................................................................................................................................ 9 2.3.2. Fluorescein ................................................................................................................................. 9 2.3.3. Trolox ........................................................................................................................................ 9 2.4. Equipment ....................................................................................................................................... 10 2.4.1. Lyophilizer ............................................................................................................................... 10 2.4.2. Microplate Reader3 .................................................................................................................. 11 2.4.3. Sonicator4 ................................................................................................................................. 11 2.4.4. Vacuum Filter .......................................................................................................................... 12 3. Measurement and Preparation Methods ................................................................................................. 13 3.1. Phosphate Buffer ............................................................................................................................ 13 3.2. Fluorescein Solution ....................................................................................................................... 14 3.3. Trolox Solution ............................................................................................................................... 14 3.4. Fruit Preparation ............................................................................................................................. 15 3.4.1. Fruit Samples ........................................................................................................................... 15 3.4.2. Fruit Juice Samples .................................................................................................................. 17 3.5. AAPH Solution ............................................................................................................................... 18 3.6. Protocol ........................................................................................................................................... 18 4. Experiments ........................................................................................................................................... 20 4.1. Preliminary Experiments ................................................................................................................ 20 4.2. Trolox Calibration .......................................................................................................................... 21 4.3. Juice Tests ...................................................................................................................................... 22 4.4. Solid Fruit Samples ........................................................................................................................ 25 2 Audrey Norris, 4d 5. Results ................................................................................................................................................... 26 5.1. Trolox Calibration .......................................................................................................................... 26 5.2. Juice Tests ...................................................................................................................................... 28 5.3. Solid Fruits ..................................................................................................................................... 34 6. Discussion .............................................................................................................................................. 38 6.1. Trolox Calibration .......................................................................................................................... 38 6.2. Juice Tests ...................................................................................................................................... 38 6.3. Solid Fruit Tests .............................................................................................................................. 39 7. Reflection .............................................................................................................................................. 43 8. Conclusions ........................................................................................................................................... 44 9. Acknowledgements ............................................................................................................................... 45 10. Bibliography ........................................................................................................................................ 46 11. Appendix ............................................................................................................................................. 50 Bestätigung der Eigenständigkeit .............................................................................................................. 54 3 Audrey Norris, 4d 1. Introduction 1.1. Motivation Living in the modern world, we are bombarded with dozens of advertisements, commercials, and product placements every day, all trying to capture our attention. In recent years, corporations have been implementing a new strategy — medical and science jargon. For example, in order to promote the beneficial effects of a new anti-aging cream, cosmetic companies began to use terminology such as “biomolecular,” “microtechnology,” and “pro-collagen.” Subconsciously, these words make us believe that the advertised products are more modern, technological, and in turn, better for us. Therefore, we are more likely to purchase them, despite their higher cost [Singer, 2008]. However, more often than not the general public has no idea what these terms actually mean. Take, for example, a Welch’s Grape Juice advertisement (Figure 1) that boasted of its high antioxidant levels. Most people have Figure 1: Welch’s antioxidant ad campaign. only a vague idea of what an antioxidant is and does. If directly asked, they, most likely, would not know the complex science behind the term. It would simply be a “health word.” After learning about oxidation and reduction in chemistry, I became curious about these compounds. What does antioxidant mean? Why are they considered so healthy? For this reason, I decided to pursue the investigation of antioxidants. Not only did I want to understand the term and its applications, I wanted to study what foods contain the highest levels of antioxidants. I was most interested in the antioxidant capacity of fruits, as they were the substance I most associated with antioxidants. 1.2. Hypotheses I collected a list of six different fruits that the media portrays as containing large amounts of antioxidants: blackberries, blueberries, cherries, cranberries, grapes, and pomegranates. Of these, my goal was to determine which one had the highest antioxidant capacity. Due to my personal 4 Audrey Norris, 4d experience, and reports in the popular press, my expectation was that pomegranates would be the highest in antioxidants. I also conducted a small, informal survey of my friends and family to investigate which fruit they associated with antioxidants, and pomegranates ranked the highest. Other fruits that were potentially better than the listed samples, like açai berries, were infeasible to test, due to their limited availability. The second factor I wanted to examine was the location of the highest quantity of antioxidants in the fruit. The fruit is composed of two components: the skin and the flesh. The flesh also contains the juice. A question that arose during my preliminary research was which part of the fruit contains the most antioxidants. As naturally occurring antioxidants such as vitamin C, which can be found in fruits, are hydrophilic, I assumed that most of the antioxidants in the fruit would be as well. The skin has a waxy texture, suggesting hydrophobic character. I therefore expected that the hydrophilic antioxidants would not be located in the skin. I anticipated that the majority of the antioxidants would be found in the flesh. Although dietary supplements of antioxidants have recently become more controversial for their possible detrimental effects on health [Watson, 2013; Williams, 2013], the positive effect of antioxidants in fruits and vegetables aids the body [Hertog, 1993; Eberhardt, 2000]. Though this may be due to the combined action of the antioxidants with other substances found naturally in the fruit or vegetable [Apak, 2013], they are considered to play a large role in reducing the risks of several diseases, such as heart disease or even cancer (see Section 2.1) [Hertog, 1993; Machlin, 1987]. Despite the myths portrayed in the media of antioxidants completely reversing aging, their real value lies in their protective traits, as explained in Section 2.1. While I might not be able to answer the age-old question of how to live forever, I will be able to determine which fruit has a higher potential to supply us with antioxidants. 5 Audrey Norris, 4d 2. Theory 2.1. Antioxidant Definition An antioxidant is a compound that has the potential to protect other molecules from oxidation, or the loss of electrons [Zumdahl, 2007]. When an oxidizing agent attempts to react with a molecule and gain the desired number of electrons, an antioxidant, if present, can react with the agent instead. The oxidizing agent will therefore only obtain electrons from the antioxidant and not from the molecule. Through its participation in the redox reaction and consequent oxidation, the antioxidant is able to prevent the reaction between the molecule and the agent. Another way an antioxidant may protect the molecule from oxidation is by donating the necessary electrons to an already oxidized molecule, thereby reversing the damage caused by an oxidative agent. For the ORAC assay (see Section 2.2.2), only the first mechanism is used [Apak, 2013]. Whether the oxidizing agent reacts with the molecule or an antioxidant depends on the quantity of antioxidants present. Since the agent can react with either substance when both substances are available, it is a probabilistic event. However, because an antioxidant can react more easily with an oxidizing agent, the concentration of the antioxidants required to hinder the oxidation can be comparatively low [Apak, 2013]. When the concentration of antioxidants reaches the required quantity, the molecules can be considered protected from oxidation. This protection continues as long as sufficient antioxidants are available. Many different compounds can act as oxidizing agents, but the class of agents investigated for this project are called free radicals. Free radicals are molecules or atoms with an unpaired electron, and are hence extremely reactive and capable of taking electrons from other substances [Zumdahl, 2007]. Free radicals are present in environmental hazards, such as tobacco smoke, and occur naturally in the body during the break down of food. If the quantity of these destructive agents becomes too high, the cell becomes damaged and can no longer repair itself. This is called oxidative stress.1 The chain reactions that the radicals initiate can cause protein, lipid, and DNA damage, which age the cell and can even cause cell death [Apak, 2013]. Due to these negative effects, free radicals are thought to play a large role in several diseases, including heart disease and cancer [Hertog, 1993; Machlin, 1987]. 6 Audrey Norris, 4d Therefore, antioxidants are extremely important for the human body, as they can protect its cells against free radicals and their harmful chain reactions [Hertog, 1993]. Antioxidants also have huge potential as a natural medicine because many antioxidants occur in fruits and vegetables, which work better than synthetic supplements [Eberhardt, 2000]. Antioxidants are divided into two main groups, hydrophilic and hydrophobic. Hydrophilic antioxidants, such as ascorbic acid, are soluble in water, whereas hydrophobic antioxidants are soluble in lipids [Apak, 2013]. 2.2. Measuring Antioxidant Activity The most common way to quantify how well an antioxidant can inhibit the effect of a free radical is through an assay. Assays are procedures where the reactivity of a certain substance is measured. In the case of antioxidants, the procedure determines how reactive a sample is towards a free radical, relative to a reference compound. Due to the diversity of antioxidants, various methods are available to determine the capacity of an antioxidant. Here we used a hydrogenatom-transfer (HAT) assay [Apak, 2013; Huang, 2005]. 2.2.1. HAT-Assays A HAT assay measures how well an antioxidant donates hydrogen atoms. In other words, instead of donating electrons to the radical, the antioxidant provides hydrogen atoms. To function, the assay requires three substances in the same solution: a source of free radicals, a reference compound, and the antioxidant. Below, the free radical is referred to in standard shorthand notation as ROO•, where the dot represents the lone electron on the molecule. Such radicals arise when an organic substance, denoted by R, reacts to form an oxygen radical, ROO• [Glazer, 1990; Apak, 2013]. Both the reference compound, which is fluorescent, and the antioxidant can react with ROO•. By measuring the fluorescent signal from the reference molecule as a function of time, the protective ability of the antioxidant can be determined. For example, in the absence of antioxidants, the fluorescent reference immediately begins to degrade due to the reaction. Consequently, its fluorescence signal decays until it can no longer be measured. However, in the presence of antioxidants, ROO• first preferentially reacts with the antioxidants. Because the free radicals are always in excess, the antioxidants are eventually consumed. ROO• then turns to the reference 7 Audrey Norris, 4d molecule, causing its fluorescence to decay. The additional time needed before the fluorescence signal starts to disappear (the lag time) indicates the capacity of an antioxidant. The longer it takes for the antioxidant to be consumed, the better the antioxidant can protect the fluorescent reference molecule from the oxygen radical. This ability of the antioxidant to impede the reaction between the fluorescent molecule and the radical is known as quenching [Apak, 2013]. To determine the quenching ability of an antioxidant quantitatively, the degradation of the fluorescence signal is measured as a function of time and plotted. The curve is then integrated. The larger the area is under the curve, the longer the antioxidant was capable of quenching the free radical [Dávalos, 2004]. Antioxidants used in this assay are typically phenolic compounds, which are aromatic molecules with hydroxyl groups. Such molecules can be represented as ArOH. More generally, antioxidants can be written as AH to denote any molecule ready to donate a hydrogen to the free radical. Thus, the model reaction between the antioxidant and the radical in this assay can be written as: 𝑅𝑂𝑂• + 𝐴𝐻/𝐴𝑟𝑂𝐻 → 𝑅𝑂𝑂𝐻 + 𝐴• /𝐴𝑟𝑂• The antioxidant donates its hydrogen to the radical, which neutralizes it. However, this creates a new radical, the antioxidant itself. While this could in principle cause destructive chain reactions, the new A•/ArO• species tend to neutralize themselves, creating a “closed” chain reaction. Therefore, despite being extremely reactive, they do not damage the cell [Apak, 2013]. 2.2.2. The ORAC Assay The specific HAT-assay used for this project was the ORAC assay. It is a procedure based on the work of Glazer [Glazer, 1990], Ghiselli et al. [Ghiselli, 1994], and Cao et al. [Cao, 1993]. The compound used to produce the oxygen radical is 2,2’-azobis (2-amidinopropane) dihydrochloride (see Figure 2), or AAPH. Fluorescein (Figure 3) is used as the fluorescent reference compound. The decay of its fluorescence signal is monitored over time. The radical quenching ability of the sample is extracted from the lag time in this signal [Apak, 2013; Dávalos, 2004; Dávalos, 2005]. To help eliminate difficulties when analyzing results from different sources, Trolox is often used as a reference antioxidant. See Section 2.3.3 for more information. In this case, the quenching ability of the measured sample is recorded as a value in comparison to Trolox. 8 Audrey Norris, 4d 2.3. Essential Substances for the ORAC Assay 2.3.1. AAPH 2,2’-azobis (2-amidinopropane) dihydrochloride, shortened as AAPH, is a chemical compound that is commonly used to study oxidation. It has become a model oxidant, due to the fact that it can initiate oxidation in two separate ways [Werber, 2011]. Figure 2: Molecular structure of AAPH. The AAPH molecule itself, however, is not a radical. It is the precursor to a free radical. When heated, the molecule decomposes into two peroxyl radicals and molecular nitrogen2 [Glazer, 1990]. Thus, our assay requires that all solutions are heated to the temperature where AAPH decomposes, in this case, 37°C [Dávalos, 2004]. 2.3.2. Fluorescein Fluorescein is a compound that is most commonly used as a fluorescent tracer, though it does have other uses. It has a very noticeable fluorescent yellow color when in solution, and is soluble in Figure 3: Molecular structure of fluorescein. both water and alcohol, making it very versatile. Its absorbance maximum is at 490 nm, and its emission maximum is at 575 nm when dissolved in water and excited at 540 nm [Glazer, 1990]. The molecular structure of fluorescein (Figure 3) contains a hydroxyl group, making it ideal to donate a hydrogen atom to radicals. Therefore, it is a perfect tracer for the ORAC assay. After fluorescein donates a hydrogen atom, it exists as a radical before quickly reacting with another fluorescein radial. This product no longer fluoresces [Janssen, 2013]. 2.3.3. Trolox Trolox is the trade name for 6-hydroxy-2,5,7,8- tetramethylchroman-2-carboxylic acid. It is a hydrophilic molecule that has a hydroxyl group, making it an optimal antioxidant for hydrogen donations in the HAT assay [Davies, Figure 4: Molecular structure of Trolox. 1988]. Trolox is also a model antioxidant used to compare results from different sources [Davies, 1988]. The Trolox Equivalent Antioxidant Capacity, TEAC, is a standardized system that uses the unit 9 Audrey Norris, 4d Trolox Equivalents, TE, to facilitate comparison between antioxidant capacities measured in different laboratories. The need for such a system arose because many fruits and vegetables contain multiple antioxidants. This diversity of substances makes it difficult to isolate single antioxidants from the heterogeneous mixture. With the TEAC, scientists have an easier time analyzing and comparing results. For example, using the TEAC listed in Table 1 [Apak, 2013], it is apparent that the red onion has approximately twice the level of antioxidant capacity as the green pepper. Table 1: Example Trolox equivalents for different vegetables. 2.4. Equipment 2.4.1. Lyophilizer Lyophilization is the scientific term for freeze-drying. Hence, a lyophilizer is a piece of equipment that removes almost all of the water from a given sample. The reasons for using such a machine are explained in Section 3.4.1. The basic method used to freeze-dry a sample is water sublimation. Before the sample can be lyophilized, it must first be frozen overnight at -20°C, to solidify all water present in the sample. Then, the lyophilizer reduces the pressure in the chamber holding the sample to below 60 mbar. This allows the direct conversion Figure 5: The lyophilizer used in this project. from solid to gaseous water via sublimation. During this process the temperature is also regulated and kept in a constant range. The exact temperature depends on the instrument and the pressure maintained. In Figure 5, the lyophilizer used to freeze-dry all fruit samples for this project is shown. As is typical for freeze-dryers, the vacuum column is visible, resting on top of the machine. All samples to be lyophilized are attached to this cylinder using special glass vials and rubber seals. The rubber seals have knobs to switch the vacuum on or off. The vacuum pump can be seen in the bottom left of Figure 5. It maintains a continuous pressure of approximately 0.22 mbar for 10 Audrey Norris, 4d the entire process. The main part of the lyophilizer, the large steel box shown in Figure 5, houses the refrigeration unit that maintains the low temperature [Harris, 2013]. 2.4.2. Microplate Reader3 The most important piece of equipment for determining the capacity of antioxidants is the microplate reader. It is capable of reading the fluorescence signal from multiple samples simultaneously. The basic principle of these machines is the same as any other instrument for absorbance or fluorescence detection. A light source excites the sample at a given wavelength, and the plate reader then detects the amount of light that the sample emits through a special optical system. The plate reader can only read samples that are deposited in the appropriate plates. These plates include an 8 by 12 grid of 96 small wells, each capable of holding 200 µL. The plates used were made from clear plastic. Both the reader and 96-welled clear plate are visible in Figure 6. When analyzing recorded data, however, it is important to keep in mind that this machine Figure 6: Plate reader with visible 96-‐well plate. has a few disadvantages. The biggest, and most important, is that if any tested samples contain larger particles, the light can be scattered, leading to false signals. To avoid this problem, solutions were typically filtered to eliminate particulate matter. The plate reader can also struggle with very concentrated colored solutions. Thus, all antioxidants tested here were either only slightly colored, or diluted until the color was reduced significantly. 2.4.3. Sonicator4 A sonicator is an instrument that helps to speed up the dissolution of chemicals through sound. A typical sonicator sends sound waves in the ultrasonic range through the desired solution, and this agitates the compounds, causing them to dissolve more quickly. 11 Audrey Norris, 4d 2.4.4. Vacuum Filter Filtration is typically a procedure that requires little equipment other than the filter and the solution. However, when a heterogeneous mixture is extremely difficult to separate by gravitation, a special vacuum filtration process is needed. As the name suggests, it is simply a filter that utilizes low pressure. This helps force more of the desired liquid through the filter. Vacuum filtration was required once during the course of this project. Fruit solutions were separated from particles. All other fruit mixtures could be filtered using centrifugation and syringe filters. 12 Audrey Norris, 4d 3. Measurement and Preparation Methods As explained in Section 2.2.2, to measure the antioxidant capacity of a specific fruit, the ORAC assay was used with the plate reader. This necessitated creating low-volume test solutions containing 120 µL fluorescein, 60 µL of the free radical, AAPH, and finally 20 µL of the desired sample. The required final concentrations of all samples were noted by Dávalos et al. [Dávalos, 2004], but the starting concentrations had to be optimized over the process of this project. This section will explain in detail how each of the solutions was prepared. 3.1. Phosphate Buffer The phosphate buffer was used to make all other solutions in the assay. It was also the blank utilized for control experiments. Anytime a well was supposed to contain only certain components of the assay, the buffer was used to fill the space of the excluded substance. This allowed the total volume of 200 µL and the concentrations of the reactants to remain constant. The phosphate buffer had a constant pH of 7.4 and was remade weekly. To prepare the phosphate buffer, 1.065 g of sodium phosphate dibasic was measured and transferred into a 100 mL volumetric flask. After the phosphate was weighed in, the volumetric flask was almost, but not quite completely, filled with water purified with a Millipore Milli-Q system. This system produces “ultra-pure” deionized water that has been treated with ultraviolet light and filtered.5 At this point, the mixture was sonicated for five minutes to dissolve the buffer salt. Next, the pH of the homogeneous solution was measured, which was normally found to be around pH 9. To adjust it to the desired 7.4, approximately 110 µL of concentrated hydrochloric acid (HCl, 37%) was added. The pH was measured again, to confirm that it lay in the acceptable range. The volume was then brought to 100 mL by adding ultra-pure water, and the solution was mixed. The finished buffer was transferred to a labeled glass bottle for later use. The phosphate buffer was a clear and colorless solution, as seen is Figure 7. Figure 7: Finished phosphate buffer. 13 Audrey Norris, 4d 3.2. Fluorescein Solution For the ORAC assay, fluorescein is the most vital component, as it is the actual measured substance. To maintain fluorescein as a constant factor in all of the different experiments, every fluorescein solution had the same concentration, 117 nM, and was always prepared in the same manner. First, a fluorescein stock was made, with a comparatively high concentration, to be diluted to create the desired solutions that were used in the wells. Accurately measuring the powdered fluorescein to create each 200-µL sample was below the measurement Figure 8: Fluorescein stock solution. capabilities of the equipment. Instead, it was more accurate to generate a high concentration stock solution and then dilute this for each sample. To make this stock solution, approximately 4 mg of fluorescein sodium salt was weighed into a 50-mL volumetric flask. This flask was then filled with freshly prepared phosphate buffer. After a quick sonication, it was transferred to a glass bottle that was either tinted or otherwise covered to protect the fluorescein from long-term exposure to the room light. The concentration of the stock was typically around 250 µM. At this point, the fluorescence was clearly recognizable, as seen in Figure 8. The fluorescein stock solution was then used to create dilutions of the desired concentration, 117 nM. Approximately 13 µL of stock solution would be diluted in a 25-mL volumetric flask. The fluorescein stock solution could be reused to make as many dilutions as needed within one month. After a month, a new stock solution was prepared. 3.3. Trolox Solution Every experiment that tested the antioxidant capacity of an unknown substance, such as a fruit or juice, required a Trolox calibration. This was to help determine the Trolox equivalent for the tested sample. As it was extremely important that all dilutions in every experiment were equal to one another, all Trolox dilutions were made from the same stock solution. This was a pre-made stock solution 14 Audrey Norris, 4d Solution #: 1 2 3 4* 4 µM Trolox: µL Stock: µL Buffer: 10 19.1 9981 30 57.3 9943 50 95.5 9904 65 124.2 9876 80 152.9 9847 Table 2: Trolox stock dilution table. that was already in use in the laboratory. The stock solution had a concentration of 5.234 mM. With a few exceptions, solutions of 10, 30, 50, and 80 µM were prepared for calibration in 10-mL volumetric flasks. They were made weekly, either the day before the actual experiment, or the same day. Toward the end of this project a concentration of 65 µM was used instead of 80 µM. These calibration solutions were diluted by a factor of ten in the wells of the plate. Table 2 shows the exact volume of stock solution and buffer solution in each dilution. 3.4. Fruit Preparation 3.4.1. Fruit Samples The real fruit samples were the most difficult to prepare, as they had to be turned from a solid into a liquid, while retaining as many of their antioxidants as possible. To attempt this, all fruits were first lyophilized to remove its water. The fruit was weighed both before and after this process so that a wet and dry weight could determine the true “concentration” of each fruit (see Table 3). After freeze-drying all of the fruit, each one was ground up into a fine powder. This was easily possible for the berries, but presented challenges with the grapes. They were finally simply cut into small pieces, as they could not be ground due to their waxy quality. Another fruit that proved difficult was the pomegranate. Their seeds had a waxy coating, and they could not be lyophilized. Therefore, they were later tested as a juice. In Figure 9, all of the ground freeze- Figure 9: All dried and ground fruits [from left: peeled grape skins (7), blackberries (6), blueberries (4), cherries (5), green grapes (2), peeled purple grapes (8), purple grapes (1), and pomegranate seeds (that did not lyophilize) (3)]. 15 Audrey Norris, 4d dried fruits are shown, including the failed pomegranate seeds. After being reduced to a powder, half of the powder from each sample was weighed and put into its own 10-mL volumetric flask. The wet weight, dry weight, and measured powder for each fruit are listed in Table 3. Fruit: Wet)Weight)[g]: Dry)Weight)[g]: Measured)Powder)[mg]: Purple'Grape 15.02 2.578 609.7 Green'Grape 13.02 2.338 384.5 Blueberry 12.27 1.751 374.4 Cherry 14.58 1.939 381.3 Blackberry 16.51 2.167 424.4 Purple'Grape'Skin 1.947 0.468 134.9 Peeled'Purple'Grape 8.355 1.529 435.9 Table 3: Recorded wet weights, dry weights, and measured powder for the 10-‐mL volumetric flasks of each fruit. The volumetric flasks containing the powdered samples were then filled with purified Milli-Q water, to replace the water that the fruit contained before lyophilization. The mixtures were sonicated for about one hour. At this point, all of mixtures were extremely heterogeneous (see Figure 10). To extract the liquid with as few particles as possible, all of the samples were Figure 10: All fruit solutions before filtration [from left: purple grape (1), green grape (2), peeled purple grape (8), blueberries (4), cherries (5), blackberries (6), and purple grape skins (7)]. filtered. Only the grape mixtures, however, could be filtered using standard filter paper. All other samples had so many fruit particles that the filter paper was easily clogged. Therefore, the remaining solutions were centrifuged to separate the solid particles from the liquid solution as much as possible. 16 Audrey Norris, 4d Figure 11: A centrifuged fruit sample. This procedure worked very well, with the two states being split into two clear sections as visible in Figure 11. However, so many particles were still present that the samples could not be measured reliably in the plate reader. To further refine the samples, they were then passed through syringe filters with a pore size of 0.45 µm. After this process, the final, clear samples were obtained, which can be seen in Figure 12. Figure 12: All final, filtered fruit samples [from left: purple grape (1), green grape (2), peeled purple grape (8), blueberries (4), cherries (5), blackberries (6), and purple grape skins (7)]. 3.4.2. Fruit-Juice Samples The fruit juice that was store-bought was either already clear enough that it did not require filtration, or if it was murky, it was centrifuged and syringe filtered, as previously explained. However, a few fruits were hand juiced, including the pomegranate, as well as green and purple grapes. Despite refrigeration, the grape juice showed signs of oxidation after only one night. The 17 Audrey Norris, 4d juice became murky and brown. Therefore, the grapes were juiced in the laboratory and then immediately centrifuged and filtered. The pomegranate juice, on the other hand, showed no signs of this oxidation, thus the pre-prepared juice was used. 3.5. AAPH Solution Unlike all of the other solutions used in the ORAC assay, the AAPH solution had to be prepared daily. The AAPH compound (Section 2.3.1) needed to be in its precursor form, before it decomposed into radicals. To prepare this solution, approximately 54.3 mg of AAPH was weighed and added to a 5-mL volumetric flask, which was then filled with phosphate buffer. The AAPH solution did not need to be sonicated, as the powder dissolved almost instantaneously when the buffer was added. With a bit of shaking, all of the AAPH would dissolve. This was then used as a stock solution, as it was imperative that all AAPH solutions had a concentration of exactly 40 mM. The concentration of this stock solution was calculated and the amount needed to make a dilution to the exact desired concentration was determined. That amount was then added to another 5-mL volumetric flask and the remaining space filled with phosphate buffer. This was the final AAPH solution used for the assay. 3.6. Protocol The exact procedure for testing was as follows. Weekly, a new phosphate buffer was prepared, typically 200 mL. A fluorescein stock solution was prepared monthly, which was then used to create dilutions with the desired concentration, 117 nM, and then refrigerated. This dilution was created from the fluorescein stock solution as often as necessary. The Trolox dilutions for calibration were prepared the day before, or the day of the experiment, from a stock solution. The other liquid samples, such as the fruit juices, were normally prepared the day of the experiment, unless a lengthy preparation process was required. In that case, the solutions were prepared a few days in advance, and then frozen. The solid fruit samples took a week to convert into a liquid form, as explained in detail in Section 3.4.1. The dilutions used for the plate reader tests however, were created the day of the experiment. The last component required for the ORAC assay was the AAPH solution, which was made the day of the test. Into each well, 120 µL of the fluorescein solution was pipetted, along with 20 µL of the sample. This mixture was then incubated in the plate reader at 37°C for 15 minutes. After this step, 60 µL 18 Audrey Norris, 4d AAPH was added, and the reading procedure was started. Typically the tests took 60 to 120 minutes, with the plate reader measuring the fluorescence every 60 seconds. The length of the test depended on the antioxidant strength of the samples investigated. 19 Audrey Norris, 4d 4. Experiments 4.1. Preliminary Experiments Before the actual assay could be utilized, the individual components needed to be investigated more in depth. This entailed doing a few simple tests to verify that fluorescein would be viable as a fluorescent tracer for the assay. To do this, the emission capability was tested. To study the fluorescence, a calibration row was tested using the plate reader. A total of five different concentrations of fluorescein were utilized, ranging from zero to 100 nM. At the same time, the plate reader was optimized to work with fluoresFigure 13: Fluorescein calibration. cein. Its detectors can be manually adjusted to the specific spectral properties of the analyzed sample. Once the ideal sensitivity was calibrated, it was set as the automatic sensitivity for all other ORAC assay experiments. In Figure 13 the calibration row is shown in a graph of intensity of the fluorescence as a function of the concentration. As expected, the higher the concentration was, the higher the recorded intensity of the emitted light. After determining that fluorescein was a viable tracer, the free radical was also examined. A test run with only AAPH and fluorescein was analyzed. As shown in Figure 14, the fluorescence undergoes a rapid deterioration beginning at time zero. Figure 14: Fluorescein, buffer, and AAPH solution. 20 Audrey Norris, 4d This deterioration meant that AAPH was an ideal reactant for fluorescein. However, one more element of the experiment needed to be checked: the ability of an antioxidant to protect the fluorescein from degrading. Four different concentrations of the model antioxidant Trolox were used. While analyzing the data, it was clear that the influence of the antioxidant was easily measurable. In any well where the Trolox was present, a visible lag time could be identified. This lag time can be observed in Figure 15 as the time needed before the radical exhausts the available Trolox and degrades the fluorescein. A divergence is observed between the curve representing the fluorescein and AAPH (orange data) and the curve representing the fluorescein and AAPH with 3 µM Trolox (blue data). 3uM*Trolox*Comparison*with*Fluorescein* Normilized*Intensity* 1.2" 1" 0.8" 0.6" 0.4" 0.2" 0" 0" 500" 1000" 1500" 2000" 2500" 3000" 3500" 4000" Time*[s]* Fluorescein"with"AAPH" Trolox"3uM" Figure 15: Fluorescence degradation for fluorescein and AAPH (orange) and fluorescein with 3 μM Trolox and AAPH (blue). All of these preliminary experiments proved that all components of the ORAC assay were viable. They also verified that the assay was a feasible measurement method using the equipment and materials available in the laboratory. 4.2. Trolox Calibration The next step taken to ensure that all further experiments using this assay could be readily compared to other values was to test the model antioxidant, Trolox. A calibration was prepared, with concentrations ranging from zero to 80 µM (labeled c1 to c4 in Table 4). This step was extremely 21 Audrey Norris, 4d Horizontal Row: A: B: C: D: E: F: G: Fluorescein: 120μL 120μL 120μL 120μL 120μL 120μL 120μL "Sample": buffer: 80μL buffer: 20μL c1: 20μL c2: 20μL c3: 20μL c4: 20μL c4: 20μL buffer: 60μL AAPH: -‐-‐-‐ 60μL 60μL 60μL 60μL 60μL -‐-‐-‐ Table 4: The well pattern for the Trolox calibration (with concentrations as follows: c1 10 μM, c2 30 μM, c3 50 μM, and c4 80 μM). important, as each plate contained such a calibration for the conversion of the tested samples into Trolox equivalents. For the preliminary tests, a plate was pre- pared with the amounts described in Table 4. To help ensure as much accuracy as possible, each well was replicated three times. The three vertical columns on the plate all contained the same samples for each horizontal row. For the rows A and G, no AAPH was added, to serve as controls. Row A showed that without the free radical the fluorescein would not degrade. Row G showed that Trolox by itself does not degrade the fluorescein. Since 20 µL of the Trolox dilution was added to a total volume of 200 µL in the well, the sample was diluted further by a factor of ten. Therefore, the solution that was originally 10 µM was only 1 µM. This was the case for all samples below, and the final concentrations are listed in each graph. The results from the wells were then used to calculate the area under the curve for different concentrations of Trolox. Every AUC (area under the curve) was then plotted against the Trolox concentration in a graph. A linear regression analysis was also performed. The calculated linear regression was also required for later experiments to interpolate the Trolox equivalents of all tested samples. The exact procedure followed to convert the well data into AUC will be explained in detail in Section 5.1. 4.3. Juice Tests To test the optimized assay on an actual, “real-life” antioxidant, a specific sample was selected. Store-bought grape juice was chosen because it was easy to prepare and test. The grape juice was already in liquid form, so no further extraction was required. Also, it was relatively clear and free of smaller particles, such that no filtration was necessary. 22 Audrey Norris, 4d As with all subsequent sample tests, a Trolox calibration was included on the plate. However, the Trolox calibration is not reported in each table below. The single change in the Trolox concentration, the switch from 80 to 65 µM that was discussed in Section 3.3, will be noted in the text. In this experiment, the same pattern for the Trolox calibration row was used as in Table 4 in Section 4.2. The wells for the juice sample were then prepared. As the AUC can only be calculated correctly if the fluorescein has been completely degraded in the time allotted for the measurement, the concentration of the grape juice was important. If the juice contained too high of an antioxidant capacity, the fluorescein would be protected from deterioration. If the concentration was too weak, the fluorescein would degrade immediately. Since the strength of the sample was unknown initially, several dilutions were prepared. This would allow the optimal dilution factor for all subsequent sample tests to be determined. It was assumed, however, that the sample would have a high antioxidant level. Thus, the sample was diluted in phosphate buffer by factors of 10, 100, 1000, and 10,000. The sequence in which the different grape juice solutions were arranged is shown in Table 5. Each well was prepared as stated in Section 3.6, with 120 µL of fluorescein solution, 20 µL of sample solution, and 60 µL of AAPH solution or buffer solution, depending on if the well was a control. Wells containing no AAPH were also included. This was to confirm that the sample and the fluorescein did not react without free radicals present. It also tested that the sample did not impair the fluorescence from the fluorescein. After determining that the ORAC assay was viable, and defining the optimal dilution factor, the remaining juice samples could be tested. Of the seven investigated, three juices were freshly squeezed: green grape, Horizontal Row: pomegranate, and purple A: grape. The other four: B: C: blood orange, cranberry, D: orange, and Tropicana E: F: Antioxidant (which con- G: tained grapes, blackcurrant, and cranberries) H: Fluorescein: 120μL 120μL 120μL 120μL 120μL 120μL 120μL 120μL Sample: c1: 20μL buffer: 60μL c2: 20μL buffer: 60μL c3: 20μL buffer: 60μL c4: 20μL buffer: 60μL c1: 20μL c2: 20μL c3: 20μL c4: 20μL AAPH: -‐-‐-‐ -‐-‐-‐ -‐-‐-‐ -‐-‐-‐ 60μL 60μL 60μL 60μL th Table 5: Arrangement of the grape juice samples (with concentrations of c1: 1/10 the th th th original concentration, c2: 1 /100 , c3: 1/1000 , and c4: 1/10000 ). 23 Audrey Norris, 4d Table 6: Arrangement of fruit juices [fresh purple grape juice: (FPG), fresh green grape juice: (FGG), cranberry juice: (CJ), orange juice: (OJ), fresh pomegranate juice: (FPM), blood orange juice: (BOJ), and Tropicana Antioxidant juice: (TEA)]. All solutions had a concentration that was a hundredth of the original (2), unless noted as (1), which only had a dilution of a tenth. The letters represent the different horizontal rows on the plate with each of the numbers corresponding to the vertical columns. were all store bought. The only juice not centrifuged and filtered was the cranberry juice, because it was already clear and particle free. All others were prepared as explained in Section 3.4.2. Since the solutions containing 80 µM Trolox did not fully degrade in the allotted time, the highest concentration was lowered to 65 µM. This concentration was then employed in all tests subsequent to the store-bought grape juice. Thus, the well pattern, described in Table 4 (Section 4.2), was used in later samples, but with 65 µM as the concentration c4. For the juices with very little color, such as the orange juice and fresh grape juices, two different dilutions were prepared. One was 1/10th of the original concentration, and the other was 1/100th. The remaining samples were only diluted to a concentration of 1/100th of the original juice. They were then arranged on the well plate as in Table 6. The pomegranate and Tropicana Antioxidant juice proved to be problematic. They had such a high antioxidant capacity that a second test was needed. Both solutions were further diluted to 1/1000th of the initial juice concentration. These dilutions were then arranged on the plate in the Horizontal Row: A: B: C: D: E: F: 4-‐6: Fruit Juices: FPM: 20μL, buffer: 60μL, NO AAPH TEA: 20μL, buffer: 60μL, NO AAPH -‐-‐-‐ -‐-‐-‐ FPM: 20μL, AAPH: 60μL TEA: 20μL, AAPH: 60μL Table 7: Well pattern for the additional juice tests, using the vertical th columns 4 through 6 on the plate. All concentrations were 1/1000 of the original juice. 24 Audrey Norris, 4d well pattern shown in Table 7. The results from these experiments were then used to compare the Tropicana Antioxidant and fresh pomegranate juices to the other samples. 4.4. Solid Fruit Samples The fruits were prepared as explained in Section 3.4.1. In total, seven different fruits were investigated: blackberries (BL), blueberries (BB), cherries (CH), green grapes (GG), peeled purple grapes (PPG), purple-grape skins (PGS), and purple grapes (PG). Each solution was then diluted before it was added to the wells, and depending on the fruit, multiple concentrations were prepared. The blackberry, blueberry, cherry, and purple-grape solutions were all diluted by a factor of 100 with phosphate buffer. The green grapes, peeled purple grapes, and purple-grape skin solutions had two different dilutions prepared. One was diluted by a factor of ten and the other by a factor of 100. This was due to the assumption that these three samples would have a lower antioxidant capability than the other samples. The complete 96-well plate was filled with samples so that the time required for the plate reader to analyze all of the wells was longer than the 60-second interval normally allotted. Consequently, the length of time between readings of the entire plate was lengthened to 120 seconds. The fruit solutions were arranged as described in Table 8. A: B: C: D: E: F: G: H: 4-‐6: Fruit Samples PG: 20μL, buffer: 60μL, NO APPH GG (1): 20μL, buffer: 60μL, NO APPH GG (2): 20μL, buffer: 60μL, NO APPH BB: 20μL, buffer: 60μL, NO APPH CH: 20μL, buffer: 60μL, NO APPH BL: 20μL, buffer: 60μL, NO APPH PGS (1): 20μL, buffer: 60μL, NO APPH PGS (2): 20μL, buffer: 60μL, NO APPH 7-‐9: Fruit Samples PPG (1): 20μL, buffer: 60μL, NO APPH PPG (2): 20μL, buffer: 60μL, NO APPH -‐-‐-‐ -‐-‐-‐ PG: 20μL, AAPH: 60μL GG (1): 20μL, AAPH: 60μL GG (1): 20μL, AAPH: 60μL BB: 20μL, AAPH: 60μL 10-‐12: Fruit Samples CH: 20μL, AAPH: 60μL BL: 20μL, AAPH: 60μL PGS (1): 20μL, AAPH: 60μL PGS (2): 20μL, AAPH: 60μL PPG (1): 20μL, AAPH: 60μL PPG (2): 20μL, AAPH: 60μL -‐-‐-‐ -‐-‐-‐ Table 6: Arrangement of all solid fruit sample solutions. The initial fruit extractions were diluted as follows: purple grape (PG) th th th th th 1/1000 , green grape c1 (GG c1) 1/100 , green grape c2 (GG c2) 1/1000 , blueberry (BB) 1/1000 , cherry (CH) 1/1000 , th th th blackberry (BL) 1/1000 , purple grape skins c1 (PGS c1) 1/100 , purple grape skins c2 (PGS c2) 1/1000 , peeled purple grape c1 th th (PPG c1) 1/100 , and peeled purple grape c2 (PPG c2) 1/1000 . The vertical columns on the plate are denoted by numbers (4-‐ 12) and the horizontal rows by letters (A-‐H). 25 Audrey Norris, 4d 5. Results 5.1. Trolox Calibration Comparison!of!1uM!Trolox!with!Fluorescein! 1.2" !Normalized!Intensity! 1" 0.8" 0.6" 0.4" 0.2" 0" 0" 500" 1000" 1500" 2000" 2500" 3000" 3500" 4000" Time![s]! Fluorescein"and"AAPH" 1uM"Trolox" Figure 16: The degradation of fluorescein from two solutions: one containing the antioxidant Trolox (blue), and one without (orange). After averaging all wells containing identical solutions, the data were normalized and plotted as shown in Figure 16. Each averaged intensity was divided by the intensity at time zero. To see the raw data, please refer to the Appendix. The complete process to obtain the final data is also described there. In Figure 16, the quenching of the AAPH is clearly visible. Starting at 60 seconds, the data point representing the solution containing the antioxidant Trolox (blue curve) separates from the control data representing fluorescein and AAPH (orange curve). This separation was only observed if an antioxidant was present to protect the fluorescein from the free radical. To calculate the area under the curve, the following summation was used to estimate the integrated area [Dávalos, 2004]: 26 Audrey Norris, 4d 𝐴𝑈𝐶 = !!!!"# 𝑓! !!! 𝑓! ∗ ∆𝑥, where fi represents the recorded intensity at time i, f0 represents the recorded intensity at time zero, and Δx represents the constant time interval in minutes. To apply this formula to the recorded data, the three replicates for each experiment were averaged and then normalized to 1. These normalized results were then added together to obtain the AUC. This process was repeated for each sample. Figure 17 shows a comparison between all of the tested Trolox concentrations (blue curves) with the fluorescein in the absence of an antioxidant (orange curve). The increase in quenching period with increasing Trolox concentration is clearly visible. The AUC was then estimated for each Trolox concentration. The results, seen in Table 9, are graphed in Figure 18. The linear fit of these data could be used to obtain the Trolox equivalent of any curve, if the Table 7: Calculated area un-‐ der the curve (AUC) for vari-‐ ous Trolox concentrations. AUC is known. All+Trolox+Concentra8ons+ 1.2" Normalized+Intensity+ 1" 0.8" 0.6" 0.4" 0.2" 0" 0" 500" 1000" 1500" 2000" 2500" 3000" 3500" 4000" Time+[s]+ 1uM"Trolox" 3uM"Trolox" 5uM"Tolox" 8uM"Trolox" Fluorescein"and"AAPH" Figure 17: Comparison of the degradation of fluorescein with varying Trolox concentrations (1, 3, 5, and 8 μM, blue curves) and the degradation of fluorescein in the absence of an antioxidant (orange curve). 27 Audrey Norris, 4d AUC$ Trolox$Calibra/on$ 45" 40" 35" 30" 25" 20" 15" 10" 5" 0" y"="4.062x"+"7.598" R²"="0.97511" 0" 1" 2" 3" 4" 5" 6" 7" 8" 9" Trolox$Concentra/on$[uM]$ Figure 18: The Trolox calibration curve and calculated linear regression. 5.2. Juice Tests As stated previously, a preliminary sample test using store-bought grape juice was used to determine the optimal dilution factor. Figure 19 shows all grape-juice concentrations. Only the two weakest dilutions degraded fully in the allotted time. These are the only results that could be used to calculate their Trolox equivalents. The samples diluted by factors of 10 and 100 were too concentrated. The lowest concentration, diluted by a factor of 10,000, displays almost no Comparison+of+Grape+Juice+Dilu<ons+ Normalized+Intensity+ 1.2" 1" 0.8" 0.6" 0.4" 0.2" 0" 0" 500" 1000" 1500" 2000" 2500" 3000" 3500" 4000" Time+[s]+ Fluorescein"and"AAPH" Grape"Juice"c4" Grape"Juice"c3" Grape"Juice"c2" Grape"Juice"c1" Figure 19: All grape-‐juice dilutions in comparison to fluorescein without an antioxidant. Concentrations of the juices are as th th th th follows: c1 1/10 the original, c2 1/100 , c3 1/1000 , and c4 1/10000 . 28 Audrey Norris, 4d Grape Juice Dilution: 1/1000th original juice AUC: 21.50 Table 10: Calculated AUC for the 1/1000 grape-‐ juice dilution. quenching. Therefore, the best result was obtained for the second weakest concentration, at a dilution factor of 1,000. The AUC for this curve is used to obtain the Trolox equivalent for the juice. The actual value is listed in Table 10. For comparison, Table 11 lists the AUCs for Trolox concentrations that were included on the same plate for calibration. The grape-juice dilution lies between these values, so to calculate the micro-Molar (µM) Trolox Table 11: Trolox calibration for grape juice test. equivalent for the dilution, the linear regression was needed. Therefore, the Trolox AUCs were graphed (see Figure 20). The µM Trolox equivalent for the grape-juice dilution was then interpolated. This value is marked in blue in Figure 20. However, the resulting Trolox equivalent, listed in Table 12, is for the dilution, and not for the initial juice. To obtain the value for the original sample, the µM Trolox equivalent must first be converted into a unit of quantity rather than concentration. This was achieved by converting the 2.28 µM Trolox to 2.28 µmoles of Trolox per liter of solution. Next, this value had to be corrected for the two dilutions. First, it was multiplied by a factor of ten, as the 20 µL sample was diluted in the 200 µL sample well. Then, the value was multiplied by another factor of 100 to account for the dilution of the original juice. This means that each liter of the original grape juice contained 22,780 Table 12: Calculated Trolox equivalent for the grape-‐juice dilution. Trolox$Calibra1on$with$Grape$Juice$Dilu1on$Equivalent$ 60" y"="5.4853x"+"9.0086" R²"="0.99655" 50" AUC$ 40" 30" Table 8: Calculated AUC for the viable grape juice dilution 20" 10" 0" 0" 1" 2" 3" 4" 5" 6" 7" 8" 9" Trolox$[uM]$ Trolox"" Grape"Juice"Dilu@on" Linear"(Trolox")" Figure 20: Trolox calibration used to calculate the equivalents for the grape-‐juice dilutions. 29 Audrey Norris, 4d µmoles Trolox equivalent. To ease the comparison with later results, this value was converted into µmoles Trolox equivalent per mL of sample, according to the following: 2.28𝜇𝑀 = !.!" !"#$ ! ∗ 10,000 = 22,800𝜇𝑚𝑜𝑙 𝐿 = 22.8𝜇𝑚𝑜𝑙 𝑚𝐿. This Trolox equivalent for the original juice is listed in Table 13. Table 13: The calculated Trolox equivalent for one mL of the original juice. Based on this result, the remaining juices were diluted by a factor of 100 and tested. The degradation curves of all other juices are graphed in Figure 21. As seen in the plot, the fluorescence signal from both the Tropicana Antioxidant juice and the freshly-squeezed pomegranate juice did not fully degrade in the allotted time. These samples required an additional test, with results graphed in Figure 22. Because the results from Figures 21 and 22 were performed on different plates, they utilized different Trolox calibrations. The AUCs for all of the juices except pomegranate and Tropicana Antioxidant are listed in Table 14. The corresponding Trolox calibration is listed in Table 15. The linear fit for this calibration is plotted in Figure 23, with all calculated Trolox equivalents of the dilutions listed in Table 16. All"Juices" 1.2" Normalized"Intensity" 1" 0.8" 0.6" 0.4" 0.2" 0" 0" 1000" 2000" 3000" 4000" 5000" 6000" 7000" 8000" Time"[s]" FPG"(c2)" FGG"(c2)" CJ" FPM" OJ"(c2)" BOJ" TEA" Fluorescein"and"AAPH" Figure 21: Data for all fruit juices, including cranberry juice (CJ), blood-‐orange juice (BOJ), orange juice (OJ), fresh green grape juice (FGG), and fresh purple grape juice (FPG). The concentrations are those noted in Section 4.3. All samples had a concentration that was diluted by a factor of 1000 compared to the original juice. A control solution of fluorescein and AAPH is also plotted. 30 Audrey Norris, 4d Pomegrante"and"Tropicana"Juices" 1.2" Normalized"Intensity" 1" 0.8" 0.6" 0.4" 0.2" 0" 0" 1000" 2000" 3000" 4000" 5000" 6000" Time"[s]" Fluorescein"and"AAPH" FPM" TEA" Figure 22: Additional tests for pomegranate (FPM) and Tropicana Antioxidant (TEA) juices. Both were diluted by a factor of 10,000. Table 14: AUC for fruit samples tested. Table 15: Trolox calibration. Trolox"CalibraAon"for"Fruit"Juices" 80" y"="4.9963x"+"8.3568" R²"="0.98863" 70" 60" AUC" 50" 40" 30" 20" 10" 0" 0" 2" 4" 6" 8" 10" 12" 14" Trolox"[uM]" Trolox"CalibraAon" FPG"(c2)" FGG"(c2)" CJ" OJ"(c2)" BOJ" Linear"(Trolox"CalibraAon)" Figure 23: The linear regression to calculate the μM Trolox equivalents for the tested fruit juices, including cranberry juice (CJ), blood-‐orange juice (BOJ), orange juice (OJ), fresh green grape juice (FGG), and fresh purple grape juice (FPG). All samples had a concentration that was diluted by a factor of 1000 compared to the original juice. 31 Audrey Norris, 4d For the pomegranate (FPM) and Tropicana Antioxidant (TEA) juices, the AUCs are listed in Table 17, with the Trolox calibration in Table 18. The linear fit is also graphed, and can be seen in Figure 24, with the calculated Table 16: All calculated Trolox equivalents for the fruit juice dilutions plotted in Figure 21. Trolox values displayed in Table 19. To convert these calculated values for the dilutions into Trolox equivalents for the original juices, the same process was applied as described earlier. First, the units were converted into µmoles per liter Table 17: AUC for pomegranate and Tropicana Antioxidant juices plotted in Figure 22. of solution. Then, the values were corrected for the dilution factor. Since every juice was diluted in the well by an additional factor of 10 on top of the 1:100 dilution, every value was multiplied by 1,000. The calculated results are listed in Table 20. This same procedure was applied to calculate the Trolox equivalents of the pomegranate and Tropicana Antioxidant juices, except that they were diluted by a Table 18: AUC for Trolox cali-‐ bration for the pomegranate and Tropicana Antioxidant juices. thousandth, and therefore needed to be multiplied by a factor of 10,000. These results are listed in Table 21. Trolox"CalibraAon"for"AddiAonal"Juice"Test" 60" y"="5.9269x"+"9.7909" R²"="0.99558" 50" AUC" 40" 30" 20" 10" 0" 0" 1" 2" 3" 4" 5" 6" 7" Trolox"[μM]" Trolox" TEA" FPM" Linear"(Trolox)" Figure 24: The linear regression of the Trolox calibration with the calculated concentration in µM for the pomegranate (FPM) and Tropicana Antioxidant (TEA) juices. Both samples had a concentration that was diluted by a factor of 10,000 compared to the original juice. 32 Audrey Norris, 4d Table 19: Calculated μM Trolox for the FPM and TEA juices. Table 20: Converted μmoles Trolox equivalents per mL of original juice. Juice: Trolox Equivalent for Original Juice [umol/mL]: Tropicana Essentials: Antioxidants Juice (TEA) 29.68 ± 12.60 Fresh Pomegranate Juice (FPM) 23.06 ± 11.40 Table 21: Calculated μmoles Trolox equivalent per mL of original juice. Comparison&of&all&Fruit&Juice&Trolox&Equivalents& 45" Trolox&Equivalent&[umol/mL]& 40" 35" 30" 25" 20" 15" 10" 5" 0" Juice& 1" Tropicana"Essen3als:"An3oxidants"Juice" Fresh"Pomegranate"Juice" Fresh"Purple"Grape"Juice" Fresh"Green"Grape"Juice"" Cranberry"Juice" Orange"Juice"" Blood"Orange"Juice" StoreHbought"Grape"Juice" Figure 25: Comparison of all fruit-‐juice Trolox equivalents. All of the Trolox equivalents are plotted together in Figure 25 for comparison. 33 Audrey Norris, 4d 5.3. Solid Fruits As discussed in Section 3.4.1, solid fruits were also investigated. All of the solid fruit samples can be seen with their varying quenching periods in Figure 26. The quenching time, however, does not determine which fruit has the highest antioxidant capacity. Each of the samples was diluted differently from its original fruit. The relation between the amount of dried powder added All+Fruit+Solu8ons+ 1.2" Normalized+Intensity+ 1" 0.8" 0.6" 0.4" 0.2" 0" 0" 1000" 2000" 3000" 4000" 5000" 6000" Time+[s]+ Fluorescein"and"AAPH" PG" GG"(c2)" BB" CH" BL" PGS"(c2)" PPG"(c1)" Figure 26: D ata for all fruit solutions. The dilutions were as follows: purple grape (PG) 1000, green grape (GG c2) 1000, blueberry (BB) 1000, cherry (CH) 1000, blackberry (BL) 1000, purple grape skins (PGS c2) 1000, and peeled purple grape (PPG c1) 100. in each 10-mL volumetric flask and the actual ratio of wet and dry weight will ultimately determine the Trolox equivalent for each fruit. The process to obtain these Trolox equivalents is similar to the procedure for the grape juices Table 22: All AUCs for the various solid fruit samples. explained in the previous section. First, all curves were analyzed and their AUCs were calculated. The AUC values are listed in Table 22. Again, for comparison, the area under each of the different curves for the Trolox concentrations from the calibration on the same plate is reported in Table 23. The resulting graph and linear fit, shown in Figure Table 23: Trolox calibration for fruit sample test. 34 Audrey Norris, 4d Trolox"CalibraAon" 70" y"="5.7557x"+"8.4078" R²"="0.98488" 60" 50" AUC" 40" 30" 20" 10" 0" 0" 2" 4" 6" 8" 10" 12" Trolox"[uM]" Trolox"CalibraAon"(AUC)" PG" GG"2" BB" CH" BL" PGS"2" PPG"1" Linear"(Trolox"CalibraAon"(AUC))" Figure 27: The linear regression of the Trolox calibration with the calculated concentration in µM for each of the solid fruit samples. Abbreviations: PG: purple grape, GG: green grape, BB: blueberry, CH: cherry, BL: blackberry, PGS: purple-‐grape skin, and PPG: peeled purple grape. All samples had a concentration that was diluted by a factor of 1000 compared to the original juice, except for the peeled purple grape, which was diluted by a factor of 100. 27, determined the Trolox equivalents for each sample dilution. The µM Trolox equivalent for each dilution can be seen in Table 24. To convert this value into the actual Trolox equivalent for the original fruit, the procedure previously described was modified. First, the units were converted to µmoles/L. Next, the µmoles of Trolox equivalent per 200 µL was calculated. To do this, the units were converted to µmoles/µL, and then multiplied by the 200 µL in the well. The resulting value was the quantity of Trolox-acting substance in each well, which could be assumed to be the 20 µL of antioxidant dilution. These first steps account for the 1:10 dilution of the sample in the well and are shown in Table 25. The quantity of dry fruit in each well was then calculated. This was achieved by obtaining the concentration per µL of the powdered fruit in Fruit: Calculated uM: Purple Grape (PG) 1.74 ± 0.37 Green Grape (GG (c2)) 1.38 ± 0.55 Blueberry (BB) 4.27 ± 0.69 Cherry (CH) 8.83 ± 1.52 Blackberry (BL) 6.92 ± 0.77 Purple Grape Skin (PGS (c2)) 3.23 ± 1.51 Peeled Purple Grape (PPG (c1)) 3.49 ± 0.77 Table 24: All calculated Trolox equivalents for the various solid fruit solutions. each 10-mL volumetric flask. Once this concentration was calculated, it was multiplied by a factor of 20 because each well contained 20 µL. The sample had also been diluted by a factor of 100. Thus, the calculated concentration 35 Audrey Norris, 4d Table 25: The calculated μmoles/μL of Trolox-‐acting substances per well for each sample. Table 26: Calculated concentration of each dilution in the well (the mass of dry mass per well). The dry and wet mass for each fruit are listed in Table 2, Section 3.4.1. was divided by 100, except in the case of the peeled purple grape. This sample had only been diluted by a factor of ten. All of these steps are demonstrated in Table 26. To obtain the Trolox equivalent per mass of dry fruit, the µmoles of Trolox in each well was divided by the dry mass for each well. The final step to convert this to a wet mass of fruit was to multiply this value by the mass ratio of dry to wet fruit. Then, to help compare the solid fruits with the juices, this value was converted into µmoles/g of wet fruit. These steps are shown in Table 27. The final values are listed in Table 28 with their deviations. These results were then charted for easier comparison, as seen in Figure 28. Table 27: Final steps for calculating the Trolox equivalent for a mass of wet fruit. 36 Audrey Norris, 4d Table 28: All final Trolox equivalents for the wet fruit [μmoles/g wet fruit]. Comparison&of&all&Solid&Fruit&Trolox&Equivalents& 80" Trolox&Equivalent&[umol/gwet]& 70" 60" 50" 40" 30" 20" 10" 0" Fruit& Purple"Grape" Green"Grape" Blueberry" Cherry" Blackberry" Purple"Grape"Skin" Peeled"Purple"Grape" Figure 28: Comparison of all solid fruit Trolox equivalents. 37 Audrey Norris, 4d 6. Discussion 6.1. Trolox Calibration The very first Trolox calibration experiment was critical for the understanding of all of the subsequent experiments. Several factors influencing the results were revealed. First, it showed explicitly that with each increase in antioxidant concentration, the delay in the deterioration of fluorescein fluorescence also increased. All Trolox concentrations, as displayed in Figure 17 in Section 5.1 show this effect. Second, experimental limitations were uncovered. For example, despite great care in the experiments, the AAPH was able to react longer in certain wells. This was due to the fact that the AAPH had to be manually added to each well. Although this was done as quickly as possible, the addition to all of the wells could not be performed simultaneously. This problem could therefore not be entirely avoided. Another limitation was observed in the control runs, where the wells contained fluorescein, the Trolox sample, and buffer (i.e. without any free radicals, AAPH). Although no change in the fluorescein signal should have occurred, a slight deterioration was observed. Fortunately, in comparison with the degradation of the fluorescein in the presence of AAPH, this degradation was negligible. 6.2. Juice Tests Experimental issues were also discovered in the juice tests. One problem was the premature oxidation of the samples. Though precautions were taken to hinder this, such as immediate usage and freezing of all solutions not in use, it can be assumed that some oxidation did occur. Therefore, the recorded antioxidant capacity is most likely lower than that of the real juice. Another limitation of the experiments was in comparing the different juices. During the project, both store-bought and fresh juices were investigated. However, as Figure 29 in Section 6.3 shows, not all store-bought juices accurately reflect the antioxidant quantity in the fruit. The store-bought juice has an antioxidant capacity much higher than the freshly squeezed juice of the same type. This limitation is discussed further in Section 6.3. 38 Audrey Norris, 4d In order to use the obtained results, it was assumed that the store-bought juices had an antioxidant capacity that was not significantly different than that of the actual fruit. This was particularly necessary in those cases where it was impossible to juice the samples by hand. While reviewing the results, several samples yielded surprises, such as the blood-orange juice. This juice had been investigated because of its darker color. Darker fruits have been portrayed as better antioxidants in the media. Blood-orange juice was chosen to test this possibility. Indeed, the results showed it had the fourth highest antioxidant capacity of all of the juices. The three higher juices were the Tropicana Antioxidant juice, the pomegranate juice, and the store-bought grape juice, all of which also had a dark color. While not enough research was done to draw a firm conclusion, it can be speculated that darker fruit and dark fruit juice indicate higher antioxidant levels. 6.3. Solid Fruit Tests An experimental limitation for all solid fruit samples was the fact that other substances can be present that increase or decrease the antioxidant capacity. Fruits naturally contain compounds that would aid or hinder the antioxidants [Apak, 2013; Dávalos, 2005; Lugasi, 2003]. Also, since all fruit samples were extracted in the lab, other in vivo factors that influence the antioxidant capacity of a substance are not included in the recorded results. For instance, all lyophilized fruits were extracted using Milli-Q ultra-pure water, which may have yielded a lower quantity of antioxidants than the extraction process that occurs in the body. However, it would have been infeasible to test each possible extraction method. Therefore, it was assumed that all antioxidants were extracted with water. This assumption was necessary to draw conclusions when comparing the juices with the solid fruits. The issue of premature oxidation (discussed in Section 6.2) was significantly hindered through the removal of water in each sample through lyophilization. However, up to that point, it is very likely that some oxidation of the fruit samples occurred which would have slightly lowered the antioxidant capacity of the sample in comparison with the real fruit. While reviewing the results, it was evident that among the solid fruits tested, the cherries had the highest antioxidant capacity. This is seen in Figure 28, Section 5.3. This result was unexpected, as cherries are not commonly associated with antioxidants. The fruit with the second highest 39 Audrey Norris, 4d antioxidant capacity, blackberries, was also unexpected. This berry is generally not portrayed in the media as a fruit containing a high level of antioxidants. The solid fruit results also support the theory that darker fruits and dark fruit juices indicate higher antioxidant levels. The antioxidant capacity of the solid fruits decreases as the color of the fruit becomes less intense. The one outlying result for this theory is the green grapes. Their Trolox equivalent is approximately the same as the Trolox equivalent for the purple grapes. This provides evidence against a correlation based on color. However, the similarity of the solid-green and purple-grape samples is most likely an experimental error. In the tests run with freshly squeezed grape juices, the purple grape juice Trolox equivalent was significantly higher than that of the fresh green grape juice. The fresh purple grape juice had roughly twice the antioxidant capacity. Thus, the theory that the color and antioxidant capacity of the fruit are correlated is also supported by this data. To determine which section of a fruit contains the highest amount of antioxidants, different sections of purple grapes were investigated. Surprisingly, the grape skins had the highest level of antioxidants. This is visible in Figure 29, with the flesh (i.e. peeled grape) containing a much Comparison&of&Grape&Sec?ons& 80" Trolox&Equivalent&[umol/mL]/[umol/gwet]& 70" 60" 50" 40" 30" 20" 10" 0" Whole"Grape" Grape"Skin" Peeled"Grape" Grape"Juice" Store>bought"grape"juice" Part&of&Grape& Figure 29: Relative comparison of all purple grape sections investigated. 40 Audrey Norris, 4d lower amount. The conclusion can be made that most antioxidants are located in the skin of a fruit. This was an unexpected result, but can potentially be explained by the fact that the skin of the fruit is continuously exposed to air. Therefore, it is reasonable that the skin would have the ability to stop oxidation. Other interesting results are displayed in Figure 29. First, the antioxidant capacity of the entire grape is only slightly higher than that of the fresh juice. This is likely due to the small amount of skin on each whole grape. The ratio of skin to fruit is relatively small for most fruits. While the skin may contain more antioxidants than the flesh and juice of the fruit, the latter two would play a larger role in the amount of antioxidants a body could consume. Also, for juices, the amount of antioxidants in the skin plays an even smaller role. In the juicing process, the skins are typically excluded. Another interesting result visible in Figure 29 is that the store-bought grape juice had a much higher Trolox equivalent than the freshly squeezed juice or even the whole grapes, at roughly seven times the antioxidant capacity. This is likely due to the fact that the store-bought grape juice has added preservatives and other substances that affect its antioxidant capacity [BrandWilliams, 1995]. Manufacturers are typically not required to label all of the preservatives in the food, making it difficult to determine the exact preservatives used. Additional inconsistencies between the store-bought and fresh juices were observed during the juicing process. The fresh grape juice did not have a strong purple color, whereas the storebought juice did. The fresh purple grape juice had an almost identical color to that of the fresh green grape juice. Both were clear and slightly golden in color. The store-bought juice was presumably darker because it contained purple grape skins, which would also increase the antioxidant capacity, or artificial coloring. Unfortunately, not all of the “super fruits” could be tested in solid form. In particular, the pomegranate solid sample could not be investigated. However, the fresh juice from this sample could. Its juice had an extremely high Trolox equivalent, as seen in Table 21, in Section 5.2 as well as Figure 25 in Section 5.2. If the conclusion drawn from the purple grape research can be applied to this fruit, it suggests that the entire fruit has a higher antioxidant capacity than the fresh juice. This would place the pomegranate most likely around the same level of antioxidant capacity as the cherries. However, since this test was impossible to run, no definite conclusion 41 Audrey Norris, 4d can be made about whether the pomegranate contains more antioxidants than the cherries. Though it certainly contains a high level of antioxidants. When comparing the results from this project to other studies, such as Crowe et al. [Crowe, 2012], several aspects differ. Crowe et al. also researched the Trolox equivalents for grapes, but found that a whole grape sample had a Trolox equivalent that was much higher (2,000 µmoles/g). The Trolox equivalent obtained in this project was only 5 µmoles/g. However, many factors can explain this discrepancy. First, Crowe et al. used methanol to extract the antioxidants instead of water. Second, although Crowe et al. used the same ORAC assay, their plate reader was calibrated differently. This may have caused a small difference. Also, the variety of grape was not the same, and this likely plays a role. However, the methanol extraction method likely explains most of the discrepancy. Other sources, such as Dávalos et al. [Dávalos, 2005], also have much lower Trolox equivalents than Crowe et al. The results for purple grape juices in the Dávalos et al. paper have a Trolox equivalent ranging from 25 to 14 µmoles/mL juice. The result for the store-bought purple-grape juice for this project had the Trolox equivalent of 23 µmoles/mL, which fits in this range. Since the procedure used to test the samples was extremely similar to the Dávalos et al. paper, it is reasonable that the results are similar. The discrepancy between different sources, however, shows how difficult it is to determine the exact antioxidant capacity of a fruit or fruit juice. 42 Audrey Norris, 4d 7. Reflection The biggest issue that could have been investigated with additional experiments was the failed solid pomegranate sample. Given more time I would have examined this further, especially since I initially hypothesized that pomegranates would have the highest antioxidant capacity. It would have been extremely interesting to see exactly how they compare to other fruit samples. To do this, a different method was needed to freeze-dry the fruit. This might have been accomplished by removing all of the seeds from many small pomegranate pieces. Then, the thick skin would have been punctured, making it easier for the water to escape. However, this would have increased the possible oxidation of the pomegranate fruit prior to the experiment. This problem with premature oxidation could have been solved by preparing the samples in an oxygen-free environment. For example, an argon-containing glove box could have been utilized. However, such a facility was not available for this project. Another aspect that could have been investigated more in depth was the specific location of antioxidants in other fruits. For example, it would have been extremely helpful, if, along with the purple grapes, another fruit had been separated into sections that were individually tested. This would have provided further evidence for the theories postulated in this project. Also, the overall limitation in comparing the different samples could have been improved. It would have been beneficial to perform tests on different types (e.g. store-bought, freshly squeezed, etc.) of the same fruit. With additional resources, it could have been possible to handjuice some of the fruits that were store-bought in this project. Difficult-to-find juices, such as cherry juice, could have been ordered. Also, the seasonal availability of some of the fruits meant that no fresh fruits were available during the project. Therefore, these were bought as frozen fruits, such as the solid cherry fruit sample. Another aspect that I would have liked to investigate was the extraction method. As mentioned in Section 6.3, when the solid samples are extracted with methanol, much higher antioxidant capacities are recorded [Crowe, 2013]. It would have been interesting to examine the difference between the antioxidant capacities obtained by extracting with methanol in comparison with water. However, the time constraints and overall parameters of the project did not allow such an investigation. 43 Audrey Norris, 4d 8. Conclusions Using the obtained results, the two questions posed by this project could be addressed. First, the fruit with the highest antioxidant capacity was the cherry. Second, the location of antioxidants in the purple-grape sample was found to be in the skin. This was initially surprising, as most of the antioxidants were expected to be hydrophilic and not contained in the waxy skin. This suggests that many antioxidants in the fruit are hydrophobic. From the data, one can also make several additional conclusions. The best fresh juice was from the pomegranate, and the best store-bought juice was the Tropicana Antioxidant juice. A correlation between the color of a fruit or juice and its antioxidant level was also observed. Finally, the results suggest that store-bought fruit juices contain a surprisingly high antioxidant capacity. Unfortunately, a comparison between the store-bought and freshly squeezed juices could only be thoroughly analyzed for the purple-grape samples. Though this project could not determine which fruit would grant eternal life, it revealed some of the fruits that contain high amounts of antioxidants. Additional information could be obtained from future studies that examine the in vivo extraction of antioxidants from fruit. As antioxidants continue to be an important topic in food science, the data provided by this project and other future works are needed to better inform the public. 44 Audrey Norris, 4d 9. Acknowledgements I would like to acknowledge the extensive assistance of Dr. Elisabeth Janssen in the Environmental Chemistry Group at ETH Zurich. I am especially grateful for the significant time that she invested in this project. I would also like to thank the head of the Environmental Chemistry Group, Prof. Kristopher McNeil, for providing me the opportunity preform this research in his laboratory. The entire Environmental Chemistry Group also provided support and encouragement, which were crucial factors in the completion of this project. Furthermore, I would like to thank my supervisor from MNG Rämibühl, Mr. Lorenz Marti, who encouraged me to undertake a more advanced project. His advice and constructive criticism were particularly helpful during the writing process. Finally, I am grateful for the support of my family. This project would not have been possible without them. 45 Audrey Norris, 4d 10. Bibliography Apak, R., Gorinstein, S., Böhm, V., Schaich, K. M., Öyürek, M., and Güçlü, K. "Pure Application Chemistry." 26 February 2013. Web. 7 June 2013. <http://dx.doi.org/10.1351/PAC-REP-12-07-15>. Brand-Williams, W., Cuvelier, M.E., and Berset C. "Use of a Free Radical Method to Evaluate Antioxidant Activity." Lebensmittel-Wissenschaft und Technologie. 28. (1995): 25-30. Print. Cao, G., Alessio, H. M., and Cutler, R. G. “Oxygen-Radical Absorbance Capacity Assay for Antioxidants.” Free Radical Biology and Medicine. 14. (1993): 303-311. Print. Crowe, K. M. and Murray, E. “Deconstructing a Fruit Serving: Comparing the Antioxidant Density of Select Whole Fruit and 100% Fruit Juices.” Journal of the Academy of Nutrition and Dietetics. 113. (2013): 1354-1358. Print. Dávalos, A., Bartolomé, B., and Gómez-Cordovés, C. “Antioxidant Properties of Commercial Grape Juices and Vinegars.” Food Chemistry. 93. (2005): 325-330. Print. Dávalos, A., Gómez-Cordovés, C., and Bartolomé, B. “Extending Applicability of the Oxygen Radical Absorbance Capacity (ORAC-Fluorescein) Assay.” Journal of Agricultural and Food Chemistry. 52. (2004): 48-54. Print. Davies, M. J., Forni, L. G., and Willson, R. L. “Vitamin E Analogue Trolox C.” Biochemical Journal. 255. (1988): 513-522. Print. Eberhardt, M. V., Lee, C. Y., and Liu, R. H. “Antioxidant Activity of Fresh Apples.” Nature. 405. (2000): 903-904. Print. Gheselli, A., Serafini, M., and Ferro-Luzzi, A. “New Approaches for Measuring Plasma or Serum Antioxidant Capacity: A Methodological Note.” Free Radical Biology and Medicine. 16. (1994): 135-138. Print. Glazer, A. N. “Phycoerythrin Fluorescence-Based Assay for Reactive Oxygen Species.” Methods in Enzymology. 186. (1990): 161-168. Print. Harris, T. "How Freeze Drying Works." How Stuff Works. no date. Web. 2 November 2013. <http://science.howstuffworks.com/innovation/edible-innovations/freeze-drying2.htm>. Hertog, M., Feskens, E., Hollman, P., Katan, M., and Kromhout, D. "Dietary Antioxidant Flavonoids and Risk of Coronary Heart Disease: the Zutphen Elderly Study." The Lancet. (1993): 1007-1011. Print. Huang, D., Ou, B., and Prior, R. L. "The Chemistry behind Antioxidant Capacity Assays." Journal of Agricultural and Food Chemistry. 53. (2005): 1841-1856. Print. Janssen, E. Personal Communication. (2013). 46 Audrey Norris, 4d Lugasi, A. and Hóvári, J. "Antioxidant Properties of Commercial Alcoholic and Nonalcoholc Beverages." Food. 47. (2003): 79-86. Print. Machlin, L. and Bendich, A. "Free Radical Tissue Damage: Protective Role of Antioxidant Nutrients." Federation of American Societies for Experimental Biology. (1987): 441-445. Print. Singer, N. "Buying Face Cream? Grab a Glossary." The New York Times. 1 October 2008. Article. 7 August 2013. <http://www.nytimes.com/2008/10/02/fashion/02skin.html?pagewanted=all&_r=0>. Watson, J. "Antioxidant Antidote." New Scientist. 2908 (2013): 28-29. Print. Williams, C. "4 Antioxidant Pills to Help You Live Longer." New Scientist. 2931 (2013): 35. Print. Werber, J., Wang, Y. J., Milligan, M., Li, X., and Ji, J. "Analysis of 2,2'-Azobis (2Amidinopropane) Dihydrochloride Degradation and Hydrolysis in Aqueous Solutions." Journal of Pharmaceutical Sciences. 100. (2011): 3307-3315. Print. Zumdahl, S. S., Zumdahl, S. A. "Chemistry. Seventh Edition." Boston, MA: Houghton Mifflin, 2007. Print. 47 Audrey Norris, 4d Footnotes 1 http://www.news-medical.net/health/What-is-Oxidative-Stress.aspx (Oxidative stress definition) Web site. Accessed: December 15th, 2013. 2 https://www.caymanchem.com/app/template/Product.vm/catalog/82235 (AAPH) Web site. Accessed: December 15th, 2013. 3 http://en.wikipedia.org/wiki/Plate_reader (Plate reader information) Web site. Accessed: November 2, 2013. 4 http://www.rsc.org/publishing/journals/prospect/ontology.asp?id=CMO:0001708 (Sonification) Web site. Accessed: November 2, 2013. 5 http://www.millipore.com/catalogue/module/c72876 (Millipore website) Web site. Accessed: November 2, 2013. 48 Audrey Norris, 4d Image Bibliography Title Page: http://omgblends.com/wp-content/uploads/2013/09/berries.gif Web site. Accessed: December 2, 2013. Figure 1: http://www.myagency.co.uk/case-studies/welchs Web site. Accessed: August 7, 2013. Figure 2: http://chemistry.about.com/od/factsstructures/ig/Chemical-Structures--F/Fluorescein.htm Accessed: August 8, 2013. Figure 3: http://www.chemicalbook.com/ChemicalProductProperty_EN_CB6138677.htm Accessed: August 8, 2013. Figure 4: http://en.wikipedia.org/wiki/2,2%27-Azobis%282amidinopropane%29_dihydrochloride Accessed: August 8, 2013. Figures 5 - 30: Original. Table 1: Values from [Apak, 2013]. Tables 2 - 31: Original. 49 Audrey Norris, 4d 11. Appendix The process of obtaining the AUC from the raw data will be explained using the example of 1 µM Trolox in fluorescein and AAPH. This will also illustrate how similar the replicates for the Trolox concentrations were. Because of this strong similarity, no error bars were included for the Trolox data in the calibration figures in the main text. First, Table 29 lists all raw data obtained from the microplate reader. As seen in the table, the three wells filled with the same mixture of Trolox, fluorescein, and AAPH exhibit roughly the same intensity and decay of the fluorescein fluorescence signal. This data has been plotted in Figure 30 to show the similarity of the three wells. The results were then averaged as shown in Table 30. Time [s] 0 60 120 180 240 300 360 420 480 540 600 660 720 780 840 900 960 1020 1080 1140 1200 1260 1320 1380 1440 1500 1560 1620 1680 1740 1800 fluor./Trol. 1uM/AAPH (1) 349 351 351 349 348 346 344 333 317 295 263 229 202 177 150 125 101 80 63 49 36 28 20 15 12 9 8 7 7 7 5 fluor./Trol. 1uM/AAPH (2) 344 342 343 342 343 342 340 336 329 311 279 256 221 193 165 140 115 95 76 60 46 36 27 21 14 12 11 9 7 8 6 fluor./Trol. 1uM/AAPH (3) 346 346 348 348 348 350 348 345 340 317 275 237 205 174 147 121 100 81 64 50 37 28 22 16 12 10 9 7 7 7 5 Time [s] 1860 1920 1980 2040 2100 2160 2220 2280 2340 2400 2460 2520 2580 2640 2700 2760 2820 2880 2940 3000 3060 3120 3180 3240 3300 3360 3420 3480 3540 3600 fluor./Trol. 1uM/AAPH (1) 6 6 5 5 5 5 5 5 6 5 5 5 5 4 5 6 6 5 5 5 4 4 5 4 4 5 5 5 4 5 fluor./Trol. 1uM/AAPH (2) 6 6 6 6 5 5 6 6 6 6 6 6 6 6 6 6 5 6 6 6 6 6 6 5 5 4 5 6 5 6 fluor./Trol. 1uM/AAPH (3) 6 5 5 6 5 6 5 6 6 5 5 6 5 5 5 5 5 5 5 5 5 5 5 5 5 6 5 6 6 5 Table 29: All raw data obtained from the microplate reader for the three identical wells containing 1 μM Trolox. 50 Audrey Norris, 4d All(Wells(Containing(1uM(Trolox( 400" 350" Intensity( 300" 250" 200" 150" 100" 50" 0" 0" 500" 1000" 1500" 2000" 2500" 3000" 3500" 4000" Time([s]( 1uM"Trolox"(1)" 1uM"Trolox"(2)" 1uM"Trolox"(3)" Figure 30: The fluorescence signals for all three wells containing 1 µM Trolox. After averaging, the data was normalized in order to compare the different samples. Each had slightly different starting values. The normalization was done using the method explained in Section 5.1. The formula, 𝐼! = 𝑦 𝑦! , was applied, where each averaged intensity was divided by the initial intensity to normalize the results to 1. The normalized data is listed in Table 31, and is also visible in Figure 16, in Section 5.1. To calculate the area under the curve for this graph, the normalized results were added together. This process was used for all sample tests. 51 Audrey Norris, 4d Time [s] 0 60 120 180 240 300 360 420 480 540 600 660 720 780 840 900 960 1020 1080 1140 1200 1260 1320 1380 1440 1500 1560 1620 1680 1740 1800 fluor./Trol. 1uM/AAPH 346.33 346.33 347.33 346.33 346.33 346.00 344.00 338.00 328.67 307.67 272.33 240.67 209.33 181.33 154.00 128.67 105.33 85.33 67.67 53.00 39.67 30.67 23.00 17.33 12.67 10.33 9.33 7.67 7.00 7.33 5.33 Time [s] 1860 1920 1980 2040 2100 2160 2220 2280 2340 2400 2460 2520 2580 2640 2700 2760 2820 2880 2940 3000 3060 3120 3180 3240 3300 3360 3420 3480 3540 3600 fluor./Trol. 1uM/AAPH 6.00 5.67 5.33 5.67 5.00 5.33 5.33 5.67 6.00 5.33 5.33 5.67 5.33 5.00 5.33 5.67 5.33 5.33 5.33 5.33 5.00 5.00 5.33 4.67 4.67 5.00 5.00 5.67 5.00 5.33 Table 30: The averaged intensity for all wells containing 1 μM Trolox. 52 Audrey Norris, 4d Time [s] 0 60 120 180 240 300 360 420 480 540 600 660 720 780 840 900 960 1020 1080 1140 1200 1260 1320 1380 1440 1500 1560 1620 1680 1740 1800 fluor./Trol. 1uM/AAPH 1.00 1.00 1.00 1.00 1.00 1.00 0.99 0.98 0.95 0.89 0.79 0.69 0.60 0.52 0.44 0.37 0.30 0.25 0.20 0.15 0.11 0.09 0.07 0.05 0.04 0.03 0.03 0.02 0.02 0.02 0.02 Time [s] 1860 1920 1980 2040 2100 2160 2220 2280 2340 2400 2460 2520 2580 2640 2700 2760 2820 2880 2940 3000 3060 3120 3180 3240 3300 3360 3420 3480 3540 3600 fluor./Trol. 1uM/AAPH 0.02 0.02 0.02 0.02 0.01 0.02 0.02 0.02 0.02 0.02 0.02 0.02 0.02 0.01 0.02 0.02 0.02 0.02 0.02 0.02 0.01 0.01 0.02 0.01 0.01 0.01 0.01 0.02 0.01 0.02 Table 31: The normalized data from all replicate wells containing 1 µM Trolox. 53 Audrey Norris, 4d Bestätigung der Eigenständigkeit Die Unterzeichnete bestätigt mit Unterschrift, dass die Arbeit selbständig verfasst und in schriftliche Form gebraucht worden ist, dass sich die Mitwirkung anderer Personen auf Beratung und Korrekturlesen beschränkt hat und dass alle verwendeten Unterlagen und Gewährspersonen aufgeführt sind. Ort, Datum Unterschrift _____________________________ _____________________________ 54
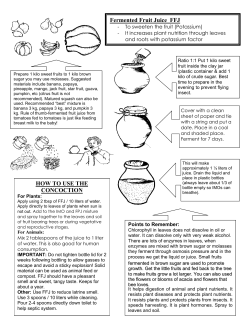


© Copyright 2026