
Relationship between semen viscosity and male genital tract infections Margot Flint
Relationship between semen viscosity and male genital tract infections By Margot Flint Thesis presented in partial fulfilment of the requirements for the degree of Master in Medical Science (MScMedSci-Reproductive Biology) at the University of Stellenbosch Supervisor: Prof Roelof Menkveld (Department of Obstetrics and Gynecology) Co-supervisor: Prof Stefan du Plessis (Department of Medical Physiology) Department of Obstetrics and Gynecology Faculty of Health Sciences March 2012 Stellenbosch University http://scholar.sun.ac.za DECLARATION By submitting this thesis/dissertation electronically, I declare that the entirety of the work contained therein is my own, original work, that I am the sole author thereof (save to the extent explicitly otherwise stated), that reproduction and publication thereof by Stellenbosch University will not infringe any third party rights and that I have not previously in its entirety or in part submitted it for obtaining any qualification. March 2012 Signature ………..………… Date ……………….………. Copyright © 2012 University of Stellenbosch All rights reserved ii Stellenbosch University http://scholar.sun.ac.za ABSTRACT The basic semen analysis plays a pivotal role in the diagnosis of male infertility and makes a significant contribution to the diagnostic process in andrology, gynecology and clinical urology. In 1902, the man considered to be ―the founding father of modern andrology‖ Edward Martin, proposed that an analysis of a semen sample should be incorporated into all infertility assessments. Following this suggestion in 1956, the scientist John MacLeod advanced the basic semen analysis from beyond a mere observation and introduced the importance of certain semen parameters such as morphology, motility and viscosity. The present day examination includes the analysis of certain established semen parameters, which can provide key information about the quality of a patient‘s semen and the functional competence of the spermatozoa. A semen analysis is also a valuable diagnostic tool in assessing possible disorders of the male genital tract and the secretory pattern of the male accessory sex glands. This information can help to determine the reproductive capacity of the male and can be used in conjunction with the partner to indicate the impact of male genital pathophysiology in the assessment of a couple‘s prospect for fertility. Patients attending the andrology laboratory at Tygerberg Academic Hospital for a semen analysis are referred based on primary, secondary or idiopathic infertility. Amongst these patients, an increase in semen viscosity has been observed over a period of time and created the need to assess the possible causes behind this trend. Despite viscosity being included in a routine spermiogram, it raises a considerable amount of concern as it is assessed semi-quantitatively. In the first part of this study, the possible correlation between seminal hyperviscosity and leukocytospermia was assessed. To achieve the most comprehensive assessment of viscosity, a new approach was used, which is a highly quantitative method to record viscosity in the international unit, centipoise (cP). The analysis of semen samples for possible leukocytospermia was approached by three methods the first of which was cytological. During this method iii Stellenbosch University http://scholar.sun.ac.za granulocyte grading was performed on stained semen smears during the normal determination of morphology. The same approach was taken for the second method, whereby white blood cell concentrations were quantified with a leukocyte peroxidase test in the total sample group (n=200). Viscosity was compared between the samples classified as leukocytospermic positive or negative, according to the set reference values of the World Health Organisation (WHO). Correlation analysis between the two variables was also performed. In the biochemical approach of detecting leukocytospermia, an enzyme-linked immunoabsorbant assay (ELISA) was used to quantify the concentration of the extracellular polymorphonuclear (PMN) enzyme released from leukocytes. This test was performed on 124 randomly selected samples. All samples were fractionated before storage in liquid nitrogen, to allow for multiple assessments to be performed on each sample. The PMN elastase concentration was assessed against viscosity to investigate a possible correlation and relationship with the presence of leukocytospermia. All three methods of detecting possible infection showed a significantly positive relationship with increased viscosity in semen samples. The second approach in the study was to assess increased viscosity and leukocytospermia against parameters included in the spermiogram. An evaluation of hyperviscosity and its correlations to the various other semen parameters can allow for a detailed study into the effects that this anomaly may elicit. With the assessment of each of the sperm parameters against the leukocyte count and viscosity (cP), volume, concentration and morphology showed significance. To further the study, the third angle was to investigate a possible correlation between viscosity and the functional status of the male accessory sex glands. The biochemical approach of assessing the secretory patterns of the prostate and seminal vesicles against markers of infection can possibly further the understanding behind hyperviscous semen and leukocytospermia. Citric acid and fructose, secretory products of the prostate and seminal vesicles respectively, showed no significance when assessed against the leukocyte count and viscosity. However, this project was a pilot study and this approach offers an exciting avenue for further research. These research findings may provide a more comprehensive assessment of a man‘s fertility status. Seen in the context of patients attending the andrology laboratory of Tygerberg Academic Hospital, this is iv Stellenbosch University http://scholar.sun.ac.za greatly needed as the majority of these patients cannot afford advanced assisted reproductive therapies. The introduction of a more accurate method of quantifying viscosity may possibly help to identify, diagnose and treat patients suffering from leukocytospermia in order to ultimately enhance their fertility potential. v Stellenbosch University http://scholar.sun.ac.za OPSOMMING Die basiese semenanalise speel 'n belangrike rol in die diagnose van manlike infertiliteit en maak dus 'n betekenisvolle bydrae tot die diagnostiese proses in andrologie, ginekologie en kliniese urologie. In 1902 het Edward Martin, wat deur sommige navorsers as die vader van moderne andrologie beskou word, voorgestel dat 'n semenanalise deel moet vorm van alle infertiliteitsondersoeke. In 1956 het die wetenskaplike John MacLeod aanvoorwerk gedoen om die grondslag van 'n basiese semenanalise daar te stel, wat beteken het dat, in plaas van net 'n observasie studie te doen, 'n semenmonster kwantitatief analiseer moes word en dat parameters soos spermmorfologie, motiliteit en viskositeit as deel van die volledige analise gedoen moet word. Die hedendaagse analise sluit, behalwe die basiese semenparameters, ook inligting in oor die funksionele aspekte van spermatozoa. Die semenanalise is dus ook ‗n belangrike diagnostiese hulpmiddel om inligting rakende moontlike abnormaliteite in die manlike genitale traktus en die sekretoriese funksies van die manlike bykomstige geslagskliere te verskaf. Hierdie inligting kan help om 'n moontlike diagnose van die man se fertiliteitspotensiaal te maak. Terselftertyd kan dit ook tesame met die metgesel se reproduktiewe inligting meer lig werp op die impak van die man se genitale patofisiologie op die paartjie se fertilitetspotensiaal. Pasiënte wat die andrologielaboratorium van die Tygerberg Akademiese Hospitaal besoek word verwys op grond van primêre, sekondêre of idopatiese infertiliteit. Gedurende die laaste aantal jare is daar ‗n toename in voorkoms van verhoogde semenviskositeit onder hierdie groep pasiënte waargeneem. Dit het die behoefte laat ontstaan om die moontlike redes hiervoor te ondersoek. Ten spyte van die feit dat viskositeit deel vorm van die roetine semenanalise is dit tog kommerwekkend aangesien dit op 'n semi-kwantitatiewe manier bepaal word. In die eerste deel van hierdie studie is 'n moontlik korrelasie tussen seminale hiperviskositeit en leukositospermie ondersoek. Om die beste moontlike verwantskap te kon bepaal is 'n nuwe en hoogs kwantitatiewe metode gebruik om viskositeit in numeriese waardes volgens internasionale vi Stellenbosch University http://scholar.sun.ac.za standaarde in centipoise (cP) te meet. Daar is van drie metodes gebruik gemaak om die teenwoordigheid van leukositospermie in 'n semenmonster te ondersoek. Die eerste metode was die sitologiese metode waar die teenwoordigheid van granulosiet op die gekleurde semensmeer tydens die standaard morfologie beoordeling bepaal word. Die tweede was deur middel van 'n leukosietperoksidase toets waarmee daar 'n kwantitatiewe telling gedoen kan word, soos teenwoordig in 'n voorbereide semenmonster. Hierdie twee bepalings is op die totale studiepopulasie van 200 pasiënte gedoen. Die viskositeit van monsters met of sonder die teenwoordigheid van leukositospermie, soos bepaal met die voorafgaande metodes en gebaseer op die WGO riglyne, is met mekaar vergelyk. Korrelasies is ook tussen hierdie twee veranderlikes en verskeie semenparameters van hierdie twee groepe gedoen. Die derde metode was 'n biochemiese ontleding met behulp van 'n ensiemgekoppeldeimmuunsorberende essai (ELISA) vir die bepaling van die ekstrasellulêre konsentrasie van polimorfonukleêre (PMN) elastase ensiem in die seminale plasma. Hierdie toets is op 124 lukraak gekose semenmonsters uitgevoer. Alle monsters is gefraksioneer voor berging in vloeibare stikstof om meervoudige analises van elke monster moontlik te maak. Die PMN elastase konsentrasies is vergelyk met die viskositeit van die semenmonsters vir 'n moontlike korrelasie en verwantskap met die teenwoordigheid van leukositospermie. Die resultate van al drie hierdie metodes, vir die moontlike bepaling van infeksie, het 'n betekenisvolle positiewe verwantskap met die toename in graad van viskositeit in semenmonsters aangetoon. Die tweede benadering van hierdie studie was om die viskositeitsgradering en die kwantitatiewe leukositopermie waardes te vergelyk met die semenparameters wat bepaal is tydens die semenanalise. Die doel van hierdie benadering was om enige verwantskap of effek van viskositeit asook die teenwoordigheid van witbloedselle op die semenparameters te ondersoek. Daar is betekenisvolle verwantskappe gevind tussen die viskositeitstatus van 'n semenmonster, die teenwoordigheid van witbloedselle en die semenparameters, soos motiliteit, morfologie en spermatosoa konsentrasie. vii Stellenbosch University http://scholar.sun.ac.za Die derde benadering was om 'n ondersoek te doen na die moontlike verwantskap tussen viskositeit en die sekretoriese funksies van die manlike bykomstige geslagskliere, te wete die prostaat en seminale vesikula. Die biochemiese ondersoek na die sekresies van hierdie twee organe, naamlik fruktose en sitroensuur, is gedoen om te bepaal of die teenwoordigheid van infeksies van die manlike traktus, en waargeneem as leukositospermia, ook in verband gebring kan word met die viskositeitstatus van 'n semenmonster. Daar is geen verband gevind tussen die sekresies van hierdie twee kliere en die viskositeit van die semenmonsters nie. Aangesien hierdie deel van die studie net as 'n loodsprojek beskou is, is die biochemiese bepalings slegs op 'n beperkte aantal semenmonsters uitgevoer en kan hierdie tipe ondersoek as 'n moontlike verdere studie onderneem word. Hierdie navorsingsresultate kan lei tot ‗n meer omvattende assessering van mans se fertiliteitstatus. Dit is uiters noodsaaklik in die konteks van omstandighede van die pasiënte wat die andrologielaboratorium van die Tygerberg Akademiese Hospitaal besoek aangesien die meerderheid nie gevorderde in vitro behandeling kan bekostig nie. Die akkurate bepaling van 'n semenmonster se viskositeit kan dus moontlik waarde toevoeg tot die identifisering, diagnose en behandeling van pasiënte met leukositospermie om sodoende hulle fertiliteitspotensiaal te verbeter. viii Stellenbosch University http://scholar.sun.ac.za DEDICATION This dissertation is dedicated to my parents Keith and Angela and my brother James, for their immense support and kindness. ix Stellenbosch University http://scholar.sun.ac.za ACKNOWLEDGEMENTS I would like to express my sincere gratitude and appreciation to the following people and institutions for their assistance during this study: Professor Stefan du Plessis, for his greatly appreciated optimism, support and enthusiasm. The Harry Crossly Foundation and National Research Foundation for financial assistance. The University of Stellenbosch and the Department of Medical Physiology for providing the research facilities. My friends from Stellenbosch, in particular Dr. Gavin George and Jessica Lee Koch, for their encouragement. Dr Florian Boehlandt, an exceptional man. With gratitude for his constant support and kindness. x Stellenbosch University http://scholar.sun.ac.za TABLE OF CONTENTS Page Declaration ii Abstract iii Opsomming vi Dedication ix Acknowledgements x Table of contents xi List of tables xvi List of figures xvii List of abbreviations xx CHAPTER 1: INTRODUCTION AND AIM OF STUDY 1.1 Introduction 1 1.2 Objective and statement of the problem 1 1.3 Thesis outlay 2 xi Stellenbosch University http://scholar.sun.ac.za 1.4 Conclusion 2 CHAPTER 2: LITERATURE REVIEW 2.1 Introduction 3 2.2 Hyperviscosity 4 2.3 Male genital tract infections 8 2.3.1 Leukocytospermia 8 2.3.2 Immune response to infection 9 2.3.3 Effects of leukocytospermia 10 2.3.4 Identification of infection 12 2.4 The role of the male accessory sex glands 13 2.4.1 Seminal vesicles 15 2.4.2 Prostate 16 CHAPTER 3: MATERIALS AND METHODS 3.1 Introduction 18 3.2 Ethical clearance 18 3.3 Semen collection 20 3.4 Standard semen analysis 20 3.4.1 Volume 20 3.4.2 Concentration 21 3.4.3 Morphology 21 3.4.4 Motility 22 xii Stellenbosch University http://scholar.sun.ac.za 3.4.4.1 Standard sperm motility analysis 22 3.4.4.2 CASA 22 3.4.5 pH 23 3.4.6 Viscosity 23 3.4.6.1 Semi-quantitative (centimeters) 23 3.4.6.2 Quantitative (centipoise) 23 3.5 Detection of the presence of leukocytes 24 3.5.1 Histochemical quantification 24 3.5.2 Cytological white blood cell grading 25 3.6 Biochemical analysis 25 3.6.1 Detection of the presence of granulocyte activity in a sample 25 3.6.2 Assessment of secretory function of seminal vesicles 28 3.6.3 Citric Acid determination for assessment of prostate function 30 3.7 Statistical analysis 32 CHAPTER 4: RESULTS 4.1 Semen parameters 33 4.2 Peroxidase positive and negative populations 36 4.2.1 Total sample group stratified based on peroxidase positive and negative samples 36 4.2.2 Sample group chosen randomly for biochemical analysis of PMN elastase stratified based on peroxidase positive and negative samples 4.3 PMN Elastase 40 43 xiii Stellenbosch University http://scholar.sun.ac.za 4.4 Secretory products of the prostate and seminal vesicles 44 4.5 Correlation studies between markers of infection and viscosity against semen parameters 45 4.5.1 PMN elastase 46 4.5.2 Leukocytes 49 4.5.3 Viscosity (cP) 53 4.5.4 Peroxidase positive cells and ASG secretions 55 4.6 Estimation of PMN elastase and viscosity (cP) cut-off values 58 4.6.1 PMN elastase 58 4.6.2 Viscosity (cP) 59 CHAPTER 5: DISCUSSION 5.1 Spermiogram results 61 5.1.1 Volume 61 5.1.2 pH 62 5.1.3 Viscosity 63 5.1.4 Leukocyte count 65 5.1.5 Motility 65 5.2 PMN elastase 68 5.3 Secretory products of the prostate and seminal vesicles 69 5.3.1 Seminal vesicles 69 5.3.2 Prostate 70 5.4 Correlation studies between markers of infection and viscosity against semen parameters 70 xiv Stellenbosch University http://scholar.sun.ac.za 5.4.1 Viscosity 71 5.4.2 Morphology 72 5.4.3 Concentration 73 5.5 PMN elastase and viscosity cut-off values 75 5.5.1 PMN elastase 75 5.5.2 Viscosity 75 CHAPTER 6: CONCLUSION 77 REFERENCES 80 APPENDICES 92 APPENDIX 1: Pap stain 92 APPENDIX 2: FIGURES i-viii 93 xv Stellenbosch University http://scholar.sun.ac.za LIST OF TABLES Page CHAPTER 2 Table 1. Semen parameters and the result of abnormalities 7 CHAPTER 4 Table 2. Summary of the semen parameters (mean ± SEM) from the total sample group and the group chosen for the assessment of PMN elastase 35 Table 3. Summary of the semen parameters (mean ± SEM) of the total sample group stratified based on peroxidase positive and negative (n=200) 38 Table 4. Summary of the semen parameters (mean ± SEM) recorded from the subpopulation of samples chosen randomly for biochemical analysis of PMN elastase (n=124), stratified based on peroxidase positive and negative 41 Table 5. Correlations between the concentration of PMN elastase (ng/ml) (mean ± SEM) and sperm parameters 47 Table 6. Correlations between peroxidase positive cells (WBC) (mean ± SEM) and sperm parameters (n=124) 50 Table 7. Correlations between cytologically determined WBC/HPF population (WBC) (mean ± SEM) and sperm parameters 53 Table 8. Correlations between seminal viscosity (cP) (mean ± SEM) and sperm parameters 55 xvi Stellenbosch University http://scholar.sun.ac.za LIST OF FIGURES Page CHAPTER 2 Figure 1. Posterior view of the male reproductive system and ASG‘s 14 CHAPTER 3 Figure 2. Flow chart showing the generalized experimental procedure 19 Figure 3 ELISA assay microtitre plate for the photometric quantification of the enzymatic activity of elastase in seminal plasma (450nm) 28 Figure 4. Standard curve generated through the biochemical analysis of the seminal plasma to assess the functioning of the seminal vesicles 29 Figure 5. Standard curve generated through the biochemical analysis of the seminal plasma to assess the functioning of the seminal vesicles 30 CHAPTER 4 Figure 6. Semen volumes of the peroxidase positive (≥1x10⁶/ml) vs. negative (<1x10⁶/ml) groups 37 Figure 7. Viscosity (filling time) of the peroxidase positive (≥1x10⁶/ml) vs. negative (<1x10⁶/ml) groups 39 Figure 8. Viscosity (cP) of the peroxidase positive (≥1x10⁶/ml) vs. negative (<1x10⁶/ml) groups 39 Figure 9. Viscosity (filling time) of the peroxidase positive (≥1x10⁶/ml) vs. negative (<1x10⁶/ml) groups 42 Figure 10. Viscosity (cP) of the peroxidase positive (≥1x10⁶/ml) vs. negative (<1x10⁶/ml) groups 42 Figure 11. PMN elastase concentrations (ng/ml) of the peroxidase positive (≥1x10⁶/ml) vs. negative (<1x10⁶/ml) groups 43 Figure 12. Citric acid (mg/per ejaculate) of the peroxidase positive (≥1x10⁶/ml) vs. negative (<1x10⁶/ml) groups 44 xvii Stellenbosch University http://scholar.sun.ac.za Figure 13. Fructose (mg/per ejaculate) of the peroxidase positive (≥1x10⁶/ml) vs. negative (<1x10⁶/ml) groups from subpopulation 45 Figure 14. Correlation analysis between the concentration of seminal PMN elastase and viscosity (seconds) 46 Figure 15. Correlation analysis between the concentration of seminal PMN elastase and viscosity (cP) 48 Figure 16. Correlation analysis between the concentrations of seminal PMN elastase and spermatozoa per milliliter of semen 48 Figure 17. Correlation analysis between the concentrations of seminal PMN elastase and the percentage of morphologically normal spermatozoa 49 Figure 18. Correlation analysis between peroxidase positive cells and the concentration of seminal PMN elastase 51 Figure 19. Correlation analysis between peroxidase positive cells and viscosity (cP) 51 Figure 20. Correlation analysis between granulocyte grade and the concentration of seminal PMN elastase 52 Figure 21. Correlation analysis between the granulocyte grade and viscosity (cP) 54 Figure 22. Correlation analysis between peroxidase positive cells and the concentration of fructose (mg/ejaculate) 56 Figure 23. Correlation analysis between peroxidase positive cells and the concentration of citric acid (mg/ejaculate) 56 Figure 24. Correlation analysis between the concentrations of seminal PMN elastase and fructose (mg/ejaculate) 57 Figure 25. Correlation analysis between the concentrations of seminal PMN elastase and citric acid (mg/ejaculate) 57 Figure 26. ROCC analysis of the PMN elastase cut-off value to establish subjects with and without leukocytospermia 58 xviii Stellenbosch University http://scholar.sun.ac.za Figure 27. ROCC analysis of semen viscosity (cP) cut-off based on the presence of ≥1x10⁶WBC/ml 59 Figure 28. ROCC analysis of semen viscosity (cP) cut-off based on manual viscosity determination (cm) 60 APPENDIX 2: Figure i. Volume of the peroxidase positive (≥1 X 10⁶ WBC/ml) vs. negative groups (<1 X 10⁶ WBC/ml) 93 Figure ii. Viscosity (filling time) of the peroxidase positive (≥1 X 10⁶ WBC/ml) vs. negative groups (<1 X 10⁶ WBC/ml) 93 Figure iii. Viscosity (cP) of the peroxidase positive (≥1 X 10⁶ WBC/ml) vs. negative groups (<1 X 10⁶ WBC/ml) 94 Figure iv. PMN elastase concentrations of the peroxidase positive (≥1 X 10⁶ WBC/ml) vs. negative groups (<1 X 10⁶ WBC/ml) 94 Figure v. Concentration of fructose per ejaculate of the peroxidase positive (≥1 X 10⁶ WBC/ml) vs. negative groups (<1 X 10⁶ WBC/ml) 95 Figure vi. Concentration of citric acid per ejaculate of the peroxidase positive (≥1 X 10⁶ WBC/ml) vs. negative groups (<1 X 10⁶ WBC/ml) 95 Figure vii. Correlation analysis between peroxidase positive cells and viscosity (sec) 96 Figure viii. Correlation analysis between peroxidase positive cells and viscosity (cP) 96 xix Stellenbosch University http://scholar.sun.ac.za LIST OF ABBREVIATIONS ART Assisted reproductive therapy ASG Accessory sex gland AUC Area under curve CASA Computer-assisted semen analysis C. trachomatis Chlamydia trachomatis CI Confidence interval cP Centipoise ELISA Enzyme-linked immunoabsorbant assay E. coli Escherichia coli F(ab’)2 Antibody fragments H202 Hydrogen peroxide HCl- Hydrochloric acid HPF High power focus IL Interleukin LCPT Leukocyte peroxidase test MAGI Male accessory sex gland infection M. hominis Mycoplasma hominis N+ Nitrogen ng Nanogram NP Non-progressive 02- Superoxide OD Optical density OS Oxidative stress P Progressive Pap Papanicolaou PMN Polymorphonuclear PSA Prostate-specific antigen r Correlation coefficient xx Stellenbosch University http://scholar.sun.ac.za ROC Receiver operating characteristic ROCC Receiver operating characteristic curve ROS Reactive oxygen species SCA Semen class analyzer SEM Standard error of the mean U. urealyticum Ureaplasma urealyticum WBC White blood cell WHO World Health Organization xxi Stellenbosch University http://scholar.sun.ac.za CHAPTER 1 INTRODUCTION AND AIM OF STUDY 1.1 Introduction A routine semen analysis remains the cornerstone of an andrological evaluation when assessing fertility challenges that particular couples‘ experience. The examination and evaluation of certain established semen parameters can provide key information about the quality of a patient‘s semen and the functional competence of the spermatozoa (Andrade-Rocha, 2005). A semen analysis is of importance to researchers and clinicians alike, playing a pivotal role in the diagnosis of male infertility and making a significant contribution to the diagnostic process in andrology, gynecology and clinical urology (Andrade-Rocha, 2005). With regards to the numerous investigations into human semen and its components, viscosity‘s possible link to subfertility is reported in journals over a period extending approximately 42 years, with one of the introductions to its association with spermatozoa motility published by Tjioe et al., in 1968. Although viscosity is included in the routine spermiogram as a macroscopic parameter, the semi-quantitative approach fails to provide a comprehensive assessment. This was recognized by researchers who developed an alternative style of quantifying viscosity in the unit cP (Rijnders et al., 2007). One way to elucidate the possible reason for an increase in samples with hyperviscosity is to investigate its relationship with male accessory sex gland infection (MAGI). An explanation may be offered by possible correlations that may exist between hyperviscosity and activation of specific immune cells, in particular a form of WBC‘s known as leukocytes. 1.2 Objective and statement of the problem A trend has been observed whereby an increasing number of patients attending the Reproductive Biology Unit at Tygerberg Hospital have presented samples with increased viscosity (Menkveld, unpublished data). The reason behind this emerging phenomenon has yet to be determined. A possible explanation could lie in the increase of male patients presenting with leukocytospermia. Although extensive research has been conducted into the relationship between certain sperm 1 Stellenbosch University http://scholar.sun.ac.za parameters and leukocytospermia (Simbini et al., 1998; Omu et al., 1999; Alvarez et al., 2002), very few studies have included the assessment of seminal viscosity. An investigation into the cause for this observation and its possible link to MAGI could provide vital insight into a condition that has received little attention. The aim of this study is therefore threefold: 1) To evaluate if a correlation exists between seminal hyperviscosity and leukocytospermia. 2) To evaluate the relationship between hyperviscosity and leukocytospermia against semen parameters such as pH and volume, as well as sperm parameters including morphology, concentration and motility. 3) To determine whether a correlation exists between hyperviscous semen and possible compromised ASG functioning as a result of genital tract infection. 1.3 Thesis outlay An extensive overview of current literature relating to seminal viscosity, the male ASG‘s and leukocytospermia and the effects thereof, will establish a background to the study in Chapter 2. This will be followed by the basic materials and methods employed in the study in Chapter 3. Chapters 4 and 5 will compromise of the results, and the discussion respectively. 1.4 Conclusion The study was able to show the applicability of a new technique in the laboratory which could extend the information of a patient‘s spermiogram for the clinician to assess. With a comprehensive analysis and standardization of spermiograms being required in a social context whereby ART is not always an option, the introduction of a more comprehensive approach to assessing hyperviscosity is crucial. 2 Stellenbosch University http://scholar.sun.ac.za CHAPTER 2 LITERATURE REVIEW 2.1 Introduction Various factors contribute towards sub-fertility and failed fertilization rates can be attributed to numerous conditions and a variety of aetiologies in both partners. However, it has been estimated that the male partner is highly influential in decreasing the possibility of a successful pregnancy with up to a third of the reports showing the male factor is solely responsible (Saalu, 2010). Therefore, judgment of the potential fertilizing capability of a man is imperative with the focal point being on the microscopic quantification of semen parameters. The assessment of several macroscopic variables such as volume, agglutination and pH are routinely evaluated as part of the standard semen analysis (Oehninger, 2000). However, the viscosity of semen is rarely quantified (Rijnders et al., 2007). Diverse irregularities or deviations from the standard reference values of these physical characteristics can be indicative of an underlying pathophysiological condition. In this context, a semen analysis can serve as a valuable diagnostic tool in assessing possible disorders of the male genital tract and the secretory pattern of the male ASG‘s (Lewis, 2007). MAGI is reflected by increased numbers of WBC‘s in semen, resulting in the condition of leukocytospermia (Wolff, 1998) and is associated with impairment in semen quality (Comhaire et al., 1999). An important symptomatic effect accompanying a MAGI is the impairment elicited upon the ASG‘s, namely the prostate and seminal vesicles which can manifest in inflammatory conditions, for example prostato-vesiculitis and epididymitis (Comhaire et al., 1999; WHO, 2010). Research has demonstrated that abnormal secretory activity of the seminal vesicles and prostate was linked to seminal changes in parameters examined in routine semen analysis such as volume, pH and viscosity (Andrade-Rocha, 2005). A detailed evaluation of the ejaculate‘s physical properties can have clinical potential for determining dysfunction in the ASG‘s (Andrade-Rocha, 2005). 3 Stellenbosch University http://scholar.sun.ac.za Samples presenting with hyperviscosity showed significant changes in the biochemical markers of the seminal vesicles and prostate, suggesting impairment in both glands ‘secretory patterns (Andrade-Rocha, 2005). 2.2 Hyperviscosity The World Health Organisation (WHO) Laboratory Manual for the Examination and Processing of Human Semen regards viscosity as one of the parameters to be assessed in the initial macroscopic examination of a semen sample (WHO, 2010). High viscosity is recorded when, after the period expected for normal liquefaction, the semen presents with homogenous stickiness as a result of the elastic properties of the semen adhering to itself (WHO, 2010). Hyperviscosity is a condition which can have a detrimental impact on both sperm functioning as well as the chemical and physical characteristics of semen, all of which contribute towards an impairment in the fertilizing capability of spermatozoa (Elia et al., 2009). Research has reported that hyperviscosity occurs in 12-29% of ejaculate‘s (Wilson and Bunge, 1975; Andrade-Rocha, 2005), and is reported more frequently in partners reporting difficulties in achieving successful pregnancies (Esfandiari et al., 2008). The biochemical processes behind the liquefaction and coagulation of semen is relatively well understood. However, at present, semen with aberrant viscosity is a phenomenon that is still not fully comprehended (Esfandiari et al., 2008; Eggert-Kruse et al., 2009). Despite this factor, the negative impact that hyperviscosity can elicit on sperm and semen parameters have been identified and are known. Semen with increased viscosity has been shown to have increased levels of sperm antibodies (IgA/IgG), coupled with higher percentages of sperm morphological abnormalities (Moulik et al., 1989) and a low sperm count (Esfandiari et al., 2008). In addition, hyperviscosity has been linked to altered motility with a lower percentage of motile spermatozoa and lower levels of Curvilinear Velocity, Straight Line Velocity, and Amplitude of Lateral Head Displacement, as determined by computer-aided sperm analysis (CASA) (Elzanaty et al., 2004). This negative influence on spermatozoa motility has been proven to be lessened after individuals 4 Stellenbosch University http://scholar.sun.ac.za responded positively to anti-inflammatory and antibiotic therapy targeted at addressing MAGI (Elia et al., 2009). Besides the negative effect that hyperviscosity can have on macro- and microscopic variables, it has also been shown to have a damaging molecular influence on the chromatin integrity of spermatozoa (Gopalkrishnan et al., 2000). To achieve successful fertilization with the oocyte, spermatozoa are required to undergo a chain of events that ensure chromatin decondensation (Windt et al., 1994). Sufficient concentrations of prostate-produced zinc in the semen ensures the stability of these processes (Caglar et al., 2005). However, semen samples presenting with glandular hypofunctioning of the prostate, a condition associated with hyperviscosity, results in the increase in seminal zinc concentrations (Huret, 1986). The resultant effect can decrease the chances of decondensation of the nucleus, which can explain the increase in reports of hyperviscosity in men suffering from infertility and partners reporting difficulties in achieving successful pregnancies (Gopalkrishnan et al., 2000). Despite a lack of understanding into the reason behind the change in this particular seminal parameter, upcoming studies have shown an association between levels of oxidative stress (OS) biomarkers and hyperviscosity, whereby the seminal antioxidant capacity is impaired in hyperviscous samples (Siciliano et al., 2001). A significant correlation was found between seminal malondialehyde, a carbonyl product of OS and viscosity, suggesting that an increase in oxidative damage may play a role in hyperviscosity (Aydemir et al., 2008). A clinical study into the prevalence of seminal hyperviscosity reported that only 48% of the patients presenting with increased viscosity displayed pathogenesis directly related to inflammatory or, infective factors. Subsequently it was hypothesized that hyperviscosity is a result of more than one pathogenic factor and could possibly be attributed to enzymatic, genetic or biochemical influences (Elia et al., 2009). Determining seminal viscosity by the WHO (WHO, 2010) approach has been criticized as a semiquantitative and poor way of assessing this abnormality (Rijnders et al., 2007). This traditional 5 Stellenbosch University http://scholar.sun.ac.za method involves the estimation of the thread length in centimeters (cm) of semen formed by gravity after it is gently aspirated into a sterile wide-bore, 5ml pipette and released. Semen with normal viscosity is regarded as having a thread-length of ≤ 2cm (WHO, 2010) (Table 1). In an attempt to quantify seminal viscosity more accurately and precisely in order to accommodate further research into its relationship with male fertility, an alternative method was devised (Rijnders et al., 2007). The approach is based on the conjecture that the viscosity of a fluid and the time taken for it to fill a capillary exist as a linear relationship (Douglas-Hamilton et al., 2005). Therefore, the viscosity status of semen samples can be determined in the laboratory when the time taken for the semen to fully load a chamber are recorded and expressed in the international unit for viscosity, cP (Rijnders et al., 2007). 6 Table 1: Selected semen parameter reference values and its associated abnormalities PARAMETER WHO LOWER REFERENCE ABNORMALITY CLINICAL SIGNIFICANCE REFERENCE Hypospermia/ Inflammation Andrade-Rocha, 2005; Agarwal et hyperspermia of ASG‘s/ al., 2009 LIMIT Semen volume (ml) 1.5 (1.4-1.7) Prostatitis Viscosity (cm) ≤2cm thread Hyperviscosity/ Dysfunctional ASG‘s Agarwal et al., 2009; WHO, 2010 Dysfunctional ASG‘s WHO, 2010 Hypoviscosity pH ≥7.2 High pH (>7.8) Low pH (<7.2) Fructose (mg/ejaculate) 2.34 Decreased concentration (<2.34) Dysfunctional Seminal Vesicles Cooper, 1991 Citric Acid (mg/ejaculate) 9.36 Decreased concentration (<9.36) Dysfunctional Prostate WHO, 1992 7 Stellenbosch University http://scholar.sun.ac.za 2.3 Male genital tract infections The inflammatory response of the genitourinary tract to the invasion of microorganisms and inflammation is considered to be extremely similar to the reaction observed in other body sites (Zorn et al., 2003). This physiological response is an important component of the immune defense system leading to a pathological condition which can continue for extended periods of time (Pasqualotto et al., 2000; Sanocka et al., 2003; Moretti et al., 2009). This passive or active invasion of these bacterial strains induces a generalized or local reaction in the urogenital tract and is often observed as an asymptomatic subclinical inflammation caused by pathogens (Bezold et al., 2007; Kokab et al., 2009), with up to 80% of infected seminal plasma showing no detection of microbial infection (Gambera et al., 2007). Studies have shown that the most common bacterium in genital tract infections is Chlamydia trachomatis (41.4%), a common sexually transmittable pathogen in young men regularly having sexual intercourse, followed by Ureaplasma urealyticum (15.5%) and Mycoplasma hominis (10.3%) (Lackner et al., 2006a; Gdoura et al., 2008), all of which are common causes of urethritis. In men experiencing infertility issues, the presence or colonisation of U. urealyticum and M. hominis in semen is a common finding (Trum et al., 1998) and semen cultures of bacterial pathogens remains the most common diagnostic method for seminal tract infections (Keck et al., 1998). Inadequate treatment of an infection and eradication of bacterial pathogens can lead to a chronic bacterial infection of the male ASG‘s (Aydemir et al., 2008). 2.3.1 Leukocytospermia Human semen is a heterogeneous fluid which contains a variety of cellular elements beyond spermatozoa such as epithelial and germ cells (el-Demiry et al., 1987). The cellular immunological composition can include chemokines, immunoglobulins, growth factors and in addition a subset of WBC‘s (el-Demiry et al., 1987; Politch et al., 2007), for example granulocytes, lymphocytes and macrophages (Lackner et al., 2006b). The predominant subset in semen is PMN leukocytes (Aitken et al., 1994), which compromise 50-80% of the total WBC count (Keck et al., 1998; Vicari, 1999), followed by macrophages (20-30%) as well as T- and B lymphocytes (2-5%) (Keck et al., 8 Stellenbosch University http://scholar.sun.ac.za 1998; Gambera et al., 2007). However, an abnormally high concentration of WBC‘s in the semen is a condition known as leukocytospermia, also referred to as leukospermia, pyospermia or pyosaemia (WHO, 2010). The WHO laboratory manual‘s guidelines define leukocytospermia as the presence of ≥1x10⁶ WBC‘s per milliliter of semen (WHO, 2010) (Table 1). An increased concentration of leukocytes is a molecular defense mechanism against the presence of foreign organisms and the detection of pathological concentrations of leukocytes, with the exclusion of a bladder infection or urethritis, has been suggested as a basic diagnostic tool in recognizing MAGI (Weidner et al., 1999; Kokab et al., 2009). The prevalence of leukocytospermia in sample population groups has yielded varying results. In a study by Kaleli et al. (2000), up to 72% of the patients examined were found to be suffering from the condition. At present, due to the fact that the condition is asymptomatic and various sites in the reproductive system can be affected (Diemer et al., 2003), the exact site of the origination of excess leukocytes is unknown (Aziz et al., 2004; Gambera et al., 2007). Due to the discrepancy as to the exact etiology of these cells, their release may be initially prompted by an inflammatory response of the genital tract to a bacterial invasion and then continually produced in their absence by immunological activity (Sharma et al., 2001). 2.3.2 Immune response to infection In response to infection, chemoattractant cytokines are important modulators in the immunoinflammatory response as they are involved in leukocyte migration (Comhaire et al., 1999; Politch et al., 2007). During a male excretory gland infection, there is a marked increase in the concentration of these regulatory proteins in the seminal plasma (Moriyama et al., 1998; Kaleli et al., 2000) due to the damaged tissue attracting WBC‘s to the site of infection (Comhaire et al., 1999; Politch et al., 2007). A positive correlation in the levels of pro-inflammatory cytokines and the concentration of seminal PMN elastase shows that there is a coordinated response to infection in the genital tract (Comhaire et al., 1999; Politch et al., 2007). Studies have demonstrated that in seminal plasma, the majority of cytokines, such as interleukin (IL) IL-8 and IL-1á, are linked to the pathogenesis of leukocytospermia (Maegawa et al., 2002). During the up-regulation of cell9 Stellenbosch University http://scholar.sun.ac.za mediated immunity, chemical reactions can result in leukocytes releasing a protease, by degranulation, known as elastase (Belorgey and Bieth, 1998; Eggert-Kruse et al., 2009). This proteolytic enzyme has been shown to be present more frequently in infertile men (Zorn et al., 2003; Moretti et al., 2009). The presence of this particular protease is considered to be a highly reliable and sensitive marker of an asymptomatic reaction (Micic et al., 1989) and can be used in diagnosing a clinically quiescent infection (Jochum et al., 1986). It can also be used in clinical application as a marker of the efficiency of anti-inflammatory treatment, as well as an alternative means of monitoring the levels of seminal WBC‘s (Eggert-Kruse et al., 2009). In the investigation into the fertility status of a couple, the concentrations of seminal PMN elastase can serve as a useful indicator of infection in the male partner (Zopfgen et al., 2000) and can be indicative of a contributing factor towards subfertility (Van der Ven et al., 1987). 2.3.3 Effects of leukocytospermia Research has shown that infertility in males can be considered beyond the conventional causes such as cryptorchidism, cystic fibrosis and varicocele and is associated with increased concentrations of leukocytes in the semen (Van der Ven et al., 1987; Henkel et al., 2003; Agarwal et al., 2008). Symptomatic and asymptomatic MAGI‘s which produce leukocytes is a condition frequently observed in infertility clinics (Arata de Bellabarba et al., 2000; Kaleli et al., 2000), with reports showing that approximately 30% of males suffering from infertility present with leukocytospermia (Gambera et al., 2007). Research on an in vitro level has proved the negative effect that leukocyte infiltration may elicit upon the fertilizing potential of spermatozoa. A study focusing on leukocyte infiltration on sperm function showed a severe negative effect of WBC contamination on the sperm-oocyte penetration test in hamster oocytes (Aitken et al., 1994), as well as human oocytes (Van der Ven et al., 1987). This adverse effect on the male‘s fertilizing potential can be attributed to the direct correlation found between increased concentrations of leukocytes and spermatozoa chromatin alterations and morphological abnormalities (Alvarez et al., 2002), all of which can have a negative influence on certain semen and spermatozoa parameters and compromise a couple‘s reproductive potential (Aitken et al., 1992; de Lamirande et al., 1995; Sanocka-Maciejewska et al., 2005). 10 Stellenbosch University http://scholar.sun.ac.za Numerous variables may influence semen parameters for example: post-testicular damage in the epididymis, abnormal spermatogenesis, environmental variables and infection (WHO, 2010). The effect of leukocytes has been controversial as different studies have reached conflicting conclusions (Tomlinson et al., 1993; Aitken et al., 1994; Omu et al., 1999; Kaleli et al., 2000; Sharma et al., 2001; Gambera et al., 2007). The two deductions which research has yielded are that leukocytospermia either lacks any influence on semen and spermatozoa parameters, or has a significant negative impact. The group of Tomlinson et al. (1993) and Aitken et al. (1994) provided data supporting the first conclusion mentioned, showing that there was no direct effect of high concentrations of leukocytes on any of the semen parameters or spermatozoa functioning. However, in contrast to the above findings, research by other study groups show that elevated levels of WBC‘s in semen have a consequential negative impact on sperm functioning and certain semen parameters such as, concentration and motility (Wolff et al., 1990) as well as the fertilizing capability (Omu et al., 1999). This can be substantiated by the results showing that the pharmacological treatment of leukocytospermia with cyclooxygenase-2 inhibitor, a form of antiinflammatory therapy, has been shown to decrease the concentration of leukocytes and improve the quality of semen parameters (Lackner et al., 2006a; Gambera et al., 2007). In the quest to examine the above mentioned negative influence of leukocytospermia on semen parameters, the role of leukocyte-produced reactive oxygen species (ROS) has been examined. ROS are spontaneously generated and required at a basal level for certain spermatozoa physiological functions (Desai et al., 2009). It has been proven that samples considered being peroxidase positive present with considerably higher concentrations of ROS (Alvarez et al., 2002) and these PMN leukocytes release oxygen radicals, such as hydrogen peroxide (H202) and superoxide (02-), which are known for their damaging effect on spermatozoa. Irrelevant of the concentration of leukocytes in semen, the presence of these WBC‘s have been shown to be associated with oxidative stress (OS) and an impairment in the quality of semen (Sharma et al., 2001). The same study has found that a negative correlation exists between leukocyte derived OS and other sperm parameters such as concentration and morphology (Sharma et al., 2001).The association between semen parameters and leukocyte concentrations is still a matter of debate in 11 Stellenbosch University http://scholar.sun.ac.za the field of male reproductive science. Owing to the fact that multiple studies have provided data that substantiates conflicting hypotheses, it is imperative to consider the findings of all these studies. 2.3.4 Identification of infection Arrays of detection methods are available to identify leukocytes in seminal plasma including: immunocytology, peroxidase, PMN elastase and cytology (Sharma et al., 2001). The traditional method and technique recommended by the WHO manual (WHO, 2010) for counting leukocytes in human semen is to use a histochemical procedure to identify the peroxidase enzyme found in the cytoplasm that characterizes PMN granulocytes (Fariello et al., 2009). Peroxidase positive leukocytes are the main leukocytes present in semen (Shekarriz et al., 1995a) and this test is proposed as the method of choice for routine andrological investigations (Menkveld, 2004) and has been stated for clinical purposes as being ideally suited to detect inflammatory changes in semen (Wolff, 1998). In the examination of a semen sample, the difference between immature germ cells and leukocytes are not easily recognizable and it is challenging to morphologically distinguish them from each other (Maietta et al., 1997). In this regard, the cytological identification is considered to be an inaccurate method to detect leukocytes (Henkel et al., 2003). ‗Round cells‘ in a routine spermiogram are considered to be all cellular elements that lack the typical morphological characteristics of normal spermatozoa (Johanisson et al., 2000). PMN granulocytes and leukocytes are considered ‗round cells‘ of non-spermatogenic origin. Due to a lack of diligence in differentiating between different categories of round cells, particularly spermatogenic germ cells and leukocytes, an overestimation of the number of leukocytes in a semen sample can often result (Maegawa et al., 2002), which can increase the chance of misdiagnoses. Research has shown that there is a significant relationship between the presence of PMN granulocyte elastase and the concentration of peroxidase positive cells in a semen sample (Henkel et al., 2003). This particular staining technique is considered to be a reliable method in the 12 Stellenbosch University http://scholar.sun.ac.za detection of leukocytes as it has minimal chances of misdiagnoses (Kaleli et al., 2000). However, it must be considered that during the inflammatory process, degranulation occurs, resulting in the extracellular liberation of the leukocyte‘s cellular contents. The quantification and identification of leukocytes based on this specific method may therefore be effected as the peroxidase compound may be undetectable (Villegas et al., 2002). In the endeavor to ensure the most accurate quantification of leukocytes, an obvious recommendation would be to use peroxidase staining, which detects intracellular enzymatic activity (Ricci et al., 2000), as well as an alternative method such as the biochemical analysis of the concentration of PMN elastase, which identifies extracellular enzymes. 2.4 The role of the male accessory sex glands Sex gland secretions play a vital role in providing spermatozoa with nourishment and a suitable environment in which to survive and function (Chughtai et al., 2005). The major male ASG‘s (Figure 1) whose secretions provide the bulk of the semen in varying volumes, are the seminal vesicles, prostate gland, and Cowper‘s bulbourethral glands (Dunker and Aumuller, 2002; Owen and Katz, 2005). Also contributing very small volumes to semen are the Ampullary, Littre and Tyson‘s glands (Mortimer, 1994). The assessment of specific seminal parameters and chemical components which contribute towards the ejaculate can serve as valuable diagnostic tools in assessing if the ASG‘s are normally functioning (Ahlgren et al.,1995; Keck et al., 1998). Diverse irregularities or deviations from the standard reference values of these physical characteristics indicate a possible underlying pathophysiological condition (Lewis, 2007). The response of the genitourinary tract to the invasion of microorganisms and inflammation is an important component of the immune defense system (Pasqualotto et al., 2000) and is considered to be extremely similar to the reaction in other body sites (Zorn et al., 2003). Inadequate treatment of an infection and eradication of bacterial pathogens can lead to a chronic bacterial infection of the male ASG‘s (Acosta and Kruger, 1996) namely the prostate and the seminal vesicles (Comhaire et al., 1999; WHO, 2010). 13 Stellenbosch University http://scholar.sun.ac.za Figure 1. Posterior view of the male reproductive system and ASG’s 14 Stellenbosch University http://scholar.sun.ac.za 2.4.1 Seminal vesicles The seminal vesicles, a pair of membranous pouches approximately 7.5cm in length, are anatomically situated in the space between the rectum and the posterior surface of the bladder (Wilson et al., 1997). The seminal vesicles play no role in the storage of sperm but its secretions are, however, responsible for most of the volume of the seminal plasma. Approximately 60% of the total ejaculated semen volume is contributed by the seminal vesicles (Nieschlag and Behre, 2000; WHO, 2010), thereby assisting in expelling and diluting the spermatozoa into the urethra and helping them to become mobile. The seminal vesicles secrete a fluid which is yellowish in color, viscid and alkaline in nature (Heath and Young, 2000). The alkalinity of the secretions provide an efficient neutralizing effect which is important as sperm functions more advantageously in alkaline fluid surroundings and require a buffer from the hostile environment of the female reproductive tract (WHO, 1992; Sherwood, 2004). A wide range of compounds are produced by the secretory cells found in the epithelial lining of the seminal vesicles, including proteins, prostaglandins, fibrinogen, ascorbic acid, flavins, phosphorycholine and ergothioneine (Hafez, 1977; Heath and Young, 2000). However, the predominant compound is fructose and the primary role of the seminal vesicles is thus considered to be the provision of high concentrations of fructose to the seminal plasma. Fructose is vital to the functional integrity of spermatozoa as it is the major source of glycolytic energy in order to maintain motility (WHO, 1992). The reference value for normal concentrations of fructose is based on the studies by Cooper, et al. (1991) is 13µmol (2.34mg) or more per ejaculate (Table 1). Determination of the concentration of the monosaccharide is commonly employed in laboratories for a variety of purposes, including the auxiliary diagnosis of retrograde ejaculation, obstructive and nonobstructive azoospermia (Lu et al., 2007) and as a marker to assess seminal vesicular function (Gonzales, 2001; WHO, 2010). Changes in seminal vesicle secretory patterns can modify the composition of products of the vesicular fluid and of the ejaculate, affecting sperm function (Andrade-Rocha, 2003). Conditions such as abnormal concentrations of zinc and fructose as well as hyperspermia, an increase in semen volume (>6ml), and hypospermia (<2ml), are all symptomatic of a glandular dysfunction in the seminal vesicles (Comhaire et al., 1999). 15 Stellenbosch University http://scholar.sun.ac.za Inflammation from infection can cause the secretory epithelium lining the seminal vesicles to be affected, resulting in atrophy and a subsequent decrease in the seminal fructose concentration (Lu et al., 2007). This post-inflammatory atrophy can result in functional deficiencies (Mikhailichenko and Esipov, 2005; Eggert-Kruse et al., 2009) and studies have demonstrated that in the presence of leukocytospermia, adequate seminal vesicle functioning appears vital to, amongst other factors, normal seminal viscosity (Gonzales, 2001; WHO, 2010). 2.4.2 Prostate The prostate is a heterogeneous, multilobulated gland consisting of four morphologically different zones: the transition, central and peripheral zone, as well as the anterior fribromuscular stroma (Rui et al., 1986; Fritjofsson et al., 1988; Lalani et al., 1997; Lu et al., 2007). Anatomically, the gland is located between the urogenital diaphragm and the neck of the bladder (Wilson et al., 1997) and develops as tubular alveolar secretory glands from the distal and proximal urethra (Knobil and Neill, 2006). The prostate completely surrounds both the ejaculatory ducts as well as the urethra and begins its journey at the neck of the bladder and ends by merging with the ejaculatory ducts (Pienta and Esper, 1993; Sherwood, 2004). The prostate secretes a thin milky fluid which is typically low in proteins, yet it contains a wide variety of various proteolytic enzymes and electrolytes. The ASG‘s supply their secretions in an ordered sequence to the ejaculate. The prostate secretions are released directly after the bulbourethral glands and contribute approximately 15-30% to the total seminal volume (Honda et al., 1988; WHO, 1992; Lalani et al., 1997; Nieschlag and Behre, 2000). The main compounds secreted by the prostate gland are citric acid and hydrolytic enzymes (Heath and Young, 2000). In addition, the following compounds are also secreted: zinc, prostate specific antigen (PSA), spermine, cholesterol, magnesium, phospholipids, muramidase, fibrinolysin, fibrinogenase, and acid phosphatase (Ganong, 1981). Biochemical evidence has shown that in males with clinically silent genital tract infections, the prostate is the organ that is predominantly affected and targeted by inflammation (Wolff et al., 1991). Prostatitis, an acute or chronic inflammation observed in young men, is classified into four groups: acute bacterial prostatitis, chronic bacterial prostatitis, achronic bacterial prostatitis and asymptomatic inflammatory prostatitis (Nieschlag and Behre, 16 Stellenbosch University http://scholar.sun.ac.za 2000). The condition has a scientifically proven negative impact on the functioning of the reproductive system and is often the common cause for recurrent urinary tract infections (Robbins and Kumar, 1987; Jennet, 1989). The predominant bacteria responsible for the infection are U. urealyticum and the gram-negative Escherichia coli (Robbins and Kumar, 1987), which reach the prostate either via the blood stream or the urethra. Chronic prostatitis may be responsible for infertility either by its negative influence on spermatozoa motility and viability or through its relation to prostatic secretions (Ganong, 1981). The effect of infection on the secretory patterns of the prostate has been identified in past studies which reported that males suffering from MAGI presented with decreased concentrations of the prostate-derived enzyme gamma- glutamyltransferase (Depuydt et al., 1998) as well as a decreased PSA by the luminal secretory cells of the prostate (Lalani et al., 1997). The latter proteolytic kallikrein-like enzyme plays a role in the degradation of the coagulated semen following ejaculation and is identified as being predominantly responsible for the process of normal liquefaction of ejaculated semen (Comhaire et al., 1999). A relationship has been established between changes in viscosity and the concentration of PSA in semen (Andrade-Rocha, 2005). With infection, and the subsequent decrease in the concentration of the enzyme and acidic compounds secreted by the prostate, in particular citric acid, the pH of the seminal plasma rises and becomes more alkaline in nature (Comhaire et al., 1999). Decreased levels of citric acid are often associated with hyperviscosity and can be used as a biomarker of glandular dysfunction (Andrade-Rocha, 2003). 17 Stellenbosch University http://scholar.sun.ac.za CHAPTER 3 MATERIALS AND METHODS 3.1 Introduction This chapter will give an overview of all the material used in the present study, as well as detailed protocols of all the methods employed. A brief outline of the experimental procedure followed in this study is shown in Figure 2. A total sample group was collected (n=200), each sample was divided into 3 separate aliquots prior to the freezing in liquid Nitrogen (N+). This allowed for each sample that was randomly chosen to be further analyzed for concentrations of PMN elastase (n=124), as well as citric acid (n=78) and fructose (n=78). No selection criteria were applied in the choice of samples to be further analyzed biochemically and photometrically. 3.2 Ethical clearance The volunteer donors involved in the sperm donor program were informed of the research protocol and ensured anonymity by signing a consent form, guaranteeing that the sample donated was to be used solely for research purposes and disposed of accordingly following experimental use. Ethical clearance for the use of semen samples was granted by the University of Stellenbosch Institutional Review Board (Ethics Reference: N07/09/198). 18 Stellenbosch University http://scholar.sun.ac.za Sampling n=200 Microscopic: Macroscopic: Peroxidase count, Concentration, Viscosity Morphology, Motility, Granulocyte pH grade Volume Extraction of seminal plasma; storage (liquid N+;-196°C) - 196º BIOCHEMICAL ANALYSIS n=124 Leukocytospermic Non – leukocytospermic (<1x 10⁶ WBC’s/ml) (≥1x 10⁶ WBC’s/ml) n=46 n=78 Citric Acid Citric Acid Fructose Fructose PMN Elastase PMN Elastase Figure 2. Flow chart showing the generalized experimental procedure 19 Stellenbosch University http://scholar.sun.ac.za 3.3 Semen collection In total, the 200 ejaculated semen samples were from two sample cohorts; patients referred to the Reproductive Biology Unit at Tygerberg Hospital for a routine spermiogram (n=162), as well as volunteer donors aged 18-26, currently studying at the Medical School Campus, University of Stellenbosch. The volunteer donors (n=38) were taking part in the sperm donor program at the Reproductive Research Laboratory. As mentioned, no exclusion criteria were applied to either group. All samples were collected in accordance to the WHO guidelines (WHO, 2010), following a 2-3 day period of sexual abstinence. Semen was collected by means of masturbation into a sterile wide mouth plastic container, placed in an incubator (37ºC, 5% CO2, 60 minutes) prior to processing of the liquefied semen samples. There is a degree of variability amongst the donors regarding a specific time at which the samples are received, therefore, to achieve consistency in the analysis, the samples were left incubated for a set period of 60 minutes. 3.4 Standard semen analysis The semen quality and sperm parameters were assessed in terms of the guidelines outlined by the WHO (WHO, 1999). The basic semen analysis was executed by phase-contrast microscopy and analyzed by experienced scientists at the Reproductive Biology Unit at Tygerberg Hospital to ensure the most accurate results. 3.4.1 Volume The volume of an ejaculate is a parameter routinely quantified in a routine semen analysis. A precise measurement of each semen sample ensures an accurate evaluation of all cellular elements suspended within (WHO, 1999). Semen samples were decanted directly from the plastic collection container following the post-ejaculate liquefaction period into a graduated plastic Falcon tube and the volume was recorded in milliliters. 20 Stellenbosch University http://scholar.sun.ac.za 3.4.2 Concentration The number of spermatozoa per unit volume of semen was determined according to WHO guidelines (WHO, 1999). In order to establish the correct dilution required for each sample, an initial wet preparation on a glass slide was examined. Once the appropriate dilution of distilled H 20 to semen has been determined according to set ratios (WHO, 2010), 10l of the diluted sample was loaded into the counting chambers of an improved bright-light Neubauer haemocytometer (depth 100µm) (Marienfeld, Germany). Once the spermatozoa settle in the counting chamber, the appropriate haemocytometer grid for the particular dilution was examined and a minimum of 200 spermatozoa were counted per replicate and the concentration of spermatozoa per milliliter of semen was calculated. 3.4.3 Morphology Sperm morphology was assessed manually using a light microscope and scored according to the Tygerberg Strict Criteria (Menkveld et al., 1990). A thin smear of each sample was prepared by placing 5-10µl of semen, depending on the concentration, on a 76 x 26mm glass microscopic slide. A second glass slide was manipulated into an angle and pulled forward dragging along the aliquot of semen to form a smear across the slide. This method ensured that a thin film of each sample was made, allowing for optimal visualization. Once the smear was air-dried and fixed in ethanol, a Papanicolaou (Pap) staining (Merck, Modderfontein, South Africa) protocol (Appendix 1) was followed to allow for morphological analysis under x100 oil-immersion bright-field objective The Pap stain allows for differentiation of a semen sample to identify spermatozoa and other cellular elements. The staining method is based on a basophilic/acidophilic stain which allows for a variation in the color of cellular contents and spermatozoa morphology (Menkveld and Kruger, 1996). For each morphology smear, a total of 200 cells were assessed and scored according to set criteria for normal and abnormal forms. 21 Stellenbosch University http://scholar.sun.ac.za 3.4.4 Motility Following the liquefaction period, the motility of the spermatozoa was analyzed and recorded by two approaches: the traditional light microscopic evaluation according to the WHO guidelines (WHO, 1999) and by the computer-assisted semen analysis (CASA). The use of two approaches for each sample ensures that an accurate result of the spermatozoa motility is recorded. 3.4.4.1 Standard sperm motility analysis For each sample, a wet smear was prepared on a microscopic slide with approximately 20µl of mixed semen dropped onto the slide and covered by a coverslip (52 x 22mm) to avoid dehydration of the semen. The slides were initially examined under a phase-contrast microscopy at an x200 magnification to get an overall assessment of the sample, followed by an x400 magnification evaluation of the motility status once the sample stops drifting. The average percentage motility of approximately 200 spermatozoa in 5 microscopic fields were assessed to the nearest 10 percent interval and recorded under the manual method as used in the Andrology laboratory, 3.4.4.2 CASA The second assessment of spermatozoa motility was quantified using an automated approach by the Sperm Class Analyzer (SCA®) (Microptic, S.L., Barcelona, Spain). The settings of the analyzer were as follows: optics, pH+; contrast, 435; brightness, 100; objective, 40x; 50 images per second; temperature, 37ºC. The components of the SCA® consist of the following: Basler A312fc digital color camera (Microptic, S.L., Barcelona, Spain), Nikon Eclipse 50i Microscope (IMP, Cape Town, South Africa) and a temperature-regulated microscope stage. To assess the motility, 2µl of semen was pipetted into a single chamber of a four-chamber disposable Leja slide (depth 20µm; length 21mm) (Leja, Nieuw-Vennep, The Netherlands). The motility status of at least 200 motile spermatozoa per sample was examined under photomicroscopic capture in several randomly selected representative fields (40x objectives). The SCA® system quantified the percentage of motile spermatozoa by following the sperm trajectory and subsequently determining the velocity. The motility parameters assessed in the study was the progressive (P) and non-progressive (NP) motility, which together reported the total motility of each sample, recorded as a percentage. 22 Stellenbosch University http://scholar.sun.ac.za 3.4.5 pH Seminal pH is an important spermiogram parameter to be investigated as the value is a reflection of the various ASG secretions (WHO, 2010). The parameter can be analyzed by both the traditional approach with litmus pH strips, as well as a more comprehensive analysis with a pH meter, which has a higher degree of accuracy in comparison. pH was assessed by a meter, 30-60 minutes post-ejaculation following the period of incubation. Prior to each sample analysis, the digital meter (Cistron) was calibrated by two pH buffers (pH 4; pH 10). The pH probe was initially immersed in a Falcon Tube containing H20 to rinse off residual traces from previous sample analysis. The probe was then placed in the pH 7 buffer solution followed by the pH 4/10 solution, with a period in between to allow for the meter to settle and calibrate. Following calibration, each sample‘s pH was assessed and recorded by submerging the probe into the semen. 3.4.6 Viscosity 3.4.6.1 Semi-quantitative (centimeters) The traditional approach in the assessment of viscosity is the observation of semen under gravity (WHO, 1999). The initial assessment of this parameter was performed after the liquefaction period of 60 minutes, at room temperature, by the aspiration of each sample through a plastic pipette and the observation of the length of a thread that viscous semen may form when released from the pipette. The estimation of this thread length that abnormally viscous samples formed was recorded in centimeters. 3.4.6.2 Quantitative (centipoise) Assessing the viscosity of a fluid indicates the resistance that the specific fluid demonstrates against natural flow (Pasqualotto et al., 2006). The following evaluation of the viscosity status was determined by measuring the filling time taken by a fresh semen sample when loaded into a capillary-loaded semen analysis chamber with tapered ends (Leja, Nieuw-Vennep, The Netherlands) (Rijnders et al., 2007). This particular action of a fluid‘s capillary flow is in accordance with the theoretical assumption that a linear relationship exists between the time taken to fill a capillary and the viscosity of the fluid (Rijnders et al., 2007). An Eppendorf 10l micropipette was 23 Stellenbosch University http://scholar.sun.ac.za used to overload semen into the filling area of a single chamber in a Leja disposable 4 chamber slide (depth, 20µm; length, 21mm; width, 6mm). The tip of the pipette was placed at the filling area of the chamber at an angle, without touching the entrance. Upon the release of the piston, the stopwatch was simultaneously started, measuring the time taken for the liquid to reach the air outlet of the chamber. The filling time of each semen sample was measured twice, with the average time taken as the final result. Once all the filling times had been recorded, the results were quantified according to a set table in cP (Rijnders et al., 2007). 3.5 Detection of the presence of leukocytes 3.5.1 Histochemical quantification For the identification and quantification of leukocytes in the semen samples, a leukocyte peroxidase test (LCPT) was performed. A wet mount was initially prepared with 20µl of mixed semen on a covered slide in order to examine the presence of non-sperm cells under a phasecontrast light microscope (x10 objective). The round cells that may be detected can include a variety of cellular elements, including morphologically immature spermatozoa such as spermatocytes and spermatids, epithelial and germ cells and leukocytes (WHO, 1999). In the microscopic evaluation, to identify and isolate leukocytes amongst the subset of non-sperm cells in the wet mount, a commercially available kit, Leukoscreen (FertiPro; Belgium) was employed. The principle of this histochemical test is based on the granules in leukocytes containing peroxidase, which together with the H202 form H20 and free oxygen ions. These oxygen ions oxidise the benzidine, staining the cells brown. A red contrast fluid allows for the differentiation between peroxidase positive round cells from peroxidase negative round cells. Prior to performing the test, a working solution was prepared with 30µl of reagent 2 (30% H202) mixed with 1ml of reagent 1 (benzidine, cyanosine and methanol), which is the stain. Subsequent to the preparation of the working solution, 100µl of the neat semen sample was mixed with 100µl of the prepared working solution in an aliquot, mixed thoroughly with a vortex and left for five minutes at room temperature on the laboratory bench. Following the five minute reaction period, 10µl was placed on 24 Stellenbosch University http://scholar.sun.ac.za a slide and covered immediately after mixing to avoid the formation of air bubbles that can interfere with the interpretation of the results. A count of the peroxidase positive cells was performed in a similar manner as the standard spermatozoa count, with the aid of a Neubauer haemocytometer (depth 100µm) (Marienfeld, Germany). Upon examination of the slides, read under the bright-field objective (magnification 400x), the following was considered: yellow to brown stained cells can be regarded as peroxidase positive cells, thus neutrophilic polymorphous leukocytes, while the pink and unstained cells can be regarded as peroxidase negative cells. For statistical purposes, the number of leukocytes present in each ejaculate can be quantified and expressed as the number of peroxidase positive cells (x106/ml). 3.5.2 Cytological white blood cell grading In addition to the quantification of leukocytes by the histochemical approach, the presence of WBC‘s was also recorded by the evaluation of semen cytology, as part of the morphology evaluation. This qualitative approach to investigate and identify cellular elements present in semen sample‘s beyond spermatozoa allows for an additional assessment of leukocytes. The assessment was consistently performed by the same scientist who quantified the morphology of each sample to ensure optimal accuracy. Leukocytes were identified under a 40x objective and counted on the slides used for morphology analysis prepared by Pap staining method (Appendix 1). Each sample‘s cellular count was graded and recorded under high power focus (HPF). For statistical purposes, the count of leukocytes were grouped to a particular number: 0) no WBC‘s present; 1) occasional WBC‘s/HPF; 2) 1-5 WBC‘s/HPF; 3) 6-10 WBC‘s/HPF; 4)>10 WBC‘s/HPF. 3.6 Biochemical analysis 3.6.1. Detection of the presence of granulocyte activity in a sample A commercially available ELISA (PMN-Elastase ELISA; Merck, Darmstadt, Germany) was employed for identifying leukocytes through the quantitative detection of extracellular PMNelastase. This ELISA is an extremely sensitive marker for the detection of elastase released by granulocytes and has been established as a useful screening method to detect the leukocytes 25 Stellenbosch University http://scholar.sun.ac.za (Ricci et al., 2000). PMN elastase in seminal plasma is linked to the alpha-1 antitrypsin inhibitor (Wolff et al., 1991). The assay contains a 96 (8 by 12 matrix) microtitre plate which is precoated with the antibody fragments (F(ab‘)2) against human PMN elastase. The assay works on an absorbance detection method whereby the prepared sample is illuminated at the specific wavelength required. After washing out the excess antibodies, the enzymatic activity in the seminal plasma can be measured photometrically (Zorn et al., 2003) by the amount of transmitted light detected passing through the sample, which is a representation of the concentration of the PMN elastase. Each sample was tested in duplicate in order to minimize methodological errors and the mean value calculated. Liquefied semen was centrifuged at 1000g for 10 minutes, after which the supernatant (seminal plasma) was aspirated and stored at -196ºC in liquid N+. To determine the PMN elastase concentration, the frozen seminal plasma was thawed at room temperature. During the thawing process, the reagents required were prepared which included the following: the wash buffer, PMN standard and the controls. Once the seminal plasma has thawed completely, it was diluted with the sample diluent (1:100) prior to the start of the assay. Once the sample has been diluted, 100µl of diluted sample mixture of seminal plasma and reagents was added in duplicate to each of the blank wells, which are coated with the PMN elastase antibody. The wells were then covered with a plate cover and incubated at room temperature for 1 hour on a rotator and subsequently washed with 300µl of wash buffer according to manufacturer‘s instructions. Following the wash, 150µl of Horseradish Peroxide conjugate was added to all the wells and incubated at room temperature for 1 hour. Once the incubation period was completed, the wells were washed 4 times as previously done. Subsequently 200µl of the Tetramethyl-benzidine substrate solution was added to all the wells, including the blanks, and incubated at room temperature for 20 minutes on a rotator, avoiding direct exposure to intense light. Subsequent to a 20 minute time lapse, the enzyme reaction was stopped by pipetting 50µl of the stop solution into each well. The results can be measured immediately or 1 hour after the addition of the stop solution if the microwell strips are stored at 4ºC in the dark. 26 Stellenbosch University http://scholar.sun.ac.za The absorbance of each microwell was read at 450nm, after the reader had been blanked with the previously prepared blank wells using a Microplate reader (Emax ImmunoAssay System, Promega, Madison, USA). The mean absorbance values for each set of duplicate standards and samples were calculated and the concentration of the PMN-elastase was determined using a standard curve prepared according to the manufacturer‘s instructions. Figure 3 shows a portion of the microtitre plate used in the biochemical assessment of the PMN elastase concentration in each sample. As previously mentioned, each sample was tested in duplicate to minimize methodological errors. Figure 3 shows the difference in colour that samples exhibit after interaction with F(ab‘)2 coating the microwells against human PMN elastase. The enzymatic activity of each sample, illuminated at a specific wavelength (450nm) to measure the optical density (OD), was calculated as previously mentioned from a standard curve. Each sample was expressed (ng/ml) as a mean ± SEM between the duplicates. 27 Stellenbosch University http://scholar.sun.ac.za Figure 3. ELISA assay microtitre plate for the photometric quantification of the enzymatic activity of elastase in seminal plasma (450nm) 3.6.2 Assessment of secretory function of seminal vesicles A photometric test for quantifying fructose in semen was done by means of a commercially available kit (FertiPro; Belgium). In order to obtain results that are reliable, each of the three standards, samples and blanks were prepared and read in duplicate and the mean value calculated. The purpose of this test is to measure the amount of fructose in human semen or seminal plasma. Due to the fact that fructose in human seminal plasma is derived from the seminal vesicles, the presence of fructose in semen can be used as a suitable marker for the secretory function of this particular ASG (Suominen, 2001). The principle of this specific photometric test is based on the fact that the fructose present in the semen is mixed with the indole in reagent 3. With the addition of the hydrochloric acid (HCl-) in reagent 2 and the heat supplied from the incubation period, this compound forms a complex which absorbs light at a wavelength of between 470492nm (WHO, 2010). Liquefied semen was centrifuged at 1000g for 10 minutes after which the seminal plasma was aspirated and stored at -196ºC in liquid N+ until further use. In preparation for the test, the seminal plasma was thawed at room temperature. During this time, a standard curve with differing fructose concentrations was created according to the manufacturer‘s instructions. Following the necessary thawing period, the seminal plasma was mixed thoroughly on a vortex mixer and 100µl was pipetted into a test tube. Subsequently, 100µl of the fructose standards and an aliquot of 0.5ml of reagent 1, a Trichloroacetic solution, were added. This mixture was 28 Stellenbosch University http://scholar.sun.ac.za centrifuged for 10 minutes at 1000g. Following centrifugation, 20µl of the resultant supernatant that formed was pipetted into an Eppendorf tube. To each of the tubes, 200µl of reagent 2 (concentrated HCl-) and 20µl of reagent 3 (indole) was added and incubated for 60 minutes at 37ºC. Following the incubation period, the color reaction was stopped by the addition of 200µl of reagent 4 (sodium hydroxide) and 200µl of the sample was read by means of a spectrophotometer at 470-492nm in a plate reader (Emax ImmunoAssay System, Promega, Madison, USA). Once all the tubes have been read, the measured OD values of the sample were plotted against the standard curve using the standard values. Two standard curves were created for each of the two kits used, as a result of the samples, with standards and blanks being used in duplicate. Figure 4 and Figure 5 show the standard curves from the two kits, created by the software of the plate reader, against the OD of each sample. Figure 4. Standard curve generated through the biochemical analysis of the seminal plasma to assess the functioning of the seminal vesicles 29 Stellenbosch University http://scholar.sun.ac.za Standard Curve 0.16 Optical Density 0.14 0.12 0.1 0.08 0.06 0.04 0.02 0 0 1 2 3 4 5 6 Fructose Concentration (mg/ml) Figure 5. Standard curve generated through the biochemical analysis of the seminal plasma to assess the functioning of the seminal vesicles To obtain the total fructose concentration for each sample, the results were multiplied with the total volume of the semen sample. This allows for an accurate assessment of the functional capacity of the seminal vesicles, as it was shown that the total fructose concentration of the glandular secretion in the ejaculate is a direct reflection of the overall secretory function of each gland (Rui et al.,1986; WHO, 2010). Normal values based on past studies which are referred to in the WHO manual is 13µmol (2.34mg) or more per ejaculate (Cooper et al., 1991). 3.6.3 Citric Acid determination for assessment of prostate function The total output of citric acid has been viewed as the strongest discriminating power in terms of biochemical markers in differentiating between semen of infected and non-infected infertile men (Comhaire et al., 1989). To be able to quantify the citric acid in human semen and therefore assess prostate functioning, a photometric test was carried out through a commercially available diagnostic reagent Citric Acid Test (FertiPro; Belgium) and performed in duplicate. 30 Stellenbosch University http://scholar.sun.ac.za Liquefied semen was centrifuged at 1000g for 10 minutes after which the seminal plasma was aspirated and stored at -196ºC in liquid N+ until further use. In preparation for the test, the seminal plasma was thawed at room temperature and once completely thawed, it was mixed well with a vortex mixer. A standard needed to first be prepared before conducting the test by mixing 100µl of reagent 3 (citric acid standard) with 100µl of reagent 2 (isopropanol and sulphuric acid). Then, 100µl of semen was mixed with 100µl of reagent 2 in an Eppendorf tube. Following centrifugation for 10 minutes at 1500g, 25µl of the supernatant was carefully pipetted into an empty well and 200µl of reagent 1 (iron (III) chloride) and sulphuric acid was added. The samples and standards were prepared in duplicate in the plate reader and the mean of the results were calculated. The OD of the sample was read by means of a spectrophotometer (Emax ImmunoAssay System, Promega, Madison, USA) at 405nm and was used to calculate the total citric acid concentration using a given equation by the manufacturer (FertiPro, Belgium): The measured value (OD) for the sample was calculated as follows: Citric Acid (mg/ml) = OD(Sample) x4 OD(Standard) The threshold level for normal citrate concentrations is 52µmol (9.36mg) or more per ejaculate (WHO, 1992). 31 Stellenbosch University http://scholar.sun.ac.za 3.7 Statistical analysis GraphPad™ Prism (version 5.00; San Diego, USA) and MedCalc™ (version 12.1; Mariakerke, Belgium) were used for all statistical analysis. The results of the study were assessed in conjunction with a Statistician from the Faculty of Sciences, University of Stellenbosch. Results are expressed as the mean ± standard error of the mean (SEM), with findings considered statistically significant when P<0.05. Comparative analysis is represented in box-and-whisker plots, which include the following for a given distribution: 1) median 2) second and third quartile values representing the middle 50% of the values 3) range of data excluding data points lying outside the T-bars and 4) data points lying outside the interquartile range. In addition, to provide an additional representation, these results which showed statistical significance by a non-parametric Wilcoxon analysis (one-tailed) are represented by bar graphs with column statistics (Appendix 2). The assessment of the relationships between specific variables and parameters was determined using correlation studies and is represented by the Spearman rank correlation coefficient (r). Results that were shown to have significant correlations are represented in linear regression graphs, with a residual plot and 95% confidence band. To assess the sensitivity and specificity of certain cut-off points and determine a cut-off point that discriminates subjects with or without leukocytospermia or hyperviscosity, the Receiver Operating Characteristic Curves (ROCC-analysis) was applied, with the Area Under the Curve (AUC) calculated. The value of AUC>50% is regarded as acceptable. 32 Stellenbosch University http://scholar.sun.ac.za CHAPTER 4 RESULTS The results can be considered in 3 stages, the first being the aim to investigate the possible influence of leukocytes on the semen parameters when the sample groups were classified by histochemical analysis into peroxidase positive (≥1x10⁶ WBC‘s/ml semen) and peroxidase negative (<1x10⁶ WBC‘s/ml semen). The values recorded represent the mean (± SEM), as well as distinction between parameters that achieved statistical significance (*P<0.05; **P<0.005). Although statistical analyses for each set of parameters that were performed are recorded in the tables, only the results that were proven significant will form part of the discussion. Included in the tables are the WHO cut-off values for the semen variables (WHO, 2010). The results that proved significant between the peroxidase positive and negative groups are represented in box and whisker-plots. The second section of the results highlights possible correlations between the three main components of the study (leukocytes, PMN elastase and viscosity) against the routine semen parameters. This allows for assessment of the possible positive or negative effect that leukocytospermia and seminal viscosity can result in. In addition, an evaluation of the relationship between the secretory products of the prostate and seminal vesicles and the semen and spermatozoa parameters are discussed. The third section of the results focuses on ROCC analysis to determine cut-off values of certain parameters in the detection of leukocytospermia. 4.1 Semen parameters For this prospective study, a basic semen analysis was performed on all 200 samples obtained. The analysis included all the parameters as was discussed in Chapter 3, the results of which are seen in Table 2. The sample groups are represented in the two populations as previously mentioned, with each sample from the total sample population (n=200), being divided and stored in fractions from which a smaller group, was randomly chosen for analysis of PMN elastase (n=124). 33 Stellenbosch University http://scholar.sun.ac.za The subgroup chosen for biochemical analysis of PMN elastase was smaller due to financial and time constraints of the study. With the exception of seminal viscosity recorded in seconds and quantified in cP according to a set table (Rijnders et al., 2007), and the granulocyte grading, the analysis and recording of the semen and sperm parameters represented in the following tables were assessed according to reference values set out by the WHO (WHO, 2010). Amongst the parameters assessed, it is interesting to note the values which deviated from the WHO lower reference values (WHO, 2010). For example, higher values were found for the volume of the ejaculates (2.86 and 2.99 vs. 1.5ml) (Table 2), the viscosity (2.99 and 2.77 vs. 2cm) (Table 2), as well as lower values in the percentage of morphologically normal spermatozoa from the total sample group (n=200) (2.22 and 2.31 vs. 4.0%) (Table 2) as well the groups stratified based on leukocyte peroxidase positive (n=61) and negative (n=139) respectively (2.44 and 2.12 vs. 4%) (Table 3). 34 Stellenbosch University http://scholar.sun.ac.za Table 2: Summary of the semen parameters (mean ± SEM) from the total sample group and the group chosen for the assessment of PMN elastase SEMEN TOTAL SAMPLE PMN ELASTASE WHO LOWER PARAMETER GROUP SAMPLE GROUP REFERNCE VALUE n=200 n=124 (5th centile; 95% CI) Volume (ml) 2.86 ± 0.11 2.99 ± 0.14 1.5 (1.4-1.7) pH 7.67 ± 0.01 7.68 ± 0.02 ≥ 7.2 Viscosity (cm) 2.99 ± 0.34 2.77 ± 0.39 ≤2cm/thread Viscosity (sec) 24.40 ± 0.78 23.89 ± 1.04 - Viscosity (cP) 7.95 ± 0.22 7.85 ± 0.29 - Leukocyte count 0.71 ± 0.04 1.57 ± 0.78 <1.0 53.04 ± 1.08 52.03 ± 15.15 32 (31-34) 1 6 (x10 /ml) Motility (% motile spermatozoa) (Grades a+b) Motility (CASA) 53.78 ± 1.06 52.67 ± 1.39 (% P and NP motile spermatozoa) 2 40 (38-42) (Grades a+b) 2 3 Concentration 78.42 ± 3.74 75.52 ± 4.64 15 (12-16) 2.00 ± 0.05 2.05 ± 0.67 - 2.22 ± 0.12 2.31 ± 0.16 4 (3.0-4.0) 6 (10 /ml) Granulocyte grade (0-4 WBC’s/HPF) 4 Morphology (normal forms, %) 1 Lower reference limit (obtained from the lower fifth centile value). 2 Grade a = rapid progressive motility (> 25 ìm s-1); Grade b = slow/sluggish progressive motility (5–25 ìm s-1); 3 P = progressive motility; NP = non-progressive motility. 4 0 = no WBC‘s; 1 = sporadic WBC‘S/HPF; 2 = 1-5 WBC/HPF; 3 = 5-10 WBC/HPF; 4 = >10 WBC/HPF; - No actual reference value 35 Stellenbosch University http://scholar.sun.ac.za 4.2 Peroxidase positive and negative populations For the purpose of identifying the relationship between leukocytospermia and the various parameters, the data in Tables 3 and 4 was analyzed after the semen samples were sub grouped into peroxidase positive and negative by the previously explained LCPT, which identifies the intracellular peroxidase enzyme in leukocytes. The division into the groups was based according to the WHO criteria for leukocytospermia, with peroxidase positive samples being classified as ≥1x10⁶ WBC‘s/ml and the peroxidase negative samples containing <1x10⁶ WBC‘s/ml (WHO, 2010). 4.2.1 Total sample group stratified based on leukocyte peroxidase positive and negative samples The incidence of males with leukocytospermia in the total sample group (n=200), as determined by the LCPT is represented in Table 3, with 31% of the subjects suffering from WHO-defined leukocytospermia (≥106 WBC‘s/ml). Volume Examination of the macroscopic parameter of semen volume per ejaculate from the total sample group revealed a significant difference between the two populations as represented in Figure 6 (and Figure i, Appendix 2). Samples classified as leukocytospermic showed a significantly higher volume of semen when evaluated against the non-leukocytospermic population (3.24 ± 0.23 vs. 2.70 ± 0.11ml; P<0.05), with the mean of both subgroups being higher than the WHO lower reference limit of 1.5ml (WHO, 2010). The range in the volume of semen in the total study group was between the lowest of 0.3ml to the highest volume reaching 10ml. The confidence interval (CI) showed that 95% of the samples fell between 2.65-3.07ml. 36 Stellenbosch University http://scholar.sun.ac.za Volume (ml) 15 10 * 5 0 Positive Negative Figure 6. Semen volumes of the peroxidase positive (≥1x10⁶/ml) vs. negative (<1x10⁶/ml) groups (*P<0.05) Viscosity The time measured in seconds for semen to fill a capillary-loaded Leja chamber was significantly increased in the leukocytospermic positive population, shown in Figure 7 (and Figure ii, Appendix 2). In comparison to the peroxidase positive group, the sample group classified as peroxidase negative showed a decrease in the filling time (28.37 ± 1.81 vs. 22.38 ± 0.74; P<0.005) (Table 3). The filling times of the Leja chamber ranged from 6.44 seconds to 49.43 seconds, with 95% of the samples filling times falling between 22.87-25.94 seconds. 37 Stellenbosch University http://scholar.sun.ac.za Table 3: Summary of the semen parameters (mean ± SEM) of the total sample group stratified based on leukocyte peroxidase positive and negative (n=200) SEMEN PARAMETER PEROXIDASE PEROXIDASE WHO LOWER POSITIVE NEGATIVE (<1x10⁶/ml) REFERENCE VALUE n=139 (5th centile; 95% CI) 6 (≥1x10 /ml) 1 n=61 Volume (ml) 3.24 ± 0.23 2.70 ± 0.11 * 1.5 (1.4-1.7) pH 7.69 ± 0.03 7.65 ± 0.02 ≥ 7.2 Viscosity (cm) 3.10 ± 0.57 2.70 ± 0.37 ≤2cm/thread Viscosity (sec) 28.37 ± 1.81 22.38 ± 0.74** - Viscosity (cP) 9.01 ± 0.49 7.39 ± 0.23** - Leukocyte count 1.34 ± 0.04 0.74 ± 0.06 <1.0 52.13 ± 1.97 54.50 ± 1.25 32 (31-34) 51.64 ± 2.00 53.74 ± 1.32 40 (38-42) Concentration (106/ml) 75.75 ± 8.11 84.88 ± 3.81 15 (12-16) Granulocyte grade (0-4 2.00 ± 0.06 2.20 ± 0.10 - 2.44 ± 0.19 2.12 ± 0.15 4 (3.0-4.0) 6 (x10 /ml) Motility (% motile spermatozoa) Motility (CASA) (% P and NP motile spermatozoa) WBC’s/HPF) 2 3 Morphology (normal forms, %) (*P<0.05; **P<0.005) 1 Lower reference limit (obtained from the lower fifth centile value). 2 P = progressive motility; NP = non-progressive motility; 3 0 = no WBC‘s; 1 = sporadic WBC‘S/HPF; 2 = 1-5 WBC/HPF; 3 = 5-10 WBC/HPF; 4 = >10 WBC/HPF 38 Stellenbosch University http://scholar.sun.ac.za Viscosity (seconds) 100 80 * 60 40 20 0 Positive Negative Figure 7. Viscosity (filling time) of the peroxidase positive (≥1x10⁶/ml) vs. negative (<1x10⁶/ml) groups (*P<0.005) Quantification of the viscosity in cP in Figure 8 (and Figure iii, Appendix 2), revealed a significant difference between the two sample groups, with 95% of the samples ranging from 7.28 to 8.43cP. The viscosity of the peroxidase positive population was significantly higher than the peroxidase negative sample group (9.01 ± 0.49 vs. 7.39 ± 0.23cP; P<0.005) (Table 3). The range was found to be 3.00-20.50cP. Viscosity (cP) 25 20 * 15 10 5 0 Positive Negative Figure 8. Viscosity (cP) of the peroxidase positive (≥1x10⁶/ml) vs. negative (<1x10⁶/ml) groups (*P<0.005) 39 Stellenbosch University http://scholar.sun.ac.za 4.2.2 Sample group chosen randomly for biochemical analysis of PMN elastase stratified based on peroxidase positive and negative samples Amongst the subset of samples chosen for biochemical analysis (n=124), the incidence of men with leukocytospermia based on the peroxidase approach was found to be 37% (n=46). The results of the spermiogram parameters recorded between the peroxidase positive and negative subpopulations are represented in Table 4. A similar trend to the total sample group of increased viscosity in the peroxidase positive samples was demonstrated in the subpopulation chosen for the assessment of PMN elastase. The peroxidase positive sample group had increased viscosity when measured in both seconds (Figure 9) and quantified in cP (Figure 10). The mean ± SEM filling time taken in seconds by the peroxidase positive population was significantly higher than the samples classified as peroxidase negative (27.81 ± 2.23 vs. 21.56 ± 0.92; P<0.05) (Table 4). Following the conversion of viscosity to cP, Figure 10 (and Figure iii; Appendix 2) the results display the same trend as expected, with the peroxidase positive sample group having an increased viscosity over the peroxidase negative group (8.87 ± 0.56 vs. 7.25 ± 0.28cP; P<0.05) (Table 4). The filling time in seconds varied from between 6.45 seconds to the highest period of 46.12 seconds. The viscosity of samples included in this study in cP, revealed the lowest viscosity to be 3.00cP and the highest viscosity to measure 20.50cP. 40 Stellenbosch University http://scholar.sun.ac.za Table 4. Summary of the semen parameters (mean ± SEM) recorded from the subpopulation of samples chosen randomly for biochemical analysis of PMN elastase (n=124), stratified based on peroxidase positive and negative SEMEN PEROXIDASE PEROXIDASE WHO LOWER PARAMETER POSITIVE NEGATIVE REFERENCE VALUE 6 6 (≥1x10 /ml) (<1x10 /ml) n=46 n=78 Volume (ml) 3.34 ± 0.27 2.78 ± 0.15 1.5 (1.4-1.7) pH 7.71 ± 0.03 7.67 ± 0.02 ≥ 7.2 Viscosity (cm) 2.78 ± 0.67 3.02 ± 0.54 ≤2cm/thread Viscosity (sec) 27.81 ± 2.23 21.56 ± 0.92 * - Viscosity (cP) 8.87 ± 0.56 7.25 ± 0.28* - Leukocyte count 1.37 ± 0.05 0.44 ± 0.03 <1.0 51.74 ± 2.12 52.18 ± 1.77 32 (31-34) 52.28 ± 2.39 52.88 ± 1.81 40 (38-42) Concentration (106/ml) 80.13 ± 5.89 67.70 ± 7.45 15 (12-16) Granulocyte grade (0- 2.28 ± 0.12 1.91 ± 0.07* - 2.48 ± 0.19 2.21 ± 0.22 4 (3.0-4.0) 618.70 ± 13.80 273.50 ± 13.42** - (5th centile; 95% CI) 1 6 (x10 /ml) Motility (% motile spermatozoa) Motility (CASA) (% P and NP motile 2 spermatozoa) 4 WBC’s/HPF) 3 Morphology (normal forms, %) PMN Elastase (ng/ml) (*P<0.05;** P<0.005) 1 Lower reference limit (obtained from the lower fifth centile value). 2 P = progressive motility; NP = nonprogressive motility 3 0 = no WBC‘s; 1 = sporadic WBC‘S/HPF; 2 = 1-5 WBC/HPF; 3 = 5-10 WBC/HPF; 4 = >10 WBC/HPF; - No actual reference value 41 Stellenbosch University http://scholar.sun.ac.za Filling time (seconds) 100 80 60 * 40 20 0 Positive Negative Figure 9. Viscosity (filling time) of the peroxidase positive (≥1x10⁶/ml) vs. negative (<1x10⁶/ml) groups (*P<0.05) Viscosity (cP) 25 20 * 15 10 5 0 Positive Negative Figure 10. Viscosity (cP) of the peroxidase positive (≥1x10⁶/ml) vs. negative (<1x10⁶/ml) groups (*P<0.05) 42 Stellenbosch University http://scholar.sun.ac.za 4.3 PMN Elastase The concentration of PMN elastase between the two groups of peroxidase positive and negative semen samples is represented in Figure 11 (and Figure iv; Appendix 2). The figure below illustrates that the sample population quantified as leukocytospermic (≥1x10⁶ WBC/ml), had significantly higher concentrations of extracellular released PMN elastase than the nonleukocytospermic sample population (618.70 ± 13.80 vs. 273.50 ± 13.42; P<0.005) (Table 4). This is in accordance with the expected outcome as it verifies that the classification of samples as leukocytospermic was accurate as the concentration of liberated PMN elastase into the seminal plasma was higher in this subpopulation. The incidence of males with PMN elastase levels in this study above 280ng/ml was found to be an overwhelming 65%. In this study, elastase concentrations that fall above 280ng/ml were to be considered as positive for MAGI/leukocytospermia (Ludwig et al., 2003). The observed range in the PMN granulocyte elastase concentrations extended from 21.37 to 813.20ng/ml, with the overall mean ± SEM of the sample group at 401.31 ± 17.92ng/ml. PMN Elastase (ng/ml) 1000 800 * 600 400 200 0 Positive Negative Figure 11. PMN elastase concentrations (ng/ml) of the peroxidase positive (≥1x10⁶/ml) vs. negative (<1x10⁶/ml) groups (*P<0.05) 43 Stellenbosch University http://scholar.sun.ac.za 4.4 Secretory products of the prostate and seminal vesicles In order to analyze the concentrations of the ASG secretions in the semen, only 78 samples could be included in the assays. As previously mentioned each of the 200 samples were subdivided and stored separately. This sample group (n=78) was chosen randomly from the same samples chosen for PMN elastase (n=124). The assay detection of these compounds is extensive and owing to time restraints and financial obstacles, only 78 samples could be assessed. Figure 12 (and Figure vi; Appendix 2) represents the different mean ± SEM concentrations (mg/ejaculate) of citric acid between the peroxidase positive (n=24) and negative (n=54) sample groups (15.33 ± 1.81 vs.19.49 ± 1.99). Although the difference between the two groups showed no significance, both are above the WHO-threshold value of 9.36mg/ejaculate (WHO, 2010). It is imperative to consider that the research in this project was intended for a pilot study and the preliminary results prompt further Citric Acid (mg/ejaculate) research. 40 30 20 10 0 Positive Negative Figure 12. Citric acid (mg/per ejaculate) of the peroxidase positive (≥1x10⁶/ml) vs. negative (<1x10⁶/ml) groups (P=0.21) 44 Stellenbosch University http://scholar.sun.ac.za The same trend was displayed in these samples when analyzed for the amount of fructose (mg/ejaculate). Figure 13 (and Figure v; Appendix 2) show the difference in fructose concentrations between the peroxidase positive (n=24) and negative (n=54) sample groups (6.20 ± 0.96 vs. 8.32 ± 1.66). The normal values according to the WHO manual is 13µmol (2.34mg) or more per ejaculate (WHO, 2010), therefore, the results show no apparent effect of leukocytes on the functional Fructose (mg/ejaculate) capacity of the seminal vesicles. 25 20 15 10 5 0 Positive Negative Figure 13. Fructose (mg/per ejaculate) of the peroxidase positive (≥1x10⁶/ml) vs. negative (<1x10⁶/ml) groups from subpopulation (P=0.42) 4.5 Correlation studies between markers of infection and viscosity, against semen parameters To further examine and analyze the main focal point of the study, correlation analysis was used to assess the interaction between leukocytospermia, viscosity and semen parameters, as well as citric acid and fructose. To achieve consistency in the results of the correlation studies, all the samples included in the analysis were from the subgroup (n=124), taken from the total sample group for the biochemical assessment of PMN elastase. 45 Stellenbosch University http://scholar.sun.ac.za 4.5.1 PMN Elastase The correlations between the concentration of PMN elastase (ng/ml) and the functional semen parameters are represented in Table 5. From the investigation into the correlation between PMN elastase against the eleven parameters, statistically significant positive correlations were found for; viscosity (seconds) (Figure 14), viscosity (cP) (Figure 15), morphology (Figure 17) and granulocyte grade (Figure 20). In contrast, a statistically significant negative correlation was found between PMN elastase concentration and the concentration of spermatozoa (Figure 16). Figures 14 and 15 reveal the relationship between PMN elastase and the viscosity of the semen samples. The parameter recorded in seconds (r=0.22; P<0.05) (Figure 14) and quantified in cP (r=0.18; P<0.05) (Figure 15), showed a significant positive correlation with the PMN elastase concentration. Viscosity (seconds) 100 80 60 r=0.22; p<0.05 40 20 0 0 200 400 600 800 1000 PMN Elastase (ng/ml) Figure 14. Correlation analysis between the concentration of seminal PMN elastase and viscosity (seconds) 46 Stellenbosch University http://scholar.sun.ac.za Table 5. Correlations between the concentration of PMN elastase (ng/ml) (mean ± SEM) and sperm parameters SEMEN r-value p-value Volume (ml) 0.03 0.74 pH 0.15 0.10 Viscosity (cm) 0.04 0.64 Viscosity (sec) 0.22 <0.05 Viscosity (cP) 0.18 <0.05 Leukocyte count 0.87 <0.005 -0.03 0.76 -0.03 0.76 Concentration (106/ml) -0.21 <0.05 Granulocyte grade (0- 0.27 <0.005 0.18 <0.05 PARAMETER 6 (x10 /ml) Motility (% motile spermatozoa) Motility (CASA) (% P and NP motile 1 spermatozoa) 4 WBC’s/HPF) 2 Morphology (normal forms, %) 1 P=progressive motility; NP = non-progressive motility; 20 = no WBC‘s; 1 = sporadic WBC‘S/HPF; 2 = 1-5 WBC/HPF; 3 = 5-10 WBC/HPF; 4 = >10 WBC/HPF 47 Stellenbosch University http://scholar.sun.ac.za Viscosity (cP) 25 20 15 r=0.18; p<0.05 10 5 0 0 200 400 600 800 1000 PMN Elastase (ng/ml) Figure 15. Correlation analysis between the concentration of seminal PMN elastase and viscosity (cP) Figure 16 shows the observed effect on sperm concentration by the release of PMN elastase by active leukocytes. This negative correlation was found to have significance (r=-0.21; P<0.05) and displays a decrease in the concentration of spermatozoa (x106/ml) against an increased PMN Concentration (x106 sperm/ml) elastase concentration per milliliter of semen. 400 300 r=-0.21; p<0.05 200 100 0 0 200 400 600 800 1000 PMN Elastase (ng/ml) Figure 16. Correlation analysis between the concentration of seminal PMN elastase and the concentration of spermatozoa per milliliter of semen 48 Stellenbosch University http://scholar.sun.ac.za Figure 17 shows a positive correlation between increased PMN elastase concentrations and an increase in spermatozoa morphological normality (r=0.18; P<0.05). Morphology (%) 15 10 r=0.18; p<0.05 5 0 0 200 400 600 800 1000 PMN Elastase (ng/ml) Figure 17. Correlation analysis between the concentration of seminal PMN elastase and the percentage of morphologically normal spermatozoa 4.5.2 Leukocytes The relationship between leukocytes, quantified by the LCPT and functional semen parameters, including PMN elastase concentrations, is represented in Table 6. Regression analysis in Figure 18 shows the statistically significant correlation between an increase in leukocytes, detected by the peroxidase count in the ejaculate and an increase in the concentration of PMN elastase, the marker for inflammation (r=0.87; P<0.05). In this regard, the study was able to successfully detect the presence of granulocyte activity and quantify the release of the extracellular enzyme, hence confirming the presence of inflammation and leukocytospermia. 49 Stellenbosch University http://scholar.sun.ac.za Table 6. Correlations between peroxidase positive cells (WBC) (mean ± SEM) and sperm parameters (n=46) SEMEN r-value p-value Volume (ml) 0.06 0.25 pH 0.01 0.45 Viscosity (cm) 0.10 0.47 Viscosity (sec) 0.35 <0.05 Viscosity (cP) 0.22 <0.05 Motility (% motile -0.11 0.11 -0.11 0.10 Concentration (106/ml) -0.10 0.14 Morphology (normal -0.10 0.10 0.87 <0.05 PARAMETER spermatozoa) Motility (CASA) (% P and NP motile 1 spermatozoa) forms, %) PMN Elastase (ng/ml) P=progressive motility; NP = non-progressive motility 50 Stellenbosch University http://scholar.sun.ac.za PMN Elastase (ng/ml) 1500 r=0.87; p<0.05 1000 r=-0.87; p<0.05 500 0 0 1 2 3 Leukocyte Count (>x106 WBC's/ml) Figure 18. Correlation analysis between peroxidase positive cells and the concentration of seminal PMN elastase Figure 19 shows the correlation between viscosity, quantified in cP and the WBC count as determined by the LCPT. A significant positive correlation was observed between increased leukocytes and an increased viscosity (r=0.22; P<0.05). A similar trend in the results was also observed when the viscosity, quantified in cm, showed significance (r=0.35; P<0.05). Viscosity (cP) 25 20 15 r=0.22; p<0.05 10 5 0 0 1 2 3 Leukocyte Count Figure 19. Correlation analysis between peroxidase positive cells and viscosity (cP) 51 Stellenbosch University http://scholar.sun.ac.za In Table 7, the correlation between cytological determination of the WBC count and semen parameters is presented. An observed negative effect of increasing WBC‘s is reflected between WBC number/HPF and motility (manual and CASA), as well as sperm concentration. However, these correlations did not achieve significance. A crucial component of the study was to confirm that the WBC‘s detected by the 3 methods were accurate in order to investigate the correlation with viscosity and semen parameters. The positive correlation between the cytological approach of a granulocyte grade of the WBC/HPF and PMN elastase is shown in Figure 20 (r=0.27; P<0.05). This significant correlation illustrates the positive connection between the amount of leukocytes and the concentration of the lysosomal proteinases of PMN granulocytes in the semen. PMN Elastase (ng/ml) 1000 800 600 r=0.27; p<0.05 400 200 0 0 2 4 6 Granulocyte grade Figure 20. Correlation analysis between granulocyte grade and the concentration of seminal PMN elastase 52 Stellenbosch University http://scholar.sun.ac.za Table 7. Correlations between cytologically determined WBC/HPF population (WBC) (mean ± SEM) and sperm parameters SEMEN r-value p-value Volume (ml) 0.01 0.45 pH 0.09 0.16 Viscosity (cm) 0.01 0.46 Viscosity (sec) 0.01 0.44 Viscosity (cP) 0.26 <0.05 Motility (% motile -0.02 0.49 -0.02 0.44 Concentration (106/ml) -0.02 0.40 Morphology (normal 0.19 0.42 0.27 <0.05 PARAMETER spermatozoa) Motility (CASA) (% P and NP motile 1 spermatozoa) forms, %) PMN Elastase (ng/ml) 1 P=progressive motility; NP = non-progressive motility 4.5.3 Viscosity (cP) The study aimed to assess viscosity in a quantitative manner; therefore, Table 8 represents the relationship between the semen parameters and viscosity when quantified in cP. The relationship between viscosity and the concentration of PMN elastase in semen is previously discussed in section 4.5.1 (Figure 14 and Figure 15). 53 Stellenbosch University http://scholar.sun.ac.za As previously discussed, Figure 19 shows the significant positive correlation between viscosities quantified in cP and an increase in leukocytes. As previously discussed, viscosity recorded in seconds (r=0.22; P<0.05) (Figure 14) and quantified in cP (r=0.18; P<0.05) (Figure 15), showed a significant correlation with the PMN elastase concentration The Spearman rank correlation in Figure 21 (r=0.26; P<0.05) expands the investigation into the association of the granulocyte grade of WBC/HPF and viscosity (cP). Viscosity (cP) 25 20 15 r=0.26; p<0.05 10 5 0 0 2 4 6 Granulocyte grade Figure 21. Correlation analysis between the granulocyte grade and viscosity (cP) 54 Stellenbosch University http://scholar.sun.ac.za Table 8. Correlations between seminal viscosity (cP) (mean ± SEM) and sperm parameters SEMEN r-value p-value Volume (ml) 0.10 0.15 pH 0.02 0.76 Leukocyte count 0.22 <0.05 -0.09 0.20 -0.08 0.25 -0.01 0.91 0.14 <0.05 0.26 <0.05 0.18 <0.05 PARAMETER 6 (10 /ml) Motility (% motile spermatozoa) Motility (CASA) (% P and NP motile 1 spermatozoa) Concentration 6 (x10 /ml) Morphology (normal forms, %) Granulocyte grade (04 WBC’s/HPF) 2 PMN Elastase (ng/ml) 1 P = progressive motility; NP = non-progressive motility; 2 0 = no WBC‘s; 1 = sporadic WBC‘S/HPF; 2 = 1-5 WBC/HPF; 3 = 5-10 WBC/HPF; 4 = >10 WBC/HPF 4.5.4 Peroxidase positive cells and ASG secretions In this study, no statistically significant results were found between increased concentrations of seminal leukocytes and alterations in the levels of citric acid and fructose. Figure 22 shows a slight decrease in the concentration of fructose secretions from the seminal vesicle observed against an increase in the leukocyte count (r=-0.12; P=0.29). 55 Stellenbosch University http://scholar.sun.ac.za In contrast, the concentration of citric acid secretions from the prostate represented in Figure 23 were slightly elevated with an increased concentration of seminal leukocytes (r=0.04; P=0.76), Fructose (mg/ejaculate) however, no significance was achieved. 25 20 15 r=-0.12; p=0.29 10 5 0 0 1 2 3 Leukocyte Count Figure 22. Correlation analysis between peroxidase positive cells and the concentration of Citric Acid (mg/ejaculate) fructose (mg/ejaculate) 100 80 60 r=0.04; p=0.76 40 20 0 0 1 2 3 Leukocyte Count Figure 23. Correlation analysis between peroxidase positive cells and the concentration of citric acid (mg/ejaculate) Figure 24 and Figure 25 show that a slight correlation was found between an increase in PMN elastase accompanied by decreased concentrations of fructose and citric acid respectively. 56 Stellenbosch University http://scholar.sun.ac.za Although no significance was found, the concentration of fructose (r=-0.15; P=0.20) (Figure 24) and citric acid (r=0.04; P=0.74) (Figure 25) per ejaculate decreased with an increase in the Fructose (mg/ejaculate) concentration of the enzyme in the semen. 25 20 r=-0.15; p=0.20 15 10 5 0 0 200 400 600 800 1000 PMN Elastase (ng/ml) Figure 24. Correlation analysis between the concentration of seminal PMN elastase and Citric Acid (mg/ejaculate) fructose (mg/ejaculate) 100 80 60 r=-0.04; p=0.74 40 20 0 0 200 400 600 800 1000 PMN Elastase (ng/ml) Figure 25. Correlation analysis between the concentration of seminal PMN elastase and citric acid (mg/ejaculate) 57 Stellenbosch University http://scholar.sun.ac.za Although no significance was revealed in the correlation studies assessing the concentration of ASG secretions, the research was a pilot study and warrants further attention with extended time and experimental procedures, as well as larger sample group of patients from Tygerberg Hospital. 4.6. Estimation of PMN elastase and viscosity (cP) cut-off values To establish cut-off values for PMN elastase and viscosity (cP) based on the results of this study, ROC analysis was employed based on the WHO cut off of ≥1 X 10⁶ WBC/ml of semen (WHO, 2010). 4.6.1 PMN elastase The resultant ROCC for PMN elastase is illustrated in Figure 26. The cut-off value for the data obtained in this study was 447ng/ml, with an AUC of 98% and P<0.0001 (n=124). PMN Elastase (ng/ml) Figure 26. ROCC analysis of the PMN elastase cut-off value to establish subjects with and without leukocytospermia 58 Stellenbosch University http://scholar.sun.ac.za 4.6.2 Viscosity (cP) The ROCC analysis indicated a cut-off value for viscosity based on the WHO criteria for leukocytospermia to be at 8.8cP, with an AUC of 59% and P=0.006 as illustrated in Figure 27. Viscosity (cP) Figure 27. ROCC analysis of semen viscosity (cP) cut-off based on the presence of ≥1x10⁶WBC/ml Figure 28 illustrates a ROCC cut-off for viscosity (cP) based on manual determination with classification variables of ≤2cm as normal and >3cm as abnormal (AUC=69%; P<0.001). According to the results, a viscosity of >8.0cP can be regarded as abnormal or increased viscosity. 59 Stellenbosch University http://scholar.sun.ac.za Viscosity (cP) Figure 28. ROCC analysis of semen viscosity (cP) cut-off based on manual viscosity determination (cm) 60 Stellenbosch University http://scholar.sun.ac.za CHAPTER 5 DISCUSSION 5.1 Spermiogram results In order to ensure the most accurate detection and quantification of the leukocyte count in the samples included in this study, three approaches were undertaken. These included: the cytological approach of the direct examination of Pap stained slides, the identification of intracellular peroxidase by the histochemical LCPT technique, as well as the biochemical procedure utilizing the monoclonal antibody technique to quantify the concentrations of PMN elastase. The following section of the discussion will focus on the spermiogram results of the study that showed significance against the presence of leukocytes, quantified histochemically and biochemically by means of the PMN elastase test. 5.1.1 Volume Results of the present study oppose past findings which have shown a diminished volume of semen is observed in patients presenting with leukocytospermia or markers of inflammation (Comhaire et al., 1989; Kaleli et al., 2000; Sanocka-Maciejewska et al., 2005; Henkel et al., 2007). The mean volume of the total sample group (n=200) was 2.86 ± 0.11ml, which is considered to be normal based on the WHO reference value of 1.5ml (5th percentile, 95% CI, 1.4-1.7ml) or more per ejaculate (Table 3) (WHO, 2010). From the division of the total sample group into peroxidase positive and negative, a significant difference was shown in the mean seminal volume between the two groups. The peroxidase positive group exhibited a higher volume of semen (3.24 ± 0.23ml) when compared to the peroxidase negative sample population (2.70 ± 0.11ml) (n=200; P<0.05) (Table 3, Figure 6). This finding also lies in contrast to previous studies which have identified leukocytospermia as having no influence on semen volume (Kaleli et al., 2000) or is linked to a trend whereby men have lower volumes of semen per ejaculate (Omu et al., 1999). An important consideration is that the samples included in the study fall between the WHO reference values, 61 Stellenbosch University http://scholar.sun.ac.za with the upper reference limit of 6ml. Thus, although a slight effect of leukocytospermia on semen volume was observed, the volume of the samples can be considered normal. The ASG‘s supply their secretions in an ordered sequence to the ejaculate. The total volume of semen is consequently indicative of the functioning of the prostate, seminal vesicles and bulbourethral glands (Nieschlag and Behre, 2000; WHO, 2010). Deviations from the lower reference value of 1.5ml are therefore symptomatic of a glandular dysfunction and have been established as a reliable reflection of the functional competence of the ASG‘s (Cooper et al., 2009; WHO, 2010). The initial volume of semen is an important parameter in an analysis as the concentration of spermatozoa and other cells in semen are based on the accurate determination of the volume (WHO, 2010). A possible explanation for the average volume being above the WHO reference value could be that the biochemical analysis revealed no major alterations in the levels of citric acid and fructose per ejaculate. This suggests that the functioning of the ASG‘s was not compromised, although leukocytospermia was identified in 31% of the total sample group. If the prostate and seminal vesicle functioning was not compromised, then the output volume of ejaculate would not be altered. It must also be considered that although alterations in volume can be a result of underlying pathological conditions and can be indicative of glandular dysfunction, other compounding factors may be responsible for hyper- or hypospermia. During the first 4 days following ejaculation, the volume of semen increases at a rate of 11.9% per day (Carlsen et al., 2004). Despite a patient review enquiring the duration of sexual abstinence prior to passing the sample, it cannot be considered to be a reliable indicator. 5.1.2 pH Semen is multi-glandular in origin with the acidic prostatic and alkaline seminal vesicle secretions combining to produce an alkaline fluid with a high pH ranging from approximately 7.2 to 8.0. With ASG secretions dictating the pH level of semen, an alteration in the pH of seminal fluid is therefore an effective indicator of prostate and seminal vesicle dysfunction (Lackner et al., 2010). 62 Stellenbosch University http://scholar.sun.ac.za Past studies have postulated that an increase in the alkalinity of semen is a result of compromised prostate functioning, which causes a decrease in the concentration of seminal citric acid contributed by the prostate gland (Comhaire et al., 1999).The results of the present study showed no evidence of hypo functioning of the prostate and seminal vesicles, or a correlation between the biochemical markers and the concentration of peroxidase positive cells. All the pH values recorded in the study fall within the WHO reference values of 7.2 - 7.8 (WHO, 2010). Therefore, a reasonable assumption is that the interaction between the ASG‘s is not responsible for the significant difference in the pH values between the two groups. It is interesting to note that in comparison to past research into the semen pH in patients with normal and abnormal spermatozoa characteristics, this study had a considerably lower mean pH value of 7.67 (n=200). Previous investigations have reported studies groups with pH values consistently >8.0 (Harraway et al., 2000) and >8.02 (Haugen and Grotmol, 1998). The WHO manual also notes that at present there are few reference points for the pH of semen and 7.2 is a consensus lower reference (WHO, 2010). A further element to consider is that seminal pH can become more alkaline in extended periods post-ejaculation, as a result of the natural buffering capacity decreasing (WHO, 2010). Therefore, in studies such as this whereby a spermiogram is sometimes performed after a reasonable amount of time due to various factors, the pH may be providing a lesser degree of significance. 5.1.3 Viscosity This study showed that from the total sample group (n=200), the overall viscosity (mean ± SEM) of the peroxidase positive fraction was found to be 9.01 ± 0.49cP (n=61), with the peroxidase negative fraction having a viscosity of 7.39 ± 0.23cP (n=139; P<0.005) (Table 3; Figure 8). Significance was found when viscosity was measured both by the filing time of the chamber measured in seconds (Figure 7), as well as when viscosity was quantified in cP. From the total sample group of 200 patients, the study demonstrated that a significant relationship exists between increased viscosity in samples which presented with a WBC count that meets the WHO-defined reference value for leukocytospermia (≥106/ml) (WHO, 2010).. Amongst the sample groups analyzed for the concentrations of PMN elastase (n=124), the same trend of significance of 63 Stellenbosch University http://scholar.sun.ac.za increased viscosity, quantified in cP, was found whereby the peroxidase positive population had a higher viscosity of 8.87 ± 0.56cP (n=46) in comparison to the peroxidase negative group presenting with a mean viscosity of 7.25 ± 0.28cP (n=78; P<0.005) (Table 4). Seminal viscosity has been scarcely addressed in literature and rarely quantified. However, this particular parameter is imperative as deviant viscosity can be indicative of hypo functioning of the ASG‘s and can impair sperm quality (Gonzales, 1993). Studies into the relationship between aberrant viscosity and various semen parameters have previously assessed viscosity with the semi quantitative method recommended by the WHO manual guidelines (WHO, 2010). Although past studies having approached alternative methods of quantifying viscosity with approaches such as a rotational viscometer (Hubner and Krause, 1985; Lin et al., 1992), the use of a lamellar capillaryfilling semen analysis chamber provides an alternative and superior method of quantifying viscosity. Studies have established a significant relationship exists between the time taken in seconds to fill the Leja chamber and the seminal plasma viscosity (Rijnders et al., 2007). Measurement of viscosity in the study by this approach found to be an effective method and allows for an accurate quantitative assessment. Data from past studies have reported that a viscosity of 4.3 ± 0.2cP is indicative of a ―normal consistency‖ and a viscosity of 5.4 ± 0.4cP can be considered a ―high consistency‖ (Mendeluk et al., 2000). The average viscosity of the semen samples in the present study was found to be considerably higher than what previous research has reported. A study has shown that from a sample group of 148 men, the lowest viscosity measurement was 1.3cP, with the highest recorded at 10.0cP (Rijnders et al., 2007). In this study, the recorded viscosities ranged from 3.0 to 15.6cP (n=200). Amongst the two sample cohorts, 81% (n=162) of the subjects were patients experiencing primary, secondary or idiopathic fertility challenges, hence it is important to note the considerably higher viscosity range in the patients from Tygerberg Hospital. Further studies assessing viscosity by this method must possibly investigate the reason for the higher viscosity statuses amongst this demographic group. Owing to quantification of viscosity in cP being an emerging method of assessing this particular parameter, a revised threshold value for high viscosity is perhaps needed. As previously mentioned, semen with a viscosity of 5.4 ± 0.4cP can be considered a ―high consistency‖ 64 Stellenbosch University http://scholar.sun.ac.za (Mendeluk et al., 2000). In the present study, the total sample group had an overwhelming 79% of the men exceeding this particular value. The results of this investigation can possibly prompt further investigations into this parameter, with emphasis on the initiation of this method to be employed in laboratories, as well as in research that focuses on male infertility. 5.1.4 Leukocyte count The prevalence of leukocytospermia as determined by means of the LCPT was 30.5% in the total sample group (n=200) (Table 3). In the samples chosen randomly for the biochemical analysis of PMN elastase (n=124), 37% (n=46) of the subjects were identified as suffering from leukocytospermia based on the WHO-threshold (Table 4). The finding strongly correlates with previously published reports which found 36.7% and 27% of males included in the studies were suffering from the condition (Gambera et al., 2007; Henkel et al., 2007). However, in contrast to past publications that reported the following incidence rates for genitourinary infection; 24% (Shekarriz et al., 1995a), 23% (Wolff and Anderson, 1988; Aitken and Baker, 1995); 22% (Arata de Bellabarba et al., 2000), 17.5% (Zorn et al., 2003), 13% (Comhaire et al., 1980), 7% (Yanushpolsky et al., 1996), and 4.7% (Cumming and Carrell, 2009), the present study group had an overall higher rate of occurrence. When considering the increase in the present study, external variables must be considered. The rate of infection varies between different population groups (Arata de Bellabarba et al., 2000) and is dependent on various external factors such as sexual behavior, environmental variables, excessive tobacco use, genetic polymorphisms and general hygiene (Close et al., 1990; Politch et al., 2007). Therefore, the demographic profile of the sample group is to be considered. 5.1.5 Motility Despite the present study observing no statistically significant differences in motility between the peroxidase positive and negative sample groups, the findings are to be discussed as spermatozoa motility is a crucial component of the routine spermiogram. Amongst the total sample group (n=200), a low mean motility value was found as determined by manual examination, as well as CASA. Motility was found to be 53.04 ± 1.08 and 53.78 ± 1.06% respectively, which is only slightly 65 Stellenbosch University http://scholar.sun.ac.za higher than the WHO reference value of 32% or more (WHO, 2010) (Table 2). The results of the present study are in accordance with previous findings, which show no significant difference between the motility of spermatozoa from leukocytospermic positive and negative semen samples (Aitken et al., 1994; Kaleli et al., 2000). An additional element which may be included in future studies is to analyze P and NP motility between peroxidase positive and negative sample populations to have a more comprehensive analysis of this particular parameter. The percentage motile sperm in a sample is a vital semen parameter as it is a physiological variable that is indicative of the functional competence of the spermatozoa (Gunalp et al., 2001). A variety of extrinsic factors can negatively impact the motility of spermatozoa, such as recreational drugs, tobacco dependence, scrotal temperature fluctuations and excessive alcohol consumption (Andrade-Rocha, 2005). However, on an intrinsic level, research has demonstrated that subnormal motility is observed in males suffering from leukocytospermia (Simbini et al., 1998). Subjects in a study which were considered infertile and presented pathological spermiograms with progressive motility of less than 50% were divided into two cohorts; with and without leukocytospermia. The study reported an overwhelming 92% of the males with leukocytospermia had sperm with no progressive motility, in comparison to the 28% in the healthy control group (Sanocka-Maciejewska et al., 2005). Endeavors aimed at understanding the pathophysiological influence of genitourinary infection on spermatozoa motility have taken numerous approaches, including the molecular and cellular interaction of bacterial pathogens, pro inflammatory cytokines and ROS. One of the most suggested explanations for this observed phenomenon is the production of ROS (Aitken et al., 1994). As previously mentioned, PMN leukocytes release oxygen radicals, such as H202 and 02-, which are known toxics towards spermatozoa, negatively effecting motility, morphology and concentration (Shekarriz et al., 1995b; Agarwal et al., 2003; 2006). It has been successfully proven that contamination of semen samples with leukocytes above the pathological threshold results in high concentrations of ROS being generated (Aitken et al., 1994). These free radicals have been shown to initiate the formation of aggregations of sperm, forming what is known as the ‗trapping effect‘. 66 66 Stellenbosch University http://scholar.sun.ac.za This phenomenon can have a negative impact on motility and therefore fertility, by limiting the amount of free sperm in the semen available to travel through the female reproductive tract (Wongkham et al., 1991). Owing to time constraints, the present study was unable to examine all of the potential mechanisms behind a decrease in spermatozoa motility of leukocytospermic positive samples but future research can benefit from an investigation in to the ROS activity of the leukocytes. With future research planned amongst patients attending the Reproductive Biology Unit at Tygerberg Hospital, the analysis of the presence of ROS in semen samples offers an interesting element to further understand the impact of the observed leukocytospermia. In summary, a crucial point to be considered is that the 81% of the subjects included in the study were providing samples for semen analysis to assess primary, secondary or idiopathic infertility. Therefore, a relatively high percentage of the samples analyzed were expected to present with characteristically abnormal parameters such as low motility, concentration or poor morphology. Owing to time restraints and the demographic profile of the subjects in the study, a follow up semen analysis wasn‘t conducted. It would possibly have been beneficial to have a second semen analysis of the leukocytospermic population, in order to compare the parameters over an extended period. This may perhaps have influenced the results of the study to a certain extent when assessing the possible impairing influence of leukocytospermia on particular spermatozoa parameters. It can be concluded that leukocytes present in semen exceeding the threshold of 1x10⁶/ml, had an influence on only a margin of the parameters assessed in a spermiogram. This finding contradicts previous reports (Tomlinson et al., 1993; Aitken et al., 1995; Fariello et al., 2009) which provided evidence that contamination of leukocyte concentrations exceeding the pathological level ascribed by the WHO have no qualitative or quantitative effect on spermatozoa that will significantly impair fertility. 67 Stellenbosch University http://scholar.sun.ac.za 5.2 PMN elastase A preliminary examination of the results of the biochemical analysis of the samples chosen for the photometric assessment of the concentration of PMN elastase, revealed a high number of the subjects in the study presenting semen with concentrations of PMN elastase above 250ng/ml, which is the suggested ―pathological‖ level (Jochum et al., 1986). From the subgroup of 124 subjects out of the total 200 sample group, 37% of the males identified as being peroxidase positive, had a PMN elastase level of more than 250ng/ml of semen. As previously mentioned, the arbitrary value of 250ng/ml is not a set reference value and previous authors (Ludwig et al., 1998; Zorn et al., 2000) have adopted varying cut-off levels. The present study used a cut-off value of 280ng/ml, which showed an overwhelming 65% of the subjects showing an incidence of PMN elastase levels above 280ng/ml. This overall frequency is considerably higher than previous reported values which have used a 250ng/ml cut-off, such as; 30.1% (Henkel et al., 2007) and 25% (Zorn et al., 2003). With regards to the concentration of the elastase in the peroxidase positive population reaching a mean ± SEM of 618.7 ± 13.80ng/ml (n=46) (Table 4), this finding is considerably higher than the concentrations reported in past studies, such as 296 ± 15.3ng/ml (Moriyama et al., 1998). However, it is imperative to consider the previously mentioned notion that the standard threshold level of what is to be considered as ―pathological‖ concentrations of the enzyme has been repeatedly debated. Various biological arguments between research groups have been put forward in the studies into leukocytospermia and the effects it has. Past investigations among different patient populations have created disparities as to the prevalence and clinical significance of the condition. This has encouraged researchers to put forward the notion that to quantify WBC‘s, standardized methods and delineations are required (Sharma et al., 2001). Despite utilizing PMN elastase as an additional marker for excess leukocyte concentrations, the complexity of the assay does not encourage it to be incorporated into a basic spermiogram. It is a valuable marker which should be promoted in research scenarios into semen viscosity and leukocytospermia as it offers a diverse biochemical insight into infection. 68 Stellenbosch University http://scholar.sun.ac.za 5.3 Secretory products of the prostate and seminal vesicles An obvious method to assess the functionality of the ASG‘s is to measure the secretory products in the seminal plasma. Several chemical components contribute towards the ejaculate; each of which can serve as diagnostic tools in assessing the functioning of the male genital system (Zopfgen et al., 2000). A decrease in the different components when assessed on an output-per-ejaculate level can represent glandular dysfunction (Acosta and Kruger, 1996). When assessing a semen sample on a biochemical level, markers of the ASG‘s can be of significant clinical value when they are associated with each other, as together they can help in determining functional disturbances (Andrade-Rocha, 2005). In spite of this, previous research outcomes have also shown that although leukocytospermia may affect certain seminal parameters, it has no detrimental effect on the functional capacity of the ASG‘s (Simbini et al., 1998). 5.3.1 Seminal vesicles The strongest discriminating factor in determining the functioning of the seminal vesicles is through measurement of the concentration of fructose in a semen sample (Lu et al., 2007). Although no significance was demonstrated, the mean fructose concentration (mg/ejaculate) (6.20 ± 0.96) of the peroxidase positive group was lower in comparison to the peroxidase negative sample population (8.32 ± 1.66) (n=78; P=0.42) (Figure 13). However, both the positive and negative samples had mean fructose concentrations exceeding the WHO-defined lower reference value of 2.34mg (13µmol) or more per ejaculate (WHO, 2010). A similar trend was observed when the correlation between additional markers of leukocytospermia and seminal fructose concentrations was examined. Accompanying an increase in PMN elastase, a decreased concentration of fructose in the ejaculate was observed but not significant (r=-0.15, P=0.20) (Figure 24). In addition, an increase in the granulocyte count of samples was shown to have a non-significant decrease in the fructose concentration (r=-0.12, P=0.29) (Figure 22). A reduction in the fructose concentration in an ejaculate has been proven to have a relationship with leukocytospermia (Bezold et al., 2007). Therefore, it can be concluded that although samples classified as leukocytospermic may have overall decreased fructose concentrations, the study was 69 Stellenbosch University http://scholar.sun.ac.za unable to document any evidence of a change in the secretory patterns of the seminal vesicles and no relationship was shown which indicated that leukocytospermia adversely affects the functional capacity of this particular ASG. 5.3.2 Prostate As previously discussed, compromised prostate functioning as a consequence of ASG infection can cause decreased concentrations of citric acid (Comhaire et al., 1999). Based on the WHOdefined reference value for citric acid 52µmol (9.36mg) or more per ejaculate (WHO, 2010), the present study revealed no overall functional disturbances in the prostatic secretory patterns of the sample groups randomly chosen for biochemical analysis. A non-significant decrease in the concentration of citric acid per ejaculate was observed in the peroxidase positive sample group (15.33 ± 1.81mg) in comparison to the peroxidase negative population (19.49 ± 1.99mg) (n=78; P=0.21) (Figure 12). The relationship between the concentrations of citric acid and PMN elastase followed the same trend as fructose, with a non-significant decrease of citric acid (mg) accompanying an increase in the concentration of the elastase enzyme (r=0.04, P=0.76) (Figure 25). However, both sample groups had a concentration of citric acid above the WHO reference value, indicating no sign of glandular hypo function. Although a pattern of decreased citric acid was demonstrated against peroxidase positive samples and increased PMN concentrations, a nonsignificant increase in the complex was seen with an increase in the leukocyte count (r=0.04, P=0.76) (Figure 23). This unexpected observation requires further investigations. However, it is important to consider what was previously mentioned that in spite the lack of statistical significance found, the research in this project was intended for a pilot study and the preliminary results prompt further research 5.4 Correlation studies between markers of infection and viscosity, against semen parameters. To further investigate and substantiate the association between viscosity and leukocytospermia, as well as the semen parameters, correlation studies were performed. The following section will discuss the relationship between the variables which showed a significant positive or negative 70 Stellenbosch University http://scholar.sun.ac.za correlation. A consideration when reviewing this section of results is the low value of the correlation coefficients. A possible reason could be attributed to the large variation of the semen samples included in the total population size. An alternative explanation could be elucidated by the large group of the samples presenting with compromised parameters upon assessment of the semen profile. 5.4.1 Viscosity Viscosity was assessed against the concentration of extracellular PMN elastase, the peroxidase reaction, as well as the cytological WBC count of the samples. In the group chosen for the assessment of PMN elastase, viscosity (cP) was shown to have a significantly positive correlation with an increase in the concentration of PMN elastase (n=124; r=0.18, P<0.05) (Figure 15). As previously discussed, the presence of PMN elastase in the semen is a complex indicator of activated leukocytes. Hence, this correlation further substantiates the study‘s findings that peroxidase positive cells at a certain concentration may be responsible for increased semen viscosity. Although past studies have shown correlations between increased viscosity and semen parameters such as motility, the present study found no correlations between viscosity in cP and the additional semen parameters assessed in a routine spermiogram. In the sample group chosen for the biochemical assessment of PMN elastase, the same trend was observed when viscosity was positively correlated against the leukocyte count, determined by the LCPT (n=124; r=0.22; P<0.05) (Figure 19). From the total sample group, an in increase in the granulocyte grade was also positively correlated with an increase in semen viscosity (cP) (n=200; r=0.26; P<0.05) (Figure 21). Based on the findings of this study showing the low, but significant correlation between WBC‘s, as detected by all three approaches of quantifying the leukocyte count against the viscosity (cP), it can be concluded with reasonable certainty that leukocytospermia is responsible for hyperviscosity. A possible application from the study is that semen samples presenting with hyperviscosity in facilities investigating the fertility status of the male partner should have a thorough examination of all markers of infection. With leukocytospermia being an asymptomatic 71 Stellenbosch University http://scholar.sun.ac.za silent infection, viscosity quantified in cP by the measurement of the filling time, can be a useful indicator for further analysis and provides a much needed quantitative approach to assess the parameter. 5.4.2 Morphology Through the detection of extracellular PMN elastase, a positive correlation was revealed between increased enzymatic presence of the leukocytes and an increase in morphologically normal spermatozoa (n=124; r=0.18, P<0.05) (Table 5, Figure 17). All morphological analyses were performed by the same, highly experienced scientist. This offers a definite degree in consistency in the results. A morphological examination provides vital information on the quality of the sperm in a sample and remains one of the pivotal parameters to be assessed in a semen analysis. Morphology has been considered to be an essential parameter when establishing the fertility status of a patient (Menkveld et al., 1990; Auger et al., 1995; Franken et al., 1999) and can be an important variable in deciding which form ART will be employed in sub fertile patients (Agarwal et al., 2009). During the maturation of spermatozoa, the morphogenetic process can result in imperfections and anomalies which can be seen in a routine semen analysis (Auger et al., 1995). Past investigations into the relationship between the presence of WBC‘s and sperm morphology have presented with conflicting results. The discrepancy has been attributed to the method of detection of leukocytes. Certain investigations that have utilized cytological methods, to detect leukocytes within the semen have reported a negative effect of leukocytospermia on the percentage of morphologically normal spermatozoa (Leib et al., 1994; Menkveld and Kruger, 1998; Arata de Bellabarba et al., 2000). In contrast, the use of alternative detection methods such as the histochemical detection of intracellular peroxidase (Kiessling et al., 1995) and immunocytochemical assays (Tomlinson et al., 1993) have proven the opposite effect. Increased concentrations of morphologically abnormal spermatozoa, specifically with elongated heads, have been reported as a parameter affected in leukocytospermic samples (Menkveld and Kruger, 1998; Simbini et al., 1998). 7272 Stellenbosch University http://scholar.sun.ac.za In a study which diagnosed MAGI by both methods of leukocyte detection, as well as the identification of pathological bacterial strains, a significant deterioration in the percentage of normal sperm cells was demonstrated (Sanocka-Maciejewska et al., 2005). Results of this study are in conflict with past findings which have shown that the presence of excessive leukocyte concentrations have a negative influence on the morphological profile of spermatozoa (Menkveld and Kruger, 1998; Alvarez et al., 2002; Fariello et al., 2009). Despite the considerable quantity of evidence substantiating the negative influence of leukocytospermia on the morphology of spermatozoa, additional studies have contested this opinion by presenting experimental findings that are in conflict with aforementioned relationship. It has been proposed that increased concentrations of leukocytes may have a positive influence on the percentage of morphologically normal spermatozoa. Research has shown that semen with increased concentrations of leukocytes presented with a significantly higher percentage of spermatozoa with normal morphology (Kaleli et al., 2000). The action of immune surveillance has been the suggested motivation behind this observation, whereby cell debris and amorphous spermatozoa are eradicated by the phagocytic action of PMN cells (Tomlinson et al., 1992; Kiessling et al., 1995). This warrants further studies into the effect of leukocytospermia and viscosity to include possible reasons for morphological changes, for example the effect of OS and ROS. An additional avenue to be investigated could include a more comprehensive analysis by CASA of sperm morphology which includes morphometric dimensions of the sperm. 5.4.3 Concentration The present study showed that with increased concentrations of PMN elastase per milliliter of semen, a decreased number of spermatozoa were observed in comparison to the nonleukocytospermic sample group (n=124; r=-0.21, P<0.05) (Table 5; Figure 16). This observation is in accordance with previous experimental data which has shown an adverse effect of leukocytospermia on the particular parameter in question (Aziz et al., 2004). The concentration or density of a semen sample is the oldest parameter reported to be investigated during a semen analysis (Macomber and Sanders, 1929). Deviations in the concentration of sperm per milliliter of 73 Stellenbosch University http://scholar.sun.ac.za seminal fluid are dependent on a variety of compounding factors. These may include: the volume of the testes, period of sexual abstinence prior to ejaculation, size of epididymal sperm reserve, as well as the extent of ductal patency, all of which can contribute towards abnormal sperm concentrations (Cooper et al., 2009). Certain medical conditions can also impact on the total number of sperm produced, such as diabetes mellitus, cryptochordism and varicocele (Agarwal et al., 2009). The isolation of pathological microbial strains in semen samples from men suffering from MAGI‘s and resultant leukocytospermia has been proven to have a significant negative correlation with the sperm concentration (Sanocka-Maciejewska et al., 2005). Numerous studies in the past have shown a similar negative relationship existing between leukocytospermia and the concentration of spermatozoa within these infected samples (Wolff et al., 1990; Simbini et al., 1998; Omu et al., 1999). However, studies by Krieger et al. (1996) and Kaleli et al. (2000) showed that subjects identified as suffering from leukocytospermia had increased concentrations of spermatozoa per milliliter in comparison to the healthy control group. It must be considered that concentration is quantified in terms of sperm per milliliter of semen. Hence, the concentration of a sample will be directly affected by the volume of semen in which it is suspended. A more effective method of quantifying the spermatozoa concentration would be to include the volume of the semen sample into the count. A trend was demonstrated in the results, whereby the volume of the leukocytospermic populations in the subpopulation of samples (n=124) was increased. However, in spite of an increase in the volume of semen, the concentration of spermatozoa in the leukocytospermic populations still decreased. As previously mentioned, it has been postulated that the phagocytic action of PMN cells may be responsible for the removal of amorphous sperm and cellular debris in the seminal plasma (Tomlinson et al., 1992; Kiessling et al., 1995). The decrease in the concentration of spermatozoa may possibly due to this explanation and warrants further investigation. Reduced or low sperm concentrations can be idiopathic, however, based on these findings; it can be postulated with a reasonable amount of certainty that an increase in the leukocyte count, quantified by enzymatic release, can be the causative factor behind a decreased spermatozoa count. 74 74 Stellenbosch University http://scholar.sun.ac.za 5.5 PMN elastase and viscosity cut-off values The approach to using the ROCC analysis is to establish cut-off values of the two main parameters that were investigated: viscosity (cP) and concentration of PMN elastase. In this study, the standard WHO-defined criteria for leukocytospermia of ≥1 x10⁶ WBC/ml was used to establish a cut-off value for viscosity (cP) and the PMN elastase concentration. 5.5.1 PMN elastase The ROCC analysis of the WHO-defined criteria for leukocytospermia (≥ 1x10⁶ WBC/ml of semen) to obtain a cut-off value for PMN elastase had a sensitivity of 95.7%, a specificity of 96.2% at a cutoff value of 447ng/ml in identifying infection (Figure 26). This value in the study of leukocytospermia helps to determine the predictive value of PMN elastase concentrations in the detection of MAGI. The large value of 98% for the AUC underlies the strong predictive value (P<0.001) of this test. The cut-off value of 447ng/ml is considerably higher, with a stronger predictive value than what previous studies have found, which have been shown to range between 230ng/ml (Ludwig et al., 1998) to 290ng/ml (Zorn et al., 2000). 5.5.2 Viscosity The ROCC-analysis to establish a cut-off for viscosity (cP), based on the WBC count standard for leukocytospermia (≥ 1x10⁶ WBC/ml of semen), showed a cut-off value of >8.8cP. Unfortunately, the predictive power for the presence of leukocytospermia with an AUC of 59% is not as strong (P=0.006) as that of the PMN elastase. However, when compared to the manual results where ≥3cm was taken as abnormal or increased viscosity, the results of the ROCC analysis also indicated a cut-off value of <8.0cP, with an AUC of 68.8% indicating a strong predictive value (P<0.001) (Figure 28). As previously mentioned, the value of 4.3 ± 0.2cP to be the cut off value to classify samples as having ―high‖ viscosity is empirical and was only established based on past studies which were novel into the quantification of semen viscosity in the unit cP (Mendeluk et al., 2000). With this component of the study being a pioneering approach, a lower reference and cut-off value for 75 Stellenbosch University http://scholar.sun.ac.za viscosity against the leukocyte count offers a novel dimension. This study provides a cut off that although is higher than previous reports, is an additional approach to view semen viscosity and definitely warrants further research to possibly establish a standard reference value. 76 Stellenbosch University http://scholar.sun.ac.za CHAPTER 6 CONCLUSION An extensive evaluation of the leukocyte concentrations in the samples by different methods was used to identify and quantify WBC‘s in semen. The project was able to successfully detect the presence of granulocyte activity and quantify the release of the extracellular enzyme, PMN elastase. The utilisation of an enzyme immunoassay to quantify the concentration liberated from leukocytes allowed for a comprehensive analysis of the semen samples which extended the study beyond the conventional cytological and histochemical approach which detects WBC‘s that still intact have membrane integrity. Therefore, this study offers an additional marker of inflammation when investigating leukocytospermia and its possible relationship with viscosity. Detection of PMN elastase correlated positively with increased concentrations of leukocytes, hence confirming the presence of inflammation and leukocytospermia. Additional research into MAGI and the effects thereof could possibly benefit from a combination of diagnostic approaches, including bacteriological tests or the measurement of IL-6 levels. However, due to the efficacy and simplicity of the LCPT to quantify leukocytes, it can be suggested that it should be implemented as primary laboratory test for leukocytospermia. A well-defined and statistically significant relationship between the filling time of a capillary slide and the viscosity of seminal plasma quantified in cP was demonstrated. A significant relationship was demonstrated between all three of the markers used to identify leukocytospermia and the condition of seminal hyperviscosity. Hence, it can be concluded with a reasonable certainty that a relationship does indeed exist between leukocytospermia and semen viscosity. With infertility challenges proposing an obstacle for many couples, the extension of variables to assess male fertility is an important line of research. Assessment of viscosity by the WHO manual guidelines can be considered a semi-qualitative approach that is in need of advancement. At present, assessment of seminal viscosity in cP is utilized in research scenarios and not in routine spermiograms. This project demonstrates the applicability of using the quantitative approach of 77 Stellenbosch University http://scholar.sun.ac.za assessing viscosity in cP. In order to provide clinicians with the most comprehensive results of the patient‘s semen parameters, there is a need for the implementation of effective laboratory techniques to assess parameters that may compromise the male‘s fertility capability. A possible limitation of the study was that the patients attending the Reproductive Biology Unit were providing semen samples for a primary or secondary spermiogram and were not expected to have a follow up at Tygerberg Hospital. Repeat analyses of the samples identified as being leukocytospermic and detected by the LCPT would provide information on the possible long term effect of chronic or episodic leukocytospermia on viscosity over an extended period. To further investigate the relationship between excess leukocytes and viscosity, a possible extension of research could include the microbiological analysis of semen samples to allow for the isolation of specific bacterial strains. Research has shown C. trachomatis to be the strain responsible for the increased PMN elastase concentrations (Wolff et al., 1991). In addition, the identification of U. urealyticum as an infectious agent linked to semen hyperviscosity puts forward the notion that a correlation does exist between leukocytospermia and increased semen viscosity (Wang et al., 2006). However, additional studies have contested this by reporting no correlation between markers of infection and increased viscosity (Munuce et al., 1999), including human immunodeficiency virus infection (Dondero et al., 1996). Treatment of patients presenting with hyperviscosity and positive semen cultures have shown that therapeutic treatment with tetracycline for a specific period resolved hyperviscosity in 52% of patients out of a sample group of 151 patients (Elia et al., 2009). In addition, treatment with anti-inflammatories and antibiotics has been shown to lower seminal elastase concentrations to a certain degree (Micic et al., 1989; Reinhardt et al., 1997). A possible step to be taken in this field of research is the isolation of a specific bacterial strain by semen culture that is causing seminal hyperviscosity and to assess the frequency of infection amongst a population group experiencing fertility challenges. 78 Stellenbosch University http://scholar.sun.ac.za With the observed increase of patients attending Tygerberg Hospital presenting semen samples with high viscosity, the study was able to show the applicability of this new approach in a laboratory which could extend the information of a patient‘s spermiogram for the clinician to assess. With a comprehensive analysis and standardization of spermiograms being required in a social context whereby ART is not always an option, the introduction of a more comprehensive approach to assessing hyperviscosity is crucial. 79 Stellenbosch University http://scholar.sun.ac.za REFERENCES Acosta, A. A. and T. F. Kruger, Eds. (1996). Human spermatozoa in assisted reproduction. Bath, Partethon Publishing Group. Agarwal, A. (2009). "Laboratory Assessment of Male Infertility—A Guide for the Urologist." US Urology: 70-3. Agarwal, A., K. Makker, et al. (2008). "Clinical relevance of oxidative stress in male factor infertility: an update." Am J Reprod Immunol 59(1): 2-11. Agarwal, A., R. A. Saleh, et al. (2003). "Role of reactive oxygen species in the pathophysiology of human reproduction." Fertil Steril 79(4): 829-43. Agarwal, A., R. K. Sharma, et al. (2006). "Reactive oxygen species as an independent marker of male factor infertility." Fertil Steril 86(4): 878-85. Ahlgren, G., G. Rannevik, et al. (1995). "Impaired secretory function of the prostate in men with oligo-asthenozoospermia." J Androl 16(6): 491-8. Aitken, R. J., K. West, et al. (1994). "Leukocytic infiltration into the human ejaculate and its association with semen quality, oxidative stress, and sperm function." J Androl 15(4): 343-52. Aitken, R. J. and H. W. Baker (1995). "Seminal leukocytes: passengers, terrorists or good samaritans?" Hum Reprod 10(7): 1736-9. Aitken, R. J., D. W. Buckingham, et al. (1995). "Analysis of sperm movement in relation to the oxidative stress created by leukocytes in washed sperm preparations and seminal plasma." Hum Reprod 10(8): 2061-71. Aitken, R. J., D. Buckingham, et al. (1992). "Differential contribution of leucocytes and spermatozoa to the generation of reactive oxygen species in the ejaculates of oligozoospermic patients and fertile donors." J Reprod Fertil 94(2): 451-62. Alvarez, J. G., R. K. Sharma, et al. (2002). "Increased DNA damage in sperm from leukocytospermic semen samples as determined by the sperm chromatin structure assay." Fertil Steril 78(2): 319-29. 80 Stellenbosch University http://scholar.sun.ac.za Andrade-Rocha, F. T. (2005). "Physical analysis of ejaculate to evaluate the secretory activity of the seminal vesicles and prostate." Clin Chem Lab Med 43(11): 1203-10. Andrade-Rocha, F. T. (2003). "Semen analysis in laboratory practice: an overview of routine tests." J Clin Lab Anal 17(6): 247-58. Arata de Bellabarba, G., I. Tortolero, et al. (2000). "Nonsperm cells in human semen and their relationship with semen parameters." Arch Androl 45(3): 131-6. Auger, J., J.M. Kunstmann, et al. (1995). "Decline in semen quality among fertile men in Paris during the past 20 years." N Eng J Med 332(5): 281-5. Aydemir, B., I. Onaran, et al. (2008). "The influence of oxidative damage on viscosity of seminal fluid in infertile men." J Androl 29(1): 41-6. Aziz, N., A. Agarwal, et al. (2004). "Novel associations between specific sperm morphological defects and leukocytospermia." Fertil Steril 82(3): 621-7. Belorgey, D. and J. G. Bieth (1998). "Effect of polynucleotides on the inhibition of neutrophil elastase by mucus proteinase inhibitor and alpha 1-proteinase inhibitor." Biochemistry 37(46): 16416-22. Bezold, G., J. A. Politch, et al. (2007). "Prevalence of sexually transmissible pathogens in semen from asymptomatic male infertility patients with and without leukocytospermia." Fertil Steril 87(5): 1087-97. Caglar, G. S., M. Hammadeh, et al. (2005). "In vivo and in vitro decondensation of human sperm and assisted reproduction technologies." In Vivo 19(3): 623-30. Carlsen, E., J. H. Petersen, et al. (2004). "Effects of ejaculatory frequency and season on variations in semen quality." Fertil Steril 82(2): 358-66. Chughtai, B., A. Sawas, et al. (2005) "A neglected gland: a review of Cowper's gland." Int J Androl 28(2): 74-7. Close, C. E., P. L. Roberts, et al. (1990). "Cigarettes, alcohol and marijuana are related to pyospermia in infertile men." J Urol 144(4): 900-3. Comhaire, F. H., A. M. Mahmoud, et al. (1999). "Mechanisms and effects of male genital tract infection on sperm quality and fertilizing potential: the andrologist's viewpoint." Hum Reprod Update 5(5): 393-8. 81 Stellenbosch University http://scholar.sun.ac.za Comhaire, F. H., L. Vermeulen, et al. (1989). "Study of the accuracy of physical and biochemical markers in semen to detect infectious dysfunction of the accessory sex glands." J Androl 10(1): 50-3. Comhaire, F.H., G. Verschraegen, et al. (1980). "Diagnosis of accessory gland infection and its possible role in male infertility." Int J Androl 3(1): 32-45. Cooper, T.G., F Jockenhoevel, et al. (1991). "Variations in semen parameters from fathers." Hum Reprod 6: 859-866. Cooper, T. G., E. Noonan, et al. (2009). "World Health Organization reference values for human semen characteristics." Hum Reprod Update 16(3): 231-45. Cumming, J. A. and D. T. Carrell (2009). "Utility of reflexive semen cultures for detecting bacterial infections in patients with infertility and leukocytospermia." Fertil Steril 91(Suppl 4): 1486-8. de Lamirande, E. and C. Gagnon (1995). "Capacitation-associated production of superoxide anion by human spermatozoa." Free Radic Biol Med 18(3): 487-95. Depuydt, C., A. Zalata, et al. (1998). "Mechanisms of sperm deficiency in male accessory gland infection." Andrologia 30 Suppl 1: 29-33. Desai, N., R. Sharma, et al. (2009). "Physiologic and pathologic levels of reactive oxygen species in neat semen of infertile men." Fertil Steril 92(5): 1626-31. Diemer, T., P. Huwe, et al. (2003). "Urogenital infection and sperm motility." Andrologia 35(5): 283-7. Dondero, F., T. Rossi, et al. (1996). "Semen analysis in HIV seropositive men and in subjects at high risk for HIV infection." Hum Reprod 11(4): 765-8. Douglas-Hamilton, D. H., N. G. Smith, et al. (2005). "Capillary-loaded particle fluid dynamics: effect on estimation of sperm concentration." J Androl 26(1): 115-22. Dunker, N., G. Aumuller (2002). "Transforming growth factor-beta 2 heterozygous mutant mice exhibit Cowper's gland hyperplasia and cystic dilations of the gland ducts (Cowper's syringoceles)." J Anat 201:173-83. 82 Stellenbosch University http://scholar.sun.ac.za Eggert-Kruse, W., K. Zimmermann, et al. (2009). "Clinical relevance of polymorphonuclear (PMN-) elastase determination in semen and serum during infertility investigation." Int J Androl 32(4): 317-29. el-Demiry, M. I., T. B. Hargreave, et al. (1987). "Immunocompetent cells in human testis in health and disease." Fertil Steril 48(3): 470-9. Elia, J., M. Delfino, et al. (2009). "Human semen hyperviscosity: prevalence, pathogenesis and therapeutic aspects." Asian J Androl 11(5): 609-15. Elzanaty, S., J. Malm, et al. (2004). "Visco-elasticity of seminal fluid in relation to the epididymal and accessory sex gland function and its impact on sperm motility." Int J Androl 27(2): 94-100. Esfandiari, N., H. Burjaq, et al. (2008). "Seminal hyperviscosity is associated with poor outcome of in vitro fertilization and embryo transfer: a prospective study." Fertil Steril 90(5): 1739-43. Fariello, R. M., P. T. Del Giudice, et al. (2009). "Effect of leukocytospermia and processing by discontinuous density gradient on sperm nuclear DNA fragmentation and mitochondrial activity." J Assist Reprod Genet 26(2-3): 151-7. Franken, D.R., C.J. Franken, et al. (1999). "Normal sperm morphology and chromatin packaging: comparison between aniline blue and chromomycin A3 staining." Andrologia 31(6): 361-66. Fritjofsson, A., U. Kvist, et al. (1988). "Anatomy of the prostate. Aspects of the secretory function in relation to lobar structure." Scand J Urol Nephrol Suppl 107: 5-13. Gambera, L., F. Serafini, et al. (2007). "Sperm quality and pregnancy rate after COX-2 inhibitor therapy of infertile males with abacterial leukocytospermia." Hum Reprod 22(4): 104751. Ganong, W. F. (1981). Review of Medical Physiology. Los Altos, Lang Medical Publications. Gdoura, R., W. Kchaou, et al. (2008). "Screening for bacterial pathogens in semen samples from infertile men with and without leukocytospermia." Andrologia 40(4): 209-18. Gonzales, G. F. (2001). "Function of seminal vesicles and their role on male fertility." Asian J Androl 3(4): 251-8. 83 Stellenbosch University http://scholar.sun.ac.za Gonzales, G.F. (1993). "Hyperviscosity and Hypofunction of the Seminal Vesicles." Syst Biol of Reprod 30(1): 63-8. Gopalkrishnan, K., V. Padwal, et al. (2000). "Does seminal fluid viscosity influence sperm chromatin integrity?" Arch Androl 45(2): 99-103. Günalp, S., C. Onculoglu, et al. (2001). "A study of semen parameters with emphasis on sperm morphology in a fertile population: an attempt to develop clinical thresholds." Hum Reprod 16(1): 110-4. Hafez, E. S. E., Ed. (1977). Techniques of Human Andrology. Human Reproductive Medicine. Amsterdam, North-Holland Publishing Company. Harraway, C., N. G. Berger, et al. (2000). "Semen pH in patients with normal versus abnormal sperm characteristics." Am J Obstet Gynecol 182(5): 1045-7. Haugen, T.B. and T. Grotmol (1998). "pH of human semen." Int J Androl 21: 105-8. Heath, J. W. and B. Young (2000). Wheater's Functional Histology. London, Churchill Livingstone. Henkel, R., G. Maass, et al. (2003). "Urogenital inflammation: changes of leucocytes and ROS." Andrologia 35(5): 309-13. Henkel, R., G. Maass, et al. (2007). "Age-related changes in seminal polymorphonuclear elastase in men with asymptomatic inflammation of the genital tract." Asian J Androl 9(3): 299-304. Honda, G. D., L. Bernstein, et al. (1988). "Vasectomy, cigarette smoking, and age at first sexual intercourse as risk factors for prostate cancer in middle-aged men." Br J Cancer 57(3): 326-31. Hubner, H.M. and W. Krause. (1985). "Investigation of Flow Behaviour (Viscosity) from Human Seminal Fluid with a Rotational Viscometer." Andrologia 17(6): 592-7. Huret, J. L. (1986). "Nuclear chromatin decondensation of human sperm: a review." Arch Androl 16(2): 97-109. Jennet, S. (1989). Human Physiology. London, Churchill Livingston. Jochum, M., W. Pabst, et al. (1986). "Granulocyte elastase as a sensitive diagnostic parameter of silent male genital tract inflammation." Andrologia 18(4): 413-9. 84 Stellenbosch University http://scholar.sun.ac.za Johanisson, E., A. Campana, et al. (2000). "Evaluation of 'round cells' in semen analysis: a comparative study." Hum Reprod Update 6(4): 404-12. Kaleli, S., F. Ocer, et al. (2000). "Does leukocytospermia associate with poor semen parameters and sperm functions in male infertility? The role of different seminal leukocyte concentrations." Eur J Obstet Gynecol Reprod Biol 89(2): 185-91. Keck, C., C. Gerber-Schafer, et al. (1998). "Seminal tract infections: impact on male fertility and treatment options." Hum Reprod Update 4(6): 891-903. Kiessling, A.A., N. Lamparelli, et al. (1995). "Semen leukocytes: friends or foes?" Fertil Steril 64(1): 196-8. Knobil, E. and J. D. Neill (2006). Knobil and Neill's Physiology of Reproduction. London, Elsevier. Kokab, A., M. M. Akhondi, et al. (2009). "Raised Inflammatory Markers in Semen from Men with Asymptomatic Chlamydial Infection." J Androl 31(2): 114-20. Krieger, J. N., R. E. Berger, et al. (1996). "Seminal fluid findings in men with nonbacterial prostatitis and prostatodynia." J Androl 17(3): 310-8. Lackner, J., G. Schatzl, et al. (2006a). "Value of counting white blood cells (WBC) in semen samples to predict the presence of bacteria." Eur Urol 49(1): 148-52; discussion 152-3. Lackner, J. E., R.D. Herwig, et al. (2006b). "Correlation of leukocytospermia with clinical infection and the positive effect of anti-inflammatory treatment on semen quality." Fertil Steril 86(3): 601-5. Lackner, J. E., A. Agarwal, et al. (2010). "The association between leukocytes and sperm quality is concentration dependent." Reprod Biol Endocrinol 8: 12. Lalani, E.N., M. E. Laniado, et al. (1997). "Molecular and cellular biology of prostate cancer." Cancer and Metastasis Reviews 16: 29-66. Leib, Z., B. Bartoov, et al. (1994). "Reduced semen quality caused by chronic abacterial prostatitis: an enigma or reality?" Fertil Steril 61(6): 1109-16. Lewis, S. E. (2007). "Is sperm evaluation useful in predicting human fertility?" Reproduction 134(1): 31-40. 85 Stellenbosch University http://scholar.sun.ac.za Lin, M.C., T.C. Tsai, et al. (1992). "Measurement of viscosity of human semen with a rotational viscometer." J Formos Med Assoc 91(4): 419-23. Lu, J. C., F. Chen, et al. (2007). "Standardization and quality control for determination of fructose in seminal plasma." J Androl 28(2): 207-13. Ludwig, M., A. Vidal, et al. (1998). Chronic pelvic pain syndrome (CPPS): impact of inflammation on fertility parameters with special focus on computer assisted motility analysis." Int J Androl 1: 23-48. Ludwig, M., A. Vidal, et al. (2003). "Chronic prostatitis/chronic pelvic pain syndrome: seminal markers of inflammation." World J Urol 21: 82-85. Macomber, D. and M.D. Sanders (1929). "The spermatozoa count: its value in the diagnosis, prognosis and concentration in fertile and infertile men." New Eng J Med 200: 3. Maegawa, M., M. Kamada, et al. (2002). "A repertoire of cytokines in human seminal plasma." J Reprod Immunol 54(1-2): 33-42. Maietta, G., J. R. Fiore, et al. (1997). "Leukocyte identification and analysis in human semen." Arch Androl 38(2): 99-105. Marconi, M., A. Pilatz, et al. (2009). "Impact of infection on the secretory capacity of the male accessory glands." Int Braz J. Urol 35(3): 299-309. Mendeluk, G., F. L. Gonzalez, et al. (2000). "Factors involved in the biochemical etiology of human seminal plasma hyperviscosity." J Androl 21(2): 262-67. Menkveld, R. (2004). "Leukocytospermia." International Congress Series (Advances in Fertility and Reproductive Medicine. Proceedings of the 18th World Congress on Fertility and Sterility) 1266: 218-44. Menkveld, R., F.S.H. Stander, et al. (1990). "The evaluation of morphological characteristics of human spermatozoa according to stricter criteria." Hum Reprod 5(5): 586-92. Menkveld, R., Kruger T. F (1996) Human Spermatozoa in Assisted Reproduction. Parthenon Carnforth. Menkveld, R. and T. F. Kruger (1998). "Sperm morphology and male urogenital infections." Andrologia 30 Suppl 1: 49-53. 86 Stellenbosch University http://scholar.sun.ac.za Micic, S., M. Macura, et al. (1989). "Elastase as an indicator of silent genital tract infection in infertile men." Int J Androl 12(6): 423-29. Mikhailichenko, V. V. and A. S. Esipov (2005). "Peculiarities of semen coagulation and liquefaction in males from infertile couples." Fertil Steril 84(1): 256-9. Moretti, E., I. Cosci, et al. (2009). "Semen characteristics and inflammatory mediators in infertile men with different clinical diagnoses." Int J Androl 32(6): 637-46. Mortimer, D (1994). Practical laboratory andrology, Oxford University Press, New York. Moriyama, A., K. Shimoya, et al. (1998). "Secretory leukocyte protease inhibitor (SLP) concentrations in seminal plasma: SLPI restores sperm motility reduced by elastase." Mol Hum Reprod 4(10): 946-50. Moulik, S., K. Gopalkrishnan, et al. (1989). "Presence of sperm antibodies and association with viscosity of semen." Hum Reprod 4(3): 290-1. Munuce, M.J., C. Bregni, et al. (1999). "Semen culture, leukocytospermia, and the presence of sperm antibodies in seminal hyperviscosity." Arch Androl 42(1): 21-8. Nieschlag, E., and H. M. Behre. (2000). Andrology: Male Reproductive Health and Dysfunction. Berlin, Springer-Verlag. Oehninger, S. (2000). "Clinical and laboratory management of male infertility: an opinion on its current status." J Androl 21(6): 814-21. Omu, A. E., F. Al-Qattan, et al. (1999). "Seminal immune response in infertile men with leukocytospermia: effect on antioxidant activity." Eur J Obstet Gynecol Reprod Biol 86(2): 195-202. Owen D.H. and D.F. Katz. (2005). "A review of the physical and chemical properties of human semen and the formulation of a semen simulant." J Androl 26:459-69. Pasqualotto, F. F., R. K. Sharma, et al. (2000). "Seminal oxidative stress in patients with chronic prostatitis." Urology 55(6): 881-5. Pasqualotto, F. F., B. P. Sobreiro, et al. (2006). "High percentage of abnormal semen parameters in a prevasectomy population." Fertil Steril 85(4): 954-60. Pienta, K. J. and P. S. Esper (1993). "Risk factors for prostate cancer." Ann Intern Med 118(10): 793-803. 87 Stellenbosch University http://scholar.sun.ac.za Politch, J. A., L. Tucker, et al. (2007). "Concentrations and significance of cytokines and other immunologic factors in semen of healthy fertile men." Hum Reprod 22(11): 2928-35. Reinhardt, A., G. Haidl, et al. (1997). "Granulocyte elastase indicates silent male genital tract inflammation and appropriate anti-inflammatory treatment." Andrologia 29(4): 187-92. Ricci, G., G. Presani, et al. (2000). "Leukocyte detection in human semen using flow cytometry." Hum Reprod 15(6): 1329-37. Rijnders, S., J. G. Bolscher, et al. (2007). "Filling time of a lamellar capillary-filling semen analysis chamber is a rapid, precise, and accurate method to assess viscosity of seminal plasma." J Androl 28(4): 461-5. Robbins, S. L. and V. Kumar (1987). Basic Pathology. Philadelphia, W.B. Saunders Company. Rui, H., Y. Thomassen, et al. (1986). "Accessory sex gland function in normal young (20-25 years) and middle-aged (50-55 years) men." J Androl 7(2): 93-9. Saalu, L. C. (2010). "The incriminating role of reactive oxygen species in idiopathic male infertility: an evidence based evaluation." Pak J Biol Sci 13(9): 413-22. Sanocka-Maciejewska, D., M. Ciupinska, et al. (2005). "Bacterial infection and semen quality." J Reprod Immunol 67(1-2): 51-6. Sanocka-Maciejewska, D., P. Jedrzejczak, et al. (2003). "Male genital tract inflammation: The role of selected interleukins in regulation of pro-oxidant and antioxidant enzymatic substances in seminal plasma." J Androl 24(3): 448-55. Sharma, R. K., A. E. Pasqualotto, et al. (2001). "Relationship between seminal white blood cell counts and oxidative stress in men treated at an infertility clinic." J Androl 22(4): 575-83. Shekarriz, M., R. K. Sharma, et al. (1995a). "Positive myeloperoxidase staining (Endtz test) as an indicator of excessive reactive oxygen species formation in semen." J Assist Reprod Genet 12(2): 70-4. Shekarriz, M., A. J. Thomas, Jr., et al. (1995b). "Incidence and level of seminal reactive oxygen species in normal men." Urology 45(1): 103-7. Sherwood, L. (2004). Human Physiology: from cells to systems. Belmont, Brooks/Cole. Siciliano, L., P. Tarantino, et al. (2001). "Impaired seminal antioxidant capacity in human semen with hyperviscosity or oligoasthenozoospermia." J Androl 22(5): 798-803. 88 Stellenbosch University http://scholar.sun.ac.za Simbini, T., E. Umapathy, et al. (1998). "Study on the origin of seminal leucocytes using split ejaculate technique and the effect of leucocytospermia on sperm characteristics." Urol Int 61(2): 95-100. Suominen, J. (2001). "Seminal fructose and glucose in asthenozoospermia." Int J Androl 24(5): 253-4. Tomlinson, M. J., C. L. Barratt, et al. (1993). "Prospective study of leukocytes and leukocyte subpopulations in semen suggests they are not a cause of male infertility." Fertil Steril 60(6): 1069-75. Tomlinson, M. J., A. White, et al. (1992). "The removal of morphologically abnormal sperm forms by phagocytes: a positive role for seminal leukocytes?" Hum Reprod 7(4): 517-22. Tjioe D.Y. and S. Oentoeng (1968). "The viscosity of human semen and the percentage of motile spermatozoa." Fertil Steril 19(4): 562-5. Trum, J. W., B. W. Mol, et al. (1998). "Value of detecting leukocytospermia in the diagnosis of genital tract infection in subfertile men." Fertil Steril 70(2): 315-9. Van der Ven, H. H., R. S. Jeyendran, et al. (1987). "Leucospermia and the fertilizing capacity of spermatozoa." Eur J Obstet Gynecol Reprod Biol 24(1): 49-52. Vicari, E. (1999). "Seminal leukocyte concentration and related specific reactive oxygen species production in patients with male accessory gland infections." Hum Reprod 14(8): 2025-30. Villegas, J., M. Schulz, et al. (2002). "Indirect immunofluorescence using monoclonal antibodies for the detection of leukocytospermia: comparison with peroxidase staining." Andrologia 34(2): 69-73. Wang, Y., C.L. Liang, et al. (2006). "Do Ureaplasma urealyticum infections in the genital tract affect semen quality?" Asian J Androl 8(5): 562-8. Weidner, W., W. Krause, et al. (1999). "Relevance of male accessory gland infection for subsequent fertility with special focus on prostatitis." Hum Reprod Update 5(5): 421-32. 89 Stellenbosch University http://scholar.sun.ac.za World Health Organization (1992). WHO laboratory manual for the examination of human semen and sperm-cervical mucus interaction. Cambridge, Press Cyndicate of the University of Cambridge. World Health Organization (1999). WHO laboratory manual for the examination of human semen and sperm-cervical mucus interaction. Cambridge. World Health Organization (2010). WHO laboratory manual for the examination and processing of human semen. Geneva, WHO Press, World Health Organization. Wilson, V. B. and R. G. Bunge (1975). "Infertility and semen non-liquefaction." J Urol 113(4): 509-10. Wilson, F. J., M. G. Kestenbaum, et al. (1997). Histology Image Review. Columbus, McGrawHill. Windt, M. L., P. M. De Beer, et al. (1994). "Sperm decondensation and semen parameters: utilization of a simple staining technique for the evaluation of human sperm decondensation." Andrologia 26(2): 67-72. Wolff, H. (1998). "Methods for the detection of male genital tract inflammation." Andrologia 30(1): 35-9. Wolff, H., G. Bezold, et al. (1991). "Impact of clinically silent inflammation on male genital tract organs as reflected by biochemical markers in semen." J Androl 12(5): 331-4. Wolff, H. and D. J. Anderson (1988). "Immunohistologic characterization and quantitation of leukocyte subpopulations in human semen." Fertil Steril 49(3): 497-504. Wolff, H., J. A. Politch, et al. (1990). "Leukocytospermia is associated with poor semen quality." Fertil Steril 53(3): 528-36. Wongkham, S., N. Tanphaichitr, et al. (1991). "The effect of polymorphonuclear leukocytes on human sperm." Sci Society of Thailand 17: 71-6. Yanushpolsky, E. H., J. A. Politch, et al. (1996). "Is leukocytospermia clinically relevant?" Fertil Steril 66(5): 822-5. Zopfgen, A., F. Priem, et al. (2000). "Relationship between semen quality and the seminal plasma components carnitine, alpha-glucosidase, fructose, citrate and granulocyte elastase in infertile men compared with a normal population." Hum Reprod 15(4): 840-5. 90 Stellenbosch University http://scholar.sun.ac.za Zorn, B., I. Virant-Klun, et al. (2000). "Semen granulocyte elastase: its relevance for the diagnosis and prognosis of silent genital tract inflammation." Hum Reprod 15: 19781984. Zorn, B., A. Sesek-Briski, et al. (2003). "Semen polymorphonuclear neutrophil leukocyte elastase as a diagnostic and prognostic marker of genital tract inflammation-a review." Clin Chem Lab Med 41(1): 2-12. 91 Stellenbosch University http://scholar.sun.ac.za APPENDICES APPENDIX 1: Pap stain (WHO, 1999) Subsequently immerse the slides in: Ethanol: 80%; 50% 30 seconds each Distilled water 30 seconds Harris‘s haematoxylin 4 minutes Distilled water 30 seconds Acidic ethanol 4-8 dips Running cold water tap 5 minutes Ethanol: 80%; 50% 30 seconds each Ethanol 95% At least 15 minutes G-6 Orange stain 1 minute Ethanol: 95%; 95%; 95% 30 seconds each EA-50 green stain 1 minute Ethanol: 95%; 95%; 30 seconds each Ethanol 100%; 100% 15 seconds each 92 Stellenbosch University http://scholar.sun.ac.za APPENDIX 2: FIGURES i-ix Volume (ml) 4 * 3 2 p<0.05 1 0 Positive Negative Figure i. Volume of the peroxidase positive (≥1 X 10⁶ WBC/ml) vs. negative groups (<1 X 10⁶ WBC/ml) (P<0.05) Filling time (seconds) 40 30 * p<0.0001 20 10 0 Positive Negative Figure ii. Viscosity (filling time) of the peroxidase positive (≥1 X 10⁶ WBC/ml) vs. negative groups (<1 X 10⁶ WBC/ml) (P<0.001) 93 Stellenbosch University http://scholar.sun.ac.za Viscosity (cP) 10 * 8 6 p<0.005 4 2 0 Positive Negative Figure iii. Viscosity (cP) of the peroxidase positive (≥1 X 10⁶ WBC/ml) vs. negative groups (<1 X 10⁶ WBC/ml) (*P<0.05) PMN Elastase (ng/ml) 600 400 * p<0.0001 200 0 Positive Negative Figure iv. PMN elastase concentrations of the peroxidase positive (≥1 X 10⁶ WBC/ml) vs. negative groups (<1 X 10⁶ WBC/ml) (*P<0.0001) 94 Fructose (mg/ejaculate) Stellenbosch University http://scholar.sun.ac.za 15 10 p=0.42 5 0 Positive Negative Figure v. Concentration of fructose per ejaculate of the peroxidase positive (≥1 X 10⁶ Citric Acid (mg/ejaculate) WBC/ml) vs. negative groups (<1 X 10⁶ WBC/ml) (P=0.42) 25 20 15 p=0.21 10 5 0 Positive Negative Figure vi. Concentration of citric acid per ejaculate of the peroxidase positive (≥1 X 10⁶ WBC/ml) vs. negative groups (<1 X 10⁶ WBC/ml) (P=0.21) 95 Stellenbosch University http://scholar.sun.ac.za Viscosity (seconds) 100 80 60 r=0.353; p<0.05 40 20 0 0 1 2 3 6 Leukocyte Count (>x10 WBC's/ml) Figure vii. Correlation analysis between peroxidase positive cells and viscosity (sec) Viscosity (cP) 25 20 15 r=0.323; p<0.05 10 5 0 0 1 2 3 Leukocyte Count (>x106 WBC's/ml) Figure viii. Correlation analysis between peroxidase positive cells and viscosity (cP) 96

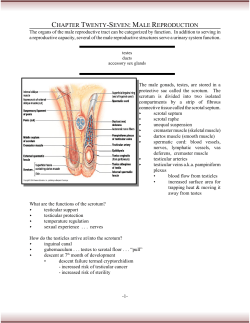


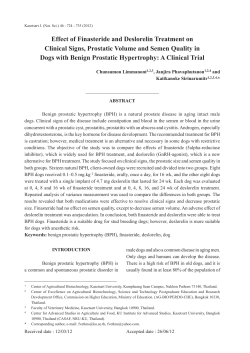


© Copyright 2026