
How How to to Put Put RTI to
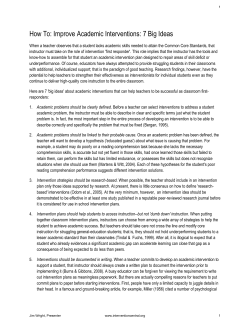
How to Put RTI to Work
in Your Math Classroom
K-8 Strategies for Screening, Intervention
and Progress Monitoring
Paul J. Riccomini, PhD
©2012 Recordings of this webinar may not be copied or used on
intranet or Internet without written permission by ERN Webinars
Today’s Topics
•
•
•
•
•
•
The 8 core principles of an effective RTI model in K8 math;
How to design an RTI framework that helps
students at all skill levels achieve more in math;
The most recent advances in universal screening,
progress monitoring and data-based management
systems;
Recommendations for effective instructional
practices for students who have disabilities or
struggle in math;
How to use explicit instruction to improve learning
outcomes Implementing interventions in both large
and small groups;
Best practices for collaboration between special ed
and regular teachers;
© Paul J. Riccomini 2012
Important and Useful Resources
•
•
•
National Mathematics Advisory Panel. (2008).
Foundation for Success: The Final Report of the National
Mathematics Advisory Panel, U.S. Department of
Education Washington DC. Available from
www.ed.gov/MathPanel
Gersten, R., Beckmann, S., Clarke, B., Foegen, A.,
Marsh, L., Star, J. R., & Witzel, B. (2009). Assisting
students struggling with mathematics: Response to
Intervention (RtI) for elementary and middle schools
(NCEE 2009-4060). Washington, DC: National Center for
Education Evaluation and Regional Assistance, Institute
of Education Sciences, U.S. Department of Education.
http://ies.ed.gov/ncee/wwc/publications/practiceguides/.
Gersten, R., Clarke, B. S., Jordan, N. C. (2007).
Screening for mathematics difficulties in K-3 students.
Portsmouth, NH: RMC Research Corporation, Center on
Instruction, www.centeroninstruction.org.
© Paul J. Riccomini 2012
Do We Have A Problem
Real World Math Performance
• 78% of adults cannot explain how to
compute interest paid on a loan
• 71% cannot calculate miles per
gallon
• 58% cannot calculate a 10% tip
• 27% of 8th graders could not
correctly shade 1/3 of a rectangle
• 45% could not solve a word problem
that required dividing fractions
Mathematics Advisory Panel Final Report, 2008
© Paul J. Riccomini 2012
Breakout Activity
If you were a struggling student in the school
where you currently teach explain:
a) How would the teachers know you are
struggling?
b) What kind of help would you receive for
mathematics?
c) Who would recommend the help?
d) Who would provide the help?
e) Where would you get the extra help?
f) What would that extra help look like?
g) For how long would you receive help?
h) How would the teachers know when you
do not need help or needed a different
kind of support?
i) Where would teachers learn about
evidenced-based practices to help you?
© Paul J. Riccomini 2012
Components of Effective
Mathematics Programs
Mathematics
Curriculum &
Interventions
Assessment &
Data-Based
Decisions
100% Math
Proficiency
Teacher Content
& Instructional
Knowledge
© Paul J. Riccomini 2012
Response to Intervention is…
the practice of providing high-quality
instruction/intervention matched to
student needs
and
using learning rate over time
and level of performance
to
inform educational decisions
Source: NASDSE. Response to Intervention: policy
considerations and implementation
© Paul J. Riccomini 2012
Response to Intervention in Context
Academic Systems Behavioral Systems
Tier 3
Intensive, Individual Interventions
Individual Students
Assessment-based
High Intensity
Of longer duration
1-5%
5-10%
1-5%
5-10%
Tier 3
Intensive, Individual Interventions
Individual Students
Assessment-based
Intense, durable procedures
Tier 2
Targeted Group Interventions
Some students (at-risk)
High efficiency
Rapid response
Tier 2
Targeted Group Interventions
Some students (at-risk)
High efficiency
Rapid response
80-90%
80-90%
Tier 1:
Universal Interventions
All students
Preventive, proactive
Tier 1:
Universal Interventions
All settings, all students
Preventive, proactive
© Paul J. Riccomini 2012
Guidelines for RTI implementation
• General education drives Tier 1 instruction,
thus general education must use researchvalidated instructional practices and
curriculum
– NMAP 2008 Recommendations
• Tier 2 & 3 instructional supports is more
focused and intensive
• Progress monitoring is used to monitor the
academic performance of everyone in
school
• Require collaboration and consultation
between stakeholders and services
• Student performance reports must be made
for each student who progresses through
tiers
© Paul J. Riccomini 2012
Jenna’s Math Performance in our current
LD identification system
Regular Education
Special Education
140
# CORRECT DIGITS
120
Core Math
Instruction
100
Motivational Small Group Strategy
Contract
& Explicit
Instruction
Instruction
Extra Fact
Practice
80
G
60
40
20
0
Sep
Oct
Nov
Dec
Jan
© Paul J. Riccomini 2012
Feb
Mar
Apr
May
The Non-Responder’s Mathematics
Performance Scenario in RtI System
Intervention
Education
General Education
70
# ITEMS CORRECT
60
Core Math
Program
50
Small Group PALS
PALS--Math
15 minutes
3x/week
CRA with
fractions
and facts
40
30
G
20
10
0
Oct
Nov
Dec
Jan
Feb
Mar
Apr
© Paul J. Riccomini 2012
The Responder’s Mathematics
Performance in an RtI System
Intervention
Education
General Education
70
# ITEMS CORRECT
60
Core Math
Program
50
Small Group PALS
PALS--Math
15 minutes
3x/week
40
G
30
G
20
10
0
Oct
Nov
Dec
Jan
Feb
© Paul J. Riccomini 2012
Mar
Apr
RTI Steps (NASDSE 2006)
Step I:
Universal Supports for all students
Step II: Data review by Problem Solving Team
Step III: Targeted interventions and progress
monitoring for struggling learners
Step IV: Intense interventions and progress
monitoring for struggling learners
Step V: Referral to special education when student
demonstrates little or no response to both
targeted and intense interventions
Step VI: General education and special education
personnel collaboratively teach and monitor
student progress; adjust IEP and services
as needed for eligible students
© Paul J. Riccomini 2012
RTI Steps (NASDSE)
Step I:
Universal Supports for all students
Step II: Data review by Problem Solving Team
Step III: Targeted interventions and progress
monitoring for struggling learners
Step IV: Intense interventions and progress
monitoring for struggling learners
Step V: Referral to special education when student
demonstrates little or no response to both
targeted and intense interventions
Step VI: General education and special education
personnel collaboratively teach and monitor
student progress; adjust IEP and services
as needed for eligible students
© Paul J. Riccomini 2012
8 Guiding Principles (
Riccomini & Witzel, 2010)
1.
2.
3.
4.
5.
6.
7.
8.
Belief System
Universal Screening
Progress Monitoring
Instructional Tiers
Research-Based Interventions
Data Based Decisions
Refinement Procedures
Ongoing High Quality
Mathematics Focused PD
© Paul J. Riccomini 2012
#1 Belief System
• Four Core Beliefs
1. All Students can be
Mathematically Proficient
2. All Students need a HighQuality Mathematics
Program
© Paul J. Riccomini 2012
#1 Belief System
• Four Core Beliefs
3. Effective Mathematics Programs
must teach conceptual
understanding, computational
fluency, factual knowledge, and
problem solving skills
4. Effective Instruction Matters and
Significantly Impacts Student
learning
© Paul J. Riccomini 2012
#2 Universal Screening
• Assessment used to measure all
students’ progress at least 3 to 4
times a year
• Used to identify those students in
need of more intensive instruction
• The screening measures are
relatively short and simple to
administer and score (10 minutes)
• Both general and special
education teachers are vested in
the use of assessment data for
instructional decisions.
© Paul J. Riccomini 2012
#3 Progress Monitoring
• Assessment similar (or the same) as
universal screening measures
• More frequent progress monitoring
of those students in need of more
intervention (weekly to bi-weekly)
• Student data is used to determine
effectiveness of instructional
programs and interventions
© Paul J. Riccomini 2012
Sample CBM
Math Quantity
Discrimination
Probe K-1st
www.studentprogress.org
© Paul J. Riccomini 2012
Name _______________________________
Date ________________________Test 4 Page 1
Applications 4
Column A
(1)
Column B
One page of a three-page
measure for mathematics
concepts and applications
(24 problems total)
(5)
Write a number in the blank.
Write the letter in each blank.
1 week = _____ days
•
(A) line segment
Z
•K
•M
L
•
(B) line
•N
(C) point
(6)
Vacation Plans for Summit
School Students
Summer
School
(D) ray
Camp
(2)
Look at this numbers.:
Travel
356.17
Stay home
Which number is in the hundredths place?
0 10 20 30 40 50 60 70 80 90 100
(3)
Number of Students
Solve the problem by estimating the sum or Use the bar graph to answer the questions.
difference to the nearest ten.
The P.T.A. will buy a Summit School
T-Shirt for each student who goes
Jeff wheels his wheelchair for 33 hours
to summer school. Each shirt costs
a week at school and for 28 hours a week $4.00. How much money will the
$
.00
in his neighborhood. About how many
P.T.A. spend on these T shirts?
hours does Jeff spend each week wheeling
How many students are planning to
his wheelchair?
travel during the summer?
Measure taken from Monitoring
Basic Skills Progress: Basic
Math Concepts and
Applications (1999)
How many fewer students are planning
to go to summer school than planning
to stay home?
(4)
Write the number in each blank.
(7)
3 ten thousands, 6 hundreds, 8 ones
2 thousands, 8 hundreds, 4 tens, 6 ones
To measure the distance of the bus
ride from school to your house you
would use
(A) meters
(B) centimeters
(C) kilometers
www.studentprogress.org
© Paul J. Riccomini 2012
Computation 4
Sheet #1
Sample CBM Math
Computation Probe
Password: ARM
Name:
Date
A
B
3
7
2
=
7
F
C
16 + 3 =
7
G
K
9
x0
L
2 )5 0
P
Random placement of
problem types on page
M
Q
95 22 5
+ 75 26 8
U
© Paul J. Riccomini 2012
O
6
x0
S
11 56
28 24
83
+
W
98 2
97
5 )2 0
N
R
V
3 + 1
5
5 =
J
6 )4 8
33
x 10
8 )32
87 5
x 7
I
24 4
x 7
61 44
44 20
E
6 )7 8
H
6
x7
Random numerals
within problems
(considering
specifications of
problem types)
D
4) 6
T
74 - 2=
7
X
9
x5
7 )3 0
38
x 33
Y
4
x1
7 )5 6
22
Assessment Resources
1. National Center on Response to Intervention
– Funded by the U.S. Department of
Education's Office of Special Education
Programs (OSEP). The Center’s mission is
to provide technical assistance to states
and districts and building the capacity of
states to assist districts in implementing
proven models for RTI/EIS.
http://www.rti4success.org/progressMonitoringTools
2. National Center on Progress Monitoring:
http://www.studentprogress.org/
© Paul J. Riccomini 2012
#4 Three Instructional Tiers
• Tier 3 – additional instruction should be given
to students who do not benefit from tier 2.
Interventions should be delivered 1:1 or in
small groups and should include specialized
personnel.
• Tier 2 – additional instruction should be given
to students who demonstrate weak progress.
Interventions typically take 20-40 minutes per
day, 4-5 times per week.
• Tier 1 – high quality instruction and universal
screening. High quality has a broad meaning.
However, it means that at least 80% of your
students are achieving on grade level.
© Paul J. Riccomini 2012
#4 Three Instructional Tiers
• Helping Struggling Students learn
more efficiently:
– Is a dosage Issue!
• Increase Amount
– 5mg to 10 mg
– 10 minutes to 20 minutes
• Increase Duration
– 2 weeks to 4 weeks
– 3 days a week to 5 days a week
• Specificity Issues
– Focus efforts to specific needs
– The Bad back example
© Paul J. Riccomini 2012
Breakout Activity
In your current school, which of the
following components are in place:
1. Belief System
2. Universal Screening
3. Progress Monitoring
4. Instructional Tiers
Strengths and/or weaknesses
with these components?
© Paul J. Riccomini 2012
#5 Research Based Instruction
and Intervention
• Research based instruction and
interventions become the
foundation of the core
mathematics program
• Selection of curricular materials
and interventions is guided by
high quality research evidence
and “philosophy”
• Decisions based on student
instructional needs, learning
characteristics, and content
© Paul J. Riccomini 2012
Foundations for Success
National Mathematics Advisory Panel
Final Report, March 2008
Select Slides taken from the NMAP-Final Report Presentation
available at: http://www.ed.gov/MathPanel
© Paul J. Riccomini 2012
Curricular Content
Streamline the Mathematics Curriculum in Grades PreK-8:
• Follow a Coherent Progression, with
Emphasis on Mastery of Key Topics
• Focus on the Critical Foundations for
Algebra
- Proficiency with Whole Numbers
- Proficiency with Fractions
- Particular Aspects of Geometry and
Measurement
• Avoid Any Approach that Continually
Revisits Topics without Closure (pg 22)
30
© Paul J. Riccomini 2012
Benchmarks for the Critical Foundations
In
conjunction
with state
standards,
not at the
expense of
either.
Mathematics Advisory Panel Final Report, pg 20
© Paul J. Riccomini 2012
Learning Processes
• To prepare students for Algebra, the curriculum must
simultaneously develop conceptual understanding,
computational fluency, factual knowledge and problem
solving skills.
• Limitations in the ability to keep many things in
mind (working-memory) can hinder mathematics
performance.
- Practice can offset this through automatic recall,
which results in less information to keep in mind
and frees attention for new aspects of material at
hand.
- Learning is most effective when practice is
combined with instruction on related concepts.
- Conceptual understanding promotes transfer of
learning to new problems and better long-term
retention.
32
© Paul J. Riccomini 2012
Breakout Activity
Working Memory Activity
•
•
•
Pencils Down
Write down the numbers in the order
that I said them.
How many did you remember?
•
Attempt #1
•
Attempt #2
•
Attempt #3
What did you learn?
33
© Paul J. Riccomini 2012
Instructional Practices
Instructional practice should be informed by
high quality research, when available, and by
the best professional judgment and experience
of accomplished classroom teachers.
• All-encompassing
recommendations that instruction
should be student-centered or
teacher-directed are not
supported by research.
34
© Paul J. Riccomini 2012
Instructional Practices
Research on students who are low achievers, have
difficulties in mathematics, or have learning disabilities
related to mathematics tells us that the effective
practice includes:
• Explicit methods of instruction available on a
regular basis
• Clear problem solving models
• Carefully orchestrated examples/ sequences of
examples.
• Concrete objects to understand abstract
representations and notation.
• Participatory thinking aloud by students and
teachers.
35
© Paul J. Riccomini 2012
Systematic and Explicit Instruction
• Clear modeling with many
examples
• Teacher think alouds with high
amounts of student interaction
• Extensive practice of newly
learned skills
• Feedback about their
performance
• Incorporate cumulative review
© Paul J. Riccomini 2012
3 Tier RtI Model
Riccomini & Witzel, 2010)
© Paul J. Riccomini 2012
For More Information
Please visit us online at:
http://www.ed.gov/MathPanel
• Read it! The report and
Factsheet should be on the
desk of every teacher
responsible for teaching and
planning math.
38
© Paul J. Riccomini 2012
Explicit Instructional Progression
Instructional scaffolding is a
process in which a
teacher adds supports for
students to enhance
learning and aid in the
mastery of tasks.
© Paul J. Riccomini 2012
Content Scaffolding
• Content Scaffolding
– the teacher selects content that is not
distracting (i.e., too difficult or
unfamiliar) for students when learning a
new skill.
– allows students to focus on the skill
being taught, without getting stuck or
bogged down in the content
• 3 Techniques for Content
Scaffolding
– Use Familiar or Highly Interesting
Content
– Use Easy Content
– Start With the Easy Steps
© Paul J. Riccomini 2012
Example of Content Scaffolding
• Math Word Problems Strategy
Instruction
– Remove irrelevant information
– Include answer in the problem (i.e., no
question)
– Allows students to focus in process of
strategy
• For example:
– Robert planted an oak seedling. It grew
10 inches the first year. Every year after it
grew 1 ¼ inches. How tall was the oak
tree after 9 years?
– An oak seedling grew 10 inches in the
first year. Every year after it grew 1 inch.
After 9 years the oak tree was 18 inches
tall.
© Paul J. Riccomini 2012
Explicit Instructional Progression
• Write a number sentence
for the word problem:
– An oak seedling grew 10
inches in the first year. Every
year after it grew 1 inch.
After 9 years the oak tree
was 18 inches tall.
© Paul J. Riccomini 2012
Explicit Instructional Progression
• Write a number sentence for
the word problem:
– An oak seedling grew 10 inches in
the first year. Every year after it
grew 1 inch. After 9 years the oak
tree was 18 inches tall.
10 + 1+1+1+1+1+1+1+1=18
OR
10 + (1)(8) = 18
OR
10 + (1)(9-1) = 18
© Paul J. Riccomini 2012
Explicit Instructional Progression
• Write a number sentence for
the word problem
– An oak seedling grew 25 feet in
the first year. Every year after it
grew 5 feet. After 4 years the oak
tree was 40 feet tall.
© Paul J. Riccomini 2012
Explicit Instructional Progression
• Write a number sentence for the
word problem
– An oak seedling grew 25 feet in the
first year. Every year after it grew 5
feet. After 4 years the oak tree was
40 feet tall.
25 + 5 + 5 + 5 = 40 feet tall
OR
25 + 5(3) = 40 feet tall
OR
25 + (5)(4-1) = 40
© Paul J. Riccomini 2012
Explicit Instructional Progression
• Write a number sentence for
the word problem
• Explicit Instruction and Guided
Think Aloud
• Now solve this problem
– An oak seedling grew 4 meters in
the first year. Every year after it
grew 2 meters. After 7 years, how
tall was the oak tree?
© Paul J. Riccomini 2012
Explicit Instructional Progression
• Solve the more complex problem
– Robert planted an oak seedling. It
grew 10 inches the first year. Every
year after it grew 1 ¼ inches. How
tall was the oak tree after 9 years?
• Scaffolded Instructional Progression
– This is how teachers can help
students progress from simple tasks
to more complex problem solving
tasks.
© Paul J. Riccomini 2012
Summary of Explicit Instruction
(The National Mathematics Advisory Panel)
Explicit systematic instruction
typically entails teachers
explaining and demonstrating
specific strategies and
allowing students many
opportunities to ask and
answer questions and to think
about the decisions they
make while solving problems
(p.48).
© Paul J. Riccomini 2012
#6 Data Based Decisions
• Student performance is reviewed
and appropriate decisions are
made
1. Adequate progress and returns
to core math instruction
2. Slow but adequate progress,
but still requires Tier 2 Instruction
in addition to core instruction
3. No progress (did not respond to
supplemental instruction and
requires additional Tiers and or
referral to special education
© Paul J. Riccomini 2012
#7 Refinement of RtI Process
• Ongoing evaluation and
refinement procedures are
essential to the continued
improvement of the RtI process
• Considerations
– Fidelity of implementation for
assessments, instructional programs,
and interventions
• Refined (tweaked) from
year to year for continuous
improvements
© Paul J. Riccomini 2012
IES RtI Math Recommendations
1. Screen all students to identify those
at risk for potential mathematics
difficulties and provide interventions
to students identified as at risk.
2. Instructional materials for students
receiving interventions should focus
intensely on in-depth treatment of
whole numbers in kindergarten
through grade 5 and on rational
numbers in grades 4 through 8.
© Paul J. Riccomini 2012
IES RtI Math Recommendations
3. Instruction during the intervention
should be explicit and systematic.
This includes providing models of
proficient problem solving,
verbalization of thought processes,
guided practice, corrective
feedback, and frequent cumulative
review.
4. Interventions should include
instruction on solving word problems
that is based on common
underlying structures.
© Paul J. Riccomini 2012
IES RtI Math Recommendations
5. Intervention materials should
include opportunities for students to
work with visual representations of
mathematical ideas and
interventionists should be proficient
in the use of visual representations
of mathematical ideas.
6. Interventions at all grade levels
should devote about 10 minutes in
each session to building fluent
retrieval of basic arithmetic facts.
© Paul J. Riccomini 2012
IES RtI Math Recommendations
7. Monitor the progress of students
receiving supplemental instruction
and other students who are at risk.
8) Include motivational strategies in
tier 2 and tier 3 interventions.
© Paul J. Riccomini 2012
Breakout Activity
• Think about (or discuss) the 8
RTI Math Recommendations
from the IES Practice guides
and identify the areas of
strengths and weaknesses
with your current RtI model or
supports for struggling
students
© Paul J. Riccomini 2012
#8 Ongoing and High Quality
Professional Development
Systematic Professional Development Plan:
1. Targets essential components of effective
mathematics instruction for struggling
students;
2. Provides specific information related to the
Common Core State Standards for Math
3. Provides information on instructional materials,
programs, and strategies that are based
NMAP, IES, CCSS, & NCTM recommendations
4. Enhances teachers’ ability to implement early
intervention and remediation programs
5. Facilitates the use of assessment data to
inform instruction and meet the needs of all
students
© Paul J. Riccomini 2012
PD Resources
• Tips for Designing a High Quality
Professional Development Program
from the National Center for
Reading First: Technical Assistance:
http://www2.ed.gov/programs/readi
ngfirst/support/tips.pdf
• Identify Professional Development
Needs in Math: A Planning Tool for
Grades 3-7 from
http://www.centeroninstruction.org/f
iles/CBI%20Identifying%20PD%20Nee
ds%20in%20Math.pdf
© Paul J. Riccomini 2012
Components of Effective
Mathematics Programs
Mathematics
Curriculum &
Interventions
Assessment &
Data-Based
Decisions
100% Math
Proficiency
Teacher Content
& Instructional
Knowledge
© Paul J. Riccomini 2012
Remember…..
Instruction
Matters!
© Paul J. Riccomini 2012
Questions?


© Copyright 2026