
How to Feed tHe world’s GrowinG Billions 2011
STUDY
COMMISSIONED
BY THE:
STUDY
2011
World population
Agriculture
Consumption
How to Feed The World’s
Growing Billions
Understanding FAO World Food Projections and their Implications
About this study
Publisher Heinrich Böll Stiftung (Heinrich Böll Foundation) and WWF Deutschland
Publication date April 2011
Acknowledgements The authors are highly appreciative for the helpful comments on a draft version of this study
provided by Franz Heidhues, Thordis Moeller, Stefan Tangermann, Detlef Virchow, Michael Hesse and Oliver Hensel.
Of course, all mistakes and deficiencies in the study remain the full responsibility of the authors
Project coordination Christine Chemnitz (Heinrich Böll Stiftung), E-mail: [email protected]
Matthias Meißner (WWF Deutschland), E-mail: [email protected]
Editor Thomas Köberich, WWF Germany; Lucais Sewell, Genial Translations
Layout Thomas Schlembach, WWF Germany
Production Rainer Litty, Panda Fördergesellschaft
Picture credits © Fotosearch, Michel Gunther/WWF-Canon, Brent Stirton/
Getty Images, iStock, Sarah C./pixelio, iStock (3x), Rob Webster/WWF
2 | How to feed the world’s growing billions
Authors
Harald Grethe, Assa Dembélé, Nuray Duman
Institute of Agricultural Policy and Markets
Food Security Center
Universität Hohenheim
Current postharvest loss levels are estimated at 20–50 %, with supply chain losses representing
the dominant form of loss in developing countries and food waste at the retail and household
levels dominating in industrialized countries. Inadequate infrastructure, such as of roads,
transportation and storage facilities, is one important factor for postharvest losses in developing
countries.
4 | How to feed the world’s growing billions
Preface
On 23 September 2009 the FAO released
the results of its food balance projections
until 2050. The main message of the FAO
press release was that agricultural production has to increase by
70 % to feed the world in 2050.
The impact of this message on the political and public debate about hunger and
malnutrition was and remains impressive. Without further background information,
this 70 % figure provides an excellent argument to all those who would seek to focus
the hunger issue on the need to intensify agricultural production. Briefly scanning
the debate, one finds the 70 % production increase as an argument against organic
agriculture, as an argument in favour of intense GMO use, and even as evidence to
justify the intensification of European agriculture within the debate on the Common
Agriculture Policy beyond 2013. In all cases the 70 % production increase figure cited
by the FAO is cited in an appeal to an underlying moral responsibility: the world
needs to be feed in 2050.
Thus, although the FAO may not have intended it, by publishing the results of their
food balance projections the FAO shifted the debate on hunger away from all aspects
of social justice and ecological sustainability. In the current debate, numerous salient
questions are now overlooked, including: Why are more than one billion people
hungry in a world which has for decades produced enough food to feed every person
on this planet? What are the main factors driving people into hunger and poverty?
How do consumer behaviour and agricultural policy in industrialized countries affect hunger and rural poverty worldwide? Who is going to manage the use of natural
resources in the future and what does a sustainable agriculture system look like in
times of decreasing fossil resources? All of these relevant questions, which are based
on considerations stemming from human rights, ecological sustainability and social
equity, have been absent from recent discussions.
WWF Germany and the Heinrich Böll Foundation hope to widen the debate with this
paper. Our goals are threefold: First, we aim to provide a better understanding of the
FAO world food balance projections by explaining the design of the FAO model as well
as by outlining which assumptions have been included in the projection and which
have not. As a consequence we hope to show how the projections have to be assessed
from a political point of view. Second, we want to outline how the weak link between
increasing world agricultural production and hunger. Third, we aim to discuss other
possibilities to ameliorate food challenges other than the intensification of agricultural production, and, in this way, provide arguments to all those who seek to discuss
the world food situation in a socially and ecologically sound way.
Matthias Meissner WWF Germany
Christine Chemnitz
Heinrich Böll Foundation
5
Preface
5
Abstract
7
Key Results
8
1Introduction
10
2
Understanding FAO World Food Projections
13
2.1
2.2
2.3
2.3.1
2.3.2
2.4
2.5
2.6
Introduction
Methodological Approach
Assumptions
Demand Factors
Supply Factors
Results of the FAO World Food Projections
Political Conclusions Drawn by FAO from the Results
Conclusions from the FAO World Food Projections
13
15
16
18
21
23
27
27
3 On the Interdependencies of Global Agricultural Production and Hunger
28
4Alternatives to Improving the World Food Balance
31
4.1
4.2
4.2.1
4.2.2
4.2.3
4.2.4
4.2.5
4.2.5.1
4.2.5.2
4.2.6
4.3
4.3.1
4.3.2
4.3.2.1
4.3.2.2
4.3.3
4.3.4
4.3.4.1
4.3.4.2
4.3.5
4.3.5.1 4.3.5.2 4.3.6 31
32
32
33
35
36
38
38
39
40
42
42
42
42
44
44
45
45
48
49
49
50
54
Introduction
Reduction of Postharvest Losses
Introduction
Causes of Postharvest Losses
Current Extent of Postharvest Losses
Postharvest Losses in the Course of Economic Development
Potential for Loss and Waste Reduction
In Developing Countries
In Developed Countries
Conclusion
Changes in Consumption Patterns
Introduction
Past and Future Livestock Sector Developments
Consumption Trends
Production Trends
Competition between Food and Feed
Reduction of Meat Consumption in Developed Countries
Benefits from Reduced Meat Demand in Developed Countries
Taxing Meat Consumption?
Quantifying Effects of Lower Meat Consumption in Developed Countries on global food balances
Literature Review
Quantitative Analysis
Conclusions
5Conclusion
56
6References
58
6 | How to feed the world’s growing billions
Abstract
This study aims to clarify the methods
used and the assumptions made in the
FAO world food projections, which forecast the need for a 70 % production increase between 2005/07
and 2050, as well as to discuss the implications of this figure.
We find that the FAO projections are based on solid analysis and
an enormous amount of expert knowledge and country specific
data, yet the assumptions and underlying methodology are poorly
documented.
Furthermore, the FAO’s strong focus on increasing production in contrast to other
options for improving the world food balance, especially in the communication of the
analysis to the public, is unbalanced. Alongside productivity increases, the reduction
of political support for biofuel production, the reduction of postharvest losses and a
less meat based diet in industrialized countries should be explored. Political support
for first generation biofuels should be ended. This option could be easily implemented
and would have direct and significant effects on the world food balance. A literature
review suggests that there is significant scope and need for reducing postharvest
losses in developing and developed countries. Current postharvest loss levels are
estimated at 20–50 %, with supply chain losses the dominant form of loss in developing countries and food waste at the retail and household levels dominating in industrialized countries. Lowering meat demand in industrialized countries would have
positive effects on human health and the environmental goods. Furthermore, it would
result in lower climate gas emissions and ease the introduction of higher animal
welfare standards. Finally, they would improve the world food balance and result in
substantially lower meat prices but only slightly reduced cereal prices. Last but not
least, it is important to note that the global availability of food is not the most relevant
limitation in the reduction of undernourishment, but rather it is the persistence of
poverty which causes undernourishment in a world which could feed 9 billion.
7
Key Results
Chapter 2: Understanding FAO World Food Projections
»» The increase in global agricultural production and demand by 70 % between
2005/07 and 2050 is not what the FAO considers as desirable, but it reflects the
increase in global demand which the FAO considers most likely to happen in the
future, and the required increase in production that the FAO considers necessary
and feasible to meet this demand. The projections are based on the assumption
that about 290 million would still be undernourished by 2050.
»» The FAO projections are based on solid analysis and a high amount of expert
knowledge and country specific data. Furthermore, they are roughly in line with
projections made by other institutions.
»» Due to intransparent presentation and insufficient documentation of assumptions
and methodology, it is almost impossible to reconstruct the results in light of the
assumptions made. In addition, as many of the assumptions are unknown to the
reader, it is impossible to evaluate their validity compared to any alternatives.
»» Climate change is not included in the projections and is likely to put further pressure on the world food balance by 2050.
»» On the other hand, GDP growth is assumed to run at 2.4 % annually for the
period between 2030 and 2050, which is about 0.2 percentage points higher than
observed between 2000 and 2010 and about 0.8 % higher than in the two decades
prior. A more conservative estimate of GDP growth would reduce the pressure on
the world food balance.
»» FAO projections of the need for a 70 % production increase do not justify the claim
that global agriculture in general should be intensified.
»» The strong focus on the relevance of global agricultural production for fighting malnutrition and hunger in the communication of the results is excessively
one-sided. Increasing global agricultural production is one option among others
to improve the world food balance. And it is poverty, not the global food balance,
which is the main cause of hunger.
Chapter 3: On the Interdependencies of Global Agricultural Production
and Hunger
»» Increasing the global availability of food, whether through higher production,
changes in consumption habits such as lower meat consumption, or lower postharvest losses, is a necessary but not a sufficient condition for decreasing hunger.
»» The most important factor for decreasing hunger is the reduction of poverty. The
effects of higher global food availability on the reduction of hunger are rather
indirect.
»» An increase in agricultural production is of importance mainly within the regions
subject to food insecurity. Here it can have a double effect, lowering prices and
increasing food availability for food purchasers while also generating additional
8 | How to feed the world’s growing billions
income for food producers. These regions should be the focus of investments in
rural infrastructure and agricultural research, and efforts to improve governance
systems and institutions which allow markets to work.
»» What is needed most to fight undernourishment is poverty reduction by providing the poor with better access to education, employment, land and other options
for income generation, as well as to public services such as social safety nets and
medical care.
Chapter 4: Alternatives to Improving the World Food Balance
»» Demand for biomass for energy production has a strong impact on the world food
balance.
»» Demand for first generation biofuels in the EU, US and various other countries
is driven by narrow political interests and contributes to high global prices for
agricultural products. This causes substantial indirect land use changes, as crop
land use intensifies and expands worldwide in response to the increasing demand
for biofuels.
Chapter 4.2 Reduction of Postharvest Losses
»» Current postharvest loss levels are estimated at 20–50%, with supply chain losses
dominating in developing countries and food waste at the retail and household
levels dominating in industrialized countries.
»» There is a significant need and considerable opportunities for reducing supply
chain losses and consumer food waste due to the sheer volume of such losses. In
contrast, there is only little evidence for the successful reduction of such losses
through policy measures.
»» Regarding the food security objective, the focus should be on reducing postharvest
losses in food insecure regions, which would increase food availability and generate income along the supply chain at the same time.
»» Without more systematic research on the extent of losses, measuring progress
against any global reduction target is impossible. Despite this lack of reliable data,
there are compelling arguments in favour of tackling postharvest losses.
Chapter 4.3 Changes in Consumption Patterns
Lowering meat demand in industrialized countries would improve the world food balance
and result in substantially lower meat prices and slightly reduced cereal prices.
»» The resulting effect of reduced meat consumption on food security, however, is
likely to be small. This is because lowering meat consumption in industrialized
countries leads to lower meat prices and causes more meat consumption elsewhere. The effect on basic staple food prices is therefore low.
»» However, lowering meat demand in industrialized countries would have positive
effects on human health and the environmental goods. Furthermore, it would
result in lower greenhouse gas emissions, a less unequal per capita use of global
resources, and ease the introduction of higher animal welfare standards.
9
1
Introduction
Despite the goal of
halving the number
of hungry by 2015
the prevalence of
hunger has increased
by 15 % since 1996
Globally, undernourishment is a disturbingly persistent
problem: Although a target was set at the 1996 World
Food Summit to reduce the number of undernourished
by 50 % by 2015, the prevalence of hunger has increased
by 15 % since that time and, after peaking at more than a billion in 2009, was at 925
million in 2010 (Figure 1.1).
1200
1000
800
600
Figure 1.1:
Number of Undernourished
1990–2010 (in millions)
Sources: FAO
(various issues).
Number of
undernourished
1996 World Food
Summit Reduction
target
Number of und
Reduction targe
400
200
0
In addition to the high prevalence of hunger that has persisted for decades, the world
experienced a situation of high peaks in agricultural world market prices in 2007 and
2008 and again in 2010 and 2011. These have translated into an increasing number
of undernourished, and many believe that they mark a change in the historical trend
of declining real agricultural prices, which has been in evidence since early industrialization. Reasons behind this trend change include increasingly scarce natural
resources such as land and water, strongly evolving non-food demand for biomass,
mainly for the production of bioenergy, a continued high population growth, a shift in
consumption patterns towards higher value foods and increasing energy prices.
Against this backdrop, projections regarding the world food balance are an important
input for the political discussion on fighting undernourishment.
10 | How to feed the world’s growing billions
In 2006, the FAO published its “FAO Interim Report” (FAO, 2006), an update of an
earlier report titled “World Agriculture: Towards 2015/2030 – An FAO Perspective”
(Bruinsma, 2003). This Interim Report and some minor updates (Bruinsma, 2009)
constitute the basis for the FAO estimate that global agricultural production must
increase by 70 % by 2050 to meet global demand, a finding which was circulated
at the World Food Summit in 2009: “In order to feed this larger, more urban and
richer population, food production (net of food used for biofuels) must increase by 70
percent” (FAO, 2009a: 2). This figure was widely cited by the international press. In
addition, several interest groups have used this figure with very different objectives,
often to suggest a close link between global production and hunger reduction:
»» In claims for more funds for development aid, e.g. by FAO (Financial Times, 2008).
»» In claims for an intensification of agricultural production (AtlasFram Group, 2010).
»» Use of GMOs (e.g. Brabeck-Letmathe, 2009; Bridges, 2008).
»» In claims for a more intensive agricultural production in the EU in order to address global food insecurity (EU COM 2010).
»» In criticism of organic agriculture (Syngenta, 2009).
But the isolated “70% production increase” figure (designated as “70 % PI” throughout this text) is not very meaningful without any accompanying information and
inadequate to support the above mentioned claims. In particular, this figure does not
justify the claim that global agriculture in general should be intensified. Furthermore,
the excessively strong focus on the relevance of global agricultural production for
fighting malnutrition and hunger is misleading.
Given this backdrop, this study has the following objectives:
»» To clarify the methods used and the assumptions made in projecting the 70 % PI
figure.
»» To discuss the implications of the 70 % PI, especially whether and to what extent
an increase of global agricultural production will contribute to reducing hunger.
»» To analyze the extent to which changes in other variables (composition of food
consumption, postharvest losses, use of biomass for energy production, etc.) –
variables which are also subject to the impact of potential policies – may
contribute to meeting the world wide increasing demand for food.
The study is organized as follows: Chapter 2 gives an overview of the background,
methods used and assumptions made as well as the core results of the FAO projections. Chapter 3 discusses the interdependencies between agricultural production and
undernourishment. Chapter 4 discusses and analyzes alternative options for improving the world food balance, in contrast to an isolated focus on increasing agricultural
production. Two factors are especially highlighted in Chapter 4: the potential to
decrease postharvest losses and the impact of lower meat consumption in developed
countries. Finally, Chapter 5 draws some conclusions.
11
Growth in agricultural production has often been coupled with the unsustainable exploitation
of natural resources. Agrochemicals, if not adequately used, have severe effects on natural
resources like biodiversity and water.
12 | How to feed the world’s growing billions
2 Understanding FAO World Food
Projections
2.1 Introduction
Several conditions are essential for understanding the 70 % PI and putting it into
perspective:
»» An understanding of the definition of the 70 % PI figure, including the units of
measurement (such as area, calories, cereal units, value).
»» An understanding of the assumptions made and methods used in the projections.
»» A comparison of the results to those from other studies.
»» An understanding of the political implications of the 70 % PI, especially with
respect to its relevance for fighting world hunger. (Under which conditions are
the 70 % PI valid? Why is the focus so much on 70 % PI instead of other options to
improve the world food balance?)
The projected 70 %
increase in
production would
imply an average
increase of per
capita calorie
consumption of 11 %
by 2050
Bruinsma (2009: 5) clearly defines what is meant by the 70 % PI: It is the increase in
the value of global agricultural production in constant base period prices (1989–91
average world market prices in US$, FAO, 2006). This implies that the projected
increase in global agricultural production has two components: (1) an increase in the
absolute quantities of individual product categories (such as cereals by 49 %, meat by
85 %), (2) a change in the composition of product categories from low priced products
(cereals, pulses, starchy tubers) to higher priced products (fruit and vegetables,
animal products) (Bruinsma, 2009: 5). These two effects together are projected to
lead to an increase in the value of global agricultural production by 70 %, equivalent
to a 22 % per capita increase, taking into account population growth of 40 %, resulting
in a world population slightly exceeding 9 billion by 2050. Expressed in calories the
projected production increase in value would imply an average increase in per capita
calorie consumption of 11 % by 2050 (ibid).
While 70 % appears on its face to be a clearly defined figure, it is difficult to know and
understand the assumptions and methods that lie behind it. This is due to several
problems:
The assumptions
underlying the
projected 70 %
production increase
are weakly
documented
»» The 70 % PI is based on several studies which are drawn together in a somewhat
intransparent manner.
»» The documentation of assumptions and methodological approach is spread over
various papers which date as far back as 1995. In addition, the assumptions and
methodologies are often drawn from papers which are not of direct relevance
for the projections.
» » A substantial portion of the assumptions are not or only in very general terms
documented.
13
It is therefore almost impossible to trace the results in light of the assumptions made
and as many of the assumptions are unknown it is impossible to evaluate their validity compared to any alternatives.
In order to ease the reader’s access to the original sources, Figure 2.1 displays a
timeline of relevant publications (lower part of the figure) and events (upper part of
the figure).
2001
UN Population
Prospects Assessment
(UN, 2001).
(9.3 billion in 2050)
2001
2002
2003
2003
UN Population
Prospects Assessment
(UN, 2003).
(downward revision;
8.9 billion in 2050)
2004
2003
FAO Report:
World Agriculture:
Towards 2015/30
(Bruinsma, 2003)
Figure 2.1:
Timeline of the Important
FAO Papers and Events
Source: Own composition.
2005
2008
2009
UN Population
Expert Meeting
Prospects Assessment (How to Feed the
(UN, 2008).
World in 2050),
(9.2 billion in 2050)
24–26 June
2006
2006
FAO Interim Report:
Revision of the key
Chapters 2 and 3
2007
2008
2010
High Level
Expert Forum,
12–13 October,
FAO, Rome
2009
2010
2011
2009
Various expert
papers, e. g.
Bruinsma (2009)
The FAO has been engaged in generating projections of the world food situation since
its foundation and has regularly published reports in this regard. The 70 % PI figure is
based on three studies which are outlined in some detail in the paragraphs below:
»» The FAO report “World Agriculture: Towards 2015/30”, published in 2003
(Bruinsma, 2003).
»» The FAO Interim Report “World Agriculture: Towards 2030/2050”, including
some updates and published in 2006 (FAO, 2006).
»» Further updates to the projections published by Bruinsma (2009).
In 2003, the report “World Agriculture: Towards 2015/30 an FAO Perspective”
(Bruinsma, 2003) was published. The report is a comprehensive study that documents
projections of global agricultural production and the world food situation until 2030 in
chapters 1–5. It also addresses several topics related loosely or not at all to the projections such as world forestry, globalization, agricultural trade liberalization, climate
change and others. The methodology of the projections is described only rudimentarily
in a short annex and reference is made to a publication by Alexandratos (1995), which
adds little to providing a comprehensive documentation of the methodology used.
The so-called Interim Report (FAO, 2006) updates the projections from Bruinsma
(2003) and extends the projection horizon to 2050. Reasons given for this update
include: (1) the corrections of the UN population projections from 9.3 billion (UN,
2001) in 2050 to 8.9 billion (UN, 2003), (2) significantly higher projections of global
crude oil prices and (3) insufficient progress with regard to the target of halving the
number of undernourished by 2015, as avowed at the World Food Summit in 1996. A
core finding of the Interim Report is a forecast that global agricultural production (in
terms of production value at constant prices) will increase by 87 % between the base
period (average of the years 1999–2001) and the year 2050 (own calculations based
on FAO, 2006: 33). This figure has been communicated by FAO (FAO, 2008) and cited
by the press frequently as the need for “doubling agricultural production by 2050”
(Financial Times, 2008).
14 | How to feed the world’s growing billions
In preparation of the World Food Summit in 2009, projections were updated again.
The most significant change was the consideration of new base data for agricultural
production (2005–2007 instead of 1999–2001) (Bruinsma, 2009: 4). Therefore,
the new projection period comprises 44 years (2005/07–2050) instead of 50 years
(1999/2001–2050). Taking into account this difference in projection horizon, the new
figures imply an almost identical annual increase in agricultural production as the
former ones (in total 70 % instead of 87 %, with the projection horizon shortened by 6
years).
In the remainder of this chapter, Sections 2.2 and 2.3 present the methodological
background of the most recent FAO projections underlying the 70 % PI and published
by Bruinsma (2009), and the assumptions made to the extent that they could be
extracted from the FAO sources. In order to ease the verification of FAO projections
and underlying assumptions, Section 2.4 summarizes some key results, discusses
the plausibility of their magnitude and compares them to those from other studies.
Section 2.5 discusses the conclusions FAO draws from the 70 % PI, which are interesting especially in light of the strong political instrumentalization of this number shown
above, and why the FAO puts such a strong weight on this figure in communicating
the results of Bruinsma (2009) to the public. Finally, Section 2.6 draws some summarizing conclusions from the analysis of the projections.
FAO world food
projections do not
reflect what the FAO
considers desirable
to happen, but most
likely to happen
2.2 Methodological Approach
FAO world food projections do not reflect what the FAO considers desirable to happen,
but they reflect the increase in global demand that the FAO considers most likely to
happen in the future, and the required increase in production that the FAO considers
necessary and feasible to meet this demand. These projections thus do not imply a
normative assessment of what should happen.
The projection of the world food balance is not based on the use of one quantitative
economic simulation model, but rather consists of three subsequent steps, using an
accounting framework and relying heavily on expert assessments. These steps are:
»» Demand projections.
»» Supply projections.
»» The reconciliation of demand and supply projections at the national and global
levels in order to achieve a balanced world food situation and plausible trade flows.
This process is not price driven: real prices are assumed to remain constant.
1) Demand projections are based on available information from various sources
such as other models, expert estimates and best guesses. Most important determinants
include population growth, income growth, changes in income distribution, and
autonomous trends in consumption patterns. As a result, the increase in effective
demand for food products between the base period and the year 2050 is estimated
based on calculations, and implies certain production increases. This increase in
effective demand is not what the FAO considers as desirable, but what the FAO
considers to be most likely to happen in the future based on currently available
information. Especially important in this context is that this increase does not
reflect the abolishment of hunger, but rather reflects the decline in hunger which
the FAO considers likely to happen (see below).
15
2) Supply projections take into account the available resource base in the individual countries (land reserves, water for irrigation), expectations on technical progress
(e.g. in yields per ha or feed use per unit of animal product output), and change in
management techniques such as changes in cropping intensity.
3) Reconciliation of supply and demand: Initially, the FAO projections of
demand and supply are generated independently, i.e. they do not necessarily balance
out. National increases in supply would not necessarily match national increases in
demand, and even if one allows for changes in the net trade balances for the individual countries, the aggregated increase in global supply would not necessarily match
the aggregated increase in global demand. Therefore, as a next step in the projection
process the global increase in supply is reconciled with the global increase in demand
in an accountancy framework. This process of reconciliation is a rather resource
intensive, technical and handmade procedure, involving per country modifications
of supply and trade which is often based on the judgement of country and market
experts. Important to mention is that this process does not involve the use of equilibrium models, which would allow for changes in relative prices in order to reconcile
supply and demand changes, but rather assumes constant prices.
The FAO produces
only one “baseline
projection”, but
not any additional
scenarios which
may result under
sets of different
assumptions
The approach chosen by FAO has the advantage of allowing the inclusion of an
enormous amount of country specific information on the natural resource base as well
as socioeconomic and cultural conditions. This means that the results are validated
against their physical feasibility and plausibility. A disadvantage, however, is that
this approach does not allow for the simulation of changes in relative prices and
the resulting feedback mechanisms. Furthermore, due to the missing market clearing price mechanism, the development of a scenario with supply and demand being
balanced is enormously time consuming. As a consequence, the FAO produces only
one “baseline projection” under a given set of assumptions and for a given projection horizon, but not any additional scenarios which may result under sets of different assumptions (Bruinsma, 2003: 381–382). Compared to projections based on a
quantitative equilibrium model which equates demand and supply using the price
mechanism, and typically finds changes in relative prices, the approach pursued by
FAO does not necessarily result in less valid results. Thus, while the inclusion of an
enormous amount of knowledge on biophysical restrictions and expert knowledge is
an asset, the inflexibility in running alternative scenarios with different assumptions
and sensitivity analyses represents a key weakness in the approach.
In the following section, we provide a description of the specific assumptions made
in the projections to the extent that it is possible to extract this information from the
respective publications.
16 | How to feed the world’s growing billions
2.3 Assumptions
A wide range of demand and supply factors are taken into account in the FAO projections and presented and discussed in detail in Sections 2.3.1 and 2.3.2. Table 2.1 gives
an overview of these factors.
Table 2.1:
Demand and Supply
Factors Considered in the
FAO Projections
Source: Own composition.
Demand Factors
Factors included in FAO projections
Factors not included in FAO projections
Population growth
Price changes
Income growth
Changes in food distribution (resulting from
changes in income distribution)
Socio-cultural factors
Postharvest losses
Improvement in feed conversion
Changes in seed use and in industrial use
Bioenergy demand
Demand for fishery products
Supply Factors
Factors included in FAO projections
Factors not included in FAO projections
Change in agricultural area
Climate change
Increase in irrigated area
Increase in cropping intensity
Crop yield growth
Production constraints resulting from
resource availability
Changes in animal numbers
Increase in animal productivity and intensification (feed conversion, off-take rates,
carcass weights, etc.)
Price changes and
climate change are
not included in the
projections
Price changes and climate change are not covered by the projections. Taking climate
change into account would put even more pressure on the world food balance. It
is very likely that climate change will negatively affect average global agricultural
production in the future, and will likely lead to lower land productivity in tropical and
subtropical climate zones and increased land productivity in temperate climate zones
(Parry et al., 2004; Nelson et al., 2009; Moeller and Grethe, 2010; Fischer, 2009).
17
2.3.1 Demand Factors
The main factors determining food demand growth are increases in population and
income as well as autonomous consumption trends:
»» Population growth is based on the UN Population Prospects (UN, 2003), which
predict world population to grow from 6.1 billion in the year 2000 to 8.9 billion by
2050, i.e. by 46 % (FAO, 2006: 16). As a result, population growth for the period
for the latest projections between 2005/07 and 2050 would amount to 37 %.
»» Average world per capita income growth for the period 2000–2030 is based on
World Bank (2006) and amounts to a 2.1 % annual growth rate, and the FAO assumes a 2.7 % annual growth rate for 2030–2050 (FAO, 2006: 17). This leads to an
income increase for the period of the latest projections between 2005/07 and 2050
of 180 %. Increases in income used in the FAO projections are country specific and
the reaction of food demand to increases in income are also considered countryby-country. For example, FAO assumes the response in demand for meat products
in India to income growth to be substantially lower than in many other countries
with comparable income levels due to dietary preferences resulting from cultural
and religious practices (FAO, 2006: 49). In the published FAO papers, projected
income growth is reported by country group (e.g. Table 2.5 in FAO, 2006: 17), but
not by country. The evidence on individual countries such as India is often anecdotal. Moreover, the income elasticity used in the projections are not documented.
»» Changes in income distribution can have substantial effects on aggregate food
demand: a more equal distribution of income results in higher food demand, as
poorer parts of the population tend to spend a larger share of their incomes on
food than higher income groups. The FAO projections do not explicitly take into
account changes in income distribution. Based on World Bank projections of
declining poverty, however, FAO projections are based on the assumption that
coefficients of variation in food demand within developing countries will decline
from a level in the range of 0.21–0.36 in the base period to 0.20–0.295 by 2050
(FAO, 2006: 21).
»» Country and product specific consumption trends which are not driven by standard variables such as income or prices are often designated as “autonomous consumption trends”. Such trends may be driven by changes in consumers’ perception
of food products, health issues and other factors. Such autonomous trends are
sometimes taken into account in the FAO projections, but are not systematically
documented in the reports.
»» Increasing demand for fishery products is taken into account in the calculations of total food availability, but the exact amount is not specified clearly. The
2003 report states that “the global average per capita consumption could grow
to 19–20 kg by 2030, raising total food use of fish to 150–160 million tons (97
million tons in 1999)”, with the bulk of the increase coming from aquaculture
(Bruinsma, 2003: 22).
»» The handling of demand forecasts for biofuels is quite intransparent. Bruinsma
(2009: 2) states that the projections do “not deal with additional demand for
agricultural products used as feedstock in biofuel production”. But obviously this
refers to any additional demand for biofuels, which would add to that already
considered in the Interim Report.
18 | How to feed the world’s growing billions
»» The biofuel demand for coarse grains, especially corn, is mentioned several
times in the Interim Report. In the section where the results are described, it is
mentioned that “consumption of coarse grains should continue to grow, mainly
for non-food uses (essentially animal feed, though use for the production of
biofuels may assume some importance in the future)” (FAO, 2006: 41). Yet it
remains open to what extent this has been considered in the projections.
The GDP growth
rates assumed by
FAO until 2050 are
substantially above
what has been
observed in the past
»» For vegetable oils, it is assumed that demand for non-food industrial uses will
grow by 3.2 % annually until 2050, compared to human demand growing by
1.5 % annually. As a result, about 42 % of vegetable oil demand will be for nonfood industrial use by 2050 (FAO, 2006: 57).
»» For cassava, the Interim Report states that “In our projections for non-food
uses we made some allowance for increased demand originating in the biofuels
sector” (FAO, 2006: 60). Yet it remains unclear to what extent this was done.
»» For sugar, it is assumed that demand for sugar in ethanol production will
increase strongly in Brazil, Peru, Colombia, Central America, India, Thailand,
Australia, South Africa and Zimbabwe. As a result, it is projected that industrial use of sugar will grow by 4 % annually up to 2050 (FAO, 2006: 62–63).
»» The overall picture with regard to biofuels is unclear: the amount of vegetable oils and sugar use for biofuel production can be derived from the Interim
Report, but this is not the case for cereals. The effect of biofuel demand on
the global food balance is explicitly addressed in supplementary papers (e.g.
Fischer, 2009).
Figure 2.2 graphically depicts the development of the two most important variables
impacting food consumption: population and income
Figure 2.2:
World Population and
World Income (1970 = 100)
Sources: FAOSTAT (2011)
for historical population data; IMF (2010) for
historical GDP data, FAO
(2006) for projections, own
calculations.
GDP
GDP/capita
Population
1000
1000
900
900
800
800
700
700
600
600
Populatio
500
500
GDP
400
400
GDP/capi
300
300
200
200
100
100
00
1970
1980
1990
2000
2010
2020
2030
2040
2050
1970 1980 1990 2000 2010 2020 2030 2040 2050
Figure 2.2 shows that world population is expected to grow slower than in the past
(annual growth rate 2030–2050 = 0.5 %). In contrast, the GDP and per capita GDP
growth rates assumed by FAO (2.1 % until 2030; 2.7 % until 2050) are substantially
above what has been observed in the past (2.2 % annually from 2000 to 2010 and
about 1.4 % in the two decades prior).
19
Assuming a reduced
annual per capita
GDP growth rate of
1.4 % leads
projected growth
in food demand by
2050 to drop from
75 % to 50 %
A quick back of the envelope calculation shows that the increase in population and
income assumed by FAO alone would result in an increase in the value of consumption on the order of magnitude projected by FAO: Assuming an income elasticity of
total food demand of about 0.21 and a population elasticity of total food demand of 1,
the resulting increase in food consumption would be about 76 %. If, instead, per capita
GDP growth rates observed between 1980 and 2000 are assumed to prevail in the
future (i.e. 1.4 % annually), the resulting increase in food consumption would only be
50 % instead of 76 %.
A final factor which impacts the future of the global food balance is the postharvest losses that occur along the food supply chain and at the household level (see
Section 4.2 below). In its projections, the FAO estimates of postharvest losses (called
“waste” in the reports) exclude losses at the household level (FAO, 2006: 14), but the
figures used for the base period and the projections are not published in the FAO
reports. Based on published FAO statistics which are used in the projections (Supply
Utilization Accounts; FAOSTAT, 2011), we can conclude that even if losses at the
household level are neglected, losses used in the projections seem low compared to
the estimates for losses along the supply chain reported in the literature, which are
about 15 % for cereals in developing countries (see Section 4.2.4 below). This conclusion can be derived as follows:
»» The updated projections of the Interim Report only include the categories “food”
and “all uses”, whereby “all uses” minus “food” would include feed, industrial use,
seed and waste (e.g. FAO, 2006: 40, Table 3.3).
»» Figure 3.9 in the original FAO report (Bruinsma, 2003: 75) shows the development
of “other uses” for cereals, including industrial use, seed use and waste, which
declines from about 10.4 % in 1997/99 to 9.4 % by 2030.
»» According to FAO commodity balances (FAOSTAT, 2011), waste accounted for
4.5 % of global cereal production in 1997/99, seed accounted for 3.6 % and industrial utilization for 2.3 %, yielding the 10.4 % figure found in Table 3.9 in Bruinsma
(2003).
Postharvest losses
assumed in the FAO
studies are far below
other estimates
Thus, postharvest losses assumed in the studies are far below other estimates.
Second, we can try to understand how FAO projects postharvest losses to develop
until 2050:
»» The FAO assumes a slight decline in the aggregate total for industrial use, seed use
and waste of about one percentage point by 2030, yet one can only guess as to the
composition of this decline.
»» According to FAO data, seed use has declined substantially in the past, whereas
waste has been quite stable. For this reason, it appears FAO projections for a decline in the aggregate are based on declining seed use instead of declining waste
(see Figure 2.3).
1
An income elasticity of demand of 0.2 means that demand for the respective product increases by 0.2 % if
income increases by 1 %.
20 | How to feed the world’s growing billions
35 % of US corn
production is used
for bio-ethanol
production
Figure 2.3 includes data on total non-feed and non-food use up to 2007, when these
categories totalled at 11 %, as well as FAO projections of this aggregate up to 2030.
This total includes seed use, industrial use and waste. In addition to showing a decline
in seed use and stable food loss percentages, Figure 2.3 highlights the strong increase
in the industrial utilization of cereals witnessed since the mid-90s. It seems that
this use category has reversed the declining trend of the overall aggregate “non-feed
and non-food use”. The main driver of the industrial utilization category is the use of
cereals for bioethanol production. For example, the use of corn for bioethanol production in the US increased from 10 mil. tons in 1995 to 116 mil. tons by 2009. The latter
figure represents 35 % of US corn production or 5 % of world cereal production (ERS,
2011; FAOSTAT, 2011). Whether and to what extent demand for cereals for ethanol
production has been considered in the projections is unclear (see below).
14 %
12 %
10 %
8 %
6 %
4 %
2 %
0 %
1960
1970
Figure 2.3:
Non-Feed/Non-Food
Cereal Use as a % of
Global Production
Sources: FAOSTAT
(2011) for historical data;
Bruinsma (2003) for projections, own calculations.
Total non-feed &
non-food
Total non-feed & nonfood projections
Seed
Waste
Industrial utilization
1980
1990
2000
2010
2020
2030
2.3.2 Supply Factors
There are essentially two factors that can lead to higher crop yields: an increase in
cultivated area and an increase in the productivity of land. Increases in the productivity of land improved may stem from several factors, including enhanced complementary inputs (irrigation, fertilizer), improvements due to crop breeding, or improved
farming techniques. For the FAO projections the following assumptions are made
about average global developments (Bruinsma, 2009: 2–6):
»» Total arable land will increase by 5 %, reflecting a decline in industrialized countries and an increase in developing countries.
»» Irrigated land will increase by 17 % and land equipped for irrigation will increase
by 11 % (all of this increase is forecasted to occur in developing countries).
»» Cropping intensity, which is defined as the frequency of harvests on a given land
unit, will increase by about 9 %.
»» Average crop yields will increase by 42 %.
21
For animal production, supply increases may be achieved with an increase in animal
numbers or with productivity increases caused by factors such as shorter production
cycles and higher carcass weight or milk and egg yields (Bruinsma, 2003: 164).
Bruinsma (2003) presents information on the projected growth rates in meat producing animal numbers between 1997/99 and 2030 (Bruinsma, 2003: 165, Table 5.3) as
well as assumed developments in carcass weight. Information on other underlying
productivity parameters is not specified in the report. Based on the increase in animal
numbers (Bruinsma, 2003: 165, Table 5.3) and the projected increase in animal
production (Bruinsma, 2003: 89, Table 3.11) between 1997/99 and 2030, the growth
rates in animal productivity that underlie the assumptions in FAO projections to 2030
can be reconstructed:
»» Beef production will increase by 1.3 % annually (= 51 % between 1998/99 and
2030) of which 0.6 % (21 %) can be ascribed to advances in productivity and 0.7 %
(25 %) to increasing animal numbers;
»» Pork production will increase by 1.1 % annually (42 % in total) of which 0.5 % (17 %)
can be attributed to productivity improvements and 0.6 % (21 %) to the increase in
animal numbers;
»» Poultry production will increase by 2.7 % annually (135 % in total) of which 1.1 %
(41 %) is attributed to productivity increases and 1.6 % (66 %) to the increase in
animal numbers.
Moreover, feed demand for cereals for overall livestock is specified, but no information is published on changes in feed conversion rates. Total feed demand for cereals
is expected to increase by 89 % between 1999/01 and 2050, which is equivalent to
1.28 % p.a. (1.6 % p.a. between 1999/01 and 2030 and 0.8 % between 2030 and 2050;
up from 0.8 % p.a. in the 1990s).
This can be compared to an increase in the production of all livestock products (including meat, eggs and milk) of 1.6 % p.a. between 1999/01 and 2030 and of 0.9 % p.a.
from 2030 to 2050, equivalent to a total increase of 92.6 % over the period 1999/01–
2050. Thus, total livestock production and total feed demand for cereals increase
by about the same rate. From these figures, however, one cannot conclude that feed
conversion rates remain constant, as they combine various effects: improvements in
feed conversion, a changing composition between different livestock products, and
changes in the composition of feed rations.
Figure 2.4:
Arable Area, Area
Equipped for Irrigation and
Crop Yield (1970 = 100)
Sources: FAOSTAT (2011)
for historical data; FAO
(2006) for projections, own
calculations.
Arable area
Cereal yield
Irrigated area
300
250
200
Arable area
150
Cereal yield
Irrigated area
100
50
0
22 | How to feed the world’s growing billions
1970
1980
1990
2000
2010
2020
2030
2040
2050
Figure 2.4 graphically depicts trends in the most important variables impacting crop
production: arable area, area equipped for irrigation and cereal yields.
Figure 2.4 shows the limited potential for increases in arable area, the strong decline
in the absolute increases of irrigated area and the declining growth rates of cereal
yields, which were above 2 % annually in 1970–1990, declining to 1.2 % in 1990–2010
and are projected to further decline to 0.6 % by 2050.
2.4 Results of the FAO World Food Projections
FAO projects agricultural production to increase by the percentages displayed in Table
2.2 over the 44 year period from 2005/07 to 2050. For product groups with a comparable value per quantity unit, such as cereals and meat, the increase is reported for the
development of the total quantity. For other product groups, which comprise products
with very different per unit values (such as “crops”), increases are expressed in terms
of total production value at constant world market prices at constant 1989–91 world
market prices in US $ (FAO, 2006: 31).
1961/63
Table 2.2:
Increases in Agricultural
Production
* In value terms, aggregated with constant world
market prices of the years
1989–91 in US $.
Sources:
Bruinsma (2009: 5),
own calculations.
2005/07
2050 1961/63 to
2005/07
2005/07
to 2050
(observed) (projected) (observed) (projected)
World
Millions of tons
Change in %
Total agricultural
production*
148.0 %
70.0 %
Total crop production*
157.0 %
66.0 %
138.7 %
49.6 %
136.0 %
76.0 %
164.9 %
85.1 %
Total agricultural
production*
255.0 %
97.0 %
Total crop production*
242.0 %
82.0 %
215.3 %
61.5 %
Cereal production
843
2,012
3,009
Livestock production*
Meat production
94
249
461
Developing countries
Cereal production
353
1,113
1,797
42
141
328
Livestock production*
Meat production
284.0 %
117.0 %
235.7 %
132.6 %
63.0 %
23.0 %
Developed countries
Total agricultural
production*
Total crop production*
Cereal production
64.0 %
30.0 %
490
900
1,112
83.7 %
23.6 %
62.0 %
17.0 %
52
108
133
107.7 %
23.1 %
Livestock production*
Meat production
23
Table 2.2 shows a total increase in agricultural production of 70 % in value terms,
which results from a 97 % increase in developing and 23 % increase in developed
countries. Globally, meat products experience the strongest growth (85 %), followed
by the aggregate of livestock production (76 %), aggregate crop production (66 %) and
cereal production (nearly 50 %). In developing countries, growth in total livestock
products and meat production increase by a higher percentage than crop production.
In developed countries, by contrast, the increase in animal production is lower than
that in crop production.
The 70 % growth in total agricultural production results in a 22 % per capita increase
when taking into account global population growth of 40 % to 9 billion by 2050.
Expressed in calories, such an increase in value would imply an average increase in
per capita calorie consumption of 11 % (Bruinsma, 2009: 5). Based on assumptions of
a more equitable distribution of food within countries by 2050 (FAO, 2006: 21), the
FAO estimates that the absolute prevalence of undernourishment in developing countries will decrease from 813 million in 2000/2002 to 290 million by 2050, a decrease
equivalent to 64 %.
Growth rates
observed in the past
are more than twice
as high as those
projected for the
future
Past growth rates
in agricultural
production has often
been accompanied
by the unsustainable
exploitation of
natural resources
In order to put the projected increases in agricultural production into perspective,
Table 2.2 also presents the historical increases for an equally long 44 year period:
1961/63 to 2005/07. A comparison shows that for agriculture as a whole as well as
for most product groups, the growth rates observed in the past are more than twice
as high as those projected for the future, although they started from a much lower
absolute level, of course. Looking more closely at the calculations underlying the
projections described above, these declining growth rates reflect lower demand
growth mainly due to weaker population growth (population has more than doubled
during the historical 44 year period and is projected to increase by only 38 % over the
forecast period). On the supply side, declining growth rates in arable area, irrigation and the productivity of land assumed, and are sufficient to satisfy the increase
in demand. Furthermore, it should be taken into account that past growth rates in
agricultural production was often accompanied by the unsustainable exploitation of
natural resources (e.g. Bruinsma, 2003: Chapter 12).
Finally, the FAO projections can be put into perspective by comparing them to
projections of the world food situation made by other institutions and author teams.
Major alternative sources are projections published by the International Food Policy
Research Institute (IFPRI) based on the partial equilibrium simulation model
IMPACT. As discussed above, simulations based on such a model allow for the simulation of price changes and the straightforward formulation of scenarios based on alternative assumptions that can be analyzed quickly. A major IFPRI publication based on
the IMPACT model is “Global Food Projections to 2020” (Rosegrant et al., 2001). Due
to the relatively dated nature of these projections, however, we also compare the FAO
projections to Msangi and Rosegrant (2009), who project the development of world
food balances up to 2050.
Generally speaking, world food projections tend to be quite much in line, as Figures
2.5 and 2.6 show. These figures contain contain FAO projections (Bruinsma, 2003;
FAO, 2006), IFPRI projections (Rosegrant et al., 2001) and different scenario results
from the Millenium Ecosystem Assesment (MA) (2005), which are also based on the
IMPACT model at IFPRI.
24 | How to feed the world’s growing billions
Corn is one of the most important staple foods worldwide. Adequate conservation and storage
techniques are needed to reduce postharvest losses.
Figure 2.5:
World Cereal Production
1960–2050
Source: IAASTD
(2009: 295).
Figure 2.6:
World Meat Production
1995–2050
Source: IAASTD
(2009: 297).
Figure 2.5 and 2.6 show that deviations between the IFPRI and FAO projections are
very small. Deviations among the MA scenarios are somewhat larger, especially for
meat, which is because of strongly differing scenario assumptions, including substantial differences in per capita income, which has greater impacts on meat than on
cereal consumption.
More recent projections based on the IMPACT model foresee a total increase in cereal
production between 2000 and 2050 by 48 % (own calculations based on Msangi and
Rosegrant, 2009: 30, Figure 3), being equivalent to an annual growth rate of 0.79 %.
This is a slightly more moderate estimate than FAO projections (Bruinsma, 2009),
foreseeing an increase of cereal production by 49.6 % between 2005/07 and 2050,
being equivalent to an annual growth rate of 0.88 %.
26 | How to feed the world’s growing billions
2.5 Political Conclusions Drawn by FAO from the Results
The FAO reports are quite modest with regard to policy conclusions. The initial report
(Bruinsma, 2003), for example, has no chapter focussing on conclusions with policy
relevance, and most conclusions formulated in the individual chapters on world food
projections are rather technical. One conclusion with strong political implications is
that it is very unlikely that the World Food Summit target of halving undernourishment by 2015 would be met, even by 2030 (FAO, 2006: 4).
Bruinsma (2009) contains more pronounced conclusions: he sees an improvement in
the global food balance by 2050, and asserts that the world as a whole could produce
enough food for all by that time. But he also hints at the remaining regional disparities which will leave large population groups in many countries undernourished
(Bruinsma, 2009: 3). Furthermore, Bruinsma highlights the importance of increasing
agricultural production within food insecure countries in order to match local demand due to often limited import capacities (ibid: 29). It is also stressed that “the projected increases in yields, land and irrigation expansion will not entirely come about
spontaneously (i.e. driven by market forces), but require huge public intervention and
investments, particularly in agricultural research and in preventing and mitigating
environmental damage” (ibid: 3). Investment requirements have been quantified by
Schmidhuber et al. (2009), who estimate that of the investments required to maintain
the capital stock of the years 2005/2007, an additional 65 % will be needed by 2050 to
reach the projected 70 % PI.
Despite the rather modest and technical policy conclusions made by the FAO, the
projections have been used to argue for a tenfold increase in agricultural development
aid by Jacques Diouf, Director General of the FAO (Financial Times, 2008), as well as
to argue for more investment in agriculture. Moreover, the projections are often cited
in the public debate over hunger reduction (e.g. FAO, 2009b).
Ultimately, it appears that the FAO may have taken the position of arguing for a 70 %
increase in production as it seems to be a less controversial position than calls for
alternate or additional measures to reduce hunger, and is likely to have few opponents
and strong supporters. Other policy recommendations such as those for income redistribution, better governance in countries with a high prevalence of food insecurity,
changes in diets in industrialized countries, the reduction of postharvest losses or
bioenergy subsidization would have been likely to raise more opposition.
It is not clear to
what extent the FAO
takes into account
increasing demand
for bioenergy
2.6 Conclusions from the FAO World Food Projections
The FAO projections are based on solid analysis and an enormous amount of expert
knowledge and country specific data. Furthermore, they are roughly in line with projections by other institutions. Due to the intransparent presentation and insufficient documentation of assumptions and methodology, however, it is almost impossible to trace the
results in light of the assumptions made. As many of the assumptions are unknown, it is
impossible to evaluate their validity compared to any alternatives. For example, it is not
clear to what extent FAO takes into account increasing demand for bioenergy.
The assumed average global income growth rates for 2030 to 2050 are high compared
to the past and may result in an overestimation of future demand. On the other hand,
the effects of climate change are not yet considered in the projection of global supply.
Climate change may put further pressure on the world food balance.
27
3
On the Interdependencies
of Global Agricultural
Production and Hunger
FAO communications and media coverage surrounding
the world food projections have strongly focused on the
need to increase global agricultural production in order
to assure world food security. In this study, however, we
discuss other measures which could be implemented
to increase global food availability: the reduction of
postharvest losses, the limiting of policy support for
bioenergy in industrialized countries and the lowering
of meat consumption in industrialized countries. Such efforts would help to improve
the global food balance and prevent global food prices from increasing to a level that
would result in increasing food insecurity and poverty for people who spend a high
share of their income on food.
But is the link between the global availability of food and undernourishment really
that strong? Amartya Sen formulated the relevance of food availability for food security three decades ago as follows:
“Starvation is the characteristic of some people not having enough food to eat. It is
not the characteristic of there being not enough food to eat. While the latter can be a
cause of the former, it is but one of many possible causes” (Sen, 1981: 1).
Undernourishment
is not a problem of
global food
availability, but
of access to food.
Poverty is the main
reason for food
insecurity
Daily per capita food
consumption was
at 2789 kcal
in 1999/2001 –
The FAO estimated
undernourishment
threshold is
1840 kcal
This notion has become widely accepted and is reflected in mainstream access-based
definitions of food security as “[a situation in which] all people, at all times, have
physical, social and economic access to sufficient, safe and nutritious food that meets
their dietary needs and food preferences for an active and healthy life” (FAO, 2010).
This definition stands in sharp contrast to earlier definitions which focused on the
availability of food, but not on individual access to food, with food security being defined as: “availability at all times of adequate world food supplies of basic foodstuffs to
sustain a steady expansion of food consumption and to offset fluctuations in production and prices” (United Nations, 1975).
In conclusion, undernourishment is not a problem of global food availability, but of
access to food. And in the overwhelming majority of cases, it is the economic access to
food that stands in the way of food security: Poverty is the main reason for food insecurity. The following facts underline the observation that food availability at a global
level is not the main problem at all, but rather that hunger is a problem of economic
access to food, and thus of its distribution:
»» Per capita food consumption was 2789 kcal/person/day in 1999/2001 (Bruinsma,
2009: 8) which was more than 50 % above the FAO estimated undernourishment
threshold of 1840 kcal/person/day (ibid: 15).
»» Per capita food consumption is projected to reach 3130 kcal/person/day by 2050
(Bruinsma, 2009: 8) which would be 64 % above the FAO estimated undernourishment threshold of 1913 kcal/person/day (ibid: 15).
»» Periods of high “global availability” of food are reflected in low world market
prices, as was seen, for example, in the mid-1980s and late 1990s. Yet even during
such periods, hunger was not significantly reduced but the number of people suffering from hunger remained at a level above 750 million (FAO, 2010: 9).
28 | How to feed the world’s growing billions
Increasing agricultural production,
reducing losses or
decreasing demand
in regions with a
low prevalence of
undernourishment
has only indirect and
limited impacts on
the prevalence of
hunger
The main bottleneck
for food security
is the reduction of
poverty
Thus, increasing agricultural production, reducing losses or decreasing demand in
regions with a low prevalence of undernourishment would only have indirect and limited impacts on the prevalence of hunger. Such measures lead to lower world market
prices (provided the region concerned is integrated into world markets). This, in turn,
lowers the import bill of net food importing countries and, if prices are transmitted
to regions with a high prevalence of undernourishment, improves the food status of
net food buying households. This assertion, however, needs to be qualified for several
reasons:
»» The overall effect is likely to be low. If, for example, cereal production in industrialized countries increased by 10 %, this would be equivalent to an increase in
global production by 3.7 % (production shares as projected for 2050 in Bruinsma,
2009). Assuming an own price elasticity of global supply of 0.5 and of global demand of -0.2, the resulting decline in world market price would be about 11 %. This
is a small price movement compared to the observed cereal price variations over
the last few years, which have fluctuated between 90 US $/t and about 250 US $/t
for wheat on an annual average (FAOSTAT, 2011).
»» The relationship between international prices and prices at the household level in
food insecure regions is often not very direct (see Winters, 2002, for a framework
to analyze the linkages between international prices and poverty and Winters et
al., 2002, for a summary of the empirical evidence). The transmission of world
market prices to domestic prices and to remote regions within countries is in
particular often far from perfect.
»» It is not only that net food purchasing households are positively affected by lower
prices, but also that net food selling households are negatively affected. Empirical
evidence suggests that the majority of poor households are net food buyers, but
this does not hold for all countries/regions (Ivanic and Martin, 2006; Aksoy and
Isik-Dikmelik, 2008).
In conclusion, improving the global availability of food is only a very indirect means
of reducing hunger. The main bottleneck to food security is instead the reduction of
poverty. What is needed is investment in rural infrastructure, agricultural research
and public services, as well as efforts to improve governance systems and institutions
which allow markets to work within food insecure regions. Finally, efforts focussing
on poverty reduction are most important, including improving the ability of the poor
to access education, land, employment and other income sources as well as to public
services such as social safety nets and medical care (von Braun, 2007; Heidhues,
2008).
An increase in agricultural production is of importance mainly within the regions
subject to food insecurity and mainly among those affected by food insecurity –
namely, agricultural smallholders.2 Here increasing production can have the dual
effect of lowering prices and increasing food availability for food purchasers, and
of generating additional income for food producers. The relevance of food production within food insecure regions is also emphasized in the various FAO studies
(e.g. Bruinsma, 2003: 45-50, Chapter 8). But even here the focus must be on poverty
reduction: if higher incomes from agriculture accrue to only a few landowners with
little trickle down effects, higher agricultural production may have little effect on
reducing hunger.
2
Agricultural smallholders are estimated to constitute about 50% of the hungry (IFAD, 2010: 1).
29
The reduction of
postharvest losses
in food insecure
regions increases
food availability for
food buyers as well
as income for
food sellers
These arguments hold not only for the effects of increasing agricultural production on
hunger, but also for the effects of any measure affecting the global food balance. More
specifically:
»» A decline in postharvest losses in food secure regions (see Section 4.2) is likely
to have only a modest and indirect effect on global undernourishment, just as a
decline in meat consumption (Section 4.3) or a decline in bioenergy production
(Section 4.1) in food secure regions.
»» In contrast, the reduction of postharvest losses within food insecure regions is
likely to have stronger effects on undernourishment: it increases food availability
for food buyers as well as income for food sellers.
Different crops have different postharvest characteristics: grains and pulses (durables) can have a storage life of
several years, roots and tubers (semi-perishables) have a shelf life of weeks to several months. For fresh fruit and
vegetables shelf life can be very short.
30 | How to feed the world’s growing billions
4
Alternatives to Improving the
World Food Balance
4.1 Introduction
There are two strong arguments in favor of searching
for alternatives to increasing global agricultural production in the effort to improve the world food balance.
First, exploring additional options will increase the
overall potential for improving the world food balance.
And second, increasingly scarce natural resources such as water, land, biodiversity,
and fossil energy suggest that an exclusive focus on increasing agricultural production
is problematic.
Many options to improve the world food balance exist, both on the demand and
supply side. One option which could be easily implemented and would have direct
and significant effects would be to abolish the policies to enhance demand for first
generation liquid biofuels in the EU, US and other countries. Furthermore, other policies that enhance the demand for biomass for energy production should be strongly
narrow political interests. Moreover, indirect many cases policies which are currently
in place are motivated by interests of vested lobbies and indirect effects on land use
and the global food situation are not sufficiently taken into account. We do not discuss
the reduction of biofuel subsidies in detail, as it has been addressed in many papers
recently. Nevertheless, we consider the revision of bioenergy policies as a self-evident
option for improving the global availability of food. The following points summarize
key findings of recent literature:
»» Demand for biomass for energy production has a strong impact on the world food
balance. This impact is expected to increase, mainly due to ongoing political efforts to increase demand for biofuels.
»» Increasing demand for biofuel has the potential to strongly contribute to higher
global prices for agricultural products (Rosegrant, 2008; Banse et al., 2008; Banse
and Grethe, 2008; OECD, 2006; Fischer 2009).
»» Higher world market prices cause substantial indirect land use changes as crop
lands expand around the world as a response to the increasing demand for biofuels (Fischer, 2009).
»» It has been found that the production of certain forms of bioenergy such as liquid
fuels in the US and EU could even increase global GHG emissions if direct land
use effects are taken into account (Searchinger et al., 2008; WBGU, 2008).
»» Overwhelming scientific evidence suggests that the political support for first generation biofuels should be ended (Wissenschaftlicher Beirat beim BMELV, 2007;
WBGU, 2008).
A more equitable
distribution of
income has a high
potential to
decrease hunger
Furthermore, a more equitable distribution of food, which could be achieved with
a more equitable distribution of income, has a high potential to decrease hunger.
Bruinsma (2003) shows that at an average national consumption level of 2300 kcal/
person/day, a reduction in the coefficient of variation3 of food distribution from 0.3 (a
typical value for developing countries with high inequality) to 0.2 (a typical value for
industrialized countries) has the same effect on the reduction of undernourishment as
an increase in average national calorie availability by 14 % (own calculations based on
Bruinsma [2003: 44]; coefficients of calorie distribution from FAOSTAT [2011]).
3
The coefficient of variation is a dimensionless statistical measure which relates the standard
deviation to the mean of a data set. The higher the coefficient of variation, the more unequal
the distribution.
31
Two options to improve the world food balance are highlighted in sections 4.2 and 4.3
below: the reduction of postharvest losses and the reduction of meat consumption in
industrialized countries. The reduction of postharvest losses, including losses along
the supply chain as well as waste at the household level, are relevant due to the high
share of up to 50 % in global agricultural production, and due to their potentially very
direct effects on food security that would result from a reduction of losses within
food insecure regions. The reduction of meat demand in industrialized countries is of
special interest as reduced meat consumption would have supplementary beneficial
effects for human health, the environment, climate change and animal welfare.
A 20 % postharvest
loss has to be
offset with a 25 %
production increase,
a 40 % loss with a
66 % increase
4.2 Reduction of Postharvest Losses
4.2.1 Introduction
The challenge of feeding a growing population is commonly framed in terms of the
need to increase production. However, there is another route to increasing food availability – the reduction of postharvest losses. In fact, a greater production increase
than loss reduction is necessary to achieve the same level of food availability, since
any production increase also suffers losses. For example, a 20 % loss has to be offset
with a 25 % production increase, a 40 % loss has to be offset with a 66 % increase and
so on (Bourne, 1977). For this reason, loss reduction is regarded as the more sustainable, economical way to increase food availability by many experts (Bender, 1994;
Bourne, 1977; Grolleaud, 2002). While often overlooked, postharvest loss trends are
an essential component to any world food projection.
Postharvest usually designates the period between completion of harvest and consumption (e.g. Bourne, 1977; NAS, 1978; Parfitt et al., 2010). Postharvest losses occur during threshing, grading, packaging, transport, storage, processing, distribution
and marketing. Throughout this study, we use the term of food waste to distinguish
the losses beyond the point of purchase, i.e. at the consumer level, which are not
included in the FAO projections (Bruinsma, 2003; FAO, 2006) from the supply chain
losses occurring between the farm and retail levels (the term supply chain losses
is used this way by, inter alia, Parfitt, 2010; Ambler-Edwards, 2009; and Knight and
Davis, 2009).
Food losses can be further subdivided into quantitative losses – a disappearance of
food because of spillage or consumption by pests – and qualitative losses in edibility,
nutritional quality, caloric value, consumer acceptability (Bourne, 1977; Grolleaud,
2002; Kader, 2004). While quantitative losses can be measured by weight or volume,
qualitative losses are much more difficult to assess. Nonetheless, nutritionally inferior
or contaminated food can lead to poor health and lowered productivity and thus affect a country’s economy as a whole (NAS, 1978; FAO, n.d.). The negative effects of micronutrient deficiencies on human capital and economic productivity are well known
(Hoffmann, 2009). Studies have found that micronutrient deficiencies – so-called
“hidden hunger” – are much greater than protein or calorie deficiencies (Bourne,
1977; Hoffmann, 2009).
This subchapter begins with the introduction of the major causes of postharvest
losses. In the following, an overview of the current extent of such losses and expected
future trends is provided. Finally, the validity of the assumptions made by the FAO as
well as potential alternative assumptions are discussed.
32 | How to feed the world’s growing billions
Figure 4.1:
Losses Along
the Food Chain
Source: Own composition.
4.2.2 Causes of Postharvest Losses
Food is biological material that naturally degrades to the simple inorganic compounds
from which it was produced. Technology can slow down this process but cannot stop
it. After the harvest, food is subject to a complex of biological, climatic, economic,
social, cultural and political conditions (Bender, 1994; Grolleaud, 2002; Parfitt et al.,
2010). The causes of postharvest losses can be classified as immediate or primary
causes and underlying or secondary causes that cause or influence the immediate
causes (see Figure 4.1).
Postharvest losses
Supply-chain losses
pre-harvest
& harvest
preprocessing
transport
storage
processing
and
packaging
Food waste
marketing
and
distribution
preparation
consumption
Immediate causes: Biological, chemical, physical, mechanical, behavioral
Secondary causes: Climate, socioeconomic environment, infrastructure, management skills, education
Immediate causes include biological, chemical, physical and mechanical factors such
as attack by insects or microbes, inherent metabolic processes, contamination with
harmful substances, mechanical damage and injuries, and improper atmosphere,
temperature, light or humidity which can interact in various ways (Lundqvist et al.,
2008; Bourne, 1977). Underlying causes can be classified into the following categories:
Many traditional
varieties have good
postharvest
qualities. Improved
high yielding
varieties are often
more vulnerable
»» The natural environment (climate): High temperatures speed up chemical
reactions, respiration and spoilage, and lead to water losses; climates that are
regularly moist and warm foster the reproduction of insects and micro-organisms
(yeasts, moulds) that attack harvest and stocks (Aidoo, 1993; Bourne, 1977;
Grolleaud, 2002; Lundqvist et al., 2008); the season (rainy or dry) can also play an
important role (Grolleaud, 2002).
»» Properties of the crop: The type of crop and the condition of the crop after
harvest (e.g. moisture content; potential damage during harvesting) are important
factors. Different crops have different postharvest characteristics: grains and
pulses (durables) can have a storage life of several years; roots and tubers (semiperishables) have a shelf life of weeks to several months; in the case of fresh fruit
and vegetables shelf life can be very short; some highly perishable foods (e.g. milk,
meat, fish) it can become inedible in a matter of hours (Grolleaud, 2002; Parfitt et
al., 2010).
33
Furthermore, there can be important differences in storage life between different
varieties. Traditional varieties have usually been selected for their good keeping qualities (e.g. hard endosperm, good husk cover which protects them against
insects), while improved high-yielding-varieties are highly vulnerable to pests and
damage in postharvest handling (Bourne, 1977; Boxall, 2001).
»» Socioeconomic and cultural factors create the conditions in which primary
causes occur and may hinder the implementation of technological solutions for
postharvest losses. These causes are highly correlated with the general economic
and institutional development process and include:
»» Inadequate infrastructure such as roads, transportation and storage facilities
(Kader, 2004; FAO, n. d.; Aidoo, 1993; Lundqvist et al., 2008; Boxall, 2001).
»» Inadequate technology that is not adapted to or incompatible with local conditions and existing practices, customs and available materials (Parfitt et al.,
2010; Bourne, 1977, NAS, 1978; IAASTD, 2009).
»» Lack of information/knowledge and managerial skills – most postharvest
handlers have little or no appreciation of the need for or how to maintain quality (Dixie, 2005; Kader, 2004). Scarcity of research on postharvest problems
(Kelman, 1989; Smil, 2004; Wirsenius et al., 2010; Lundqvist et al., 2008) and
inadequate extension services (Aidoo, 1993; FAO n. d.; Boxall, 2001) contribute
to these problems.
»» Underdeveloped institutions and lack of or inadequate government regulation
(Kader, 2004; Bourne, 1977; Boxall, 2001; World Resources Program, 2001).
»» Lack of political attention and neglect by the international community; lack of
funding (Smil, 2004; Boxall, 2001; Bourne, 1977; Kelman, 1989; Lundqvist et
al., 2008).
»» Lack of access to financial resources; low returns from agricultural production
(Mittal, 2007 cited in Parfitt et al., 2010). Improving postharvest methods is
often costly and can only be justified if it is profitable (Dixie, 2005). Peasant
farmers are not squandering their harvests unnecessarily (Grolleaud, 2002).
The cost of an improvement including maintenance (!) is the deciding factor in
its adoption (World Resources Program, 2001; Boxall, 2001; NAS, 1978).
Food waste is found
to be higher in more
advanced economies
due to changes in
consumer attitudes
These factors tend to increase supply chain losses in developing countries relative to
developed countries. In contrast, food waste is found to be higher in more advanced
economies due to changes in consumer attitudes, values, behaviours and knowledge
that accompany rising incomes (Parfitt et al., 2010; Lundqvist et al., 2008; AmblerEdwards, 2009). Since affluent consumers spend only a small proportion of their
income on food, its value is less appreciated and waste seems harmless. Concerns
about food safety, demand for quality, high expectations in terms of food cosmetics
and a growing disconnect between consumers and food production lead to edible, but
imperfect food items being outgraded and thrown away before they are sold (especially in industrial countries, but also among the more wealthy in developing countries).
34 | How to feed the world’s growing billions
4.2.3 Current Extent of Postharvest Losses
Overall average losses are not known with certainty. Many of the numbers for
developing countries that are cited in the literature date back to quite limited studies
carried out in the 1970s and 1980s. Since then, there has been technological progress
and changes in markets and distribution systems. Thus there is little consensus on
the current global level of food losses and waste (Parfitt et al., 2010). Estimates vary
widely from 10 to 50 % overall, 10 to 25 % for cereals and from 1 to 50 % for roots, tubers, fruits and vegetables, depending on the location, crops and keeping conditions.
(Bourne, 1977; World Resources Program, 2001). There are important differences in
climate, economic development, postharvest systems and causes of losses between
different countries and even within countries. Furthermore, a universally applied
method for measuring losses does not exist and a wide variety of approaches are used
in different studies (Grolleaud, 2002; World Resources Program, 2001).Therefore, it is
difficult to draw conclusions about overall averages and it is advisable to be cautious
about over-simplified results (Grolleaud, 2002).
Postharvest losses
between farm and
retail are higher
in developing
countries. Food
waste at the retail
and household levels
is higher in more
advanced economies
A wastage rate of
about 25 % for the
most affluent
countries seems
appropriate
In light of all the studies reviewed for this report, a very conservative estimate for
cereal losses in developing countries, excluding marketing, distribution and consumer
losses, would be in the range of 15 %. Worldwide postharvest losses in fruits and vegetables could be estimated at around 30 % in developed and developing countries in
the whole supply chain including food waste at the household level. It should be kept
in mind that these figures are averages over a great variety of regions and conditions
– losses for single locations and crops or varieties could be much larger or smaller.
Although accurate data are not available there is general agreement that postharvest
losses are heaviest in developing countries (Kelman, 1989). However, if losses at
the consumption stage are taken into account, the picture might be different. Kader
(2004) estimates that total postharvest losses for horticultural crops in both developing and developed countries are about 32 %, but they occur at different points after
harvest. Ambler-Edwards et al. (2009) report that 50 % of the food produced may be
lost after harvest in the UK (including consumer waste) according to work done at
Cardiff University. While in developing countries the bulk of losses occur in the first
part of the postharvest system (between farm and retail), in developed countries
they occur in rather late stages (retail and consumption) (Kader, 2004; Lundqvist
et al., 2008; Nellemann et al., 2009). In the UK one-third of all food purchased is
discarded by consumers, according to a study carried out by the waste and resources
action programme (WRAP, 2008), an amount equal to 6.7 million tonnes worth an
estimated £ 14.5 billion. 61 % of this waste, worth £ 10.2 billion, is avoidable, meaning
it could have been eaten if prepared in time or was thrown away while still in date.
Kantor et al. (1997) estimate that consumers wasted 26 % of the edible food purchased
in the United States in 1995, cautioning that this was an underestimate. More recently
Hall et al. (2009) estimate that consumers wasted 40 % (or 1400 kcal per capita) of
the food available in the United States in terms of caloric energy. Assuming a wastage
rate of about 25 % for the most affluent countries seems appropriate. Consumer waste
in developing and transition economies seems to be significantly lower. Pekcan et
al. (2006) find waste rates of 8.9 % for Turkish households, and Sibrián et al. (2006)
estimate a household waste of 9 % for the Philippines based on secondary data from
1978. Two studies from the 1970s suggest that waste was much lower in the UK at that
time, equal to about 10 % and 6.5 %, respectively (Dowler, 1977; Wenlock et al., 1980).
Yet in addition to the poor empirical evidence for quantitative food losses, there are
very few datasets on qualitative losses, with the existing studies in this area focussing
on losses during storage. Measurement here is even more problematic than for quantitative losses (Parfitt et al., 2010). However, some data for single countries or sectors
35
that are available could give an idea of their order of magnitude. While conservative
estimates of losses in horticultural crops during transport, processing and storage
amount to 10–15 % in terms of quantity, they could amount to 25–50 % in terms of
economic value because of quality reductions (Lundqvist et al., 2008).
In conclusion, both supply chain losses and consumer food waste seem to be correlated with the level of economic development and incomes, however in different
directions. We would expect supply chain losses to drop with higher levels of development and thus higher levels of development, as higher levels of technology become
affordable, and food waste to rise with higher disposable incomes. The total effect of
economic development on overall postharvest losses in the absence of policy interventions is therefore ambiguous.
Low food prices in
relation to
disposable income
encourage wasteful
behavior
4.2.4 Postharvest Losses in the Course of Economic Development
It is often argued that in the course of economic development industrialized food chains
achieve better resource efficiency and lower losses, but research suggests that these
benefits are negated by growing consumer waste for various reasons (Parfitt et al., 2010).
1. Rising incomes and changing consumer attitudes: According to AmblerEdwards (2009), increasing food waste is concomitant with the transition to a more
affluent diet. Higher incomes result in increasing consumption and thus higher food
wastage (Nellemann et al., 2009; Sibrián et al., 2006; Wirsenius et al., 2010). With
growing incomes, qualitative factors become more important and foods that may
have been acceptable before may become “lost” now because they do not meet the
new higher standards (World Resources Program, 2001). IAASTD (2009) expects
the demand for products with high quality and safety standards to further grow in
developed countries. Furthermore, low food prices in relation to disposable income
encourage wasteful behaviour (Sibrián et al., 2006; Lundqvist et al., 2008). Bender
(1994) finds that overconsumption and consumer food waste are already very large,
with rates of 30–60 % of food requirements in high income countries, and will
increase rapidly with rising incomes in developing countries, as well. According to
Parfitt et al. (2010) and Hall et al. (2009), there is strong evidence for the increase
of consumer food waste over the past decades. But overconsumption is not only a
problem in developed countries. Wasteful food habits and excessive consumption are
spreading among the better-off segments of the population in many middle- and lowincome countries. For example, there are unprecedented levels of obesity in China,
and in Shanghai alone more than 1000 tonnes of food a day are thrown out (AmblerEdwards, 2009; Parfitt et al., 2010; Smil, 2004). However, while the link between
income and food waste is strong, cultural differences and differences in consumption
styles can influence waste generation in unpredictable ways (Thøgersen, 1996).
2. Dietary transition: In addition to the direct effects of higher income on food
waste, there is an indirect effect resulting from changes in the composition of
diets: the proportion of luxury foods increases relatively to staples (Bender, 1994;
Parfitt et al., 2010). According to Parfitt et al. (2010), there is a shift in consumption patterns towards more vulnerable foods with shorter shelf-lives. A higher
proportion of perishable food items increases the risk of losses and wastage
(Lundqvist et al., 2008). The rapid expansion of the fresh fruit and vegetable
sector in transitioning countries is likely responsible for significant supply chain
losses due to inadequate infrastructure. Perishables also constitute the largest
part of household food waste (Parfitt et al., 2010), and there is evidence that varied
consumption styles generate more waste than “pure” forms (Rathje, 1984, cited in
Thøgersen, 1996; Sibrián et al., 2006).
36 | How to feed the world’s growing billions
Urbanization results
in longer food
supply chains which
increase the risk of
losses
3. Urbanization and demographic changes: Urbanization results in longer food
supply chains (Parfitt et al., 2010; Adhikari et al., 2006) which increase the risk of
losses as food has to travel longer distances, be kept fresh for longer periods of time
and is handled at many stages and by many different actors, such as processors,
brokers and wholesalers. Kantor et al. (1997) report that a typical food item in the
US has already been handled 33 times on average before it is displayed for consumers in the supermarket. An ageing population and the growth of single person
households in developed countries lead to higher wastage rates. Studies have
found that large households waste less per person than smaller households and
singles throw away more per capita. Adults waste more than children and young
people waste more than older people. However, this is likely to change in the future
because today’s young are tomorrow’s elderly and unlikely to change their attitudes
and behaviours towards food. Whereas today’s elderly might still have experienced
hunger and scarcity, many younger people grow up in affluence (Parfitt et al., 2010).
4. Technological progress: Technological progress not only decreases supply
chain losses but also affects food waste. However, technological advances do not
automatically result in consumer waste reductions. The relationship between
refrigeration and food loss, for example, is complex and depends on factors such
as lifestyle and attitudes to food (Garnett, 2008). Mercado-Villavieja (1976) found
Mexican households with refrigerators tend to waste more food than those without
(cited in Parfitt et al., 2010). Better packaging can significantly reduce food waste
but leads to higher solid waste (Beede and Bloom, 1995).
5. Vertical integration: Arrangements such as contract farming and vertical integration can significantly reduce postharvest losses within supply chains, however,
more often than not at the cost of excluding small farmers and firms (Goletti,
2003, Parfitt et al. 2010, Mrema and Rolle, 2003).
Next to these factors which are closely related to economic development, two more
factors may substantially affect future trends in postharvest losses: increasing real
food prices and climate change. Long term price trends would affect postharvest
losses. Food prices have been decreasing for a long time, and despite recent price
hikes, food is still relatively cheap. Food price is recognized as the most important
factor in determining consumer choices. Thus, except for the very poor, many consumers have little incentive to change their wasteful behavior (Lundqvist et al., 2008).
However, anecdotal evidence suggests that the economic crisis has stimulated a shift
in consumer attitude to food waste. In the long run, resource limitations are likely to
increase the value of food. This might lead to a more efficient postharvest system and
consumer waste reduction (Parfitt et al., 2010).
Finally, alongside food production, climate change will also affect the postharvest
system. Extreme weather events could affect transport and storage infrastructure, and
rising temperatures place greater demand on refrigeration, with the poor likely hardest
hit (Garnett, 2008). Introduction of new pest species and the exacerbation of existing
pest problems are also likely to increase with climate change. Warmer winters will
allow the expansion of insects and diseases over wintering ranges – this has already
happened for some plant pathogens (Garrett et al., 2006; Rosenzweig et al., 2001;
Baker et al., 2004; all cited in IAASTD, 2009). Current strategies for pest control could
loose their effectiveness and reduce the flexibility of pest management in the future.
Higher temperatures could also lead to the deactivation of resistance genes in plants,
thus increasing their vulnerability. Furthermore, crops could become increasingly
susceptible to nematode attack with higher temperatures (IAASTD, 2009).
37
4.2.5 Potential for Loss and Waste Reduction
4.2.5.1 In Developing Countries
In developing countries supply chain losses are more important than consumer food
waste. Therefore, actions to reduce postharvest losses should focus on the first stages of
the postharvest system. However, it is advisable to keep in mind that with rising incomes
food waste could increasingly become a problem that should be addressed as well.
The first World Food
Conference in 1974
identified reducing
postharvest losses
as a key strategy for
addressing hunger
and set a reduction
goal of 50 % by 1985
Only 5 % of funding
for agricultural
research are
devoted to postharvest systems.
Yet internal rates
of return from
post-harvest
research are high
The first World Food Conference in 1974 identified reducing postharvest losses as as
a key strategy for addressing hunger and set a reduction goal of 50 % by 1985. Since
data on the initial loss level and subsequent progress are missing, it is not possible
to say what advances were made (Parfitt et al. 2010). Although most authors agree
that there is significant scope for reducing supply chain losses, concrete figures on
reduction potential are rare. According to a study carried out in the ASEAN region,
10 % of the losses during handling, storage and processing of grains could be avoided
(Grolleaud, 2002). The grain storage losses accepted by farmers in developed countries are very low at about 0.75 to 2 %, according to Grolleaud (2002). Bourne (1977)
sees the average storage losses of 0.249 % in wheat in Australia in the 1960s and 1970s
as a reference figure for an achievable goal. Lundqvist et al. (2008) find a 50 % reduction in postharvest losses, including consumer losses, to be realistic.
Although the evidence base is scarce, all studies reviewed agree that there is significant scope and need to reduce supply chain losses in developing countries, and that
increasing production without addressing the postharvest system bears the risk of
exacerbating the situation. There are compelling arguments in favour of tackling
postharvest losses, despite the lack of reliable data.
Heyes (2003) argues that internal rates of return from postharvest research are high.
The internal rates of return on investments to reduce postharvest losses in fruit were
21–48 % per year, according to the Australian Centre for International Agricultural
Research. An impact study on research concerned with the large grain borer found
that the benefits in Ghana and Tanzania alone outweighed the costs of all large grain
borer research expenditures undertaken by all aid organizations (Goletti and Wolff,
1999). Although these are only a few examples for the high positive impact of postharvest research, they suggest that the current lack of attention to these issues is not justified. Currently, only 5 % of funding for agricultural research and 4 % of agricultural
researchers are devoted to postharvest systems (Parfitt et al. 2010, IAASTD, 2009).
Furthermore, investment in the postharvest sector helps to achieve multiple goals. In
addition to improving food and nutrition security, a growing postharvest sector can
foster rural development and create rural employment opportunities, thus contributing to the development of the wider economy via production and consumption
linkages, while reducing migration to urban centers. Improved postharvest practices can improve competitiveness and facilitate access to lucrative export markets.
Furthermore, support to the postharvest sector has the potential of enhancing gender
equality and increasing employment opportunities for women, since they have traditionally played an important role in food processing, handling and preparation. In
addition, reducing postharvest losses can address environmental and sustainability
issues, easing unnecessary pressure on natural and financial resources by reducing
overproduction (Goletti, 2003). The public good character of many investments in the
postharvest sector – including those in research and extension, transportation and
infrastructure, and improved institutions – justifies government intervention.
38 | How to feed the world’s growing billions
After increased international attention and action in the 1970s and 1980s, the topic
of postharvest losses seems to have slipped off the agenda. In the late 1990s and early
2000s some international organizations, including FAO, started addressing the issue
again with the information network on postharvest operations (Inpho), a global postharvest forum (phAction) and a global postharvest initiative (GphI). However, the
information gathered by these initiatives did not include any original research, and
mostly dates from the 1970s and 1980s. Furthermore, there has not been any activity
since 2002.
4.2.5.2 In Developed Countries
In developed countries, food supply chains are quite efficient, with low losses. Waste
by consumers and food services are relatively more important and have become a
significant problem in some affluent countries.
Nellemann et al. (2009) sees scope for increasing food system efficiency by 30 to 50 %
through reducing and recycling food waste. One suggestion is to use food waste as a
substitute for animal feed. However, such practices are limited by current feed safety
regulations, such as those in the European Union. Bender (1994) sees the largest opportunities for consumer waste reduction in high income countries and expects savings from a reduction of losses in marketing and distribution in developing countries
to be small.
There are large
variations in wastage
rates among
countries of similar
income levels. The
Netherlands, Finland,
Japan and Sweden
waste only about
60 % of the amount
of food that is wasted
in the USA, Belgium,
Switzerland and Italy
Intercountry comparisons show that there are large variations in wastage rates among
countries of similar income levels. For example, the Netherlands, Finland, Japan and
Sweden waste only about 60 % of the amount of food that is wasted in the US, Belgium,
Switzerland and Italy. In some countries food demand could conceivably be reduced by
50 % to a level that is found in “best practice” countries. Bender calculates that “A reduction in food waste from 50 % of […] [consumed food products] to 35 % would directly result in a minimum of a 10 % decrease in global food supply requirements” (Bender, 1994:
389). However, it is unclear to what extent increased efficiency is economically feasible.
Sibrián et al. (2006) report that knowledge on food safety and quality issues was the
most important factor determining the quantity of household food wastage in several
studies. Increased awareness and behavioral change could have significant impacts
on consumer waste (Parfitt et al., 2010; Garnett, 2008). However, the large number of
actors makes it difficult for policies to influence consumer behavior (Lundqvist et al.,
2008; Garnett, 2008). There is significant scope to improve labelling and the understanding of labelling by consumers (Granett, 2008; Parfitt et al., 2010). Research by
WRAP (2008) in the UK suggests that there is significant scope for consumer waste
reduction as most waste would be avoidable with better housekeeping, planning and
clearer labelling. WRAP is currently taking action to reduce waste at the consumption
and retail levels. If successful, these programmes could be a model for other developed countries. Packaging technology that improves shelf life of perishables could
help to reduce consumer waste (Garnett, 2008; Parfitt et al., 2010). However, this
waste reduction has to be traded off with higher packaging waste (Beede and Bloom,
1995). Another important consideration is that if people wasted less food, they might
use the money saved to consume more resource-intensive luxury food products or
more non-food products with high environmental impacts. If policies are not aware
of possible knock-on effects, changes in one aspect of consumption behaviour will
simply shift the problem to another area (Garnett, 2008).
39
Furthermore, Bender (1994) cautions that in many countries with particularly high
consumer food waste, farmer subsidies and supply management measures make it unlikely in the short run that policies for food waste reduction will gain political support.
Investment in
research as well as
postharvest loss
reduction policies is
too low
4.2.6 Conclusion
All of the cited authors agree that there is a significant need and considerable potential in reducing supply chain losses and consumer food waste due to the sheer size of
such losses. Regarding the objective of achieving food security, the focus should be on
reducing postharvest losses in food insecure regions. This would have the additional
benefits of increasing food availability and generating income along supply chains.
Currently, investment in research as well as policies to reduce postharvest losses
is too low. Without more systematic research on the extent of losses, measuring
progress against any global reduction target is impossible (Parfitt et al., 2010;
Lundqvist et al., 2008). Furthermore, successfully implemented measures to reduce
losses are needed in order to establish precedents that allow an estimation of the
potential for reducing global food waste as one answer to the challenge of feeding
nine billion people by 2050.
The potential for reducing of postharvest losses to improve the world food balance is
illustrated in Table 4.1 in a small example.
Table 4.1:
The Link Between Cereal
Production and Availability
in Developing Countries
Under Different Waste
Assumptions (in millions of
tonnes)
2005/07
2050
Scenario 1
15 %
Production
1,113
1,797
1,651
946
1,527
1,527
61 %
48.4 %
Food/feed availability*
Increase of production
15 %
Scenario 2
Postharvest losses
7.5 %
*at the wholesale level.
Production data in
Scenario 1 from Bruinsma
(2009). Own calculations.
Bruinsma (2009) projects a 61 % increase in cereal production between 2005/07 and
2050. If we assume a 15 % loss rate (see Section 4.2.4 above), food/feed availability at
the wholesale level would be 946 million tonnes a year in 2005/07, and 1,527 million
tonnes in 2050 (Scenario 1). If losses could be reduced by half to 7.5 % (Scenario 2),
a cereal production of 1,651 million tonnes by 2050 would be sufficient to achieve
the same level of food/feed availability as in Scenario 1. This translates into a 48.4 %
production increase over the production of 1,113 million tonnes in the base year. In
other words, if losses could be reduced by 7.5 percentage points, a production increase
of less than 50 % would be necessary to reach the same level of food/feed availability,
as opposed to the 61 % that would be necessary if losses remain constant.
40 | How to feed the world’s growing billions
If average meat consumption in OECD countries were to decline by 30 %, approximately 30 million hectares of crop land could be set free for alternative food production such as cereals.
4.3 Changes in Consumption Patterns
Decreasing meat
demand in
industrialized
countries could
represent one part
of a solution to ease
future resource
pressures
With average per
capita meat
consumption of
82 kg, developed
countries consume
40 % of world meat
while representing
only 20 % of world
population
4.3.1 Introduction
The future world food balance will not only depend on overall production and overall
calorie intake, but also on the composition of the average human diet. Agricultural
production depends on various resources that will become more scarce in the future
(land, water, energy). As meat-based diets are on average more resource intensive
than plant-based diets (Marlow et al., 2009; Pimentel and Pimentel, 2003), the
amount of animal products consumed per person plays a vital role in the average
resource use of a human diet. Within this context, the sustainability of current
meat consumption in developed countries has gained broad attention in the media
(ScienceDaily, various issues; MailOnline, 2010) as well as in the scientific debate
(Stehfest et al., 2009; Rosegrant et al., 1999; Wirsenius et al., 2010; Pimentel and
Pimentel, 2003; Nonhebel, 2004; Marlow et al., 2009; Elferink and Nonhebel, 2007;
Aiking, 2011; Fiala, 2008). Decreasing meat demand in industrialized countries could
represent one part of a solution to ease future resource pressures. As a side effect,
decreased meat consumption would be likely to lower agricultural prices, and, in
turn, enhance food security by reducing the food cost for net food buying households.
Political measures could contribute to achieving such a demand shift, including
the introduction of a consumer tax on meat and consumer awareness campaigns in
developed countries.
The following Section 4.3.2 presents a short summary of past and projected livestock
sector developments. Section 4.3.3 describes the competition between food and feed
production. Next, Section 4.3.4 introduces potential motives for political measures to
reduce meat consumption. Section 4.3.5 presents a literature review and some of our
own calculations on how reduced meat consumption in OECD countries may affect
the world food balance. Finally, Section 4.3.6 draws some summarizing conclusions.
4.3.2 Past and Future Livestock Sector Developments
4.3.2.1 Consumption Trends
During the past decades, and especially since the 1980s, per capita consumption of
animal products experienced an immense upsurge. Due to the already high level of
consumption in developed countries, growth rates have been modest in the developed
world. By contrast, in the developing countries, average per capita growth rates have
been immense. Table 4.2 illustrates the changes that happened between 1980 and
2005. The impressive growth of past decades is not at all evenly distributed among
developing countries. Instead, the lion’s share of the increase can be attributed to a
small number of countries/regions, with major increases in East and Southeast Asia
(Pica-Ciamarra and Otte, 2009). China in particular witnessed immense increases, in
per capita meat consumption growing by more than 4 times from 1980 to 2005. For
other regions changes have been more moderate, and in Sub-Saharan Africa levels
have even slightly decreased (FAO 2009c).
The gap between average consumption in developing and developed countries
remains wide: With average per capita meat consumption of 82 kg, developed countries consume 40 % of world meat while representing only 20 % of world population.
As consumption levels in developing countries are much lower – 31 kg per capita, on
average – there is immense potential for consumption levels to increase. Whether
past trends of growth will continue will be determined crucially by the development
and distribution of future income growth in low income countries (FAO, 2009c).
The FAO projections foresee a growth of per capita meat consumption in developing
countries to an average of 44 kg/capita by 2050. Still, growth rates are projected to
42 | How to feed the world’s growing billions
FAO projects world
meat consumption
to increase by 85 %
overall between
2005/07 and 2050
be significantly below those of the past: FAO projects an annual global increase in
meat consumption of 1.7 % between 1999/01 and 2030 and 1 % annual growth between
2030 and 2050, in contrast to the annual increases of 3 % from 1961 to 2001 (FAO,
2006: 47, Table 3.7). As a result, meat consumption is expected to increase by 85 %
overall between 2005/07 and 2050 (Bruinsma 2009: 5, Table 1). In contrast to the
FAO assumptions, Keyzer et al. (2005: 194) figures higher levels of future demand:
“per capita demand for India of 11.8 kg per year (8.9 kg) in 2015 and 17.9 kg (13.8 kg)
in 2030 for the High Growth (Low Growth) scenario”, which “differs substantially
from what is implied for India by Bruinsma (2003) or explicitly projected by IFPRI
(2001) in their baseline scenario (7.4 kg)”. Due to India’s high share of world population such deviations imply large quantities.
Besides the trend towards higher overall consumption levels there has been a shift
between different meat categories. While bovine meat consumption increased by 1.1 %
per year, pork and poultry consumption increased by 2.9 % and 5.1 %, respectively,
from 1981 to 2001. According to FAO projections, future growth rates will decrease
and converge again, with annual percentage increases in demand for pork falling
slightly below the levels of beef demand, and demand growth for poultry remaining
higher (FAO, 2006: 47, Table 1).
Table 4.2:
Per Capita Consumption
of Livestock Products
in kg/year by Region
1980 and 2005
Source: FAO (2009c: 11).
Meat
Milk
Eggs
1980
2005
%
change
1980
2005
%
change
1980
2005
%
change
Developed
countries
76.3
82.1
7.6 %
197.6
207.7
5.1 %
14.3
13.0
-9.1 %
Developing
countries
14.1
30.9
119.1 %
33.9
50.5
49.0 %
2.5
8.0
220.0 %
East and
Southeast
Asia
12.8
48.2
276.6 %
4.5
21
366.7 %
2.7
15.4
470.4 %
Of which
China
13.7
59.5
334.3 %
2.3
23.2
908.7 %
2.5
20.2
708.0 %
Latin
America
and the
Carribean
41.1
61.9
50.6 %
101.1
109.7
8.5 %
6.2
8.6
38.7 %
South Asia
4.2
5.8
38.1 %
41.5
69.5
67.5 %
0.8
1.7
112.5 %
Of which
India
3.7
5.1
37.8 %
38.5
65.2
69.4 %
0.7
1.8
157.1 %
Near East
and North
Africa
17.9
27.3
52.5 %
86.1
81.6
-5.2 %
3.7
6.3
70.3 %
SubSaharan
Africa
14.4
13.3
-7.6 %
33.6
30.1
-10.4 %
1.6
1.6
0.0 %
World
30.0
41.2
37.3 %
75.7
82.1
8.5 %
5.5
9.0
63.6 %
43
4.3.2.2 Production Trends
Due to their more industrialized types of production, better feed conversion rates and
relatively shorter lifecycles compared to ruminants, which allow for faster productivity improvements, the supply response to increasing meat demand has been greater
for monogastrics (especially poultry) than for ruminants (Bouwman et al., 2005; FAO,
2009c; Naylor et al., 2005). In addition to the shift from ruminants to monogastrics,
a movement from extensive land-based towards intensive production systems has
occurred. Most of the production increases in recent decades have occurred within
intensive systems (Naylor et al., 2005; Gold, 2004). One major aspect of these systems
is that they depend to a lesser extent on local feed production, because feed use shifts
from low-value crop residues and natural pastures towards concentrate feeds that
consist of feed crops (mainly cereals) and high-quality agro-industrial by-products
(mainly oilmeals). In contrast to pasture and low-value plant residues, these are
traded on domestic and international markets and can be sourced by animal producers at the lowest prices. As a result, production becomes more independent from the
local land base (Naylor et al., 2005; FAO, 2009c). Increasing industrialization in animal production has been especially strong for pork and poultry. About 75 % of world
poultry production, more than half of pork, and over two-thirds of all egg production
now takes place in large-scale intensive production systems4 (FAO, 2009c: 27; Naylor
et al., 2005). This is mainly because of higher feed conversion rates with poultry
and pork production than with cattle (Naylor et al., 2005; FAO, 2009c; Koning et
al., 2008) and because of the feed requirement of cattle for roughage that has to be
provided locally. Consequently, the share of cattle production in intensive systems has
remained at a rather low level (FAO, 2009c: 26, Table 7).
Livestock production
is the primary driver
of deforestation
Worldwide, an estimated 470 million ha
has recently been
devoted to feed crop
production, which
amounts to about
33 % of the world’s
total cropland
4.3.3 Competition Between Food and Feed
Livestock production can make use of resources without alternative use options
(marginal lands), improve the utilization of agricultural by-products and yield a range
of other beneficial effects (see for example Bradford, 1999). Nevertheless, livestock
production increasingly relies on resources which can also be used in food crop production (Steinfeld et al., 2006; Keyzer et al. 2005). This is true not only with regard to
monogastric production in industrialized systems (which use large amounts of cereals
as feed) but also with regard to beef and milk production. The potential to expand
pasture area into marginal lands has practically reached its limits, and already
today vast areas of pasture land are being established to the detriment of valuable
and important natural ecosystems. Livestock production is the primary driver of
deforestation. Additionally, where land expansion potentials are limited, growth in
livestock production has often lead to the degradation of grazing areas due to overgrazing (Asner et al., 2004; Keyzer et al., 2005; Steinfeld et al., 2006). Furthermore,
the increasing share of animal products in the human diet will contribute to less
low-value there will be less low-value plant residues available as animal feed (Keyzer
et al., 2005). As a consequence of the scarcer availability of natural grazing area
and plant residues, and with the growing industrialization of the livestock sector, it
appears that the majority of additional production will rely on feed inputs that use
the same resources (e.g. land and water) that could instead be used for crop production or serve other important ecosystem functions. Worldwide, an estimated area of
470 million ha has recently been devoted to feed crop production, which amounts to
about 33 % of the world’s total cropland (Steinfeld et al., 2006). Alongside increasing demand for oilmeals, there will be huge demand increases for cereals, especially
maize (Bruinsma, 2009).
4
Intensive systems are defined as systems in which less than 10 % of the dry matter fed to
animals is farm-produced, and in which annual average stocking rates are above ten livestock
units per km 2 (on average at the census unit level) (Steinfeld et al., 2006).
44 | How to feed the world’s growing billions
Moreover, while a downward trend in cereal growth rates has been witnessed in the
past, leading to reduced grain/meat ratios, this trend is expected to reverse (FAO,
2006: 51).
The increasing importance of cereals for use as feed is also pointed out by Keyzer et
al. (2005), who assert that many projection models may underestimate future cereal
demand. Keyzer et al. believe that cereal/meat ratios in developing countries will
increase during the next decades rather than fall, as is commonly assumed in many
projection models, because traditional sources of animal feeds such as crop residues
and household waste are becoming more scarce.
In conclusion, there will be pressure to intensify crop and pasture production (Wirsenius
et al., 2010), with associated negative environmental effects. A reduction in meat
consumption in developed countries could be an option for increasing food availability
without putting additional strains on the environment and/or animals.
A reduction in
meat consumption
in industrialized
countries may have
several positive
effects
4.3.4 Reduction of Meat Consumption in Developed Countries
4.3.4.1 Benefits from Reduced Meat Demand in Developed Countries
There are several considerations that support efforts to reduce meat consumption in
OECD countries. Major considerations include the following:
Consumer health: In 2005/07 average per capita meat consumption (including
only poultry, beef and pork) in OECD was around 225 g/day (82.1 kg/year) (calculation
based on FAOSTAT, 2011) and is projected to increase further. From the perspective
of human health, however, significant reductions in meat consumption in the OECD
would instead be preferable (Pimentel and Pimentel, 2003; Gold 2004; McMichael et
al., 2007). The recommended maximum daily protein intake for an average person is
around 50–60 g protein per day from a mixed diet (Aiking, 2011). In light of average daily meat consumption levels of 225 g and assuming protein content in meat
of 20–30 % (Stehfest et al., 2009; Aiking, 2011), daily protein intake of meat alone
already roughly covers the recommended protein intake level. Together with the
protein intake from other animal and plant products that are being consumed, average protein intake is way above the recommended level. As a comparison, the World
Cancer Report Fund recommends around 300 g meat per week (approx. 45 g meat/
day) (EPHAC, n.d.). Curbing meat consumption in OECD countries may lead to health
benefits for the majority of the population and reduce social costs triggered by the
negative health effects of meat consumption (see for example Barnard et al. 1995, who
calculate the medical costs in the US that can be attributed to meat consumption). This
would probably not be the case in developing countries, where average consumption
levels are still low.
Environmental sustainability: Livestock, including feed production, contributes
to environmental problems which are hardly reflected in the prices of animal products. Due to increasing trade of meat and feed, environmental externalities do not
necessarily occur where the end products are consumed (Naylor et al., 2005). Instead,
increasing demands for feed and meat in one country can cause increasing environmental resource pressures and foster unsustainable land used in another country
(Steinfeld et al., 2006). Von Witzke and Noleppa (2010) show that EU net imports
of “virtually traded land” have increased substantially over the last decade, mainly
because of soybean imports used in animal feed. A decrease in meat consumption
in one part of the world may therefore ease resource pressures and environmental
degradation on a local as well as global level (e.g. less deforestation in the Amazon due
to decreasing feed and meat demands in developed countries).
45
In 2005/07 average per capita meat consumption (including
only poultry, beef and pork) in the OECD was around 225 g/
day (82.1 kg/year) (calculation based on FAOSTAT, 2011)
and is projected to increase further.
Global warming: There is increasing evidence that the livestock sector and especially cattle production contribute significantly to global GHG emissions, though
estimated amounts differ over a wide range (Steinfeld et al., 2006; Goodland and
Anhang, 2009; Fiala, 2008).
Animal feed is
increasingly
competing with the
production of food
crops that could be
used for direct
human consumption
Global food security: As described in Section 4.3.3, rising meat production as
well as the shift in feed use towards concentrate feed lead to a situation in which the
production of animal feed is increasingly competing with the production of food crops
that could be used for direct human consumption (FAO, 2009c). This has the effect
of increasing food prices for animal as well as plant products (as analyzed in detail in
Section 4.3.5 below).
4.3.4.2 Taxing Meat Consumption
In Section 4.3.5, we analyze the potential effects of a 30 % decrease in OECD meat
consumption levels. Such a demand change could be reached via changes in consumer
attitudes, which could be supported by political measures such as consumer awareness campaigns and nutritional education in schools, as well as price policies such as
consumption or production taxes. In the long run, factors such as the development of
more attractive meat substitutes may also make a contribution (Smil, 2002).
If the main aim of reducing meat consumption is to improve human health, a consumer tax would have two important advantages over a producer tax: First, it addresses
the issue of “health effects” more adequately, as it would not allow for switching from
more expensive home produced (and taxed) products to non-taxed imports. Second, it
is likely easier to implement.
A producer tax, on the other hand, would be a more adequate instrument in order to
internalize external costs that arise from negative environmental effects connected
with livestock production that are not reflected in the current price levels. A producer
tax would, however, result to some extent in foregone production in industrialized
countries being replaced by imports which would lead to a lower achievement of
policy objectives related to global environmental goods such as a reduction in GHG
emissions.52On the other hand, one should take into account that animal production
today is substantially more supported in most industrialized countries than crop production (OECD, 2010), which results in animal production being distorted in favour of
producers in developed countries.
Several authors have discussed a tax on livestock products (or production): Goodland
(1997) suggests that a differentiated tax scheme on animal products could improve
the diets of the rich, increase food availability for the poor and reduce adverse environmental impacts such as the excessive use of resources and pollution inherent to
livestock production. Wirsenius (2008) proposes the introduction of a differentiated
consumption tax on animal products as a climate policy instrument. Gonzáles-Zapata
et al. (2009) discuss a tax on “obesity-promoting foods” within the context of fighting
obesity in Europe. Though they do not mention the taxation of animal products specifically, it can be assumed that certain animal products, being high in saturated fats,
are among those that contribute to obesity, as suggested by Preker (2002). A report by
Goodman (2006) includes a critical evaluation concerning the effectiveness of a tax to
reduce the consumption of saturated animal-based fats in order to reduce obesity. The
report includes a short overview of some modelling studies that analyzed the effectiveness of economic instruments to influence food consumption.
5
For options to compensate for such a replacement of domestic by imported production see Grethe (2007).
48 | How to feed the world’s growing billions
Lelieveldt (2010) illustrates how the option of a “meat tax” in order to combat Green
House Gas Emissions has so far been received among politicians, the media and
public.
Lower meat demand
in OECD countries,
would involve lower
global meat prices,
less global meat
production, more
meat consumption in developing
countries, less feed
demand and lower
global feed prices
In considering whether it is preferable to achieve changes in meat consumption via taxes or via changes in consumer awareness, it has to be noted that human food consumption involves complex behavioural processes and that efforts to induce consumption
changes in food bear risks. Meat products do not only contain health damaging components, but contain important nutrients and vitamins in highly concentrated forms. In
order to achieve positive health effects from lower meat consumption, it is important
that substitution takes place with food that is healthy and nutritionally adequate to
compensate for the forgone meat consumption (Haddad, 2003; Powell and Chaloupka,
2009). Research is needed to analyze the effectiveness of pricing health adverse food
categories (Thow et al., 2010). Most preliminary research suggests that a mixture of
different political instruments might be the way to steer consumption changes in a
desired direction. These may include the combination of food taxes on health adverse
food categories (Powell and Chaloupka, 2009; Thow et al., 2010) and other measures
such as consumer information campaigns and health labelling, or the introduction of
healthy meals in public institutions such as schools (Tukker et al., 2009).
The effects of lower meat demand in OECD countries, which are analyzed in the following section, include lower global meat prices, less global meat production, more
meat consumption in developing countries, less feed demand and lower global feed
prices, as well as more consumption of crop products in developed countries and
potentially also in developing countries.
4.3.5 Quantifying Effects of Lower Meat Consumption in Developed
Countries on Global Food Balances
4.3.5.1 Literature Review
Several studies have tried to assess the effects of lower meat demand in developed
countries on global food markets based on spreadsheet calculations or quantitative
simulation models. Analyses differ widely due to discrepancies in the employed base
period, projection horizon, model type and scenario specifications. As a result, they
are difficult to compare.
Rosegrant et al. (1999) project developments on global agricultural markets up to
2020 based on the partial equilibrium model IMPACT. In addition to a reference
scenario, they run a scenario in which they assume an exogenous decline in meat
demand in developed countries by 70 % compared to the reference scenario in 2020.
In addition, an exogenous increase in cereal consumption is assumed in order to keep
the overall energy balance of consumers in developed countries constant. Results of
the study compared to the reference scenario show a decline in global meat prices by
20–30 %, a decline in global meat supply by 13 %, and an increase in meat demand in
developing countries by 13 %. Due to falling feed demand, coarse grain prices decline
by up to 10 %, but the rice price stays constant and the wheat price even increases by
1.5 %. Finally, per capita demand for cereals in developing countries remains almost
constant. In conclusion, the effect on average calorie consumption in developing
countries is positive (+0.8 %) but small.
Two other studies project effects of a shift towards less meat focused diets and base
their reference scenarios on FAO projections: Stehfest et al. (2009) and Wirsenius
et al. (2010). Both studies display effects on changes in area use, but not on food
consumption and food security.
49
Stehfest et al. (2009) use the IMAGE modelling framework and simulate a scenario
in which they assume a globally uniform meat diet of about 93 grams of meat per
capita per day (~34 kg/yr), leading to an increase in consumption levels in developing
countries and a decrease in developed ones.
In total, global meat consumption decreases by 37 % by 2050 compared to the reference situation. Total agricultural area use declines by 42 % for pasture land and by 9 %
for crop land.
Wirsenius et al. (2010) use the Albio model to simulate a scenario in which about 20 %
of global ruminant consumption is replaced by poultry and pig consumption. As a
result, total agricultural area use declines by 14 % for pasture land and by 2.3 % for
crop land, compared to a reference scenario which includes a higher productivity of
livestock production than FAO projections. Additional scenarios include a reduction
in total meat consumption, but are combined with reductions in postharvest losses
such that results cannot be attributed to the reduced meat demand alone.
In conclusion, these studies suggest that a reduction in meat, and especially beef
consumption, lowers the demand for agricultural area, even if calorie consumption
is kept constant. They also find strong effects on pasture area and comparably low
effects on cereal area. Only the Rosegrant et al. (1999) study assesses the effects on
global agricultural prices and food demand in developing countries and finds the
effects on calorie availability in developing countries to be small, but positive. This
is because the effects on prices for cereals are small. In contrast, price effects for
meat are substantial and lead to a higher protein availability from meat in developing
countries.
4.3.5.2 Quantitative Analysis
In order to get an impression of the extent to which declining meat consumption
could enable additional food production, we analyzed the impact that a reduction in
meat (beef, poultry and pork) consumption in OECD countries by 30 % would have on
world food balances. Such a reduction could be attained through various measures,
including the implementation of a consumption tax on meat along with consumer
awareness campaigns. For simplicity, these illustrative calculations are done for the
years 2005/07, the base year of the FAO projections.
The daily average meat intake (only accounting for poultry, pork and beef) in OECD
countries in 2005/07 was ~225 g/day, which amounted to an annual meat consumption of around 102 million tonnes. We assumed a 30 % demand decrease for each
meat category resulting in a total meat reduction of 30.6 million tonnes per year and a
reduction of per capita meat consumption by about 70 grams per day (Table 4.3).
Table 4.3:
OECD Base Year (2005/07)
Meat Consumption and
Consumption Change
Source: FAOSTAT (2011),
own calculations.
Beef
Pork
Poultry
Total
Meat
Base consumption (million tonnes/year)
27.9
37.6
36.5
102.1
Consumption change (million tonnes/year)
-8.4
-11.3
-11.0
-30.6
Base consumption (g/capita/day)
61.5
82.8
80.4
224.7
Consumption change (g/capita/day)
-18.4
-24.8
-24.1
-67.4
Percentage change
-30 %
-30 %
-30 %
-30 %
50 | How to feed the world’s growing billions
A 30 % decrease in
meat consumption
in OECD countries
would set free
30 million ha
of cropland
Table 4.4:
Assumed Feed Demand
per kg of Meat,
Crop Yields, Changes in
Crop Demand and Crop
Land Set Free
Sources: Feed demand:
own composition based
on Banse et al. (2005);
Bouwmann et al. (2005);
FAOSTAT (2011); Steinfeld
et al. (2006). Crop yields:
FAOSTAT (2011). Changes
in human demand and
area: own calculations. For
more detailed information
see Duman (2011).
Based on assumptions concerning feed rations and crop yields (see Table 4.4), the
estimated amount of feed and corresponding areas that are set free by the reduction of meat production can be calculated. These effects are, however, reduced when
considering that the reduced meat consumption is offset by an increase in other food
products in human diets. It is assumed here that offsetting occurs through by higher
demand for plant products (pulses, cereals, roots and soybeans), ensuring that the
decrease in protein and energy intake from meat is roughly compensated for. Milk
and egg consumption levels are assumed to be constant.
The net effect of reduced meat production, taking into account additional food crop
production for dietary compensation, is illustrated in Table 4.4. The main effects
on crop production arise from changes in cereals (around 85 million tonnes) and
oilmeals (around 25 million tonnes) which make up the main part of concentrate
feed. For pulses, roots and soybeans the additional demand for human consumption
exceeds the reduced demand in feed (this, however, depends on the assumptions
regarding substitution in human diets), resulting in higher land use.
Cereals
Soybeans
Pulses
Roots
Oilmeals
Human Demand Change
(million tonnes/year)
6.813
6.813
9.084
9.084
0
Ratio of feed (kg)
to meat (kg)
3.080
0.000
0.054
0.190
0.887
Feed Demand Change
(million tonnes/year)
-94.294
0.000
-1.642
-5.814
-27.159
Net Demand Change
(million tonnes/year)
-87.482
6.813
7.441
3.270
-27.159
Crop Yields (tonnes/ha)
Area Set Free (million ha)
5.500
2.500
1.700
27.000
1.400
15.906
-2.725
-4.377
-0.121
19.400
When adding up the area change resulting from the change in crop production as illustrated in Table 4.4, one can conclude that approximately 30 million ha of crop land
would be set free that could be used for alternative food production. This would correspond to about 2 % of global arable and permanent cropland. This finding, however,
is subject to several qualifications:
Land set free from decreased feed demand for cereals, pulses and roots can be used
for alternative food production purposes. But this is not the case for oilmeals which
are a co-product of plant oil production. Both oilmeal and plant oil production yield
similar revenues (while 1 kg of soybeans yields around 20 % oil, the oil price per kg is
about 3 times that of 1 kg of oilmeals). (Nonhebel, 2004). Supply reactions in oilseeds
will therefore depend on demand for plant oils. As a consequence, a decrease in
demand for oilmeals by a certain percentage will not translate into the same percentage change in oilcrop production. In the case of low demand elasticities for plant oils
(low price reactions by consumers) and continued strong demand for vegetable oils it
is likely that the supply quantities of oilmeals will not be affected much and only little
area would be released for alternative uses. Due to a lower feed demand, however,
prices for oilmeals would drop and the share of oilmeals in feed rations might increase. This effect may further reduce the demand for other feed crops such as cereals
that are in direct competition with resources used for food production.
51
One important aspect not considered so far is the effect on permanent pasture aarea.
This effect, however, is difficult to estimate. There are great variations in pasture
qualities, yields and use intensities (Bouwmann et al., 2005; Steinfeld et al., 2006),
but there are only very limited data (Wirsenius et al., 2010). However, a significant
amount of pasture area is hardly suitable for food crop production. Steinfeld et al.
(2006: 37) classify 60 % of all pasture land as “extensive pasture in marginal areas”.
In developed countries, this category comprises even 80 % of pasture area. Thus, a
substantial part of the pasture area calculated to be “set free”, but having no other
lucrative use options, might therefore still stay in animal production. This would increase the share of forage in the average feed rations and thus reduce the use of other
feed crops in ruminant production. Moreover, to some extent these marginal areas
could serve other valuable purposes not directly related to food production. Stehfest
et al. (2009) estimate that around 50 % of global extensive and intensive grassland
area could constitute important carbon sinks if reverted from managed grazing land
to natural vegetation such as forests, woodland, savannah or scrubland.
More generally, it has to be said that predicting and quantifying effects from reduced
meat demand is not as straightforward as the previous calculations would suggest. Effects are complex and strongly depend on supply and demand interactions.
Therefore, the results illustrated in Table 4.4 cannot do more than give an indication
of their order of magnitude.
There are numerous complex and interrelated adjustment processes, for example:
»» Substitution processes in human demand play a significant role in determining
the effects of reduced meat consumption. For example, if it is assumed that milk
and eggs play a role in compensating for reduced meat consumption, the resulting
effects are smaller.
»» Reduction rates may differ among meats: If the meat reduction percentage is
assumed to be greater for ruminant meat and smaller for monogastric meat, the
resulting changes on resource use are larger, as ruminant meat needs relatively
more feed and land per kg of output.
»» OECD countries are not isolated from the rest of the world and agricultural production and consumption is part of a global system in which market forces come
to play. A decrease in meat demand in OECD countries has effects on international food commodity and agricultural input prices, which in turn induce global
changes in demand as well as in production processes for various agricultural
products.
In order to address these shortcomings to a certain extent, an economic equilibrium
model with fully elaborated supply and demand functions can give further insights.
Such a partial equilibrium model in a very rudimentary form has been developed for
this study. It consists of isoelastic supply and demand functions for five plant and
five livestock products and market clearing conditions (for a full documentation see
Duman, 2011).
52 | How to feed the world’s growing billions
The plant products covered are cereals, roots, pulses, oilmeals and grass. Feed demand functions are specified for all plant products; human demand only exists for cereals, roots and pulses. Animal products comprise beef, poultry, pork, eggs and milk.
The world is divided in two country aggregates: OECD member states and an aggregate of all other countries, called “rest of the world” (ROW). The model is calibrated to
correspond to FAOSTAT (2011) data for the three year average of 2005/07. Time is not
considered and the model solves comparative static equilibria for the base situation
2005/07. In order to simulate the effects of reduced meat demand, a tax is imposed on
all meat products in OECD countries at a level such that demand decreases for each
of them by 30 %. Due to a system of symmetric cross price elasticities, higher meat
prices result in more plant product consumption such that overall calorie and protein
intake is maintained. Core results compared to the base situation comprise:
»» World market prices for pork and poultry decrease by 13 % and for beef by
18 %; cereal and root prices fall by 10 %, while the price of pulses increases by 11 %.
»» Consumption changes in the ROW:
»» Due to lower world meat prices, overall meat consumption rises by 5 % (~4 % in
pork and poultry and 7.5 % in beef).
»» Cereal demand increases by 2.6 % and root demand stays constant.
Consumption of pulses falls by abaut 5 %.
»» Consumption changes in the OECD:
»» The 30 % meat demand reduction is compensated for by an increase in cereal
(5 %), root (6.5 %) and pulse (160 %) consumption.
»» Change in aggregate world production:
»» Meat production falls by 9.6 % (11.1 % in poultry, 8.7 % in pork, 9 % in beef).
»» Cereal production decreases by 1 %, production of pulses increases by 5.3 % and
that of roots decreases by ~1 %.
Thus, a main conclusion is that the 30 % decrease in meat consumption in OECD
countries results in lower world market prices for meat and thus increased meat
demand in the ROW. Therefore, not all cereals which are theoretically set free by consumption changes in the OECD according to our previous calculations (Table 4.4) will
be available for direct human consumption. As a consequence, the effect on cereal
prices and increased cereal consumption in the ROW are small, which is in line with
the simulations by Rosegrant et al. (1999). ROW consumers do, however, benefit from
higher protein supply from meat products. Moreover, with world production of meat
decreasing by almost 10 %, environmental pressures would be reduced.
53
4.3.6 Conclusions
Lower meat consumption in developed countries would substantially impact the 70 %
PI figure for two reasons:
»» The FAO study forecasts a quantitative increase in global meat production of 85 %.
This makes a significant contribution to the overall 70 % increase in two ways:
First, the 85 % increase is disproportionately large in magnitude. Second, meat
products are of higher value than most other food commodities. Due to this, a
change in meat consumption would have a larger impact on the necessary production increase than a same quantitative change in plant products.
»» Moreover, alongside less meat production there would be less crop demand, in the
event the value increase in food crop demand is smaller than the value decrease
resulting from decreased feed demand. This would decrease the necessary
increase in crop production until 2050 and further reduce the projected increase
of 70 %.
In order to show the effect of lower meat demand in developed countries on the
required increase in global meat production, Table 4.5 illustrates the required meat
production increases to 2050 when meat demand is reduced by 30 % relative to
2005/07 in developed countries compared to the reference scenario developed by
Bruinsma (2009).
2005/07
Table 4.5:
Effect of a 30 % Meat
Demand Decrease in
Developed Countries on
2050 Meat Balance
Source: own calculations
base on Bruinsma (2009),
FAO (2009c), Alexandratos
(2009).
The effect of lower
meat demand in
developed countries
on the global world
food balance would
be substantial. But
the effect on food
security in developing
countries would be
relatively small
2050
Scenario 1 (FAO)
Scenario 2
Change
relative to
2005/07
Per capita meat demand in
developed countries (kg/yr)
Change
relative to
2005/07
77.1
95.7
24.0 %
57.5
-25.4 %
Total meat demand in developed countries (million t)
103.0
130.0
26.6 %
78.0
-24.0 %
Global meat demand (million t)
249.0
462.0
85.0 %
412.0
65.6 %
FAO projections foresee an increase in per capita meat demand in developed countries by 24 % between the base year and 2050. Assuming instead that per capita meat
demand based on 2005/07 levels will decrease by 30 % and remain at this level up to
2050 would result in 40 % lower meat demand in developed countries (78 million t instead of 130 million t) than foreseen by the FAO for 2050. Thus, instead of 462 million
t of meat, only 412 million t would have to be produced globally (without considering
that part of the demand change in developed countries might be counterbalanced by
increasing meat demand in developing countries, as described in Section 4.3.5.2).
As a consequence the global meat balance would be improved, with necessary meat
production growth by 2050 of 65.6 % instead of 85 %.
In conclusion, the effect of lower meat demand in developed countries on the global
world food balance would be substantial. But the effect on food security in developing
countries would be relatively small, because crop prices would fall only slightly due to
increasing meat demand in developing countries as a response to lower prices.
54 | How to feed the world’s growing billions
Curbing meat consumption in OECD countries may produce health benefits for the majority of
the population and reduce social costs associated with the negative health effects of meat consumption. This would probably not be the case in developing countries, however, where average
consumption levels are still low.
5. Conclusion
Concerning the first objective of our study – namely, to clarify the methods used
and assumptions made in projecting the 70 % PI figure – we conclude that the FAO
projections are based on solid analysis and a high amount of expert knowledge and
country specific data. Furthermore, they are roughly in line with projections by other
institutions. Due to the intransparent presentation and insufficient documentation of
assumptions and methodology, however, it is almost impossible to trace the results in
light of the assumptions made. As many of the assumptions are unknown, it is impossible to evaluate their validity in comparison to any alternatives. For example, it is not
clear to what extent the FAO takes into account increasing demand for bioenergy.
Poverty is the main
reason for food
insecurity.
Assumptions on average global income growth rates for 2030 to 2050 are high
compared to the past and may have resulted in an overestimation of future demand.
On the other hand, the effects of climate change are not yet considered in the projection of global supply, and these effects are expected to put further pressure on the
world food balance. Our second objective was discuss the implications of the 70% PI,
especially whether and to what extent an increase in global agricultural production
would contribute to reducing hunger. We conclude that undernourishment is not a
problem of global food availability, but rather of access to food. Furthermore, in the
overwhelming majority of cases it is economic access to food that stands in the way of
food security. Clearly, poverty is the major reason why food insecurity persists.
Nonetheless, improving the global world food balance is of importance in order to
prevent global food prices from increasing to a level that leads to increasing food
insecurity and poverty for people who spend a high share of their income on food. In
tackling this objective, efforts to increase global production should be complemented
and balanced with other strategies for improving the world food balance, including
eliminating bioenergy subsidies, reducing postharvest losses and reaching a lower
meat share in food consumption in developed countries.
Thus, increasing agricultural production, reducing food losses or decreasing demand
in regions with a low prevalence of undernourishment are only likely to have indirect
and limited impacts on the prevalence of hunger. An increase in agricultural production or reduction in postharvest losses is of importance mainly within the regions
subject to food insecurity. In these regions it can have the dual benefit of lowering
prices and increasing food availability for food purchasers while also generating
additional income for food producers. Thus, what is needed is investment in rural
infrastructure, agricultural research and public services, as well as efforts to improve governance systems and institutions which allow markets to work within food
insecure regions. Finally, efforts focussing on poverty reduction are most important,
including improving the ability of the poor to access education, land, employment
and other income sources as well as to public services such as social safety nets and
medical care.
Our third and final objective was to analyze the extent to which changes in other
variables (composition of food consumption, post harvest losses, use of biomass for
energy production, etc.) – variables which are also subject to the impact of potential
policies – may contribute to meeting increasing global demand for food. We conclude
that the opportunities for alternative or complementary measures are manifold. The
reduction of subsidy-supported biofuel demand, minimization of postharvest losses
and consumption of less animal products in industrialized countries should also
be considered and may be more sustainable measures for improving the world food
balance.
56 | How to feed the world’s growing billions
The production of certain forms of bioenergy such as liquid fuels in the US and EU
has significant indirect land use effects and could even increase global GHG emissions if these effects are taken into account. Political support for first generation
biofuels should therefore be ended. This could be easily implemented and would have
direct and significant effects on the world food balance.
Various studies suggest that there is significant scope and need for reducing postharvest losses in developing and developed countries due to the sheer volume of such
losses: Current postharvest loss levels are estimated at 20–50 %, with supply chain
losses representing the dominant form of loss in developing countries and food waste
at the retail and household levels dominating in industrialized countries. Regarding
the objective of achieving food security, reducing postharvest losses in food insecure
regions. This, in turn, would increase food availability while also generating income
along supply chains.
Without more systematic research on the extent of losses, measuring progress against
any global reduction target is impossible. Nonetheless, there are compelling arguments in favour of tackling postharvest losses, despite the lack of reliable data.
Lowering meat demand in industrialized countries would have positive effects on human health and environmental goods. Furthermore, it would result in lower climate
gas emissions and ease the introduction of higher animal welfare standards. Finally,
reduced meat consumption would improve the world food balance and result in substantially lower meat prices and slightly reduced cereal prices.
The resulting effect on food security, however, is likely to be small since lowering
meat consumption in industrialized countries leads to lower meat prices, which in
turn triggers more meat consumption elsewhere. The effect on basic staple food prices
is therefore low.
Livestock, including feed
production, contributes
to environmental problems to an extent hardly
reflected in the prices of
animal products.
57
References
Adhikari, B. K., Barrington, S., Martinez, J. (2006): Predicted growth of world urban food waste
and methane production. Waste Management & Research, 24(5): 421–433.
Aidoo, K. E. (1993): Post-harvest storage and preservation of tropical crops. International
Biodeterioration & Biodegradation, 32(1–3): 161–173.
Aiking, H. (2011): Future protein supply. Trends in Food Science & Technology, 22 (2–3): 112–120.
Aksoy, M. A., Isik-Dikmelik, A. (2008): Are low food prices pro-poor? Net food buyers and sellers
in low-income countries. Policy Research Working Paper Series No. 4642, The World Bank.
Alexandratos, N. (2009): World food and agriculture to 2030/50. Highlights and views from mid2009. Paper presented at the FAO Expert Meeting, 24–26 June 2009, Rome, on “How to Feed
the World in 2050” (revised 25 July 2009).
Alexandratos, N. (ed.) (1995): World Agriculture: Towards 2010, an FAO Study. J. Wiley and
Sons, Chichester, UK and FAO, Rome.
Ambler-Edwards, S., Bailey, K., Kiff, A., Lang, T., Lee, R., Marsden, T., Simons, D., Tibbs, D.
(2009): Food Futures: Rethinking UK Strategies A Chatham House Report. Chatham House.
Asner, G. P., Elmore, A. J., Olander, L. P., Martin, R. E., Harris, A. T. (2004): Grazing Systems,
Ecosystem Responses, and Global Change. Annual Review of Environment and Resources,
29: 261–299.
AtlasFram Group (2010): Demands for food will require intensification. Press Release of March
12, 2010. http://atlasfram.co.uk/content/NewsItem.aspx?id=32.
Banse, M., Grethe, H. (2008): Effects of the New Biofuel Directive on EU Land Use and
Agricultural Markets. Contributed paper at the EAAE-Seminar Modelling Agricultural and
Rural Development Policies, 31. Januar–1. Februar 2008, Seville, Spain.
Banse, M., Grethe, H., Nolte, S. (2005): European Simulation Model (ESIM) in GAMS: Model
Documentation. Model Documentation prepared for DG AGRI, European Commission,
Göttingen and Berlin.
Banse, M., Tabeau, A., Woltjer, G., van Meijl, H. (2008): Will Biofuel Policies Affect Global
Agricultural Markets? European Review of Agricultural Economics 35(2): 117–141.
Barnard, N. D., Nicholson, A. N., Howard, J. J. (1995): The Medical Costs Attributable to Meat
Consumption. Preventive Medicine, 24: 646–655.
Beede, D. N., Bloom, D. E. (1995): The Economics of Municipal Solid Waste. The World Bank
Research Observer, 10(2): 113–150.
Bender, W. H. (1994): An end use analysis of global food requirements. Food Policy, 19(4):
381–395.
Bourne, M. C. (1977): Post Harvest Food Losses – the neglected dimension in increasing the
world food supply (Mimeograph). Geneva, New York: Cornell University. Available at http://pdf.
usaid.gov/pdf_docs/PNAAE321.pdf
Bouwman, A. F., Van der Hoek, K. W., Eickhout, B., Soenario, I. (2005): Exploring changes in
world ruminant production systems. Agricultural Systems, 84: 121–153.
Boxall, R. A. (2001): Post-harvest losses to insects – a world overview. International
Biodeterioration & Biodegradation, 48: 137–152.
Brabeck-Letmathe, P. (2009): cited in http://www.spiegel.de/spiegel/print/d-19120464.html.
Bradford, G. E. (1999): Contributions of animal agriculture to meeting global human food
demand. Livestock Production Science, 59: 95–112.
Bridges, G. (2008): If we want to feed the world, we must go GM. The Telegraph, August 13,
2008. http://www.telegraph.co.uk/comment/personal-view/3561413/If-we-want-to-feed-theworld-we-must-go-GM.html.
Bruinsma, J. (2009): The Resource Outlook to 2050: By how much Do Land, Water and Crop
Yields Need to Increase by 2050? Paper presented at the FAO Expert Meeting, 24–26 June
2009, Rome, on “How to Feed the World in 2050”.
Bruinsma, J. (ed.) (2003): World Agriculture: Towards 2015/2030 – An FAO Perspective.
Earthscan, London and FAO, Rome.
Dixie, G. (2005): Horticultural marketing. Rome: FAO Agricultural Support Systems Division.
Available at http://www.fao.org/docrep/008/a0185e/a0185e0a.htm#bm10
Dowler, E. A. (1977): A pilot survey of domestic food wastage. International Journal of Food
Sciences and Nutrition, 31(3): 171–180.
58 | How to feed the world’s growing billions
Duman, N. (2011): Implications of Reduced Demand for Livestock Products in OECD Countries
for the World Food Balance: A Partial Equilibrium Analysis. MSc-Thesis, Fachgebiet Agrarund Ernährungspolitik, Universität Hohenheim.
Elferink, E. V., Nonhebel, S. (2007): Variations in land requirements for meat production.
Journal of Cleaner Production, 15: 1778–1786.
EPHAC (European Public Health And Agriculture Consortium) (n.d.): Towards a healthier, more
sustainable CAP. European Public Health and Agriculture Consortium (EPHAC) position on
“The Future of the Common Agricultural Policy”.
ERS (2011): Feed Grains Database. http://www.ers.usda.gov/Data/FeedGrains/
FAO (2006): World Agriculture: Towards 2030/2050 – Interim Report. Rome, FAO Global
Perspective Studies Unit.
FAO (2008): Address by Jacques Diouf, Director-General of the Food and Agriculture
Organization of the United Nations, at the ‘FAO High-Level Conference on World Food
Security: The challenges of climate change and bioenergy’, Rome, 3/6/08. http://www.fao.org/
foodclimate/conference/statements/en/
FAO (2009a): How to Feed the World in 2050. Rome.
FAO (2009b): 2050: A third more mouths to feed. Food production will have to increase by
70 percent – FAO convenes high-level expert forum. http://www.fao.org/news/story/en/
item/35571/icode/
FAO (2009c): The State of Food and Agriculture. Livestock in the balance. Available at: http://
www.fao.org/docrep/012/i0680e/i0680e00.htm.
FAO (2010): The State of Food Insecurity in the World, Addressing food insecurity in protracted
crises. Rome.
FAO (various issues): The State of Food and Agriculture. Rome.
FAO. (n. d.). The impact of post-harvest handling losses. Food and Agriculture Organisation
of the United Nations. Available at http://www.fao.org/es/esc/common/ecg/227/en/postharvest_web.pdf
FAOSTAT (2011): FAO Statistical Databases & Data-sets. Available at: http://faostat.fao.org/
default.aspx
Fiala, N. (2008): Meeting the demand: An estimation of potential future greenhouse gas emissions from meat production. Ecological Economics, 67(3): 412–419.
Financial Times (2008): UN food chief seeks tenfold rise in aid. June 1, 2008, http://www.ft.com/
cms/s/0/b82be35c-3013-11dd-86cc-000077b07658.html#ixzz1BpCLQyG7.
Fischer, G. (2009): World Food and Agriculture to 2030/50: How do climate change and bioenergy alter the long-term outlook for food, agriculture and resource availability? Paper at the
Expert Meeting on How to Feed the World in 2050, Food and Agriculture Organization of the
United Nations, Economic and Social Development Department.
Garnett, T. (2008): Cooking up a storm: Food, greenhouse gas emissions and our changing climate. Food Climate Research Network. Available at: http://www.fcrn.org.uk/fcrnPublications/
publications/PDFs/CuaS_web.pdf
Gold, M. (2004): Global benefits from eating less meat. A report by Compassion in World
Farming Trust.
Goletti, F. (2003): Current status and future challenges of the postharvest sector in developing
countries. Acta Hort., 628: 41–48.
Goletti, F., Wolff, C. (1999): The impact of postharvest research. International Food Policy
Research Institute, Washington, DC, MSS Discussion Papers, 29. Available at: http://www.
ifpri.org/sites/default/files/publications/pubs_divs_mtid_dp_papers_dp29.pdf
Gonzalez-Zapata, L. I., Alvarez-Dardet, C., Millstone, E., Clemente-Gómez, V., Holdsworth,
M., Ortiz-Moncada, R., Lobstein, T., Sarri, K., de Marchi, B., Horvath, K. Z. (2009): The
potential role of taxes and subsidies on food in the prevention of obesity in Europe. Journal of
Epidemiology & Community Health, 64: 696–704.
Goodland, R. (1997): Environmental sustainability in agriculture: diet matters. Ecological
Economics, 23: 189–200.
Goodland, R., Anhang, J. (2009): Livestock and Climate Change. Worldwatch Institute. http://
www.worldwatch.org/node/6294.
59
Goodman C, Anise A (2006): What is known about the effectiveness of economic instruments to
reduce consumption of foods high in saturated fats and other energy-dense foods for preventing and treating obesity? Copenhagen, WHO Regional Office for Europe (Health Evidence
Network report; http://www.euro.who.int/document/e88909.pdf, accessed 26.11.2010).
Grethe, H. (2007): High Animal Welfare Standards in the EU and International Trade – How to
Deal with Potential “Low Animal Welfare Havens”? Food Policy, 32(3): 315–333.
Grolleaud, M. (2002): Post-Harvestlosses: discovering the full story. Overview of the phenomenon of losses during the Post-harvest System. Rome: FAO. Available at http://www.fao.org/
docrep/004/AC301E/AC301E00.HTM
Haddad, L. (2003): Redirecting the Diet Transition: What Can Food Policy Do? Development
Policy Review, 21(5–6): 599–614.
Hall, K. D., Guo, J., Dore, M., Chow, C. (2009): The Progressive Increase of Food Waste in
America and Its Environmental Impact. PLoS ONE, 4(11), e7940.
Heidhues, F. (2008): Welternährung – Ernährungssicherheit bei rasch wachsender
Bevölkerung. In: Online Handbuch Demographie. Berliner Institut.
Heyes, J. (2003): Post-Harvest Action: The Global Postharvest Forum. Acta Hort., 628. 55–61.
Hoffmann, V. (2009): What You Don’t Know Can Hurt You: Micronutrient Content and Fungal
Contamination of Foods in Developing Countries. Agricultural and Resource Economics
Review, 38(2): 100–108.
IAASTD (2009): Agriculture at a Crossroads. Washington DC: International Assessment of
Agricultural Knowledge, Science and Technology for Development (IAASTD).
IFAD (2010): Governing Council 2010: High-Level Panel. From summit resolutions to farmers’
fields: Climate change, food security and smallholder agriculture.
IMF (2010): World Economic Outlook Databases. http://www.imf.org/external/ns/cs.aspx?id=28.
Ivanic, M., Martin, W. (2006): Potential Implications of Agricultural Special Products for Poverty
in Low-Income Countries. Draft World Bank paper, October, 16.
Kader, A. A. (2004): Increasing food availability by reducing postharvest losses of fresh produce. In V International Postharvest Symposium, 682: 2169–2176.
Kantor, L. S., Lipton, K., Manchester, A., Oliveira, V. (1997): Estimating and addressing
America’s food losses. Food Review, 20(1). 2–12.
Kelman, A. (1989): Introduction: The importance of research on the control of postharvest
diseases of perishable food crops. Annual Review of Phytopathologie, 16: 321–341.
Keyzer, M. A, Merbis, M. D., Pavel, I., van Wesenbeeck, C. F. A. (2005): Diet shifts towards
meat and the effects on cereal use: can we feed the animals in 2030? Ecological Economics,
55(2): 187–202.
Koning, N. B. J., van Ittersum, M. K., Becx, G. A., van Boekel, M., A. J. S., Brandenburg, W.
A., van Den Broek, J. A., Goudriaan, J., van Hofwegen, G., Jongeneel, R. A., Schiere, J. B.,
Smies, M. (2008): Long-term global availability of food: continued abundance or new scarcity?
NJAS-Wageningen Journal of Life Sciences, 55(3): 229–292.
Lelieveldt, H. (editor) (2010): What’s on the menu? A comparative analysis of the agenda-setting
dynamics of sustainable meat and fish in four European countries. Middelburg: Roosevelt
Academy.
Lundqvist, J., de Fraiture, C., Molden, D. (2008): Saving Water: From Field to Fork – Curbing
Losses and Wastage in the Food Chain. SIWI Policy Brief. Stockholm: Stockholm International
Water Institute (SIWI).
MailOnline (2010): Veggies are wrong and eating less meat will NOT save planet
Available at: http://www.dailymail.co.uk/news/article-1259867/Veggies-wrong-eating-meatNOT-save-planet.html.
Marlow, H. J., Hayes, W. K., Soret, S., Carter, R. L., Schwab, E. R., Sabaté, J. (2009): Diet
and the environment: does what you eat matter? American Journal of Clinical Nutrition, 89:
1699–1703.
McMichael, A. J, Powles, J. W., Butler, C. D. Uauy, R. (2007): Food, livestock production,
energy, climate change, and health. The Lancet, 370:1253–1263.
Millennium Ecosystem Assessment (MA) (2005): Ecosystems and human wellbeing: Volume 2:
Scenarios. Island Press, Washington DC.
Moeller, T., and Grethe, H. (2010): Climate Change and Agriculture in 2050: Assessing
Prospects for European Cereal and Oilseed Markets. Contributed paper at the AAEA annual
meeting, 25–27 July 2010, Denver, Colorado, USA.
60 | How to feed the world’s growing billions
Mrema, G. C., Rolle, R. S. (2003): Status of the postharvest sector and its contribution to
agricultural development and economic growth. Value-Addition to Agricultural Products, 13:
2169–2175.
Msangi, S., Rosegrant, M. (2009): World Agriculture in a Dynamically-Changing Environment:
IFPRI’s Long-Term Outlook for Food and Agriculture under Additional Demand and
Constraints. Paper presented at the FAO Expert Meeting, 24–26 June 2009, Rome, on “How
to Feed the World in 2050”National Academy of Sciences (NAS) (1978): Postharvest food
losses in developing countries. Washington DC. http://pdf.usaid.gov/pdf_docs/PNAAG239.pdf
Naylor, R., Steinfeld, H., Falcon, W., Galloway, J., Smil, V., Bradford, E., Alder, J., Mooney, H.
(2005): Losing the links between livestock and land. Science, 310: 1621–1622.
Nellemann, C., MacDevette, M., Manders, T., Eickhout, B., Svihus, B., Prins, A. G., Kaltenborn,
B. P. (Eds) (2009): The environmental food crisis – The environment’s role in averting future
food crises. A UNEP rapid response assessment. United Nations Environment Programme,
GRID-Arendal, Norway.
Nelson, G., Rosegrant, M., Koo, J., Robertson, R., Sulser, T., Zhu, T., Ringler, C., Msangi,
S., Palazzo, A., Batka, M., Magalhaes, M., Valmonte-Santos, R., Ewing, M., Lee, D. (2009):
Climate Change-Impact on Agriculture and Costs of Adaptation. International Food Policy
Research Institute, Food Policy report, Washington DC.
Nonhebel, S. (2004): On resource use in food production systems: the value of livestock as
“rest-stream upgrading system”. Ecological Economics, 48:221–230.
OECD (2006): Agricultural Market Impact of Future Growth in the Production of Biofuels. AGR/
CA/APM(2005)24/FINAL. OECD, Paris.
OECD (2010): Producer and Consumer Support Estimates Database. Paris
Parfitt, J., Barthel, M., Macnaughton, S. (2010): Food waste within food supply chains: quantification and potential for change to 2050. Philosophical Transactions of the Royal Society B:
Biological Sciences, 365(1554), 3065–3081. Available at http://rstb.royalsocietypublishing.
org/content/365/1554/3065.full.pdf+html
Parry, M., Rosenzweig, C., Iglesias, A., Livermore, M., Fischer, G. (2004): Effects of Climate
Change on Global Food Production under SRES Emissions and Socio-Economic Scenarios.
Global Environmental Change, 14: 53–67.
Pekcan, G., Köksal, E., Küçükerdönmez, Ö., Özel, H. (2006): Household Food Wastage in
Turkey (Statistics Division Working Paper Series No. ESS/ESSA/006e). Rome: Food and
Agriculture Organisation of the United Nations.
Pica-Ciamarra, U., Otte, J. (2009): The ‘Livestock Revolution’: Rhetoric and Reality. Research
report. Pro-Poor Livestock Policy Initiative. A living from Livestock. Research Report. PR Nr.
05–09, November 2009.
Pimentel, D., Pimentel, M. (2003): Sustainability of meat-based and plant-based diets and the
environment. American Journal of Clinical Nutrition, 78: 660–663.
Powell, L. M., Chaloupka, F. J. (2009): Food Prices and Obesity: Evidence and Policy
Implications for Taxes and Subsidies. The Milbank Quarterly, 87(1): 229–257.
Preker, A. S. (ed.) (2002): Food Policy Options. Preventing and Controlling Nutrition Related
Non-Communicable Diseases. Report of a World Health Organization (WHO) and World Bank
Consultation. HNP Discussion Paper.
Rosegrant, M. W. (2008): Biofuels and Grain Prices: Impacts and Policy Responses. Testimony
for the U.S. Senate Committee on Homeland Security and Governmental Affairs, May 7.
Rosegrant, M. W., Leach, N., Gerpacio, R. V. (1999): Meat or wheat for the next millennium?
Alternative futures for world cereal and meat consumption. Proceedings of the Nutrition
Society, 58: 219–234.
Rosegrant, M. W., Paisner, M. S., Meijer, S., Witcover, J. (2001): Global Food Projections to
2020. Emerging Trends and Alternative Futures. International Food Policy Research Institute,
Washington DC.
Schmidhuber, J., Bruinsma, J., Boedeker, G. (2009): Capital Requirements for Agriculture in
Developing Countries to 2050. Paper presented at the FAO Expert Meeting, 24–26 June
2009, Rome, on “How to Feed the World in 2050”.
ScienceDaily (various issues): http://www.sciencedaily.com/releases/2010/03/100322121103.
htm, http://www.sciencedaily.com/releases/2010/06/100628075744.htm
61
Searchinger, T., Heimlich, R., Houghton, R. A., Dong, F., Elobeid, A., Fabiosa, J., Tokgoz, S.,
Hayes, D., Tun-Hsiang, Y. (2008): Use of U.S. Croplands for Biofuels Increases Greenhouse
Gases through Emissions from Land Use Change. Science, 319: 1238–1240.
Sen, A. (1981): Poverty and Famines. Clarendon, Oxford.
Sibrián, R., Komorowska, J., Mernies, J. (2006): Estimating household and institutional food
wastage and losses (No. ESS/ESSA/001e). Statistics Division Working Paper Series. FAO.
Smil, V. (2002): Worldwide transformation of diets, burdens of meat production and opportunities for novel food proteins. Enzyme and Microbial Technology, 30: 305–311.
Smil, V. (2004): Improving Efficiency and Reducing Waste in Our Food System. Environmental
Sciences, 1(1), 17–26. Stehfest, E., Bouwman, L., van Vuuren, D. P., den Elzen, M. G. J.,
Eickhout, B., Kabat, P. (2009): Climate benefits of changing diet. Climatic Change, 95: 83–102
Steinfeld, H., Gerber, P., Wassenaar, T., Castel, V., Rosales, M., de Haan, Cees (2006):
Livestock’s Long Shadow: environmental issues and options. Food and Agriculture
Organisation of the United Nations. Rome. Available at: http://www.fao.org/docrep/010/
a0701e/a0701e00.HTM
Syngenta (2009): Growing More From Less, Achieving Food Security in the 21st Century.
Available at: www.sais-jhu.edu/news-and-events/pdf/syngenta.pdf.
Thøgersen, J. (1996): Wasteful food consumption: Trends in food and packaging waste.
Scandinavian Journal of Management, 12(3): 291–304.
Thow, A. M., Jan, S., Leeder, S., Swinburn, B. (2010): The effect of fiscal policy on diet, obesity
and chronic disease: a systematic review. Bull World Health Organ, 88(10): 609–614.
Tukker, A., Bausch-Goldbohm, S., Verheijden, M., de Koning, A., Kleijn, R., Wolf, O., Pérez
Domínguez, I. (2009): Environmental impacts of diet change in the EU. EUR 23783 EN. JRC
Scientific and Technical Reports. European Comission.
UN (2001): World Population Prospects: The 2000 Revision – Highlights. Doc. No. ESA/P/
WP.165. United Nations, New York.
UN (2003): World Population Prospects: The 2002 Revision. United Nations, New York.
United Nations (1975): Report of the World Food Conference, Rome 5–16 November 1974. New
York.
von Braun, J. (2007): The World Food Situation, New Driving Forces and Required Actions.
IFPRI Food Policy Report.
von Witzke, H., Noleppa, S. (2010): EU Agricultural Production and Trade: Can More Efficiency
Prevent Increasing “Land Grabbing” Outside of Europe? Research Report, HumboldtUniversität zu Berlin, agripol.
WBGU (Wissenschaftlicher Beirat der Bundesregierung Globale Umweltveränderungen) (2008):
Welt im Wandel: Zukunftsfähige Bioenergie und nachhaltige Landnutzung.
Wenlock, R. W., Buss, D. H., Derry, B. J., Dixon, E. J. (1980): Household Food Wastage in
Britain. British Journal of Nutrition, 43(01): 53–70.
Winters, L. A. (2002): Trade Liberalisation and Poverty: What are the Links?
The World Economy, 25(9): 1339–1367.
Winters, L. A., McCulloch, N., McKay, A. (2004): Trade Liberalization and Poverty: The
Evidence So Far. Journal of Economic Literature, 42(1): 72–115.
Wirsenius, S. (2008): Differentiated consumption taxes of food as a climate policy instrument. Feeding the world under the climate threat?, 12–13.Nov. 2008. Chalmers Universit of
Technology, Sweden. Available at: http://www.guengl.eu/upload/Stefan_Wirsenius.pdf
Wirsenius, S., Azar, C., Berndes, G. (2010): How much land is needed for global food production under scenarios of dietary changes and livestock productivity increases in 2030?
Agricultural Systems, 103(9): 621–638.
Wissenschaftlicher Beirat Agrarpolitik beim Bundesministerium für Ernährung, Landwirtschaft
und Verbraucherschutz (2007): Nutzung von Biomasse zur Energiegewinnung –
Empfehlungen an die Politik.
World Bank (2006): Global Economic Prospects, 2006. Washington, D.C.
WRAP (2008): The Food We Waste. Banbury, UK: Waste and Resource Action Programme.
Available at http://wrap.s3.amazonaws.com/the-food-we-waste.pdf .
WRP (World Resources Program) (2001): Disappearing Food: How Big are Postharvest
Losses? Earth Trends, World Resources Institute. Available at: http://earthtrends.wri.org/
pdf_library/feature/agr_fea_disappear.pdf
62 | How to feed the world’s growing billions
100%
RECYCLED
Schumannstr. 8
10117 Berlin | Germany
Tel.:+49 (0)30 285 34-0
Fax:+49 (0)30 285 34-109
E-mail: [email protected]
Unser Ziel
Wir wollen die weltweite Zerstörung der Natur und Umwelt stoppen und eine
Zukunft gestalten, in der Mensch und Natur in Harmonie miteinander leben.
wwf.de
WWF Deutschland
Reinhardtstr. 14
10117 Berlin | Germany
Tel.: +49 (0)30 311 777 0
Fax:+49 (0)30 311 777 199
E-mail: [email protected]
© Copyright of WWF International ® Brand symbol of WWF International • Printed on 100 % recycled paper • Last updated: 03/11
Heinrich-Böll-Stiftung e.V.

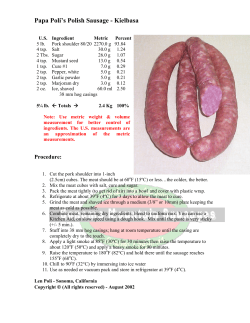

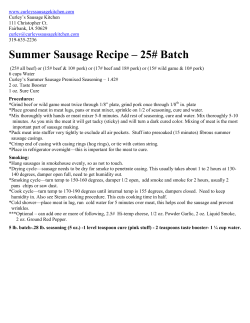


© Copyright 2026