
Comparing SFT and bio
ii50
(C) Subjective global assessment (SGA)
SGA should be used to identify severe malnutrition in haemodialysis patients (Evidence level III).
Rationale
SGA is based on a combination of subjective and
objective features from the medical history and
physical examination. A modified version of the SGA
has been used in the Canada/United States Peritoneal
Dialysis Study (CANUSA) and DOPPS studies
(see Appendix). It was demonstrated that lower
values of the mSGA were associated with a higher
mortality risk [16]. The investigators concluded that in
haemodialysis patients malnutrition, as indicated by
low values obtained with the mSGA, was associated
with higher mortality risk [16]. In a prospective
observational study, it was also shown that patients
with the lowest SGA score had higher mortality and
hospitalization rates [17]. In a direct comparison with
the determination of body nitrogen content by means
of in vivo neutron activation analysis it was demonstrated that SGA was able to differentiate severely
malnourished patients from those with normal nutrition, but appeared not to be a reliable predictor of the
degree of malnutrition [18].
(D) Anthropometry
Anthropometry in MHD patients should be
assessed immediately after dialysis (Opinion).
Anthropometry (Mid Arm Circumference (MAC),
Mid-Arm Muscle Circumference (MAMC) and
four site Skin Fold Thickness (SFT) should be
performed by the same individual on the nonfistula arm (Opinion).
Rationale
BMI, Four-site skin fold thickness (SFT), mid-armcircumference (MAC) and mid-arm-muscle-circumference (MAMC) are anthropometric screening methods
to assess fat and lean body mass and may detect a
potential risk for Protein and Energy Wasting (PEW).
These are easy to use, widely available and cost effective tools to help assess nutritional status of patients
on MHD but fluid status influences calculations.
Four-site SFT, MAC and MAMC: these
anthropometric measurements are important for
overall nutritional assessment. Measuring muscle
mass, MAC and MAMC, is essential to assess muscle
mass. It is necessary to perform skin fold thickness at
four sites to obtain an accurate assessment of total
body fat: triceps, biceps, sub-scapular and ileac crest.
The Frisancho Tables (1984) and Durnin and
Womersley (1974) equations are used to calculate
lean body mass and body fat percentage from obtained
details (see Appendix for methods).
D. Fouque et al.
Comparing SFT and bio impedance analysis
(BIA): Oe et al. [19] evaluated body composition
[lean body mass (LBM), body fat (BF) and total
body water (TBW)] using SFT and BIA techniques in
20 stable MHD patients pre- and post-dialysis. These
authors showed a good agreement between the two
techniques (R ¼ 0.93, P < 0.005) and proposed that
BIA might be the preferred method, as BIA is not
operator dependent and requires minimal training to
assess fluid status. Kamimura et al. [20] also found that
SFT measurements were comparable with BIA and
remain interesting for routine body fat assessment.
Ninety clinically stable MHD patients were studied;
body fat measurements using SFT and BIA were
similar (13.5 6.2 kg and 13.7 6.7 kg). Further
research is recommended to obtain references
for body composition assessment that are simple to
use in the routine care of MHD patients.
(E) Normalized protein nitrogen appearance (nPNA)
Normalized PNA should be measured in clinically
stable haemodialysis patients and be above 1.0 g/kg
ideal BW/day (Evidence level III) (see Guideline 3).
Rationale
Normalized PNA provides an independent and
less time consuming assessment of dietary protein
intake. Nitrogen balance, the difference between
intake and losses, is zero in the steady state or slightly
positive. Both net protein breakdown under fasting
conditions and dietary protein requirements are
strongly influenced by body mass. In order to normalize PNA it should be related to body weight of the
patient. When determining nPNA, patients should be
stable and neither anabolic nor catabolic [21]. The
protein equivalent of total PNA can be estimated from
interdialytic changes in urea nitrogen concentrations in
serum and urine (see Appendix). A recent study
in more than 50.000 US adult haemodialysis patients
reported that mortality was lowest for patients having
a nPNA between 1.0 and 1.4 g protein/kg BW/day;
furthermore, when patients had a decreased nPNA
after a 6-month follow-up, the 18-month subsequent
mortality increased [22]. PNA should however not be
used alone to evaluate nutritional status, but rather as
one of several independent measures when evaluating
nutritional status.
(F) Serum albumin and serum prealbumin
Serum albumin should be above 40 g/l by
bromocresol green method (Evidence level III).
For other albumin assessment methods the target
values should be adapted to the above (Opinion).
Serum prealbumin should be above 0.3 g/l
(Evidence level III)
EBPG guideline on nutrition
Rationale
Serum albumin is recommended for routine measurement because a large body of literature is available,
that defines normal serum albumin values and
characterizes the clinical factors affecting serum
albumin concentrations. Serum albumin, per se, is
an indicator of visceral protein stores. During recent
years the interactions between inflammation and
malnutrition status became complex, as inflammation
and dietary protein intake exert competing effects
on serum albumin levels [23]. A number of publications
demonstrate the relationship between serum albumin
concentrations and outcome [24]. Hypoalbuminaemia
is a predictor of future mortality [25–29] and cardiac
disease [27] at the time of initiation of dialysis and at
any time during dialysis treatment. Among 1411
patients enrolled in the HEMO study, those in the
low albumin group had significantly greater prevalence
of coronary heart disease [30]. Serum albumin should
not fall below 40 g/l (measured by the bromocresol
green method). Patients with a serum albumin
level below 35 g/l have a relative mortality risk of
4 [31], or a 2-year survival of 20% as compared with a
2-year survival of 80% in those with a serum albumin
greater than 40 g/l [23].
Serum albumin levels are not only affected by
poor energy and protein intake, but also by other
factors including inflammation, catabolic and
anabolic processes, age, comorbidity, fluid overload
(i.e. plasma volume) and urinary albumin losses
[32,33]. Albumin synthesis is reduced during the
acute phase response. The presence of acute or chronic
inflammation limits the specificity of serum albumin as
a nutritional marker. Measurements of serum
albumin levels is inexpensive, easy to perform and
widely available. Since there are currently more
than fifty different methods for measuring serum
albumin in laboratories, reference values should
be known to all nephrologists especially when
benchmarking is done in order to compare levels
in between centres on the national or international
level.
The
available
literature
suggests
that
prealbumin, also called transthyretin, may have
unique validity among the panel of available biochemical nutritional indicators. However, no formal guideline was developed for serum prealbumin so far.
Although predicting outcome, more mechanistic
understanding of its functions is mandatory. Beside
issues of reproducibility, costs inhibited implementation of prealbumin so far. Serum prealbumin is a
more sensitive indicator for the nutrition status than
albumin due to its shorter half life [34,35]. Prealbumin
levels correlate strongly with serum albumin and
have shown to provide prognostic value independent
of albumin [36]. Because albumin is markedly influenced by inflammation as negative acute phase
reactant its levels change more rapidly than prealbumin [37]. Therefore prealbumin is a good indicator of
liver anabolic protein synthesis. The half life of serum
ii51
prealbumin is approximately two days instead of 20
days for albumin [34,35]. Serum prealbumin levels
lower than 0.3 g/l predict a relative mortality risk of
2.64 [36]. The patients 2-year survival rate was 50%
with a serum prealbumin level <0.3 g/l and 90% in
patients with a prealbumin level >0.3 g/l. Another
cohort of 130 patients observed for 10 years demonstrated that each 0.01 g/l increase in serum prealbumin
at enrolment was associated with a 9% decrease in the
relative risk of death [38].
(G) Serum cholesterol
Serum total cholesterol should be measured and
be above the minimal laboratory threshold value
(Evidence level III).
Rationale and commentary
Serum cholesterol is a component of the lipid profile,
recommended for routine measurement, to assess the
cardiovascular risk of a given haemodialysis patient
[39,40]. Low (<1.5 g/l) or declining serum cholesterol
concentrations are predictive of increased mortality
risk [31,34,41–45]. Hypocholesterolaemia is associated
with chronic protein–energy deficits and/or the
presence of comorbid conditions, including inflammation. Individuals with low, low–normal (1.5–1.8 g/l),
or declining serum cholesterol levels should be
investigated for possible nutritional deficits as well as
for other comorbid conditions. The relationship
between serum cholesterol and outcome has been
described as either ‘J-shaped’ or ‘U-shaped’ with
increasing risk for mortality as serum cholesterol
falls below approximately 2 g/l or rises above 2–3 g/l.
Low levels of cholesterol are confounded by inflammation [45] and are influenced by the same comorbid
conditions that affect other nutritional markers
(e.g. serum albumin). Predialysis serum cholesterol
correlates with serum albumin, prealbumin, creatinine
and age [46]. If a patient takes lipid lowering drugs,
these should be taken into account in the total
cholesterol values.
(H) Technical investigations
Rationale
For the assessment of malnutrition several technical
tools are available such as bioelectrical impedance
analysis (BIA), whole body dual energy X-ray
absorptiometry (DXA), near infrared interactance
(NIR) and in vivo neutron activation analysis.
In addition the presence of malnutrition can be
investigated by means of subjective global assessment.
In vivo neutron activation analysis is considered the
reference standard for the determination of protein
ii52
malnourishment. In a sex- and age-matched study,
Allman et al. [47] demonstrated that haemodialysis
patients manifested a significantly lower total body
nitrogen content, suggesting protein depletion.
This observation was confirmed by Rayner et al in a
larger group showing that nitrogen levels were more
decreased in males (13%) than in females (4%).
Later studies demonstrated that a significant proportion of haemodialysis patients had total body nitrogen
depletion, expressed as a nitrogen index <80% being
the ratio of measured nitrogen vs the predicted
nitrogen for sex-, age- and height-matched controls
[48–50]. This seems especially to be the case in
older patients [48] and patients starting dialysis late
i.e. at low levels of renal function [49]. Pollock et al.
[48] demonstrated that patients with a nitrogen
index of <80% had a relative risk of dying of 4.1
compared with patients with a higher index whereas
Cooper et al. [51] found a hazard ratio of mortality of
1.6 per 10% of decline in nitrogen index. Several
studies demonstrated that compared with in vivo
neutron activation analysis, nutritional state
analysis by means of anthropometry underestimated
the presence of protein malnutrition in haemodialysis
patients [47,50,52]. Studies comparing in vivo neutron
activation analysis with BIA, DXA or NIR are
lacking.
DXA determines in a non-invasive way fat mass,
fat-free mass and bone mineral mass and density
from which body composition is computed. Thus,
protein–energy nutritional status can be assessed.
However, there are only limited data comparing
DXA-determined body composition of haemodialysis
patients with that of healthy subjects. Woodrow et al.
[53] demonstrated that in comparison with control
subjects patients on chronic haemodialysis have
a significant reduction in lean tissue mass. In this
study, the investigators also found similar reductions
in fat-free mass with BIA, which were not found
with skin-fold anthropometry. Data comparing
nutritional status between haemodialysis patients
and control subjects determined with BIA are scarce.
Woodrow et al. [53] demonstrated with BIA a decrease
in lean body mass in haemodialysis patients
compared with healthy control subjects. Madore
et al. [54] developed an impedance index with
which they could demonstrate in a small group of
haemodialysis patients that fat mass and lean body
mass were significantly reduced in 50% of patients
compared with the ideal value obtained from the
NHANES II tables, suggesting the existence of
malnutrition in these patients. Likewise, Maggiore
et al. [55] demonstrated that haemodialysis patients
after haemodialysis had lower body weight and a
reduced phase angle compared with healthy controls.
However, these investigators concluded that bioimpedance indexes were not reliable in detecting clinically
overt lean body mass depletion albeit that phase
angle was strongly related to patient survival [55].
Likewise, Woodrow et al. [56] found in patients with
chronic renal failure compared with control subjects
D. Fouque et al.
larger errors with BIA and skin fold anthropometry
compared with DXA, suggesting that the latter
technique is the preferred one.
Suggestion for future research
Validation of the assessment of nutritional state by
means of in vivo neutron activation analysis vs BIA,
DXA and NIR.
More frequent use of handgrip testing in clinical
research studies.
Guideline 2.2. Monitoring and follow-up
of nutritional status
Nutritional status should be followed using the
following assessment tools (Opinion):
(A) Dietary interviews
(B) Body weight
(C) nPNA, serum albumin and serum cholesterol
The use of other technical investigations should
be restricted to research purposes (Opinion).
(A) Dietary interviews
Stable and well-nourished haemodialysis patients
should be interviewed by a qualified dietitian
every 6–12 months or every 3 months if they are
over 50 years of age or on haemodialysis for
more than 5 years (Evidence level III).
Malnourished haemodialysis patients should
undergo at least a 24-h dietary recall more
frequently until improved (Opinion).
Rationale
Dietary interviews are the best way to detect in time a
reduced food intake before other objective malnutrition parameters start changing. Depending on staffing
constraints a 3-day dietary recording or a 24-h recall of
previous day intake should be performed, evaluated
and findings must be noted in the patient’s care plan.
During the same appointment any new dietary
information can be implemented. Patients may need
to be seen sooner if abnormal monthly blood tests
require dietary intervention. Patients may request to
visit the dietitian more often to alter parts of their
dietary regimens or changes in their personal circumstances may indicate the need for additional information. Establishing a telephone help line and/or access to
internet facilities enables dietitians and patients to
communicate more frequently.
The reasons for more frequent interviews in
patients over 50 years of age and treated by
haemodialysis for more than 5 years have been
discussed in Guideline 1.
EBPG guideline on nutrition
ii53
Table 1. Significance of unplanned weight loss
Unplanned weight loss
in past 3–6 months
(% body weight)
Significance
>10% of body weight
5–10% of body weight
Clinically significant
More than normal intra-individual
variation (potentially significant)—
early indicator of risk of malnutrition
increased
Within ‘normal’ intra-individual
variation (small)
<5% of body weight
(B) Body weight
Post dialysis body weight should be averaged
over the month and percentage change in the
average weight of the previous month, should be
calculated (Opinion).
Percent interdialytic weight gain (IDWG) should
be based on ‘dry weight’ (post dialysis) (Evidence
level III).
Rationale
It has been suggested that MHD patients should have
been on MHD for 60 days as this can reflect ‘dry
weight’ more accurately [12]. Ideal body weight (IBW)
is the weight based on a range of BMI’s that yields the
lowest morbidity and mortality rates. IBW may need
to be adjusted in overweight and underweight patients.
Unintentional weight loss during the previous 3–6
months period is more accurate as a risk factor for
protein–energy malnutrition than BMI. This weight
loss may be categorized according to the British
Association of Parenteral and Enteral Nutrition
(BAPEN) Malnutrition Advisory Group as in
Table 1 [57].
Therefore, a simple cut-off of >10% weight loss
during the last 3–6 months can be recommended for
the diagnosis of malnutrition.
Typically MHD patients are advised to keep IDWG
between 2 and 2.5 kg. Current guidelines for daily fluid
intake vary from 500 to 750 ml in addition to daily urine
output. Thirst is dependent on dietary sodium (salt)
intake and a high sodium intake will contribute to
excessive IDWG and may not be the immediate result of
food intake itself. Therefore, MHD patients must be
advised to reduce their daily sodium (salt) intake to
5–6 g salt (Na 85–100 mmol). However, patients eating
well also gain additional weight in between dialysis and
this is due to the invisible fluid content of food. A ‘dry’
diet of 2100 Kcal can contain as much as 300–350 ml
fluid and this adds to the daily fluid intake.
It has been suggested by Sherman et al. [58] that
IDWG could reflect nutritional intake. In a study of
860 randomly selected patients, a relationship between
IDWG and nPCR was noted, a higher protein (g/kg)
intake was associated with a higher IDWG, confirmed
by a correlation analysis that dry weight and nPCR
were independent factors (R ¼ 0.05). There was a
small but significant positive association between
IDWG and serum albumin concentrations: 3.78 vs
3.83 g/dl (P < 0.001) in patients with a <3% and
>4.5% dry weight gain, respectively. Testa et al. [59]
also found that dietary protein and energy intake was
higher in patients with a higher IDWG of 4.5 1.5%
during the 3 days interval. Dietary protein, energy
and sodium intake were assessed from 3-day diet
diaries from 32 patients, for each patient for 1 year.
This study suggests that a stable IDWG may be a
clinical indicator of adequate protein and energy intake
and that the extent of IDWG was not directly related
to blood pressure even in hypertensive patients.
Some patients are afraid of gaining more then 2 kg in
between dialysis treatment and this may affect their
nutritional intake. Nutritional counselling is therefore
important and should establish which patients eat well
compared with those who do not and have a lower
IDWG. Patients with large weight gains should nevertheless be challenged to assess what proportion is
nutritive and non-nutritive fluid consumption. Staff
should be aware of this when assessing compliance
with dietary and fluid intake when discussing ‘individual ideal IDWG’ of 2 kg or less as this may be
inappropriate for some patients. A percentage of dry
body weight gain of 4–4.5% seems acceptable in
patients with an optimal nutritional intake and
observing salt restriction.
Recommendation for future research
Further studies are required to evaluate what
constitutes an ‘ideal’ IDWG for the well nourished
and what percentage is acceptable for hypertensive and
cardiovascularly unstable MHD patients.
(C) nPNA, serum albumin and serum cholesterol
nPNA, serum albumin and serum cholesterol
should be measured at presentation, 1 month
after beginning of haemodialysis and three
monthly thereafter in clinically stable patients
(Opinion).
In clinically unstable patients with a number of
comorbidities, persistent inflammation, during
periods of intensive dietary counselling and
during therapeutic intervention the frequency of
measurements should be increased to monthly
intervals (Opinion).
Rationale
Albumin levels also reflect several non-nutritional
factors which are frequently present in MHD patients,
including inflammation and infection, urinary and
dialysate losses as well as hydration status. Therefore,
serum albumin alone is not a clinically useful measure
ii54
for protein/energy nutritional status in MHD patients.
Hypoalbuminaemia in MHD patients does not necessarily indicate protein–energy malnutrition, which also
may not correlate with changes in other nutritional
parameters.
Normalized PNA is a valid estimate of protein
intake, is well validated and simple to use in the clinical
setting. It is important to monitor protein intake in
MHD patients. However, there are limitations as well
such as overestimation of dietary protein intake when
the protein intake is <1 g/kg/day, possibly due to
protein catabolism [60,61]. Normalizing PNA to body
weight can be misleading in obese and volume
overloaded patients. It is recommended that for
individuals who are <90% or >115% of standardized
body weight, the oedema-free adjusted body weight
is used.
Serum total cholesterol is part of the routine lipid
profile measured in 3–6 month intervals according to
changes in clinical status and during lipid modifying
interventions [39]. Similar arguments apply for serum
cholesterol as for serum albumin. Serum cholesterol
may not correlate with changes in nutrition but
also with changes in other nutritional parameters
e.g. with those pointing to an activated acute phase
reaction.
Technical investigations are not recommended
for routine follow up
Rationale
Changes in body composition reflecting nutritional
status can be monitored with several techniques
although the number of studies is limited and direct
comparisons of these techniques with a gold standard
are lacking. By means of in vivo neutron activation
analysis a declining trend in the nitrogen index was
found after 1 year in prevalent haemodialysis patients
whereas the nitrogen index correlated with dietary
calorie intake [48]. Pupim et al. [62] investigated
nutritional parameters for 1 year in 50 incident
haemodialysis patients including BIA every 3 months
and DXA at the beginning and end of the year.
BIA-derived fat mass as well as DXA-measured fat
mass increased over time suggesting an improvement
of nutritional status. This was not associated with a
change in body mass of these patients, which was
explained by a decrease in total body water.
In prevalent chronic diabetic haemodialysis patients a
decrease in DXA-determined fat mass was found after
1 year of treatment which was attributed to impaired
nutritional status in these patients [63]. From these
studies it can be concluded that technical tools can be
used to monitor changes in body composition. Future
research, however, should further clarify which method
is the preferred one and with what intervals it should
be applied.
D. Fouque et al.
References
1. Wiggins KL. Guidelines for Nutrition Care of Renal
Patients. Renal Dietetic Practice Group, Am Diet Assoc,
3rd edn 2001; 1–101
2. Clinical practice guidelines for nutrition in chronic renal failure.
K/DOQI, National Kidney Foundation. Am J Kidney Dis 2000;
35: S1–S140
3. Schoenfeld PY, Henry RR, Laird NM, Roxe DM. Assessment
of nutritional status of the National Cooperative Dialysis Study
population. Kidney Int Suppl 1983; 23: S80–S88
4. Thomas B. Manual of Dietetic Practice, Brit Diet Assoc, 3rd edn
2001: 30–37
5. Kloppenburg WD, Stegeman CA, Hooyschuur M, Van der
Ven J, de Jong PE, Huisman RM. Assessing dialysis adequacy
and dietary intake in the individual hemodialysis patient. Kidney
Int 1999; 55: 1961–1969
6. Burrowes JD, Larive B, Cockram DB et al. Effects of
dietary intake, appetite, and eating habits on dialysis and
non-dialysis treatment days in hemodialysis patients: Crosssectional results From the HEMO study. J Renal Nutr 2003; 13:
191–198
7. Lou LM, Gimeno JA, Paul J et al. Evaluation of food intake in
hemodialysis using a food consumption and appetite questionnaire. Nefrologia 2002; 22: 438–447
8. Kopple JD, Zhu X, Lew NL, Lowrie EG. Body weight-forheight relationships predict mortality in maintenance hemodialysis patients. Kidney Int 1999; 56: 1136–1148
9. Aparicio M, Cano N, Chauveau P et al. Nutritional status of
haemodialysis patients: a French national cooperative study.
French Study Group for Nutrition in Dialysis. Nephrol Dial
Transplant 1999; 14: 1679–1686
10. Leavey SF, Strawderman RL, Jones CA, Port FK, Held PJ.
Simple nutritional indicators as independent predictors of
mortality in hemodialysis patients. Am J Kidney Dis 1998; 31:
997–1006
11. Leavey SF, McCullough K, Hecking E, Goodkin D, Port FK,
Young EW. Body mass index and mortality in ‘healthier’ as
compared with ‘sicker’ haemodialysis patients: results from the
Dialysis Outcomes and Practice Patterns Study (DOPPS).
Nephrol Dial Transplant 2001; 16: 2386–2394
12. Abbott KC, Glanton CW, Trespalacios FC et al. Body mass
index, dialysis modality, and survival: analysis of the United
States Renal Data System Dialysis Morbidity and Mortality
Wave II Study. Kidney Int 2004; 65: 597–605
13. Chauveau P, Combe C, Laville M et al. Factors
influencing survival in hemodialysis patients aged older than
75 years: 2.5-year outcome study. Am J Kidney Dis 2001; 37:
997–1003
14. Chumlea WC, Dwyer J, Bergen C et al. Nutritional status
assessed from anthropometric measures in the HEMO study.
J Renal Nutr 2003; 13: 31–38
15. Combe C, Chauveau P, Laville M et al. Influence of nutritional
factors and hemodialysis adequacy on the survival of 1,610
French patients. Am J Kidney Dis 2001; 37: S81–S88
16. Pifer TB, McCullough KP, Port FK et al. Mortality risk in
hemodialysis patients and changes in nutritional indicators:
DOPPS. Kidney Int 2002; 62: 2238–2245
17. Kalantar-Zadeh K, Kopple JD, Block G, Humphreys MH.
Association among SF36 quality of life measures and nutrition,
hospitalization, and mortality in hemodialysis. J Am Soc
Nephrol 2001; 12: 2797–2806
18. Cooper BA, Bartlett LH, Aslani A, Allen BJ, Ibels LS, Pollock
CA. Validity of subjective global assessment as a nutritional
marker in end-stage renal disease. Am J Kidney Dis 2002; 40:
126–132
19. Oe B, de Fijter CW, Oe PL, Stevens P, de Vries PM. Four-site
skinfold anthropometry (FSA) versus body impedance analysis
(BIA) in assessing nutritional status of patients on maintenance
EBPG guideline on nutrition
20.
21.
22.
23.
24.
25.
26.
27.
28.
29.
30.
31.
32.
33.
34.
35.
36.
37.
38.
39.
hemodialysis: which method is to be preferred in routine patient
care? Clin Nephrol 1998; 49: 180–185
Kamimura MA, Jose Dos Santos NS, Avesani CM,
Fernandes Canziani ME, Draibe SA, Cuppari L. Comparison
of three methods for the determination of body fat in patients
on long-term hemodialysis therapy. J Am Diet Assoc 2003; 103:
195–199
Kopple JD, Jones MR, Keshaviah PR et al. A proposed glossary
for dialysis kinetics. Am J Kidney Dis 1995; 26: 963–981
Shinaberger CS, Kilpatrick RD, Regidor DL, et al.
Longitudinal associations between dietary protein intake
and survival in hemodialysis patients. Am J Kidney Dis 2006;
48: 37–44
Kaysen GA, Chertow GM, Adhikarla R, Young B, Ronco C,
Levin NW. Inflammation and dietary protein intake
exert competing effects on serum albumin and creatinine in
hemodialysis patients. Kidney Int 2001; 60: 333–340
Dwyer JT, Larive B, Leung J et al. Are nutritional status
indicators associated with mortality in the Hemodialysis
(HEMO) Study? Kidney Int 2005; 68: 1766–1776
Lowrie EG, Lew NL. Death risk in hemodialysis patients: the
predictive value of commonly measured variables and an
evaluation of death rate differences between facilities. Am J
Kidney Dis 1990; 15: 458–482
Iseki K, Yamazato M, Tozawa M, Takishita S.
Hypocholesterolemia is a significant predictor of death in a
cohort of chronic hemodialysis patients. Kidney Int 2002; 61:
1887–1893
Foley RN, Parfrey PS, Harnett JD, Kent GM, Murray DC,
Barre PE. Hypoalbuminemia, cardiac morbidity, and mortality
in end-stage renal disease. J Am Soc Nephrol 1996; 7: 728–736
Owen WF, Jr., Lew NL, Liu Y, Lowrie EG, Lazarus JM. The
urea reduction ratio and serum albumin concentration as
predictors of mortality in patients undergoing hemodialysis.
N Engl J Med 1993; 329: 1001–1006
Owen WF, Lowrie EG. C-reactive protein as an outcome
predictor for maintenance hemodialysis patients. Kidney Int
1998; 54: 627–636
Beddhu S, Kaysen GA, Yan G et al. Association of serum
albumin and atherosclerosis in chronic hemodialysis patients.
Am J Kidney Dis 2002; 40: 721–727
Lowrie EG, Huang WH, Lew NL. Death risk predictors among
peritoneal dialysis and hemodialysis patients: a preliminary
comparison. Am J Kidney Dis 1995; 26: 220–228
Stenvinkel P, Barany P, Chung SH, Lindholm B, Heimburger O.
A comparative analysis of nutritional parameters as predictors
of outcome in male and female ESRD patients. Nephrol Dial
Transplant 2002; 17: 1266–1274
Kaysen GA. Biological basis of hypoalbuminemia in ESRD.
J Am Soc Nephrol 1998; 9: 2368–2376
Avram MM, Mittman N, Bonomini L, Chattopadhyay J, Fein
P. Markers for survival in dialysis: a seven-year prospective
study. Am J Kidney Dis 1995; 26: 209–219
Goldwasser P, Michel MA, Collier J et al. Prealbumin
and lipoprotein(a) in hemodialysis: relationships with patient
and vascular access survival. Am J Kidney Dis 1993; 22: 215–225
Chertow GM, Ackert K, Lew NL, Lazarus JM, Lowrie EG.
Prealbumin is as important as albumin in the nutritional
assessment of hemodialysis patients. Kidney Int 2000; 58:
2512–2517
Ingenbleek Y, Carpentier YA. A prognostic inflammatory and
nutritional index scoring critically ill patients. Int J Vitam Nutr
Res 1985; 55: 91–101
Mittman N, Avram MM, Oo KK, Chattopadhyay J. Serum
prealbumin predicts survival in hemodialysis and peritoneal
dialysis: 10 years of prospective observation. Am J Kidney Dis
2001; 38: 1358–1364
European Best Practice Guidelines in Haemodialysis (Part 1).
Section VII. Vascular disease and risk factors. Nephrol Dial
Transplant 2002; 17 [Suppl 7]: 88–109
ii55
40. K/DOQI clinical practice guidelines for management of dyslipidemias in patients with kidney disease. Am J Kidney Dis 2003;
41: 1–91
41. Piccoli GB, Quarello F, Salomone M et al. Are serum
albumin and cholesterol reliable outcome markers in
elderly dialysis patients? Nephrol Dial Transplant 1995; 10
[Suppl 6]: 72–77
42. Degoulet P, Legrain M, Reach I et al. Mortality risk factors in
patients treated by chronic hemodialysis. Report of the
Diaphane collaborative study. Nephron 1982; 31: 103–110
43. Iseki K, Miyasato F, Tokuyama K et al. Low diastolic
blood pressure, hypoalbuminemia, and risk of death in a
cohort of chronic hemodialysis patients. Kidney Int 1997; 51:
1212–1217
44. Goldwasser P, Mittman N, Antignani A et al. Predictors of
mortality in hemodialysis patients. J Am Soc Nephrol 1993; 3:
1613–1622
45. Liu Y, Coresh J, Eustace JA et al. Association between
cholesterol level and mortality in dialysis patients: role of
inflammation and malnutrition. JAMA 2004; 291: 451–459
46. Cano N, Di Costanzo-Dufetel J, Calaf R et al. Prealbuminretinol-binding-protein-retinol complex in hemodialysis patients.
Am J Clin Nutr 1988; 47: 664–667
47. Allman MA, Allen BJ, Stewart PM et al. Body protein of
patients undergoing haemodialysis. Eur J Clin Nutr 1990; 44:
123–131
48. Pollock CA, Ibels LS, Allen BJ et al. Total body nitrogen as a
prognostic marker in maintenance dialysis. J Am Soc Nephrol
1995; 6: 82–88
49. Cooper BA, Aslani A, Ryan M, Ibels LS, Pollock CA.
Nutritional state correlates with renal function at the start of
dialysis. Perit Dial Int 2003; 23: 291–295
50. Arora P, Strauss BJ, Borovnicar D, Stroud D, Atkins RC,
Kerr PG. Total body nitrogen predicts long-term mortality in
haemodialysis patients – a single-centre experience. Nephrol Dial
Transplant 1998; 13: 1731–1736
51. Cooper BA, Penne EL, Bartlett LH, Pollock CA.
Protein malnutrition and hypoalbuminemia as predictors of
vascular events and mortality in ESRD. Am J Kidney Dis 2004;
43: 61–66
52. Rayner HC, Stroud DB, Salamon KM et al. Anthropometry
underestimates body protein depletion in haemodialysis patients.
Nephron 1991; 59: 33–40
53. Woodrow G, Oldroyd B, Turney JH, Tompkins L, Brownjohn
AM, Smith MA. Whole body and regional body composition in
patients with chronic renal failure. Nephrol Dial Transplant 1996;
11: 1613–1618
54. Madore F, Wuest M, Ethier JH. Nutritional evaluation of
hemodialysis patients using an impedance index. Clin Nephrol
1994; 41: 377–382
55. Maggiore Q, Nigrelli S, Ciccarelli C, Grimaldi C, Rossi GA,
Michelassi C. Nutritional and prognostic correlates of bioimpedance indexes in hemodialysis patients. Kidney Int 1996; 50:
2103–2108
56. Woodrow G, Oldroyd B, Smith MA, Turney JH.
Measurement of body composition in chronic renal failure:
comparison of skinfold anthropometry and bioelectrical
impedance with dual energy X-ray absorptiometry. Eur J Clin
Nutr 1996; 50: 295–301
57. Todorovic V, Russell C, Stratton R, Ward J, Elia M. A Guide to
the Malnutrition Universal Screening Tool (MUST) for Adults.
Brit Ass Parent Enteral Nutr (BAPEN) 2003.
58. Sherman RA, Cody RP, Rogers ME, Solanchick JC.
Interdialytic weight gain and nutritional parameters in chronic
hemodialysis patients. Am J Kidney Dis 1995; 25: 579–583
59. Testa A, Plou A. Clinical determinants of interdialytic weight
gain. J Ren Nutr 2001; 11: 155–160
60. Lorenzo V, de BE, Rufino M et al. Caloric rather than protein
deficiency predominates in stable chronic haemodialysis
patients. Nephrol Dial Transplant 1995; 10: 1885–1889
ii56
61. Enia G, Sicuso C, Alati G, Zoccali C. Subjective global
assessment of nutrition in dialysis patients. Nephrol Dial
Transplant 1993; 8: 1094–1098
62. Pupim LB, Kent P, Caglar K, Shyr Y, Hakim RM, Ikizler TA.
Improvement in nutritional parameters after initiation of
chronic hemodialysis. Am J Kidney Dis 2002; 40: 143–151
63. Okuno S, Ishimura E, Kim M et al. Changes in body fat mass in
male hemodialysis patients: a comparison between diabetics and
nondiabetics. Am J Kidney Dis 2001; 38: S208–S211
Guideline 3. Recommendations for protein and
energy intake
Guideline 3.1. Recommended protein intake
The dietary protein intake in clinically stable
chronic haemodialysis patients should be at least
1.1 g protein/kg ideal body weight/day (Evidence
level III).
The achieved nPNA in a clinically stable chronic
haemodialysis patient should be at least 1.0 g/ideal
body weight/day (Evidence level III).
Rationale
The prevalence rate of protein–energy malnutrition in
chronic haemodialysis patients ranges from 20%
to 70% with an average of 40% [1–3]. A poor
nutrient intake is the most frequent cause for
malnutrition in MHD patients. Observational or
interventional clinical trials have reported patients’
spontaneous intakes to be as low as 20–25 kcal/kg/day
and/or 0.8–1.0 g/kg protein/day [4,5]. Although some
patients may do well with slightly lower intakes than
recommended, the general dialysis population should
be advised to reach a minimal protein intake of 1.1 g
protein/kg/day. Protein intake should be taken with a
sufficient energy intake (e.g. 30–40 kcal/kg/day, see
Recommendation 3.2) to guarantee an optimal
metabolic balance.
Protein requirements. There has been controversy
regarding the optimal protein intake in MHD patients
since clinical studies are scarce and their duration is
usually too short (on average less than 10 days) to
obtain valid conclusions. In healthy adults, metabolic
studies include nitrogen balances during many days or
weeks, and whole body as well as regional (at tissue
level such as forearm) amino acid turnover studies.
Values reported in these studies are expressed as a
mean SD. However, when transferred to the general
population, a mean experimental value of a minimal
intake means that 50% of subjects will be covered
whereas 50% will not be adequately covered by the
proposed level. Since there is no method for identifying
those patients who will not be in balance by eating this
mean value, the World Health Organization defined a
‘population level’ by adding 2 SDs of the mean to the
protein intake obtained through metabolic studies [6].
This ‘population level’ is therefore considered safe,
since it will ensure that 97.5% of patients would get
D. Fouque et al.
enough protein to balance their needs. Consequently,
this also implies that almost half of the subjects will be
counselled to achieve a protein intake above their
individual needs. This is the reason why a given subject
can remain in metabolic equilibrium, e.g. in adequate
nutritional status when receiving a protein intake less
than recommended.
For healthy young adults, the most recent recommendations have slightly increased the daily protein
intake towards 0.8–0.85 g/kg body weight [6,7].
Furthermore, in a recent meta-analysis, it was not
possible to recommend different values for elderly
people, nor was it possible to find marked differences
in requirement according to the nature of animal or
vegetable protein [7]. Thus, a balanced intake of high
quality animal protein and vegetable protein source
should be proposed.
Protein requirements in the normal population chronic
haemodialysis. During routine haemodialysis, protein
requirements do not appear to be sufficient for the
following reasons. First, the dialysis treatment induces
a loss of nutrients (glucose, amino acids, vitamins and
trace elements) through the dialysis filter, which may
even be more important today in response to the use of
more porous membranes and/or more efficient techniques such as haemofiltration [8,9]. Second, the dialysis
procedure itself is a catabolic event responsible for
protein catabolism (fragmentation of albumin, release
of pro-inflammatory cytokines, role of heparin) [9–15].
For example, in response to the rapid decrease in
plasma amino acid at the start of the haemodialysis
session, muscle proteolysis occurs in order to maintain
an adequate plasma and cellular amino acid concentration [16,17]. This catabolic event may lead to muscle
wasting over the long term. Feeding patients during the
dialysis session through regular meals, special liquid
feeding or parenteral administration has been shown to
revert this catabolic state and should be used as
frequently as possible [11,17,18]. Some authors have
hypothesized that, during the non-dialysis days, the
catabolic stress may not be present or even be replaced
by an anabolic response [19]. Nutrient intake may vary
according to the dialysis schedule: food intake was
greater by approximately 10% on non-dialysis days
than on dialysis days [5], an observation not confirmed
by Kloppenburg et al. [20]. During a standard threeweekly dialysis schedule, food intake was recently
reported to be spontaneously reduced by 40% on the
last day of the long interdialysis interval, probably in
order to avoid fluid overload [21].This last observation
fits well with the previous report from Sherman et al.
[22] showing that patients with a reduced interdialytic
weight gain (<3% dry weight) had a mean nPNA of
0.94 g/kg BW/day, as compared with those who had an
interdialytic weight gain >4% corresponding to a
nPNA of 1.17 g/kg BW/day.
Research data in dialysis patients indicate that in
most metabolic studies performed in adult chronic
dialysis patients, a protein intake of 0.8–0.85 g/kg
BW/day or less was constantly associated with a
EBPG guideline on nutrition
negative metabolic balance [23–27]. When protein
intake averaged 1.1 g/kg/day or more, most patients
showed neutral or positive balance [23–27] but not all
[28]. These observations have led many investigators to
recommend a safety level of protein intake of 1.2 g/kg
BW/day. After publication of previous nutritional
guidelines in renal disease [29, 30], sporadic reports
have challenged these recommendations, by reporting
good nutritional status in patients eating less protein
[31,32]. These observations may have been obtained in
selected patients, and for the safety reasons detailed
above, lower levels of protein intake should not be
recommended for the general dialysis population.
Protein intake and nutritional status in epidemiological
studies in maintenance dialysis. In a cross-sectional
survey of more than 7400 haemodialysis patients,
Aparicio et al. [4] showed that serum albumin reached
a plateau of 39.3 g/l for a PNA of 1–1.2 g/kg/day, but
no superior serum albumin values were observed
in patients with greater nPNAs. Additional data
have recently been obtained from prospective
epidemiological studies [33–35]. Ohkawa et al. [33]
reported in 127 MHD patients that body composition,
as assessed by CT scan, was maintained constant with
a level of protein intake of 0.9–1.1 g protein/kg/day,
and that there was no clinical or biochemical benefit
for the patients eating more than 1.1 g protein/kg/day.
Kloppenburg and colleagues performed a randomized
cross-over trial comparing two levels of protein intake
(0.9 vs 1.1 g/kg BW/day) for 40 weeks each in 45
haemodialysis patients [36]. They did not observe
significant changes in nutritional parameters between
the two diets which were comparable in terms of
energy intake (28–30 kcal/kg BW/day). In a secondary
analysis of the HEMO study, serum albumin was
shown to be positively associated with protein intake
(assessed by equilibrated normalized PCR) only
between 0.4 and 1.0 g/kg/day, without further benefit
on serum albumin for a nPCR > 1.0 [37].
Is a protein intake greater than 1.2 g/kg/day harmful in
chronic haemodialysis? Although larger protein intakes
may not improve nutritional status, they may possibly
be associated with better survival: in a 2-year
prospective follow-up of more than 1600 chronic
haemodialysis patients in France, higher nPNA was
associated with higher survival by univariate analysis
[34]. More recently, the same group reported increased
survival in patients with an nPNA between 1.24 and
1.46 g/kg BW/day, as compared with the quartiles
having an nPNA lower than 1.24. Survival was not
further improved in the upper quartile of patients
taking 1.46 g protein and above [35]. In another recent
1-year prospective study, Kalantar et al. [38] reported
an inverse relationship between PNA (mean value,
1.13 0.29 g/kg/day, range 0.5–2.15) and mortality or
hospitalization rate in 122 patients adequately dialysed
(Kt/V > 1.2).
Protein intake and CKD mineral and bone
disease. Elevated protein intakes are not dissociable
ii57
from an increase in dietary phosphate, which has led
some investigators to warn against a potential increase
in vascular calcification. Most clinical trials have
specifically addressed the question of dietary phosphate restriction only in CKD stages 2 and 3, well
before end-stage renal disease (stage 5), in an attempt
to prevent secondary hyperparathyroidism [39].
Once dialysis treatment is started however,
the relationship between dietary phosphate and hyperphosphataemia is less straightforward, since bone
metabolism and intestinal absorption become the
focus of complex interactions and new therapeutic
interventions [40]. In 39 patients undergoing a 80-week
randomized cross-over trial, Kloppenburg et al. [36]
reported that two different protein intakes (0.94 vs
1.15 g/kg IBW/day, estimated from food reports,
corresponding to a nPNA of 0.9 and 1.0 g/kg/day,
respectively) were not associated with different serum
phosphate levels (1.88 0.40 vs 1.89 0.39 mmol/l,
respectively). Serum phosphate was markedly influenced by the dialysis dose, being lower in the greater
dialysis dose group (1.77 0.30 vs 2.01 0.41 mmol/l
for Kt/Vs of 1.26 0.14 and 1.02 0.08, respectively),
underlining the predominant importance of the dialysis
dose over the protein intake in controlling serum
phosphate and the phosphocalcic product. Many
individuals may have a high serum phosphate without
eating a large quantity of proteins, possibly from a
greater intestinal fractional absorption of phosphate
and the influence of vitamin D therapy, and these
patients may better benefit from oral phosphate
binders than from a reduction in their protein intake.
In contrast, low serum phosphate is frequently
associated with low protein intake in patients undergoing regular 4-h or shorter haemodialysis sessions.
Indeed, Lorenzo et al. [41] reported that patients with
a serum phosphate <4 mg/dl did eat 0.86 0.3 g
protein/kg BW/day whereas those with a serum
phosphate >4 mg/dl had a protein intake of
1.05 0.4 g/kg/day. Finally, and most importantly,
there is no prospective clinical trial to show that
the vascular risk associated with elevated serum
phosphorus or calcium phosphate product occurs in
response to a high protein intake.
Protein
intake
and
frequency
of
haemodialysis. The frequency of the dialysis sessions
should be considered when analysing nutritional
intake. Indeed, fear of overload or pulmonary
oedema may significantly limit food intake during the
interdialytic interval, particularly during the long 3-day
period [21]. Switching patients to a daily haemodialysis
program, either long noctural or short 2-h, has been
reported to augment protein intake up to 40%,
an increase that was sustained over 1 year and
associated with improved serum albumin in almost
all pilot studies [42]. The reasons for this improved
nutrient intake is probably due to the lifting of the
fluid restriction and other general limitations of food
intake, especially for those nutrients containing phosphate and/or potassium.
ii58
Protein intake and inflammation. Inflammation,
which has been repeatedly reported in 20–50% of
routine haemodialysis patients, may impair nutritional status by different mechanisms such as
increased anorexia and/or protein catabolism
[37,43]. Controversial debate occurs as to wether
protein intake may reverse impaired nutritional
status in the presence of chronic inflammation. In
a randomized dietary intervention study, Leon et al.
[44] showed that it was possible to increase serum
albumin over 6 months in haemodialysis patients by
simple dietary counselling, and this improvement also
occurred when chronic inflammation was present. In
an ancillary analysis of the HEMO study in more
than 1000 MHD patients, Kaysen et al. [37] showed
that serum albumin was independently influenced by
either protein intake or inflammation status. Indeed,
serum albumin correlated positively with protein
intake (as assessed by ‘nPCR’) only for a protein
intake <1.0 g/kg/day, with no further benefit above,
and there was no inflammation impact on serum
albumin for C reactive protein (CRP) values
<13 mg/l [37]. These authors suggested that the
independent effect of protein intake might positively
impact on nutritional status of inflamed patients
with a CRP > 13 mg/l. A comparable observation
has been reported by Chauveau and colleagues [35]
in a recent prospective cohort of more than 400
MHD patients. These authors showed that the 2-year
survival of patients with a serum CRP > 10 mg/l was
superior for the patients with a nPNA 1.2 g/kg/day.
Thus, the relationship between chronic inflammation,
dietary intake and nutritional status still remains
unclear but may suggest that malnourished inflamed
patients may benefit from increased protein intakes.
Thus from these studies, it seems that nutritional
status does not much improve when protein intake
is 1.0–1.2 g/kg/day or above, whereas there might
be a sustained protective effect on morbi-mortality
for protein intakes slightly above these nutritional
recommendations. These hypotheses should be
confirmed in larger specifically designed prospective
studies. Practically however, if an individual dialysis
patient eats slightly less (0.9–1.0 g/kg/day) than
recommended and presents with a stable nutritional
status, in absence of superimposed disease or
catabolic event, and until further survival studies
become available, his/her protein intakes may
be maintained under the recommended level
unless clinical and/or biochemical nutritional indices
worsen.
Recommendation for further research
Which PNA gives the best survival in chronic
haemodialysis?
Formula for normalizing PNA.
Specific protein needs for malnourished HD
patients (may differ from well-nourished patients).
Effect of dialysis techniques on nutritional status
(haemofiltration, daily dialysis, etc.) on appetite and
D. Fouque et al.
their relationship with appetite regulatory factors
(leptin, ghrelin).
Effects of higher protein intake on malnourished
inflamed patients.
Relationship between protein intake, vascular
calcification and bone metabolism.
Guideline 3.2. Recommended energy intake
The recommended energy intake in a clinically
stable chronic haemodialysis patient should be
30–40 kcal/kg IBW/day, adjusted to age, gender
and to the best estimate of physical activity level
(Evidence level III).
Regular physical activity should be encouraged,
and energy intake should be increased proportionally to the level of physical activity (Opinion).
Rationale
Energy metabolism in chronic kidney disease. Energy
metabolism may be impaired during CKD, in
response to metabolic disorders such as insulin
resistance and impaired triglyceride utilization, carnitine deficiency, hyperparathyroidism, metabolic acidosis, chronic inflammation and the haemodialysis
procedure itself [45]. However, except in severely
sick patients, these abnormalities do not seem to
greatly affect resting energy expenditure (REE) [45–
50]. Indeed, even if some activities or treatments
impact on energy metabolism in CKD, this will occur
for only short periods of time in the entire nycthemere
and the resulting overcost may not significantly alter
the daily energy expenditure (DEE) [6,51]. Energy
expenditure has even been shown to be reduced in
CKD patients as compared with control subjects
[51,52]. The main reason for altered energy metabolism seems therefore to be a predominant deficit in
energy intake rather than an increase in energy
expenditure. Indeed, many reports in MHD showed
energy intake being as low as 20–22 kcal/kg BW/day
[53–56]. When normalized by lean body mass, REE
may be more elevated in MHD than in peritoneal
dialysis for yet unexplained reasons [57], but this
normalization does not reflect a general consensus
until now [45,53].
How to estimate daily energy expenditure? Estimation
of daily energy expenditure (DEE) has been
performed by different research tools including indirect
calorimetry (sequential or continuous over 24 h or
more), deuterated water, physical activity questionnaires, and Harris-Benedict or Schofield formulas
[6,47,48,57–60]. Daily energy expenditure strongly
depends on the active metabolic mass, e.g. lean body
mass, but is independent on fat mass [48]. Since excess
energy intake is rapidly stored in fat tissue in the body,
the optimal daily energy intake (DEI) in a stable adult
equals his/her daily energy expenditure. A detailed
individual calculation of DEI firstly includes the
estimation of resting energy expenditure (REE) also
EBPG guideline on nutrition
ii59
called basal metabolic rate, strongly influenced by
thermic conditions including ambiant temperature,
and thyroid function.
Resting energy expenditure (REE) can be estimated
as follows:
lifestyle (AF of 1.4), will have a DEE of
approximately 1500 kcal/day, e.g. 30 kcal/kg/day.
A 30-year very active male, weighting 80 kg with a
height of 1.80 m, will have a REE of 1900 kcal/day,
and his DEE will be 1900 1.7 ¼ 3230 kcal,
e.g. 40 kcal/kg/day.
3.2.1 By the use of the Schofield tables reported by
the WHO [6]:
Males
Females
18 30 years 15:3 BW þ 679 14:7 BW þ 496
30 60 years 11:6 BW þ 879 8:7 BW þ 829
> 60 years
13:5 BW þ 487 10:5 BW þ 596
The WHO recommendations obtained through the
Schofield tables (see equation 3.2.1) have been
recently challenged, and newer studies have reported
measured daily energy expenditure to be even lower
by 8–14% and 16–20% in sedentary adult women
and men, respectively [62,63]. Elderly people have a
decline in REE in response to a 3% loss of lean body
mass per decade and their activity factor was
estimated to be low, at about 1.45. In the most
recent dietary reference intakes released by the Food
and Nutrition board (Institute of Medicine,
Washington, USA), to determine someone’s energy
requirement, the DEE is estimated for a 30-year old
adult and then reduced by 7 and 10 kcal/year for age
above 30 [63]. Blanc et al. [59] reported that the
WHO recommendations led to a 10% overestimation
of daily energy expenditure in elderly women (mean
age, 75 year), underlining the need for further
research in larger cohorts of patients. Thus, from
the most recent publications in the field, it seems that
energy requirements could be lower than previously
reported.
Finally, there is a metabolic adaptation to a reduced
energy intake, which includes a decrease in resting
energy expenditure, both from a loss of active lean
body mass, but also through an improved efficiency of
energy metabolism, as recently showed by Friedlander
et al. [64]. Thus, even though their energy intake does
not reach the recommended values, malnourished
patients may still benefit from a relative increase in
their nutritional intake, from spontaneous or supplemental oral intake, or from oral or parenteral sources
during the dialysis session [11,18,65].
where REE is expressed in kcal/day and body weight
(BW) in kg
3.2.2 By the use of Harris-Benedict equations as
follows:
For men: REE ¼ 66 þ (13.7 BW) þ (5 H)
(6.8 A)
For women: REE ¼ 655.1 þ (9.6 BW)
þ(1.8 H) (4.7 A)
where REE is expressed in kcal/day, body weight
(BW) in kg, height (H) in cm and age (A) in years.
3.2.3 By the use of Black equations [61] as follows:
For men: REE ¼ 259 BW0.48 H0.50 A0.13
For women: REE ¼ 230 BW0.48 H0.50 A0.13
where REE is expressed in kcal/day, body weight
(BW) in kg, height (H) in m and age (A) in years.
The third important and highly variable determinant
of daily energy expenditure (DEE) is physical activity.
To obtain the optimal DEE, REE should be multiplied
by an activity factor, which greatly depends on the type
and the duration of professional and recreational
activities. This factor is generally comprised between
1.3 and 2, with a mean of 1.5 in most publications [59]
with an upper limit of 2.2 in case of extemely high
physical activity, an uncommon condition in routine
dialysis (see [6] for detailed calculations).
Thus, daily energy expenditure (DEE) can be
estimated as follows:
Daily energy expenditure (i.e. daily energy
requirement):
DEEðkcal=dayÞ ¼ 1:51 REE
1
activity factor could vary from 1.2 to 2 (see text for
comments)
Examples:
A 40-year male weighting 75 kg, with a height
of 1.75 m will have a REE of about 1700 kcal/day.
If he develops a moderate but significant activity,
his DEE will be 1700 1.5, e.g. 2550 kcal per day,
equal to 34 kcal/kg/day.
A frail elderly woman, aged 75, with a weight of
50 kg and a height of 1.60 m and a very sedentary
How to estimate daily energy intake? Since energy
intake in excess of expenditure is rapidly stored as fat
in a stable well-nourished haemodialysis patient, the
optimal energy intake equals his/her daily energy
expenditure. In contrast to protein, estimation of
energy intake can only be done by monitoring intake
and not by collecting any fluid parameter. There are a
lot of difficulties in performing diet collections, among
which dietitian availability and patient training, knowledge and perception of exact food intake, time
consumption and cost. Precision of food reports are
limited and may artefactually underestimate patients’
true energy intake, the magnitude of underestimation
being greater in patients with larger BMIs, in both men
and women [58]. From a recent analysis from 40 MHD
patients, Kloppenburg et al. [66] measured basal
metabolic rate and obtained self reports of energy
intake. Whereas in general, the daily energy expenditure cannot be lower than 1.2-1.3 REE (see above),
these authors found that 60% of patients had an
ii60
energy intake report lower than 1.27 REE. Since
these patients did not present with symptoms of
chronic malnutrition, the authors suggested that daily
energy intake was notably underestimated. The underreporting of energy intake could be improved by
increasing the number of dietary interviews: it has been
shown that at least four different 3-day dietary
interviews separated each by 1 month were necessary
to reduce the intraindividual variability of reports [67],
the impact of dialysis or non-dialysis day schedule [5],
but 5–7 days appear optimal [20]. In addition, a 7-day
collection is more conform with reality of intakes, since
there is in some patients an important spontaneous
intake reduction the ‘seventh-day’, e.g. the last day of
the long interdialytic interval, [21]. Training should be
performed, including spouse and/or relatives to help
identifying nutrient type and size of servings since
patients are not able to clearly identify the different
sources of nutrients [44]. Finally, it should be
emphasized that energy intake cannot be derived
from other reported food components. Indeed, for a
same amount of protein intake, the variability of
energy intake between patients is too large to draw
any reliable relationship between protein and energy
intake [68]. Thus, physical activity determination and
reported dietary energy intake will be the best estimate
of patients’ needs.
Is energy intake sufficient in MHD patients? After the
publication of previous guidelines [29,30], there was
some disagreement between the recommended values
as compared with what was reported in observational
studies [54–56]. Most epidemiological studies have
reported energy intakes lower than recommended,
and being as little as 20–25 kcal/kg BW/day. Thus,
when clinical or biological indices of malnutrition are
found in a given patient (see Guideline 2), a nutritional
work-up should be rapidly performed. However,
if there is no clear sign of ongoing malnutrition or
(a) catabolic process or processes, a number of facts
may partly explain the discrepancy between low
reported energy intake and patient’s nutritional
status. There could be a true inadequate energy
intake that will lead to reduced physical activity,
altered protein metabolism and muscle losses:
this could be corrected by active nutritional support
(see Guideline 5). Alternatively, individual energy
expenditure was not correctly assessed, in case of a
more reduced than estimated physical activity, which is
frequent in chronically haemodialysed patients: thus
the true energy needs are closer to 30 kcal/kg/day or
may even be slightly less in elderly sedentary women
(see above formules for calculation). A third event is
the potential underestimation of energy intake through
the food reports or dietary interviews, an occurrence
recently confirmed in healthy adults [69] as well as in
renal failure patients [45,53,66,70].
Energy intake can be markedly increased in MHD
patients by administering oral supplements [71,72].
Daily amounts of 500 kcal could be delivered quite
easily and the benefits related to these interventions
D. Fouque et al.
have been recently reported to be better than
previously expected (see Guideline 5). Increasing the
frequency of dialysis to daily sessions has allowed a
generous increase in energy intake in recent reports
[42,73]. These interventions have been associated with
weight gain, both from fat and lean body mass.
In summary, estimating energy needs and energy
intake is a skilled task, and recent findings have
underlined the following points: (1) there is a trend for
lowering the daily energy requirements in healthy
adults, particularly in women; (2) energy expenditure
should be more closely matched to physical activity,
which may be very variable between individuals, and
particularly reduced in dialysis patients; (3) almost all
methods for monitoring daily energy intake, even when
used by a trained staff, do underestimate actual energy
intake. Whether this information applies to dialysis
patients is not fully known and may be the scope for
further research. However, these points partly explain
why, in routine practice, patients may do acceptably
well despite recorded energy intakes lower than
previously recommended.
References
1. Cianciaruso B, Brunori G, Kopple JD et al. Cross-sectional
comparison of malnutrition in continuous ambulatory
peritoneal dialysis and hemodialysis patients. Am J Kidney Dis
1995; 26: 475–486
2. Marcen R, Teruel JL, de la Cal MA et al. The impact of
malnutrition in morbidity and mortality in stable haemodialysis patients. Spanish Cooperative Study of Nutrition in
Hemodialysis. Nephrol Dial Transplant 1997; 12: 2324–2331
3. Park YK, Kim JH, Kim KJ et al. A cross-sectional study
comparing the nutritional status of peritoneal dialysis
and hemodialysis patients in Korea 1999. J Renal Nutr 9:
149–156
4. Aparicio M, Cano N, Chauveau P et al. Nutritional status of
haemodialysis patients: a French national cooperative study.
French Study Group for Nutrition in Dialysis. Nephrol Dial
Transplant 1999; 14: 1679–1686
5. Burrowes JD, Larive B, Cockram DB et al. Effects of dietary
intake, appetite, and eating habits on dialysis and non-dialysis
treatment days in hemodialysis patients: cross-sectional
results From the HEMO study. J Renal Nutr 2003; 13: 191–198
6. Energy and protein requirements. Report of a joint FAO/WHO/
UNU Expert Consultation. World Health Organ Tech Rep Ser
1985; 724: 1–206
7. Rand WM, Pellett PL, Young VR. Meta-analysis of nitrogen
balance studies for estimating protein requirements in healthy
adults. Am J Clin Nutr 2003; 77: 109–127
8. Ikizler TA, Flakoll PJ, Parker RA et al. Amino acid
and albumin losses during hemodialysis. Kidney Int 1994; 46:
830–837
9. Combarnous F, Tetta C, Cellier CC et al. Albumin loss in
on-line hemodiafiltration. Int J Artif Organs 2002; 25: 203–209
10. Raj DS, Zager P, Shah VO et al. Protein turnover and amino
acid transport kinetics in end-stage renal disease. Am J Physiol
Endocrinol Metab 2004; 286: E136–E143
11. Veeneman JM, Kingma HA, Boer TS et al. Protein intake
during hemodialysis maintains a positive whole body protein
balance in chronic hemodialysis patients. Am J Physiol
Endocrinol Metab 2003; 284: E954–E965
12. Gutierrez A, Alvestrand A, Wahren J et al. Effect of in vivo
contact between blood and dialysis membranes on protein
catabolism in humans. Kidney Int 1990; 38: 487–494
EBPG guideline on nutrition
13. Ikizler TA, Pupim LB, Brouillette JR et al. Hemodialysis
stimulates muscle and whole body protein loss and alters
substrate oxidation. Am J Physiol Endocrinol Metab 2002; 282:
E107–E116
14. Lofberg E, Essen P, McNurlan M et al. Effect of hemodialysis
on protein synthesis. Clin Nephrol 2000; 54: 284–294
15. Veeneman JM, Kingma HA, Boer TS et al. The metabolic
response to ingested protein is normal in long-term hemodialysis
patients. Am J Kidney Dis 2004; 43: 330–341
16. Raj DS, Welbourne T, Dominic EA et al. Glutamine kinetics
and protein turnover in end-stage renal disease. Am J Physiol
Endocrinol Metab 2005; 288: E37–E46
17. Lim VS, Ikizler TA, Raj DS et al. Does hemodialysis increase
protein breakdown? Dissociation between whole-body amino
acid turnover and regional muscle kinetics. J Am Soc Nephrol
2005; 16: 862–868
18. Pupim LB, Flakoll PJ, Brouillette JR et al. Intradialytic
parenteral nutrition improves protein and energy homeostasis
in chronic hemodialysis patients. J Clin Invest 2002; 110: 483
19. Lim VS, Yarasheski KE, Flanigan MJ. The effect of uraemia,
acidosis, and dialysis treatment on protein metabolism:
a longitudinal leucine kinetic study. Nephrol Dial Transplant
1998; 13: 1723–1730
20. Kloppenburg WD, Stegeman CA, Hooyschuur M et al.
Assessing dialysis adequacy and dietary intake in the individual
hemodialysis patient. Kidney Int 1999; 55: 1961–1969
21. Bellizzi V, Di Iorio BR, Terracciano V et al. Daily nutrient
intake represents a modifiable determinant of nutritional status
in chronic haemodialysis patients. Nephrol Dial Transplant 2003;
18: 1874–1881
22. Sherman RA, Cody RP, Rogers ME et al. Interdialytic weight
gain and nutritional parameters in chronic hemodialysis
patients. Am J Kidney Dis 1995; 25: 579–583
23. Kopple JD, Shinaberger JH, Coburn JW et al. Optimal dietary
protein treatment during chronic hemodialysis. Transactions –
Am Soc Art Int Org 1969; 15: 302–308
24. Ikizler TA, Greene JH, Yenicesu M et al. Nitrogen balance
in hospitalized chronic hemodialysis patients. Kidney Int 1996;
57: S53–S56
25. Borah MF, Schoenfeld PY, Gotch FA et al. Nitrogen balance
during intermittent dialysis therapy of uremia. Kidney Int 1978;
14: 491–500
26. Lim VS, Flanigan MJ, Zavala DC et al. Protective adaptation of
low serum triiodothyronine in patients with chronic renal failure.
Kidney Int 1985; 28: 541–549
27. Rao M, Sharma M, Juneja R et al. Calculated nitrogen balance
in hemodialysis patients: influence of protein intake. Kidney Int
2000; 58: 336–345
28. Slomowitz LA, Monteon FJ, Grosvenor M et al. Effect of
energy intake on nutritional status in maintenance hemodialysis
patients. Kidney Int 1989; 35: 704–711
29. Clinical practice guidelines for nutrition in chronic renal failure.
K/DOQI, National Kidney Foundation. Am J Kidney Dis 2000;
35: S1–S140
30. Toigo G, Aparicio M, Attman PO et al. Expert working group
report on nutrition in adult patients with renal insufficiency
(Part 2 of 2). Clin Nutr 2000; 19: 281–291
31. Uribarri J. The obsession with high dietary protein intake
in ESRD patients on dialysis: is it justified? Nephron 2000; 86:
105–108
32. Lim VS, Flanigan MJ. Protein intake in patients with renal
failure: comments on the current NKF-DOQI guidelines
for nutrition in chronic renal failure. Semin Dial 2001; 14:
150–152
33. Ohkawa S, Kaizu Y, Odamaki M et al. Optimum dietary protein
requirement in nondiabetic maintenance hemodialysis patients.
Am J Kidney Dis 2004; 43: 454–463
34. Combe C, Chauveau P, Laville M et al. Influence of nutritional
factors and hemodialysis adequacy on the survival of 1610
French patients. Am J Kidney Dis 2001; 37: S81–S88
ii61
35. Chauveau P, Bourdenx J, Montaudon D et al. Interaction
between nutrition and inflammation in the Bordeaux study of
inflammation in chronic hemodialysis patients (BICHE): 2 years
follow-up. J Am Soc Nephrol 2004; 15: Abs
36. Kloppenburg WD, Stegman CA, Kremer Hovinga TK et al.
Effect of prescribing a high protein diet and increasing the
dose of dialysis on nutrition in stable chronic haemodialysis
patients: a randomized, controlled trial. Nephrol Dial Transplant
2004; 9: 1212–23
37. Kaysen GA, Greene T, Daugirdas JT et al. Longitudinal
and cross-sectional effects of C-reactive protein, equilibrated
normalized protein catabolic rate, and serum bicarbonate on
creatinine and albumin levels in dialysis patients. Am J Kidney
Dis 2003; 42: 1200–1211
38. Kalantar-Zadeh K, Supasyndh O, Lehn RS et al. Normalized
protein nitrogen appearance is correlated with hospitalization
and mortality in hemodialysis patients with Kt/V greater
than 1.20. J Renal Nutr 2003; 13: 15–25
39. K/DOQI clinical practice guidelines for bone metabolism
and disease in chronic kidney disease. Am J Kidney Dis 2003;
42: S1–S201
40. Locatelli F, Cannata-Andia JB, Drueke TB et al. Management
of disturbances of calcium and phosphate metabolism in
chronic renal insufficiency, with emphasis on the control
of hyperphosphataemia. Nephrol Dial Transplant 2002; 17:
723–731
41. Lorenzo V, Martin M, Rufino M et al. Protein intake, control of
serum phosphorus, and relatively low levels of parathyroid
hormone in elderly hemodialysis patients. Am J Kidney Dis 2001;
37: 1260–1266
42. Fouque D, Guebre-Egziabher F, Laville M. Advances in
anabolic interventions for malnourished dialysis patients.
J Ren Nutr 2003; 13: 161–165
43. Kaysen GA, Chertow GM, Adhikarla R, et al. Inflammation
and dietary protein intake exert competing effects on serum
albumin and creatinine in hemodialysis patients. Kidney Int
2001; 60: 333–340
44. Leon JB, Majerle AD, Soinski JA et al. Can a nutrition
intervention improve albumin levels among hemodialysis
patients? A pilot study. J Renal Nutr 2001; 11: 9–15
45. Cuppari L, Avesani CM. Energy requirements in patients with
chronic kidney disease. J Ren Nutr 2004; 14: 121–126
46. Monteon FJ, Laidlaw SA, Shaib JK et al. Energy
expenditure in patients with chronic renal failure. Kidney Int
1986; 30: 741–747
47. Ikizler TA, Wingard RL, Sun M et al. Increased energy
expenditure in hemodialysis patients. J Am Soc Nephrol 1996;
7: 2646–2653
48. Tabakian A, Juillard L, Laville M et al. Effects of recombinant
growth factors on energy expenditure in maintenance
hemodialysis patients. Miner Electrolyte Metab 1998; 24:
273–278
49. Schneeweiss B, Graninger W, Stockenhuber F et al. Energy
metabolism in acute and chronic renal failure. Am J Clin Nutr
1990; 52: 596–601
50. Cuppari L, de Carvalho AB, Avesani CM et al. Increased
resting energy expenditure in hemodialysis patients with severe
hyperparathyroidism. J Am Soc Nephrol 2004; 15: 2933–2939
51. Veeneman JM, Kingma HA, Stellaard F et al. Oxidative
metabolism appears to be reduced in long-term hemodialysis
patients. Am J Kidney Dis 2005; 46: 102–110
52. Avesani CM, Draibe SA, Kamimura MA et al. Decreased
resting energy expenditure in non-dialysed chronic kidney
disease patients. Nephrol Dial Transplant 2004; 19: 3091–3097
53. Kloppenburg WD, de Jong PE, Huisman RM. Low
calorie intake in dialysis patients: an alternative explanation.
Am J Kidney Dis 1999; 33: 1202–1204
54. Rocco MV, Paranandi L, Burrowes JD et al. Nutritional
status in the HEMO Study cohort at baseline. Hemodialysis.
Am J Kidney Dis 2002; 39: 245–256
ii62
55. Thunberg BJ, Swamy AP, Cestero RV. Cross-sectional
and longitudinal nutritional measurements in maintenance
hemodialysis patients. Am J Clin Nutr 2005; 34: 2005–2012
56. Schoenfeld PY, Henry RR, Laird NM et al. Assessment of
nutritional status of the National Cooperative Dialysis Study
population. Kidney Int 1983; 23: S80–S88
57. Neyra R, Chen KY, Sun M et al. Increased resting energy
expenditure in patients with end-stage renal disease. J Parenter
Enteral Nutr 2003; 27: 36–42
58. Livingstone
MB,
Black
AE.
Markers
of
the
validity of reported energy intake. J Nutr 2003; 133 [Suppl 3]:
895S–920S
59. Blanc S, Schoeller DA, Bauer D et al. Energy
requirements in the eighth decade of life. Am J Clin Nutr 2004;
79: 303–310
60. Schofield WN. Predicting basal metabolic rate, new
standards and review of previous work. Hum Nutr Clin Nutr
1985; 39 [Suppl 1]: 5–41
61. Black AE, Coward WA, Cole TJ et al. Human energy
expenditure in affluent societies: an analysis of 574
doubly-labelled water measurements. Eur J Clin Nutr 1996; 50:
72–92
62. Alfonzo-Gonzalez G, Doucet E, Almeras N et al. Estimation
of daily energy needs with the FAO/WHO/UNU 1985
procedures
in
adults:
comparison
to
whole-body
indirect calorimetry measurements. Eur J Clin Nutr 2004; 58:
1125–1131
63. Trumbo P, Schlicker S, Yates AA et al. Dietary reference
intakes for energy, carbohydrate, fiber, fat, fatty acids,
cholesterol, protein and amino acids. J Am Diet Assoc 2002;
102: 1621–1630
64. Friedlander AL, Braun B, Pollack M et al. Three weeks
of caloric restriction alters protein metabolism in normal
weight, young men. Am J Physiol Endocrinol Metab 2005; 289:
E446–E455
65. Pupim LB, Flakoll PJ, Ikizler TA. Nutritional supplementation
acutely increases albumin fractional synthetic rate in
chronic hemodialysis patients. J Am Soc Nephrol 2004; 15:
1920–1926
66. Kloppenburg WD, de Jong PE, Huisman RM. The contradiction of stable body mass despite low reported dietary energy
intake in chronic haemodialysis patients. Nephrol Dial
Transplant 2002; 17: 1628–1633
67. Laville M, Fouque D: Nutritional aspects in hemodialysis.
Kidney Int Suppl 2000; 76: S133–S139
68. Black AE, Bingham SA, Johansson G et al. Validation of dietary
intakes of protein and energy against 24 hour urinary N and
DLW energy expenditure in middle-aged women, retired
men and post-obese subjects: comparisons with validation
against presumed energy requirements. Eur J Clin Nutr 1997;
51: 405–413
69. Slimani N, Bingham S, Runswick S et al. Group level validation
of protein intakes estimated by 24-hour diet recall and dietary
questionnaires against 24-hour urinary nitrogen in the European
Prospective Investigation into Cancer and Nutrition (EPIC)
calibration study. Cancer Epidemiol Biomarkers Prev 2003; 12:
784–795
70. Avesani CM, Kamimura MA, Draibe SA et al. Is energy intake
underestimated in nondialyzed chronic kidney disease patients?
J Renal Nutr 2005; 15: 159–165
71. Allman MA, Stewart PM, Tiller DJ et al. Energy
supplementation and the nutritional status of hemodialysis
patients. Am J Clin Nutr 1990; 51: 558–562
72. Stratton R, Bircher G, Fouque D et al. Multi-nutrient oral
supplements and tube feeding in maintenance dialysis:
a systematic review and meta-analysis. Am J Kidney Dis 2005;
46: 387–405
73. Galland R, Traeger J, Arkouche W et al. Short daily
hemodialysis rapidly improves nutritional status in hemodialysis
patients. Kidney Int 2001; 60: 1555–1560
D. Fouque et al.
4. Recommendations for vitamins, minerals and
trace elements administration in MHD patients
Due to insufficient evidence from clinical trials
for recommending administration of vitamins,
the following information only reflects the expert’s
opinion and cannot be considered as a clinical
guideline but a recommendation.
4.1. Vitamins
Abnormal renal metabolism, inadequate intake
and/or gastrointestinal absorption and dialysis losses,
account for vitamin deficiencies amongst dialysis
patients. Losses are even greater with high-flux and
high-efficiency dialysis. Vitamin deficiency progresses
slowly depending on body stores, nutritional intake
and chronic dialysis losses. Vitamin status in individual
patients depends on age, gender, actual vitamin intake,
previous supplementation, dialysis losses, residual
renal function, time on dialysis and types of dialysers
in addition to impaired metabolism. Ideally vitamin
supplements should be tailored to individual needs.
Overt clinical manifestations include depressed
immune system, neuropathy and impaired amino
acid and lipid metabolism, mild scurvy and other
abnormalities. The most frequently observed vitamin
disturbances concern water soluble vitamins and these
may be supplemented daily or administered after
dialysis, three times weekly, which promotes
compliance.
In a recent prospective cohort study, the DOPPS
evaluated the relative risk (RR) for hospitalization
and mortality in 16 345 MHD patients from 308
randomly selected renal centres in Europe, Japan
and USA [1]. There were large regional variations
in the percentage of patients who received various
multivitamin types of water soluble vitamins.
In Europe, this ranged from 3.7% in the United
Kingdom to 6.4% in Italy and 37.9% in Spain; it was
5.6% in Japan as compared with 71.9% in the US.
Possible reasons for these large variations may be due
to differences in cost, health insurance coverage,
patient’s preferences and patients and medical staff
health beliefs regarding efficacy as several short-term
studies have in the past not shown benefits.
The DOPPS evaluation showed a 16% reduction in
the relative risk for mortality in MHD patients taking
water soluble vitamins [2].
However, only a prospective randomized controlled
trial would prove that water soluble vitamin supplementation improves outcomes. The authors meanwhile
proposed that while awaiting further more robust
evidence, prescription of water soluble vitamin
supplements, being of minimal medical risk, could
be proposed to the patients [1]. If administered,
watersoluble vitamin supplements should be taken or
infused at the end of the dialysis session. Patients
should be discouraged to purchase regular vitamin
EBPG guideline on nutrition
ii63
and mineral supplements over the counter as
requirements differ from those for healthy people,
and some formulas include vitamins that are not
recommended in maintenance dialysis.
4.1.1 Water-soluble vitamins
Thiamine (B1)
A daily supplement of 1.1–1.2 mg thiamin hydrochloride is recommended
Rationale. Thiamine deficiency is responsible for
beriberi, a rare condition in MHD patients. Vitamin
B1 deficiency may also be evoked in case of atypical
neurological symptoms (Wernicke encephalitis).
Thiamine is strongly removed during haemodialysis.
Thiamine plasma concentration may not reflect its
biological activity. Thiamine intake in MHD patients
can range from 0.6 to 1.5 mg/day depending on
individual food consumption, and is mainly contained
in pork meat, beer and dried vegetables [3]. Patients
with a poor nutritional intake, as may occur in the
elderly, are most likely to benefit from supplementation. Thiamine has been administered in amounts up to
300 mg/week in patients undergoing high-flux haemodialysis [4]. Presently, all renal multivitamin formulas
include thiamine, from 1.5 mg (NephroviteÕ ,
Dialyvite3000Õ , DiatxÕ , USA, RenavitÕ , Germany),
3 mg (RenaxÕ , USA) to 50 mg (DialvitÕ , Switzerland)
per tablet.
Riboflavin (B2)
A daily supplement of 1.1–1.3 mg is recommended
Rationale. Although it is well cleared during haemodialysis, not tightly bound to proteins, riboflavin
deficiency is uncommon. A supplement of 1.1–1.3 mg
is equal to the recommended daily allowance of healthy
people and is sufficient to supplement inadequate
nutritional intake and dialysis losses [3]. Riboflavin is
contained in milk, bread and cereals, lean meat and
egg. Presently, all renal multivitamin formulas include
riboflavin, from 1.7 mg (NephroviteÕ , Dialyvite3000Õ ,
USA, RenavitÕ , Germany), 2 mg (RenaxÕ , USA) to
10 mg (DialvitÕ , Switzerland) per tablet.
Pyridoxine (B6)
A daily supplement of 10 mg
hydrochloride is recommended
as
pyridoxine
Rationale. There is evidence that plasma and red cell
pyridoxine levels are low in MHD patients. Although
the pyridoxine recommended dietary allowance in
healthy adults is 1.3–1.7 mg, the use of erythropoietin
(EPO) may increase requirements because of increased
erythropoiesis. Some drugs and other substances
interfere with pyridoxine metabolism, an additional
cause for deficiency. A decreased level of pyridoxine
may be associated with hyperhomocysteinaemia,
but the benefit of supplementation is as yet unclear
[3,5]. Pyridoxine is contained in yeast, cereal buds,
green vegetables, egg yolk and meat. A supplement of
10 mg/day is recommended as this is the lowest
pyridoxine hydrochloride dose that has consistently
normalized pyridoxine deficiency and the transamination activation index of stable MHD patients.
Pyridoxine supplementation given to correct hyperoxalaemia or hyperhomocysteinaemia is still a controversial issue. High doses of pyridoxine hydrochloride
(200–600 mg daily) should be avoided as these have
been associated with peripheral neuropathy. Presently,
all renal multivitamin formulas include pyridoxine,
10 mg (NephroviteÕ , Dialyvite3000Õ , USA, RenavitÕ ,
Germany), 15 mg (RenaxÕ , USA), 40 mg (DialvitÕ ,
Switzerland) and 50 mg (Diatx ZnÕ , USA) per tablet.
Ascorbic Acid (vitamin C)
A daily supplement of 75–90 mg is recommended.
Rationale. Vegetables and fresh fruit are the main
sources of vitamin C but these foods are often
restricted or need to be avoided in a potassium
restricted diet, resulting in an inadequate intake. In
addition, vitamin C is inactivated by heat during
cooking. Vitamin C is readily removed by dialysis as
reported by Wang et al. [6]. Serum levels fell by
30–40% after a single dialysis session and losses from
80 to 280 mg per dialysis session have been reported [3].
Vitamin C deficiency contributes to a mild form of
scurvy sometimes seen in MHD patients, may lead to
abnormal amino acid metabolism and disturbances in
folic acid metabolism. Although high-flux dialysis
techniques increase vitamin C losses, Descombes
et al. [4] reported normal plasma ascorbate values in
patients receiving 500 mg vitamin C at the end of the
dialysis session thrice weekly. Vitamin C supplements
appear to improve functional iron deficiency and hence
the response to EPO [7–9].
Vitamin C supplementation may help to relieve
muscle cramps. In a double blind randomized trial,
60 MHD patients, divided into four groups, daily
received either vitamin E (400 mg), vitamin C (250 mg),
either vitamins or a placebo for 8 weeks [10]. Muscle
cramps significantly improved in patients receiving
both vitamins E and C (97%), vitamin E alone (54%),
vitamin C (61%) as compared with only 7% of
placebo-treated patients [10].
More recently, Deicher et al. [11] reported that, in
MHD patients followed for 30 months, total vitamin
C plasma levels were predictive of mortality, with a
risk of dying at least three times greater in the plasma
vitamin C tertiles <60 mmol/l, suggesting to keep
patients plasma vitamin C levels above this target.
Further studies are required to explore safety, to what
extend patients are vitamin deficient, and whether
other dialysis factors may increase removal. High doses
of vitamin C (e.g. superior to 500–1000 mg daily)
should however be avoided in MHD patients because
of tissue oxalate deposition in response to increased
ii64
D. Fouque et al.
serum oxalates not cleared by the failing kidney.
Presently, renal multivitamin formulas generally
include vitamin C, e.g. 50 mg (RenaxÕ , USA), 60 mg
(NephroviteÕ , Diatx ZnÕ , USA, RenavitÕ , Germany),
100 mg (Dialyvite3000Õ , USA) and 200 mg (DialvitÕ ,
Switzerland) per tablet.
vitamin B12 equal to the requirement, e.g. 2.4 mg/day,
seems safe.
Presently, most but not all renal multivitamin
formulas include vitamin B12, 6 mg (NephroviteÕ ,
DialyviteÕ , USA, RenavitÕ , Germany), 12 mg
(RenaxÕ , USA) and 1 mg (Dialyvite3000Õ , USA)
per tablet.
Folic Acid (Folate, vitamin B9)
A daily supplement
recommended.
of
1 mg
folic
acid
is
Rationale. In MHD patients, folic acid levels may be
reduced in serum and red blood cells and induce
megaloblastic anaemia. Folic acid is contained in yeast,
liver, green vegetables, fruit and meat. Because
of impaired intestinal absorption, ethanol or drug
interaction and dialysate losses, particularly with high
flux/high efficiency dialysis [12], it is prudent to
prescribe 1 mg folic acid/day to prevent deficiency.
This may be insufficient to lower elevated plasma
homocysteine levels as the administration of 5–10 mg/
day has shown a plasma homocysteine reduction by
30–50% [3]. Indeed, the National Kidney Foundation
Task Force on Cardiovascular Disease issued a
report with recommendations for treatment of hyperhomocysteinaemia [13]. It was recommended that
MHD patients should receive daily 5 mg folic acid,
50 mg pyridoxine and 400 mg vitamin B12, to reduce
serum homocysteine levels and protect against
cardiovascular disease.
Presently, all renal multivitamin formulas
include folic acid, 0.8 mg (RenavitÕ , Germany),
1 mg (NephroviteÕ , DialyviteÕ , USA), 3 mg
(Dialyvite 3000Õ , USA, DialvitÕ , Switzerland) and
5 mg (Diatx ZnÕ , USA) per tablet.
B12 (cobalamin)
A daily supplement of 2.4 mg vitamin B12 is
recommended.
Rationale. Vitamin B12 or cobalamin, combined
with the gastric intrinsic factor, are necessary factors
for an optimal folate metabolism, a normal nonmegaloblastic erythropoiesis and to avoid nervous
system demyelinization observed in pernicious anaemia. Cobalamin is found in sufficient amounts in meat,
liver, seafood, milk and egg yolk. Vitamin B12
undergoes an enterohepatic cycling. Most MHD
patients present plasma levels of cobalamin in
the normal range, whether they receive vitamin B12
supplements or not. Administration of vitamin B12 has
been shown to improve or correct nerve conduction
velocity in MHD patients having low vitamin B12
plasma levels [14]. Vitamin B12, when administered
for 1 mg monthly, is also efficient in decreasing serum
homocysteinaemia by 10% [15]. Since there is no
clear report of vitamin B12 toxicity even for high
vitamin B12 doses, i.e. 2.5 mg three times weekly [16],
and because some dialysis patients have an intake
below the daily requirements, a daily supplement of
Niacin (vitamin B3, nicotinamide, nicotinic acid,
vitamin PP)
A daily supplement
recommended.
of
14–16 mg
niacin
is
Rationale. Niacin is contained in meat, fish, dry
vegetables, coffee and tea. A deficit in niacin store
results in signs of pellagra, a dermatosis associated with
diarrhea and dementia, as soon as 50–60 days after a
complete dietary niacin removal. However, pellagra has
never been reported in a chronic dialysis patient. Niacin
undergoes a rapid metabolic clearance and does not
seem to be cleared by dialysis. Pharmacological niacin
doses improve lipid profile by increasing serum HDL
and decreasing LDL cholesterol fraction and serum
triglycerides. Since many MHD patients have limited
intakes of food containing niacin, it is recommended to
supplement patients with the required allowance of
normal adults, e.g. 14–16 mg daily.
Recently, niacin, given at about 1000 mg daily has
been reported to efficiently decrease serum phosphate
by 20% in hyperphosphataemic MHD patients, by
inhibiting intestinal phosphate transport [17]. A mild
thrombopenia was recently reported as a side effect of
this treatment dose in maintenance dialysis [18]. High
doses of niacin have been alternatively proposed for
controlling dyslipidaemia and reduce cardiovascular
risk in non-renal patients [19]. Side effects of high-dose
niacin (1000–1500 mg daily) include flushes and
impaired glucose metabolism [20]. Thus, high doses
of niacin should be prescribed with great caution in
dialysis patients, since no long-term clinical trial has
been performed in these patients.
Presently, many renal multivitamin formulas
include niacin, 20 mg (NephroviteÕ , DialyviteÕ ,
Dialyvite3000Õ , Diatx ZnÕ , RenaxÕ , USA, RenavitÕ ,
Germany) per tablet.
Biotin (vitamin B8)
A daily supplement of 30 mg biotin is recommended.
Rationale. Major sources of biotin (vitamin B8)
include yeast, egg yolk, liver, soybean, mushrooms
and cauliflower. Biotin deficiency may be responsible
for depression, somnolence, hyperesthaesia, anorexia
and dermatosis, symptoms often present to a certain
extent in MHD patients. In renal patients, a decrease
in intestinal biotin absorption has been reported,
as well as a plasma biotin decrease during the dialysis
session [3]. Furthermore, food intakes that are low in
protein are also low in biotin and do not meet the
minimal daily biotin requirement. An adequate biotin
EBPG guideline on nutrition
intake has been proposed at 30 mg/day, and for the
aforementioned reasons, it seems prudent to recommend this value also to MHD patients. Clearly,
further studies are needed to better address the
biotin needs in maintenance dialysis.
Presently, many renal multivitamin formulas include
biotin, 150 mg (NephrocapsÕ , USA) and 300 mg
(DialyviteÕ , Diatx ZnÕ , NephroviteÕ , RenaxÕ , USA,
RenavitÕ , Germany) per tablet.
Pantothenic acid (vitamin B5)
A daily supplement of 5 mg pantothenic acid is
recommended.
Rationale. Pantothenic acid is widely spread in many
food including liver, kidney, fresh vegetables and egg
yolk. It plays an important role in b-oxidation, free
fatty acid and amino acid oxidation and protein
acylation. To date, there is no clear information on
pantothenic acid stores for MHD patients. Pantothenic
acid is cleared by dialysis, and although no data are
yet available, newer more efficient techniques might
increase pantothenate losses. Since diets low in protein
may not provide the adequate daily needs (5 mg/day),
it is recommended that MHD patients take a
supplement of 5 mg/day. Further research is warranted
on pantothenic acid dialysate losses and stores in
dialysis patients.
Presently, many renal multivitamin formulas
include pantothenic acid, 5 mg (NephrocapsÕ , USA)
and 10 mg (NephroviteÕ , DialyviteÕ , Diatx ZnÕ ,
RenaxÕ , USA, RenavitÕ , Germany) per tablet.
4.1.2 Fat-soluble vitamins
Vitamin D is not considered in this section as its
metabolism, effect and administration in MHD
patients depend on phosphocalcic metabolism and
bone status, and has been the focus of a recent set of
guidelines [21].
Vitamin A (retinol)
A daily intake of 700–900 mg is recommended.
Vitamin A supplements are not recommended.
Rationale. Vitamin A is found in dairy products, fish
oil, liver, spinach and carrots. Vitamin A is necessary
for night vision and epithelium maintenance. Serum
plasma levels of vitamin A are elevated in patients with
chronic kidney disease. Vitamin A is not removed
during MHD and deficiencies are rare and mostly
related to inadequate nutritional intake. Vitamin A
toxicity includes hypercalcaemia, anaemia and hypertriglyceridaemia. In order to prevent vitamin A
toxicity, supplements containing larger amounts than
700–900 mg/day should not be given to MHD patients.
Patients receiving total parenteral nutrition (TPN) may
require vitamin A supplements, but not greater than
700–900 mg/day [3,5].
ii65
Vitamin E (alpha-tocopherol)
A daily supplement of 400–800 IU is recommended in
secondary prevention of cardiovascular events and for
preventing recurrent muscle cramps.
Rationale. Vitamin E is a strong antioxidant and
cell membrane protector. Vitamin E is mainly found
in vegetable oils (corn, sunflower and soybean) and
wheat germs. Vitamin E plasma levels are not
influenced by the dialysis session, and no vitamin E
is found in the spent dialysate. There is no decrease in
vitamin E plasma levels in long-term MHD patients
[22]. The potential benefits of vitamin E supplementation were addressed in a large randomized controlled
trial (Secondary Prevention with Antioxidants of
Cardiovascular disease in End-stage renal disease,
SPACE). A total of 196 MHD patients with preexisting cardiovascular disease were randomly assigned
to either a treatment group (97 patients) receiving
800 IU vitamin E or a control group (99 patients)
receiving a placebo. Patients were followed up for a
median of 519 days. The primary end point was
myocardial infarction, ischaemic stroke, peripheral
vascular disease, unstable angina. Sixteen percent
of patients on vitamin E vs 33% on placebo proceeded
to a primary endpoint and 5.1% on vitamin E
vs 17.2% on placebo suffered from myocardial
infarction, both reductions being highly significant in
favour of the use of vitamin E [23].
Vitamin E supplementation appears to be effective
in reducing the incidence of leg cramps. Roca et al. [24]
compared the effect of quinine and vitamin E in 40
patients with a history of leg cramps who were
randomized to either quinine 325 mg or vitamin E
400 IU taken daily at bedtime for 2 months. Quinine
and vitamin E were equally effective in reducing
cramps as compared with the wash-out period,
but due to potential toxicity of quinine, vitamin E
should be recommended as treatment of choice [24].
As shown previously for vitamin C in the Khajehdehi
et al. trial [10], vitamin E (400 mg daily) alone or in
combination with vitamin C (250 mg daily) was able to
alleviate muscle cramps significantly when patients
receiving both vitamins E and C (97%) or vitamin E
alone (54%) whereas only 7% of the placebo group
patients improved [10].
Presently, some but not all renal multivitamin
formulas include vitamin E, 30 IU (Dialyvite3000Õ ,
USA) and 35 IU (RenaxÕ , USA) per tablet.
Vitamin K
A daily intake of 90–120 mg is recommended.
There is no need for vitamin K supplementation,
except in patients receiving long term antibiotic
treatment or those with altered coagulant activity;
a daily amount of 10 mg vitamin K may be
temporarily administered.
Rationale. Vitamin K is contained in green
leaves vegetables (cabbage, spinach) and cow milk.
ii66
Vitamin K undergoes intestinal reabsorption through
enterohepatic cycling, which may be reduced during
oral antibiotic administration. Vitamin K (K for
Koagulation in german) is essential in promoting
synthesis of II, VII, IX and X coagulation factors
but also of some coagulation inhibitors such as
factor C, S and Z. Vitamin K is a cofactor for the
g-carboxylation of glutamate in proteins (GLAproteins) such as the matrix GLA-protein and osteocalcin, explaining a potential role of vitamin K
deficiency in patients with bone fractures. In addition,
high plasma vitamin K levels have been associated
with soft tissue calcifications in MHD patients and
elevated serum parathormone values were found in
patients with a low plasma vitamin K level [25].
The daily recommended allowance for healthy
individuals is 90–120 mg [26]. There is no evidence
that MHD patients suffer from vitamin K deficiency.
Patients who are treated with antibiotics for
prolonged periods and who have a poor nutritional
intake may benefit from a 10 mg/day vitamin K
supplement. Patients receiving TPN may require
7.5 mg vitamin K per week [5].
4.2. Minerals
Phosphate (phosphorus)
A daily intake of 800–1000 mg phosphate is
recommended.
Dietary education improves phosphate control.
Dietary phosphate control should not compromise
protein intake.
Rationale. Dietary phosphate intake should be
restricted in MHD patients to avoid hyperphosphataemia leading to secondary hyperparathyroidism.
The consequences and treatment of hyperphosphataemia are well known and have been reviewed recently in
the context of the management of renal bone disease
[21,27]. Foods with a high protein content may contain
12–16 mg phosphate per gram protein, with dairy
products having the highest ratio. Thus, a protein
intake of 80 g (optimal for a MHD patient weighing
70 kg) will bring about 1100 mg phosphate daily.
Since 40–80% of the oral phosphate load will be
absorbed, depending on vitamin D administration,
the net phosphate gain for two days will be
800–1700 mg. Because one standard haemodialysis
session can only clear 500–700 mg phosphate,
this will result in a positive phosphate balance,
an increase in calcium–phosphate product, an increase
in serum parathyroid hormone and a greater cardiovascular risk [21]. However, compromising protein
intake at the expense of phosphate restriction should
be avoided. Foods high in protein but with the
least amount of phosphate should preferably be
prescribed through a detailed dietitian interview.
Hyperphosphataemia should be treated by intensive
counselling, by increasing phosphate binders and
D. Fouque et al.
by reviewing the dialysis regimen as appropriate.
It has recently been shown in a randomized dietary
intervention trial that MHD patients who received
extra counselling on the phosphate content of food
and a detailed report of their own phosphocalcic
laboratory parameters, they reduced their serum
phosphate and calcium phosphate product by 23%
(P < 0.01 for both parameters) after 6 months of
intervention [28].
More frequent dialysis sessions (e.g. short daily or
long nightly schedules) have been reported in pilot
studies to improve control of hyperphosphataemia
despite increased protein and phosphate intake [29].
Longer duration of dialysis (‘t’ from Kt/V) also helps
to improve control serum phosphate, as well as
increasing the dialysis membrane surface.
Calcium
The total intake of elemental calcium should not
exceed 2000 mg/day including calcium obtained from
calcium-based phosphate binders.
Rationale. Calcium intake may be limited due
to dietary phosphate restriction (milk and dairy
products). Overall, a mean food calcium intake
is comprised between 500 and 800 mg/day. However,
other sources of calcium include calcium-based
phosphate binders, and thus the total daily intake of
calcium could be much greater, leading to a positive
calcium balance, vascular calcifications and episodes
of hypercalcaemia. For these reasons, the total amount
of oral calcium intake including calcium-based
phosphate binders should not exceed 2000 mg daily,
and non-calcium phosphate binders should be
used if hyperparathyroidism is not controlled.
The consequences and treatment of altered phosphocalcic metabolism have been extensively reviewed in
recent guidelines regarding the management of renal
bone disease and metabolism [21].
Sodium and fluid
A daily intake of no more than 80–100 mmol
(2000–2300 mg) sodium or 5–6 g (75 mg/kg BW) per
day of sodium chloride is recommended.
Interdialytic weight gain (IDWG) should not exceed
4–4.5% of dry body weight.
Rationale. The importance of controlling interdialytic
weight gain (IDWG) by restricting dietary sodium
(and fluid intake) and the preference for using lower
sodium dialysate, has been described in the
Haemodynamic Instability Guideline 2.1.
With progressive loss of urine output, sodium and
fluid restrictions are vital to control extra cellular
volume, blood pressure and to prevent excessive
IDWG in anuric and oliguric MHD patients.
By reducing the sodium load from diet and dialysate,
the lesser urge for patients to quench their
EBPG guideline on nutrition
thirst improves compliance with fluid restriction and
reduces IDWG. A reduction in sodium intake to
80–100 mmol/l (5–6 g salt) in addition to lowering the
dialysate sodium concentration from 140 to 135 mmol/l
appears to be sufficient to suppress thirst and hence
excessive weight gain. This also benefits blood pressure
control and might result in the withdrawal of
antihypertensive treatment in some patients [30].
The majority of dietary sodium, 70–80%, is derived
from salt and mono sodium glutamate added to food
at home, in restaurants and food outlets or by food
manufacturers. Examples of some convenience foods
are: ready to eat meals, cured meat and fish products,
canned and processed foods. The salt content of some
staple foods such as breakfast cereals (i.e. cornflakes),
bread, butter and margarine and sandwich fillings
contribute significantly to dietary sodium intake.
In anuric patients, each 8 g NaCl (140 mmol Naþ)
requires 1 l of fluid intake to maintain normal serum
sodium. Dietary Naþ intake (mmol) may be calculated
from average daily fluid weight gain (kg) average
serum Naþ concentration (mmol/l). An 80 kg dialysis
patient with 4% IDWG, will have 12 g NaCl intake per
day. Current guidelines for daily fluid intake vary
from 500 to 1000 ml in addition to daily urine output
to achieve an IDWG of 2–2.5 kg or 4–4.5% dry
body weight. Some dialysis centres include the amount
of ‘hidden’ fluid in food in fluid allowance prescriptions. Individual fluid allowances need to be
adapted for patients living in warmer climates, during
periods of hot weather, working in hot environments
and as a result of clinical conditions (high fever).
However, it is more efficient to carefully monitor salt
rather than fluid intake, since as a response to salt
intake, thirst will regulate the subsequent fluid
ingested.
All foods that are liquid at room temperature
(18–208C) should be counted as fluid except oil and
foods with a high fat or sugar content. Reducing
sodium and fluid in addition to a potassium and
phosphate restriction and ensuring that protein and
energy intake is adequate, is difficult and a stepwise
approach to educate the patient is most important.
MHD patients must be advised to avoid those
convenience foods that contain potassium chloride or
other potassium containing additives to replace salt.
ii67
for hyperkalaemia should also be investigated and
corrected such as metabolic acidosis together with a
review of drug therapies that contribute to hyperkalaemia such as angiotensin-converting enzyme
inhibitors, angiotensin receptor blockers, spironolactone, b-blockers, non-steroidal anti-inflammatory
drugs and other contributing drug therapies. Tissue
destruction (e.g. catabolism) as a result of trauma or
weight loss releases potassium from intracellular
space and results in hyperkalaemia in haemodialysis
patients [31].
4.3. Trace elements
Iron (Fe)
A daily intake of 8 mg Fe for men and 15 mg
for women is recommended.
Supplementary Fe should be given to all haemodialysis patients treated with an erythropoiesisstimulating agent (ESA), to maintain adequate
serum transferrin and serum ferritin levels,
aimed to achieve a target haemoglobin (Hb) concentration >110 g/l or a haematocrit >33%, except
for those receiving the iron intravenously.
Rationale. The Institute of Medicine (USA) published
the Dietary Reference Intakes (DRI) in 2001 and
recommended a daily iron allowance for adults of 8 mg
for men and 15 mg for women [26]. Fe deficiency is
common in MHD patients and is mainly due to blood
losses during dialysis, frequent blood testing, blood
remaining in dialysers and gastrointestinal bleeding.
Iron absorption from food and oral supplements may
be impaired due to increased gastric pH levels as a
result of phosphate binder and antacid use. Oral Fe
supplements should be taken between meals (at least
2 h after and 1 h before a main meal) to maximize Fe
absorption and should not be taken with phosphate
binders. Oral Fe supplements are known to cause
adverse gastrointestinal effects and compliance with
drug therapy may be compromised. Indeed, most
MHD patients will receive Fe supplementation,
intravenously or orally, as described in detail in
the updated European Best Practice Guidelines for
management of anaemia in patients with chronic renal
failure [27].
Potassium
In patients with a pre-dialysis serum potassium
greater than 6 mmol/l, a daily intake of potassium
of 50–70 mmol (1950–2730 mg) or 1 mmol/kg IBW is
recommended.
Rationale. Hyperkalaemia is a potential cause of
sudden death in MHD patients. There are no warning
signs and when pre-dialysis serum potassium levels
approach 6 mmol/l, nutritional counselling to lower
dietary potassium is indicated, in addition to Calcium
ResoniumÕ or KayexalateÕ . However, other causes
Zinc (Zn)
A daily nutritional intake of 8–12 mg of elemental
zinc (Zn) for women and 10–15 mg for men is
recommended.
Routine zinc supplementation is not recommended.
A zinc supplementation of 50 mg Zn element per day
for 3–6 months should be considered in haemodialysis
patients with a chronic inadequate protein/energy
intake and symptoms evoking zinc deficiency
(impaired taste or smell, skin fragility, impotence,
peripheral neuropathy).
ii68
Rationale. Zinc deficiency is rare in western countries
since zinc is absorbed in large quantities from protein
rich foods such as red meat, fish and shellfish, milk
and milk products, poultry and eggs. Zinc is albumin
bound and plays an important role in protein,
carbohydrate, energy, nucleic acid and lipid metabolism [32]. The Institute of Medicine (USA) recommends for healthy adults a daily zinc intake of 8 mg
for women and 11 mg for men [26]. In the United
Kingdom, recommendations are slightly different,
7 mg for women and 9 mg for men [33]. Matson et al.
[34] and Kalantar-Zadeh et al. [35] recommend 12 mg
of elemental zinc for women and 15 mg for men.
Early signs of deficiency include defects in rapidly
dividing tissues such as skin, intestinal mucosa
and immune response, decreased taste acuity with a
loss in taste buds, impotence, glucose intolerance
and hyperlipidaemia. Taste and smell impairment
associated with chronic uraemia contributes to anorexia leading to a reduced food intake that includes
protein and may result in zinc deficiency [5].
Zinc deficiency in uraemic patients may contribute to
peripheral neuropathy [36]. Oral iron supplements,
calcium-based phosphate binders and corticosteroids
may promote zinc deficiency. Although improvements
in taste, smell, appetite, wound healing, immune
response and sexual function have been reported
when zinc supplements were prescribed, results were
not supportive in several earlier studies. Most involved
a small number of MHD patients, were of short
duration whereas zinc concentration levels may vary
due to different laboratory techniques. Zinc supplementation should be given for at least 3 months since
shorter trials did not show expected improvements on
taste [34] or immune system [36,37]. It was shown in
a 3-month randomized crossover trial that zinc
supplementation, 50 mg Zn element per day for
90 days significantly increased serum zinc level from
low to normal and also increased nPCR and serum
cholesterol [38,39]. In more observational reports,
nerve conduction velocity improved with zinc supplementation [40] as well as sexual potency [41] but not
all studies have confirmed this [42].
Zinc sulphate is a gastric irritant and should be
taken with meals. Zn acetate, Zn aspartate and
Zn chloride seem to be better tolerated even on an
empty stomach [36,41]. Adding zinc to the haemodialysate may be considered if side effects associated with
oral supplementation prohibit their use. During a
randomized crossover study, serum zinc levels, taste
acuity and nerve conduction velocity improved by
adding zinc to dialysate during 12 weeks and achieving
an increase in serum zinc from 10.1 1.3 to
23.1 0.7 mmol/l (N ¼ 13.8 1.9) [40]. Once this
supplement was discontinued at the end of the 3
months supplementation, taste acuity reduced.
Serum zinc levels lowered to baseline levels indicating
that zinc supplementation should have been continued
to maintain normal zinc levels.
Presently, some but not all renal multivitamin
formulas include zinc, 15 mg (Dialyvite3000Õ , USA),
D. Fouque et al.
20 mg (RenaxÕ , USA) and
3000-ZincÕ , USA) per tablet.
50 mg
(Dialyvite
Selenium (Se)
A daily intake of 55 mg of selenium is recommended.
Routine
selenium
supplementation
is
not
recommended.
A selenium supplementation for 3–6 months should be
considered in haemodialysis patients with symptoms
evoking selenium deficiency (cardiomyopathy,
skeletal myopathy, thyroid dysfunction, haemolysis,
dermatosis).
Rationale. Selenium is an essential trace element
leading to an adequate glutathionine peroxidase
(GPX) activity that protects cells from lipid peroxidation. Thyroid function regulation depends on selenium.
The recommended intake for healthy males and
females is 55 mg/day [26]. In case of acute oxidative
stress, selenium needs may increase up to 100–150 mg/
day. Intestinal absorption is thought to be 50–65%
[32]. The main sources of selenium are meat, fish, fat,
vegetables and cereals. However, selenium content of
food depends on the selenium content of local soil on
which crops have grown or animals have grazed.
A severe cardiomyopathy has been reported in the
region of Keshan, China, where there is an extreme
lack in selenium in earth and food, leading to very low
selenium intake (<15 mg/day) and low serum selenium
in humans. This cardiac disease is reversed by
administering a selenium supplement. Other clinical
symptoms of altered selenium metabolism include
skeletal muscle dystrophia, haemolysis and dermatosis.
Low serum selenium in CKD and MHD patients are
not uncommon. There is no recommendation for
selenium supplementation for CKD patients but if
prescribed, selenium levels should be monitored
closely, as selenium is excreted by the kidney and not
removed by dialysis [5]. Selenium supplementation
might be helpful in partially improving thyroid
function in MHD patients. In a randomized control
trial, Napolitano et al. [43] administered selenium to
stable MHD patients. Ten patients received sodium
selenite supplements orally, 500 mg three times weekly
for the first 3 months followed by 200 mg three times
weekly for the next 3 months, whereas five patients
received a placebo. Selenium supplementation was well
tolerated and a significant increase in serum selenium
was observed as well as an improvement in thyroid
function tests (i.e. a reduction in TSH) and an
improvement in immune parameters in patients receiving selenium. No side effect was reported [43,44].
In a small pilot trial, Richard et al. [45] administered
selenium intravenously as sodium selenite in six MHD
patients, 50 mg at the end of the dialysis session three
times weekly for the first five weeks then 100 mg for the
next 15 weeks. This treatment was able to increase
serum selenium levels and restore glutathione peroxidase activity to normal.
EBPG guideline on nutrition
ii69
Presently, some renal multivitamin formulas
include selenium, 70 mg per tablet (Dialyvite3000Õ
and RenaxÕ , USA).
Table 2. Recommended dietary intake and supplements of vitamins
and trace elements in adult haemodialysis patients (opinion)
Vitamins
Daily recommendation
Thiamine hydrochloride (B1)
Riboflavin (B2)
Pyridoxine hydrochloride (B6)
Ascorbic Acid (C)
Folic Acid (B9)
Cobalamine (B12)
Niacin (B3, nicotinamide,
nicotinic acid, PP)
Biotin (B8)
Pantothenic acid (B5)
Retinol (A)
1.1–1.2 mg supplement
1.1–1.3 mg supplement
10 mg supplement
75–90 mg supplement
1 mg supplement
2.4 mg supplement
14–16 mg supplement
Alpha-tocopherol (E)
Vitamin K
Minerals and Trace elements
Phosphorus
Calcium
Sodium
Potassium
Iron
Zinc
Selenium
30 mg supplement
5 mg supplement
700–900 mg intake
(no supplement)
400–800 IU supplementa
90–120 mg intake
(no supplement)
800–1000 mg intake
2000 mg intake including
calcium from phosphate binders
2000–2300 mg intake
i.e. 5–6 g sodium chloride
50–70 mmol intake
(1950–2730 mg) or 1 mmol/kgb
8 mg (men) and 15 mg (women)
intakec
10–15 mg (men) and 8–12 mg
(women) intake (no supplement)d
55 mg intake (no supplement)e
a
For secondary prevention of cardiovascular events and muscle
cramps.
b
Only in hyperkalaemic patients, otherwise liberal intake.
c
In case of EPO treatment, supplemental iron is to be added,
either orally or parenterally.
d
In case of malnutrition or symptoms of zinc deficiency, a trial
of 50 mg Zn/day for 3–6 months could be considered (see text).
e
In case of symptoms of zinc deficiency, a trial of selenium for
3–6 months could be considered (see text).
References
1. Andreucci VE, Fissell RB, Bragg-Gresham JL et al. Dialysi
Outcomes and Practice Patterns Study (DOPPS) Data on
Medication in Hemodialysis Patients. Am J Kidney Dis 2004;
44 [Suppl 2]: S61–S67
2. Fissell RB, Bragg-Gresham JL, Gillespie BW et al. International
variations in vitamin prescription and association with mortality
in the Dialysis Outcomes and Practice Patterns Study (DOPPS).
Am J Kidney Dis 2004; 44: 293–299
3. Chazot C, Kopple JD. Vitamin metabolism and requirements
in renal disease and renal failure. In Nutritional Management
of Renal Disease, Kopple JD, Massry SG Eds, 2nd edn,
Lipincott Williams and Wilkins, Philadelphia, USA: 2004;
315–356
4. Descombes E, Hanck AB, Fellay G. Water soluble vitamins
in chronic hemodiualysis patients and needs for supplementation. Kidney Int 1993; 43: 1319–1328
5. Wiggins KL. Renal Care: Resources and practical
applications. Renal Dietitians Dietetic Practice Group: Am
Diet Ass 2003: 51–52
6. Wang S, Eide TC, Sogn EM et al. Plasma ascorbic acid in
patients undergoing chronic haemodialysis. Eur J Clin
Pharmacol 1999; 55: 527–532
7. Giancaspro V, Nuziello M, Pallotta G et al. Intravenous
ascorbic acid in hemodialysis patients with functional iron
deficiency: a clinical trial. J Nephrol 2000; 13: 444–449
8. Lin CL, Hsu PY, Yang HY et al. Low dose intravenous
ascorbic for erythropoietin hypo-responsive anaemia in diabetic
haemodialysis patients with iron overload. Ren Failure 2003; 25:
443–453
9. Keven K, Kutley S, Nergizoglu G et al. Randomized, crossover
study of the effect of vitamin C on EPO response in hemodialysis
patients. Am J Kidney Dis 2003; 41: 1233–1239
10. Khajehdehi P, Mojerlou M, Behzadi S et al. A randomized
double blind placebo controlled trial of supplementary vitamin
E, C and their combination for treatment of haemodialysis
cramps. Nephrol Dial Transplant 2001; 16: 1448–1451
11. Deicher R, Ziai F, Bieglmayer C, Schillinger M, Horl WH.
Low total vitamin C plasma level is a risk factor for
cardiovascular morbidity and mortality in hemodialysis patients.
J Am Soc Nephrol 2005; 16: 1811–1818
12. Lasseur C, Parrot F, Delmas Y et al. Impact of high-flux/
high-efficiency dialysis on folate and homocysteine metabolism.
J Nephrol 2001; 14: 32–35
13. KDOQI Clinical Practice Guidelines in cardiovascular disease in
dialysis patients. Am J Kidney Dis 2005; S3: 16–153
14. Rostand SG. Vitamin B12 levels and nerve conduction velocities
in patients undergoing maintenance hemodialysis. Am J Clin
Nutr 1976; 29: 691–697
15. Kaplan LN, Mamer OA, Hoffer LJ. Parenteral vitamin B12
reduces hyperhomocysteinemia in end-stage renal disease. Clin
Invest Med 2001; 24: 5–11
16. Mangiarotti G, Canavese C, Salomone M et al. B12
in maintenance hemodialysis patients receiving massive
supplementation of vitamin B12. Int J Artif Organs. 1986; 9:
417–420
17. Takahashi Y, Tanaka A, Nakamura T et al. Nicotinamide
suppresses hyperphosphatemia in hemodialysis patients.
Kidney Int 2004; 65: 1099–1104
18. Rottembourg
JB,
Launay-Vacher
V,
Massard
J.
Thrombocytopenia induced by nicotinamide in hemodialysis
patients. Kidney Int 2005; 68: 2911–2912
19. Grundy SM, Vega GL, McGovern ME et al. Diabetes
Multicenter Research Group. Efficacy, safety, and
tolerability of once-daily niacin for the treatment of dyslipidemia
associated with type 2 diabetes: results of the assessment of
diabetes control and evaluation of the efficacy of niaspan trial.
Arch Intern Med 2002; 162: 1568–1576
20. Canner PL, Furberg CD, Terrin ML, McGovern ME.
Benefits of niacin by glycemic status in patients with healed
myocardial infarction (from the Coronary Drug Project). Am J
Cardiol 2005; 95: 254–257
21. K/DOQI clinical practice guidelines for bone metabolism
and disease in chronic kidney disease. Am J Kidney Dis 2003;
42 [4 Suppl 3]: S1–S201
22. Chazot C, Laurent G, Charra B et al. Malnutrition in
long-term haemodialysis survivors. Nephrol Dial Transplant
2001; 16: 61–69
23. Boaz M, Smetena S, Weinstein T et al. Secondary prevention
with antioxidants of cardiovascular disease in end stage
renal disease (SPACE): randomised placebo-controlled trials.
Lancet 2000; 356: 1213–1218
24. Roca AO, Jarjoura D, Blend D et al. Dialysis Leg Cramps.
Efficacy of quinine versus vitamin E. ASAIO J 1992; 38:
M481–M485
25. Kohlmeier M, Saupe J, Shearer MJ, Schaefer K, Asmus G. Bone
health of adult hemodialysis patients is related to vitamin K
status. Kidney Int 1997; 51: 1218–1221
26. Trumbo P, Schlicker S, Yates AA et al. Dietary references
intakes for energy, carbohydrate, fiber, fat, fatty acids,
ii70
27.
28.
29.
30.
31.
32.
33.
34.
35.
36.
37.
38.
39.
40.
41.
42.
43.
44.
45.
D. Fouque et al.
cholesterol, protein and amino acids. J Am Diet Assoc 2002; 102:
1621–1630
Locatelli F, Aljama P, Barany P. European Best Practice
Guidelines Working Group. Revised European best practice
guidelines for the management of anaemia in patients with
chronic renal failure. Nephrol Dial Transplant 2004; 19 [Suppl 2]:
1–47
Ford JC, Pope JF, Hunt AE, Gerald B. The effect of diet
education on the laboratory values and knowledge of
hemodialysis patients with hyperphosphatemia. J Renal Nutr
2004; 14: 36–44
Galland R, Traeger J, Arkouche W, Cleaud C, Delawari E,
Fouque D. Short daily hemodialysis rapidly improves
nutritional status in hemodialysis patients. Kidney Int 2001; 60:
1555–1560
Krautzig S, Janssen U, Koch KM et al. Dietary salt restriction
and reduction of dialysate sodium to control hypertension in
maintenance haemodialysis patients. Nephrol Dial Transplant
1998; 13: 552–553
Beto JA, Bansal VK. Medical nutrition therapy in chronic
kidney failure: integrating clinical practice guidelines. J Am Diet
Assoc 2004: 104: 404–409
Thomas B. Manual of Dietetic Practice. Brit Diet Ass, 3rd edn,
London, 2001: 182–183
Dietary Reference Values for Food Energy and Nutrients
for the United Kingdom. Department of Health Report on
Health and Social Subjects 1991; 41: 1–210
Matson A, Wright M, Oliver A et al. Zinc supplementation
at conventional doses does not improve the disturbance
of taste perception in HD patients. J Renal Nutr 2003; 13:
224–228
Kalantar-Zadeh K, Kopple JD. Trace elements and vitamins in
maintenance dialysis patients. Adv Renal Repl Therapy 2003; 10:
170–182
Kouw PM, Jonings CH, de Vries PMJM et al. Effects of
zinc supplementation on zinc status and immunity in
haemodialysis patients. J Trace Elem Electrolyte Health
Disease 1991; 5: 115–119
Turk S, Bozfakioglu S, Ecder ST et al. Effects of zinc
supplementation on the immune system and on antibody
response to multivalent influenza vaccine in hemodialysis
patients. Int J Artif Organs 1998; 21: 274–278
Jern NA, VanBeber AD, Gorman MA et al. The effects of
zinc supplementation on serum zinc concentration and
protein catabolic rate in HD patients. J Renal Nutr 2000; 10:
148–153
Chevalier CA, Liepa GL, Murphy MD et al. The effects of
zinc supplementation on serum zinc and cholesterol
concentrations in HD patients. J Renal Nutr 2002; 12: 183–189
Sprenger KBG, Bundschau D, Lewis K et al. Improvement
of uremic neuropathy and hypogeusia by dialysate zinc
supplementation: a double blind study. Kidney Int 1983; 24
[Suppl 16]: S315–S318
Mahajan SK, Abbasi AA, Prasad AS et al. Effect of oral
zinc therapy on gonadal function in HD patients. Ann Intern
Med 1982; 97: 357–361
Rodger RS, Sheldon WL, Watson MJ et al. Zinc deficiency
and hyperprolactinaemia are not reversible causes of
sexual dysfunction in uraemia. Nephrol Dial Transplant 1989;
4: 888–892
Napolitano G, Bonomini, Bomba G et al. Thyroid function
and plasma selenium in chronic uremic patients on
hemodialysis treatment. Biol Trace Element Research 1996; 55:
221–230
Bonomini M, Forster S, De Risio F et al. Effects of selenium
supplementation on immune parameters in chronic uraemic
patients on haemodialysis. Nephrol Dial Transplant 1995; 10:
1654–1661
Richard MJ, Ducros V, Foret M et al. Reversal of selenium
and zinc deficiencies in chronic hemodialysis patients by
intravenous sodium selenite and zinc gluconate supplementation. Time-course of glutathione peroxidase repletion and lipid
peroxidation decrease. Biol Trace Elem Res 1993; 39: 149–159
Guideline 5. Treatment of malnutrition
5.1. Dietary intervention
Malnourished haemodialysis patients should
receive nutritional counselling (Evidence level III).
In hospitalized patients counselling should be started
within 3 days of referral. A daily follow-up should
be performed when patients are at high nutritional
risk and weekly when at low risk (Opinion).
Rationale and commentary
Regular dietary counselling is an important part of
the overall nutritional management of MHD patients.
A qualified dietitian is trained to apply specific
counselling techniques and these are aimed at behavioural change strategies to empower the patient
to make successful changes in his/her diet. A ‘renal’
diet is complex as the intake of several nutrients
requires modification during the different stages of
chronic kidney disease and once again when the mode
of dialysis changes or the patient is transplanted.
Thus a MHD diet requires changes in the intake of
protein and energy, sodium and fluid, potassium,
calcium and phosphate and also in mineral and
vitamin requirements. Early intervention during regular follow up may prevent nutritional inadequacies
and could avert malnutrition.
Several investigators studied the effect of regular
nutritional counselling regarding nutritional intake of
MHD patients. Removing some of the reasons for
inadequacies considerably improved intake without
the need for nutritional supplements. Sehgal et al. [1]
investigated barriers to protein nutrition among MHD
patients in a cohort of 298 patients from 22 dialysis
units. Four parameters were assessed: nutritional
status (serum albumin and PNA); potential medical
barriers (poor appetite, difficulty in chewing, inadequate dialysis, bioincompatible dialysis membranes
and comorbidity); behavioural barriers (knowledge
of the protein content of food and dietary noncompliance) and socio-economic barriers (expense of
foods with a high protein content, lack of support with
shopping and cooking). It was concluded that three
medical factors (poor appetite, inadequate dialysis
and comorbidity), two behaviour factors (lack of
knowledge and low interdialytic weight gain, IDWG)
and one socio-economic factor (need for help with
shopping and cooking) were independently associated
with poor nutritional intake of MHD patients.
Leon et al. [2] showed that frequent nutritional
counselling by trained dietitians and tactfully removing
existing barriers to food optimizes dietary protein
and energy intake that leads to improved serum
albumin, even in the presence of chronic inflammation.
EBPG guideline on nutrition
Akpele and coll. compared in a pilot study in
40 patients on haemodialysis for at least 6 months
intensive dietary counselling vs the prescription of
nutritional supplements [3]. The difference in rate of
change in serum albumin (3.5 g/dl at onset) was
measured [3]. The dietary goal was 1.2 g protein/kg
IBW/day and 30–35 kcal/kg IBW/day. Twenty-six
patients received nutritional supplements and 14 dietary counselling only. Patients receiving intensive
counselling showed greater benefit than those receiving
supplements. Indeed, albumin concentrations rose by
0.06 g/dl/month in the non-supplemented group vs
0.04 g/dl/month in the supplemented group [3].
A possible reason for this smaller change in the
supplemented group was non-compliance and ageusia,
anorexia, gastro intestinal side effects (diarrhoea),
fear of weight gain, taste fatigue and preference for
whole foods. Sharma et al. [4] surveyed 106 Indian
MHD patients and found that patient’s diets changed
over time on dialysis to a lower protein and energy
intake than originally prescribed. Intakes were also
compromised on dialysis days also adding to
an increasingly poorer nutrient intake [4]. Dietary
counselling and continuous monitoring therefore
play an important role in malnutrition prevention.
Steiber et al. [5] analysed nutritional intakes of CKD
patients on admission in a general hospital. Less than
25% of patients with chronic renal failure (pre-dialysis,
HD and CPD) achieved a 75% intake of the
recommended diets. By knowing factors that can
predict poor oral intake at referral, patients at risk
could be identified earlier and their nutritional loss
during hospitalization decreased. Similarly, it was
shown that MHD patients only received 80% or less
of recommended intake when hospitalized over 1 week
[6]. Thus, it is now clear that malnutrition can start or
deteriorate in hospital. Early aggressive intervention
from the start of hospitalization should be initiated
within 3 days of referral with a daily follow up for high
and weekly follow up for low risk patients.
5.2. Oral supplements and enteral feeding
Nutritional supplements should be prescribed
if nutritional counselling does not achieve an
increase in nutrient intake to a level that covers
minimum recommendation (see Guideline 3)
(Evidence level III).
Products specifically formulated for dialysis
patients should be prescribed in preference to
standard supplements for non-renal patients
(Evidence level III).
Enteral tube [naso-gastric or percutaneous
entero-gastrostomy (PEG)] feeding using disease
specific formulas for dialysis patients should be
prescribed if attempts to increase dietary intake
with oral supplements fail and nutritional status
does not improve (Evidence level IV).
ii71
Rationale
The development of several feeding methods such as
PEG tube feeding and Intradialytic Parenteral
Nutrition (IDPN) and the development of diseasespecific commercial products for oral (flavoured),
enteral (no added flavour) and parenteral feeding
have greatly modified the application of nutritional
support for MHD patients during the past years. Oral
or enteral nutritional support is less expensive than
parenteral nutrition. Standard products for oral and
enteral nutritional support contain a mixture of whole
protein and/or amino acids, glucose polymers,
fat components and added vitamins, minerals
(including phosphate) and trace elements. It is preferable to use specific formulated products for
dialysis patients containing more protein and energy
(1.5–2.0 kcal/ml) and less potassium and phosphate
if patients are hyperphosphataemic and/or hyperkalaemic [7]. Some of the oral supplements contain a
non-sweet glucose polymer without addition of other
nutrients or flavours. These are presented as a powder
or as a concentrated liquid and are suitable to be added
to food and drinks to improve energy intake without
significantly altering the taste.
Few clinical trials have been conducted about the
provision of oral nutritional support to dialysis
patients [7] and are limited in patient number and by
short duration. Results have been affected due to
early withdrawal from the trials when patients
experienced side effects such as nausea or diarrhoea
and when non-compliant with prescribed amount of
nutritional supplement(s) [3]. Using essential amino
acid tablets (15 tablets daily for 3 months),
Eustace et al. [8] reported non-compliance as high as
50% at 3 months of oral supplement, underlining the
necessity for more research on supplements specifically
designed for MHD patients.
A recent systematic review and meta-analysis of 18
studies (five randomized and 13 non-randomized
controlled trials) on the use of multi-nutrient oral
supplements and tube feeding in MHD patients by
Stratton et al. [7] showed that oral and enteral
nutritional support improves protein and energy
intake, increases serum albumin concentrations by
0.23 g/dl (P < 0.05) and improves total energy intake.
There is still insufficient data on the clinical effect on
MHD patients and specifically malnourished patients
to determine from which regimen they would benefit
most.
Clinical
benefits
of
oral
nutritional
supplements. A number of studies have investigated
the effect of oral supplements on the nutritional
parameters of MHD patients [3,8–15]. Ivarsen et al.
[15] and Eustace et al. [8] studied the effect of amino
acid supplements on albumin changes in MHD
patients. Providing 19 stable, well-dialysed and wellnourished MHD patients a daily protein supplement
containing 7.8 g amino acids (4.8 g were essential) for
3 months in addition to their usual MHD diet,
ii72
no improvement in nutritional parameters was shown,
although intracellular amino acid concentration
improved significantly [15]. In a randomized double
blind trial, Eustace et al. [8] studied the benefits of a
supplement containing a daily total of 10.8 g essential
amino acids (EAA) in 29 MHD and 19 peritoneal
dialysis (PD) patients with a mean three months prestudy serum albumin of 3.8 g/dl or less. Patients were
taking five tablets (e.g. 3.6 g EAA), three times daily
with food for 3 months. Serum albumin concentrations
increased by 0.22 0.09 g/dl (P ¼ 0.02) in MHD
patients but did not change significantly in the PD
group. Patients with lower serum albumin concentrations improved more. No improvement was seen in
serum amino acid concentrations.
Non-compliance with prescribed supplements and
gastrointestinal side effects can affect the outcome of
oral nutritional support as shown by Akpele et al. [3]. In
this pilot study of 41 MHD patients, 26 patients were
given a commercial renal-specific nutritional supplement in addition to their regular dietary intake for an
average of 6–7 months. The expected increase in protein
and energy intake however was not achieved and several
factors contributed to the lack of compliance such as
taste impairment, anorexia and gastrointestinal side
effects such as nausea, diarrhoea, fear of weight gain,
taste fatigue and preference to whole food. These
investigators concluded that patients may benefit from
a choice in a selection of different nutritional products
with different consistency and flavour to boost their
protein and energy intake [3]. Changing the timing of
taking the prescribed nutritional supplement can
improve compliance. Cockram et al. [11] compared
the gastrointestinal symptoms, bowel habits, routine
blood chemistries, urea kinetics and nPNA in 79
patients over a three week period using three products:
one standard and two special formulas (one with and
one without a fructooligosaccharide – FOS) developed
for renal patients. The investigators found that the two
specialized formulas resulted in lower serum phosphate
levels and a decrease in the calcium–phosphate product.
Patients taking the product containing FOS had less
constipation [11].
Caglar et al. [10] studied 85 malnourished MHD
patients who were given a commercial nutritional
supplement containing 475 kcal and 16.6 g protein for
oral use on haemodialysis days to ensure compliance,
for a period of 9 months. Serum albumin concentration
rose significantly from 3.33 0.32 to 3.65 0.26 mg/dl
(P ¼ 0.002) during 6 months of supplementation.
The changes in BMI (from 25.8 6.1 to 27.1 5.4)
and estimated dry body weight (from 73.1 15.3
to 76.1 16.2 kg) were not statistically significant. The
mean SGA score improved by 14% from baseline by
the end of the study (P ¼ 0.02) [10].
The effect of two different oral nutritional supplements both providing daily an additional 16 g protein
and 500 kcal on improving body weight and serum
albumin levels was studied by Sharma et al. [14].
Forty seven malnourished MHD patients in India with
a BMI of less than 20 and a serum albumin
D. Fouque et al.
concentration of less than 40 g/l were selected and
40 completed this trial after 1 month of thrice weekly
dialysis. Twenty-six patients received oral supplements
containing 16 g protein and 500 kcal either as a
commercial supplement (CS) or a low cost home
made blend (HP Blend) after the dialysis session
was completed, for 1 month [14]. Patients were also
prescribed a diet with 1.2 g protein and 35–45 kcal/kg
BW/day followed by regular counselling. The control
group received counselling only. A significant improvement in serum albumin concentration (P ¼ 0.03) was
seen in the supplemented HP Blend and the CS group
even after 1 month compared with the control group.
The HP Blend and control group gained the same
amount of dry weight (2 kg). Patients however were
young, without comorbidities and with baseline BMIs
of 17.9 or less [14]. Kuhlman et al. [12] showed in a
small and short study that specific protein and
energy supplements for CKD patients taken as a sip
feed in addition to a prescribed MHD diet with a total
intake of 1.5 g/kg protein and 45 kcal/kg/day, resulted
in a sustained weight gain of 1.2 0.4 kg during a
3-month period in underweight patients with a mean
BMI of 17.6.
Adding a glucose polymer daily to the regular MHD
diet was investigated by Allman et al. [9] and Milano et
al. [13]. Both investigators reported the absence of
gastrointestinal side effects and the products were well
tolerated. In the first trial, Allman et al. randomly
prescribed 100–150 g glucose polymer equivalent to
400–600 kcal/day to 9 patients in addition to their
usual diet (protein intake: 1.16 0.28 g/kg and energy:
30 10 kcal/kg) for 6 months vs no supplement in the
control group. The supplemented patients gained
3.1 2.3 kg (P < 0.005), 1.8 kg as body fat and 1.3 kg
as lean body mass indicated by changes in anthropometry. BMI rose from 21.3 to 22.9 and this weight
gain was maintained 6 months after stopping the
supplement [9]. In the second trial, Milano et al. [13]
studied the effect of a 100 g glucose polymer supplement (380 kcal) daily in 21 MHD patients in addition
to their usual diet. This amount increased their energy
intake to at least 34 kcal/kg/day. After 6 months of
supplement, their mean weight increased by 2.4 kg
(range 0.6–6.3 kg) but assessed by anthropometry, this
weight gain appeared to be predominantly fat. This
gain was maintained for 6 months after cessation of the
supplement [13].
Clinical benefits of enteral tube feeding. If the provision of oral supplements in addition to intensive
counselling is unsuccessful, tube feeding should be
proposed. Renal specific formulas may be used to
maximize protein and energy supply, while controlling
excessive amounts of fluid, phosphate, potassium and
unnecessary vitamins usually contained in standard
feed products.
Sayce et al. [16] analysed serum albumin and
anthropometry in eight malnourished MHD outpatients
who received PEG feeding for 3–15 months. Energy
dense renal formula tube feeds were prescribed based on
EBPG guideline on nutrition
individual requirements. The feed was administered as a
bolus or by means of continuous pump feeding overnight. Two anuric patients required changes in their
feeding regimens due to fluid overload. The amount of
tube feed was reduced even further during the 3-day
weekend interval when fluid overload was likely to
occur. After 3 months, mean dry weight increased from
a mean of 43.0 to 48.3 kg (P ¼ 0.01). Mid upper arm
circumference increased from 20.2 to 24.8 cm (P ¼ 0.02)
and triceps skinfold thickness from 17.7 to 19.8 mm
(P ¼ 0.03). Serum albumin rose from 29.5 to 36.5 g/l
(P ¼ 0.01). It was concluded that home enteral feeding
using PEG access is effective and safe in improving and
maintaining nutritional status in malnourished
MHD patients. Frequent monitoring with provision of
additional support throughout the feeding period
is paramount.
Holley et al. [17] performed a retrospective analysis of
a small cohort of 10 MHD patients (mean age 66 years)
who received nasogastric or PEG enteral feeding for
1–36 months. Seven out of ten patients had suffered a
cerebrovascular accident; two patients were in intensive
care units. In five patients, tube feeding was supplementary to a normal nutrition and provided 50% of
protein and energy of their requirements to achieve a
protein intake of 1.0–1.3 g protein/kg BW and 30–
35 kcal/kg per day. Serum albumin rose from 2.8 to
3.3 g/dl (P ¼ 0.04) by the end of the feeding period, but
no significant weight gain was reported. Eight out of ten
patients had at least one episode of hypophosphataemia
(<2.0 mg/dl in four of the eight patients) which
was resolved by replacing the regimen from the renal
to a standard formula and by using phosphate
supplements [17]. Although retrospective and of limited
size, these results should encourage well designed
prospective studies in MHD patients.
Recommendations for further research
What is the optimal composition of oral supplements (taste, concentration, electrolyte composition, vitamin and trace content)?
What is the optimal schedule and delivery rate of
oral and enteral supplements?
What are the indications, optimal duration and
complications of PEG in MHD patients?
Is it possible to improve patient’s appetite with
specific oral supplements?
5.3. Intradialytic parenteral nutrition
When intensive dietary support, oral supplements
and enteral nutrition have failed, a course of
parenteral nutrition is recommended (Evidence
level IV).
Intradialytic parenteral nutrition (IDPN) is
recommended in malnourished patients only if
spontaneous nutrient intake is >20 kcal/kg IBW
and 0.8 g protein/kg IBW/day. Otherwise, total
parenteral nutrition infused over the entire day is
indicated (Opinion).
ii73
Rationale and commentary
There are many speculative reasons that intravenous
nutrition may improve patient’s nutritional status.
In the particular case of maintenance dialysis, the fact
that patients will be referred three times weekly with
vascular access allowing additional nutrient infusion
theoretically simplifies applicability, delivery and
compliance to parenteral nutrition. On the other
hand, time to exposure for nutritional support is
rather short (standard 10–15 h weekly) as compared
with total parenteral nutritional support used in
intensive care units or at home for patients with
intestinal failure. Hence, non-renal nutritionists
often question the efficacy of IDPN. In addition,
IDPN is more expensive than any oral or enteral
nutrition. The key questions are: do patients have a
spontaneous intake great enough to supplement
through a limited delivery related to the intermittent
pattern of intradialytic parenteral nutrition (e.g.
greater than 20 kcal and 0.8 g protein/kg IBW/day),
and how will IDPN interfere with spontaneous
patient’s intake throughout metabolic and appetite
alterations?
Several retrospective analyses, prospective trials
and reviews have addressed the various aspects
of IDPN [18–28]. From a metabolic point of view,
one haemodialysis session dramatically decreases the
plasma amino acids and as a consequence, blunts
intracellular muscle protein synthesis. In addition,
in response to the rapid plasma amino acid decrease
at the start of the haemodialysis session, muscle
proteolysis occurs in order to maintain an adequate
plasma and cellular amino acid concentration [29].
These events result in a clear catabolic state at the
end of the dialysis session [30–32]. In the long term
these catabolic modifications may lead to muscle
wasting. Feeding patients by parenteral route during
the dialysis session has been shown to revert this
acute catabolic state by maintaining a normal
plasma amino acid concentration [30]. Recently,
Pupim et al. [33] reported that a brief 15 min cycling
exercise at the beginning of the dialysis session
dramatically improved the anabolic effect of the
IDPN supplement.
However, it is less clear if these beneficial effects are
associated with long-term improvement in patient’s
nutritional status and morbi-mortality. Indeed,
protein metabolism may be modified during the nondialysis days, and to some extent, compensate for
the dialysis-induced acute catabolic state. In more
prolonged surveys, improvement in serum albumin
[22,24] and patient’s spontaneous intake has been
reported [23,24,27] but few studies were adequately
designed and to date, evidence is low. Thus, long-term
randomized studies should address the potential
effect of IDPN on nutritional status and morbimortality of MHD patients. The ongoing Fines
study, the largest prospective randomized controlled
trial addressing the efficacy on oral and intradialytic
nutritional support in malnourished MHD patients
ii74
will provide evidence for indication and limits of
nutritional support in these patients [18].
5.4. Anabolic agents
In case of severe malnutrition resistant to
optimal nutritional intervention, a course of
androgens should be considered in MHD
patients for three to 6 months (Evidence level II).
Androgens should be administered weekly or
bimonthly (Evidence level II).
Patients should be monitored at regular intervals
for side effects (hirsutism, voice change, priapism, alteration in plasma lipids, liver tests and
prostatic markers) (Evidence level II).
Patients with a known prostate cancer should not
receive androgens (Evidence level II).
Rationale
In healthy adults the body protein mass is maintained
at equilibrium by a subtle tuning between anabolism
and catabolism that is regulated through independent
signals. Among anabolic factors (which promote
growth in childhood, and maintenance of protein
mass in adults), growth hormone (GH) and insulinlike growth factor (IGF)-1 have been studied in-depth
in many disorders, including CKD. Many acute
administration
studies
and
most
mid-term
(3–6 months) treatments with recombinant GH have
reported beneficial metabolic, nutritional and body
composition changes [34–45]. Long-term administration of recombinant GH has not been studied in
CKD adults, and potential side-effects may occur, such
as hyperglycaemia, hypertriglyceridaemia, and sodium
retention. Recombinant GH treatment is only
approved in short stature CKD children and helps to
catch-up growth. However, GH is not currently
approved in adult MHD patients. Recombinant
IGF-1, which also exerts acute anabolic responses
in malnourished dialysis patients [46], is only approved
for the specific Laron nanism, a GH receptor
deficient disease. Thus, except for pituitary insufficiency, a treatment by recombinant GH to improve
nutritional status cannot yet be proposed to adult
dialysis patients.
Androgens are well-known anabolic compounds.
It should be emphasized that with age and CKD,
a relative androgen insufficiency may be present,
underlining a potential cause for muscle loss in
males. Recently, it has been reported that non-renal
male patients with coronary disease and low
plasma testosterone levels did benefit from low-dose
transdermal testosterone treatment, which improved
their coronary symptoms [47]. In elderly patients
without known kidney disease, a 6-month administration of low doses of testosterone to reach supranormal
plasma levels significantly increased muscle mass
and strength [48]. In kidney patients, androgens have
D. Fouque et al.
been largely utilized before the era of erythropoietin
to correct anaemia and reduce the number of
blood transfusions. However, since the release of
recombinant EPO in the 1990s, androgens were left
apart and it is only since recently that their anabolic
properties were rediscovered [48–54]. In a randomized
controlled trial, Johansen et al. [52] assessed
body composition and strength while administering
nandrolone decanoate, 100 mg intramuscularly
weekly for 6 months in 29 MHD patients. Body
composition was monitored by dual energy X-ray
absorptiometry and functional status by treadmill,
walking, and stair-climbing times. Nandrolone
decanoate induced a 4.5 kg lean body mass gain
(P < 0.01) and a fat loss of 2.4 kg (P < 0.01)
from baseline. There was a reduction in reported
symptoms of fatigue and a decrease in walking and
stair climbing times in the nandrolone group.
No changes in serum cholesterol or triglycerides
were reported in either group. Dose adjustment was
done in two women who complained of acne and
amenorrhea [52].
In elderly MHD patients receiving EPO,
Gascon et al. [54] administered nandrolone decanoate,
200 mg intramuscularly weekly for 6 months in
14 patients who were withdrawn from EPO, whereas
19 patients continued to receive regular EPO
treatment. Patients receiving nandrolone gained
weight (from 68.2 9.1 to 70.3 8.6 kg; P < 0.05)
and muscle mass (P < 0.05) [54]. Haemoglobin
improved from 9.6 1.0 to 11.0 1.4 g/dl (P < 0.01)
in the nandrolone group, whereas no change was
observed in the EPO group who received
6000 3900 IU EPO weekly. Serum albumin decreased
from 4.0 0.3 to 3.6 0.5 g/dl (P < 0.05) in the EPO
group, whereas it did not change in the nandrolone
group. During nandrolone treatment, although serum
triglycerides increased from 144 78 to 180 76 mg/dl
(P < 0.05) and HDL-cholesterol decreased from
39 13 to 32 11 (P < 0.05), Lp(a), a strong predictor
of cardiovascular risk, decreased from 26 23
to 9 8 mg/dl (P < 0.005) [54]. Thus, it is not clear in
MHD patients if androgens impair lipid metabolism
to the point of increasing long-term cardiovascular
risk, which should be weighted against the risk of
rapidly worsening malnutrition.
In another retrospective study by Pai and colleagues
[50] in which five women received 25 mg nandrolone
decanoate intramuscularly weekly for 3 months,
no side effect was reported. Serum albumin significantly rose from 29 to 33 g/l (P < 0.05) in the study
of Pai et al. [50] and from 32 to 38 g/l (P < 0.001) in the
prospective randomized trial reported by Navarro
and colleagues [51]. The dose of nandrolone administered in these studies ranged from 100 mg
twice monthly for 3 months to 200 mg weekly for
6 months. Potential side effects include voice
change and hirsutism in women, prostatic markers in
men and abnormal liver tests and change in
lipid metabolism in all and regular follow-up should
be done accordingly [55,56]. Thus, in moderate
EBPG guideline on nutrition
amounts for 3–6 months, nandrolone improved body
composition in MHD patients.
Recommendation for further research
Larger randomized controlled trials of androgens
administration should be performed in various
degrees of malnutrition in MHD patients, in order
to characterize a likely dose-response, the optimal
duration and frequency of administration and to
monitor potential side-effects.
Test the efficacy of a combined intervention of
androgens and exercise training on body composition and nutritional status of malnourished MHD
patients
Measure the effects of a combined intervention by
androgens and supplemental nutrition (either oral,
enteral or parenteral) on body composition and
nutritional status of malnourished MHD patients
5.5. Other interventions: daily dialysis
A 6–12 month trial of daily dialysis (either short
daily or long nocturnal) should be considered as
a rescue therapy in unstable patients undergoing
difficult haemodialysis sessions with symptoms
of malnutrition or malnourished patients with
poor appetite after a negative nutritional workout (Opinion).
ii75
Table 3. Serum albumin level before and at the end of daily
dialysis programs in pilot maintenance dialysis adult patients trials
(SDHD: short daily haemodialysis; NHHD: nocturnal home
haemodialysis)
Reference
Treatment Nb
S. albumin (g/l)
Patients
At start At the end
Woods et al. [67]
Buoncristiani et al. [68]
Pinciaroli [69]
Kooistra and Vos [70]
Galland et al. [61]
Lugon et al. [71]
Pierratos et al. [57]
McPhatter et al. [72]
O’Sullivan et al. [66]
Cacho et al. [73]
SDHD
SDHD
SDHD
SDHD
SDHD
SDHD
NHHD
NHHD
NHHD
NHHD
72
50
22
13
10
5
12
9
5
5
39
39
35
42.2
39
40
41.2
34
36.3
43.0
43.5
44
42.6
43.2
42
43
41.4
41
36.8
43.8
Whether those nutritional changes are beneficial
over the long term is not known and should be the
subject to future well-designed randomized trials.
Indeed, one recent systematic review on the benefits
of
daily
nocturnal
haemodialysis,
although
clearly showing improved blood pressure and left
ventricular hypertrophy, did report mixed effects
on quality of life, anaemia control and phosphocalcic
metabolism [65]. Authors asked for harder endpoint events such as mortality or cardiovascular
morbidity before this strategy could be more largely
diffused.
Rationale
References
Since almost 10 years, daily haemodialysis pilot
trials in Europe and North America have
reported nutritional and metabolic effects in MHD
patients [57–73]. Different schedules as well as durations have been proposed, such as six 2-h morning
sessions to seven 8-h slow nocturnal sessions weekly.
Interestingly, although nutrition was not the primary
cause for enrolling patients in these programs,
most reported unexpected improvements in appetite,
clinical and biological nutritional parameters.
Table 3 reports the change in serum albumin
before and after switching from standard haemodialysis thrice weekly to daily dialysis. The improvement
appeared greater in studies in which patients disclosed
lower albumin levels, except for one [66]. In studies
where nutritional status and dietary intake were
followed, increase in food intake was best explained
by an increase in well-being, a reduced interdialytic
weight gain, a decrease in phosphate binders and
KayexalateÕ , which are known to decrease
appetite [61]. Another possible explanation, yet
unproved, could be a better clearance of catabolic
molecules and/or anorectic compounds. Thus,
daily dialysis allows freeing patients from dietary
restrictions and, at least for some months, may be
viewed as a rescue therapy in malnutrition states.
1. Sehgal AR, Leon J, Soinski JA. Barriers to adequate
protein nutrition among haemodialysis patients. J Renal Nutr
1998; 8: 179–187
2. Leon JB, Majerle AD, Soinski JA, et al. Can a nutrition
intervention improve albumin levels among hemodialysis
patients? A pilot study. J Renal Nutr 2001; 11: 9–15
3. Akpele L, Bailey JL. Nutrition counseling impacts serum
albumin levels. J Renal Nutr 2004; 14: 143–148
4. Sharma M, Rao M, Jacob S et al. A dietary survey in Indian
hemodialysis patients. J Renal Nutr 1999; 9: 21–25
5. Steiber AL. Clinical indicators associated with poor oral
intake of patients with chronic renal failure. J Renal Nutr
1999; 9: 84–88
6. Laville M, Fouque D. Nutritional aspects in hemodialysis.
Kidney Int 2000; Suppl 76: S133–S139
7. Stratton RJ, Bircher G, Fouque D et al. Multinutrient oral
supplements and tube feeding in maintenance dialysis: a
systematic review and meta-analysis. Am J Kidney Dis 2005;
46: 387–405
8. Eustace JA, Coresh J, Kutchey C et al. Randomized doubleblind
trial
of
oral
essential
amino
acids
for
dialysis-associated hypoalbuminemia. Kidney Int 2000; 57:
2527–2538
9. Allman MA, Allen BJ, Stewart PM et al. Body protein of
patients undergoing haemodialysis. Eur J Clin Nutr 1990; 44:
123–131
10. Caglar K, Fedje L, Dimmitt R, et al. Therapeutic effects of oral
nutritional supplementation during hemodialysis. Kidney Int
2002; 62: 1054–1059
ii76
11. Cockram DB, Hensley MK, Rodriguez M, et al. Safety
and tolerance of medical nutritional products as sole
sources of nutrition in people on hemodialysis. J Renal Nutr
1998; 8: 25–33
12. Kuhlmann MK, Schmidt F, Kohler H. High protein/energy
vs. standard protein/energy nutritional regimen in the
treatment
of
malnourished
hemodialysis
patients.
Miner Electrolyte Metab 1999; 25: 306–310
13. Milano MC, Cusumano AM, Navarro ET et al.
Energy supplementation in chronic hemodialysis patients
with moderate and severe malnutrition. J Renal Nutr 1998; 8:
212–217
14. Sharma M, Rao M, Jacob S et al. A controlled trial of
intermittent enteral nutrient supplementation in maintenance
hemodialysis patients. J Renal Nutr 2002; 12: 229–237
15. Ivarsen P, Frystyk J, Pedersen EB. The pattern of intracellular
free amino acids in granulocytes from hemodialysis
patients change to an oral protein supplement (granulocyte
amino acids after protein in HD patients). Clin Nephrol 1999; 52:
110–118
16. Sayce H, Rowe P, McGonogle R: Percutaneous endoscopic
gastrostomy feeding in hemaodialysis out-patients. J Human
Nutr Diet 2000; 13: 333–341
17. Holley JL, Kirk J. Enteral tube feeding in a cohort of chronic
hemodialysis patients. J Renal Nutr 2002; 12: 177–182
18. Cano N. Intradialytic parenteral nutrition: where do we go
from here? J Renal Nutr 2004; 14: 3–5
19. Foulks CJ. An evidence-based evaluation of intradialytic
parenteral nutrition. Am J Kidney Dis 1999; 33: 186–192
20. Chertow GM, Ling J, Lew NL et al. The association of
intradialytic parenteral
nutrition
administration with
survival in hemodialysis patients. Am J Kidney Dis 1994; 24:
912–920
21. Kopple JD. Therapeutic approaches to malnutrition in
chronic dialysis patients: the different modalities of nutritional
support. Am J Kidney Dis 1999; 33: 180–185
22. Capelli JP, Kushner H, Camiscioli TC et al. Effect of
intradialytic parenteral nutrition on mortality rates in endstage renal disease care [see comments]. Am J Kidney Dis 1994;
23: 808–816
23. Piraino AJ, Firpo JJ, Powers DV. Prolonged hyperalimentation
in catabolic chronic dialysis therapy patients. J Parenter Enteral
Nutr 1981; 5: 463–477
24. Hiroshige K, Iwamoto M, Kabashima N et al. Prolonged
use of intradialysis parenteral nutrition in elderly malnourished
chronic haemodialysis patients. Nephrol Dial Transplant 1998;
13: 2081–2087
25. Guarnieri G, Faccini L, Lipartiti T et al. Simple methods
for nutritional assessment in hemodialyzed patients. Am J Clin
Nutr 1980; 33: 1598–1607
26. Wolfson M, Jones MR, Kopple JD. Amino acid losses
during hemodialysis with infusion of amino acids and glucose.
Kidney Int 1982; 21: 500–506
27. Cano N, Labastie-Coeyrehourq J, Lacombe P et al. Perdialytic
parenteral nutrition with lipids and amino acids in
malnourished hemodialysis patients. Am J Clin Nutr 1990; 52:
726–730
28. Navarro JF, Mora C, Leon C et al. Amino acid losses
during hemodialysis with polyacrylonitrile membranes:
effect of intradialytic amino acid supplementation on
plasma
amino
acid
concentrations
and
nutritional
variables in nondiabetic patients. Am J Clin Nutr 2000; 71:
765–773
29. Raj DS, Zager P, Shah VO et al. Protein turnover and
amino acid transport kinetics in end-stage renal disease. Am J
Physiol Endocrinol Metab 2004; 286: E136–143
30. Pupim LB, Flakoll PJ, Brouillette JR et al. Intradialytic
parenteral
nutrition
improves
protein
and
energy
homeostasis in chronic hemodialysis patients. J Clin Invest
2002; 110: 483–492
D. Fouque et al.
31. Raj DS, Welbourne T, Dominic EA et al. Glutamine
kinetics and protein turnover in end-stage renal disease. Am J
Physiol Endocrinol Metab 2005; 288: E37–E46
32. Bohe J, Rennie M. Muscle protein metabolism during
haemodialysis. J Renal Nutr 2006; 16: 3–16
33. Pupim LB, Flakoll PJ, Levenhagen DK et al. Exercise
augments the acute anabolic effects of intradialytic
parenteral nutrition in chronic hemodialysis patients. Am J
Physiol Endocrinol Metab 2004; 286: E589–E597
34. Kopple JD, Brunori G, Leiserowitz M et al. Growth
hormone induces anabolism in malnourished maintenance
haemodialysis patients. Nephrol Dial Transplant 2005; 20:
952–958
35. Kotzmann H, Yilmaz N, Lercher P et al. Differential
effects of growth hormone therapy in malnourished hemodialysis patients. Kidney Int 2001; 60: 1578–1585
36. Johannsson G, Bengtsson BA, Ahlmen J. Double-blind,
placebo-controlled study of growth hormone treatment in
elderly patients undergoing chronic hemodialysis: anabolic
effect and functional improvement. Am J Kidney Dis 1999; 33:
709–717
37. Iglesias P, Diez JJ, Fernandez-Reyes MJ et al. Recombinant
human growth hormone therapy in malnourished dialysis
patients: a randomized controlled study. Am J Kidney Dis
1998; 32: 454–463
38. Garibotto G, Barreca A, Russo R et al. Effects of recombinant
human growth hormone on muscle protein turnover
in malnourished hemodialysis patients. J Clin Invest 1997;
99:97–105
39. Blake PG: Growth hormone and malnutrition in dialysis
patients. Perit Dial Int 1995; 15: 210–216
40. Ikizler TA, Wingard RL, Breyer JA et al. Short-term effects
of recombinant human growth hormone in CAPD patients.
Kidney Int 1994; 46: 1178–1183
41. Schulman G, Wingard RL, Hutchison RL et al. The effects
of recombinant human growth hormone and intradialytic
parenteral nutrition in malnourished hemodialysis patients.
Am J Kidney Dis 1993; 21: 527–534
42. Ziegler TR, Lazarus JM, Young LS et al. Effects of recombinant
human growth hormone in adults receiving maintenance
hemodialysis. J Am Soc Nephrol 1991; 2: 1130–1135
43. Hansen TB, Gram J, Jensen PB et al. Influence of
growth hormone on whole body and regional soft tissue
composition in adult patients on hemodialysis. A double-blind,
randomized, placebo-controlled study. Clin Nephrol 2000; 53:
99–107
44. Ericsson F, Filho JC, Lindgren BF. Growth hormone
treatment in hemodialysis patients – a randomized,
double-blind, placebo-controlled study. Scand J Urol Nephrol
2004; 38: 340–347
45. Kotzmann H, Riedl M, Pietschmann P et al. Effects of
12 months of recombinant growth hormone therapy on
parameters of bone metabolism and bone mineral density
in patients on chronic hemodialysis. J Nephrol 2004; 17: 87–94
46. Fouque D, Peng SC, Shamir E et al. Recombinant
human insulin-like growth factor-1 induces an anabolic
response in malnourished CAPD patients. Kidney Int 2000; 57:
646–654
47. English KM, Steeds RP, Jones TH et al. Low-dose
transdermal testosterone therapy improves angina threshold
in men with chronic stable angina: a randomized,
double-blind, placebo-controlled study. Circulation 2000; 102:
1906–1911
48. Ferrando AA, Sheffield-Moore M, Yeckel CW et al.
Testosterone administration to older men improves muscle
function: molecular and physiological mechanisms. Am J
Physiol Endocrinol Metab 2002; 282: E601–E607
49. Bhasin S, Woodhouse L, Casaburi R et al. Testosterone
dose-response relationships in healthy young men. Am J
Physiol Endocrinol Metab 2001; 281: E1172–E1181
EBPG guideline on nutrition
50. Barton Pai A, Chretien C, Lau AH. The effects of nandrolone
decanoate on nutritional parameters in hemodialysis patients.
Clin Nephrol 2002; 58: 38–46
51. Navarro JF, Mora C, Macia M et al. Randomized prospective
comparison between erythropoietin and androgens in CAPD
patients. Kidney Int 2002; 61: 1537–1544
52. Johansen KL, Mulligan K, Schambelan M. Anabolic effects
of nandrolone decanoate in patients receiving dialysis: a
randomized controlled trial. JAMA 1999; 281: 1275–1281
53. Johnson CA. Use of androgens in patients with renal failure.
Semin Dial 2000; 13: 36–39
54. Gascon A, Belvis JJ, Berisa F et al. Nandrolone decanoate is a
good alternative for the treatment of anemia in elderly male
patients on hemodialysis. Geriatr Nephrol Urol 1999; 9: 67–72
55. Teruel JL, Aguilera A, Avila C et al. Effects of androgen
therapy on prostatic markers in hemodialyzed patients.
Scand J UrolNephrol 1996; 30: 129–131
56. Teruel JL, Lasuncion MA, Rivera M et al. Nandrolone
decanoate reduces serum lipoprotein(a) concentrations in
hemodialysis patients. Am J Kidney Dis 1997; 29: 569–575
57. Pierratos A, Ouwendyk M, Francoeur R et al. Nocturnal
hemodialysis: three-year experience. J Am Soc Nephrol 1998; 9:
859–868
58. Vos PF, Zilch O, Kooistra MP. Clinical outcome of daily
dialysis. Am J Kidney Dis 2001; 37: S99–S102
59. Kooistra MP, Vos J, Koomans HA et al. Daily home
haemodialysis in The Netherlands: effects on metabolic control,
haemodynamics, and quality of life. Nephrol Dial Transplant
1998; 13: 2853–2860
60. Lacson E, Jr, Diaz-Buxo JA. Daily and nocturnal
hemodialysis: how do they stack up? Am J Kidney Dis 2001;
38: 225–239
61. Galland R, Traeger J, Arkouche W et al. Short daily
hemodialysis rapidly improves nutritional status in hemodialysis
patients. Kidney Int 2001; 60: 1555–1560
62. Goffin E, Pirard Y, Francart J et al. Daily hemodialysis
and nutritional status. Kidney Int 2002; 61: 1909–1910
63. Schulman G. Nutrition in daily hemodialysis. Am J Kidney Dis
2003; 41: S112–115
64. Maduell F, Navarro V, Torregrosa E et al. Change from three
times a week on-line hemodiafiltration to short daily on-line
hemodiafiltration. Kidney Int 2003; 64: 305–313
65. Walsh M, Culleton B, Tonelli M et al. A systematic review
of the effect of nocturnal hemodialysis on blood pressure,
left ventricular hypertrophy, anemia, mineral metabolism,
and health-related quality of life. Kidney Int 2005; 67: 1500–1508
66. O’Sullivan DA, McCarthy JT, Kumar R et al. Improved
biochemical variables, nutrient intake, and hormonal factors
in slow nocturnal hemodialysis: a pilot study. Mayo Clin Proc
1998; 73: 1035–1045
67. Woods JD, Port FK, Orzol S et al. Clinical and biochemical
correlates of starting ‘‘daily’’ hemodialysis. Kidney Int 1999; 55:
2467–2476
68. Buoncristiani U, Fagugli R, Pinciaroli M et al. Control
of aneamia by daily dialysis. J Am Soc Nephrol 1997; 8: 216A
69. Pinciaroli M. Results of daily hemodialysis in Cantanzaro:
12-year experience with 22 patients treated for more than one
year. Home Hemodial Int 1998; 2: 12–17
70. Kooistra MP, Vos J. Daily home hemodialysis: towards a
more physiological treatment of patients with ESRD. Semin Dial
1999; 12: 424–430
71. Lugon J, Reimbold S, Pereira C et al. Improvement in dialysis
adequacy and quality of life by in-center daily hemodialysis.
J Am Soc Nephrol 1997; 8: 165A
72. McPhatter LL, Lockridge RS, Jr, Albert J et al. Nightly home
hemodialysis: improvement in nutrition and quality of life. Adv
Ren Replace Ther 1999; 6: 358–365
73. Cacho C, Ferrara K, Guthrie B et al. Slow Intensive
Home Hemodialysis (SIHD): the University Hospitals of
Cleveland experience. Nephrol News Issues 2000; 14: 36–41
ii77
Guideline 6. Metabolic acidosis
Mid-week predialysis serum bicarbonate levels
should be maintained at 20–22 mmol/l (Evidence
level III).
In patients with venous predialysis bicarbonate
persistently <20 mmol/l, oral supplementation
with sodium bicarbonate and/or increasing dialysate concentration to 40 mmol/l should be used
to correct metabolic acidosis (Evidence level III).
Rationale
In two epidemiological studies a U-shape relationship
between serum bicarbonate levels and mortality has
been demonstrated in haemodialysis patients [1,2].
Lowrie et al. [1] reported from a retrospective analysis
in over 12 000 haemodialysis patients an increased risk
of dying if serum bicarbonate levels were <17.5 or
>25 mmol/l. Recently, this was confirmed in the
DOPPS study, in which a rise in mortality was
present if predialysis bicarbonate level was <17 or
>27 mmol/l [2]. In the latter study, it was demonstrated that serum bicarbonate levels between 20.1 and
21.0 mmol/l faced the lowest risk for mortality
and levels of 21.1–22.0 the lowest risk of hospitalization. From these epidemiological data it can be
concluded that predialysis serum bicarbonate levels
of 20–22 mmol/l seem to be optimal.
Although in a number of studies the effect of
metabolic acidosis on nutritional status in haemodialysis patients has been investigated, their outcome is
inconclusive as only a small number of patients
were investigated, the follow-up was short and few
randomized prospective trials are available. In a singleblind crossover study design, Williams et al. [3]
demonstrated that 27% of patients had metabolic
acidosis defined as pH < 7.36 when treated with a
30 mmol/l bicarbonate dialysis solution. When the
bicarbonate content of the dialysate was increased to
40 mmol/l, all patients had a pH > 7.36 which
appeared to be associated with a rise in triceps skinfold
thickness but no change in serum albumin or other
nutritional parameters. When using a 40 mmol/l
bicarbonate dialysis solution, it seems prudent to
monitor post-dialysis venous bicarbonate to avoid
post-dialytic alkalaemia.
In two small prospective studies, it could be
demonstrated in haemodialysis patients [4] and
patients with chronic renal failure [5] that metabolic
acidosis (serum bicarbonate levels <21 mmol/l) could
be corrected by oral sodium bicarbonate supplementation (serum bicarbonate levels in both studies after
treatment >24 mmol/l). This resulted in a rise in serum
albumin levels, but no other changes in nutritional
parameters. In both studies it was shown that
after correction of metabolic acidosis nPNA
decreased. Verove et al. [5] did not find a difference
in daily protein intake. Likewise, Movilli et al. did not
find a change in protein intake [6] or urea kinetics and
ii78
serum proteins [4] after the correction of metabolic
acidosis. In a longitudinal observational study of
248 patients it was also observed that correction of
metabolic acidosis by increasing the dialysate bicarbonate concentration to 39 mmol/l resulted in a fall in
MPNA whereas serum albumin and SGA did not
change [7]. Thus, several authors have concluded that
in moderate to severe metabolic acidosis protein
catabolism is present resulting in a rise in MPNA
which then does not reflect daily protein intake only
[4–8]. The existence of increased protein turnover in
acidotic haemodialysis patients was indeed shown
by studies with radiolabelled leucine [9]. Likewise,
it was demonstrated that net daily acid gain was higher
in acidotic haemodialysis patients [10]. Uribarri et al.
[11] found in the HEMO study a negative correlation
between serum total carbon dioxide levels and
MPNA, and concluded that this could be attributed
to a high protein intake in the patients with more
severe metabolic acidosis as there were no signs of
abnormal nutritional parameters in these patients.
Thus, in patients with persistent metabolic acidosis
protein intake may be assessed to see whether a high
protein intake could contribute to the acidosis.
In one randomized prospective study, treatment of
acidotic haemodialysis patients with oral sodium
bicarbonate and increasing the bicarbonate dialysate
concentration to 40 mmol/l caused a rise in serum
bicarbonate levels without any effect on serum
albumin and other nutritional parameters [12]. In this
study, however, oral supplementation and increasing
dialysate bicarbonate only resulted in a rise of serum
bicarbonate levels to 20 mmol/l, which could be
too low to see positive effects on nutritional outcome.
Kooman et al. [13] demonstrated in acidotic
haemodialysis patients that oral sodium bicarbonate
supplementation resolved metabolic acidosis, caused a
rise in serum branched-chain amino acids but did not
affect nutritional parameters. Similar findings have
been obtained in children [14].
In summary, it may be concluded that correction
of metabolic acidosis to serum bicarbonate levels
at around 20–22 mmol/l should be aimed for to
reduce the risk of mortality and morbidity, to increase
serum albumin levels and to reduce protein catabolism.
References
1. Lowrie EG, Lew NL. Death risk in hemodialysis patients:
the predictive value of commonly measured variables and an
evaluation of death rate differences between facilities. Am J
Kidney Dis 1990; 15: 458–482
2. Bommer J, Locatelli F, Satayathum S et al. Association of
predialysis serum bicarbonate levels with risk of mortality and
hospitalization in the Dialysis Outcomes and Practice Patterns
Study (DOPPS). Am J Kidney Dis 2004; 44: 661–671
3. Williams AJ, Dittmer ID, McArley A, Clarke J. High
bicarbonate dialysate in haemodialysis patients: effects on
acidosis and nutritional status. Nepholr Dial Transplant 1997;
12: 2633–2637
D. Fouque et al.
4. Movilli E, Zani R, Carli O et al. Correction of metabolic
acidosis increases serum albumin concentrations and
decreases kinetically evaluated protein intake in haemodialysis
patients: a prospective study. Nephrol Dial Transplant 1998; 13:
1719–1722
5. Verove C, Maisonneuve N, El AA, Boldron A, Azar R. Effect
of the correction of metabolic acidosis on nutritional status
in elderly patients with chronic renal failure. J Renal Nutr 2002;
12: 224–228
6. Movilli E, Bossini N, Viola BF et al. Evidence for an
independent role of metabolic acidosis on nutritional status in
haemodialysis patients. Nephrol Dial Transplant 1998; 13: 674–
678
7. Blair D, Bigelow C, Sweet SJ. Nutritional effects of delivered
bicarbonate dose in maintenance hemodialysis patients. J Renal
Nutr 2003; 13: 205–211
8. Bastani B, McNeely M, Schmitz PG. Serum bicarbonate is an
independent determinant of protein catabolic rate in chronic
hemodialysis. Am J Nephrol 1996; 16: 382–385
9. Graham KA, Reaich D, Channon SM, Downie S, Goodship
TH. Correction of acidosis in hemodialysis decreases wholebody protein degradation. J Am Soc Nephrol 1997; 8: 632–637
10. Sepandj F, Jindal K, Kiberd B, Hirsch D. Metabolic acidosis
in hemodialysis patients: a study of prevalence and factors
affecting intradialytic bicarbonate gain. Artificial Organs 1996;
20: 976–980
11. Uribarri J, Levin NW, Delmez J et al.Association of acidosis
and nutritional parameters in hemodialysis patients. Am J
Kidney Dis 1999; 34: 493–499
12. Brady JP, Hasbargen JA. Correction of metabolic acidosis
and its effect on albumin in chronic hemodialysis patients.
Am J Kidney Dis 1998; 31: 35–40
13. Kooman JP, Deutz NE, Zijlmans P et al. The influence
of bicarbonate supplementation on plasma levels of
branched-chain amino acids in haemodialysis patients
with metabolic acidosis. Nephrol Dial Transplant 1997; 12:
2397–2401
14. Mak RH. Effect of metabolic acidosis on branched-chain
amino acids in uremia. Pediatr Nephrol 1999; 13: 319–322
Appendices
Formulas (body weight, nPNA, dialysis dose,
residual renal function)
Body weight: definitions
BW: body weight—should be assessed in patients
wearing stocking feet and light indoor clothing with
accurate scales, calibrated on a regular basis. Ask the
patient to remove coat, jacket and heavy objects such
as coins, keys, whichever is appropriate.
ABW: actual body weight—the patient’s present
body weight at the time of the observation.
SBW: standard body weight—normal weight of
healthy Americans of similar sex, age, height and
skeletal frame size, obtained through the NHANES II
Tables [1].
USB: usual body weight—the patient’s weight
obtained through history or previous measurements,
considered to be stable over time.
efBW: oedema free body weight, corresponding to
‘dry weight’—obtained post-dialysis in HD patients
EBPG guideline on nutrition
ii79
based on clinical judgement wether the patient still
presents clinical oedema.
Estimating height in elderly and physically disabled
patients [2]
AefBW: adjusted oedema-free body weight—should
be used in order to calculate the optimal dietary intake
of protein and energy. It may avoid recommendations
for too large intakes that may induce overproduction
of waste products increasing uraemic symptoms.
When patient’s body weight will improve towards
standard body weight value, adjustment of body
weight will not be necessary anymore.
If possible use recent documented (i.e. passport details)
or self reported height, although patients tend to
overestimate height which decreases with advancing
age.
AefBW ¼ efBW þ ðSBW efBWÞ 0:25
where SBW obtained from NHANES II Tables [1].
Height
Height should be measured as follows: ask the
patient to remove shoes, to stand straight with feet
together, buttocks, shoulder blades and head against
the measuring device or wall and looking straight
ahead. The measuring device will indicate length in
meters/centimetres.
The practitioner should not depend on self-reporting
as patients tend to overestimate height which decreases
with advancing age.
Alternative height measurements
Length forearm (ulna), knee height and arm
demispan. In older people, the measurement of height
to calculate BMI does not take into account bone
loss (osteoporosis) that results in reduced height.
Using alternative measurements such as knee height
compensates for age-related changes.
Arm demispan can be used for people with
curvatures of the spine, with infirmity and confusion.
Length of forearm (ulna) (Fig. 1)
Ask the patient to bend the left arm if possible,
palm across the chest, fingers pointing to opposite
shoulder.
Using a tape measure, measure the length in
centimeters to the nearest 0.5 cm between the
point of the elbow (olecranon) and the mid-point
of the prominent bone of the wrist (styloid process).
Use Table 1 to convert ulna length (cm) to height
(m).
Knee height (Fig. 2)
Measure left leg if possible.
The patient should sit on a chair, without shoes,
with knee at a right angle.
Hold tape measure between 3rd and 4th finger with
zero reading underneath fingers.
Place your hand flat across the patient’s thigh,
about 4 cm behind the front of the knee.
Extend the tape measure straight down the side of
the leg in line with the bony prominence at the ankle
(lateral malleolus) to the base of the heel. Measure
to the nearest 0.5 cm.
Note the length and use Table 2 to convert knee
height (cm) to height (m).
Fig. 1. Estimating height from ulna length (permission from MAG
BAPEN, www.bapen.org.uk).
Source: Malnutrition Advisory Group (MAG) British Association of
Enteral and Parenteral Nutrition (BAPEN), 2003 (www.bapen.org).
Demispan (Fig. 3). Demispan should not be used in
patients with severe or obvious curvature of the spine
(kyphosis or scoliosis).
Table 1. Estimating height from ulna length (permission from MAG BAPEN, www.bapen.org.uk)
HEIGHT (m)
HEIGHT (m)
HEIGHT (m)
HEIGHT (m)
Men (<65 years)
Men (>65 years)
Ulna length (cm)
Women (<65 years)
Women (>65 years)
Men (<65 years)
Men (>65 years)
Ulna length (cm)
Women (<65 years)
Women (>65 years)
1.94
1.87
32.0
1.84
1.84
1.69
1.65
25.0
1.65
1.61
1.93
1.86
31.5
1.83
1.83
1.67
1.63
24.5
1.63
1.60
1.91
1.84
31.0
1.81
1.81
1.66
1.62
24.0
1.62
1.58
1.89
1.82
30.5
1.80
1.79
1:64
1.60
23.5
1.61
1.56
1.87
1.81
30.0
1.79
1.78
1.62
1.59
23.0
1.59
1.55
1.85
1.79
29.5
1.77
1.76
1.60
1.57
22.5
1.58
1.53
1.84
1.78
29.0
1.76
1.75
1.58
1.56
22.0
1.56
1.52
1.82
1.76
28.5
1.75
1.73
1.57
1.54
21.5
1.55
1.50
1.80
1.75
28.0
1.73
1.71
1.55
1.52
21.0
1.54
1.48
1.78
1.73
27.5
1.72
1.70
1.53
1.51
20.5
1.52
1.47
1.76
1.71
27.0
1.70
1.68
1.51
1.49
20.0
1.51
1.45
1.75
1.70
26.5
1.69
1.66
1.49
1.48
19.5
1.50
1.44
1.73
1.68
26.0
1.68
1.65
1.48
1.46
19.0
1.48
1.42
1.71
1.67
25.5
1.66
1.63
1.46
1.45
18.5
1.47
1.40
ii80
For bed bound patients, those with severe disabilities
and those with kyphosis or scoliosis, it is preferable to
use forearm (ulna) length to estimate height.
The patient should stand as this makes taking the
measurement easier.
Locate and mark the mid-point of the sternal notch
(V at the base of the neck).
Ask the patient to raise the right arm until it is
horizontal with the shoulder (give assistance if
necessary; make sure the wrist is straight).
D. Fouque et al.
Place a tape measure between the middle and ring
finger of the patient’s right hand, with zero at the
base of the fingers.
Extend the tape measure along the length of the arm
to the mid-point of the sternal notch and note the
measurement to the nearest 0.5 cm. Use Table 3 to
convert demispan length to height (m).
Ideal body weight estimation (Tables 4 and 5).
Body mass index (BMI). BMI is calculated from the
weight (kg) divided by the square of the height (m).
BMI of maintenance dialysis patients should be
maintained in the upper 50th percentile (BMI for
men and women of at least approximately 23.6 and
24.0 kg/m2)
The World Health Organization describes the
condition of low BMI as thinness which is divided
into three grades:
Grade 1: BMI 17.0–18.49 (mild thinness)
Grade 2: BMI 16.0–16.99 (moderate thinness)
Grade 3: BMI < 16.0 (severe thinness)
The Malnutrition Advisory Group (MAG),
a standing committee of the British Association for
Parenteral and Enteral Nutrition [2] has recommended
Fig. 2. Estimating height from knee height (permission from MAG
BAPEN, www.bapen.org.uk).
Source: Malnutrition Advisory Group (MAG) British Association of
Enteral and Parenteral Nutrition (BAPEN), 2003 (www.bapen.org).
Fig. 3. Estimating height using demispan (permission from MAG
BAPEN, www.bapen.org.uk).
Source: Malnutrition Advisory Group (MAG) British Association of
Enteral and Parenteral Nutrition (BAPEN), 2003 (www.bapen.org).
Table 2. Estimating height (in meter) from knee height (permission from MAG BAPEN, www.bapen.org.uk)
Men (18–59 years)
1.94 1.93 1.92
1.91
1.90 1.89 1.88 1.87 1.865 1.86 1.85
1.84
1.83 1.82 1.81
Men (60–90 years)
1.94 1.93 1.92
1.91
1.90 1.89 1.88 1.87 1.86
1.85 1.84
1.83
1.82 1.81 1.80
Knee height (cm)
65
64.5 64
63.5
63
62.5 62
61.5 61
60.5 60
59.5
59
58.5 58
Women (18–59 years) 1.89 1.88 1.875 1.87
1.86 1.85 1.84 1.83 1.82
1.81 1.80
1.79
1.78 1.77 1.76
Women (60–90 years) 1.86 1.85 1.84
1.835 1.83 1.82 1.81 1.80 1.79
1.78 1.77
1.76
1.75 1.74 1.73
Men (18–59 years)
1.80 1.79 1.78
1.77
1.76 1.75 1.74 1.73 1.72
1.71 1.705 1.70
1.69 1.68 1.67
Men (60–90 years
1.79 1.78 1.77
1.76
1.74 1.73 1.72 1.71 1.70
1.69 1.68
1.67
1.66 1.65 1.64
Knee height (cm)
57.5 57
56.5
56
55.5 55
54.5 54
53.5
53
52.5
52
51.5 51
50.5
Women (18–59 years) 1.75 1.74 1.735 1.73
1.72 1.71 1.70 1.69 1.68
1.67 1.66
1.65
1.64 1.63 1.62
Women (60–90 years) 1.72 1.71 1.70
1.69
1.68 1.67 1.66 1.65 1.64
1.63 1.625 1.62
1.61 1.60 1.59
Men (18–59 years)
1.66 1.65 1.64
1.63
1.62 1.61 1.60 1.59 1.58
1.57 1.56
1.555 1.55 1.54 1.53
Men (60–90 years
1.63 1.62 1.61
1.60
1.59 1.58 1.57 1.56 1.55
1.54 1.53
1.52
1.51 1.49 1.48
Knee height (cm)
50
49.5 49
48.5
48
47.5 47
46.5 46
45.5 45
44.5
44
43.5 43
Women (18–59 years) 1.61 1.60 1.59
1.585 1.58 1.57 1.56 1.55 1.54
1.53 1.52
1.51
1.50 1.49 1.48
Women (60–90 years) 1.58 1.57 1.56
1.55
1.54 1.53 1.52 1.51 1.50
1.49 1.48
1.47
1.46 1.45 1.44
EBPG guideline on nutrition
ii81
Table 3. Estimating height (in meter) using demispan (permission from MAG BAPEN, www.bapen.org.uk)
Men (16–54 years)
Men (>55 years)
Demispan (cm)
Women (16–54 years)
Women (>55 years)
Men (16–54 years
Men (>55 years
Demispan (cm)
Women (16–54 years)
Women (>55 years)
1.97
1.90
99
1.91
1.86
1.75
1.69
82
1.69
1.65
1.95
1.89
98
1.89
1.85
1.73
1.68
81
1.67
1.64
1.94
1.87
97
1.88
1.83
1.72
1.67
80
1.66
1.63
1.93
1.86
96
1.87
1.82
1.71
1.66
79
1.65
1.62
1.92
1.85
95
1.85
1.81
1.69
1.65
78
1.63
1.61
1.90
1.84
94
1.84
1.80
1.68
1.64
77
1.62
1.59
1.89
1.83
93
1.83
1.79
1.67
1.62
76
1.61
1.58
1.88
1.81
92
1.82
1.77
1.65
1.61
75
1.59
1.57
1.86
1.80
91
1.80
1.76
1.64
1.60
74
1.58
1.56
1.85
1.79
90
1.79
1.75
1.63
1.59
73
1.57
1.55
1.84
1.78
89
1.78
1.74
1.62
1.57
72
1.56
1.54
1.82
1.77
88
1.76
1.73
1.60
1.56
71
1.54
1.52
1.81
1.75
87
1.75
1.71
1.59
1.55
70
1.53
1.51
1.80
1.74
86
1.74
1.70
1.58
1.54
69
1.52
1.50
1.78
1.73
85
1.72
1.69
1.56
1.53
68
1.50
1.49
1.77
1.72
84
1.71
1.68
1.55
1.51
67
1.49
1.47
1.76
1.71
83
1.70
1.67
1.54
1.50
66
1.48
1.46
Table 4. Fiftieth (50th) Percentile of Standard Body Weight for Men
(NHANES 1 and II); reproduced with permission from Frisancho
et al. The Amercian Journal of Clinical Nutrition [1].
Table 5. Fifthieth (50th) Percentile of Standard Body Weight for
Women (NHANES 1 and II); reproduced with permission from
Frisancho et al. The Amercian Journal of Clinical Nutrition [1].
Age
Age
25–54 years
55–74 years
25–54 years
Weight (kg)
Weight (kg)
Height
(cm)
Small
frame
Medium
frame
Large
frame
Small
frame
Medium
frame
Large
frame
157
160
163
165
168
170
173
175
178
180
183
185
188
64
61
66
66
67
71
71
74
75
76
74
79
80
68
71
71
74
75
77
78
78
81
81
84
85
88
82
83
84
79
84
84
86
89
87
91
91
93
92
61
62
63
70
68
69
70
75
76
69
76a
78a
77a
68
70
71
72
74
78
78
77
80
84
81
88
95
77
80
77
79
80
85
83
84
87
84
90
88
89
a
Value estimated through linear regression equation.
nutritional measurements should be height, weight and
recent weight loss. The BMI categories are:
BMI < 18.5 chronic protein–energy undernutrition
probable
BMI 18.5–20.0 chronic protein–energy undernutrition
possible
BMI > 20.0 chronic protein–energy undernutrition
unlikely
Classification of BMI. Significance: (normal individuals) from Wiggins [3]
<16
<18.5
Severely
underweight
underweight
18.5–24.9
Within normal
weight range
25–29.9
Overweight
30–34.9
Obesity class I
35–39.9
Obesity class II
>40
Obesity class III
55–74 years
Associated with health problems
May be associated with health
problems for some people
‘ideal’ or healthy weight range
associated with lowest risk of illness and mortality for most people
May be associated with health
problems in some people
Associated with increased risk of
health problems such as heart
disease, hypertension, diabetes
Associated with increased risk of
health problems such as heart
disease, hypertension and diabetes
Extreme obesity
Height
(cm)
Small
frame
Medium
frame
Large
frame
Small
frame
Medium
frame
Large
frame
147
150
152
155
157
160
163
165
168
170
173
175
178
52
53
53
54
55
55
57
60
58
59
62
63*
64*
63
66
60
61
61
62
62
63
63
65
67
68
70
86a
78
87
81
81
83
79
81
75
80
76
79
76
54
55
54
56
58
58
60
60
68
61a
61a
62a
63a
57
62
65
64
64
65
66
67
66
72
70
72a
73a
92
78
78
79
82
80
77
80
82
80
79
85a
85a
a
Value estimated through linear regression equation.
Calculating BMI in amputees [3]. IBW needs to be
adjusted by taking into account the weight of body
segment(s) that is/are amputated. Adjustments of body
weight can be made from knowledge of missing limbs
segments.
Upper limb: whole arm 5% (upper arm 2.7% and
fore arm 1.6%, hand 0.7%)
Lower limb: whole leg 16% (thigh 10.1%, lower leg
4.4%, foot 1.5%)
To measure full body weight equation
Estimated full body weight ðkgÞ
measured weight
¼
100
ð100 % weight of amputationÞ
Change in body weight over the previous 6 months
Unintentional weight loss over the previous
3–6 months is categorized as
10 % of body weight: clinically significant,
5–10% of body weight: more than normal intraindividual variation,
<5% of body weight: within ‘normal’ intraindividual variation.
ii82
D. Fouque et al.
A cut-off of >10% weight loss during the last
6 months is recommended to be used in the diagnosis
of malnutrition [4].
Body surface. Body surface area should be estimated
according to Gehan and George method [5]
BSA ¼ 0:235 BW0:51456 BH0:42246
Body water. Total body water (TBW), necessary for
the calculation of the correct dialysis dose, can be
estimated by the Watson formulas (2):
Vmale (L) ¼ 2.447 þ 0.3362 BW (kg) þ 0.1074 BH
(cm) 0.09516 age (years)
Vfemale (L) ¼ 2.097 þ 0.2466 BW (kg) þ 0.1069 BH (cm)
Normalized protein equivalent of total nitrogen
appearance nPNA. By the use of protein nitrogen
appearance (PNA), formerly called protein catabolic
rate (PCR), the dietary protein intake can be
estimated in patients with neutral nitrogen balance
(i.e. in patients, who are neither anabolic nor
catabolic). In order to normalize PNA, it should be
related to the body weight of the patient, leading
to nPNA.
In order to optimize the diet of patients with
renal disease, the dietary protein intake has to be
controlled. In stable patients (non-catabolic,
non-anabolic) nPNA reflects the dietary protein
intake and can be calculated based on UNA
(urea nitrogen appearance in the urine and/or in the
dialysate, respectively) for the following reasons:
1. In patients with a neutral nitrogen balance,
the nitrogen intake is identical with the loss of
nitrogen (that is the total nitrogen appearance:
TNA)
2. As nitrogen in protein accounts for 16% of the
protein’s weight, the protein equivalent of nitrogen
appearance (PNA) can be calculated by total
nitrogen appearance (TNA).as:
PNA ¼ 6:25 TNA
3. There is a linear relationship between TNA
and UNA. The ratio between UNA and TNA,
however, depends on the dietary intake of
protein as well as the status and treatment of the
patient [2]
4. In order to normalize PNA to body weight, the
K/DOQI Nutrition Work Group recommends the
use of the following formula [4]:
nPNA ¼
PNA
AefBW
where AefBW is the adjusted, oedema free body
weight, see above
PNA is calculated by using spKt/V and C0.
Different formulas are used for different days of the
week (5) in a two-BUN, single-pool, variable-volume
model:
Beginning
of
the
week PNA ¼ C0/[36.3 þ
(5.48)(spKt/V) þ (53.5)/(spKt/V)] þ 0.168
Midweek PNA ¼ C0/[25.8 þ (1.15)(spKt/V) þ
(56.4)/(spKt/V)] þ 0.168
End of week PNA ¼ C0/[16.3 þ (4.3)(spKt/V) þ
(56.6)/(spKt/V)] þ 0.168
where C0 ¼ predialysis blood urea nitrogen (BUN)
spKt=V ¼ single pool Kt=V
In patients with considerable residual renal function,
C0 should be replaced by C00 :
C00 ¼ C0 ½1 þ ð0:79 þ 3:08=ðKt=VÞÞ Kr=V
where Kr is residual renal clearance in ml/min [4].
Residual renal function: glomerular filtration rate (GFR)
Residual renal function should be expressed as equivalents of glomerular filtration rate (GFR). One accepted
method in both PD and HD patients is to estimate GFR
from the mean of urea and creatinine clearance [6],
normalized to 1.73 m2 using the Gehan & George
method [5] for calculating body surface area (BSA).
The collection time in haemodialysis patients is identical with the interval between two dialysis sessions. The
plasma concentration of urea and creatinine used in the
following formula are determined at the beginning and
end of the collection. As in pre-ESRD and peritoneal
dialysis patients, the bladder must be empty at the
beginning of the collection (i.e. at the end of the dialysis)
and must be completely emptied at the end of the
collection (i.e. before the next dialysis starts):
Uurea
Ucreat
þ
GFR ¼
prePurea þpostPurea prePcreat þpostPcreat
Uvol
1:73
BSA
t
derived from:
Uurea
0:5 ðprePurea þpostPurea Þ
Ucreat
þ
0:5 ðprePcreat þpostPcreat Þ
Uvol
1:73
BSA
t
GFR ¼ 0:5 with 0.5 (prePurea þ postPurea) ¼ average concentration of urea in the plasma between dialysis sessions and
0.5 (prePcreat þ postPcreat) ¼ average concentration of
creatinine in the plasma between dialysis. prePurea,
plasma urea concentration before dialysis at end of
collection; postPurea, plasma urea concentration after
dialysis at beginning of collection; prePcreat, plasma
creatinine concentration before dialysis at end of
collection; postPcreat, plasma creatinine concentration
EBPG guideline on nutrition
after dialysis at beginning of collection; Uurea, urine
urea concentration; Ucreat, urine creatinine concentration; Uvol, urine volume; t, time of collection between
dialysis sessions.
In order to be more precise, the post-dialysis concentrations should be replaced by the post-rebound
concentrations, which can be calculated as follows [7]:
Post-rebound concentration for urea:
post td=ðtdþ35Þ
rebound ¼ pre
pre
where td, dialysis time in minutes; pre, concentration
before dialysis before collection; post, concentration
immediately after dialysis.
Post-rebound concentration for creatinine:
post td=ðtdþ70Þ
rebound ¼ pre
pre
where td, dialysis time in minutes; pre, concentration
before dialysis before collection; post, concentration
immediately after dialysis.
Dialysis dose
For MHD it is recommended to calculate the
equilibrated Kt/V (eKT/V) instead of the single pool
Kt/V (sp(Kt/V) from pre- and post-HD blood
samples taken under standard conditions (see below).
The eKt/V takes into account the urea rebound post
dialysis resulting from redistribution of peripheral
pools.
Haemodialysis dose should be quantified as
equilibrated Kt/V (eKtV) based on the regional
blood flow two-pool model [8,9]:
ii83
for central venous
catheter.
using sterile technique withdraw
any heparin/saline from the arterial port withdraw 10 mL of blood
collect blood sample
(b)Post-dialysis blood sampling procedure:
As recirculation of dialysated blood in the arterial
line or rebound of urea can significantly influence the
value of urea, the sampling technique must be
performed in a standardized way leading to reproducible results. In following the techniques explained
below, the sample will be drawn after possible
recirculation but before rebound of urea from peripheral compounds.
1. Turn off dialysate flow or reduce to minimum,
decrease ultrafiltration rate to 50 ml/h
2. Decrease blood flow to 50–100 ml/min for 15 s
proceed with slow pump or stop pump technique
Slow flow sampling technique
3. draw blood sample with pump running at
50–100 ml/min
4. stop blood pump and complete disconnection
procedure
Stop pump sampling technique
5. stop the blood pump
6. clamp arterial and venous blood lines; clamp
arterial needle tubing
7. sample blood either from arterial sampling port
nearest to patient or from the arterial needle tubing
after disconnection from the arterial blood line
8. blood is returned to the patient, complete disconnection procedure
eKt=V ¼ spKt=V ð0:6 spKtV=TÞ
þ 0:03 ðwith an arteriovenous accessÞ
The value for single pool Kt/V (spKtV) should be
derived from urea kinetic model or alternatively from
the natural logarithm equation to estimate spKtV [10]:
spKt=V ¼ lnðR 0:008 tÞ þ ð4 3:5 RÞ
dBW=BW
where R, post-HD/pre-HD BUN ratio; T, treatment
time in hours; dBW, intradialytic weight lost
(corresponding to ultrafiltration); BW, end session
body weight.
Standard conditions for blood sampling
Methods procedure derived from the K/DOQI
guidelines [4,11].
(a) Pre-dialysis blood sampling procedure:
for arteriovenous
graft or fistula: obtain the blood from arterial
needle before connecting the tube
or flushing the needle, avoid
dilution of the sample by saline
and/or heparin
LABORATORY METHODS
Serum Albumin
The gold-standard for determining serum albumin
levels are immunological methods. Serum albumin
levels determined by established methods like
the bromcresol green (BCG) or bromcresol
purple (BCP) method differ from those obtained
by immunological methods due to limitations in
methodology [12].
Comparing the values of albumin in plasma and
serum, measured by the same method, identical values
are found. However, differences are found between the
bromcresol green and the bromcresol purple method.
Uremic toxins as well as certain medications
(e.g. phenylbutazon, clofibric acid) [13] influence the
measurement.
In general, bromcresol green methods overestimate
albumin levels [14] compared with bromcresol
purple [15] and nephelometry [16]. Bromcresol
purple, on the other hand, generally underestimates
albumin values [12,17]. Thus the evaluation of the
ii84
serum albumin level must take into account the
different normal ranges of the applied laboratory
methods.
Bicarbonate
Plasma bicarbonate is estimated from total CO2
measurements. It is thus mandatory to use fresh
D. Fouque et al.
blood samples because CO2 might be lost leading
to significant underestimation of plasma bicarbonate
[18]. One must also keep in mind that total CO2
levels assessed by electrode-based methods are
an average 4 mmol/l higher compared with plasma
bicarbonate concentrations determined by enzymatic
assays [19].
EBPG guideline on nutrition
The plasma bicarbonate, calculated from pCO2
by using the Henderson-Hasselbach equation, gives:
ðpH6:1Þ
cHCO
3 ðmmol=lÞ ¼ 0:0307 pCO2 ðmmHgÞ 10
C-reactive protein
C-reactive Protein (CRP) has been used as a
marker of inflammation for many years. In this
respect, levels in the range of 5–300 mg/l have
been of interest, which are detected by the common
laboratory methods. Standard immunological methods
like immunonephelometry and immunoturbidimetry
should detect levels at least above 5 mg/l.
New assays allow the detection of even lower
CRP levels in the range of 0.1–10 mg/l. These so
called ‘high sensitive-CRP-assays’ (hs-CRP) are needed
to assess the risk of atherosclerosis [20–22], as
already only slightly elevated CRP levels below 5 mg/
l have been found to be associated with increased risk
of cardiovascular disease [23].
TECHNICAL ASSESSMENT
Subjective global assessment (SGA)
The SGA was developed for use in assessing
the nutrition of general surgery patients [24]. It is
recommended also for patients on dialysis, because it is
a valid clinical assessment of nutritional status and is
strongly associated with patient survival.
Remind that the overall SGA classification is not
simply a numerical store. It does strongly depend on
the clinical judgement of the examiner. He has to
consider whether the patient’s status is improving or
deteriorating, this information may lead to different
‘scores’ given in each section.
The SGA is based on history and physical examination [24]. It focuses on gastrointestinal symptoms
(anorexia, nausea, vomiting, diarrhoea), weight
loss in the preceding 6 months, and visual assessment
of subcutaneous tissue and muscle mass. Scores are
subjectively rated on a four-point or seven point
scale [4]. The use of the seven point scale is
recommended because of its greater sensitivity and its
use in large epidemiological studies such as the
CANUSA study [25]:
Severe malnutrition: 1 or 2,
Moderate to mild malnutrition: 3 to 5,
Mild malnutrition to normal nutritional state: 6 to 7.
SGA was found to be related to other markers of
nutritional status in dialysed [26] and non-dialysed
uraemic subjects [27] as well as to mortality [28].
Anthropometry
Skinfold thickness (SFT) should be measured by
someone experienced in the use of skinfold callipers.
The measurement is taken at four different sites
ii85
Table 6. Equivalent body fat content (in% body weight)
obtained from the sum of four (biceps, triceps, subscapular
and suprailiac) skinfold measurements. Reproduced with
permission from Durnin and Womersley. British Journal of
Nutrition [32].
Skinfolds Men (y)
Women (y)
(mm)
17–29 30–39 40–49 50þ 16–29 30–39 40–49 50þ
15
20
25
30
35
40
45
50
55
60
65
70
75
80
85
90
95
100
105
110
115
120
125
130
135
140
145
150
155
160
165
170
175
180
185
190
195
200
205
210
4.8
8.1
10.5
12.9
14.7
16.4
17.7
19.0
20.1
21.2
22.2
23.1
24.0
24.8
25.5
26.2
26.9
27.6
28.2
28.8
29.4
30.0
31.0
31.5
32.0
32.5
32.9
33.3
33.7
34.1
34.5
34.9
35.3
35.6
35.9
12.2
14.2
16.2
17.7
19.2
20.2
21.5
22.5
23.5
24.3
25.1
25.9
26.6
27.2
27.8
28.4
29.0
29.6
30.1
30.6
31.1
31.5
31.9
32.3
32.7
33.1
33.5
33.9
34.3
34.6
34.8
12.2
15.0
17.7
19.6
21.4
23.0
24.6
25.9
27.1
28.2
29.3
30.3
31.2
32.1
33.0
33.7
34.4
35.1
35.8
36.4
37.0
37.6
38.2
38.7
39.2
39.7
40.2
40.7
41.2
41.6
42.0
12.6
15.6
18.6
20.8
22.9
24.7
26.5
27.9
29.2
30.4
31.6
32.7
33.8
34.8
35.8
36.6
37.4
38.2
39.0
39.7
40.4
41.1
41.8
42.4
43.0
43.6
44.1
44.6
45.1
45.6
46.1
10.5
14.1
16.8
19.5
21.5
23.4
25.0
26.5
27.8
29.1
30.2
31.2
32.2
33.1
34.0
34.8
35.6
36.4
37.1
37.8
38.4
39.0
39.6
40.2
40.8
41.3
41.8
42.3
42.8
43.3
43.7
44.1
17.0
19.4
21.8
23.7
25.5
26.9
28.2
29.4
30.6
31.6
32.5
33.4
34.3
35.1
35.8
36.5
37.2
37.9
38.6
39.1
39.6
40.1
40.6
41.1
41.6
42.1
42.6
43.1
43.6
44.0
44.4
44.8
45.2
45.6
45.8
46.2
46.5
19.8
22.2
24.5
26.4
28.2
29.6
31.0
32.1
33.2
34.1
35.0
35.9
36.7
37.5
38.3
39.0
39.7
40.4
41.0
41.5
42.0
42.5
43.0
43.5
44.0
44.5
45.0
45.4
45.8
46.2
46.6
47.0
47.4
47.8
48.2
48.5
48.9
49.1
49.4
21.4
24.0
26.6
28.5
30.3
31.9
33.4
34.6
35.7
36.7
37.7
38.7
39.6
40.4
41.2
41.9
42.6
43.3
43.9
44.5
45.1
45.7
46.2
46.7
47.2
47.7
48.2
48.7
49.2
49.6
50.0
50.4
50.8
51.2
51.6
52.0
52.4
52.7
53.0
Source: Durnin JV, Womersley J. Body fat assessed from total body
density and its estimation from skinfold thickness: measurements on
481 men and women aged from 16 to 72 years. British Journal of
Nutrition 1974; 32: 77-97.
(biceps, triceps, subscapular and suprailiac). For each
skinfold, the mean of three measurements is taken.
The sum of four different skinfold sites allows to
estimate patient’s body fat in percent body weight
(Table 6).
Mid-upper arm circumference (MAC) should
be measured on the non-dominant, non-fistula
arm. The arm should be bent at the elbow at an
angle of 908. The midpoint between the acromion
and olecranon process should be ascertained by
measurement and marked. The MAC at this
point should be measured three times and the mean
taken.
ii86
D. Fouque et al.
Table 7. Mid-arm muscle circumference (MAMC) for adult men and
women from USA (from NHANES I study [33]); measurements
made in the right arm. Reproduced with permission from Bishop
CW, Bowen PE, Ritchey SJ. The Amercian Journal of Clinical
Nutrition [33].
Age (years)
Men
18–24
25–34
35–44
45–54
55–64
65–74
Women
18–24
25–34
35–44
45–54
55–64
65–74
50th Percentile (cm)
27.2
28.0
28.7
28.1
27.9
26.9
20.6
21.4
22.0
22.2
22.6
22.5
Source: Bishop CW, Bowen PE, Ritchey SJ. Norms for nutritional
assessment of American adults for upper arm anthropometry.
American Journal of Clinical Nutrition 1981; 34: 2530–39 [ref. 33].
Mid-arm muscle circumference (MAMC, Table 7)
should be calculated as the MAC in cm minus
(triceps skinfold thickness ). There are no agreed
cut off points for MAC, TSF or MAMC for
the diagnosis of malnutrition in either the normal
population or patients with chronic renal failure.
Frisancho’s tables provide standards for mid-arm
muscle circumference in normal subjects [29,30]
whilst norms have also been published for the dialysis
population [31].
Handgrip strength
Muscle strength is best evaluated by muscle
dynanometry of the handgrip strength which has
been related to protein stores assessed by neutron
activation analysis in non-uraemic subjects [34]. In
pre-ESRD patients handgrip strength was strongly
related to lean body mass determined by DEXA,
anthropometry, and creatinine kinetics and the
strongest factor related to malnutrition defined by
SGA [27]. In dialysis patients handgrip strength
was reduced in malnourished patients determined by
SGA [35].
References
1. Frisancho AR. New standards of weight and body
composition by frame size and height for assessment of
nutritional status of adults and the elderly. Am J Clin Nutr
1984; 40: 808–819
2. Todorovic V, Russell C, Stratton R, Ward J, Elia M. A Guide to
the ‘Malnutrition Universal Screening Tool’ (‘MUST’) for
Adults. Brit Ass Parenter Enteral Nutr (BAPEN) 2003, pp. 1–23.
3. Wiggins KL. Renal care: resources and practical applications.
Renal Dietitians Dietetic Practice Group. J Am Diet Assoc 2001;
1–101
4. Clinical practice guidelines for nutrition in chronic renal failure.
K/DOQI, National Kidney Foundation. Am J Kidney Dis 2000;
35: S1–S140
5. Gehan EA, George SL. Estimation of human body surface
area from height and weight. Cancer Chemother Rep 1970; 54:
225–235
6. Van Olden RW, Krediet RT, Struijk DG, Arisz L.
Measurement of residual renal function in patients treated
with continuous ambulatory peritoneal dialysis. J Am Soc
Nephrol 1996; 7: 745–750
7. Tattersall JE, DeTakats D, Chamney P, Greenwood RN,
Farrington K. The post-hemodialysis rebound: predicting and
quantifying its effect on Kt/V. Kidney Int 1996; 50: 2094–2102
8. Daugirdas JT. Simplified equations for monitoring Kt/V,
PCRn, eKt/V, and ePCRn. Adv Ren Replace Ther 1995; 2:
295–304
9. Leblanc M, Charbonneau R, Lalumiere G, Cartier P, Deziel C.
Postdialysis urea rebound: determinants and influence on
dialysis delivery in chronic hemodialysis patients. Am J Kidney
Dis 1996; 27: 253–261
10. Daugirdas JT. Second generation logarithmic estimates of
single-pool variable volume Kt/V: an analysis of error. J Am
Soc Nephrol 1993; 4: 1205–1213
11. NKF-K/DOQI
Clinical
Practice
Guidelines
for
Hemodialysis Adequacy: update 2000. Am J Kidney Dis 2001;
37: S7–S64
12. Joseph R, Tria L, Mossey RT et al. Comparison of methods for
measuring albumin in peritoneal dialysis and hemodialysis
patients. Am J Kidney Dis 1996; 27: 566–572
13. Calvo R, Carlos R, Erill S. Underestimation of albumin content
by bromocresol green, induced by drug displacers and uremia.
Int J Clin Pharmacol Ther Toxicol 1985; 23: 76–78
14. Carfray A, Patel K, Whitaker P, Garrick P, Griffiths GJ,
Warwick GL. Albumin as an outcome measure in
haemodialysis in patients: the effect of variation in assay
method. Nephrol Dial Transplant 2000; 15: 1819–1822
15. McGinlay JM, Payne RB. Serum albumin by dye-binding:
bromocresol green or bromocresol purple? The case for
conservatism. Ann Clin Biochem 1988; 25: 417–421
16. Blagg CR, Liedtke RJ, Batjer JD et al. Serum albumin
concentration-related health care financing administration
quality assurance criterion is method-dependent: revision is
necessary. Am J Kidney Dis 1993; 21: 138–144
17. Maguire GA, Price CP. Bromcresol purple method for serum
albumin gives falsely low values in patients with renal
insufficiency. Clin Chem Acta 1986; 155: 83–87
18. Kirschbaum B. Spurious metabolic acidosis in hemodialysis
patients. Am J Kidney Dis 2000; 35: 1068–1071
19. Bray SH, Tung RL, Jones ER. The magnitude of metabolic
acidosis is dependent on differences in bicarbonate assays. Am J
Kidney Dis 1996; 28: 700–703
20. Rifai N, Ridker PM. High-sensitivity C-reactive protein: a
novel and promising marker of coronary heart disease. Clin
Chem 2001; 47: 403–411
21. Blake GJ, Ridker PM. High sensitivity C-reactive protein for
predicting cardiovascular disease: an inflammatory hypothesis.
Eur Heart J 2001; 22: 349–352
22. Cotton F, Thiry P, Hsain AB, Boeynaems JM. Analyzer
transfer of a broad range high-sensitivity C-reactive protein
immunoassay. Clin Lab 2001; 47: 405–409
23. Ridker PM, Cushman M, Stampfer MJ, Tracy RP, Hennekens
CH. Inflammation, aspirin, and the risk of cardiovascular
disease in apparently healthy men. N Engl J Med 1997; 336:
973–979
24. Detsky AS, McLaughlin JR, Baker JP et al. What is
subjective global assessment of nutritional status? J Parenter
Enteral Nutr 1987; 11: 8–13
EBPG guideline on nutrition
25. Adequacy of dialysis and nutrition in continuous peritoneal
dialysis: association with clinical outcomes. Canada-USA
(CANUSA) Peritoneal Dialysis Study Group. J Am Soc
Nephrol 1996; 7: 198–207
26. Enia G, Sicuso C, Alati G, Zoccali C. Subjective global
assessment of nutrition in dialysis patients. Nephrol Dial
Transplant 1993; 8: 1094–1098
27. Heimburger O, Qureshi AR, Blaner WS, Berglund L, Stenvinkel
P. Hand-grip muscle strength, lean body mass, and plasma
proteins as markers of nutritional status in patients with chronic
renal failure close to start of dialysis therapy. Am J Kidney Dis
2000; 36: 1213–1225
28. Chung SH, Lindholm B, Lee HB. Influence of
initial nutritional status on continuous ambulatory
peritoneal dialysis patient survival. Perit Dial Int 2000;
20: 19–26
29. Frisancho AR. New norms of upper limb fat and muscle areas
for assessment of nutritional status. Am J Clin Nutr 1981; 34:
2540–2545
ii87
30. Frisancho AR. Triceps skin fold and upper arm muscle size
norms for assessment of nutrition status. Am J Clin Nutr 1974;
27: 1052–1058
31. Nelson EE, Hong CD, Pesce AL, Peterson DW, Singh S, Pollak
VE. Anthropometric norms for the dialysis population. Am J
Kidney Dis 1990; 16: 32–37
32. Durnin JV, Womersley J. Body fat assessed from total
body density and its estimation from skinfold thickness:
measurements on 481 men and women aged from 16 to 72
years. Br J Nutr 1974; 32: 77–97
33. Bishop CW, Bowen PE, Ritchey SJ. Norms for nutritional
assessment of American adults for upper arm anthropometry.
Am J Clin Nutr 1981; 34: 2530–2539
34. Windsor JA, Hill GL. Grip strength: a measure of the
proportion of protein loss in surgical patients. Br J Surg 1988;
75: 880–882
35. Qureshi AR, Alvestrand A, Danielsson A et al. Factors
predicting malnutrition in hemodialysis patients: a crosssectional study. Kidney Int 1998; 53: 773–782


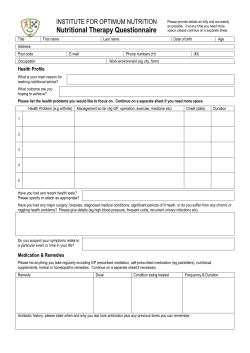


© Copyright 2026