
WORKING PAPER SERIES WHAT IS DRIVING OIL FUTURES PRICES? FUNDAMENTALS
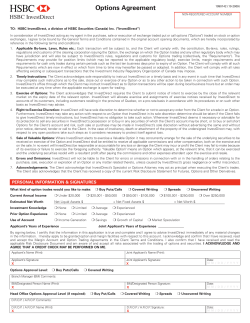
WO R K I N G PA P E R S E R I E S N O 1 3 7 1 / A U G U S T 2 011 WHAT IS DRIVING OIL FUTURES PRICES? FUNDAMENTALS VERSUS SPECULATION by Isabel Vansteenkiste WO R K I N G PA P E R S E R I E S N O 1371 / A U G U S T 2011 WHAT IS DRIVING OIL FUTURES PRICES? FUNDAMENTALS VERSUS SPECULATION 1 by Isabel Vansteenkiste 2 NOTE: This Working Paper should not be reported as representing the views of the European Central Bank (ECB). The views expressed are those of the author and do not necessarily reflect those of the ECB. In 2011 all ECB publications feature a motif taken from the €100 banknote. This paper can be downloaded without charge from http://www.ecb.europa.eu or from the Social Science Research Network electronic library at http://ssrn.com/abstract_id=1910590. v Domit, TTamarah SShakir, an anonymous referee and by seminar participants at the Bank of England 1 Comments by SSilvia are gratefully acknowledged. Any remaining errors are the sole responsibility of the author. 2 European Central Bank, Kaiserstrasse 29, D-60311 Frankfurt am Main, Germany; e-mail: [email protected] © European Central Bank, 2011 Address Kaiserstrasse 29 60311 Frankfurt am Main, Germany Postal address Postfach 16 03 19 60066 Frankfurt am Main, Germany Telephone +49 69 1344 0 Internet http://www.ecb.europa.eu Fax +49 69 1344 6000 All rights reserved. Any reproduction, publication and reprint in the form of a different publication, whether printed or produced electronically, in whole or in part, is permitted only with the explicit written authorisation of the ECB or the author. Information on all of the papers published in the ECB Working Paper Series can be found on the ECB’s website, http://www. ecb.europa.eu/pub/scientific/wps/date/ html/index.en.html ISSN 1725-2806 (online) CONTENTS Abstract 4 Non-technical summary 5 1 Introduction and literature review 6 2 A small model of heterogeneous agents and the oil futures market 2.1 A fundamental-based model of oil futures prices 2.2 The microstructural set-up of the trading behaviour 3 Empirically modelling strategy: the Markov-switching model 3.1 The time-varying transition probability Markov-switching model 3.2 Oil prices modelled as a TVTP Markov-switching model 3.3 Data 9 9 10 15 15 16 18 4 Concluding remarks 23 References 24 ECB Working Paper Series No 1371 August 2011 3 Abstract In this paper we analyse the relative importance of fundamental and speculative demand on oil futures price levels and volatility. In a rst step, we present a theoretical heterogeneous agent model of the oil futures market based on noise trading. We use the model to study the interaction between the oil futures price, volatility, developments in underlying fundamentals and the presence of dierent types of agents. We distinguish between commercial traders (who are physically involved in oil) and non-commercial traders (who are not involved physically with oil). Based on the theoretical model we nd that a multiplicity of equilibria can exist. More specically, on the one hand, if we have high fundamental volatility, high uncertainty about future oil demand, and the oil price deviation from fundamentals or the price trend is small, we will only have commercial traders entering the market. On the other hand, if a large unexpected shock to the oil spot price occurs then all traders will enter the market. In a next step, we empirically test the model by estimating a markov-switching model with time-varying transition probabilities. We estimate the model over the period January 1992 - April 2011. We nd that up to 2004, movements in oil futures prices are best explained by underlying fundamentals. However, since 2004 regime switching has become more frequent and the chartist regime has been the most prominent. J.E.L. classication: D84, Q33, Q41, G15. Keywords: Markov switching models, oil prices, speculation. 4 ECB Working Paper Series No 1371 August 2011 Non-technical summary The importance of oil to the modern world is unique in character and far-reaching in scope. It is a singularly autonomous variable in the world economy and it is used inter alia for transportation, heating and production. As such, oil availability and prices thus aect the global output capacity, rate of growth and level of in ation and hence oil price uctuations can have important macroeconomic repercussions. Indeed, sharply higher oil prices can set di!cult economic challenges for oil importing economies as it can simultaneously slow economic growth while stoking in ation. For these reasons, already almost a century ago, academics started to study oil prices (see for instance Working, 1948). During the eighties and nineties, however, interest in understanding oil price developments fell mainly because prices remained relatively low and stable in nominal and real terms. However, since 2000, interest in oil price developments resurfaced as prices started to experience a steady upward trend. Since 2005, this upward movement became more rapid and then, in the course of 2008, oil prices climbed to unprecedented highs of USD 140 per barrel in July, only to fall dramatically in a very short period of time to a low of US 40 per barrel in December 2008. Since the end of 2008, oil prices have picked up again. Such relatively dramatic and unprecedented movements in oil prices have reignited interest into the question as to what drives oil prices. The recent academic and policy debate seems to put forward several possible factors however no consensus seems to arise as to the relative importance of these factors. In particular, there is no consensus as to the relative weight that should be attributed to speculation versus (i.e. supply and demand) fundamentals in driving oil prices. In this paper we analyse the relative importance of fundamental and speculation driven demand on oil futures price levels and volatility. In a rst step, we present a theoretical heterogeneous agent model of the oil futures market based on "noise trading". We use the model to study the interaction between prices, volatility, developments in underlying fundamentals and the presence of dierent types of agents. We distinguish between commercial traders (who are physically involved in oil) and non-commercial traders (who are not involved physically with oil). Based on the theoretical model we nd that a multiplicity of equilibria can exist. More specically, on the one hand, if we have high fundamental volatility, high uncertainty about future oil demand, and the oil price deviation from fundamentals or the price trend is small, we will only have commercial traders entering the market. On the other hand, if a large unexpected shock to the oil spot price occurs then all traders will enter the market. Under this circumstance, the oil price variance reaches its maximum and the oil price itself is a weighted average of the pricing rules applied by the dierent traders. Important in this respect is also that increasing the number of commercial traders decreases the benets for the non-commercial traders to enter the market. In a next step in the paper, we empirically test the model by estimating a markov-switching model with time-varying transition probabilities. We estimate the model over the period January 1992 - April 2011. We nd that for the earlier part of our sample (up to 2004) that fundamentals have been the key driving force behind oil price movements. Thereafter, trend chasing patterns appear to be better in capturing the developments in oil futures markets. ECB Working Paper Series No 1371 August 2011 5 1 Introduction and literature review The importance of oil to the modern world is unique in character and far-reaching in scope. It is a singularly autonomous variable in the world economy and it is used inter alia for transportation, heating and production. As such, oil availability and prices thus aect the global output capacity, rate of growth and level of in ation and hence oil price uctuations can have important macroeconomic repercussions. Indeed, sharply higher oil prices can set di!cult economic challenges for oil importing economies as it can simultaneously slow economic growth while stoking in ation. For these reasons, already almost a century ago, academics started to study oil prices (see for instance Working, 1934). During the eighties and nineties, however, interest in understanding oil price developments fell mainly because prices remained relatively low and stable in nominal and real terms (see Figure 1). However, since 2000, interest in oil price developments resurfaced as prices started to experience a steady upward trend. Since 2005, this upward movement became more rapid and then, in the course of 2008, oil prices climbed to unprecedented highs of almost USD 140 per barrel in July, only to fall dramatically in a very short period of time to a low of US 40 per barrel in December 2008. Since the end of 2008, oil prices have picked up again. Nominal WTI oil price (in USD) 140 120 100 80 60 40 20 0 jan 59 apr 67 aug 75 dec 83 apr 92 aug 00 dec 08 Real WTI oil price (US CPI deflated, Jan 2002 = 100) 300 250 200 150 100 50 0 jan 59 apr 67 aug 75 dec 83 apr 92 aug 00 dec 08 Figure 1: Monthly oil price developments over the period 1959-2011 Such relatively dramatic and unprecedented movements in oil prices have reignited interest 6 ECB Working Paper Series No 1371 August 2011 into the question as to what drives oil prices. The recent academic and policy debate seems to put - next to the geopolitical factor - forward three main possible factors which may have caused the upward movement in oil prices, however no consensus seems to arise as to the relative importance of these factors. First, some authors note that fundamentals and more specically increased demand from fast growing developing countries - which are accounting for larger and larger shares of annual oil consumption growth - are playing an important role (see for instance Helbling and others (2008)). While some large developing countries have been growing rapidly for years, and in some cases decades, a combination of rapid industrialization and higher commodity intensity of growth, coupled with rapid income per capita growth, has increased signicantly their oil demand. Second, Calvo (2008) argues that excess liquidity and low interest rates have been contributing to the price increases. Low interest rates would result in the expansion of money supply. They would also decrease the demand for liquid assets by sovereigns like China, Chile or Dubai. Both eects would eventually lead to an increase in prices. But not all prices would move at the same time as some prices are more exible than others. Among the most exible, according to Calvo (2008), are the commodity prices. A similar argument has been made by Frankel (2005, 2006). Finally, in additional to these more fundamental based explanations, some studies have noted that speculation may also be behind the upward movement in commodity prices. The role of speculators in futures markets has been the always been a source of both interest and controversy recent years. The traditional speculative stabilizing theory of Friedman (1953) suggests that protable speculation must involve buying when the price is low and selling when the price is high. The traditional theory predicts that irrational speculators or noise traders, who trade on the basis of irrelevant information, will not survive in the market place. Such view is for instance conrmed in Lombardi and Van Robays (2011) who nd that speculative trading in futures markets may aect spot oil prices signicantly, but their overall importance is limited over time. Such views are however being challenged by theories of noise trading, herding behaviour and speculative bubbles. Shleifer and Summers (1990) and deLong et al. (1990) for instance show that noise traders might have an impact on prices if they hold large share of assets regardless of their survival in the long run. Such views have gained increasing prominence, due to the coincident rise in crude oil prices and the increased numbers of nancial participants in the crude oil futures market from 20002008. Indeed, over the last decade, the volume of trading in nancial instruments linked to oil (and in general commodities) has increased sharply on both commodity exchanges and over-the-counter markets. For instance, the open futures positions held by nancial traders (hedge funds and non-registered participants) grew sharply — from about 45,000 contracts in the second half of 2000, to more than half a million futures in the rst eight months of 2008. As a result, the market share of nancial traders has more than doubled, from less than 20% of all open futures and futures-equivalent option positions in 2000 to more than 40% in 2008. However, one of the counter arguments that recently prices re ect fundamentals rather than speculation is the question "Where are the stocks? " (see Krugman, 2008). Along this line of argumentation, if speculators were the main force pushing oil prices far above the level justied by fundamentals, excess supply should be observed. Taken together, the recent literature points towards several factors which may have driven oil prices upwards. However, at the same time, the literature remains inconclusive as to the relative importance of these factors. In particular, there is no consensus as to the relative ECB Working Paper Series No 1371 August 2011 7 weight that should be attributed to speculation versus (i.e. supply and demand) fundamentals in driving oil prices. Of course alternatively, it could be asserted that both stories overlap and are connected and that a complete picture should take all the pieces together in a coherent way. As such, both nancialization and rising demand from emerging markets (i.e. fundamentals) could have played a role in the recent oil price movements. On this basis, we could argue that there are several agents active in the market with dierent beliefs or strategies. Their interaction determines the price formation in the market. In previous studies, such models have been successfully applied to a variety of markets. Shiller (1984) was the rst to estimate such a model for the money market whereas deLong et al. (1990) developed a model of the asset markets in which irrational noise traders with erroneous stochastic beliefs aect prices. The approach has however been most widely adopted to model the exchange rate market (see for instance among others De Grauwe, Dewachter and Embrechts (1993), Menkho et al. (2009) and Jeanne and Rose (2002)). In our case, we intend to apply this theoretical model to the crude oil futures market and then test the model empirically using a time-varying transition probability Markov-switching model. We decide to apply the model to the crude oil futures market and not the spot market as agents who are not physically involved in oil can enter the oil futures market but are less likely to enter the spot market. Indeed, contracts sold on futures markets generally do not require the purchaser to take delivery of the oil, and can be implemented immediately with little up-front cash (Silvapulle and Moosa, 1999). As such, these contracts are specically designed to be nancial instruments (Energy Information Agency, 2008). In addition, Newberry (1992) argues that futures markets provide opportunities for price manipulation (see Kaufman and Ullman, 2009). By analysing the potential non-linear link between oil futures prices and its fundamentals, this paper ts into several strands of the nance and commodities literature. In the literature on commodities, our analysis contributes to determining the link between the futures price of oil and oil price fundamentals. In theory, futures prices should be equal to the spot price plus the cost of carry (the sum of the cost of storage and the interest rate) and the convenience yield (that is, the benet from holding spot oil which accrues to the owner of the spot commodity). Since the study of Garbade and Silver (1983), a widely recognised benet of futures markets has been the process of competitive price discovery, that is the use of futures prices for pricing spot market transactions through the timely incorporation into market prices of heterogeneous private information or heterogeneous interpretation of public information by way of trading activity (Lehmann, 2002). Nevertheless, emprically, the determination of the convenience yield and the role of futures prices in the price discovery process remains unconclusive. In nance, our analysis adds to extant work on the roles of dierent kinds of traders in nancial markets. The evidence of the presence of noise traders in nancial markets is well documented. For instance, a survey conducted by the Group of Thirty (1985) reported that 87% of security houses believed that the use of technical analysis has a signicant impact on the foreign exchange market. In the case of commodity markets, evidence also starts to emerge of the use of chartist trading techniques. In this context, for instance Smidt (1965) reports that a large fraction of the speculators applies price charts to render trading decisions in commodity markets. Similar results are obtained by Draper (1985) and Canoles (1998). Furthermore, Sanders et al. (2000) discern evidence of positive feedback grading in several commodity markets and Weiner (2002) detects evidence of herding behaviour in the petroleum market. 8 ECB Working Paper Series No 1371 August 2011 In terms of approach, our paper is closest to Reitz and Slopek (2008) and Ter Ellen and Zwinkels (2010). In the rst study, the authors develop and empirically investigate a simple oil market model with technical and fundamental traders. Technical traders form price predictions by extrapolating historical price trends thereby destabilizing the market. Fundamental analysis is based on the assumption that prices converge towards their long-run equilibrium value. To do so, the authors estimate a smooth transition autoregressive model. The results suggest that heterogeneous agents and their nonlinear trading impact may be responsible for pronounced swings in oil prices, as witnessed in recent years. In Ter Ellen and Zwinkels (2010) the authors assert that fundamentalists have a demand for oil based on the dierence between the spot price and the expected price of oil in the future. Chartists have a simpler approach: they react to the price change. Chartists expect trend movements to continue in the same direction irrespective of fundamentals. Total market demand for oil consists of the real demand for oil – the users of oil – and the weighted average of the demand of the chartists and the fundamentalists. Their results suggest that typically, fundamentalists are 40% to 70% of the market; however in 2008, they fell to about 35% of the market. When chartists dominated the market – in 1985-1986, 1990, and in 1998 – price changes were particularly pronounced. The remainder of the paper is organised as follows. In Section 2 we present a theoretical model of heterogeneous agents. Then in section 3 we present the empirical markov-switching model that we will estimate. Finally, in Section 3.3 we discuss the data and the estimation results. 2 A Small Model of Heterogeneous Agents and the oil futures market The model presented in this section mixes elements from two hitherto disparate branches of the theory of oil price determination and the noise trading approach to asset price and volatility determination. On the oil price theory side, we use the conventional model of oil futures price determination, as developed by Kaldor (1939) and rened by Pindyck (1994). On the microstructure side, we employ the model of noise trading developed by deLong et al. (1990) and rened by Sanders et al. (1999) for the futures market. 2.1 A fundamental-based model of oil futures prices The literature on determining the commodity futures prices dates back to the Theory of Normal Backwardation introduced by Keynes (1930), which compares futures prices to expected future spot prices. This theory is based on a denition of the basis, i.e. the dierence between the current futures price maturing at time T (Iw>W ) and the current spot price (Vw ). The theory divides the basis into the dierence between the spot price expected to prevail at time W (Hw V(W )) and the current spot prices (Vw ) minus a risk premium ( w>W ): Iw>W Vw = Hw (VW ) Vw w>W In its earliest form, the Theory of Normal Backwardation asserts that in order to induce storage, futures prices and expected spot prices have to rise over time to compensate storage holders for the costs of storage. This cost of carry principle, however, had di!culties to explain downward sloping futures curves. ECB Working Paper Series No 1371 August 2011 9 In response, Kaldor (1939) introduced the Theory of Storage. The Theory of Storage established a link between contemporaneous spot and futures prices and recties the Theory of Normal Backwardation by introducing the concept of convenience yield. The convenience yield can be dened as the implicit gain that accrues to an owner of the physical commodity but not to the owner of a contract for future delivery of the commodity (Brennan and Schwartz, 1985). These additional benets include production smoothing (Kaldor, 1939, and Working, 1948)1 , as well as the option value of holding inventories (Dixit and Pindyck, 1994).2 In the specic case of the crude oil market, the convenience yield turns out to be particularly relevant, not only because of the strategic benet from the possession of the commodity, but also because of the relative scarcity of that non-renewable resource (Coppola, 2008). Under the cost of storage model and in the absence of arbitrage opportunities, the relationship between futures and spot prices can be described as follows: Iw>W = Vw + (W w)uw # w>W Pindyck (1994) then in turn expressed the net convenience yield (# w>W ) as a function of the spot price, the level of inventories (Qw ) and expected oil demand (Tw+1 ): # w>W = #(Qw > Tw+1 > Vw ) The net marginal convenience yield is assumed to be negatively correlated with the level of inventory. Indeed, at times of higher inventories, adding an additional unit is expected to yield less benet. At the same time, it is positively related to the spot price and higher expected oil demand since in both cases the convenience of holding inventories increases. 2.2 The Microstructural Set-up of the Trading Behaviour On the microstructure side, the model presented in this paper is in essence a stripped down version of Samuelson’s (1958) overlapping generations model with two-period lived agents who allocate their portfolio between the risk free asset (which is in perfect elastic supply) and oil futures contracts. As in deLong et al. (1990) we assume that there is no rst period consumption, no labour supply decision and no bequest. As a result, the resources the agents in the model have to invest are exogenous. The only decision agents have to make is to choose a portfolio when young. Traders have the same endownments but dier in their ability to trade in the oil futures and spot market. We will distinguish between two main types of agents: commercial and non-commercial agents. Commercial agents are physically involved in the oil market. They supply and consume oil and are able to store it. These agents are able to trade on the oil spot market and only enter in the futures market as they wish to hedge against price uctuations by xing in advance the price they wil have to pay or receive for a delivery in the future. In the case of oil producers, entering in the futures market ensures that they have the opportunity to secure their income today by selling futures contracts, whilst oil consumers will buy futures contracts in order to pin down their future costs. These traders are able to form rational expectations on risk and returns costlessly. 1 There are costs to rms from rapidly shifting production and from rapid shifts (especially declines) in inventory holdings. Additional inventories oer the rm added exibility to produce at the time that minimizes costs, by reducing the risk of stockouts. 2 In eect, an option value exists because inventories allow the exibility to choose the most protable time to sell the commodity. 10 ECB Working Paper Series No 1371 August 2011 Non-commercial agents are, in contrast to commercial agents, not physically involved with oil. They intervene in the oil futures market because they want to achieve exposure to oil price risk. While commercial agents can enter the oil futures markets costlessly, non-commercial agents face an entry costs. Moreover, non-commercial agents have only imperfect information regarding the evolution of oil price fundamentals. In addition, while some base their expectations about future prices on the perceived evolution of market fundamentals others not do not take market fundamentals into account but instead base their expectations about future prices and their trading strategies upon observed historical patterns in past prices. These technical analysts try to extrapolate observed price patterns, such as trends, and exploit these patterns in their investment decisions. Allen and Tailor (1989) describe the distinction as follows: chartists study only the price action of a market, whereas fundamentalists look for the reason behind that action.3 As in DeLong et al. (1990) we assume a generation of traders is born each period. We assume that commercial traders are present in the model in measure Q1 whereas non-commercial traders who based their expectations about future prices on market fundamentals are present in measure Q2 = Finally, non-commercial traders who base their expectations upon historical patterns are presented in measure Q3 . Each trader decides upon the share of its endowment (Z ) it wishes to invest in the oil market at time t (emw ). The remainder will be invested at the risk free interest rate u. The decision are taken before time w shocks are revealed, on the basis of the information available at time w 1= Each agent has a constant absolute risk aversion utility function: X = exp3dHw (Zw+1 ) where d is the constant absolute risk aversion. Traders aim to maximise the expected utility of their end-of-life wealth (Zw+1 ). With normally-distributed returns to holding an oil futures contract, this is equivalent to m ) is given maximising Hw (X ) = Hw (Zw+1 ) 2d 2Hw (Zw+1 ) . End-of-life wealth of trader j (Zw+1 by: m Zw+1 = (1 + uw )Z + mw (emw w+1 Fm ) (1) Trader m’s end-of-life wealth is thus equal to the trader’s initial endowment times the risk free interest rate plus, if m enters, the excess return on the oil futures market investment (w+1 ) minus a xed cost that must be borne to enter the market. Fm re ects the costs associated with entering the market for trader m.4 As noted above, we assume there are three types of traders. Commercial traders are assumed to have an accurate knowledge of the way the oil futures price is determined and bear no entry cost. They are knowledgeable about the oil market, can process new information costlessly and make their decisions based on rational expectations about the future. For these set of traders, the expected excess return on the oil futures market investment can be written 3 Albeit to some extent arbitrary to divide the traders in the oil market into dierent types of people (i.e. rational versus irrational, well- versus ill-informed,...) such categorisation can however be justied on the basis of two grounds. First, some traders in the oil market are indeed better informed than other. This is for instance the basis of research in the recently increasingly popular market microstructure literature. Secondly, although we here assume the presence of dierent trader types in the oil market, our model could also be interpreted as one where there is one trader present in the market who weighs the dierent information sets available (i.e. technical versus fundamental information). An alternative set-up to the one presented in this section can be found for instance in the De Grauwe and Grimaldi (2004) for the exchange rate market. 4 For simplicity we assume here that the costs do not dier according to the type of non-commercial trader that enters the market. The model could however easily be modied to include dierent entry costs for dierent types of non-commercial traders. ECB Working Paper Series No 1371 August 2011 11 as: Hwm (w+1 ) = Vw + uw Hw (Jw>w+1 ) Iw>w+1 yduwm (w+1 ) = yduw (w+1 ) Fm = 0 Non-commercial traders, in contrast to commercial traders, have imperfect knowledge of the determinants of oil prices and are also faced with a positive entry cost. For noncommercial traders which base their predictions about oil prices upon market fundamentals, we adopt the assumption, akin to DeLong et al. (1990) that the perception of future oil demand is aected by noise unrelated to fundamentals. This noise is common among all noncommercial fundamental traders (i.e. we assume that among non-commercial traders there is no private information). For these traders we can then write: Hwm (w+1 ) = Vw + uw Hw (Jw>w+1 ) + w Iw>w+1 yduwm (w+1 ) = yduw (w+1 ) Fm A 0 whereby w represents the extent to which non-commercial fundamental traders misperceive the distribution of expected oil demand. The misperception is represented by an i.i.d normal variable, i.e. w ˜Q ( W > 2w ) and is assumed to be uncorrelated with oil fundamentals. We interpret the noise terms as a fad which is wide-spread but non-fundamentals. In addition, we link the size of the non-commercial traders ’ errors to economic uncertainty by assuming that the variance of the noise is proportional to the true unconditional variance of the oil futures price, i.e. 2w = 2Iw>w+1 with A 1. Finally, the last set of non-commercial traders base their expectations about future oil prices on historical patterns. In our case, we can write for these non-commercial chartist traders: Hwm (w+1 ) = Vw Iw31>w1 yduwm (w+1 ) = yduw (w+1 ) Fm A 0 Based on these expected returns, we can determine the optimal share each trader will invest in the oil futures market (assuming rational bahviour of all active traders). We can then derive a market entry condition for each non-commercial trader. The optimal share each trader will invest in the oil futures market is given by (see DeLong et al., 1990): H m ( ) emw = w 2 w+1 d w+1 Moreover, market clearance in the oil futures market implies a zero net supply (see Irwin et al., 1997): e1w Q1 + e2w Q2 + e3w Q3 = 0 This three equation system can be solved for an oil futures pricing formula: Iw>w+1 = [Vw + uw Hw (Jw>w+1 )] + 12 ECB Working Paper Series No 1371 August 2011 Q2 Q3 w + [Vw Iw31>1 ] Q1 + Q2 Q1 + Q2 (2) And oil future price volatility can be represented as: μ μ ¶2 ¶2 Q3 Q2 2 2 2 2 Vw + 2w Iw>w+1 = Vw + Jw>w+1 + Q1 + Q2 Q1 + Q2 (3) The above equations would suggest that noise trader sentiment impacts the pricing of oil futures contracts. The rst term (in square brackets) in equation (2) indicates that the futures price equals the fundamental value, in the absence of non-commercial traders. The second and third term capture the price pressure eects of non-commercial traders. If fundamental noncommercial traders are on average bearish regarding future demand, then the price is lower than the fundamnetal value. Similarly when the past trends are be below the fundamental based outlook, prices would be pushed below the fundamental value. However, unlike the model of DeLong (1990) but in line with Irwin et al. (1997) we nd that non-commercial traders cannot create their own space in futures market. That is, there is no premium for assuming noise trader risk in futures markets. This stems from the fact that the investment in futures is really just a side bet on price movements, and therefore, requires no net risk sharing capacity within the economy (see Irwin, 1997). As regards the futures price volatility, we nd that volatility is unambiguously increasing with the number of noise traders and the variability of their sentiment (equation (3)). In a next step, we can endogenise the composition of the pool of active traders. The entry decision of traders that do not bear any entry cost (i.e. the commercial traders) is trivial: they always enter the market in equilibrium. However, a non-commercial trader only enters if the benet of diversifying the portfolio exceeds the entry cost. For non-commercial traders, this is the case if the gross benet exceeds the costs F. The gross benets for fundamental and chartist non-commercial traders is given by: JE2 = JE2 = JE3 = JE3 = (Vw + uw Hw (Jw>w+1 ) Iw>w+1 )2 1 1 log(1 + ) + 2d 2d(1 + ) 2Iw>w+1 ³ ´2 Q3 (V I ) w w31>w Q1 +Q2 1 1 log(1 + ) + ³ ´2 ³ ´2 2d 2d(1 + ) Q3 2 (1 + Q1Q+Q + ) 2Vw + 2Jw>w+1 Q1 +Q2 2 (Vw Iw31>w1 )2 1 1 log(1 + ) + 2d 2d(1 + ) 2Iw>w+1 ¡ Q1 +Q2 ¢2 Q 3 (Vw + uw Hw (Jw>w+1 ) Iw>w+1 ) 1 1 log(1 + ) + ³ ´2 ³ ´2 2d 2d(1 + ) Q3 2 (1 + Q1Q+Q + ) 2Vw + 2Jw>w+1 Q1 +Q2 2 (4) (5) The partial derivatives of the gross benet equations (4) and (5) have an intuitive interpretation. The benet of entry for a marginal non-commercial trader increases with the expected deviation of oil price from its underlying fundamentals or from its historical trend and decreases with the oil futures price variability. The partial derivatives in this case show that the further the oil price deviates from its fundamentals, the more non-commercial fundamental traders will be willing to enter the market, while increases in the oil price trend will attract non-commercial chartist traders. However, in equilibrium both the risk premium and the variance of the oil price are functions of the number of non-commercial traders that enter ECB Working Paper Series No 1371 August 2011 13 the market. This circularity is responsible for the multiple equilibria. The multiplicity of equilibria in the model is illustrated in Figure 2 which shows the gross benefit and cost of entry for the marginal non-commercial fundamental trader for various input values.5 The entry of the marginal non-commercial fundamental traders depends on the cost, the share of share of non-commercial and commercial traders present in the market, the degree of uncertainty regarding future demand expectations as well as the impact this has on oil price variability and the expected oil price. The gross benefit and cost of entry for low (red line) and high (blue line) values for lambda 0.4 0.3 0.2 0.1 0 0 0.1 0.2 0.3 0.4 0.5 0.6 0.7 0.8 0.9 1 The gross benefit and cost of entry for low (red line) and high (blue line) values for oil fundamental volatility 0.4 0.3 0.2 0.1 0 0 0.1 0.2 0.3 0.4 0.5 0.6 0.7 0.8 0.9 1 The gross benefit and cost of entry for low (red line) and high (blue line) values for the expected excess return 0.4 0.3 0.2 0.1 0 0 0.1 0.2 0.3 0.4 0.5 0.6 0.7 0.8 0.9 1 Figure 2: The gross benefit and cost of entry for the marginal non-commercial fundamental trader with the number of non-commercial fundamental traders ranging between 0 and 1. Overall, the results would indicate that in case we have high fundamental volatility, high uncertainty about future oil demand, and the oil price deviation from fundamentals or the price trend is small, we will only have commercial traders entering the market (as represented for instance by the blue lines in the two top charts in Figure 2 and the red line in the bottom chart). If, however, a large unexpected shock to the oil spot price occurs or uncertainty decreases about future oil demand (see top chart in Figure 2), non-commercial traders with 5 All model derived charts are based on the following parameter assumptions: = 14, 3 = 0, 2 = 1. The low value scenarios are based on the following parameters: = 1, 2 = 05 and ( − −1 ) = 05. The high value scenarios are based on the following parameters: = 4, 2 = 2 and ( − −1 ) = 07. 14 ECB Working Paper Series No 1371 August 2011 enter the market. Under this circumstance, the oil futures price variance will increase and the oil futures price itself is a weighted average of the various forecasting rules. In this case, oil futures price volatility exceeds that of its underlying fundamentals. This increase in oil futures price volatility will reduce the gross benet for a marginal non-commercial trader to enter the market. Finally, equilibria in between these two extrema exist. Important in this respect is to note that increasing the number of chartist noise traders decreases the benets for the fundamentalist noise traders to enter (and vice versa). This is shown in Figure 3. 0.5 The impact of the changing number of commercial traders on the GB for a non-com. fundamental trader Changing commercial traders 0.4 0.3 0.2 0.1 0 0 0.1 0.2 0.3 0.4 0.5 0.6 Number of commercial traders 0.7 0.8 0.9 1 The impact of the changing number of non-com. chartist traders on the GB for a non-com. fundamental trader 0.5 Changing non-com. chartist traders 0.4 0.3 0.2 0.1 0 0 0.1 0.2 0.3 0.4 0.5 0.6 0.7 Number of non-commercial chartist traders 0.8 0.9 1 Figure 3: The impact of changing the number of commercial (above) or non-commercial chartist traders (below) on the gross benet for commercial fundamental traders to enter the market. 3 3.1 Empirically Modelling strategy: the Markov-switching model The time-varying transition probability markov-switching model The model presented in section 2 can generate multiple equilibria. These equilibria depend on the number of non-commercial traders that enter the oil futures market. If they are present, ECB Working Paper Series No 1371 August 2011 15 they increase oil price rate volatility and aect oil price rate movements. If they are absent from the market, oil futures price movements can be explained by developments in underlying fundamentals as commercial traders dominate the market. Which factors drive the oil futures price at each moment in time thus depends on the share of non-commercial traders present in the oil futures market. The presence of non-commercial traders in turn depends on the net entry benet for the marginal non-commercial trader to enter into the oil futures market. This is according to equations (4) and (5) a function of the number of non-commercial traders present in the market, the deviation of the oil futures price from its fundamentals and/or from its trend and the volatility of the underlying fundamentals. To test these model assumptions and outcomes empirically, we rely on a 2-regime Markov-switching model with time-varying transition probabilities. Such a model is closest to the spirit of the theoretical model. Markov-switching models represent time series models with a latent variable component where an unobserved Markov process drives the observation-generating distribution. Such models have been rst applied to economics and nancial econometrics after the seminal work of Hamilton (1989). There exists a number of extensions made to the basic Markov-switching model as developed by Hamilton (1989), one being the time-varying transition probability Markov-switching model. In this variant, transition probabilities are allowed to vary with such information variables as the strength of the economy, deviations of fundamentals from actual values, and other leading indicators of change. Examples of these extensions show up in many elds of research. Researchers have used time-varying transition probability models to examine output seasonality in a time-varying transition probability model (see Ghysels, 1994), to study business cycle uctuations (Filardo, 1994), interest rate dynamics (Gray, 1996), bubbles and asset pricing (Schaller and van Norden 1996), and exchange rates (Diebold, et.al. 1994, Engel and Hakkio 1994). In our set-up, we allow for two regimes. In one regime, henceforth called the commercial trader regime (frp), oil futures prices are a function of a set of underlying fundamentals. In the other regime, called the non-commercial trader regime (qrqfrp), oil futures prices are a function of historical price movements. At each moment in time, the Markov-switching model will give us the probability of being in either of the two regimes. This probability can then be seen as the weight placed on the commercial/non-commercial trader oil price forecast. The transition probabilities, i.e. the probability of being in a regime in the current period given the previous period’s regime, are allowed to be time-varying in our case and take a logstical functional form, namely: 0 1 h(s +s Yw ) 1 + h(s0 +s1 Yw ) 0 1 h(t +t Zw ) = qrqfrp) = 1 + h(t0 +t1 Zw ) S (Vw = frp|Vw31 = frp) = S (Vw = qrqfrp|Vw31 (6) The transition probabilities are in our model a function of the variables driving the entry benet for the marginal non-commercial trader, as specied in equation (4) and (5). 3.2 Oil prices modelled as a TVTP Markov-switching model In order to estimate the Markov-switching model, we rst need to specify the equations we will estimate under the two regimes. As regards the fundamental model, as noted in section 16 ECB Working Paper Series No 1371 August 2011 2, in theory, oil futures prices can under the cost of storage model be represented as follows: Iw>W = Vw + (W w)uw # w>W Whereby # w>W is the net convenience yield. In our empirical model, we will incorporate the net convenience yield as a function of the spot price, the level of inventories (Qw ) and expected oil demand (Tw+1 ) (see Pindyck, 1994). As a result, the theoretical model will empirically translate into the following equation: Iw>W = 0 + 1 (Vw ) + 2 uw>W + 3 Hw (Tw+1 ) + 4 Qw + %w (7) As regards the chartist, trend-chasing model, we will set up a model that has the highest performance (out-of-sample) over our sample period. We estimated this model by a generalto-specic approach and end up with the following specication Iw>W = 0 + 1 Iw31>W 31 + 2 DWw31 + 3 TP Dw31 + 4 wuhqg + yw (8) Whereby oil futures prices are a function of its own lag, the one-period lagged annual trend (I 3I ) (DWw31 = w31>W 31 12 w313>W 313 ), the one-period lagged quarterly moving average (TP Dw31 = (Iw31>W 31 +Iw32>W 32 +Iw33>W 33 ) ) 3 and the trend since the beginning of the sample period. Take together, we will thus estimate the following measurement equations 1 : Iw>W = 0 + 1 (Vw ) + 2 uw>W + 3 Hw (Tw+1 ) + 4 Qw + %w %w Q (0> 2i xqg>w ) 2 : Iw>W = 0 + 1 Iw31>W 31 + 2 DWw31 + 3 TP Dw31 + 4 wuhqg + yw (9) yw Q (0> 2fkduw>w ) As regards the volatility, we would expect, based on section 2, that the volatility regimes accompanying these mean regimes should have the property that: 2uhjlph 1 ? 2uhjlph 2 Besides modelling the two regime equations, we also need to model the determinants of the transition probabilities, i.e. Yw and Zw in equation 6. In our case, these information variables are determined by the net entry benet for the marginal non-commercial trader, namely the deviation of oil futures price from its trend and the amount of non-commercial traders present in the market (VS HF). Based on our theoretical model, we would expect the probability of remaining in the non-commercial trader regime is positively related to both variables. For the commercial trader regime (or fundamental-based regime) we would expect the probability of not switching regime to increase if oil prices deviate further from underlying fundamentals and fundamental volatility (yro_i xqg) is high. Based on equations (4) and (5) we would expect that the deviation of oil futures prices from trend and the deviation from fundamentals enter the equation squared (implying that a positive or negative deviation would trigger the same eect). We would thus get the following equations for Yw and Zw :. Yw = d1 × yro_ixqg + d2 × (%w31 )2 (10) 2 Zw = d3 × vshf + d4 × (yw31 ) Ex-ante we would expect all coe!cients to have a positive sign. A number of methods have been used to estimate this model. A standard approach is to use both conditional maximum likelihood estimation and ltering methods (as for instance in Gray, 1996). However, the conditions that justify this approach are non-trivial. In general, ECB Working Paper Series No 1371 August 2011 17 the ]w variables that enter the transition probability functions must be contemporaneously conditionally uncorrelated with the unobserved state Vw . If this condition is not met in a particular empirical application, other methods need to be employed to deliver estimators with the typical desirable properties (see Filardo, 1998). One such alternative method is presented in Filardo and Gordon (1998) where a Bayesian method is adopted, using the simulation estimation techniques of Gibbs sampling. This approach has also been adopted in this paper. In the next section, we discuss the data used for our estimation and thereafter the estimation results. 3.3 Data In order to analyse the above presented model, we need to choose the relevant variables. The rst key variable in this context is what futures price of oil should be analysed? There exist several references in world exchanges: North Sea Brent, West Texas Intermediate (WTI) and Dubai. Each refers to an oil of high quality with a specic production or trading location. The WTI and Dubai prices are chie y traded in the United States and Asia, whereas the North Sea Brent is often used as the world reference. In the London based ICE futures exchange (formerly known as the international petroleum exchange, or IPE) the Brent is used to specify the price of two thirds of crude oil exchanged worldwide. However, although the three prices do not uctuate perfectly in line with one another over time, they are strongly correlated and modelling one or the other should not impact substantially the analysis. Fattouh (2007) in this context compares their dynamics and concludes that most varieties cointegrate in threshold models. The Brent-WTI price dierentials is stationary with no need for thresholds (see also Chevillon and Ri"art, 2008). In this paper, we will rely on the WTI futures price of oil for the analysis. The main reason is that the index used to measure speculative activity (see below) uses CFTC data, which is based on trading activity in the WTI futures market. Our empirical analysis is based on daily prices of crude oil futures traded on the NYMEX from the EIA (Energy Information Agency). Crude oil futures can have maturities as long as 7 years. Contracts are for delivery at Cushing, OK. Trading ends four days prior to the 25th calendar day preceding the delivery month. If the 25th is not a business day, trading ends on the fourth business day prior to the last business day before the 25th calendar day (see Alquist and Kilian, 2010). Given that our fundamental variables are only available at a monthly frequency, we have to construct monthly futures prices. A comment problem in constructing monthly futures prices of a given maturity is that an h-month contract may not trade on a given day. In line with Alquist and Kilian (2010) we identify the h-month futures contract trading closest to the last trading day of the month and use the price associated with that contract as the end-of-month value. By doing so, we obtain a continuous monthly time series based on a backward-looking window of at most ve days. For maturities up to three months, the backward-looking window is at most three days. This allows us to match up end-of-month spot prices and futures prices as closely as possible. The daily spot price data are also obtained from the EIA and refer to the price of West Texas Intermediate crude oil available for delivery at Cushing, OK. Besides the futures and spot price of oil, we also need to include expected oil demand, oil inventories and the risk free interest rate into our fundamental equation. For expected oil demand, we take the total global oil demand projections by the IEA (International Energy Agency) as published on a monthly basis in their monthly world oil market report. These series are consistently available for the next quarter ahead since January 1992. To match 18 ECB Working Paper Series No 1371 August 2011 them to the oil price futures data, we take from the EIA the oil futures contract that have a three month maturity. In our regressions, we incorporate the expected change in oil demand between the current and next quarter. For oil inventories, we also take the data available from the IEA. However, in this case, only OECD inventories for crude oil are available. For non-OECD countries, this data is unfortunately not available. For the risk free interest rate, we take the 10-year US government bond yield, which is often considered to be a risk free rate (see Fleming, 2010). 1.18 1.16 1.14 1.12 1.1 1.08 1.06 1.04 1.02 1 Jan 92 Feb 96 Apr 00 June 04 Aug 08 Apr 11 Figure 4: Index of speculative activity for the period January 1992 - April 2011 For our transition equations, we need to model fundamental volatility (see equation 10). In our case, we calculate the volatility of oil demand (as derived from the IEA’s monthly world oil market report). Finally, our transition equation would require the share of noncommercial traders in the oil futures market (see equation 10). One possible way to do so would be to include the net open interest non-commercial positions from the CFTC’s historical commitment of traders report. However, as noted by Working (1960), the level of non-commercial trading is only meaningful in comparison with the level of hedging in the market. Indeed, increased speculative positions naturally arise with increased hedging pressures in the market. Hence, in order to assess the adequacy of speculative activity in the crude oil market, relative to hedging activity, Working has suggested the following index: W = 1+ 1+ QFV KO+KV QFO KO+KV KV KO KV ? KO ECB Working Paper Series No 1371 August 2011 19 whereby is non-commercial short positions, is non commercial long positions, is short hedge positions and is long hedge positions. To calculate the index, we rely on the CFTC’s historical commitment of traders reports. These reports distinguish between noncommercial and commercial traders. When using this data, it is important to note that (as stated by the CFTC, 2008 page 2), the current data received by the CFTC classifies positions by entity (commercial versus noncommercial) and not by trading activity (speculation versus hedging). These trader classifications have grown less precise over time, as both groups may be engaging in hedging and speculative activity. Indeed, the behaviour of hedgers and speculators is actually better described as a continuum between pure risk avoidance and pure speculation. However, since no breakdown by trading activity is available, we will rely in our analysis on the CFTC data since it is the best proxy available at present. In our calculations we include information from the trading on the oil futures (and hence exclude oil options from the series). The results of the calculations are presented in Chart 4. As can be seen, until approximately end 2002, the index was stable with an average of around 1.15 suggesting a level of speculation that is 15% in excess of what is minimally necessary to meet hedging needs. Since early 2003 however, the index has initially increased steadily and in the course of 2007 rapidly to reach a peak of almost 1.5. Overall, the sample period for our estimation is determined by the availability of oil demand projections by the IEA. As a result, the time-varying transition probability Markovswitching model was estimated over the period January 1992 - April 2011. The estimated parameter coefficients from the model are presented in Table 1. TABLE 1. Estimates of the markov switching model Coefficient estimates of the Markov-switching model Fundamentalist equation Chartist equation 0 -25.00∗∗ 0 -1.89∗∗ 1 0.96∗∗ 1 0.81∗∗ ∗∗ 2 0.21 2 0.07∗∗ 3 -0.03∗ 3 0.08∗∗ ∗∗ 4 0.01 4 0.02∗∗ Time-varying transition probabilities estimates Fundamentalist equation Chartist equation 0 ∗ 0 0.31 0.09∗∗ 1 ∗ 1 0.05 0.10∗∗ 2 50.53∗ Variance Fundamentalist equation Chartist equation 2 2.56∗∗ 2 25.06∗∗ Note: standard errors are in parentheses, ∗ denotes significance at a 10% level,∗∗ at a 5% level. Fundamentalist equation: = 0 + 1 ( ) + 2 + 3 (+1 ) + 4 + , Chartist equation: = 0 + 1 −1 −1 + 2 −1 + 3 −1 + 4 + , Fundamentalist equation: ( = |−1 = 0 ) = 1 2 ( + (−1 ) ) 0 1 2 , Chartist equation: 1+( + (−1 ) ) 0 ( = |−1 = ) = 1 2 ( + −1 + ) 0 1 2 1+( + −1 + ) The results indicate, that consistently with what we assumed in our theoretical model, there exists a "fundamental-based " and "chartist-based " regime. In the fundamental 20 ECB Working Paper Series No 1371 August 2011 1 Transition probability, fundamental regime (Y-axis) - Deviation from fundamental based model (X-axis) 0.9 0.8 0.7 0.6 0.5 -15 1 -10 -5 0 5 10 15 Transition probability, chartist regime (Y-axis), Deviation from chartist model (X-axis) 0.9 0.8 0.7 0.6 0.5 -10 1 -8 -6 -4 -2 0 2 4 6 8 10 Transition probability, chartist regime (Y-axis), Detrended speculative position (X-axis) 0.8 0.6 0.4 0.2 0 -0.12 -0.1 -0.08 -0.06 -0.04 -0.02 0 0.02 0.04 0.06 Figure 5: Changes in the transition probabilities of the two estimated regimes for changes in underlying parameters based regime we nd that all explanatory variables are statistically signicant and enter the regression with the sign as expected from the storage theory of oil as outlined in Pindyck (1994). In more detail, oil spot prices, the 10-year government bond yield and oil stocks are positively related to the oil futures prices. At the same time an increase in expected oil demand results in a decline in oil futures prices. When considering the equations for the timevarying transition probabilities, we nd that the probability of staying in the fundamentalbased regime increases stastically signicant as lagged oil futures prices deviate further from underlying fundamentals. This is also shown in the top chart of Figure 5 (in the gure a value closer to one indicates a higher probability of not switching regimes). The volatility of oil demand did not enter the regression statistically signicant and the coe!cient was small. Therefore it was dropped from the empirical model. In the case of the equation governing the probability of remaining in the chartist regime, we nd that lagged deviations from the chartist model indeed increase the probability of remaining in the chartist regime. This is also shown in the middle chart of Figure 5. Moreover, in this equation we also nd that the (detrended) speculative index enters the equation statistically signicant and with the ECB Working Paper Series No 1371 August 2011 21 expected sign: an increase of speculative activity increases the probability of remaining in the chartist regime. This is re ected in the bottom chart of Figure 5. The overall evolution of the transition probabilities is then shown in Figure 6. On average, the probability of remaining the current regime is high in the fundamental regime (being on average 0.86). In the chartist regime, the average probability is somewhat lower, being 0.53. However, since 2004, the probability of remaining in the chartist regime has on average clearly increased. This can most probably be attributed to the higher level of the detrended speculative index in the latter part of the sample. The variance estimates, as presented by the coe!cients 2i xqg>w and 2fkduw>w , show that volatility is higher in the trend chasing than in the fundamental-based regime. A Hansen likelihood ratio test also indicates that the dierence is statistically signicant. As such, this result thus also conrms the outcome of theoretical model presented above. 1 Evolution of time-varying transition probabilities in the fundamental-based regime 0.9 0.8 0.7 0.6 0.5 Jan 92 1 Feb 96 Apr 00 Jun 04 Aug 08 Apr 11 Evolution of the time-varying transition probabilities in the chartist regime 0.8 0.6 0.4 0.2 0 Jan 92 Feb 96 Apr 00 Jun 04 Aug 08 Apr 11 Figure 6: The evolution of the time-varying transition probabilities over time Finally, we can look at the smoothed probabilities to understand how likely at each moment in time the fundamental-based versus chartist regime prevailed. This is presented in Chart 7. As can be seen in the chart, in the earlier period of our sample, namely between January 1992 and January 2004, the fundamental-based regime has clearly prevailed. How- 22 ECB Working Paper Series No 1371 August 2011 ever, since then, several regime swithces have occurred and for most of the remaining sample period, the chartist regime appears to have dominated market dynamics. This would suggest that some speculative and trend chasing behaviour may have been adding to oil prices over this period. Towards the very end of our estimation sample, however, the fundamental based regime seem to re-emerge, however with a less than 100% certain probability. 1 0.9 0.8 0.7 0.6 0.5 0.4 0.3 0.2 0.1 0 Jan 92 Feb 96 Apr 00 Jun 04 Aug 08 Apr 11 Figure 7: Smoothed probability of being in the fundamental based regime 4 Concluding Remarks In this paper we analysed the relative importance of fundamental and speculative demand on oil futures price levels and volatility. In a rst step, we presented a theoretical heterogeneous agent model of the oil futures market based on noise trading. Based on the theoretical model we found that a multiplicity of equilibria can exist. More specically, on the one hand, if we have high fundamental volatility, high uncertainty about future oil demand, and the oil price deviation from fundamentals or the price trend is small, we will only have commercial traders entering the market. On the other hand, if a large unexpected shock to the oil spot price occurs then all traders will enter the market. In a next step, we empirically test the model by estimating a markov-switching model with time-varying transition probabilities. We estimate the model over the period January 1992 - April 2011. We nd that up to 2004, movements in oil futures prices are best explained by underlying fundamentals. However, since 2004 regime switching has become more frequent and the chartist regime has been the most prominent.. ECB Working Paper Series No 1371 August 2011 23 References [1] Allen, H.L. and M.P. Taylor (1989). Charts and Fundamentals in the Foreign Exchange Rate Market. Discussion paper number 40, Bank of England. [2] Alquist, R. and Kilian L. (2010). What do we Learn from the Price of Crude Oil Futures? Journal of Applied Econometrics, Forthcoming. [3] Bacon, R. (1991). Modelling the Price of Oil. Oxford Review of Economic Policy, Vol 7, pp. 17-34. [4] Bastourre, D., Carrera J., Ibarlucia J. and M. Redrado (2008). Financialization of Commodity Markets: Non-linear Consequences from Heterogeneous Agents Behavior. Mimeo. Banco Central de Argentina. [5] Brennan M.J. and E.S. Schwartz (1985). Evaluating Natural Resource Investments, Journal of Business, Vol. 58, pp. 135-157. [6] Calvo, G. (2008). Exploding Commodity Prices, Lax Monetary Policy, and Sovereign Wealth Funds.VoxEU. 20 June. http://www.voxeu.org/index.php?q=node/1244 [7] Canoles, B., S. Thompson, S. Irwin and V. France (1998), An Analysis of the Proles and Motivations of Habitual Commodity Speculators, Journal of Futures Markets, Vol. 18, pp. 765-801. [8] Chevillon, G. and C. Ri"art (2008). Phsyical Market Determinants of the Price of Crude Oil and the Market Premium. ESSEC Business School Working Paper. [9] Commodity Futures Trading Commission (CFTC) (2008). Sta Report on Commodity Swap Dealers & Index Traders with Commission Recommendations. Washington, D.C.. [10] Coppola A. (2008). Forecasting Oil Price Movements: Exploiting the Information in the Futures Market, Journal of Futures Markets, Vol. 28, pp. 34-56 [11] Draper, D. (1985), The Small Public Trader in Futures Markets in: A. Peck (Ed.) Futures Markets: Regulatory Issues. American Enterprise Institute for Public Policy Research, Washington: 211-269. [12] Dees, S., Karadeloglou P., Kaufmann R.K. and M. Sanchez (2007). Modelling the World Oil Market: Assessment of a Quarterly Econometric Model. Energy Policy, Vol. 35(1), pp. 178-191. [13] De Grauwe P. and Dewachter, H. (1993). A Chaotic Model of the Exchange Rate: The Role of Fundamentalists and Chartists. Open Economies Review, 4(4), pp. 351-79. [14] De Grauwe, P., Dewachter, H. and Embrechts, M. (1993). Exchange Rate Theory: Chaotic Models of Foreign Exchange Markets, Oxford and Cambridge, Mass., Blackwell, 328p. [15] De Grauwe, P. and Grimaldi, M. (2004). Exchange Rate Puzzles: A Tale of Switching Attractors, European Economic Review, forthcoming. 24 ECB Working Paper Series No 1371 August 2011 [16] De Grauwe, P. and Grimaldi, M. (2004). Heterogeneity of Agents, Transaction Costs and the Exchange Rate, Journal of Economic Dynamics and Control, forthcoming. [17] DeLong B.J., A. Shleifer, Summers, L.H. and Waldman, R.J. (1990). Noise Trader Risk in Financial Markets, Journal of Political Economy, Vol. 98(4), pp. 703-738. [18] Diebold, F.X., Lee, J.H. and G.C. Weinbach (1994). Regime Switching with Time Varying Probabilities, in: Hargreaves, C.P., ed., Nonstationary Time Series Analysis and Cointegration, Oxford University Press, Oxford, pp. 283-302. [19] Dixit, A. and R. Pindyck (1994). Investment under Uncertainty. Princeton NJ: Princeton University Press. [20] Energy Information Administration http://www.eia.doe.gov/glossary/index.html. (2008). Glossary: [21] Engel, C. and Hakkio C. (1994). The Distribution of Exchange Rates in the EMS. NBER Working Paper, number 4834. [22] Fattouh, B. (2007). The Drivers of Oil Prices: The Usefulness of Limitations of NonStructural Model, the Demand-Supply Framework and Informal Approaches. Oxford Institute for Energy Studies, WP 32. [23] Filardo A.J. (1994). Business Cycle Phases and their Transitions. Journal of Business and Economic Statistics, Vol. 12, pp. 299-308. [24] Filardo A.J. (1998). Choosing information variables for Transition Probabilities in a Time-Varying Transition Probability Markov-Switching Model. Federal Reserve Bank of Kansas City Working Paper, No. 98-09. [25] Filardo A.J. and Gordon, S.F. (1998). Business Cycle Durations. Journal of Econometrics, Vol. 85, pp. 99-123. [26] Fleming, M.J. (2000). The Benchmark U.S. Treasury Market: Recent Performance and Possible Alternatives. FRBNY Economic Policy Review / April 2000. [27] Frankel, J.A. (2005). Why are Commodity Prices so High? Don’t Forget Low Interest Rates. Financial Times. 4/15/05 [28] Frankel, J.A. (2006). The Eects of Monetary Policy on Real Commodity Prices. NBER Working Paper Number 12713. [29] Friedman, M. (1953). The Case for Flexible Exchange Rates, in Essays in Positive Economics, University of Chicago Press, Chicago, pp. 157-203. [30] Garcia, R. (1998). Asymptotic Null Distribution of the Likelihood Ratio Test in Markov Switching Models. International Economic Review, Vol. 39, pp. 763-788. [31] Group of Thirty (1985). The Foreign Exchange Market in the 1980s, Group of Thirty, New York. [32] Hamilton, J.D. (1989). A New Approach to the Economic Analysis of Nonstationary Time Series and the Business Cycle. Econometrica, 57(2), pp. 357-384. ECB Working Paper Series No 1371 August 2011 25 [33] Hamilton, J.D. (1990). Analysis of Time Series Subject to Changes in Regime. Journal of Econometrics, Vol. 45, pp. 39-70. [34] Hansen, B.E. (1992). The Likelihood Ratio Test under Non-standard Conditions: Testing the Markov-switching Model of GNP, Journal of Applied Econometrics, Vol. 7, S61-S82. [35] Hansen, B.E. (1996). Inference when a Nuisance Parameter is not Identied under the Null Hypothesis. Econometrica, Vol. 64, pp. 413-430. [36] Helbling, T. (2008). Box 5.2: The Current Commodity Price Boom in Perspective. in IMF (2008). World Economic Outlook. http://www.imf.org/external/pubs/ft/weo/2008/01/pdf/text.pdf. [37] Helbling, T., V. Mercer-Blackman, and K. Cheng (2008). Riding a Wave.Finance and Development March. www.imf.org/external/pubs/ft/fandd/2008/03/pdf/helbling.pdf. [38] Hotelling H. (1931). The Economics of Exhaustible Resources, Journal of Political Economy, Vol 39, pp. 137-175. [39] Irwin, S., Leuthold, R. and D. Sanders (1997). Noise Traders, Market Sentiment, and Futures Price Behaviour. University of Illinois working paper. [40] Jeanne, O and Rose, A. (2002). Noise Trading and Exchange Rate Regimes, Quarterly Journal of Economics, Vol. 117(2), pp. 537-569. [41] Kaldor, N. (1939). Speculation and Economic Stability. Review of Economic Studies Vol 7, pp. 1-27. [42] Kaufman, R.K. and Ullman B. (2009). Oil Prices, Speculation and Fundamentals: Interpreting Causal Relations Among Spot and Futures Prices. Energy Economics, Vol. 31, pp. 550-558. [43] Keynes, J.M. (1930). A Treatise of Money, Volume II. London MacMillan. [44] Krugman, P. (2008). More on Oil and Speculation. http://krugman.blogs.nytimes.com/2008/05/13/more-on-oil-and-speculation/ [45] Lombardi, M.J. and Van Robays I. (2011). Do Financial Investors Destabilize the Oil Price?, ECB Working Paper no. 1346, June 2011 [46] Menkho, L, Rebitzky, R.R. and M. Schroder (2009). Heterogeneity in Exchange Rate Expectations: Evidence on the Chartist-Fundamentalist Approach, Journal of Behaviour and Organization 70, pp. 241-252. [47] Newberry, D.M. (1992). Futures Markets: Hedging and Speculation in Newman, P., Milgate, M. and Earwell, J. (eds.), The New Palgrave Dictionary of Money and Finance, Vol. 2.McMillan London, pp. 207-2010. [48] Pindyck, R. S. (1994). Inventories and the Short-Run Dynamics of Commodity Prices. Rand Journal of Economics, Vol. 25(1). [49] Pindyck, R.S. (2001). The Dynamics of Commodity Spot and Futures Markets: A Primer. The Energy Journal Vol. 22(3). 26 ECB Working Paper Series No 1371 August 2011 [50] Reitz, S. and U. Slopek (2008). Nonlinear Oil Price Dynamics — a Tale of Heterogeneous Speculators? Deutsche Bundesbank discussion paper series in economic studies 10/2008. [51] Samuelson, P. (1958). An Exact Consumption-Loan Model of Interest with or without the Social Contrivance of Money. Journal of Political Economy Vol 66, pp. 467-482. [52] Sanders, D., S. Irwin and R. Leuthold (2000). Noise Trader Sentiment in Futures Markets in: B. Goss (ed.) Models of futures markets. Routledge, London: 86- 116. [53] Schaller, H. and Van Norden, S. (1996). Speculative Behaviour, Regime-Switching and Stock Market Crashes, Working Papers 96-13, Bank of Canada. [54] Schiller, R.J. (1984). Stock Prices and Social Dynamics. Brooking Papers on Economic Activity, Vol. 1984(2), pp. 475-510. [55] Shleifer, A. and L. Summers (1990). The Noise Trader Approach to Finance, The Journal of Economic Perspectives, Vol. 4(2), pp. 19-33. [56] Silvapulle, P. and Moosa, L.A. (1999). The Relationship between Spot and Futures Prices: Evidence from the Crude Oil Market. Journal of Futures Markets, Vol. 19(2), pp. 175193. [57] Smidt, S. (1965). Amateur Speculators: A Survey of Trading Strategies, Information Sources and Patterns of Entry and Exit from Commodity Futures Markets by NonProfessional Speculators, Cornell Studies in Policy and Administration, Cornell University. [58] Terl Ellen, S. and R.C.J. Zwinkels (2010). Oil price dynamics: A behavioral nance approach with heterogeneous agents, Energy Economics, Elsevier, Vol. 32(6), pp. 14271434. [59] Working, H. (1948). The theory of the price of storage, American Economic Review, Vol. 39, pp. 1254-1262. [60] Working, H. (1960) Speculation on Hedging Markets, Food Research Institute Studies, Vol. I, No. 2, pp. 185-220. [61] Weiner, R. (2002). Sheep in Wolves Clothing? Speculators and Price Volatility in Petroleum Futures, Quarterly Review of Economics and Finance, Vol. 42, pp. 391-400. [62] Ye. M., Zyren, H. and J. Shore (2002). Forecasting Crude Oil Spot Price Using OECD Petroleum Inventory Levels. St. Mary’s College of Maryland Working Paper. ECB Working Paper Series No 1371 August 2011 27 Wo r k i n g Pa p e r S e r i e s N o 1 1 1 8 / n ov e m b e r 2 0 0 9 Discretionary Fiscal Policies over the Cycle New Evidence based on the ESCB Disaggregated Approach by Luca Agnello and Jacopo Cimadomo


© Copyright 2026