
What is the optimal follicular size before triggering ovulation
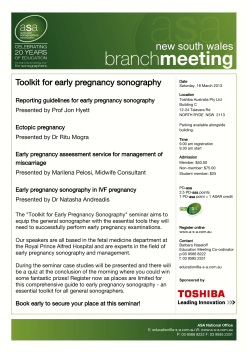
What is the optimal follicular size
before triggering ovulation
in intrauterine insemination cycles
with clomiphene citrate or letrozole?
An analysis of 988 cycles
Anna Palatnik, M.D.,a Estil Strawn, M.D.,a Aniko Szabo, Ph.D.,b and Paul Robb, M.D.a
a
Department of Obstetrics and Gynecology, Froedtert Hospital, Medical College of Wisconsin Affiliated Hospitals; and
Biostatistics, Medical College of Wisconsin, Milwaukee, Wisconsin
b
Division of
Objective: To determine the optimal size of the leading follicle before human chorionic gonadotropin (hCG) administration in cycles with clomiphene
citrate (CC) and letrozole, and to examine any differences in the optimal leading follicle size between cycles with CC and letrozole.
Design: A retrospective study.
Setting: University hospital-based reproductive center.
Patient(s): 1,075 women undergoing intrauterine insemination cycles with CC or letrozole.
Intervention(s): Leading follicle diameters and endometrial thickness were recorded 24 hours before hCG administration, together with other cycles parameters, and were compared between pregnant and nonpregnant patients.
Main Outcome Measure(s): Leading follicle diameter and intrauterine insemination outcome.
Result(s): Eight percent of patients (n ¼ 87) were excluded because their leading follicle was less than 18 mm by days 11 to 13. Pregnancy was recorded
as clinical pregnancy with fetal heart activity seen at 6- to 7-week transvaginal ultrasound. For both CC and letrozole, higher pregnancy rates were
achieved when the leading follicles were in the 23 to 28 mm range. The optimal size of the leading follicle was not statistically significantly different
between cycles using CC or letrozole. However, for each endometrial thickness, the optimal follicular size of the leading follicle was different. Each
additional millimeter of endometrial thickness increased the optimal follicular size by 0.5 mm. Thicker endometrial lining led to a higher probability
of pregnancy.
Conclusion(s): The optimal size of the leading follicle in ovulation induction with CC and letrozole is similar for both drugs and is closely related to the
endometrial thickness. (Fertil SterilÒ 2012;97:1089–94. Ó2012 by American Society for Reproductive Medicine.)
Key Words: Clomiphene citrate, endometrial thickness, intrauterine insemination, leading follicle diameter, letrozole, pregnancy rates
W
hen performing ovulation
induction (OI) cycles combined with intrauterine insemination (IUI), the use of exogenous
human chorionic gonadotropin (hCG)
to trigger ovulation remains a popular
practice. This treatment is especially
valuable for women who cannot reliably detect the spontaneous luteinizing
hormone (LH) surge. The timing of hCG
administration is not well standardized
but usually relies on there being at least
one follicle greater than 18 mm in
mean diameter at ultrasound imaging
(1). This timing is important because
premature administration of hCG acts
like a premature LH surge and may result in follicular atresia (1, 2). Delayed
hCG administration can happen after
ovulation has already occurred, thus
negating any potential benefit.
The first studies to examine follicular sizes to trigger ovulation were in the
1980s and 1990s, and follicular diame-
Received September 28, 2011; revised January 25, 2012; accepted February 14, 2012; published online
March 28, 2012.
A.P. has nothing to disclose. E.S. has nothing to disclose. A.S. received funding from NIH/NCRR. P.R. has
nothing to disclose.
Supported by NIH-CTSI grant for biostatistics work.
Reprint requests: Paul Robb, M.D., Department of Obstetrics and Gynecology, Medical College of Wisconsin Affiliated Hospitals, 9200 W. Wisconsin Ave, Milwaukee, WI 53226 (E-mail: [email protected]).
Fertility and Sterility® Vol. 97, No. 5, May 2012 0015-0282/$36.00
Copyright ©2012 American Society for Reproductive Medicine, Published by Elsevier Inc.
doi:10.1016/j.fertnstert.2012.02.018
VOL. 97 NO. 5 / MAY 2012
ters R16–18 mm were used as the criteria for hCG administration (1–7).
Studies comparing the leading follicle
diameter in natural cycles with CC
cycles found that CC cycles have
significantly larger leading follicles,
measuring between 18 and 30 mm (2–
5, 8). Because of this wide range, many
investigators did not consider this
parameter to be a prognostic indicator
for IUI success (9–11). More recent
studies examining the leading follicle
have included cycles stimulated either
with CC or with gonadotropins (7, 12–
15). They reported different, and at
times contrasting, optimal follicular
diameters to time the triggering of
ovulation; however, in general, cycles
using gonadotropin stimulation used
a smaller follicular diameter to judge
1089
ORIGINAL ARTICLE: ASSISTED REPRODUCTION
hCG administration as compared with CC. In 2003, the
American Society for Reproductive Medicine (ASRM)
published a practice committee report on the use of CC
which said that the average peak diameter in CC cycles
ranges between 19 and 30 mm (with median diameter of 25
mm) (16). That statement was based on one prospective
study from 1996 (3).
During the last decade, the use of aromatase inhibitors for
ovulation induction has rapidly expanded (17). Studies have
shown the efficacy of aromatase inhibitors in ovulation induction in patients who have a poor response to CC (18), in
patients with polycystic ovary syndrome who are resistant
to CC (19), and in patients with unexplained infertility (20).
Regarding the size of the leading follicle, we have found
two studies demonstrating larger leading follicles with letrozole compared with CC (21, 22), and one study showing no
difference between the two (23).
We investigated the optimal size of the leading follicle
before hCG administration in cycles with CC and letrozole.
Secondarily, examined whether there is a difference in the
optimal leading follicle size between cycles with CC and
letrozole.
MATERIALS AND METHODS
Our retrospective analysis included women undergoing ovulation induction followed by IUI at an academic reproductive
medicine center from 2004 to 2009. The study protocol was
approved by the institutional review board at the Medical
College of Wisconsin. The study group included all women
undergoing a first cycle of IUI in our center after treatment
with either CC or letrozole in which a midcycle ultrasound
was performed and ovulation was triggered with hCG. All
patients consented to the use of letrozole as an off-label medication for ovulation induction. Patients whose hCG administration was postponed because of small follicular diameter at
midcycle ultrasound were excluded from the study as they did
not return for a follow-up ultrasound, and patients who were
lost to follow-up observation after the cycles were excluded
as well. Maternal age and total motile sperm count in the insemination sample were also recorded, and the sperm assessment was performed in accordance with the 1999 World
Health Organization criteria (24). Pregnancy was recorded
as an intrauterine pregnancy with fetal heart motion detected
at the 6- to 7-week transvaginal scan.
As is standard in our clinic, all women in their first ovulation induction/IUI cycle underwent transvaginal ultrasound
monitoring between cycle days 11 and 13 after receiving
5 days of treatment with 100 mg of CC daily or 5 mg of letrozole daily starting on days 3 to 5. At the time of the ultrasound, the mean diameter of the follicle was calculated
from measurements in two perpendicular planes for any follicles measuring greater than 14 mm. This was recorded along
with the endometrial thickness in the midsagittal plane. The
transvaginal ultrasounds were performed by one of two of
the coauthors (E.S. or P.R.) with the General Electric Voluson
730 Expert. If at least one follicle R18 mm in mean diameter
was detected, hCG was administered the same morning,
and IUI was scheduled 24 hours later. Sperm samples were
1090
prepared by density gradient centrifugation. Patients were
instructed to obtain a quantitative serum hCG measurement
14 days after the insemination if they did not menstruate. If
the result was positive, the patient was scheduled for a transvaginal ultrasound 6 to 7 weeks after the last menstrual period
to document the pregnancy location and fetal heart activity.
Statistical Analysis
Power analysis. The sample size of 1,047 cycles was chosen
to achieve an 80% power for detecting a statistically significant difference at the 5% level if the pregnancy rate after one
cycle of intrauterine insemination increased from 12% to 26%
when the diameter of the leading follicle increased from 18
mm to 30 mm, and the follicular diameter was normally distributed with mean 24 mm and standard deviation of 3 mm
(chosen because the diameters are expected to be in the
18 to 30 mm range). The power sample was chosen before
the study and was our true estimate, included in the institutional review board protocol. More specifically, the power
of a logistic regression to detect a log-odds ratio of 0.08 per
1 mm increase in follicular diameter (slope ¼ 0.08) was used.
Statistical tests. Univariate comparisons were performed using Pearson's chi-square test for categorical data and the
Wilcoxon-Mann-Whitney test for continuous measures.
Multivariate analysis was performed using logistic regression
for the probability of pregnancy. The considered predictors
were age, cycle type, postprocessing total motile sperm count,
leading follicle size, the size of the second leading follicle,
thickness of the endometrial lining, and primary diagnosis.
Linearity of continuous covariates was evaluated first using
fourth-degree orthogonal polynomials, and only leading follicle size was found to have a statistically significant nonlinear effect. All interactions with leading follicle size—the
variable of primary interest—were tested, and those that
were statistically significant at the 10% level (interaction
with cycle type and endometrial lining thickness) were retained for the final model. Backward selection guided by minimizing the Akaike information criterion (AIC) (25) was used
to determine the degree of the polynomial describing the effect of leading follicle size; a second-degree relationship
was found to be adequate by providing the lowest AIC value.
We collected the information only from each woman's first
cycle that was conducted in our clinic; to avoid potential selection bias, repeated cycles of the same patient were not recorded. All analyses determining the probability of pregnancy
for each cycle type were adjusted for the following covariates:
age, total motile sperm count, and difference in primary diagnosis distribution.
RESULTS
During the specified time period 1,075 women were identified
to be qualified for the study. After removing 87 women whose
hCG was not administered on the same day as the ultrasound,
988 women remained in the study. Of these patients, 777
received CC and 211 received letrozole for ovulation
stimulation.
VOL. 97 NO. 5 / MAY 2012
Fertility and Sterility®
Descriptive summaries of all the CC and letrozole group
variables can be seen in Table 1. The group who was treated
with letrozole was found to be slightly younger and had a different primary diagnosis distribution, with a higher percentage (53%) having anovulation and lower percentage (31%)
with unexplained infertility. In the CC group, 56% of the patients had a primary diagnosis of unexplained infertility, and
only 16% were anovulatory. The overall mean diameter of the
leading follicle was 23 mm in the group treated with CC and
22 mm in the group treated with letrozole (see Table 1). There
was a difference in pregnancy outcomes between the two
groups. Higher pregnancy rates were achieved with letrozole
in comparison with CC in the univariate analysis (P¼ .024)
(see Table 1). Cycles of ovulation induction with letrozole
had a 23% pregnancy rate, whereas cycles with CC had
a 16% pregnancy rate. These results were before controlling
for other covariates in multivariate analysis.
In our univariate analysis, age, cycle type, leading follicle
size, thickness of endometrial lining, and primary diagnosis
were statistically significantly associated with achieving
pregnancy (Supplemental Table 1, available online). The average thickness of the endometrial lining in our study at the
time of hCG administration was 8.5 mm for CC cycles and
8.7 mm for letrozole cycles (Table 1).
A multivariate analysis was then performed using logistic
regression for the probability of pregnancy as described in the
‘‘Materials and Methods’’ section. In this analysis, we found
that increasing age decreased the probability of pregnancy,
and the size of the second leading follicles and postprocessing
total motile sperm count were not predictive (Supplemental
Table 2, available online). The largest group, unexplained diagnosis, was used as a reference for comparison with primary
diagnosis; only the diagnosis of anovulation showed a statistically significant increase in the probability of pregnancy
compared with an unexplained cause.
The relationship between the leading follicle size and the
probability of pregnancy was found to be closely related to
the endometrial thickness and the drug type, and is best understood from Figure 1 and Table 2 (1, 5). All the following
analyses are adjusted for age, total motile sperm count,
diagnosis, and cycle type as described in the method
section. Figure 1 shows that the size of the optimal leading
follicle was not statistically significantly different for cycles
with CC and letrozole (P¼ .44).
For both drugs, the leading follicle size exhibited a nonlinear effect: an optimal follicular size maximized the probability of pregnancy, with lower rates for both larger and smaller
sizes. We found that there was no one single size of the leading follicle that will go with any cycle; rather, the data we collected showed that the optimal follicular diameter is different
for each endometrial thickness (Fig. 1, Table 3). We estimated
that each additional millimeter of endometrial thickness is associated with an increase in the optimal follicular size by 0.5
mm (Table 2). For an endometrial lining of 9 mm, which was
the mean thickness in our study, the optimal follicular size
was 24 mm with CC and 24.7 mm with letrozole. Table 3
shows that at the optimal follicle size a thicker endometrium
leads to higher probability of pregnancy for the given drug
cycle (odds ratio [OR] 1.14; 95% confidence interval [CI],
1.05–1.25). This effect is depicted in Figure 1.
In addition, at the optimal follicle size the cycles with letrozole had statistically significantly higher pregnancy rates,
after adjusting for other covariates (OR 1.8; 95% CI, 1.07–3.0;
P¼ .03) (Supplemental Figure1). However, moving away from
the optimum statistically significantly dropped the pregnancy
rates more in the letrozole group compared with the CC group.
DISCUSSION
In this study, we examined the optimal follicular size before
hCG administration to yield the highest pregnancy rates in
IUI cycles stimulated using CC or letrozole. Predictors of IUI
cycle success in achieving pregnancy have been examined
by several studies (8–11). Factors that were considered to be
TABLE 1
Descriptive statistics of the study population by cycle type.
Pregnancy
Age
Postprocessing TMSC (millions)
Leading follicle (mm)
Second follicle present
Endometrial lining (mm)
Primary diagnosis
Unexplained
Anovulation
Male factor
Endometriosis
Tubal factor
Advanced maternal age
PCOS
Recurrent miscarriages
N
CC (n [ 777)
Letrozole (n [ 211)
Combined (N [ 988)
P value
988
988
985
988
988
988
988
16% (125)
31/34/37c
12.0/28.0/59.0c
20/23/26c
87% (675)
7.4/8.5/10.0c
23% (48)
29/32/36c
17.0/38.5/79.8c
19/22/24c
64% (135)
7.6/8.7/10.1c
18% (173)
30/34/37c
13.0/30.0/64.0c
20/23/25c
82% (810)
7.5/8.6/10.1c
.024a
< .001b
< .001b
< .001b
< .001b
.325b
< .001a
56% (432)
14% (111)
9% (71)
6% (47)
6% (45)
5% (40)
2% (16)
2% (15)
31% (65)
50% (105)
9% (18)
5% (10)
2% (4)
1% (3)
3% (6)
0 (0)
50% (497)
22% (216)
9% (89)
6% (57)
5% (49)
4% (43)
2% (22)
2% (15)
Note: N is the number of non-missing values, and the numbers after percentages are frequencies. CC ¼ clomiphene citrate; PCOS ¼ polycystic ovary syndrome; TMSC ¼ total motile sperm count.
a
Wilcoxon test.
b
Pearson's chi-square test.
c
The lower quartile/median/upper quartile for continuous variables.
Palatnik. Optimal follicular size before hCG. Fertil Steril 2012.
VOL. 97 NO. 5 / MAY 2012
1091
ORIGINAL ARTICLE: ASSISTED REPRODUCTION
Lining <= 7mm
Lining 8 − 9mm
Lining 10 − 11mm
Lining >= 12mm
0.7
0.6
0.5
0.4
observed
with 95% CI
fitted
0.3
0.2
<21
21−22
23−24
25−26
27−28
>28
<21
21−22
23−24
25−26
27−28
>28
<21
21−22
23−24
25−26
27−28
>28
0.1
<21
21−22
23−24
25−26
27−28
>28
Probability of pregnancy
FIGURE 1
Follicle size, mm
The probability of pregnancy by the size of the leading follicle and the endometrial lining thickness. Points represent observed proportions with 95%
binomial confidence intervals; lines connect the average model-based predicted values for each patient in the given follicle size/endometrial
thickness group, thus it is adjusted for the observed age, cycle type, and diagnostic group distribution.
Palatnik. Optimal follicular size before hCG. Fertil Steril 2012.
prognostic were the age of the patient, primary infertility
diagnosis, duration of the infertility, sperm motility,
number of mature follicles, and estrogen level on the day of
hCG administration. In our study, the important factors for
clinical pregnancy after IUI were found to be maternal age,
primary infertility diagnosis, endometrial thickness, the size
of the leading follicle, and the drug type. Sperm motility
and the presence of other mature follicles were not found to
be statistically significantly correlated with pregnancy. One
possible explanation for the sperm motility not being
a predictive factor of the cycle outcome may be because the
majority of men in our couples had total motile sperm
count values above the threshold.
Several studies examined the predictive value of the
leading follicle size in determining the success of IUI cycles
(12–15). Silverberg et al. (12) analyzed IUI cycles after
ovulation induction with human menopausal gonadotropins
and found that ovulation success was higher in follicles larger
than 20 mm on the day of hCG administration, although
there was no relationship between the size of the leading
follicle and cycle outcome. There was no difference in that
study in the incidence of conception between cycles when
the leading follicle was larger or smaller than 16 mm (12).
Ghosh et al. (13) examined cycles with CC and
gonadotropins and found that cycles in which the leading
follicle was R20 mm were less likely to achieve pregnancy
compared with those for which the leading follicles had
diameters between 15 and 19.99 mm. The inverse association
between follicular diameter and pregnancy was explained
by nondifferential misclassification bias (intraobserver,
interobserver, machine settings, and measurement of
collapsed follicles after they have ovulated). Iberico et al. (14)
found higher pregnancy rates when the leading follicle was
larger than 20 mm, but this finding was not statistically
significant. A recent study by Farhi et al. (15) showed that
pregnancy rates are higher when the leading follicle was
between 18 and 22 mm, and that they dropped for both
smaller and larger diameters.
TABLE 2
Parameters of the parabolic relationship between leading follicle size, endometrial thickness, and probability of pregnancy, adjusted for age and
primary diagnosis.
Parameter
OR for pregnancy rates at optimal follicle size
Thicker endometrial lining (mm)
Letrozole vs. CC
OR for pregnancy rates 2 mm away from the optimal follicle size
Increase in 1 mm in endometrial lining
Letrozole vs. CC
Optimal diameter (mm)
Value when endometrial lining ¼ 9 mm, CC
Increase of 1 mm in endometrial lining
Letrozole vs. CC
Value when endometrial lining ¼ 9 mm, letrozole
Estimate
95% CI
P value
1.14
1.8
1.05–1.24
1.05–2.9
.002
.03
0.99
0.90
0.98–0.99
0.83–0.99
.005
.030
22.4–25.5 mm
0.2–0.9 mm
1.1–2.7 mm
23.5–25.9 mm
.003
.44
24 mm
þ0.5 mm
þ0.8 mm
24.7 mm
Note: CC ¼ clomiphene citrate; CI ¼ confidence interval; OR ¼ odds ratio.
Palatnik. Optimal follicular size before hCG. Fertil Steril 2012.
1092
VOL. 97 NO. 5 / MAY 2012
Fertility and Sterility®
TABLE 3
Observed pregnancy rates by endometrial lining thickness and size of leading follicle.
Leading follicle size
Lining
%7 mm
8–9 mm
10–11 mm
R12 mm
Total
£20 mm
21–22 mm
23–24 mm
25–26 mm
27–28 mm
R29 mm
n
%
n
%
n
%
n
%
n
%
n
%
n
%
58
136
67
27
288
10
14
9
7
11
34
84
47
34
199
15
14
21
21
17
24
96
55
22
197
21
24
27
41
26
19
53
47
21
140
16
9
30
19
19
13
45
17
15
90
8
16
18
47
20
13
24
20
17
74
8
8
10
29
14
161
438
253
136
988
13
16
20
25
18
Total
Palatnik. Optimal follicular size before hCG. Fertil Steril 2012.
In our study, we found that there is an optimal size for the
leading follicle that maximizes the probability of pregnancy,
with lower rates for both smaller and larger leading follicles.
This optimal size is influenced by the endometrial thickness.
For both drugs, higher pregnancy rates were achieved with
the leading follicle being in the range of 23 to 28 mm
(Table 3). Within that range, pregnancy rates were higher
when the larger follicles were accompanied by a thicker endometrium and vice versa (see Table 3). These findings can be
seen as a similar response of the endometrium and the follicles
to the ovulation-induction agent, letrozole or CC: an appropriate response affected both the follicles and the endometrium in the same way. Possibly, this reflects coordination
between follicular growth and the endometrial lining. Larger
follicles would be expected to produce higher levels of estradiol that would then stimulate the endometrial lining more,
and smaller follicles would produce lower levels of estradiol
and thus produce a thinner lining. When this coordination
is disrupted, lower pregnancy levels are the result.
The size of the leading follicle that resulted in a pregnancy
was not statistically significantly different in cycles with CC
and letrozole. However, it appears that cycles stimulated
with CC had a wider range of follicle sizes, which resulted
in similar rates of pregnancy as compared with letrozole
(Fig. 1).
The role of endometrial thickness in the success of IUI
cycles is a matter of debate, with some studies supporting
the benefit of thicker endometrium and others dismissing its
importance (26–29). In our study, endometrial thickness was
not found to be statistically significantly different among
the cycles with CC and letrozole. In addition, endometrial
lining was found to be a predictive factor of achieving
pregnancy, and thicker endometrial lining resulted in higher
pregnancy rates when the leading follicle size was close to
the optimum (P¼ .002).
We did find that higher pregnancy rates were achieved
with letrozole (23%) in comparison with CC (16%) (P¼ .024).
However, in a univariate analysis, these groups were not
directly comparable, so these findings might be biased. The
letrozole group was slightly younger (averaging 32 years
old vs. 34 years old for CC) and included more women with
anovulation as their primary infertility diagnosis, whereas
more than half the women in the CC group had a diagnosis
of unexplained infertility. In addition, as was shown in
Figure 1, moving away from the optimum size dropped
VOL. 97 NO. 5 / MAY 2012
pregnancy rates more in the letrozole than the CC cycles.
Therefore, although letrozole had higher pregnancy rates at
the optimal follicle size because the deviation from the optimal size had a higher effect for letrozole cycles, this effect disappeared and even potentially reversed for leading follicle
sizes that were 3 mm or more away from the optimum.
Among the weaknesses of our was our short-term followup observation. We evaluated the patients only until their
clinical pregnancy was documented via a 6- to 7-week ultrasound and did not document delivery rates. In addition, we
did not perform serial ultrasounds during the cycles, and we
based the definition of the dominant follicle on one midcycle
scan. On the other hand, these procedures are similar to the IUI
surveillance protocol in our hospital as well as in many other
reproductive clinics. We had 87 patients who, on the day of
the midcycle ultrasound, had a leading follicle size smaller
than 18 mm; their hCG administration was postponed. These
patients were excluded from our analysis because they did not
return for a follow-up ultrasound, so we cannot make any
conclusions regarding pregnancy rates among the patients
with a smaller size follicle on cycle days 11 to 13 who were
not ready to be triggered on those days.
Our study has shown that the optimal size of the leading
follicle in ovulation induction with CC and letrozole is similar
for both drugs and is closely related to the endometrial thickness of the cycle. Keeping that relationship in mind can
help in planning the IUI cycle and in timing the hCG
administration.
REFERENCES
1.
2.
3.
4.
5.
O'Herlihy C, Pepperell RJ, Robinson HP. Ultrasound timing of human chorionic gonadotropin administration in clomiphene-stimulated cycle. Obstet
Gynecol 1982;59:40–5.
Speroff L, Fritz MA. Clinical gynecologic endocrinology and infertility. 7th
ed. Philadelphia: Lippincott Williams & Wilkins; 2005.
Opsahl MS, Robins ED, O'Connor DM, Scott RT, Fritz MA. Characteristics of
gonadotropin response, follicular development, and endometrial growth
and maturation across consecutive cycles of clomiphene citrate treatment.
Fertil Steril 1996;66:533–9.
Martinez AR, Bernardus RE, Kucharska D, Schoemaker J. Urinary luteinizing
hormone testing and prediction of ovulation in spontaneous, clomiphene
citrate and human menopausal gonadotropin-stimulated cycles: a clinical
evaluation. Acta Endocrinol 1991;124:357–63.
Randall JM, Templeton A. Transvaginal sonographic assessment of follicular
and endometrial growth in spontaneous and clomiphene citrate cycles. Fertil
Steril 1991;56:208–12.
1093
ORIGINAL ARTICLE: ASSISTED REPRODUCTION
€ T, Chari S, Sturm G, et al. SimNilsson L, Wikland M, Hamberger L, Hillensjo
plification of the method of in vitro fertilization: sonographic measurements
of follicular diameter as the sole index of follicular maturity. J In Vitro Fert
Embryo Trans 1985;2:17–22.
7. Plosker SM, Jacobson W, Amato P. Predicting and optimizing success in an
intra-uterine insemination programme. Hum Reprod 1994;9:2014–21.
8. Haritha S, Rajagopalan G. Follicular growth, endometrial thickness, and serum estradiol levels in spontaneous and clomiphene citrate-induced cycles.
Int J Gynaecol Obstet 2003;81:287–92.
9. Tomlison MJ, Amissah-Arthur JB, Thompson KA, Kasraie JL, Bentick B. Prognostic indicators for intrauterine insemination (IUI): statistical model for IUI
success. Hum Reprod 1996;11:1892–6.
10. Messinis IE, Templeton A. Urinary estrogen levels and follicle ultrasound
measurements in clomiphene induced cycles with an endogenous luteinizing hormone surge. Br J Obstet Gynaecol 1986;9:43–9.
11. Merviel PM, Heraud MH, Grenier N, Lourdel E, Saguinet P, Copin H. Predictive factors for pregnancy after intrauterine insemination (IUI): an analysis of
1038 cycles and a review of the literature. Fertil Steril 2010;93:79–88.
12. Silverberg KM, Olive DL, Burns WN, Johnson JV, Groff TR, Schenken RS. Follicular size at the time of human chorionic gonadotropin administration predicts ovulation outcome in human menopausal gonadotropin-stimulated
cycles. Fertil Steril 1991;56:296–300.
13. Ghosh C, Buck G, Priore R, Wacktawski-Wende J, Severino M. Follicular response and pregnancy among infertile women undergoing ovulation induction and intrauterine insemination. Fertil Steril 2003;80:328–35.
14. Iberico G, Viogue J, Ariza N, Lozano JM, Roca M, Llacer J, et al. Analysis of
factors influencing pregnancy rates in homologous intrauterine insemination. Fertil Steril 2004;81:1308–13.
15. Farhi J, Orvieto R, Gavish O, Homburg R. The association between follicular
size on human chorionic gonadotropin day and pregnancy rate in clomiphene citrate treated polycystic ovary syndrome patients. Gynecol Endocrinol 2010;26:546–8.
16. American Society for Reproductive Medicine, Practice Committee of the
American Society for Reproductive Medicine. Use of clomiphene citrate in
women. Fertil Steril 2003;5:1302–8.
17. Requena A, Herrero J, Landeras J, Navarro E, Neyro JL, Salvador C, et al. Use
of letrozole in assisted reproduction: a systematic review and meta-analysis.
Hum Reprod Update 2008;14:571–82.
6.
1094
18.
19.
20.
21.
22.
23.
24.
25.
26.
27.
28.
29.
Mitwally MF, Casper RF. Use of an aromatase inhibitor for induction of ovulation in patients with an inadequate response to clomiphene citrate. Fertil
Steril 2001;75:305–9.
Abu Hashim H, Shokeir T, Badawy A. Letrozole versus combined metformin
and clomiphene citrate for ovulation induction in clomiphene-resistant
women with polycystic ovary syndrome: a randomized controlled trial. Fertil
Steril 2010;94:1405–9.
Badawy A, Shokeir T, Allam AF, Abdelhady H. Pregnancy outcome after ovulation induction with aromatase inhibitors or clomiphene citrate in unexplained infertility. Acta Obstet Gynecol Scand 2009;88:187–91.
Begum MR, Ferdous J, Begum A, Quadir E. Comparison of efficacy of aromatase inhibitor and clomiphene citrate in induction of ovulation in polycystic
ovarian syndrome. Fertil Steril 2009;92:853–7.
Samani FG, Farzadi L, Nezami N, Tarzamni MK, Soleimani F. Endometrial and
follicular development following letrozole intervention in unexplained infertile patients failed to get pregnant with clomiphene citrate. Arch Gynecol
Obstet 2009;280:201–5.
Zeinalzadeh M, Basirat Z, Esmailpour M. Efficacy of letrozole in ovulation induction compared to that of clomiphene citrate in patients with polycystic
ovarian syndrome. J Reprod Med 2010;55:36–40.
World Health Organisation. Laboratory manual for the examination of human semen and semen-cervical mucus interaction. 4th ed. Cambridge:
Cambridge University Press; 1999.
Burnham KP, Anderson DR. Model selection and multi-model inference:
a practical information-theoretic approach. 2nd ed. London: Springer;
2010.
Noyes N, Liu HC, Sultan KS, Schattemen G, Rozenwaks Z. Endometrial thickness appears to be a significant factor in embryo implantation in vitro fertilization. Hum Reprod 1995;10:919–22.
Kovacs P, Boda K, Kaali SG. The effect of endometrial thickness on IVF/ICSI
outcome. Hum Reprod 2003;18:2337–41.
De Geyter C, De Geyter M, Nieschlag E, Holzgreve W, Schneider HP. Prospective evaluation of the ultrasound appearance of the endometrium in
a cohort of 1186 infertile women. Fertil Steril 2000;73:106–13.
Kolibianas EM, Zikopoulus KA, Fatemi HM, Osmanagaoglu K, Evenpoel J,
Van Steirteghem A, et al. Endometrial thickness cannot predict ongoing
pregnancy achievement in cycles stimulated with clomiphene citrate for intrauterine insemination. Reprod Biomed Online 2004;8:115–8.
VOL. 97 NO. 5 / MAY 2012
Fertility and Sterility®
Estimated probability of pregnancy
SUPPLEMENTAL FIGURE 1
Clomid
Letrozole
Endometrial
thickness
0.3
7 mm
0.2
8 mm
9 mm
0.1
10 mm
0.0
20
25
30
20
25
30
Leading follicle size, mm
The estimated effect of the leading follicle size on the probability of pregnancy depending on endometrial thickness and cycle type. The figure is
adjusted for other covariates via logistic regression. Reference levels (mean for continuous and mode for discrete variables): age ¼ 34 years; primary
diagnosis ¼ unexplained.
Palatnik. Optimal follicular size before hCG. Fertil Steril 2012.
VOL. 97 NO. 5 / MAY 2012
1094.e1
ORIGINAL ARTICLE: ASSISTED REPRODUCTION
SUPPLEMENTAL TABLE 1
Summary of predictors by pregnancy status: all patients.
N
Age
Cycle type: letrozole
Postprocessing TMSC
Leading follicle (mm)
Second follicle present
Endometrial lining (mm)
Primary diagnosis
Unexplained
Anovulation
Male factor
Endometriosis
Tubal factor
Advanced maternal age
PCOS
Recurrent miscarriages
988
221
988
988
988
988
Pregnant (n [ 173)
a
Not pregnant (n [ 815)
a
30.0/32/36.0
28% (48)
16/35/62a
21/23/25a
81% (140)
7.9/9/10.7a
30.5/34/37
20% (163)
13/29/64.2a
20/22/25a
82% (670)
7.4/8.5/10.0a
45% (77)
29% (50)
9% (15)
3% (6)
6% (10)
2% (4)
3% (5)
3% (6)
52% (420)
20% (166)
9% (74)
6% (51)
5% (39)
5% (39)
2% (17)
1% (9)
P value
.005b
.024c
.197b
.015b
.69c
.001
.013c
Note: N is the number of non-missing values, and the numbers after percentages are frequencies. CC ¼ clomiphene citrate; PCOS ¼ polycystic ovary syndrome; TMSC ¼ total motile sperm count.
a
The lower quartile/median/upper quartile for continuous variables.
b
Wilcoxon test.
c
Pearson's chi-square test.
Palatnik. Optimal follicular size before hCG. Fertil Steril 2012.
1094.e2
VOL. 97 NO. 5 / MAY 2012
Fertility and Sterility®
SUPPLEMENTAL TABLE 2
Effect of predictors on the probability of pregnancy in a multivariate logistic analysis adjusted for the effects of endometrial thickness and leading
follicle size via a quadratic polynomial.
Predictor
OR
95% CI
P value
Age
Second leading follicle (mm)
Postprocessing TMSC (log10-transformed)
Primary diagnosis
Anovulation vs. unexplained
Male factor vs. unexplained
Endometriosis vs. unexplained
Tubal factor vs. unexplained
Advanced maternal age vs. unexplained
PCOS vs. unexplained
Recurrent miscarriages vs. unexplained
0.94
1.01
1.23
0.90–0.99
0.98–1.04
0.83–1.83
.012
.32
.22
1.63
1.26
0.48
1.89
0.77
1.43
3.10
1.04–2.55
0.69–2.31
0.18–1.27
0.91–3.93
0.25–2.43
0.48–4.28
1.00–9.57
.035
.45
.14
.086
.66
.52
.049
Note: CI ¼ confidence interval; OR ¼ odds ratio; PCOS ¼ polycystic ovary syndrome; TMSC ¼ total motile sperm count.
Palatnik. Optimal follicular size before hCG. Fertil Steril 2012.
VOL. 97 NO. 5 / MAY 2012
1094.e3


© Copyright 2026