
Money or Ideas? A Field Experiment on Xavier Giné, World Bank
Money or Ideas? A Field Experiment on
Constraints to Entrepreneurship in Rural Pakistan ∗
Xavier Giné, World Bank
Ghazala Mansuri, World Bank
September 2011
Abstract
This paper identifies the importance of access to human capital and credit for entrepreneurship. We conduct
a field experiment in rural Pakistan where a subset of male and female microfinance clients were offered 8
full time days of business training and the opportunity to participate in a lottery to access business loans of
up to 100,000 Rs (USD 1,700), about seven times the average loan size. We find that offering business
training leads to increased business knowledge, better business practices and improvements in several
household and member outcomes. These effects are mainly concentrated among male clients, however.
Among men, business training also leads to lower attrition among baseline businesses and better financial
decisions. Women improve business knowledge but show no improvements in other outcomes. Access to
the larger loan, in contrast, has little effect, indicating perhaps that existing loan size limits already meet the
demand for credit for these clients.
Keywords: Microfinance; Credit Constraints; Entrepreneurship
JEL codes: C93, G21, D12, D13, D21, D24, J24, O12.
Giné: Development Research Group, The World Bank (e-mail:[email protected]). Mansuri: Poverty
Reduction and Economic Management, The World Bank (e-mail: [email protected]). We are
especially grateful to the following individuals for their help and support in implementing the experiment:
Shahnaz Kapadia, at ECI Islamabad, for her help with designing the business training; Irfan Ahmad at
RCONs, Lahore, for managing the data collection; Dr Rashid Bajwa, Agha Javad, Tahir Waqar and the
team of field assistants at NRSP for implementing the intervention; Kevin Crockford and Imtiaz Alvi at the
World Bank Office in Islamabad and Qazi Azmat Isa, Kamran Akbar, Ahmed Jamal and Kamal Hyat at the
Pakistan Poverty Alleviation Program (PPAF) in Islamabad for their support and encouragement. This
project was jointly funded by the Development Research Group and the PPAF. Alberto Fuertes, Santhosh
Srinivasan and Mario Picón provided outstanding research assistance. The views expressed herein are those
of the authors and should not be attributed to the World Bank, its executive directors, or the countries they
represent.
1. Introduction
It has long been recognized that entrepreneurship plays a central role in the
process of economic growth and development (Knight, 1921; Schumpeter, 1942). In his
seminal paper on total factor productivity, Solow (1957) found that only a modest
increase in output per worker from 1909 to 1949 in the US was driven by increases in
capital use. The rest was attributable to technical change, referring to either technical
innovation or the way production is organized, both requiring entrepreneurial talent
(Baumol, 1968).
While it is hard to deny that some countries have grown dramatically while others
have remained stagnant, it is hard to believe that poor countries systematically lack
entrepreneurial talent. So what are the main barriers to entrepreneurship in a poor
country?
One candidate is access to finance. There is a large empirical and theoretical
literature that emphasizes distortions in the capital market as critical for business creation
and survival (Blanchflower and Oswald, 1984; Holtz-Eakin, Joulfaian and Rosen, 1994a
and 1994b and more recently Paulson, Townsend and Karaivanov, 2006; de Mel,
McKenzie and Woodruff, 2008 and Banerjee et al. 2010). 1 Mohammed Yunus, founder
of Grameen Bank also sides with this view by stating that “giving the poor access to
credit allows them to immediately put into practice the skills they already know”. 2
A more recent view suggests that business skills, or managerial capital more
generally is missing in poor countries (Bloom and Van Reenen, 2010; Bruhn, Karlan and
Schoar, 2010 and Schoar, 2010). This view builds on the occupational choice models of
Lucas (1978) and others with the implicit assumption that managerial capital can actually
be taught. 3
This paper reports on a field experiment that offered microfinance clients in rural
Pakistan an eight day business training course and access to a loan lottery where eligible
clients could borrow up to 7 times the average loan size. We randomly offered the
1
See Banerjee and Newman, 1993; King and Levine, 1993; Giné and Townsend; 2004 or Buera, Kaboski
and Shin, forthcoming, for examples of macro models of entrepreneurship with financial imperfections.
2
Quote from Yunus, M “Banker to the Poor”, 1999.
3
Yet another view is that regulations in the labor market create important distortions (Hsieh and Klenow,
2009, Schoar, 2010).
1
training to half of 747 groups of borrowers from 5 different branches in three districts.
Training sessions were held from February to May 2007 and focused on business
planning, marketing and financial management. From November 2007 to June 2008 a
lottery was introduced that allowed eligible members to apply for a loan of up to Rs
100,000 (1,667 USD at the time of the baseline). Loan requests were subject to the usual
screening and amounts approved above the usual limit of Rs 30,000 (500 USD) were
forwarded to headquarters, where the result of the lottery was maintained. Lottery
winners could borrow the approved amount, while those who lost the lottery could
borrow up to their maximum loan size which depended on the number of loans they had
previously repaid successfully.
If proponents of the credit constraints view are correct, then business training
should have no effect on business and household outcomes whereas access to a larger
loan would, insofar as clients are constrained by the existing loan size.
We find that offering business training leads to increased business knowledge,
better business practices (but not business sales) and increases in household expenditures,
group cohesion and general outlook on life. These effects are mainly concentrated among
male clients, however. Among men, business training also leads to lower business failure,
but this may not be a desirable outcome if ex-business owners switched to more
profitable occupations. We show that this is not the case because failed businesses in the
control group appear to be among the worse, indicating possible gains in sales and profits
once we correct for differences in the composition of businesses due to the differential
failure rate.
Another reason for the increase in household income but not business sales or
profits is that there may be households without businesses who also benefit from business
training, particularly those engaged in self-employment activities. Alternatively, there
may be households for whom the share of income from the businesses is relatively small.
The gains from business training should therefore be concentrated among self-employed
households, which is precisely what we find.
Unlike men, women increase business knowledge but show no improvements in
any other outcomes, particularly income and assets, and business practices and
operations. While there are substantial differences between male and female CO member
2
characteristics, perhaps due to the different process by which women select to become a
CO member and into self-employment, the inclusion of additional controls and their
interactions with treatment dummies does not qualitatively affect the estimates.
One plausible explanation for these gender differences is rooted in the norms
about the role of women as caregivers and other social norms that limit their labor supply.
In our data, while most men are active in the labor force, 71 percent of females report
staying at home without a primary occupation. If women are excluded from the labor
market, then the prediction of an occupational choice model (for example Lucas, 1978 or
more recently Emran, Morshed and Stiglitz, 2007) is that businesses run by women
should be of lower quality because the marginal female entrepreneur will be indifferent
between running a business and earning a low wage. In addition, the same social and
cultural norms that restrict female labor supply also affect their mobility outside the
home. This explains why women are primarily engaged in home based manufacture. But
even if female labor supply is limited, the intervention could have improved the
performance of their businesses if they were inefficiently run. After all, better decisions
about production and marketing, etc may not require additional time. However, 40
percent of business women report that their (male) spouses are responsible for most of
their business decisions, suggesting that female businesses show no improvement
because women have little decision-making control. Indeed, business creation increases
in households of women offered business training and assigned to be winners of the
lottery, but the woman is not directly involved in the new business suggesting that their
spouses or other household members use the proceeds of the loan to start the business.
Business training also increased the number of larger loans issued, but being
assigned a winner of the lottery has on average little effect on the clients, perhaps because
the limit on the current loan size already meets the demands of most borrowers. Among
male borrowers, lottery winners tend to borrow larger amounts, perhaps not surprisingly.
Since we find neither an increase in default nor an increase in the workload of credit
officers handling larger loans, we conclude that these larger loans are profitable for the
lender. Interestingly, we also find that business training improved the selection of
borrowers. In particular, men offered business training with an ex-ante probability of
3
default in the loan were less likely to borrow during and after the lottery. This result is
remarkable because it suggests that training led to better financial decision-making.
Finally, because both treatments may raise the productivity of household labor, it
is important that we study children schooling outcomes. On the one hand, since schooling
is a normal good, higher incomes should translate into better schooling outcomes (income
effect). On the other, higher household productivity raises the opportunity cost of the
children’s time (price effect), so the net effect is ambiguous. We find that children,
especially boys, in households of a male CO member assigned to be a winner of the
lottery about 9 percent more likely to be absent during the last school day, suggesting that
the price effect dominates.
Taken together, the results above contribute to the literature that highlights the
importance of heterogeneity in the impacts of relaxing credit constraints and enhancing
business skills (de Mel, McKenzie and Woodruff, 2009; Karlan and Valdivia, 2010;
Drexler, Fischer and Schoar, 2010 and Berge, Bjorvatn and Tungodden, 2010).
Our paper is perhaps closer to Berge, Bjorvatn and Tungodden, 2010 in that both
combine business training with access to capital but we use loans rather than grants on a
larger number of clients. Unlike the rest of papers, we use rich administrative and survey
data that allow us to focus on a wide range of business, household and individual
outcomes.
The remainder of the paper is structured as follows. Section 2 describes the
context in Pakistan and the experiment. Section 3 discusses the data and Section 4
describes the empirical strategy and the results of the experiment. Section 5 concludes.
2. Context and Experiment Design
The experiment was carried out in collaboration with the Pakistan Poverty
Alleviation Fund (PPAF), the National Rural Support Program (NRSP), and the World
Bank. ECI, a local firm that specializes in capacity building activities for micro
entrepreneurs, designed the business training modules, trained NRSP staff and was a key
partner during all phases of field implementation. Baseline and follow up data were
collected by Research Consultants (RCons).
4
PPAF is an apex institution created in 2000 with World Bank funding that
provides capacity building and funding to numerous partner microfinance institutions and
NGOs. More than half of its funds, however, go to the Rural Support Programs of which
NRSP is by far the largest. 4 PPAF funding has allowed NRSP to grow rapidly over the
past decade. It is now present in 51 districts and is considered the second largest
microcredit provider in Pakistan.
NRSP provides uncollateralized microloans to individual clients who are required
to become members of a community organization (CO). Members of a CO meet regularly
and contribute towards individual and group savings. Meetings are also used to make
loan payments. Besides credit, NRSP offers training in vocational skills and provides up
to 80 percent financing for infrastructure projects in the village. Due to budget
constraints, only 8.2 percent of the members in our sample had received training prior to
the baseline. COs typically have between 5 and 30 members. NRSP records indicate that
over the past decade, it has organized more than a million poor households into a network
of more than 100,000 COs across the country. In principle, all loans have a joint liability
clause at the CO level, but it is seldom enforced. In practice, new loans are often issued to
members who belong to a CO with overdue loans. 5
NRSP has three main credit products: a single installment loan for agricultural
inputs (fertilizer, seeds, etc) with maturity of 6 to 12 months; an enterprise, and a
livestock loan of 12 monthly installments each. At the time of the baseline, 32 percent of
the loans disbursed were enterprise loans, 46 percent were livestock loans and the
remainder were agricultural inputs loans. The maximum amount that can be borrowed
depends on the number of loans successfully repaid. A new borrower starts with a loan
limit of Rs 10,000 (USD 167) which can increase in intervals of up to Rs 5,000 per loan
cycle until a maximum of Rs. 30,000 (USD 500). 6 As a point of comparison, a cow costs
around Rs 60,000 at the time of the baseline.
4
Established in 1991, NRSP is modeled after the Aga Khan Rural Support Program, established in the
early 1980s as a not-for-profit rural development organization. NRSP, along with Khushali Bank and Kashf
Foundation, accounts for approximately 70 percent of the sector’s active clients according to MicroWatch,
2008. In 2010, NRSP also obtained a microfinance bank license.
5
Borrowers are required to find two guarantors, who can be members of the same CO. NRSP appears to
use guarantors as a means of exerting peer pressure, rather than enforcing repayment from them.
6
The exchange rate at the time of the baseline (November 2006) was roughly 60 Rs / USD.
5
The experiment was conducted in five branches in the districts of Bahawalpur,
Hyderabad, and Attock, spanning different agro-climatic regions of Pakistan. 7 Figure 1
shows the location of the study districts.
We randomly selected 747 COs in the study branches based on membership
between 5 and 20 members. In each of these COs, NRSP staff conducted a complete
listing of the gender and occupation of its members to identify those that were engaged in
a non-farm enterprise. Most COs are segregated by gender. In our sample, there are 447
male COs (60 percent), 251 female COs (33.6 percent) and 49 mixed COs (6.5 percent). 8
Using data from this listing exercise, half of the COs were randomly assigned to receive
business training while the rest did not (control group).
The timeline of the experiment is reported in Figure 2. A baseline survey was
conducted in November 2006. The original sampling framework included all male and
female CO members that according to the listing exercise had a non-farm business and
five other members selected at random from each CO. In practice, enumerators ended up
interviewing everyone that attended a special CO meeting that was called to conduct the
baseline survey. Individuals with businesses were encouraged to attend the meeting. The
resulting sample consisted of a total of 4,162 members of which 2,532 had a business.
The break-up by gender yields 2,144 men (and 1,325 businesses) and 2,018 women, of
which 1,207 had a business. The sample accounts for 61 percent of all members and
roughly 90 percent of all businesses. During the meeting, interest in hypothetical business
training was elicited in a uniform manner across all COs.
While the baseline was underway, 24 NRSP staff members attended a 31-day
“training of trainers” course taught by ECI. 9 In January 2007, trained NRSP staff held
7
These branches are as follows: Matiari and Tando Muhammad Khan in Hyderabad, Attock in Attock and
Bahawalpur (rural and urban) in Bahawalpur.
8
In mixed COs, enumerators had to draw randomly from among male and female members separately.
9
In October 2006, NRSP submitted the CVs of about 30 staff members (10 in each of the study districts)
From these, ECI selected 24 (8 per district) based on their presentation and communication skills, facility
with basic math skills, basic computer literacy and diligence. Potential trainers were required to also have 3
to 4 years of experience working with communities and to have at least a Bachelor degree in commerce or a
related field. After the training, ECI finalized the list of 18 NRSP staff members who were to offer EDT to
CO members. The Training of Trainers had three main modules. The first (11 days) introduced basic
business concepts, the key modules of the business training. Trainees also engaged in a business creation
exercise (See Appendix A). During the following 10 days, trainers conducted a center assessment (see
Appendix A) and selected trainees for a business training session. The third module (10 days) provided
6
orientation meetings in treatment COs to announce the business training. Interested
members were asked to sign up for training and to suggest the most convenient time and
venue. Training sessions were organized by area, trying to accommodate time and venue
constraints, especially for women.
From February to May 2007, 47 business training sessions were held. Appendix A
describes the content of the training sessions, which were based on the “Know About
Business” modules designed by the International Labor Organization but adapted as a
series of role-play and case-studies and thus more hands-on, rather than being lecturebased. Each session lasted 6 days, typically from 9 am to 4pm with a 20 minutes tea
break and a 40 minutes lunch break, except for the fourth day that participants visited a
local market, and the last day that concluded at noon followed by an awards ceremony. 10
Sessions were conducted by two ECI trained NRSP staff and were attended by 25 CO
members on average. A total of 1,252 individuals (601 males and 651 females)
participated in the training and were given a travel allowance, a snack and lunch.
Attendance was remarkably high. Around 93 percent of those that signed up during
orientation attended, and among these, virtually everyone completed the training with full
attendance.
In June 2007, trainers met for a second two day ‘training of trainers’ workshop
and discussed business needs identified during the training sessions. With ECI staff, they
identified the right resources and training to support their CO clients. A second set of 2day sessions were conducted in July 2007. 11
It is informative to compare the business training implemented in our experiment
to that of Karlan and Valdivia (2010) (KV, henceforth) and Drexler, Fischer and Schoar
(2010) (DFS, henceforth). In all three experiments, the target audience is microfinance
clients. KV used a program designed by Freedom from Hunger, a US-based non-profit
organization in one location while the other location used a program designed by ILO
teaching resources to deal with both literate and non-literate audiences and gave trainers an opportunity to
test their teaching skills through mock training sessions.
10
Given the low levels of literacy, especially among women, the training was adapted to the illiterate
population. As an example, checklists contained icons that could be visualized and remembered. In
addition, the concept of costing an item was explained by bringing a shirt, taking apart every component
and costing each one separately.
11
The contents of the second training session included identification of technical/skill training needs,
product design and marketing, and choice of input and output markets and distribution systems.
7
adapted by a local Peruvian firm. Similar to our training, it included general business
skills rather than client-specific business knowledge and was delivered by staff of the
microfinance institution, in their case previously taught by Freedom from Hunger. The
training was offered in 30 minutes sessions during the weekly repayment meetings and
was planned to last 22 sessions. 12 DFS compared two alternative financial education
programs for business owners. One was based on programs designed by Freedom from
Hunger and the Citigroup Foundation and adapted to the Dominican context. The other
was based on simple rules that could be easily remembered by participants. Unlike our
training or that of KV, instructors were trained professionals and participants in both
programs received handouts and homework assignment to reinforce the concepts learned
during the sessions. Both classes were offered once a week for three hours and they lasted
six and five weeks, respectively. The student-teacher ratio in all three training is
comparable, with sessions of 15-25 participants per trainer.
In sum, the training implemented in our experiment was more hands-on that either
KV or DFS, including visits to a market, and requiring participants to set up a business
for a day. In addition, it was also more intensive, containing a total of 46 hours of training
compared to either 11 hours in KV or 15 to 18 hours in DFS.
From October 2007 to January 2008 one-on-one follow-up sessions called “HandHolding” sessions were organized for all participants in half of the COs that were offered
training, selected at random. NRSP trainers would visit the member at their home or
place of business once or twice a month and discuss the topics learned, answer questions
and suggest solutions to potential problems. Men were visited by male trainers while
women where visited by female trainers.
While the business training sessions were being conducted, NRSP identified all
the study members that were eligible to apply for the larger loan size. Eligible members
had to be borrowers of NRSP in good standing, that is, they were required to have
successfully repaid at least one loan on time and had no overdue loans. Roughly 55
percent of CO members in our sample were eligible (58 percent among male members
and 52 percent among women). All eligible members, including those in COs not offered
12
In practice, after 2 years since the launch of program only half the groups had reached the 17th session of
the 22 programmed.
8
the business training were invited to another orientation session and were given a
brochure that explained the loan lottery. 13 Orientations occurred successfully in 596 COs.
In the remaining 151 COs orientation meetings could not be held because the CO had
either disbanded (95 percent of cases) or was newly formed so that none of its members
was eligible for the lottery. 14 Most loan orientation sessions took place in regularly
scheduled CO meetings that lasted about an hour and a half and were delivered by trained
NRSP staff to ensure uniformity of message. 15
During the loan orientation, eligible CO members were informed that they could
request a loan of up to Rs. 100,000. The request was appraised by NRSP credit officers,
who then determined the loan amount they were willing to approve. Loans with an
approved amount larger than the previous limit of Rs. 30,000, were forwarded to
headquarters, where the result of the lottery were maintained. The lottery was designed so
that the chance of winning was 50 percent. Lottery winners could borrow the approved
amount, while those who lost could borrow up to their regular loan amount. Although
members were encouraged to borrow for productive purposes, in practice there were no
restrictions on the use of the loan. In addition, qualifying members who already had an
outstanding loan with NRSP were allowed to apply for the larger loan, with the condition
that part of the new loan would be used to pay off the outstanding debt. Among lottery
winners, 62.3 percent took agricultural (lump-sum) loans, 20.5 percent took enterprise
loans and the rest took livestock loans.
Eligible CO members had seven months spanning the planting period for the main
growing season (from November 2007 to June 2008), to apply for the larger loan. Of the
2,284 eligible CO members, 713 (31.2 percent) applied. NRSP approved 532 loans (74.6
percent) and most had their loan amounts reduced after appraisal. Of the customers
approved, 254 were assigned to win the lottery (47.7 percent) and 211 ended up
borrowing (83 percent). Among the 278 loan applicants that lost the lottery, only 161
borrowed (58 percent). Among the reasons cited for changing their mind were time
13
See Giné, Mansuri and Picón (2011) for a marketing experiment conducted during the loan orientation
meetings using the brochure.
14
First time borrowers were not eligible to participate in the lottery because they did not have sufficient
credit history. They could however apply to the initial loan of up to Rs 10,000.
15
There were 12 teams of two NRSP staff each in Attock, 29 in Bahawalpur and 7 in Hyderabad.
9
elapsed from request to approval (average time was 2 months), and for losers the fact that
the new loan size was not too different from the loan they currently had.
A follow-up survey was conducted in December 2008, six months after the loan
lottery concluded and about 13 months after the loan orientation meetings. At the time of
the follow-up, roughly half of the loans taken during the lottery period were still active.
3. Data
We use two main sources of data, administrative records from NRSP and survey
data collected in November 2006 and in December 2008.
Administrative data
We use NRSP administrative records on every loan taken by borrowers in our
sample from November 2006 to November 2009. The data includes the disbursement
date, amount, type of loan and repayment performance.
Survey data
Baseline data collected in November 2006, prior to the business training and loan
lottery orientations, included questions about the CO member, the member’s household,
the business if they had one, and the CO. The follow-up survey was collected in
December 2008, 2 years after the baseline, and was similar in structure to the baseline.
Besides the usual set of demographic variables, such as age, education, marital status etc,
individual characteristics included measures of entrepreneurship, business knowledge,
digit span recall, risk preferences and decision making autonomy across a range of
household outcomes. Household characteristics included information on expenditures,
wealth (including agricultural land, livestock, housing quality and savings) and past and
current borrowing and saving of household members. Business characteristics included
age, location and type of business activity, as well as the scale of the business as
measured by its assets, hired workers and monthly sales. The survey also contained
information on CO cohesion, including borrowing and lending between members in a CO
and the collective purchase and/or sale of products. The follow-up survey also included
questions about business training and the loan lottery, if applicable. Summary statistics
from the baseline survey are presented in Table 1, and variable definitions are provided in
Appendix B.
10
The average age among CO members at baseline is 38 years, with 3.9 years of
education. Households have average landholdings of 3.9 acres and average monthly
expenditures of Rs 4,740 which amounts to daily per capita expenditure of roughly 3.30
dollars a day (PPP adjusted). About 60 percent of the households in the sample run at
least one business. This percentage is significantly higher than the population average in
the study areas because households with businesses are more likely to be microfinance
clients. 16 Although most businesses have a fixed location and operate all year round, the
average scale is small. About 90 percent of businesses do not have a paid employee, and
sales are about Rs 14,250 (USD 240). These numbers are typical of microentrepreneurs
in developing countries (see for example Banerjee and Duflo, 2011).
Columns 7 and 8 of Table 1 report mean baseline characteristics by gender along
with the associated p-values of the difference in means’ t-test (column 9). It is clear that
the type of businesses managed by male and female CO members is quite different.
While women are primarily engaged in small home based manufacture (handicrafts or
tailoring), men are involved primarily in the agribusiness sector which requires much
greater contact with markets outside the village. The scale and profitability of male and
female businesses is also quite different (see also de Mel et al. 2009). Average sales
among male businesses are Rs 22,820 (USD 380) while only Rs 4,827 (USD 80) among
businesses run by female CO members. Women tend to operate mainly from home and
are less likely to employ paid employees. 17 More importantly, business women report far
less decision making autonomy than their male counterparts (see Sathar and Kasi, 1997).
Out of a total of 8 decisions on a range of household, individual and business outcomes,
women report complete autonomy over roughly 1.5 decisions compared to more than 3
decisions among men. There is also evidence that the selection process to become a CO
member may differ by gender. Women tend to have less education, are to be less likely to
run a business and, perhaps related, are also less risk tolerant on a 0 to 10 scale. Female
members are also more likely to come from households that have less land wealth, as
16
According to the Demographic and Heath Survey conducted in 2006-07, 31 percent of households in
rural areas reported having at least one household member engaged in non-agriculture self-employment.
Among all the 6,837 microfinance clients in the study COs, roughly 40 percent have a business at the time
of baseline.
17
There is also weak evidence suggesting that female businesses are more of a fall back option: among
households of male CO members, businesses are concentrated among the richer households. In contrast,
businesses are more prevalent among the poorer households of female CO members.
11
compared to the households of male CO members. This selection of women CO members
by wealth is consistent with more stringent female seclusion practices among landed rural
households (see Jacoby and Mansuri, 2011).
In sum, there are substantial differences in individual and business characteristics
between male and female CO members. Because the process by which women select to
become a CO member and into self-employment may be different from that of men, it
will be important to take these characteristics into account when assessing treatment
impacts by gender, since treatment impacts may be driven by these characteristics rather
than gender per se.
Table 2 checks that the assignment of COs to business training and members to
win or lose the loan lottery was successful. Columns (2) and (3) compare mean baseline
characteristics, at the member, household and business level, for members in COs that
were assigned to business training against those in the control group. Columns (5) and (6)
compare lottery winners to losers among the subsample of eligible members. Columns
(3) and (7) report the p-values of the t-test for each comparison.
Overall, we find balance between the two groups. The difference in means for
members receiving business training and participating in the loan lottery is significant at
conventional levels for only a few variables, such as log month sales, credit constraints
and being an office bearer for the business training comparison and being married, the
business sector, and the index of optimism for the lottery comparison. These differences,
however, are small in magnitude, and while significant, there is no clear pattern that
higher values are systematically in the treatment or control group. For example, the group
assigned to business training has more members that are office bearers but also more
individuals with credit constraints. We also run a regression of “offered business
training” against all individual, household and business baseline characteristics reported
in Table 2 and find a p-value of 0.15, 0.18 and 0.47, respectively, of an F-test that all the
covariates are not jointly different from zero. The analogous p-values for the regression
using “assigned a lottery winner” as dependent variable are 0.32, 0.11 and 0.70. 18
18
The p-values of an F-test that all business characteristics are jointly insignificant are 0.47 when the
dependent variable is “Offered Business Training” and 0.70 when it is “Assigned a Winner”.
12
The attrition rate between the baseline and follow-up two years after is 16 percent.
Attrition is larger at 22.1 percent among CO members in COs that disbanded. In
Appendix Table A1, we check that the attrition rate does not differ by treatment status. In
column 1 none of the coefficients are significant at conventional levels but in column 2,
which includes interactions with gender, individuals assigned to be lottery winners are 4
percentage points more likely to be interviewed at follow-up. At any rate, the differential
attrition rate is too small to be a source of concern.
4. Empirical strategy and Results
By virtue of our design, CO members are in one of four groups: (i) offered business
training (BT) and assigned as winner of the lottery (WL), (ii) BT but no WL, (iii) no BT
but WL and (iv) no BT nor WL. Because both treatments (BT and WL) are assigned
randomly, their separate and joint impact on various business, household and member
outcomes can be estimated via the following OLS regression equation:
Yijb1 = β1 BTijb + β2 WLijb+ β3 BT and WLijb +γXijb + δ Yijb0 + εijb,
(1)
in case both baseline and follow-up data were collected, or
Yijb1 = β1 BTjb + β2 WLijb + β3 BT and WLijb + γXijb + εijb,
(2)
when only follow-up data exist. In both specifications, Yijbt is a given outcome for
individual i in CO j in branch b at time t (1 for follow-up, 0 for baseline), BTijb is a
dummy that takes value 1 if business training was offered in CO j in branch b but
individual i was not assigned as winner in the loan lottery, WLijb is a dummy that takes
value 1 if individual i in CO j in branch b was assigned as winner but CO j was not
offered business training, and BT and WLijb is a dummy that takes value 1 if CO j in
branch b was offered business training and individual i in CO j was assigned as winner in
the loan lottery. The vector Xijb contains the stratification variables (gender, business
ownership, eligibility for loan lottery and branch dummies). The term εijb is a mean-zero
error and because the unit of randomization for business training is the CO, standard
errors are clustered at this level (Moulton 1986). The coefficient β1 is the impact of being
offered business training alone, the coefficient β2 measures the impact of being assigned
a winner of the loan lottery alone while the combined effect of being offered business
13
training and winning the lottery is measured by β3. We report the p-value of a t-test that
β1 = β3 , β2 = β3 and that β1 = β2. 19
We focus on intent-to-treat estimates because not every CO member offered
training did participate nor did every member request a larger loan. We do not report
average treatment on the treated estimates because it is plausible that non-participants are
influenced by participants in the same CO given that they interact often during CO
meetings thus violating SUTVA (Rubin, 1974).
Appendix Table A2 reports the household and individual correlates of interest in
business training (columns 1 to 3) and actual uptake of business training (columns 4 to 6).
Perhaps not surprisingly, business owners, more educated, risk tolerant and older
members as well as officers in the CO. Among female members, mobility and being less
observant of Purdah are also correlated with interest in training. Actual take-up of
business training is strongly correlated with interest (among other variables). 20
Given that we focus on a wide range of business, household and member
outcomes we follow Kling, Liebman, and Katz (2007), Karlan and Valdivia (2010) and
Drexler, Fischer and Schoar (2010) and construct summary measures of standardized
treatment effects for several families of outcomes. Within each class or family, we
rescale each outcome such that larger values indicate more desirable values and convert
each measure to a z-score such that z
y
µ /σ , where µ and σ are the mean
and standard deviation of the variable y for CO members that were not offered business
training nor were assigned to be winners of the lottery. For each class, we then construct
a summary measure Z
∑ z /k.
4.1 Business Outcomes
Panel A of Table 3 reports the intent to treat effects on business related outcomes.
The dependent variable in column 1 is an aggregate index of business knowledge that
19
Notice that an alternative specification to (1) would be
Yijb1 = β ’1 BTijb + β ’2 LLijb+ β ’3 BTijb x LLijb +γXijb + δ Yijb0 + εijb,
where the combined effect of the business training offer and winning the lottery would be the sum of β ’1 +
β ’2 + β ’3 . We prefer specification (1) because it is easier to interpret.
20
While it is not surprising that members that expressed interest in a hypothetical training sign up for it
when offered, NRSP staff could have devoted more resources to signing them up. As a result, we interpret
the point estimates of columns 4 to 6 of Appendix Table A2 are mere correlations.
14
includes questions on competition and basic business concepts, not necessarily taught
during the training. Appendix Table A4 reports the intent to treat impacts for the
individual items that are used to construct the aggregate index. As mentioned, the
definition of the aggregate variables is reported in Appendix B. Because these aggregates
include some variables that are only observed at follow-up, the number of observations
for the aggregate is 3,494 instead of 4,160 observations included in the baseline.
We find that business training (and not being assigned a winner of the lottery)
improves business knowledge for all CO members interviewed. This is remarkable
because business knowledge was assessed during the follow-up survey which took place
18 months after the business training was implemented. Given that a substantial amount
of time has elapsed from training to testing, it is plausible that the acquired business
knowledge will not be forgotten. The next two columns report business creation in the
household with (column 2) or without (column 3) the CO member’s involvement in the
business. The sample includes again all study CO members. We find no effect of business
training on business creation either with or without access to the larger loan. We next
examine business failure among business owners at baseline and again find no effect. The
point estimate on business training is negative and large, but so is the standard error.
Columns 6 and 7 report intent to treat impacts on operations and business practices for
the sample of business owners at baseline. We find that the offer of business training
leads to improvements in business practices such as recording the sales on a piece of
paper as well as separating business from household accounts by recording money taken
for household needs. There are also some improvements in business operations,
especially among business owners assigned as winners of the lottery. 21 In particular,
Appendix Table A4 shows that businesses of CO members assigned to be lottery winners
are more likely to operate all year round and to have a secured buyer. Perhaps more
importantly, and consistent with the larger loan being used for business equipment, we
find a higher level of business assets measured using principal component analysis. These
21
Appendix Table A4 shows that the reason there is no overall improvements in business operations for the
sample of CO members offered business training is due to opposing changes in individual items. In
particular, business training encouraged entrepreneurs to secure a buyer which led to reductions in
marketing and the need to open the business to the public.
15
improvements in business operations, however, do not translate into higher sales and
profits (column 7).
Panel B of Table 3 includes interactions with gender. Even though the effects on
business knowledge are no longer significant at conventional levels, female CO members
that were assigned as lottery winners and were offered business training (BT and WL)
increase their business knowledge by about 8.7 percent of a standard deviation (p-value
0.12). Since female CO members have lower levels of business knowledge at baseline,
this finding is consistent with diminishing returns to learning business skills. Column 3
shows that households of female CO members in the BT and WL group are more likely
to create a business without the CO member involvement, compared to households of
male CO members. This is suggestive evidence that spouses or other household members
may use the funds borrowed by the female CO member to set up a business without her
involvement, consistent with the review of empirical evidence on the impact of microcredit in Pakistan by Hussein and Hussein (2003). They argue that most women
borrowers only have partial control over the loans. Column 4 shows that among male
business owners, business training led to a reduction in business failure of 6.1 percent
compared to the control group. There is no effect among business women (p-value is
0.98). The overall business failure rate between baseline and follow-up (2 years) among
business owners that were not offered training and were not assigned winners is 38
percent, which is somewhat higher than that of other countries (Mead and Liedholm,
1998), perhaps as a result of the financial crisis. Despite the relatively high rate of exit in
the sample, it is not clear, a priori whether a lower business failure rate is desirable, since
ex-business owners may have switched to more profitable occupations. However, this is
not the case in our data: more than three quarters of all business failures report not being
actively employed and experience a decline in expenditures per capita relative to business
owners that survived.
Columns 5 and 6 show treatment effects in business practices and operations
among men, but not among women. However, given that business training led to
differential attrition among male businesses, we follow Lee (2002) and construct non-
16
parametric bounds on the same business outcomes. 22 The bounds, presented in Table 4,
create intervals that are rather wide, and so for all aggregate categories the impact of
business training on male business could be positive and significant or negative and
significant, depending on the assumptions about the characteristics of businesses in the
control group that attrite. Appendix Table A3 runs a regression with business failure as
the dependent variable against baseline characteristics for businesses in the control group.
Land wealth and business ability are negatively correlated with business failure,
suggesting that business failures may be driven by worse quality entrepreneurs operating
at a smaller scale. Consequently, it is likely that business training led to positive and
significant impacts among male businesses.
4.2 Individual and Household Outcomes
Table 5 examines the impact of the treatments on household outcomes. In Panel
A, CO members offered business training (irrespective of the lottery assignment) show a
significant increase of roughly 7 percent of a standard deviation in the income and assets
aggregate. According to Appendix Table A5 which shows the individual components of
the aggregate, they increase their expenditures and housing quality. Among individuals
not offered business training, those assigned to be lottery winners increase the income
and assets aggregate by roughly half (3 percent of a standard deviation), but this increase
is not statistically significant. The difference between this increase and that of members
offered business training is not statistically significant either (p-value of 0.25 or 0.3
depending on the comparison, as reported in the table).
We find the same pattern with the CO cohesion aggregate (column 2). The
increase in the aggregate comes from increases in the collective purchase and sale of
inputs and outputs and an increase in the borrowing and lending between CO members
(Appendix Table A5). In column 3, all CO members, either assigned to be lottery
winners or offered business training also report better outlook on life by 7 to 11 percent
of a standard deviation in the aggregate. Satisfaction with life increases for everyone,
while those offered business training also improve optimism and decrease the stress /
22
The idea behind Lee (2002) bounds is as follows. Since attrition in the control group is 6.1 percent larger
than in the treatment group, 115 observations from the treatment group are eliminated to make both groups
comparable. The upper bound is computed as the difference between the treatment and control group when
observations are removed from the bottom of the distribution. Similarly, the lower bound is computed by
removing observations from the top of the distribution.
17
depression index (Appendix Table A5). Finally, the index of decision-making power
(column 4) does not change as a result of the treatments.
In Table 3 we found no improvement in business sales or profits, yet Table 5
shows significant increases in income and assets. What might reconcile the difference?
As mentioned, the Lee (2002) bounds reported in Table 4 are consistent with increases in
sales and profits, but it is worth pointing out that there are households engaged in selfemployment activities (farming) that do not own a business and yet may have benefited
from business training. Likewise, there are business-owning households whose main
activity may not be self-employment. We therefore define a self-employed household as
one whose household income share from self-employment (both farm and non-farm)
activities is larger than 50 percent. According to this definition, Table 1 reports that 23
percent of households can be classified as self-employed households. 23 In Appendix
Table A6, we check whether the gains by households offered business training are
concentrated among self-employed households. We find that this is indeed the case. Selfemployed households increase business knowledge by 8.4 to 8.9 percent of a standard
deviation (p-values of 0.02 and 0.06) depending on the lottery assignment. In contrast,
households that are not self-employed only increase business knowledge by 3.4 to 6.2
and these increases are statistically insignificant. The same pattern arises with the income
and assets aggregate. Self-employed households experience increases of 9.2 to 14.9
percent of a standard deviation (p-value of 0.00 in both cases) while households that are
not self-employed do not gain at all.
We now turn to Panel B of Table 5 to examine the impacts on individual and
household outcomes by gender. By and large, the impacts on the income and assets
(column 1) and CO Cohesion (column 2) aggregates are concentrated among male CO
members. The effects on the aggregate outlook on life are mostly concentrated among
females, which is surprising given the lack of improvements in the other aggregates.
To sum up, female CO members improve business knowledge but do not put it
into practice in their existing businesses or new ones. As a result, we see no
improvements in income and assets or CO cohesion. In contrast, business training leads
23
Twenty eight percent of business owners and 15.5 percent of non-business owners are self-employed
households. This indicates that even among business owners, income from business may not be large,
relative to other sources of household income.
18
to lower business failure and likely improvements in business practices, operations and
sales for men in addition to improvements in income and assets and CO cohesion.
4.3 Exploring Gender Differences
Given the results just described, a natural question that arises is why women fail
to capitalize on the training offered. There are several potential answers. First, given the
substantial differences between male and female CO members and the process by which
women select into CO membership and into self-employment, gender differences may
simply reflect differences in other characteristics. These male-female differences may
stem from biological factors or from “learned” social behavior, that is, may be the result
of culture and the environment (Gneezy, Leonard, and List 2009, for example and World
Bank, 2012) Similar to del Mel et al (2009), we address this point by including a range of
controls and their interaction with the treatment dummies in the specifications of Table 5
and business knowledge of Table 3, column 1. 24 Table A7 report the results. We find that
the coefficients of the interactions of treatment dummies with genders are smaller in
magnitude but qualitatively, the results are the same as those reported in Table 5.
One might also argue that given the low levels of literacy among women, they
were unable to understand the training, or that women attended training sessions
delivered by trainers of poorer quality. As we have noted in Panel B of Table 3, business
training did lead to an increase in business knowledge among women, so lack of
understanding is not the issue. In addition, both male and female sessions were taught by
the same team of trainers. Finally, as discussed in Section 2, we note that a random subsample of business training participants were selected for follow-up visits (“HandHolding”) after the training had concluded. The goal of those visits was to provide male
and female entrepreneurs an opportunity to discuss the concepts learned during business
training with trainers and to ask specific questions about how to run their business. Table
A8 reports the impact of Hand Holding on the same aggregates as Table 5. The number
of 1,140 observations corresponds to the sample of business training participants among
the original 1,252 individuals that were successfully interviewed during follow-up. We
find that Hand Holding had no effect on any aggregate variable and that this lack of
24
We include risk aversion, education, landholdings, digit span recall and interactions of these variables
with treatment dummies.
19
impact does not vary by gender. 25 This is consistent with the view that training was
delivered successfully and that the barriers that women face as entrepreneurs cannot be
overcome by more intense visits. In conversations with trainers, some mentioned that
they dropped one of the two scheduled business visits, after realizing that entrepreneurs
in the sample did not need the mentoring.
A perhaps more convincing explanation of why impacts differ by gender comes
from the fact that in Pakistan, as in other South Asian and Middle Eastern countries, labor
markets are segregated by gender (see Samina, 1997 and Goher, 2003). According to the
ILO (2010), female labor force participation in Pakistan was only 22 percent in 2009,
compared to 52 percent worldwide. In our data, while most of the male CO members
without a business at baseline are involved in other self-employment activities (mainly
agriculture) or wage work, 71 percent of females report staying at home without a
primary occupation. One of the reasons for the limited female labor supply may be the
prevalence of social norms about the role of women as caregivers. We explore this
hypothesis by examining self-reported time allocation during the day prior to when the
follow-up survey took place. Women do indeed spend a lot more time in household
chores than men do (6.4 hours for women compared to 2 for men) and about half as much
time in the business than their male counterparts (2.9 versus 5.4 hours among business
owners). Their spouses behave along similar gender lines, that is, female spouses of male
CO members show similar hours in household chores and the business as female CO
members and vice versa. 26
Panel B of Table 6 shows that female labor supply in the business does not
respond to any of the treatments, either for females or their male spouses. Women in the
LW and the BT and LW groups do reduce the labor supply in agriculture but the overall
impact is small because women spend only 0.4 hours on average in agricultural activities.
In contrast, male CO members devote more time to business activities in the BT and BT
and LW groups (p-values are 0.12 and 0.15 respectively) and agricultural activities in the
BT and LW group (p-value is 0.11). The response in the BT group could be driven by the
25
Hand Holding did not have any impact either on aggregates other than those in Table 5 (results not
reported).
26
These time use data patterns are similar to those found for Pakistan in Berniell and Sánchez-Páramo
(2011) who report data for a sample of 23 countries.
20
fact that there are more businesses active in the BT group due to the lower failure rate
(see Table 3, column 4) but the effects are somewhat imprecisely estimated. 27
If female labor supply is restricted, then according to occupational choice models
in the literature (for example Lucas, 1978 or more recently Emran, Morshed and Stiglitz,
2007), businesses run by women will be of lower quality and may thus benefit less from
business training. In its simplest formulation, individuals differ in the ability to run a
business and face the choice between becoming an entrepreneur and working for the
going wage in a single labor market. Since the marginal entrepreneur is indifferent
between self-employment and wage work, the wage (opportunity cost) is a good proxy
for the marginal entrepreneur’s profits. Because face a lower wage in the labor market,
the scale and profits of the marginal female entrepreneur will be lower as well.
In addition, the same social and cultural norms that restrict female labor supply
also affect their mobility outside the home. In a study of female entrepreneurs in
Pakistan, Roomi (2005) finds that the social unacceptability of females interacting with
unrelated males is responsible for the low number of female borrowers (less than 40
percent in Pakistan in 2009) compared to more than 85 percent in India or Bangladesh.
The lack of mobility also affects women’s involvement in the business. Since women
cannot sell products or purchase inputs in the market, their decision-making power is
limited. In our data, 40 percent of female CO members involved in a business report that
all business decisions are made by their husband. Therefore, even if one argued that
business training could have improved business performance because better decisions
about production and marketing, etc may not require additional time, the fact is that
women show no improvement because they have little control over the businesses they
are involved in.
Discussion
The gender differences we find are not unique to the context we study. De Mel et
al. (2009) study a comparable sample of female entrepreneurs in Sri Lanka and find that
they tend to overinvest in fixed assets relative to male entrepreneurs, consistent with the
idea that investment in fixed assets is a (costly) strategy to protect resources from the
27
Interestingly, male spouses in households of female CO members in the BT and LW group where new
businesses were created (see Table 3, column 3) reduce labor supply in agricultural activities but we fail to
see an increase in labor supply in business activities (column 4).
21
husband that would otherwise be expropriated as women lack control. Using a similar
experimental design with a larger sample that includes businesses with five or more
employees, Fafchamps et al. (2011) find that small female businesses in Ghana are very
similar to those in Sri Lanka (and in this study) in that they do not benefit from capital
injections. However, female owners of larger businesses, who report full decision-making
power, are able to generate profits in response to treatment. In sum, the ability of women
to capitalize on business training or increased access to capital seems to depend
importantly on the social background.
4.4 Loan Uptake and Repayment
We now turn to the impact of business training and the loan lottery on the demand
for loans and their repayment. We use administrative data on 283 loans disbursed after
November 2006 that matured from February 2007 to November 2007, the period before
the loan lottery and on 1,497 loans disbursed from November 2007 to June 2008, the
period during which the lottery was available. We have repayment data from February
2007 to November 2009, at which point all loans given before and during the lottery had
matured by more than 90 days.
Table 7 presents the results before the lottery on loan size (column 1) and
repayment (columns 2-5). We use two measures of default: a dummy indicating whether
the loan had not been fully repaid at maturity (column 2) or 90 days past the maturity
date (column 3) and the percentage of the due amount that had not been repaid at
maturity (column 4) and 90 days after the maturity date (column 5). We find that business
training leads to an increase of 16 percent in loan size and no adverse effect on
repayment, irrespective of the measure and time period used. In fact, the point estimates
suggest a reduction of default [MODIFY]. The default rate at maturity among controls is
only 3 percent but it increases to 44 percent during the period of the loan lottery,
coinciding with the crisis. 28 During this period, loan sizes are higher among lottery
winners, not surprisingly, but there is no deterioration of default. 29 Since we find neither
an increase in default nor an increase in the workload of credit officers handling larger
28
The loan lottery per se did not affect the default rate as we find a similar pattern if we use data for all
COs in the study branches. We should therefore view the increase in default as a secular trend.
29
The point estimates are however positive and large and so given that standard errors are also large, the
effect of n default Given that standard errors are somewhat large, one cannot rule out increases
22
loans, we conclude that these larger loans are profitable for the lender. In Panel B we
explore gender differences, and similar to previous tables, we find that the increase in
loan size is again concentrated among male CO members. Female CO members offered
business training appear in fact to be borrowing less (p-value 0.11) and the same is true
among the same females during the loan lottery. Women assigned to be lottery winners
do borrow more, like their male counterparts. As for repayment, we do find lower default
among women offered business training, perhaps because their loan burden is lower
given that they borrowed less.
Perhaps more interestingly, we also explore whether business training leads to
more informed financial decisions and thus less scope for mistakes. We first compute an
ex-ante probability of default among CO members not offered business training nor
assigned as winners in the loan lottery and use the estimated coefficients to predict this
probability of default for every CO member in the sample. Given that the average default
rate is quite different in both periods, we compute two different ex-ante probabilities, one
for each period. In practice, we take the sample of CO members not offered business
training nor assigned as winners in the loan lottery with at least one outstanding loan
during each period and construct an indicator variable for whether at least one loan is in
default at maturity. We then run a regression of this individual level variable against
individual characteristics measured at baseline. The results are in Table A9. As one can
see from the R-squared, the fit of the model is worse during the period before the loan
lottery, due to perhaps little variation in default. The second step is to use the estimated
coefficients to compute the predicted probability for all borrowers in the sample. Finally,
we rerun columns 1 and 6 including this measure and its interaction with treatment
dummies. Standard errors are bootstrapped with 200 repetitions preserving the CO
structure because the ex-ante probability of default is a generated regressor. Table 8
reports the results. Individuals offered business training with a lower ex-ante probability
of default are more likely to borrow during and after the lottery. This result is remarkable
because it suggests that training leads to increased knowledge about one’s ability to repay
the loan thus contributing to better financial decision-making. This “learning” mechanism
is distinguishable from other stories because ex-ante worse borrowers have a lower
probability of borrowing compared to the control group. The simple alternative story
23
where ex-ante better borrowers are more likely to borrow because they benefit more from
business training would not predict that ex-ante worse borrowers would borrow less than
borrowers in the control group.
Here we find once again that the effect is concentrated among male CO members,
perhaps because females do not decide whether and how much to borrow on their own as
they need approval of their husbands.
4.5 Child Labor
Finally, because both treatments may raise the household labor productivity, we study
children schooling outcomes. On the one hand, given that schooling is a normal good,
higher incomes should translate into better schooling outcomes (income effect). On the
other, higher household labor productivity raises the opportunity cost of children’s time
(price effect), so the net effect is ambiguous. Table 9 shows that children, especially
boys, in households of a male CO member assigned to be a winner of the lottery about 9
percent more likely to be absent during the last school day, suggesting that the price
effect dominates.
6.Conclusions
In this paper we ask: What are the barriers to entrepreneurship among
microfinance clients in rural Pakistan? We posit that the main barriers are credit
constraints and managerial capital constraints. The experimental design alleviates each
potential barrier in turn by offering a subset of the borrower groups an 8 day business
training course and the opportunity to participate in a lottery for a loan up to 7 times the
average loan size. We find that offering business training led to improved business and
household outcomes, but only among men. We also find positive impacts of offering
business training for the lender insofar as the offer of larger loans led to increased lending
without a rise in default. The benefits from relaxing credit constraints are more modest,
perhaps because in the context we study, microfinance clients are not constrained.
Despite these encouraging results, we note that ninety percent of businesses in our
sample have no hired employees and most business owners have low levels of literacy.
They are therefore “subsistence” entrepreneurs, that is, individuals that own the business
to survive and perhaps provide employment to family members (Schoar, 2010; Woodruff,
24
2006). However, even if the impact of these businesses on the aggregate economy is
small, they do account for a large share of the population and so business training can
serve as an effective poverty alleviation tool as it improves business management and
financial decision-making.
Appendix A: Business Training
The training includes a village assessment, four modules that cover key dimensions of the business and a
business creation exercise (BCE) where participants identify, prepare, implement and close a micro
business during the last day of training. The training combines field visits to markets, input suppliers and
wholesalers, group work and one on one coaching and is designed for both literate and non-literate
audience.
Village Assessment
A Village Assessment is a mapping of all infrastructure, utilities/amenities, population, resources and local
institutions and organizations in the village. The goal is to determine the socio-economic status of the
population, assess the local production of goods and services and identify potential businesses.
Module 1. The entrepreneur
In this module, basic entrepreneurial competencies are defined. They include, for example the ability to
take risks, to plan and set goals, to gather information for decision-making, to persuade and negotiate
effectively, etc. Participants identify and assess personal competencies, and are provided tools to develop
them.
Module 2. The project
This module focused on how to identify businesses ideas and select the most viable one based on the
village assessment and the qualities of the entrepreneur. The concepts of feasibility and the components of
a business plan are introduced and participants are asked to develop one for their own business creation
exercise to be implemented in the last day of training.
Module 3. Marketing
In this module, participants visit a nearby market and are introduced to the 4-Ps (product, price, place and
promotion). The importance of establishing links with wholesale buyers is discussed.
Module 4. Financial Management
In this module, participants learn the importance of using receipts, and keeping records of all sales,
purchases and expenses, inventory, debt and receivables. Participants are required to develop an accounting
system for their own BCEs. With the example of interactive exercises, participants are introduced to the
concept of a balance sheet and profit and loss statement. Participants realize that these statements are
important to track business profitability.
Business Creation Exercise
During the last day of training, participants apply the topics learned during the training by starting and
closing a mini business of their choosing for a day. Through the BCE, participants are able to analyze their
own competence for business, are required to generate a number of business ideas, choose one, assess its
viability and assess their expected profit. They are given a small budget and have to cost their product/
service, and maintain record of sales and expenses.
Appendix B: Variable definitions
Baseline characteristics
Individual
Female is a dummy that equals 1 for women and 0 for men.
25
Age is respondent’s age in years.
Years of education is years of completed schooling, and is top-coded at 16.
Married, a dummy taking the value of 1 if member is married, 0 if single, divorced or
widowed.
Digital span recall reports the number of digits correctly recalled after being shown an
eight digit number for 30 seconds.
Index of Optimism is the first component of a PCA for the following questions on
attitudes towards own life that have been coded in a way that a positive or optimistic
answer receives a score of 1 (0 otherwise): (i) There is really no way I can solve some of
the problems I have; (ii) Sometimes I feel that I am being pushed around in life; (iii) I
have little control over the things that happen to me; (iv) I can do just about anything I
really set my mind to do; (v) I often feel helpless in dealing with the problems of life; (vi)
What happens to me in the future mostly depends on me; (vii) There is little I can do to
change many of the important things in my life.
Index of Knowledge of Competition is the first component of a PCA of two questions
about knowledge of competition: (i) “Suppose 10 traders set up a market right outside
your village to sell ghee. These traders never talk or cooperate with each other in any
way. They have the capacity to sell as much ghee as they want and their only cost of
supplying one tin of ghee is Rs 100/kg. The current price of ghee is Rs 200/kg. What do
you think would happen to the price of ghee over time?” and (ii) What would happen if
these 10 traders were able to cooperate with each other in setting the price? What would
be the price of ghee? For each question is answer correctly, a value of 1 is assigned, 0
otherwise.
Index of female mobility and No purdah index are also the first component of a PCA of
several variables with negative values indicating less mobility (or observing more types
of purdah). For female mobility, the questions are (i) Would you be willing to travel
outside your settlement if your work required it? And (ii) Would you be allowed to travel
outside your settlement if your work required it?.
The “No Purdah” the questions are (i) Do you observe any type of purdah? and (ii) When
you are within your settlement do you […], (iii) When you are outside your settlement do
you […], (iv ) When you are working in the field, do you […], which accepts as answers
a) Cover your head only; b) Cover both your head and your bosom; or c) Cover your
whole body, including your face.
Aversion to risk general is measured on a 0-10 scale where 0 indicates the most risk
averse and 10 the most risk-tolerant/lover.
Trust in Formal System, scores of component 1 of a PCA for the response on considering
six different institutions as useful or not to resolve payment disputes.
Months as member, number of months as member of NRSP group.
Holds Office in Group, takes value 1 if member has or has had in the past a leadership
position in group.
Business owner equals 1 if the member had a business at baseline, 0 otherwise.
Fraction of Members of same Zaat (caste), is a percentage of members in the group that
share the same cast of the member.
26
Member of a mixed group, dummy takes the value of 1 if the member belongs to a
borrowing group with mixed gender, 0 if the group is of the same gender.
Index of Depression/Stress, applies PCA to two questions specific to experiencing stress
and depression.
OCEAN indexes, PCA indexes for the big five personality traits: openness,
conscientiousness, extraversion, agreeableness, and neuroticism (emotional stability).
Household
Household size, number of people living in the household (excludes migrants, students
living away).
Ever in business, captures business experience within the household. Equals 1 when this
is the case, 0 otherwise.
Household member has held hereditary, political office.
Land is the total owned land inside and outside the village.
Distance, to CO meeting place.
Credit constraints, dummy taking a value of 1 if the member faced any type of credit
constraint, formal or informal.
Household expenditures, expressed as logs of average monthly expenditures at the time
of baseline.
Decision Making, is the number of household decisions out of a total of eight that the
member usually takes on his or her own. The decisions are: children’s schooling,
consumption expenditures, major investments in business or land, the respondent’s
participation in community or political activities, the respondent’s spouse participation in
community or political activities, whether or not the respondent should work for an
income, whether or not the spouse should work for an income and how much the
household saves. In the analysis, a dummy is used that takes value 1 if the variable is
above the median for each gender subsample.
Bank deposit, dummy taking the value of 1 if the member has a bank account, 0
otherwise.
Education of spouse is years of completed schooling of the respondent’s partner, if any.
Top coded at 16.
Business characteristics
Type of business, dummy variables for businesses shown on brochure
Fixed location, dummy equal to 1 when the business is not mobile, 0 otherwise.
Operates all months, dummy equal to 1 when business operates year round, 0 otherwise.
Purchase on credit, equal to 1 if sales can be made on credit to customers.
Records of sales and of money taken from business, 1 if the member does keep records, 0
otherwise.
Number of workers, includes both paid and unpaid workers.
Paid workers, dummy equal to 1 if the business owner employs people for wages, 0
otherwise.
Log of SalesGood, Average, Bad month, considers average sales the year the baseline was
taken, considering goods, average and bad month.
27
Sales in ‘000 rupees, sales of business in an average month at the time of baseline.
Aggregate Outcomes
Business Knowledge, simple average of standardized z-scores of the following variables:
knowledge of competition, bookkeeping and business concepts, all calculated as the first
component of a PCA of several survey questions.
Business Practices, simple average for standardized z-scores of the following variables:
allowing purchases on credit, record of sales, record of money taken from business, all
dummies taking values of 1 or 0.
Business Operations, simple average for standardized z-scores of the following variables:
having a fixed location, year-round operation, investing in marketing, having a business
open to the public, or having secured buyers (all dummies); and z-scores of two indexes
built around a number of questions on business appearance, and business assets.
Sales and Profits, simple average for standardized z-scores of the following variables: log
of sales and profits by November 2008, and the log of sales at baseline, under three
scenarios: good, average, and bad month.
Expenditures/Assets, simple average for standardized z-scores of the following variables:
log of monthly expenditures, log of savings, log of livestock value, and a PCA index of
housing conditions, based on interviewer’s report.
Access to Credit, simple average for standardized z-scores of four dummies taking the
value of 1 if the members has taken a loan from either formal sector (banks),
microfinance institutions (including NRSP), informal sources ( lenders, providers) or
family/friends.
CO Cohesion, simple average for standardized z-scores of four dummies taking the value
of 1 if the member considers that can rely more on other CO members, if reports more
collective action among the group, or if the member lends or borrows to/from other
members.
General Outlook of Life simple average for standardized z-scores of three PCA indexes
for questions related to trust in people’s intentions, optimism and satisfaction with life.
28
References
Banerjee, Abhijit and Esther Duflo. 2008. “Do Firms Want to Borrow More? Testing
Credit Constraints Using a Directed Lending Program”, mimeo, MIT.
Banerjee, Abhijit and Esther Duflo. 2011. “Poor Economics” PublicAffairs.
Banerjee, Abhijit V, Esther Duflo, Rachel Glennerster, and Cynthia Kinnan. 2010. “The
Miracle of Microfinance? Evidence from a Randomized Evaluation.” MIT mimeo.
Banerjee, Abhijit and Andrew Newman. 1993. “Occupational choice and the process of
development.” Journal of Political Economy 101 (2): 274– 298.
Berniell, Maria Inés, and Carolina Sánchez-Páramo. 2011. “Overview of Time Use Data
Used for the Analysis of Gender Differences in Time Use Patterns.” World Bank, mimeo.
Baumol, William. 1968. Entrepreneurship in Economic Theory. American Economic
Review, Papers and Proceedings 58 (2) 64-71.
Beaman, L. Raghabendra Chattopadhyay, Esther Duflo, Rohini Pande and Petia Topalova
(2009) “Powerful Women: Does Exposure Reduce Bias?” Quarterly Journal of
Economics 124(4): 1497-1540.
Berge, Lars Ivar Oppedal , Kjetil Bjorvatn and Bertil Tungodden. 2010. “On the role of
human and financial capital for microenterprise development: Evidence from a field
experiment in Tanzania”, mimeo.
Blanchflower, David G. and Andrew J. Oswald. 1998. “What Makes an Entrepreneur?”
Journal of Labor Economics 16(1): 26-60.
Bloom, Nicholas, and John Van Reenen. 2010. “Why do management practices differ
across firms and countries?” Journal of Economic Perspectives, 24(1): 203-224.
Bruhn, Miriam, Dean Karlan, and Antoinette Schoar. 2011. “What Capital is Missing in
Developing Countries?” American Economic Review Papers and Proceedings.
Buera, Francisco J. Joseph P. Kaboski, and Yongseok Shin. Forthcoming. “Finance and
Development: A Tale of Two Sectors.” American Economic Review.
De Mel, Suresh, David McKenzie and Christopher Woodruff. 2009. “Are Women More
Credit Constrained? Experimental Evidence on Gender and Microentreprise Returns”
American Economic Journal: Applied Economics, 1(3):1-32.
De Mel, Suresh, David McKenzie and Christopher Woodruff. 2008. “Returns to Capital:
Results from a Randomized Experiment.” Quarterly Journal of Economics 123(4): 132972.
29
Drexler, Alejandro, Greg Fischer and Antoinette Schoar. 2010. “Financial Literacy
Training and Rule of Thumbs: Evidence from a Field Experiment”, mimeo.
Emran, M. Sahe, AKM Mahbub Morshed and Joseph Stiglitz. 2007. “Microfinance and
Missing Markets”, mimeo.
Fafchamps, Marcel, David Mckenzie, Simon Quinn and Christopher Woodruff. 2011.
“When is capital enough to get female enterprises growing? Evidence from a randomized
experiment in Ghana”. World Bank Working Paper Series 5706.
Field, Erica, Seema Jayachandran and Rohini Pande. 2010. “Do Traditional Institutions
Constrain Female Entrepreneurship? A Field Experiment on Business Training in India.”
American Economic Review Papers and Proceedings forthcoming.
Giné, Xavier and Robert M. Townsend. 2004. “Evaluation of Financial Liberalization: A
General Equilibrium Model with Constrained Occupation Choice.” Journal of
Development Economics 74: 269-307.
Giné, Xavier, Ghazala Mansuri and Mario Picón. Forthcoming. “Does a Picture Paint a
Thousand Words? Evidence from a Microcredit Marketing Experiment”, World Bank
Economic Review.
Gneezy, Uri, Kenneth L. Leonard, and John A. List. 2009. “Gender Differences in
Competition: Evidence from a Matrilineal and a Patriarchal Society.” Econometrica 77
(5): 1637–64.
Goheer, Nabeel A. 2003. Women Entrepreneurs in Pakistan: How to Improve Their
Bargaining Power. Geneva: International Labour Organisation.
Holtz-Eakin, D., D. Joulfaian and H. S. Rosen. 1994a. “Sticking it Out: Entrepreneurial
Survival and Liquidity Constraints” Journal of Political Economy 102(1): 53-75.
Holtz-Eakin, D., D. Joulfaian and H. S. Rosen. 1994b. “Entrepreneurial Decisions and
Liquidity Constraints”, Rand Journal of Economics, 23 (2): 334-347.
Hussein, Maliha and Shazreh Hussein. 2003. “The Impact of Micro Finance on Poverty
and Gender Equity: Approaches and Evidence from Pakistan,” Pakistan Micro Finance
Network working paper.
Hsieh, Chang-Tai and Peter Klenow. 2009. “Misallocation and Manufacturing TFP in
China and India.” Quarterly Journal of Economics, 124(4): 1403–1448.
International Labor Organization. 2010. Women in Labor Markets: Measuring Progress
and Identifying Challenges. ILO: Geneva.
30
Kamal, Samina. 1997. Women, empowerment and poverty alleviation in South Asia: The
dual benefits of Microcredit South Asia Poverty Alleviation Program, UNDP.
Karlan, Dean S, and Martin Valdivia. 2010. “Teaching Entrepreneurship: Impact of
Business Training on Microfinance Clients and Institutions.” Review of Economics and
Statistics forthcoming.
King, Robert G. and Ross Levine. 1993. “Finance and Growth: Schumpeter Might be
Right.” Quarterly Journal of Economics, 108(3): 717-737.
Kling, Jeffrey R, Jeffrey B Liebman, and Lawrence F Katz. 2007. “Experimental
Analysis of Neighborhood Effects.” Econometrica 75:83-119.
Knight, F. 1921. Risk, Uncertainty, and Profit. Boston: Houghton Mifflin.
Lee, David S. 2002. “Trimming for Bounds on Treatment Effects with Missing
Outcomes.” NBER Technical Working Paper 277.
Lucas, Robert E. 1978. “On the size distribution of business firms.” Bell Journal of
Economics 9(2): 508-523.
Mead, Donald and Carl Liedholm. 1998. “The Dynamics of Micro and Small Entreprises
in Developing Countries” World Development, 26 (1): 61-74.
Moulton, Brent, “Random Group Effects and the Precision of Regression Estimates”
Journal of Econometrics, 32, 3, August 1986, p. 385-397.
Nenova, T., and C. Nenang, with A. Ahmad. 2009. Bringing Finance to Pakistan’s Poor:
A Study on Access to Finance for the Underserved and Small Enterprises. World Bank
report. Washington, DC: World Bank.
Paulson, A. R. Townsend and A. Karaivanov. 2006. “Distinguishing Limited Liability
from Moral Hazard in a Model of Entrepreneurship.” Journal of Political Economy,
144(1): 100-144.
Roomi, Muhammad Azam. 2005. Women Entrepreneurs in Pakistan: Profile, Challenges
and Practical Recommendations. University of London, School of Management.
Rubin, D.B. 1974. “Estimating causal effects of treatments in randomized and
nonrandomized studies.” Journal of Educational Psychology 66: 688–701
Sathar, Z. A. and S. Kazi. 1997. Women's Autonomy, Livelihood and Fertility. A Study
of Rural Punjab. Islamabad: Pakistan Institute of Development Studies.
Schoar, Antoinette. 2010. “The Divide between Subsistence and Transformational
31
Entrepreneurship.” in Innovation Policy and the Economy vol. 10. Chicago: National
Bureau of Economic Research, pp. 57-81.
Schumpeter, J. A. 1942. Capitalism, Socialism, and Democracy. New York:Harper,
1942.
Sen, A. 1999. Development and Freedom, New York, Anchor Books.
Solow, R. 1957. “Technical Change and the Aggregate Production Function.” Review of
Economics and Statistics 39(3): 312-20.
UNDP. 1998, Human Development Report 1998: Consumption for Human
Development. New York: Oxford University Press.
Yunus, M. 1999. Banker to the Poor. London: Aurum Press Ltd.
Woodruff, Christopher. 2006. “Self-employment: Engine of Growth or Self-help Safety
Net?” Prepared for the World Bank Conference on “Rethinking the Role of Jobs for Shared
Growth”.
World Bank. 2008. “Finance for All? Policies and Pitfalls in Expanding Access”, World
Bank: Washington, DC.
32
Figure 1. Pakistan Study Districts
Northern Areas
Jammu & Kashmir
Disputed Territory
NWFP
Attock
PUNJAB
Bahawalpur
BALOCHISTAN
SINDH
Hyderabad
Figure 2. Timeline
Nov 06
Baseline Survey
Jan 07
Feb‐May 07
Orientation BT Rollout
for BT
Nov 07
Oct 07 Jan 08
Hand Holding
June 08
Loan Lottery
Dec 08 Nov 09
Follow‐up MIS Survey data
Table 1. Summary Statistics
N. Obs
Member
Age
Years of Education
Male (1=yes)
Married (1=yes)
Digit Span Recall
Index of Optimism
Index of Business Knowledge
Index of Female Mobility
Index of No Purdah
Risk Tolerance (0-10)
Months as CO member
Interested in Training (1=Yes)
Holds office in CO (1=Yes)
Business at baseline (1=Yes)
Eligibility for Loan Lottery (1=Yes)
Household
Household Size
Fraction of CO Members of same Zaat (caste)
Ever in Business (1=Yes)
Household member has held hereditary or political office (1=Yes)
Land (acres)
Distance to CO meeting place
Credit Constraints (1=Yes)
Log Household Expenditures
Decision-making power (0-8)
Member has a Bank Account (1=Yes)
Self-employment (1=Yes)
Business
Agribusiness, Dairy, Livestock (1=Yes)
Retail and Food Services (shopkeeping) (1=Yes)
Handicraft, Tailoring, Vocational Trade (1=Yes)
Other (1=Yes)
Business has fixed location (1=Yes)
Operates all months (1=Yes)
Purchase credit (1=Yes)
Records sales (1=Yes)
Records Money taken from business (1=Yes)
Number of Workers
Paid Workers (1=Yes)
Log Good Month Sales
Log Average Month Sales
Log Bad Month Sales
Mean
Std. Dev. 10th Pct.
All members
(3)
(4)
Median
90th Pct.
(5)
(6)
Male
(7)
Female
(8)
P-val of Ttest
(7)=(8)
(9)
Mean
(1)
(2)
4,160
4,160
4,160
4,160
4,160
4,160
4,160
2,020
2,020
4,160
4,160
4,160
4,160
4,160
4,160
37.6
3.92
0.51
0.89
3.22
0.00
0.00
0.00
0.00
3.53
25.2
0.58
0.21
0.61
0.55
12.0
4.49
0.50
0.31
2.27
1.49
1.18
1.34
1.71
3.00
23.4
0.49
0.41
0.49
0.48
23.0
0.00
0.00
0.00
0.00
-1.94
-1.51
-1.11
-2.58
0.00
5.0
0.00
0.00
0.00
0.00
35.0
2.00
1.00
1.00
4.00
0.11
0.23
-1.11
0.96
4.00
19.0
1.00
0.00
1.00
0.00
55.0
12.00
1.00
1.00
6.00
2.22
1.40
2.69
1.72
8.00
52.0
1.00
1.00
1.00
1.00
37.8
5.23
0.84
3.81
0.21
0.14
3.76
27.4
0.65
0.22
0.62
0.58
37.3
2.45
0.94
2.60
-0.34
-0.14
0.00
0.00
3.29
22.9
0.50
0.20
0.60
0.52
0.31
0.00
0.00
0.00
0.00
0.00
0.00
0.00
0.00
0.18
0.01
0.00
4,160
4,160
4,160
4,160
4,160
4,160
4,160
4,160
4,160
4,160
4,160
5.57
0.36
0.61
0.12
3.91
7.94
0.13
8.27
2.56
0.10
0.48
2.87
0.35
0.49
0.33
17.14
7.11
0.33
0.62
3.07
0.30
0.49
2.00
0.00
0.00
0.00
0.01
2.50
0.00
7.31
0.00
0.00
0.00
5.00
0.21
1.00
0.00
0.13
10.00
0.00
8.00
1.00
0.00
0.00
9.00
0.94
1.00
1.00
8.88
23.00
1.00
9.10
8.00
0.00
1.00
5.87
0.47
0.62
0.15
5.52
7.40
0.12
8.28
3.31
0.13
0.59
5.26
0.25
0.60
0.09
2.22
8.51
0.15
8.26
1.76
0.06
0.35
0.00
0.00
0.52
0.00
0.00
0.00
0.01
0.14
0.00
0.00
0.00
2,532
2,532
2,532
2,532
0.38
0.23
0.33
0.06
0.48
0.42
0.47
0.24
0.00
0.00
0.00
0.00
0.00
0.00
0.00
0.00
1.00
1.00
1.00
0.00
0.53
0.28
0.09
0.09
0.20
0.18
0.58
0.03
0.00
0.00
0.00
0.00
2,532
2,532
2,532
2,532
2,532
2,532
2,532
2,532
2,532
2,532
0.94
0.80
0.70
0.17
0.17
2.43
0.10
8.74
8.27
7.73
0.24
0.40
0.46
0.37
0.38
1.98
0.29
1.28
1.24
1.30
1.00
0.00
0.00
0.00
0.00
1.00
0.00
7.09
6.68
6.21
1.00
1.00
1.00
0.00
0.00
2.00
0.00
8.60
8.19
7.60
1.00
1.00
1.00
1.00
1.00
4.00
0.00
10.60
9.90
9.39
0.90
0.81
0.67
0.22
0.22
2.51
0.14
9.31
8.81
8.30
0.97
0.78
0.72
0.11
0.11
2.34
0.05
8.12
7.67
7.12
0.00
0.00
0.02
0.00
0.00
0.24
0.00
0.00
0.00
0.00
Note: Data come from baseline survey of November 2006. See Appendix B for definiton of variables. Column 1 reports the number of observations. Index of female mobility and
Index of Purdah have 2,020 observations because only females answer the question. Similarly, there are 2,532 businesses in the sample. Column 9 reports the p-value of the t-test of the
difference between columns 7 and 8.
Table 2. Randomization Check
Means
N. Obs
(1)
BT
(2)
P-val of ttest
No BT
(2)=(3)
N. Obs
(3)
(4)
(5)
Means
Winner
Loser
(6)
(7)
P-val of ttest
(5)=(6)
(8)
38.2
4.32
0.54
0.93
3.31
0.00
0.06
0.02
-0.02
-0.09
-0.06
-0.02
0.02
-0.09
3.57
26.7
0.58
0.21
0.66
-
37.8
4.24
0.55
0.90
3.26
0.06
-0.04
0.00
-0.07
0.02
-0.03
-0.06
0.00
0.20
3.56
25.7
0.58
0.22
0.66
-
0.39
0.72
0.17
0.03
0.61
0.06
0.06
0.58
0.29
0.01
0.31
0.30
0.98
0.18
0.90
0.22
0.59
0.68
0.56
-
Member
Age
Years of Education
Male (1=yes)
Married (1=yes)
Digit Span Recall
Index of Optimism
Index of Stress
Index of Openness
Index of Extroversion
Index of Agreebleaness
Index of Emotional Stability
Index of Business Knowledge
Index of Female Mobility
Index of No Purdah
Risk Tolerance
Months as CO member
Interested in Training
Holds office in CO
Business at Baseline (1=Yes)
Eligibility
4,160
4,160
4,160
4,160
4,160
4,160
4,160
4,160
4,160
4,160
4,160
4,160
2,020
2,020
4,160
4,160
4,160
4,160
4,160
4,160
37.3
4.15
0.49
0.89
3.16
-0.11
0.06
-0.02
0.01
0.04
0.02
0.13
0.04
-0.07
3.45
23.9
0.63
0.22
0.64
0.55
37.9
4.20
0.54
0.89
3.29
0.10
-0.07
0.02
-0.01
-0.05
-0.03
-0.13
-0.05
0.08
3.63
26.7
0.52
0.19
0.59
0.55
0.63
0.42
0.35
0.28
0.23
0.23
0.22
0.11
0.34
0.12
0.98
0.31
0.67
0.35
0.65
0.38
0.23
0.06
0.11
0.77
2,283
2,283
2,283
2,283
2,283
2,283
2,283
2,283
2,283
2,283
2,283
2,283
1,044
1,044
2,283
2,283
2,283
2,283
2,283
2,283
Household
5.57
5.58
0.54
2,283
5.51
5.60
0.74
Household Size
4,160
Fraction of CO Members of same Zaat (caste)
4,160
0.36
0.31
0.41
2,283
0.33
0.32
0.49
Ever in Business (1=Yes)
4,160
0.62
0.60
0.31
2,283
0.62
0.64
0.49
Household member has held hereditary or political office (1=Yes)
4,160
0.11
0.13
0.24
2,283
0.12
0.12
0.96
Land (acres)
4,160
4.01
3.79
0.59
2,283
3.01
3.88
0.19
Distance to CO meeting place
4,160
7.90
8.00
0.15
2,283
8.15
8.15
0.92
Credit Constraints (1=Yes)
4,160
0.14
0.12
0.07
2,283
0.14
0.12
0.33
Log of Household Expenditures
4,160
8.27
8.27
0.76
2,283
8.23
8.26
0.15
Decision-making power
4,160
2.61
2.51
0.89
2,283
2.76
2.59
0.13
Member has a bank account
4,160
0.10
0.10
0.95
2,283
0.10
0.11
0.58
Self-employment (1
(1=Yes)
Yes)
4,160
0.46
0.50
0.17
2,283
0.52
0.51
0.41
Business
Sector
0.37
0.38
0.32
1,507
0.41
0.40
0.77
Agribusiness, Dairy, Livestock (1=Yes)
2,532
0.23
0.24
0.22
1,507
0.23
0.27
0.02
Retail and Food Services (shopkeeping) (1=Yes)
2,532
0.33
0.32
0.23
1,507
0.30
0.26
0.03
Handicraft, Tailoring, Vocational Trade (1=Yes)
2,532
0.08
0.05
0.03
1,507
0.06
0.06
0.89
Other (1=Yes)
2,532
Business Operation
Business has fixed location (1=Yes)
2,532
0.94
0.93
0.54
1,507
0.93
0.94
0.36
Operates all months (1=Yes)
2,532
0.79
0.80
0.15
1,507
0.80
0.81
0.62
Business Practices
Purchase on credit allowed (1=Yes)
2,532
0.70
0.70
0.57
1,507
0.68
0.67
0.58
Records sales (1=Yes)
2,532
0.18
0.16
0.64
1,507
0.17
0.18
0.45
Records Money taken from business (1=Yes)
2,532
0.18
0.16
0.20
1,507
0.18
0.18
0.94
Employment and sales
Number of Workers
2,532
2.50
2.35
0.67
1,507
2.50
2.46
0.74
Paid Workers (1=Yes)
2,532
0.10
0.09
0.39
1,507
0.09
0.10
0.50
Log Good Month Sales
2,532
8.74
8.75
0.03
1,507
8.81
8.85
0.40
Log Average Month Sales
2,532
8.25
8.29
0.01
1,507
8.32
8.36
0.43
Log Bad Month Sales
2,532
7.70
7.77
0.01
1,507
7.77
7.84
0.18
Note: Data come from baseline survey of November 2006. See Appendix B for definition of variables. Columns 4 and 8 report the p-value of the t-test of the
difference between columns 2 and 3 and columns 6 and 7, respectively.
Table 3. Business Outcomes
OLS
Panel A: Intent to Treat Effect
Business Training (1=Yes)
Lottery Winner (1=Yes)
BT and LW
Business
Knowledge
(1)
New Business
CO member
involved
(1=Yes)
(2)
New Business
CO member
Aggregate
not involved Main Business Business
(1=Yes)
Failed (1=Yes) Practices
(3)
(4)
(5)
Aggregate
Business
Operations
(6)
Aggregate Sales
and Profits
(7)
0.058*
(0.031)
-0.014
(0.037)
0.075*
(0.038)
-0.006
(0.008)
-0.012
(0.013)
-0.004
(0.013)
-0.001
(0.012)
-0.007
(0.019)
0.010
(0.018)
-0.034
(0.028)
-0.002
(0.036)
-0.014
(0.037)
0.131**
(0.062)
0.099
(0.082)
0.166**
(0.079)
0.043
(0.027)
0.081**
(0.035)
0.047
(0.035)
-0.021
(0.054)
0.013
(0.071)
-0.080
(0.066)
0.01
0.01
0.03
0.06
0.09
0.33
0.88
0.53
0.59
0.51
0.42
0.77
0.55
0.77
0.37
0.61
0.45
0.69
0.89
0.40
0.29
0.32
0.26
0.66
-0.011
(0.013)
0.013
(0.017)
-0.019
(0.018)
0.016
(0.023)
-0.016
(0.016)
0.028
(0.024)
-0.012
(0.016)
0.023
(0.025)
-0.015
(0.024)
0.017
(0.035)
-0.017
(0.020)
0.062*
(0.036)
-0.061*
(0.037)
0.060
(0.055)
-0.004
(0.045)
0.000
(0.068)
-0.047
(0.046)
0.077
(0.069)
0.122
(0.085)
0.018
(0.118)
0.061
(0.105)
0.097
(0.150)
0.246**
(0.102)
-0.225
(0.138)
0.067*
(0.036)
-0.061
(0.052)
0.095**
0.095
(0.046)
-0.034
(0.067)
0.084*
(0.044)
-0.098
(0.069)
0.023
(0.070)
-0.111
(0.102)
-0.008
(0.092)
0.065
(0.138)
-0.07
(0.085)
-0.022
(0.128)
R-Squared
0.09
P-value of t - test of ...
BT = BT and LW
0.63
LW = BT and LW
0.03
BT = LW
0.05
Panel B: Intent to Treat Effects with Gender Interactions
Business Training (1=Yes)
0.058
(0.043)
BT x Female
0.000
(0.062)
Lottery Winner (1
(1=Yes)
Yes)
0.014
(0.045)
LW x Female
-0.066
(0.073)
BT and LW
0.066
(0.051)
BT and LW x Female
0.021
(0.073)
R-Squared
P-value of t - test of ...
BT = BT and LW
LW = BT and LW
BT = LW
0.09
0.01
0.01
0.03
0.06
0.09
0.34
0.87
0.32
0.35
0.74
0.86
0.63
0.77
0.92
0.90
0.75
0.40
0.20
0.17
0.11
0.55
0.64
0.82
0.54
0.20
0.57
0.76
BT + BT x Female = 0
LW + LW x Female = 0
BT and LW = BT and LW x Female = 0
Mean of dependent variable among controls
N. Observations
0.19
0.38
0.12
0.02
3494
0.88
0.85
0.53
0.04
3494
0.56
0.94
0.14
0.1
3494
0.98
0.34
0.58
0.38
2137
0.10
0.18
0.84
0.11
1333
0.88
0.22
0.79
-0.04
1333
0.26
0.58
0.35
0.43
1333
Note: The reported mean of the dependent variable is computed using CO members not offered business training nor chosen as winners of the lottery.The dependent variables
are aggregates of standardized z-scores. See Appendix B for a definition of the aggregates. All regressions are estimated using OLS methods and include as covariates the
stratification variables (eligibility for loan lottery, business ownership at baseline, gender and branch dummies). Standard errors reported in parentheses are clustered at the CO
level. The following symbols *, * * and ** * denote significance at the 10 , 5, and 1 percent level, respectively.
Table 4. Bound Analysis for Male Business Owners
OLS
Lower Bound
(1)
Unadjusted
Treatment Effect
(2)
-0.043
(0.043)
0.017
(0.044)
-0.003
(0.037)
0.003
(0.042)
0.075*
(0.045)
0.067*
(0.039)
0.06
(0.042)
0.122***
(0.046)
0.103**
(0.041)
-0.043
(0.050)
-0.188**
(0.080)
0.058
(0.049)
0.114
(0.086)
0.193***
(0.050)
0.410***
(0.084)
0.043
(0.030)
-0.011
(0.040)
0.055*
(0.028)
0.016
(0.039)
0.084***
(0.025)
0.095***
(0.036)
-0.217
(0.222)
0.319
(0.210)
1.076***
(0.166)
Investment in Marketing (1=Yes)1
-0.087***
(0.018)
-0.018
(0.023)
0.001
(0.025)
Business is open to the public (1=yes)1
-0.199***
(0.049)
-0.107**
(0.049)
0.056
(0.048)
H secured
Has
d bbuyer (1
(1=Yes)
Y )1
-0.100***
0 100***
(0.036)
0.106***
0
106***
(0.040)
0.176***
0
176***
(0.044)
-0.138
(0.136)
-0.046
(0.035)
0.005
(0.130)
0.062*
(0.036)
0.065
(0.146)
0.184***
(0.034)
-0.027
(0.121)
-0.006
(0.093)
-0.084
(0.095)
-0.078
(0.108)
0.178
(0.132)
0.13
(0.097)
0.047
(0.098)
0.052
(0.112)
0.290**
(0.134)
0.268***
(0.092)
0.187**
(0.091)
0.190*
(0.105)
Log Sales November 20081
-0.510***
(0.159)
0.061
(0.151)
0.596***
(0.132)
Log Profit1
-0.596***
(0.193)
-0.179***
(0.066)
-0.044
(0.187)
0.027
(0.072)
0.636***
(0.155)
0.245***
(0.067)
Business Practices
Allows purchases on credit (1=Yes)
Recorded sales last month (1=Yes)
Records money taken for household needs (1=Yes)
Record anything (1=Yes)1
Aggregate Business Practices
Business Operation
Business has fixed location (1=Yes)
Operates all months of the year (1=Yes)
Index of Business Appearance1
Index of business assets1
Aggregate Business Operations
Employment, Sales and Profits
Number of Workers
Log Sales in a Good Month
Log Sales Average Month
Log Sales in a Bad Month
Aggregate Sales and profits
Upper Bound
(3)
Note:1 Variable collected only during follow-up. Aggreggate variables for each family of outcomes are averages of the
standardized z-score of each variable in the family. See Appendix B for a definition of the aggregates. All regressions control for
eligibility for loan lottery, and include dummies for business category and branch. Standard errors are clustered at the CO level.
The following symbols *,** and *** denote significance at the 10, 5 and 1 percent level, respectively. Bounds are computed
based on Lee (2002).
Table 5. Individual and Household Outcomes
OLS
Income and
Assets
CO Cohesion
(1)
(2)
Panel A: Intent to Treat Effect
Business Training (1=Yes)
Outlook on Life
(3)
DecisionMaking
(4)
0.070***
(0.021)
0.036
(0.027)
0.069**
(0.029)
0.089***
(0.027)
0.037
(0.032)
0.084**
(0.039)
0.082***
(0.024)
0.074**
(0.029)
0.115***
(0.032)
0.082
(0.080)
-0.021
(0.113)
-0.027
(0.116)
0.44
0.02
0.08
0.03
0.99
0.30
0.25
0.88
0.28
0.14
0.25
0.22
0.79
0.32
0.97
0.38
0.094***
(0.028)
-0.056
(0.041)
0.046
((0.036))
-0.02
(0.050)
0.144***
(0.038)
-0.167***
(0.051)
0.102***
(0.039)
-0.031
(0.053)
0.032
((0.037))
0.012
(0.061)
0.145**
(0.060)
-0.139**
(0.068)
0.050
(0.033)
0.067
(0.047)
0.058
((0.039))
0.032
(0.054)
0.115***
(0.040)
0.000
(0.059)
0.123
(0.123)
-0.083
(0.162)
0.045
((0.163))
-0.146
(0.205)
-0.067
(0.161)
0.096
(0.207)
R-Squared
0.45
0.02
0.08
0.03
P-value of t - test of ...
BT = BT and LW
LW = BT and LW
BT = LW
0.31
0.54
0.91
0.13
0.05
0.39
0.08
0.20
0.84
0.20
0.55
0.64
BT + BT x Female = 0
LW + LW x Female = 0
BT and LW = BT and LW x Female = 0
Mean of dependent variable among controls
N. Observations
0.63
0.14
0.45
-0.03
3494
0.05
0.39
0.87
-0.05
3494
0.00
0.03
0.01
-0.12
3494
0.70
0.46
0.84
0.23
3494
Lottery Winner (1=Yes)
BT and LW
R-Squared
P-value of t - test of ...
BT = BT and LW
LW = BT and LW
BT = LW
Panel B: Intent to Treat Effects with Gender Interactions
Business Training (1=Yes)
BT x Female
Lottery Winner (1=Yes)
LW x Female
BT and LW
BT and LW x Female
Note: The reported mean of the dependent variable is computed using CO members not offered business training nor chosen as winners of the
lottery.The dependent variables are aggregates of standardized z-scores. See Appendix B for a definition of the aggregates. All regressions are
estimated using OLS methods and include as covariates the stratification variables (eligibility for loan lottery, business ownership at baseline
and gender). Standard errors reported in parentheses are clustered at the CO level. The following symbols *, * * and ** * denote significance at
the 10 , 5, and 1 percent level, respectively.
Table 6. Time Allocation
Tobit
CO member
Business
Paid Work
Agriculture
(1)
(2)
(3)
Panel A: Intent to Treat Effect
Business Training (1=Yes)
Lottery Winner (1=Yes)
BT and LW
1.571
(1.047)
-0.044
(1.389)
1.32
(1.307)
R- square
0.07
P-value of t - test of ...
BT = BT and LW
0.83
LW = BT and LW
0.36
BT = LW
0.25
Panel B: Intent to Treat Effects with Gender Interactions
Business Training (1=Yes)
2.119
(1.376)
BT x Female
-1.292
(2.117)
Lottery Winner (1=Yes)
-0.385
(1 642)
(1.642)
LW x Female
0.904
(2.705)
BT and LW
2.299
(1.593)
BT and LW x Female
-2.383
(2.517)
Business
(4)
Spouse of CO member
Paid Work
Agriculture
(5)
(6)
-0.451
(2.048)
-2.867
(2.621)
2.864
(2.733)
0.616
(1.325)
-0.264
(1.470)
-1.033
(1.621)
-0.659
(0.609)
-0.709
(0.835)
0.822
(0.855)
-0.374
(2.051)
0.011
(3.065)
-1.613
(2.895)
-1.45
(1.415)
1.579
(1.655)
-4.552**
(1.867)
0.04
0.04
0.03
0.01
0.03
0.19
0.06
0.40
0.24
0.66
0.58
0.06
0.11
0.95
0.65
0.63
0.90
0.06
0.00
0.09
0.513
(2.477)
-2.346
(4.279)
-3.428
(2 993)
(2.993)
2.218
(5.248)
0.577
(3.237)
6.81
(5.115)
1.349
(1.548)
-2.252
(2.693)
2.198
(1 695)
(1.695)
-7.281**
(3.034)
2.976
(1.863)
-11.755***
(3.541)
0.116
(0.932)
-1.546
(1.189)
-0.995
(1 150)
(1.150)
0.766
(1.508)
0.637
(1.192)
0.462
(1.536)
3.671
(3.009)
-7.282*
(4.005)
-0.72
(4 681)
(4.681)
1.77
(5.924)
-2.956
(4.301)
2.532
(5.272)
-0.927
(1.688)
-1.655
(2.878)
2.464
(1 862)
(1.862)
-2.626
(3.405)
-1.581
(2.071)
-9.142**
(4.051)
R-square
P-value of t - test of ...
BT = BT and LW
LW = BT and LW
BT = LW
0.07
0.04
0.04
0.03
0.01
0.03
0.90
0.14
0.15
0.98
0.27
0.25
0.32
0.70
0.65
0.72
0.61
0.64
0.10
0.68
0.34
0.72
0.09
0.11
BT + BT x Female = 0
LW + LW x Female = 0
BT and LW = BT and LW x Female = 0
Mean of dependent variable among controls
N. Observations
0.61
0.82
0.97
-11.85
3494
0.60
0.79
0.09
-17.43
3494
0.69
0.05
0.00
-12.61
3494
0.63
0.74
0.45
-6.63
3494
0.18
0.79
0.91
-17.63
3494
0.28
0.96
0.00
-14.4
3494
Note: The reported mean of the dependent variable is computed using CO members not offered business training nor selected as winners of the lottery. The dependent variable
in columns 1-3 are log of hours spent by the CO member in various activities the day prior to the survey. The dependent variable in columns 4-6 are log of hours spent by the
spouse of CO member in various activities the day prior to the survey. All regressions are estimated using Tobit and include as covariates the stratification variables (eligibility
for loan lottery, business ownership at baseline, gender and branch dummies). Standard errors reported in parentheses are clustered at the CO level. The following symbols *,
* * and ** * denote significance at the 10 , 5, and 1 percent level, respectively.
Table 7. Repayment Outcomes
OLS
Before Loan Lottery
Loan
Amount
(Logs)
Panel A: Intent to Treat Effects
Business Training (1=Yes)
During and after Loan Lottery
Amount due as
% of principal
Loan Past Due (1=Yes)
(1)
At
Maturity
(2)
After 90
days
(3)
At
Maturity
(4)
After 90
days
(5)
0.149**
(0.070)
0.02
(0.041)
-0.022*
(0.012)
0.029
(0.026)
0.000
(0.000)
0.05
0.05
0.07
0.05
Lottery Winner (1=Yes)
BT and LW
R-Squared
0.21
P-value of t - test of ...
BT = BT and LW
LW = BT and LW
BT = LW
Panel B: Intent to Treat Effects with Gender Interactions
Business Training (1=Yes)
0.237***
((0.079))
BT x Female
-0.414***
(0.138)
Lottery Winner (1=Yes)
0.035
((0.050))
-0.069
(0.057)
-0.018
((0.014))
-0.017
(0.036)
0.035
((0.032))
-0.029
(0.028)
0.000
((0.000))
0.000
(0.000)
0.05
0.05
0.07
0.05
LW x Female
BT and LW
BT and LW x Female
R-Squared
P-value of t - test of ...
BT = BT and LW
LW = BT and LW
BT = LW
0.26
BT + BT x Female = 0
LW + LW x Female = 0
BT and LW + BT and LW x Female = 0
Mean of dependent variable among controls
N. Observations
0.11
0.21
0.27
0.53
0.82
9.70
283
0.03
283
0.03
283
0.00
283
0.00
283
Loan
Amount
(Logs)
Amount due as
% of principal
Loan Past Due (1=Yes)
(6)
At
Maturity
(7)
After 90
days
(8)
At
Maturity
(9)
After 90
days
(10)
0.009
(0.034)
0.134***
(0.032)
0.151***
(0.044)
0.2
0.026
(0.038)
0.017
(0.026)
0.062
(0.039)
0.38
0.019
(0.038)
0.02
(0.027)
0.043
(0.038)
0.39
0.031
(0.032)
0.025
(0.025)
0.053
(0.036)
0.16
0.028
(0.032)
0.018
(0.025)
0.032
(0.034)
0.17
0.00
0.73
0.00
0.14
0.24
0.81
0.39
0.55
0.97
0.37
0.47
0.86
0.86
0.70
0.79
0.121*
((0.069))
-0.265**
(0.109)
0.439***
(0.050)
-0.245*
(0.131)
0.415***
(0.066)
-0.06
(0.105)
0.23
0.058
((0.047))
-0.105
(0.074)
0.023
(0.029)
-0.009
(0.063)
0.088*
(0.047)
-0.093
(0.076)
0.38
0.052
((0.047))
-0.107
(0.074)
0.027
(0.030)
-0.01
(0.063)
0.062
(0.046)
-0.066
(0.075)
0.39
0.071
((0.045))
-0.131***
(0.049)
0.025
(0.030)
0.029
(0.045)
0.073
(0.047)
-0.073
(0.061)
0.17
0.069
((0.045))
-0.132***
(0.050)
0.015
(0.030)
0.039
(0.045)
0.046
(0.045)
-0.045
(0.060)
0.18
0.00
0.70
0.00
0.28
0.16
0.45
0.77
0.44
0.59
0.94
0.31
0.31
0.44
0.51
0.24
0.09
0.11
0.00
9.83
1497
0.42
0.81
0.93
0.44
1497
0.34
0.76
0.94
0.44
1496
0.00
0.14
0.99
0.15
1497
0.00
0.13
0.97
0.15
1496
Note: The dependent variables come from administrative records from the lender. See Appendix B for a definition of the variables. All regressions are run using OLS methods and
include as covariates the stratification variables (eligibility for loan lottery, business ownership at baseline, gender and branch dummies). Standard errors reported in parentheses are
clustered at the CO level. The following symbols *, * * and ** * denote significance at the 10 , 5, and 1 percent level, respectively.
Table 8. Selection Effect of Business Training on Loan Uptake
(1)
During and
After
Lottery
(2)
-0.003
(0.024)
-0.016
(0.327)
-0.100
(0.225)
0.09
0.059**
(0.027)
-0.332**
(0.169)
0.634***
(0.161)
0.21
0.002
(0.038)
0.159
(0.510)
-0.005
(0.045)
0.615
(0.466)
-0.351
0 351
(0.663)
-0.368
(0.352)
0.078**
(0.034)
-0.574**
(0.265)
-0.032
(0.063)
-0.605**
(0.297)
0 357
0.357
(0.374)
0.934***
(0.205)
Before
Lottery
Panel A: Intent to Treat Effects
Business Training (1=Yes)
BT x Prob. Default
Prob. Default
R-Squared
Panel B: Intent to Treat Effects with Gender Interactions
Business Training (1=Yes)
BT x Prob. Default
BT* Female
Prob. Default * Female
BT x Prob.
P b D
Default
f l xF
Female
l
Prob. Default
R-Squared
P-value of t - test of ...
BT= BT x Female
BT x Prob. Default = BTx Prob. Default x Female
0.09
0.21
0.61
0.72
0.18
0.08
Mean of dependent variable among controls
N. Observations
0.21
4,160
0.27
4,160
Note: The reported mean of the dependent variable is computed using CO members not offered
business training nor chosen as winners of the lottery.The dependent variable is a dummy that
takes value 1 if individual applied for a loan before the loan lottery (column 1) or during and
after the loan lottery (column 2). See Appendix B for a definition of the variables. All
regressions are estimated using OLS methods and include as covariates the stratification
variables (eligibility for loan lottery, business ownership at baseline, gender and branch
dummies). Standard errors reported in parentheses are bootstrapped with 200 samples. The
following symbols *, * * and ** * denote significance at the 10 , 5, and 1 percent level,
respectively.
Table 9. Children Schooling Outcomes
OLS
All Children 9-15 years
Boys 9-15
Panel A: Intent to Treat Effect
Business Training (1=Yes)
Lottery Winner (1=Yes)
BT and LW
Enrollment
(1)
Absent last
school day
(1=Yes)
(2)
Work for
Income
(1=Yes)
(3)
-0.012
(0.020)
-0.026
(0.022)
-0.017
(0.024)
0.04
-0.003
(0.025)
0.073*
(0.038)
-0.024
(0.034)
0.04
Enrollment
(4)
Absent last
school day
(1=Yes)
(5)
Work for
Income
(1=Yes)
(6)
0.025
(0.024)
0.010
(0.033)
0.029
(0.033)
0.06
-0.021
(0.021)
-0.030
(0.027)
-0.007
(0.028)
0.05
0.009
(0.028)
0.077*
(0.041)
-0.039
(0.039)
0.04
0.52
0.02
0.05
0.88
0.60
0.67
0.62
0.47
0.75
-0.027
(0.034)
0.051
(0
(0.049)
049)
0.084*
(0.047)
-0.027
(0.071)
-0.04
(0.044)
0.035
(0.062)
-0.02
(0.030)
0.096**
(0 046)
(0.046)
-0.027
(0.041)
0.085
(0.060)
-0.015
(0.041)
0.1
(0.065)
0.04
0.04
0.98
0.33
0.28
0.77
0.02
0.02
R-Squared
P-value of t - test of ...
BT = BT and LW
0.82
LW = BT and LW
0.72
BT = LW
0.57
Panel B: Intent to Treat Effects with Gender Interactions
Business Training (1=Yes)
0.006
(0.028)
BT x Female
-0.039
(0 041)
(0.041)
Lottery Winner (1=Yes)
-0.032
(0.028)
LW x Female
0.016
(0.041)
BT and LW
0.006
(0.033)
BT and LW x Female
-0.051
(0.047)
R-Squared
P-value of t - test of ...
BT = BT and LW
LW = BT and LW
BT = LW
Girls 9-15
Enrollment
(7)
Absent last
school day
(1=Yes)
(8)
Work for
Income
(1=Yes)
(9)
0.013
(0.027)
0.010
(0.038)
0.027
(0.038)
0.06
0.002
(0.029)
-0.027
(0.031)
-0.017
(0.034)
0.04
-0.015
(0.030)
0.065
(0.050)
-0.002
(0.044)
0.05
0.041*
(0.025)
0.015
(0.034)
0.039
(0.036)
0.07
0.22
0.01
0.11
0.71
0.69
0.94
0.55
0.79
0.43
0.74
0.20
0.11
0.96
0.55
0.47
-0.008
(0.030)
-0.028
(0 044)
(0.044)
-0.034
(0.034)
0.016
(0.049)
0.004
(0.037)
-0.025
(0.055)
-0.022
(0.038)
0.066
(0
(0.056)
056)
0.088*
(0.051)
-0.037
(0.076)
-0.057
(0.048)
0.042
(0.072)
-0.023
(0.035)
0.079
(0 052)
(0.052)
-0.027
(0.047)
0.091
(0.070)
-0.013
(0.045)
0.092
(0.074)
0.028
(0.042)
-0.056
(0
(0.057)
057)
-0.039
(0.040)
0.026
(0.058)
0.019
(0.049)
-0.08
(0.064)
-0.035
(0.040)
0.037
(0.059)
(0 059)
0.069
(0.065)
-0.006
(0.092)
-0.014
(0.059)
0.024
(0.081)
-0.014
(0.032)
0.116**
(0
(0.049)
049)
-0.028
(0.044)
0.094
(0.064)
-0.012
(0.046)
0.114*
(0.069)
0.06
0.05
0.04
0.06
0.04
0.05
0.07
0.88
0.78
0.87
0.76
0.36
0.48
0.47
0.01
0.05
0.81
0.79
0.94
0.84
0.28
0.18
0.71
0.26
0.11
0.95
0.75
0.76
BT + BT x Female = 0
0.25
0.52
0.03
0.27
0.29
0.16
0.48
0.95
0.01
LW + LW x Female = 0
0.61
0.33
0.22
0.65
0.39
0.26
0.78
0.38
0.18
BT and LW = BT and LW x Female = 0
0.19
0.93
0.10
0.62
0.79
0.20
0.18
0.86
0.06
Mean of dependent variable among controls
0.63
0.37
0.25
0.67
0.38
0.27
0.58
0.35
0.23
N. Observations
8572
5387
8572
4524
3026
4524
4048
2361
4048
Note: The reported mean of the dependent variable is computed using CO members not offered business training nor chosen as winners of the lottery. All regressions are estimated using OLS
methods and include as covariates the stratification variables (eligibility for loan lottery, business ownership at baseline, gender and branch dummies). Standard errors reported in parentheses
are clustered at the CO level. The following symbols *, * * and ** * denote significance at the 10 , 5, and 1 percent level, respectively.
Table A1. Attrition in Follow Up Survey
OLS
Panel A: Intent to Treat Effects
Business Training (1=Yes)
Lottery Winner (1=Yes)
BT and LW
R-Squared
P-value of t - test of ...
BT = BT and LW
LW = BT and LW
BT = LW
Panel B: Intent to Treat Effects with Gender Interactions
Business Training (1=Yes)
BT x Female
Lottery Winner (1=Yes)
LW x Female
BT and LW
BT andd LW x Female
F
l
R-Squared
P-value of t - test of ...
BT = BT and LW
LW = BT and LW
BT = LW
BT + BT x Female = 0
LW + LW x Female = 0
BT and LW = BT and LW x Female = 0
Mean of dependent variable
N. Observations
-0.022
(0.019)
-0.019
(0.019)
-0.008
(0.021)
0.03
0.43
0.60
0.88
-0.029
(0.028)
-0.038
-0.039
-0.043*
(0.024)
0.056
(0.036)
-0.021
(0.027)
0 029
0.029
(0.040)
0.03
0.49
0.37
0.11
0.12
0.66
0.77
0.16
4,160
Note: The dependent variable takes value 1 if observation is missing at
follow-up. Regressions include stratification variables as covariates
(business ownership at baseline, gender, eligibility of larger loan and
branch dummies). Standard errors are clustered at the CO level. The
following symbols *,** and *** denote significance at the 10, 5 and 1
percent level, respectively.
Table A2. Uptake of BT_Using Self Employment as Main Source of Income (excluding business utility)
OLS
All
(1)
Interest in BT
Male
Female
(2)
(3)
Interest in BT
Member has Business (1=Yes)
Uptake of BT
Male
Female
(5)
(6)
0.316*** 0.149***
(0.043)
(0.040)
0.058
0.001
(0.038)
(0.036)
-0.056*
-0.001
(0.031)
(0.033)
0.024
-0.036
(0.031)
(0.049)
0.014**
0.007
(0.006)
(0.007)
-0.000**
0
(0.000)
(0.000)
0.003
0.007
(0.004)
(0.005)
-0.002
0.004
(0.005)
(0.005)
0.032*** -0.001
(0.008)
(0.008)
0.006
0.001
(0.011)
(0.012)
-0.025
-0.022
(0.031)
(0.031)
0.079***
(0.027)
-0.006
(0.023)
-0.048*
(0.025)
0.005
(0.005)
-0.000*
(0.000)
0.018***
(0.003)
0.002
(0.004)
-0.010*
(0.006)
-0.001
(0.007)
0.018
(0.022)
0.048*
(0.028)
0.059**
(0.023)
-0.013
(0.029)
0.003
(0.006)
0
(0.000)
0.009**
(0.004)
0.007*
(0.004)
0.019***
(0.006)
-0.011
(0.008)
0
(0.026)
-0.003
(0.006)
Index of Trust
-0.006
(0.006)
Index of Optimism
-12.392
(11.643)
Index Stress/Depression
-12 381
-12.381
(11.650)
Index of Openness
0.012
(0.008)
Index of Extroversion
0.025***
(0.008)
Index of Agreeableness
0.012
(0.008)
Index of Emotional Stability
0.025***
(0.008)
Log HH Expenditure
0.018
(0.013)
Credit Constraints (1=Yes)
-0.04
(0.025)
Household member has held hereditary or political office (1=Yes) 0.011
(0.025)
Months as CO member
0
(0.000)
Fraction of CO Members of same Zaat (caste)
0.274***
(0.037)
Holds office in CO (1=Yes)
0.072***
(0.020)
Land
0
(0.000)
Distance to meeting place
-0.002
(0.001)
-0.012*
(0.007)
0.004
(0.008)
-17.427
(17.243)
-17 431
-17.431
(17.253)
0.009
(0.011)
0.028**
(0.011)
0.005
(0.011)
0.032***
(0.012)
0.011
(0.017)
-0.033
(0.037)
0.015
(0.031)
-0.001
(0.000)
0.234***
(0.040)
0.117***
(0.026)
0
(0.001)
-0.003
(0.002)
0.042***
(0.008)
-0.017**
(0.008)
0.008
(0.009)
-0.017*
(0.009)
-12.691
(15.936)
-12 675
-12.675
(15.946)
0.014
(0.012)
0.018*
(0.011)
0.016
(0.011)
0.017
(0.012)
0.028
(0.021)
-0.043
(0.032)
-0.02
(0.044)
0.002**
(0.001)
0.331***
(0.068)
0.036
(0.030)
0
(0.000)
0
(0.002)
-0.008
(0.007)
-0.007
(0.009)
-28.487*
(16.459)
-28 508*
-28.508*
(16.469)
-0.013
(0.012)
-0.009
(0.010)
0.002
(0.010)
-0.003
(0.012)
-0.033*
(0.018)
0.031
(0.031)
0.098***
(0.034)
0.002***
(0.001)
0.144***
(0.049)
0.109***
(0.024)
0
(0.000)
-0.001
(0.002)
-0.003
(0.010)
-0.025**
(0.011)
-31.291
(21.009)
-31 322
-31.322
(21.022)
-0.018
(0.017)
-0.016
(0.013)
-0.009
(0.014)
-0.002
(0.017)
-0.033
(0.022)
0.075*
(0.040)
0.079*
(0.045)
0.003***
(0.001)
0.100**
(0.050)
0.086***
(0.031)
0
(0.001)
0.005**
(0.002)
0.01
(0.011)
0.006
(0.011)
-0.008
(0.011)
0.004
(0.012)
-34.172
(24.406)
-34 188
-34.188
(24.419)
-0.01
(0.018)
-0.003
(0.016)
0.02
(0.014)
-0.007
(0.017)
-0.031
(0.028)
-0.022
(0.043)
0.132**
(0.053)
0.002
(0.001)
0.175**
(0.083)
0.105***
(0.038)
0
(0.000)
-0.004*
(0.002)
Eligibility
-0.009
(0.029)
0.005
(0.031)
0.124***
(0.027)
0.179***
(0.037)
0.096**
(0.039)
Ever in Business (1=Yes)
Self Employed by Income
Age
Age^2
Years of Education
Risk Tolerance
Digit Span Recall
Index of Knowledge of Competition
Decision-making power
Female (1=yes)
0.061***
(0.020)
0.027
(0.017)
-0.045**
(0.019)
0.007*
(0.004)
-0.000**
(0.000)
0.015***
(0.002)
0.006**
(0.003)
0.006
(0.004)
-0.008
(0.006)
0.003
(0.017)
-0.04
(0.029)
All
(4)
0.226***
(0.031)
0.031
(0.026)
-0.03
(0.023)
0.013
(0.028)
0.011***
(0.004)
-0.000**
(0.000)
0.005
(0.003)
0.001
(0.004)
0.014**
(0.006)
0.005
(0.008)
-0.021
(0.022)
0.112***
(0.035)
Index of Female Mobility
Index of No Purdah
Trust in Formal System
0.008
(0.021)
Mean of Dependent Variable
0.58
0.65
0.50
0.50
0.50
0.50
N. Observations
4160
2140
2020
2252
1110
1142
R-Squared
0.11
0.11
0.11
0.13
0.21
0.09
Note: In columns (1)-(3), the dependent variable takes value 1 if the member was interested in a hypothetical business training elicited during
baseline. In columns (4)-(6) the dependent variable takes value 1 if the member participated in business training if offered in the CO. Columns
(1) and (4) include all CO members, columns (2) and (5) male members only and columns (3) and (6) female members only. All regressions
include branch fixed effects. Standard errors are clustered at the CO level.The following symbols *,** and *** denote significance at the 10, 5
and 1 percent level, respectively. See Appendix B for definition of variables.
Table A3. Determinants of Business Failure using self-income
OLS
All
Male
(1)
(2)
Interest in training
-0.072**
-0.061
(0.035)
(0.047)
Ever in business
-0.033
0.018
(0.035)
(0.047)
Self Income
0.011
0.031
(0.035)
(0.040)
Age
-0.021**
-0.018
(0.009)
(0.012)
Age^2
0.000**
0
(0.000)
(0.000)
Education
0.003
0.003
(0.005)
(0.007)
Risk Tolerance
-0.001
-0.008
(0.006)
(0.008)
Digit Span Recall
-0.008
-0.025**
(0.009)
(0.012)
Index of Knowledge of Competition
-0.01
-0.014
(0.013)
(0.017)
Decision-making power
-0.028
-0.057
(0.034)
(0.046)
Female (1=Yes)
0.089**
(0.044)
Index of Female Mobility
Index of No Purdah
Index of Trust
Index of Optimism
Index Stress/Depression
Index of Openness
Index of Extroversion
Index of Agreeableness
Index of Emotional Stability
Log HH Expenditure
Credit Constraints (1=Yes)
Household member has held hereditary or political office (1=Yes)
Months in CO
Fraction of CO members same zaat (caste)
Holds office in CO (1=Yes)
Land
Distance
0.017
(0.013)
18.094
(25.425)
18 111
18.111
(25.440)
-0.016
(0.018)
-0.040**
(0.015)
0.02
(0.014)
0.001
(0.020)
0.002
(0.032)
0.118**
(0.054)
-0.01
(0.049)
0
(0.001)
0.073
(0.059)
-0.013
(0.041)
-0.005*
(0.003)
0.021
(0.015)
69.562*
(36.790)
69 604*
69.604*
(36.811)
-0.024
(0.027)
-0.015
(0.020)
0.021
(0.019)
-0.018
(0.029)
-0.004
(0.042)
0.051
(0.073)
0.042
(0.056)
0
(0.001)
0.039
(0.071)
-0.031
(0.060)
-0.007***
(0.002)
Female
(3)
-0.106**
(0.053)
-0.071
(0.055)
-0.035
(0.061)
-0.028*
(0.016)
0.000*
(0.000)
0.003
(0.007)
0.004
(0.009)
0.017
(0.014)
-0.007
(0.020)
0.025
(0.054)
-0.008
(0.020)
0.030**
(0.015)
0.021
(0.023)
-21.196
(36.211)
-21
-21.201
201
(36.234)
0.008
(0.025)
-0.088***
(0.025)
0.021
(0.022)
0.012
(0.028)
0.036
(0.051)
0.189**
(0.083)
-0.114
(0.093)
0
(0.001)
0.169
(0.127)
0.013
(0.063)
0.001
(0.004)
0
0.001
-0.002
(0.002)
(0.003)
(0.004)
Eligibility
-0.019
-0.016
-0.025
(0.034)
(0.046)
(0.053)
Mean of Dependent Variable
0.39
0.34
0.46
N. Observations
949
529
420
R-Squared
0.05
0.06
0.09
Notes: Dependent variable takes value 1 if the main business at baseline had failed at follow-up. Sample includes all
baseline businesses in COs that were not offered Business training. See Appendix B for definition of variables. All
regressions include branch fixed effects. Standard errors are clustered at the CO level.The following symbols *,** and ***
denote significance at the 10, 5 and 1 percent level, respectively. See Appendix B for definition of variables.
Table A4. Business Outcomes (Individual Items)
OLS, ITT
N. Obs
Mean
BT
WL
BT and WL
(1)
(2)
(3)
(4)
0.148**
(0.069)
0.02
(0.063)
0.11
(0.087)
-0.09
(0.076)
0.260***
(0.084)
-0.04
(0.079)
0.06
(0.048)
0.058*
(0.031)
-0.06
(0.064)
-0.01
(0.037)
0.004
(0.033)
0.066**
(0.033)
0.076**
(0.030)
Business Knowledge
Knowledge of Competition (index)
3494
0.44
Knowledge of bookkeeping (index)
3494
0.04
Knowledge of business concepts (index)1
3494
-0.04
Aggregate of Business Knowledge
3494
0.01
Business Practices
Allows purchases on credit (1=Yes)
1333
0.71
Recorded sales last month (1=Yes)
1333
0.15
Records money taken for household needs (1=Yes)
1333
0.15
1
1333
0.36
Aggregate Business Practices
1333
0.05
Business Operation
Business has fixed location (1=Yes)
1333
0.94
1333
0.79
1333
Investment in Marketing (1=Yes)1
P-value of P-value of
t-test
t-test
(3)=(4)
(2)=(4)
(5)
(6)
0.26
0.48
0.47
0.84
0.08
(0.062)
0.075*
(0.038)
0.30
0.05
0.64
0.45
0.028
(0.044)
0.04
(0.040)
0.021
(0.040)
0.027
(0.044)
0.041
(0.040)
0.070*
(0.041)
0.85
0.38
0.89
0.42
0.10
0.77
0.066*
(0.035)
0.131**
(0.062)
0.054
(0.046)
0.099
(0.082)
0.090**
(0.042)
0.166**
(0.079)
0.35
0.22
0.35
0.17
0.035*
(0.019)
0.048
((0.031))
-0.012
(0.025)
0.079*
((0.043))
0.039*
(0.021)
0.074*
(
)
(0.040)
0.62
0.82
0.49
0.03
0.32
0.145
(0.139)
0.012
(0.180)
0.193
(0.144)
0.63
0.74
1333
0.84
-0.032*
(0.019)
0.004
(0.027)
-0.024
(0.025)
0.89
0.29
Business is open to the public (1=yes)1
1333
0.66
-0.075**
(0.037)
0.023
(0.041)
-0.082*
(0.045)
0.57
0.10
Has secured buyer (1=Yes)1
1333
-0.80
0.083***
(0.031)
0.073*
(0.041)
0.041
(0.039)
0.17
0.36
Index of business assets1
1333
-0.07
-0.09
0.087
(0.105)
0.047
(0.035)
0.13
1333
0.178*
(0.107)
0.081**
(0.035)
0.78
Aggregate Business Operations
0.026
(0.089)
0.043
(0.027)
0.84
0.75
Sales and Profits
Log Sales in a Good Month
1333
8.74
8.29
0.85
0.28
Log Sales in a Bad Month
1333
7.76
-0.045
(0.086)
-0.101
(0.086)
-0.132
(0.103)
0.08
1333
0.172*
(0.094)
0.002
(0.097)
0.002
(0.109)
0.74
Log Sales Average Month
0.032
(0.073)
-0.023
(0.073)
-0.044
(0.083)
0.94
0.24
Log Sales November 2008
1333
9.24
-0.002
(0.116)
0.038
(0.156)
-0.318**
(0.146)
0.02
0.14
Log Profit1
1333
7.82
-0.249
(0.182)
-0.08
(0.066)
0.48
0.47
-0.323
(0.220)
0.013
(0.071)
0.68
1333
-0.121
(0.142)
-0.021
(0.054)
0.05
0.59
Record anything (1=Yes)
Operates all months of the year (1=Yes)
Index of Business Appearance
1
Aggregate Sales and profits
1
Note:1 Variable collected only during follow-up. Column 1 reports the mean of CO members not offered business training nor chosen as winners of the
lottery. Aggreggate variables for each family of outcomes are averages of the standardized z-score of each variable in the family. See Appendix B for a
definition of the aggregates. Each row in the table is from a regression of the form in Equation (1) in text. All regressions are estimated using OLS
methods and include as covariates the stratification variables (eligibility for loan lottery, business ownership at baseline, gender and branch dummies).
Standard errors reported in parentheses are clustered at the CO level. The following symbols *,, * * and ** * denote significance at the 10 , 5, and 1
percent level, respectively.
Table A5 Individual and Household Outcomes (Individual Items)
OLS, ITT
N. Obs
P-value of P-value of
t-test
t-test
(2)=(4)
(3)=(4)
Mean
BT
WL
BT and WL
(1)
(2)
(3)
(4)
(5)
(6)
3494
8.28
9.42
0.40
0.18
Housing index
3494
0.24
0.59
0.33
Log of Livestock value
3494
7.15
0.83
0.78
Aggregate of Income and Assets
3494
0.01
0.045*
(0.026)
0.327*
(0.188)
0.207**
(0.082)
-0.612**
(0.252)
0.069**
(0.029)
0.94
3494
0.02
(0.025)
0.18
(0.190)
0.10
(0.077)
0.14
(0.207)
0.04
(0.027)
0.91
Log of Savings
0.056***
(0.021)
0.14
(0.153)
0.232***
(0.059)
-0.17
(0.194)
0.070***
(0.021)
0.27
0.04
CO Cohesion
Can rely more on group members (1=Yes)
3494
0.17
0.10
0.10
0.01
Lends to CO members (1=Yes)
3494
0.03
0.57
0.03
Borrows from CO members (1=Yes)
3494
0.02
0.60
0.51
Aggregate of CO Cohesion
3494
-0.11
0.01
(0.019)
0.052***
(0.018)
0.02
(0.017)
0.01
(0.012)
0.084**
(0.039)
0.70
3494
0.02
(0.019)
0.00
(0.015)
-0.01
(0.013)
0.02
(0.012)
0.04
(0.032)
0.58
More collective action in group (1=Yes)
0.027**
(0.013)
0.029**
(0.012)
0.029**
(0.012)
0.01
(0.008)
0.089***
(0.027)
0.32
0.03
General Outlook on Life
Trust index
3494
-0.05
-0.13
0.14
0.21
Satisfaction with life index
3494
5.47
0.30
0.93
Stress/Depression Index
3494
0.08
0.71
0.44
Aggregate of Outlook on Life
3494
-0.11
0.05
(0.034)
0.158**
(0.072)
0.289***
(0.088)
-0.182**
(0.090)
0.115***
(0.032)
0.86
3494
0.02
(0.035)
0.10
(0.067)
0.189**
(0.091)
-0.12
(0.084)
0.074**
(0.029)
0.61
Optimism index
0.03
(0.026)
0.141***
(0.054)
0.191***
(0.065)
-0.170**
(0.068)
0.082***
(0.024)
0.10
0.46
Household Expenditures and Assets
Log of Monthly Expenditures
Note:1 Variable collected only during follow-up. Column 1 reports the mean of CO members not offered business training nor chosen as winners of the lottery
Aggreggate variables for each family of outcomes are averages of standardized z-scores of each variable in the family. See Appendix B for a definition of the
aggregates. Each row in the table is from a regression of the form in Equation (1) in text. All regressions are estimated using OLS methods and include as
covariates the stratification variables (eligibility for loan lottery, business ownership at baseline, gender and branch dummies). Standard errors reported in
parentheses are clustered at the CO level. The following symbols *, * * and ** * denote significance at the 10 , 5, and 1 percent level, respectively.
Table A6. Individual and Household Outcomes with other interactions
OLS
Business
Knowledge
(1)
0.034
(0.042)
0.05
(0.049)
0.032
(0.053)
-0.08
(0.070)
0.062
(0.054)
0.027
(0.065)
Income and
Assets
(2)
0.039
(0.029)
0.063*
(0.037)
0.018
(0.040)
0.035
(0.048)
-0.007
(0.039)
0.149***
(0.048)
CO
Cohesion
(3)
0.093***
(0.033)
-0.009
(0.047)
0.043
(0.045)
-0.013
(0.064)
0.041
(0.046)
0.083
(0.066)
Outlook on
Life
(4)
0.076**
(0.030)
0.012
(0.040)
0.070*
(0.039)
0.009
(0.053)
0.099**
(0.043)
0.032
(0.052)
DecisionMaking
(5)
0.054
(0.106)
0.056
(0.162)
0.005
(0.168)
-0.039
(0.246)
-0.027
(0.152)
-0.002
(0.215)
R-Squared
0.09
0.45
0.02
0.08
0.03
P-value of t - test of ...
BT = BT and LW
LW = BT and LW
BT = LW
0.59
0.62
0.97
0.21
0.58
0.61
0.24
0.97
0.31
0.58
0.54
0.87
0.57
0.87
0.77
BT + BT x Self Employed = 0
LW + LW x Self Employed = 0
BT and LW = BT and LW x Self Employed = 0
Mean of dependent variable among controls
N. Observations
0.02
0.33
0.06
0.01
3494
0.00
0.10
0.00
0.01
3494
0.03
0.50
0.03
-0.1
3494
0.01
0.05
0.00
-0.11
3494
0.37
0.83
0.86
0.12
3494
Business Training (1=Yes)
BT x Self-Employment
Lottery Winner (1=Yes)
LW x Self-Employment
BT and LW
BT and LW x Self-Employment
Note: Self-employment is defined as a dummy that takes value 1 of 50 percent of more of household income come
from self-employment activities. The reported mean of the dependent variable is computed using CO members not
offered business training nor chosen as winners of the lottery.The dependent variables are aggregates of standardized
z-scores. See Appendix B for a definition of the aggregates. All regressions are estimated using OLS methods and
include as covariates the stratification variables (eligibility for loan lottery, business ownership at baseline and gender)
and the Self-employment dummy. Standard errors reported in parentheses are clustered at the CO level. The following
symbols *, * * and ** * denote significance at the 10 , 5, and 1 percent level, respectively.
Table A7. Individual and Household Outcomes with other interactions
OLS
Business
Knowledge
(1)
0.099
(0.081)
-0.026
(0.063)
0.011
(0.104)
-0.081
(0.077)
0.091
(0.094)
0.027
(0.075)
Income and
Assets
(2)
0.083*
(0.048)
-0.05
(0.043)
0.02
(0.055)
-0.007
(0.051)
0.09
(0.068)
-0.146***
(0.054)
CO
Cohesion
(3)
0.163**
(0.064)
-0.039
(0.055)
0.054
(0.077)
0.011
(0.062)
0.185*
(0.106)
-0.138*
(0.077)
Outlook on
Life
(4)
0.114**
(0.056)
0.058
(0.047)
0.074
(0.077)
0.006
(0.057)
0.085
(0.074)
-0.003
(0.058)
DecisionMaking
(5)
0.288
(0.211)
-0.19
(0.171)
0.001
(0.340)
-0.127
(0.234)
-0.276
(0.275)
0.196
(0.218)
R-Squared
0.12
0.46
0.02
0.11
0.03
P-value of t - test of ...
BT = BT and LW
LW = BT and LW
BT = LW
0.93
00.48
48
0.40
0.92
0.34
0
34
0.26
0.83
0.26
0
26
0.19
0.69
0.90
0
90
0.59
0.04
0.48
0
48
0.41
BT + BT x Female = 0
LW + LW x Female = 0
BT and LW = BT and LW x Female = 0
Mean of dependent variable among controls
N. Observations
0.25
0.44
0.11
0.02
3494
0.44
0.82
0.33
-0.03
3494
0.02
0.38
0.43
-0.05
3494
0.00
0.20
0.21
-0.12
3494
0.56
0.65
0.72
0.23
3494
Business Training (1=Yes)
BT x Female
Lottery Winner (1=Yes)
LW x Female
BT and LW
BT and LW x Female
Note: The reported mean of the dependent variable is computed using CO members not offered business
training nor chosen as winners of the lottery.The dependent variables are aggregates of standardized z-scores.
See Appendix B for a definition of the aggregates. All regressions are estimated using OLS methods and
include as covariates the stratification variables (eligibility for loan lottery, business ownership at baseline and
gender), risk aversion, education, landholdings, digit span recall and all interactions of these with treatment
dummies. Standard errors reported in parentheses are clustered at the CO level. The following symbols *, * *
and ** * denote significance at the 10 , 5, and 1 percent level, respectively.
Table A8. Impact of Handholding
OLS
Business
Income and
Knowledge
Assets
(1)
(2)
Panel A: Intent to Treat Effect
Handholding (1=Yes)
Lottery Winner (1=Yes)
HH and LW
-0.025
(0.047)
0.001
(0.058)
0.022
(0.065)
CO Cohesion
(3)
DecisionOutlook on Life Making
(4)
(5)
-0.042
(0.038)
-0.004
(0.045)
-0.055
(0.052)
-0.01
(0.054)
-0.005
(0.076)
-0.022
(0.060)
-0.003
(0.038)
0.065
(0.050)
0.047
(0.055)
-0.164
(0.146)
-0.189
(0.193)
-0.116
(0.196)
P-value of t - test of ...
BT = BT and LW
0.42
LW = BT and LW
0.77
BT = LW
0.67
Panel B: Intent to Treat Effects with Gender Interactions
Handholding (1=Yes)
-0.056
(0.071)
HH x Female
0.063
(0.094)
Lottery Winner (1=Yes)
-0.014
(0 075)
(0.075)
LW x Female
0.027
(0.111)
HH and LW
0.017
(0.090)
HH and LW x Female
0.003
(0.123)
0.78
0.31
0.37
0.81
0.82
0.95
0.27
0.76
0.17
0.81
0.73
0.90
-0.062
(0.045)
0.045
(0.071)
0.063
(0 048)
(0.048)
-0.148*
(0.082)
-0.045
(0.066)
-0.026
(0.089)
-0.037
(0.077)
0.06
(0.099)
0.092
(0 117)
(0.117)
-0.214*
(0.125)
-0.046
(0.087)
0.053
(0.103)
0
(0.056)
0
(0.076)
0.115*
(0 062)
(0.062)
-0.107
(0.092)
0.089
(0.070)
-0.097
(0.102)
-0.151
(0.245)
-0.042
(0.302)
-0.226
(0 280)
(0.280)
0.08
(0.353)
-0.303
(0.272)
0.447
(0.378)
P-value of t - test of ...
HH = HH and LW
LW = HH and LW
HH = LW
0.34
0.74
0.59
0.79
0.09
0.01
0.90
0.30
0.31
0.09
0.71
0.05
0.57
0.80
0.80
HH + HH x Female = 0
LW + LW x Female = 0
HH and LW = HH and LW x Female = 0
Mean of dependent variable among controls
N. Observations
0.92
0.88
0.83
0.03
1140
0.76
0.24
0.31
-0.14
1140
0.74
0.06
0.91
0.02
1140
0.99
0.92
0.92
-0.15
1140
0.26
0.54
0.60
0.11
1140
Note: The reported mean of the dependent variable is computed using CO members not offered the hand holding treatment nor chosen as
winners of the lottery.The dependent variables are aggregates of standardized z-scores. See Appendix B for a definition of the aggregates.
All regressions are estimated using OLS methods and include as covariates the stratification variables (eligibility for loan lottery, business
ownership at baseline and gender). Standard errors reported in parentheses are clustered at the CO level. The following symbols *, * * and
** * denote significance at the 10 , 5, and 1 percent level, respectively.
Table A9. Default among controls
OLS
Female (1=yes)
Member has Business (1=Yes)
Eligibility
Age
Age^2
HH members business history (1=Yes)
HH size
Number of Children under 9
% HH Income from Wage Labor
Landless (1=Yes)
Fraction of CO Members of same Zaat (caste)
Months as CO member
Holds office in CO (1=Yes)
Literacy (1=Yes)
Knowledge of Competition
Risk Tolerance
Index of Optimism
Mean of dependent variable among controls
N. obs
R-Sq.
Before Loan
Lottery
(1)
During and
After Loan
Lottery
(2)
0.067
(0.059)
-0.009
(0.021)
-0.036
(0.050)
0
(0.004)
0
(0.000)
0.044*
(0.026)
0
(0.002)
0.011
(0.009)
0.029
(0.047)
-0.012
(0 028)
(0.028)
-0.052
(0.048)
0
(0.000)
0.012
(0.045)
0.01
(0.023)
0.001
(0.015)
-0.007
(0.006)
0.008
(0.008)
0.03
144
0.07
0.210*
(0.108)
0.009
(0.047)
-0.078*
(0.042)
0.014
(0.012)
0
(0.000)
-0.018
(0.045)
-0.005
(0.007)
0.008
(0.014)
0.087
(0.059)
-0.064
(0 055)
(0.055)
0.094
(0.087)
0.001*
(0.001)
-0.055
(0.054)
0.072
(0.046)
-0.006
(0.014)
0.002
(0.006)
-0.013
(0.017)
0.45
409
0.42
Note: The dependent variable takes value 1 if the member took at least a loan
during the period, and defaulted on at least one of those loans. Standard errors are
clustered at the CO level. Branch fixed effects are included. The following symbols
*,** and *** denote significance at the 10, 5 and 1 percent level, respectively.


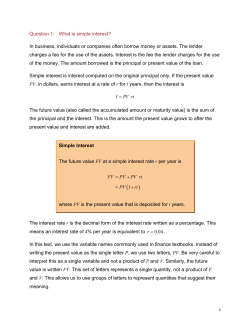
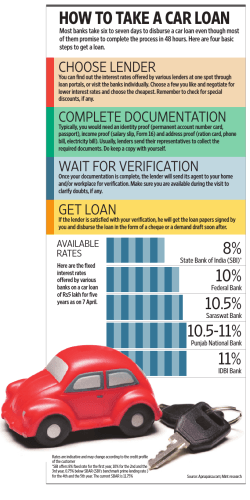
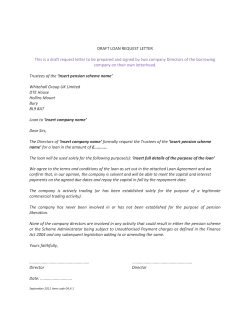


© Copyright 2026