
Body size and pubertal development explain ethnic differences in structural... at the femur in Asian, Hispanic, and white early adolescent...
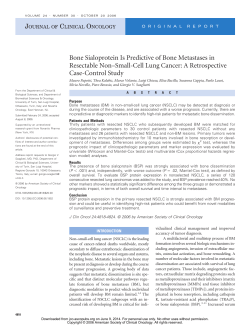
Bone 51 (2012) 888–895
Contents lists available at SciVerse ScienceDirect
Bone
journal homepage: www.elsevier.com/locate/bone
Original Full Length Article
Body size and pubertal development explain ethnic differences in structural geometry
at the femur in Asian, Hispanic, and white early adolescent girls living in the U.S.
D.L. Osborne a,⁎, C.M. Weaver b, L.D. McCabe b, G.P. McCabe c, R. Novotny d, M.D. Van Loan e, S. Going f,
V. Matkovic g, C.J. Boushey b, h, D.A. Savaiano b
and the ACT research team
a
Dept. of Anthropology, University of Nebraska, Lincoln, NE, USA
Dept. of Nutrition Science, Purdue University, West Lafayette, IN, USA
c
Dept. of Statistics, Purdue University, West Lafayette, IN, USA
d
Department of Human Nutrition, Food and Animal Sciences, University of Hawaii-Manoa, HI, USA
e
USDA, ARS, Western Human Nutrition Research Center Davis, CA, USA
f
University of Arizona, Tucson, AZ, USA
g
Ohio State University, Columbus, OH, USA
h
Epidemiology Program, University of Hawaii Cancer Center, Honolulu, HI, USA
b
a r t i c l e
i n f o
Article history:
Received 11 June 2012
Revised 16 August 2012
Accepted 18 August 2012
Available online 27 August 2012
Edited by: Thomas Einhorn
Keywords:
Bone
Lean mass
Fat mass
Menarche
Ethnicity
Race
a b s t r a c t
Variation in structural geometry is present in adulthood, but when this variation arises and what influences
this variation prior to adulthood remains poorly understood. Ethnicity is commonly the focus of research of
skeletal integrity and appears to explain some of the variation in quantification of bone tissue. However, why
ethnicity explains variation in skeletal integrity is unclear.
Methods: Here we examine predictors of bone cross sectional area (CSA) and section modulus (Z), measured
using dual-energy X-ray absorptiometry (DXA) and the Advanced Hip Analysis (AHA) program at the narrow
neck of the femur in adolescent (9–14 years) girls (n = 479) living in the United States who were classified as
Asian, Hispanic, or white if the subject was 75% of a given group based on parental reported ethnicity. Protocols for
measuring height and weight follow standardized procedures. Total body lean mass (LM) and total body fat mass
(FM) were quantified in kilograms using DXA. Total dietary and total dairy calcium intakes from the previous
month were estimated by the use of an electronic semi-quantitative food frequency questionnaire (eFFQ). Physical
activity was estimated for the previous year by a validated self-administered modifiable activity questionnaire for
adolescents with energy expenditure calculated from the metabolic equivalent (MET) values from the Compendium
of Physical Activities. Multiple regression models were developed to predict CSA and Z.
Results: Age, time from menarche, total body lean mass (LM), total body fat mass (FM), height, total calcium, and
total dairy calcium all shared a significant (pb 0.05), positive relationship with CSA. Age, time from menarche,
LM, FM, and height shared significant (pb 0.05), positive relationships with Z. For both CSA and Z, LM was the
most important covariate. Physical activity was not a significant predictor of geometry at the femoral neck
(p≥ 0.339), even after removing LM as a covariate. After adjusting for covariates, ethnicity was not a significant
predictor in regression models for CSA and Z.
Conclusion: Variability in bone geometry at the narrow neck of the femur is best explained by body size and
pubertal maturation. After controlling for these covariates there were no differences in bone geometry between
ethnic groups.
Published by Elsevier Inc.
Introduction
Bone growth during adolescence is particularly important to the
prevention of bone fragility during senescence. Growth during adolescence is at its maximum velocity; the rate and pattern of growth during
⁎ Corresponding author at: Department of Anthropology, University of Nebraska-Lincoln,
810 Oldfather Hall, P.O. Box 880368, Lincoln, NE 68588‐0368, USA. Fax: +1 402 472 9642.
E-mail address: [email protected] (D.L. Osborne).
8756-3282/$ – see front matter. Published by Elsevier Inc.
http://dx.doi.org/10.1016/j.bone.2012.08.125
this life stage are regulated by genes and hormones [1–3] as well as the
environment [4–6]. Understanding the variation in bone growth during
adolescence will better equip researchers to develop interventions
targeted at preventing osteoporosis.
Some indicators of bone growth, such as bone mineral content
(BMC) and bone mineral density (BMD), have been well documented
[4–12]. However, less is known about changes in structural geometry
during adolescence. Structural geometry describes the surface-specific
nature of bone loss and acquisition [13]. The surface, or envelope, on
D.L. Osborne et al. / Bone 51 (2012) 888–895
which bone is deposited determines how large the bone is and also its
shape. These features describe its bending strength or rigidity, with
bending strength increasing more with bone deposition at the periosteal
surface [14].
Structural geometry is influenced by physical activity, nutrition, body
size and composition, pubertal development, and ethnicity [7,15–23].
Greater activity levels benefit bone acquisition and maintenance, but
this is dependent on the activity type, duration, intensity of exertion,
and substrate [14,24]. Lean muscle mass has a strong effect on structural
geometry, but also shares a strong association with activity [25,26]. It is
possible that loads induced by muscles pulling on bone contribute sufficient loading to impact geometry, but partitioning the effects of activity
and lean mass (LM) is difficult at best. Peak lean tissue mass accrual precedes peak growth in bone cross sectional area and section modulus,
supporting an osteogenic response to increased muscle mass and associated hormonal changes that accompany growth in lean tissue [27].
This relationship varies by sex, as girls have on average a greater proportion of bone to muscle mass than do boys [28]. In adolescent girls,
bone responds positively to the interaction between estrogen (E2)
levels and physical activity [15]. Ruff found that growth velocity in
femoral strength was very poorly correlated with growth velocity in
thigh muscle mass and strongly correlated with growth velocity in
body weight×femur length, suggesting perhaps a greater role for body
mass in development of femoral strength [29]. But growth in fat mass
independent of muscle mass appears to have a negative impact on periosteal expansion and thus section modulus [30–32]. However, precisely
when these factors influence growth in structural geometry and to what
degree remains largely unanswered. While more is known about ethnic
variation in structural geometry of adults [33–36], relatively little has
been done to examine ethnic variation in structural geometry during
late childhood and early adolescence. Further, a better understanding
of the cause(s) of variation in structural geometry between ethnic groups
is needed to better assess future risk of bone fragility and intervention.
To this end we analyzed structural geometry at the femoral neck in a
sample of adolescent girls (n = 479) living in the U.S. Subjects identified
as one of three ethnic groups: Asian, Hispanic, or white. In our analysis
of structural geometry we had three goals: 1. consider the relationship
between lean muscle mass and fat mass and bone geometry; 2. evaluate
the relationship between physical activity, total calcium intake and total
dairy intake, and bone geometry; and 3. determine if ethnic differences
in bone geometry develop by late childhood/early adolescence after
controlling for covariates, with Asians presenting smaller measures of
bending rigidity than Hispanics or whites; and whites presenting the
greatest measures of bending rigidity.
Materials and methods
Research design
This cross-sectional analysis used baseline data from the Adequate
Calcium Today (ACT) project, a school-randomized educational intervention conducted at sites in six states (Arizona, California, Hawaii,
Indiana, Nevada, and Ohio). The baseline data from the multi-site
ACT study have been used to investigate the effects of body size and
ethnicity on BMC [12], perceived lactose intolerance and BMC [37],
ethnic differences in the android/gynoid fat ratio [38], development
and reliability testing of psychosocial measurement of calcium intake
[39], assessment of breast density using DXA [40], development and
analysis of a calcium testing tool [41], the effects of race, acculturation,
and SES on obesity, and the relationship between tanning and bone
mass and structure [42]. Subjects used in this analysis were girls in
the sixth grade, with age at baseline measurement ranging from 9 to
14 years. Middle schools within 1-hour driving time of one of the designated DXA measurement sites were eligible for participation in ACT if
their student populations had a higher proportion of Asian or Hispanic
students than the state average. Sixth-grade girls within participating
889
schools were recruited as volunteers via presentations, mailings, and
flyers. Recruitment goals for the total number of Asian, Hispanic, and
non-Hispanic white girls within a school were established based on
goals for the overall ACT project and enrollment distributions in each
school.
Subjects were classified as Asian, Hispanic, or white (Table 1). Inclusion into a particular ethnic group required that a subject be 75% of a
given group based on parental or guardian reported percentage ethnicity
of each biological parent [38]. Ethnicity choices given to the parents were
American Indian or Alaska Native, Asian or Asian American, black or
African-American, Hispanic or Latino, Native Hawaiian or Pacific Islander,
white, or other. Many parents reported multiple ethnic backgrounds, so
each child was assumed to be one half of each of the ethnicities of each
parent. These percentages were summed and had to total 75% of the
recruited ethnic group (Asian, Hispanic, or white). For example, a child
might get 50% of their Asian ancestry from one parent and 25% from
the other parent that was one-half Asian and one-half white. Letters
requesting consent were sent to parents of the interested students and
girls were enrolled into the program subsequent to completion of required informed consent and assent documentation. The study was
approved by local Institutional Review Boards.
Bone and body composition measurements
Dual energy X-ray absorptiometry (DXA; Lunar Prodigy, software
version 6.5 and 6.7 GE Medical Instruments, Madison, WI) was used to
derive measures of body composition. Matching instruments and software were used at each site. Training of DXA staff was conducted by
the same individual at each geographic site, and measurements followed
standardized procedures. Within laboratory and between-laboratory
variance in DXA measurements were determined by measuring totalbody, spine, forearm, and femur phantoms (Hologic, Bedford, MA) at
each geographic site. Each phantom was scanned ten times, with
repositioning of the phantom between each scan, so positioning error
is included in the results. The phantom measurements were analyzed
and reviewed for accuracy errors by an independent group at the
University of California-San Francisco. The means and standard deviations were calculated for each scanned phantom including BMD and
BMC for total-body, spine, femur, and forearm as well as whole body
lean mass (LM) and whole body fat mass (FM). Results indicated that
no study site adjustments for DXA measurements were needed. The
coefficient of variation (percent) for BMD ranged from 0.59 (spine) to
5.36 (total forearm 800 density); for BMC from 1.18 (spine) to 1.93
(total-body); and for area from 1.19 (spine) to 4.06 (neck). The coefficients of variation for LM and FM were 0.72 and 1.10, respectively. A
single DXA operator performed all scans at each site, except in California
and Indiana, where two operators were used. The reliability between
operators was 0.96–0.99 for California and 0.97–0.99 for Indiana. [12].
Subjects provided a urine sample for use in a pregnancy testing prior
to the DXA scan. If the test was negative, then a subject could proceed
with scanning.
The Advanced Hip Analysis (AHA) program provided measures of
structural geometry at the femoral neck. The AHA software calculated
several measures of structural geometry using data derived from the
DXA curves calculated from proximal femur scans [16,43,44]. From
this information the following measures of geometry were included
in this analysis:
1. Cross sectional moment of inertia (CSMI, mm 4) was measured at the
section of minimum CSMI within the region of interest (ROI) on the
femoral neck. This measure reflects the distribution of material
around the neck axis and is necessary in order to calculate a bone's
resistance to bending stress:
"
#
kðdxÞ
∑PBMx 2
2
4
∑PBMx −
CSMI ¼
mm
ρ
PBM
890
D.L. Osborne et al. / Bone 51 (2012) 888–895
Table 1
Characteristics, bone geometry, and lifestyle among Asian, Hispanic, and white early adolescent girls (10–13 years).
Variable
Asian (n = 124)
Hispanic (n = 152)
White (n = 221)
Total (n = 497)
Mean ± SD (range)
Age (years)
Time to menarche (mo)
Height (cm)a
Weight (kg)b
Total-body fat mass (kg)b
Total-body lean mass (kg)a
CSA (mm2)a
Z (mm4)a
Calcium (mg)a
Dairy (mg)c
Physical activity (MET hours/week)d
11.1 ± 0.5 (10–13)
−0.7 ± 10.9 (−17–36.5)
147.3 ± 7.1 (129.8–170.3)
43.1 ± 9.7 (27.4–71.1)
11.5 ± 6.2 (2.6–28.5)
29.2 ± 6.2 (20.1–44.5)
106.5 ± 18.5 (63.5–159.4)
363.9 ± 87.3 (184.8–602.4)
1118.8 ± 733.7 (108.7–3878.1)
675.7 ± 456.7 (38.5–105.2)
41.7 ± 41.4 (0.0–235.7)
11.3 ± 0.6 (10–14)
2.4 ± 13.6 (−20.3–38.8)
151.2 ± 6.4 (131.9–166.3)
51.5 ± 12.7 (28.1–88.7)
17.8.7 ± 8.6 (4.1–38.8)
31.1 ± 4.9 (20.4–47.9)
117.6 ± 21.7 (64.2–176.7)
414.1 ± 101.9 (192.7–781.2)
1536.8 ± 916.6 (108.7–3980.6)
835.3 ± 582.4 (39.3–270.8)
36.3 ± 45.4 (0.0–323.5)
11.6 ± 0.6 (9–13)
1.3 ± 13.8 (−23.8–53.3)
155.5 ± 7.1 (139.4–175.1)
52.4 ± 14.2 (29.7–109.2)
16.7 ± 9.7 (4.1–52.1)
33.3 ± 5.4 (22.2–57.1)
124.8 ± 22.7 (77.9–188.1)
459.1 ± 111.9 (214.1–900.8)
1206.2 ± 707.4 (110.4–3980.6)
766.2 ± 502.2 (51.2–609.5)
54.6 ± 60.0 (0.0–443.9)
11.4 ± 0.6 (9–14)
1.1 ± 13.1 (−23.8–53.3)
152.1 ± 7.7 (129.8–175.1)
49.8 ± 13.4 (27.4–109.2)
15.8 ± 8.9 (2.6–52.1)
31.6 ± 5.3 (20.1–57.1)
118.1 ± 22.6 (63.5–188.1)
421.7 ± 109.9 (184.8–900.8)
1285.0 ± 799.8 (108.7–3980.6)
764.9 ± 519.9 (38.5–609.5)
45.8 ± 52.1 (0.0–443.9)
CSA = cross sectional area; Z = section modulus; MET = metabolic equivalent.
Table footnotes below show Bonferroni comparisons by ethnic groups.
a
A b H b W (P b 0.001).
b
Ab H, Ab W (P b 0.001).
c
Ab H (P b 0.001).
d
H b W (P b 0.001).
where PBM is a pseudo-bone mineral value based on the X-ray absorption data, k is a PBM to BMC conversion factor, ρis the average
physical density of bone (1.85 g/cm3), and dx is the distance between scan lines. This variable was not a unit of analysis, rather its
calculation was necessary to quantify section modulus.
2. Section modulus (Z, mm4) was derived using CSMI. Section modulus
is a ratio of CSMI to the distance of the outer most point on the
periosteum. Section modulus evaluates the size and shape of the
cross section in a given ROI while controlling for distance from
the neutral axis (y) to the periosteal diameter:
To assess sexual maturity, subjects were asked about menarche status.
Because we have 2 years of follow up data on the subjects analyzed
here, we were able to quantify time to menarche measured as months
away from menarche either pre- or post-menarche. Girls who were
measured/scanned prior to menarche were assigned negative values in
months prior to menarche ðn ¼ 241; x ¼ −9:45; σ ¼ 5:34Þ at the time
of data collection, while girls who had attained menarche were assigned
a positive value denoting the amount of time between menarche
ðn ¼ 256; x ¼ 11:06; σ ¼ 10:06Þ and data collection.
Lifestyle
Z¼
CSMI
y
where y is the distance from the neutral axis to the periosteal
margin.
3. Cross sectional area (CSA, mm 2) was used to measure the amount
of cortical bone at the section of minimum CSMI within the ROI on
the femoral neck.
Structural geometry was calculated for both the left and right femoral
necks. These values were not significantly different from one another, so
the average value of the left and right sides were used in this analysis.
Anthropometry and sexual maturity
Weight was measured with subjects wearing laboratory issued
scrubs and without shoes on an electronic scale or beam balance and
recorded to the nearest 0.1 kg. Sets of three measurements were
taken until two measures were within a 0.2 kg agreement and the
median was used for analysis. Height was measured with the subject
standing barefoot against a wall with her head in the Frankfurt horizontal
plane. A stadiometer was used to measure height and measurements
were recorded to the nearest 0.1 cm. Sets of three measurements were
taken until two measures were within a 0.2 cm agreement and the
median was used for analysis. Protocols for measuring height and
weight follow standardized procedures [45]. Total body lean mass
(LM) and total body fat mass (FM) were quantified in kilograms using
DXA. Within-laboratory and between laboratory variance in DXA measurements were determined following the same procedures outlined
for bone above using a whole body phantom (Hologic, Bedford, MA).
The coefficients of variation for lean mass and fat mass were 0.72 and
1.10, respectively.
Dietary calcium intakes from the previous month were estimated by
the use of an electronic semi-quantitative food frequency questionnaire
(eFFQ) based on a FFQ developed for and evaluated with Asian, Hispanic,
and non-Hispanic white youth [46]. The eFFQ was administered through
an interactive multi-media computer program that provided images of
a food or food grouping with a text message of the serving size(s). Respondents were instructed to indicate how often a food was consumed
(e.g., never or less than once per month, 1–3 servings per month, 1
serving per week, 2–4 servings per week, 5 or more servings per
week). Approximately 81 food items containing calcium and foods that
may interfere with calcium consumption (e.g., soft drinks) were included
in the eFFQ. Calcium intakes from food were categorized in five ways:
(1) calcium exclusively from dairy foods (e.g., milk); (2) calcium from
non-dairy foods (e.g., broccoli); (3) calcium from mixed-foods that
include calcium from both dairy and non-dairy sources (e.g., pizza);
(4) total dairy calcium determined from the sum of both calcium from
dairy foods and calcium from mixed-foods; and (5) total calcium from
food calculated for the entire diet. In this analysis total calcium and
total dairy calcium are used to quantify calcium intake.
An estimate of daily food calcium intake was computed based on a
calcium value assigned to each food item on the eFFQ using mean
methods for assigning nutrient values [47] and multiplying by the
corresponding frequency. Estimated daily food calcium intakes that
were b 100 mg/day or >2500 mg/day were considered improbable
and individuals with such values were excluded from analyses using
food calcium intakes.
Physical activity was estimated for the previous year by a validated
self-administered modifiable activity questionnaire for adolescents
[48,49]. Energy expenditure was calculated from the metabolic equivalent (MET) values from the Compendium of Physical Activities [50].
The MET values were expressed as hours of energy expenditure/week
for all activities controlled for body weight. The sum of all MET values
D.L. Osborne et al. / Bone 51 (2012) 888–895
was used as a proxy for physical activity in the past year. Physical activity
questionnaires were entered and checked for accuracy at the Coordinating Center (Purdue University). Inconsistent or incomplete questionnaires were returned to the appropriate site for further clarification from
the subject.
Statistical analysis
Prior to analysis, outliers (±3 standard deviations from mean)
were removed from the total sample (n = 748). If an individual was
an outlier for any of the variables they were excluded from analyses,
resulting in a reduced sample size (n= 678). Subsequently, only subjects whose time to menarche was known were included in this analysis
(n= 497). Ethnicity was dummy coded in all regression models. Total
calcium intake was log transformed to account for skewness in this
measure, while total dairy calcium intake was transformed using the
square root to correct for skewness. Physical activity data were also
log transformed to account for skewness. Baseline data were summarized using means and standard deviations. ANOVA was used to test
for differences in age, anthropometry, physical activity and calcium intake between ethnic groups. Bonferonni correction was used for
post-hoc comparisons of individual groups. Multiple regression was
used to examine ethnic differences in the two bone outcome variables
at the proximal femur. Factors known to predict skeletal integrity
(age, time to menarche, weight, height, lean muscle mass, physical activity, total calcium, total dairy, ethnicity) were entered in sequential
models to evaluate improvement in predictive power and significance
of predictors. Chronological age and time to menarche—an indicator of
maturation—were both included in regression models; the former provides a reference of physical development and the latter indicates how
far from maturity subjects are at the time of measurement. A series of
statistics and plots were performed to check the assumptions underlying regression. The Durbin–Watson statistic was used to test for autocorrelation in regression models, while tolerance was used to evaluate
the likelihood of multicolinearity. Standardized residuals were plotted
against standardized predicted values to evaluate the assumptions of
homoscedasticity, while predicted outcomes were plotted against
their actual, respective values to evaluate linearity. The Levene's test
statistic tested for homogeneity of variances. Statistics were performed
using SPSS Version 19 [51].
891
Evaluating predictors of cross sectional area and section modulus
All models met the assumptions underlying regression. In the
baseline regression models predicting CSA and Z, weight, height, LM
and FM shared low tolerance values and likely share variation explained
in outcome measures. Total body fat and lean mass as well as height were
used as anthropometric indicators in subsequent models as they directly
relate to one of our research questions, while weight provides a proxy of
body composition and body size. While including measures of body size
are important for understanding variation in 2-dimensional DXA scans,
LM, FM, height and weight are strongly correlated with one another
and if included in the same regression model would increase the
likelihood of collinearity. Because results affected by collinearity can
be tenuous, only height was included with LM and FM in regression
models. Total calcium and total dairy calcium were used as indicators
of calcium intake in separate regression models as they are not independent of one another and thus would result in problems with collinearity.
Subsequent to these modifications there were no issues with tolerance,
suggesting collinearity was not a problem in successive models.
Cross sectional area
Results from regression models to predict CSA at the hip are shown
in Table 2 and Fig. 1. In general, age, time to menarche, FM, LM, height,
total calcium, and total dairy calcium were significant predictors of CSA.
Ethnicity and physical activity failed to reach significance in any of the
models. The standardized coefficients (β) provided a useful means of
analyzing the relative importance of predictors in each model and LM,
time to menarche, and height produced the highest β values across all
models. In the final model, age and FM were relatively equivalent to
one another in terms of importance to predicting CSA. Predictive
power of the models did not differ substantially between the three
models, although the final model produced the highest R2 value.
Section modulus
Results
Multiple regression results for Z are also included in Table 2 and
Fig. 1. Age, time to menarche, LM, FM, and height were significant predictors across all models. Ethnicity, physical activity, total calcium, and
total dairy calcium failed to reach significance in all models. The β
values for LM suggest that this variable is a very important predictor
of Z in all models, followed by height, time to menarche, and age. The
R2 value varies little in each model and ethnicity does not add any explanatory power to the model.
Subject characteristics
Discussion
In this sample, ethnic groups differed significantly in age, CSA, Z, and
anthropometry (Table 1). There were no differences in time to menarche.
In post-hoc comparisons of age, CSA, Z, height, and LM Asians were significantly smaller than Hispanics and whites, and Hispanics were significantly smaller than whites (P≤0.02). Asians weighed significantly less
than Hispanics and whites (Pb 0.001), but there were no differences in
weight between Hispanics and whites. Asians had significantly less FM
than Hispanics and whites (Pb 0.001), but Hispanics and whites did not
differ in FM. White girls were significantly more active than Hispanics
(P ≤ 0.001), but not Asians and there were no differences between
Hispanics and Asians. Hispanics consumed significantly more total
calcium than whites (P b 0.03) and Asians (P b 0.001), but total calcium
consumption in Asians and whites were not different. Total dairy
calcium consumption was also significantly higher in Hispanics than
Asians (P b 0.04), but this was the only significant difference in total
dairy calcium. To evaluate the effects of physical activity on CSA and Z
models were analyzed without the variable LM. The results of these
models were not different from those that included LM and thus only
models including physical activity and LM are discussed.
The results of this study are unique in that structural geometry at
the neck of femur was analyzed in a large, multi-ethnic, multi-site
sample of adolescent girls living in the US. Our results suggest that
ethnic differences in CSA and Z at adolescence are best explained by
covariates. These results are consistent with our observations of BMC
in this sample [12], but are contrary to some of the literature on ethnic
differences in bone geometry [7,19,32,33,36].
By this stage of development, age, time to menarche, FM, LM, and
height are all significant predictors of CSA and Z. Total calcium and total
dairy calcium were significant predictors of CSA, but not Z. It is possible
that increases in calcium and protein contribute to the amount of bone
present in a given section, but do not contribute to the bone's shape
as it pertains to bending stress. Physical activity was not a significant
predictor of either outcome. After controlling for body size, ethnicity
was not a significant predictor of CSA or Z. LM appears to be a very important predictor of structural geometry which is not surprising given
its role in loading of bone and its association with body size, consistent
with previous research in this area [25,26,28]. Age was significantly
different across ethnic groups, but multiple regression allowed for
892
D.L. Osborne et al. / Bone 51 (2012) 888–895
Table 2
Regression models describing the relationship between predictors and bone CSA and Z.
Models and R2
Cross sectional area (CSA)
Section modulus (Z)
(n = 479)
(n = 479)
Model I
Constant
Age (years)
Time to menarche (months)
Total body fat mass (kg)
Total body lean mass (kg)
Height (cm)
Weight (kg)
R2
B = −134.04
B = 1.87
B = 0.32
B = 8.79
B = 0.00
B = 0.54
B = −0.29
0.73
SE
SE
SE
SE
SE
SE
SE
B = 28.88
B = 0.93
B = 0.05
B = 3.00
B = 0.00
B = 0.12
B = 0.19
Model II
Constant
Age (years)
Time to menarche (months)
Total body fat mass (kg)
Total body lean mass (kg)
Height (cm)
Physical activity(MET hours/week)
Calcium (mg)
R2
B = −113.71
B = 2.25
B = 0.33
B = 4.72
B = 0.00
B = 0.54
B = 0.47
B = 1.68
0.74
SE
SE
SE
SE
SE
SE
SE
SE
B = 19.69
B = 0.92
B = 0.05
B = 1.19
B = 0.00
B = 0.12
B = 0.49
B = 0.79
Model III
Constant
Age (years)
Time to menarche (months)
Total body fat mass (kg)
Total body lean mass (kg)
Height (cm)
Physical activity(MET hours/week)
Dairy (mg)
R2
B = −106.70
B = 2.33
B = 0.33
B = 4.32
B = 0.00
B = 0.54
B = 0.46
B = 0.13
0.75
SE
SE
SE
SE
SE
SE
SE
SE
B = 19.00
B = 0.92
B = 0.05
B = 1.91
B = 0.00
B = 0.12
B = 0.49
B = 0.06
Model IV
Constant
Age (years)
Time to menarche (months)
Total body fat mass (kg)
Total body lean mass (kg)
Height (cm)
Calcium (mg)
a
Ethnicity (Asian)
(Hispanic)
R2
B = −105.85
B = 2.07
B = 0.33
B = 4.22
B = 0.00
B = 0.51
B = 1.67
B = −1.26
B = −11.33
0.74
SE
SE
SE
SE
SE
SE
SE
SE
SE
B = 22.34
B = 0.94
B = 0.05
B = 1.24
B = 0.00
B = 0.13
B = 0.81
B = 1.52
B = 6.33
Model V
Constant
Age (years)
Time to Menarche (months)
Total body fat mass (kg)
Total body lean mass (kg)
Height (cm)
Physical activity(MET hours/week)
Dairy (mg)
Ethnicity (Asian)a
(Hispanic)
R2
B = −99.17
B = 2.16
B = 0.33
B = 4.24
B = 0.00
B = 0.51
B = 0.45
B = 0.13
B = −1.18
B = −0.68
0.75
SE
SE
SE
SE
SE
SE
SE
SE
SE
SE
B = 21.56
B = 0.94
B = 0.05
B = 1.24
B = 0.00
B = 0.13
B = 0.49
B = 0.06
B = 1.52
B = 1.33
β = 0.05
β = 0.19⁎⁎
β = 0.22⁎⁎
β = 0.59⁎⁎
β = 0.19⁎⁎
β = −0.17⁎⁎
β = 0.06⁎
β = 0.20⁎⁎
β = 0.11⁎⁎
β = 0.52⁎⁎
β = 0.19⁎⁎
β = 0.02
β = 0.05⁎
β = 0.06⁎
β = 0.19⁎⁎
β = 0.11⁎⁎
β = 0.51⁎⁎
β = 0.19⁎⁎
β = 0.02
β = 0.05⁎
β = 0.06⁎
β = 0.19⁎⁎
β = 0.11⁎
β = 0.52⁎⁎
β = 0.17⁎⁎
β = 0.05⁎
β = −0.02
β = −0.05
β = 0.06⁎
β = 0.19⁎⁎
β = 0.11⁎
β = 0.52⁎⁎
β = 0.18⁎⁎
β = 0.02
β = 0.05⁎
β = −0.02
β = −0.01
B = −764.29
B = 10.57
B = 1.14
B = 27.36
B = 0.01
B = 3.08
B = −2.55
0.75
SE
SE
SE
SE
SE
SE
SE
B = 136.05
B = 4.36
B = 0.22
B = 14.12
B = 0.01
B = 0.57
B = 0.88
β = −0.03
B = −766.20
B = 11.88
B = 1.09
B = 22.28
B = 0.01
B = 2.99
B = 0.94
B = 4.48
0.76
SE
SE
SE
SE
SE
SE
SE
SE
B = 93.57
B = 4.35
B = 0.21
B = 5.67
B = 0.00
B = 0.57
B = 2.33
B = 3.77
β = 0.07⁎
β = 0.13⁎⁎
β = 0.11⁎⁎
β = 0.53⁎⁎
β = 0.21⁎⁎
β = 0.01
β = 0.03
B = −751.35
B = 12.24
B = 1.08
B = 22.38
B = 0.01
B = 2.99
B = 0.85
B = 0.45
0.76
SE
SE
SE
SE
SE
SE
SE
SE
B = 90.21
B = 4.35
B = 0.21
B = 5.65
B = 0.00
B = 0.57
B = 2.33
B = 0.27
β = 0.01
β = 0.04
B = −714.63
B = 10.39
B = 1.15
B = 22.99
B = 0.01
B = 2.75
B = 4.96
B = −9.58
B = 10.45
0.76
SE
SE
SE
SE
SE
SE
SE
SE
SE
B = 105.81
B = 4.45
B = 0.22
B = 5.87
B = 0.00
B = 0.60
B = 3.83
B = 7.20
B = 3.44
β = 0.06⁎
β = 0.14⁎⁎
β = 0.12⁎⁎
β = 0.53⁎⁎
β = 0.19⁎⁎
β = 0.03
β = −0.04
β = 0.08⁎
B = −699.17
B = 10.80
B = 1.14
B = 23.09
B = 0.01
B = 2.76
B = 0.46
B = 0.45
B = −9.12
B = −10.84
0.76
SE
SE
SE
SE
SE
SE
SE
SE
SE
SE
B = 102.08
B = 4.46
B = 0.22
B = 5.87
B = 0.00
B = 0.60
B = 0.27
B = 0.27
B = 7.20
B = 6.28
β = 0.06⁎
β = 0.14⁎⁎
β = 0.14
β = 0.53⁎⁎
β = 0.22⁎⁎
β = 0.07⁎
β = 0.13⁎⁎
β = 0.10⁎⁎
β = 0.53⁎⁎
β = 0.21⁎⁎
β = 0.06⁎
β = 0.14⁎⁎
β = 0.12⁎⁎
β = 0.53⁎⁎
β = 0.19⁎⁎
β = 0.01
β = 0.04
β = −0.04
β = − 0.06
Unstandardized coefficients (B) with standard error and standardized coefficients (β) are provided.
a
Ethnic comparisons were in reference to white subjects.
⁎
P b 0.05.
⁎⁎
P b 0.001.
the effects of this covariate to be included in subsequent statistical
models as physiological processes associated with age during this
period are clearly associated with physical growth.
When multiple predictors were included in regression models to
predict CSA and Z, ethnicity was not significant. These findings are
consistent with prior observations in this age group for BMC [12].
There is evidence, however, that ethnic differences are present in
bone geometry [7,19,32,33,36]. Ethnicity's significance as a predictor
in some studies may support an underlying genetic basis to differences in skeletal integrity. This assumption is tacit when ethnicity
or race are used to group individuals, although relatively few have actually employed genetic analyses to confirm this. There is a clear genetic
basis to femoral neck geometry [53–56] and this variation interacts
with the environment, but not all bones respond to environmental
stimuli to the same degree [29,57]. Even with this knowledge we still
do not know how these genes vary across ethnic groups. The efficiency
with which early adolescent African American girls [58] and Chinese
girls [59] maintain calcium homeostasis relative to other groups and
the observation that Asian young women maintain greater trabecular
bone thickness than do white young women [60] also supports use of
D.L. Osborne et al. / Bone 51 (2012) 888–895
Cross Sectional Area (mm2)
A
R2 = 0.74
Predicted Cross Sectional Area(mm2)
Section Modulus (mm4)
B
R2 = 0.75
Predicted Section Modulus (mm4)
Fig. 1. Comparison of actual versus predicted (A) cross sectional area and (B) section
modulus at the femoral neck for multiple regression models V. 95% confidence intervals
are indicated adjacent to the line of best fit.
ethnicity or race as a proxy for some underlying biological basis to
variability in skeletal health. But pooling of subjects by ethnicity or
race may also miss important variation. For example, Finklestein et
al., found significant differences in unadjusted bone mineral apparent
density (BMAD) at the lumbar spine and femur between Chinese and
Japanese women, a difference that would have gone unnoticed had
subjects been pooled as Asian [61]. The ability to define meaningful
categories, however, may not be possible in many situations. The degree
to which these differences reflect genetic or epigenetic influence remains
unknown.
Variables that captured aspects of growth and development, age and
time to menarche, were also significant in every model predicting CSA or
Z. These results support previous findings suggesting that growth and
pubertal development are important contributors to skeletal integrity
[15,27,62,63]. Fluctuations in hormone levels responsible for this are in
turn affected by genes and energy availability [64,65]. This relationship
likely affects bone growth and development.
Height was important for predicting CSA and Z. These results correspond with our previous findings for BMC and body size in this sample
[12] and support other observations regarding the relationship between
bone geometry and body size in general [17,30,52]. If indicators of body
893
size are important covariates of bone geometry, then the effects of body
composition must also be considered to investigate potential differences in LM and FM, each of which correspond to body size.
LM was a significant predictor of CSA and Z in all models and
explained most of the variance in these outcomes. Although, in this
sample, levels of physical activity were not significantly different across
ethnic groups; these results do not reflect long term loading history or
the intensity, duration, and substrate on which loading has occurred.
There is some evidence that load bearing bones are less sensitive to
physical activity in pre- and early pubertal girls than in boys [66],
which may also factor into our findings. Further, LM may share variance
with physical activity, with the former explaining more of the variation
in CSA and Z and thus masking the effects of the latter. LM also shares a
strong positive relationship with body size. Anthropometric indicators
of body size have been previously noted as important predictors of
bone health outcome [7,12,29], so some of the variation in CSA and Z
explained by LM may be owed in part to differences in body size.
Body size is relevant in terms of functional loading of the axial and
lower appendicular skeleton during locomotion and thus affects skeletal
integrity. Differences in LM and body size across the lifespan would
certainly have an effect on variability in bone quantity and quality.
This relationship is certainly complex in that variability in type of
movement, substrate, and frequency of activity would interact to produce variability in loading regimes. Some have argued that muscle
and bone should be viewed as a functional unit with muscle development driving bone development [25]. Indeed peak LM growth velocity
occurs prior to peak growth in bone, perhaps suggesting that loads imposed by muscle are largely responsible for the timing and pattern of
bone growth [25,28,67]. However, the data presented here are cross
sectional and relate to early adolescence, so it is not possible to determine if our data support these findings.
In this sample, FM was also a significant, positively associated predictor of CSA and Z, although clearly not as important a predictor as
LM. There is equivocal evidence that FM can influence bone growth.
There is evidence that increases in FM during late adolescence/early
adulthood limits periosteal expansion among girls and thus decreases
bone strength relative to the load imposed on it [31]. However, there is
also evidence that during adolescence FM in girls is positively associated
with periosteal circumference and thus increased bending strength,
similar to our results [67]. It may be that body composition is interacting
with physical activity; more active, heavier individuals with greater LM
impose larger loads, inducing skeletal growth to accommodate these
loads.
In terms of lifestyle, total calcium and total dairy calcium independent of one another were significant predictors of CSA, but not Z. Physical
activity failed to achieve significance. Research using calcium “intakes” or
“intake of dairy foods” as a predictor of geometry has been equivocal,
with some studies finding significant results [22,68] and others not
[20,69,70]. Dairy foods contribute protein and calcium and may be the
more appropriate predictor of bone geometry [22]. The importance of
physical activity as a determinant of structural geometry is well documented [17,18,20,21,28,66,71], with some evidence that these effects
last into early adulthood [72,73], so failure of physical activity to predict
bone geometry here is at odds with most of the published literature.
However, our findings support the observations of Macdonald et al.,
who found no significant increase in bone strength in pre- and early adolescent girls exposed to a jumping intervention compared to controls
[21]. Bone growth and maintenance are influenced by intensity and duration of activity, with greater loading at irregular intervals producing
the strongest effects [14,24]. Because MET values are quantified as
hours of energy expenditure/week for all activities controlled for body
weight, we cannot comment on variability in osteogenic effect by activity
type or intensity. Additionally, because LM and physical activity are not
independent of one another it is possible that the former is accounting
for the variation in geometry explained by physical activity. However,
tolerance values for these variables remain high (≥0.72) suggesting
894
D.L. Osborne et al. / Bone 51 (2012) 888–895
that the amount of the variance in geometry shared by LM and physical
activity is insufficient to produce collinearity. Additionally, to see if physical activity had an effect on bone geometry regression models including
all covariates except LM were evaluated, but physical activity still failed
to reach significance (results not shown).
After controlling for covariates, however, these differences disappear.
Covariates indicative of body size—LM, height, FM—explained most of the
variation in CSA and Z, suggesting structural geometry scales positively
with body size. If ethnic differences in bone geometry are explained by
body size, then our understanding of when and why these differences
arise may best be framed within an intergenerational perspective.
There is a strong possibility that health and lifestyle across generations
can influence skeletal integrity, particularly given the strong association
between body size and measures of bone health outcome. Growth insult
is dependent on severity of environment, duration and timing. For instance, a sample of adults whose mothers experienced and survived
the Dutch Winter Famine (winter of 1944–1945) presented with different patterns of methylation on the IGF2 gene, with those exposed to
stresses earlier in development deviating the most from unexposed
same sex siblings [74]. Because IGF2 plays a major role in promoting
intrauterine growth, modifications to expression may influence skeletal
integrity later in life. Migration studies examining changes across generations have consistently demonstrated that increasing body size is associated with improvements in health and nutrition [75,76]. Secular
trends in increasing body size also associated with improvements in
health and nutrition seem to corroborate this as well. Genetic potential
limits body size attainment and thus ultimately height would plateau
following generations of life in a healthy environment. Therefore, this
type of change may not completely buffer against poor bone health
and the infrastructure to insure optimal health and nutrition alone is
likely impossible to attain. However, awareness of these issues will contribute greater understanding of factors influencing bone health and inform future intervention.
There are limitations to this study worthy of discussion. For instance,
we only measured girls and thus our results are not generalizable to
both sexes. Although our sample was large, ethnically diverse, and
representative of cities in six states, it may not be representative of
the population of girls since not all ethnicities were represented in the
sample. Additionally, all subjects lived and attended school in the United
States, so results may not be generalizable to other cultures. In terms of
methods, the physical activity questionnaire used in this study was validated on adolescents aged 15–18 years; our sample ranged in age from 9
to 14 years so this may have influenced our results for physical activity.
Variation in AHA precision across sites has not been quantified with a
phantom to date, but %CV for BMC across sites suggested that no adjustments were needed to control for scanner/operator differences. Additionally, scanners were consistently calibrated using a daily calibration
phantom. Finally, these results are limited in that they are cross sectional,
although a longitudinal analysis of geometric change in this sample is
currently underway.
Conclusion
Our results suggest that CSA and Z in early adolescence are associated
with LM and FM, but LM explains most of the variance in all regression
models. This further supports the relationship between muscle and
bone as a functional unit. In terms of lifestyle, physical activity and
calcium and dairy intake were not significant predictors of bone geometry. There were no significant differences between ethnic groups after
controlling for body size. These results contribute to a growing body of
literature on variation in structural geometry at adolescence.
Acknowledgments
This project was supported by the Initiative for Future Agriculture
and Food Systems Program (IFAFS) of the USDA Cooperative State
Research, Education and Extension Service, award number 00-521029696. This research could not have taken place without the combined
efforts of the ACT research team. Thanks to David Burr for comments
on an earlier draft of this manuscript. Thanks to LuAnn Wandsnider
and the anonymous reviewers for comments. USDA is an equal opportunity provider and employer.
References
[1] Liu Y, Jalil F, Karlberg J. Risk factors for impaired length growth in early life viewed
in terms of the infancy–childhood–puberty (ICP) growth model. Acta Paediatr
1998;87:237-43.
[2] Sovio U, Bennett AJ, Millwood IY, Molitor J, O'Reilly PF, Timpson NJ, et al. Genetic
determinants of height growth assessed longitudinally from infancy to adulthood
in the Northern Finland birth cohort 1966. PLoS Genet 2009;5:e1000409.
[3] Veldhuis JD, Roemmich JN, Richmond EJ, Rogol AD, Lovejoy JC, Sheffield-Moore M,
et al. Endocrine control of body composition in infancy, childhood, and puberty.
Endocr Rev 2005;26:114-46.
[4] Bailey DA, Mckay HA, Mirwald RL, Crocker PRE, Faulkner RA. A six‐year longitudinal
study of the relationship of physical activity to bone mineral accrual in growing
children: the University of Saskatchewan Bone Mineral Accrual Study. J Bone
Miner Res 1999;14:1672-9.
[5] Bailey DA, Martin AD, McKay HA, Whiting S, Mirwald R. Calcium accretion in girls
and boys during puberty: a longitudinal analysis. J Bone Miner Res 2000;15:2245-50.
[6] Ouyang F, Wang B, Arguelles LM, Xu X, Yang J, Li Z, et al. Bone growth patterns in
Chinese children and adolescents: a 6-year follow-up study provides evidence for
sexual dimorphism and tracking. Arch Osteoporos 2007;2:29-43.
[7] Burrows M, Baxter-Jones A, Mirwald R, Macdonald H, McKay H. Bone mineral accrual
across growth in a mixed-ethnic group of children: are Asian children disadvantaged
from an early age? Calcif Tissue Int 2009;84:366-78.
[8] Hui SL, Perkins AJ, Zhou L, Longcope C, Econs MJ, Peacock M, et al. Bone loss at the
femoral neck in premenopausal white women: effects of weight change and
sex-hormone levels. JCEM 2002;87:1539-43.
[9] Li J-Y, Specker BL, Ho ML, Tsang RC. Bone mineral content in black and white children
1 to 6 years of age: early appearance of race and sex differences. Arch Pediatr Adolesc
Med 1989;143:1346-9.
[10] Bell NH, Shary J, Stevens J, Garza M, Gordon L, Edwards J. Demonstration that bone
mass is greater in black than in white children. J Bone Miner Res 2009;6:719-23.
[11] Mccormick DP, Ponder SW, Fawcett HD, Palmer JL. Spinal bone mineral density in 335
normal and obese children and adolescents: evidence for ethnic and sex differences.
J Bone Miner Res 2009;6:507-13.
[12] Weaver CM, McCabe LD, McCabe GP, Novotny R, Loan M, Going S, et al. Bone mineral
and predictors of bone mass in white, Hispanic, and Asian early pubertal girls. Calcif
Tissue Int 2007;81:352-63.
[13] Burr BD, Turner CH. Biomechanics of bone. In: Favus M, editor. Primer on the Metabolic
Bone Diseases and Disorders of Mineral Metabolism. Washington DC: American Society
for Bone and Mineral Research; 2003. p. 58-64.
[14] Robling A, Castillo A, Turner C. Biomechanical and molecular regulation of bone
remodeling. Annu Rev Biomed Eng 2006;8:455-98.
[15] Devlin MJ, Stetter CM, Lin HM, Beck TJ, Lefro RS, Petit MA, et al. Peripubertal estrogen
levels and physical activity affect femur geometry in young adult women. Osteoporos
Int 2009;21:609-17.
[16] Faulkner KG, Wacker WK, Barden HS, Simonelli C, Burke PK, Ragi S, et al. Femur
strength index predicts hip fracture independent of bone density and hip axis
length. Osteoporos Int 2005;17:593-9.
[17] Forwood MR, Baxter-Jones AD, Beck TJ, Mirwald RL, Howard A, Bailey DA. Physical
activity and strength of the femoral neck during the adolescent growth spurt: a
longitudinal analysis. Bone 2006;38:576-83.
[18] Iuliano-Burns S, Stone J, Hopper JL, Seeman E. Diet and exercise during growth have
site-specific skeletal effects: a co-twin control study. Osteoporos Int 2005;16:
1225-32.
[19] Leonard MB, Elmi A, Mostoufi-Moab S, Shults J, Burnham JM, Thayu M, et al. Effects of
sex, race, and puberty on cortical bone and the functional muscle bone unit in
children, adolescents, and young adults. J Clin Endocrinol Metab 2010;95:1681-9.
[20] Lloyd T, Petit MA, Lin HM, Beck TJ. Lifestyle factors and the development of bone
mass and bone strength in young women. J Pediatr 2004;144:776-82.
[21] Macdonald HM, Kontulainen SA, Petit MA, Beck TJ, Khan KM, McKay HA. Does a
novel school-based physical activity model benefit femoral neck bone strength
in pre- and early pubertal children? Osteoporos Int 2008;19:1445-56.
[22] Matkovic V, Landoll JD, Badenhop-Stevens NE, Ha E-Y, Crncevic-Orlic Z, Li B, et al.
Nutrition influences skeletal development from childhood to adulthood: a study
of hip, spine, and forearm in adolescent females. J Nutr 2004;134:701S-5S.
[23] Specker B, Binkley T. Randomized trial of physical activity and calcium supplementation on bone mineral content in 3‐ to 5‐year‐old children. J Bone Miner
Res 2003;18:885-92.
[24] Shaw CN, Stock JT. Intensity, repetitiveness, and directionality of habitual adolescent
mobility patterns influence the tibial diaphysis morphology of athletes. Am J Phys
Anthropol 2009;140:149-59.
[25] Rauch F, Bailey DA, Baxter-Jones A, Mirwald R, Faulkner R. The “muscle-bone unit”
during the pubertal growth spurt. Bone 2004;34:771-5.
[26] Schonau E, Werhahn E, Schiedermaier U, Mokow E, Schiessl H, Scheidhauer K, et al.
Influence of muscle strength on bone strength during childhood and adolescence.
Horm Res 1996;45:63-6.
D.L. Osborne et al. / Bone 51 (2012) 888–895
[27] Jackowski SA, Faulkner RA, Farthing JP, Kontulainen SA, Beck TJ, Baxter-Jones
ADG. Peak lean tissue mass accrual precedes changes in bone strength indices at
the proximal femur during the pubertal growth spurt. Bone 2009;44:1186-90.
[28] Högler W, Blimkie CJR, Cowell CT, Inglis D, Rauch F, Kemp AF, et al. Sex-specific
developmental changes in muscle size and bone geometry at the femoral shaft.
Bone 2008;42:982-9.
[29] Ruff C. Growth in bone strength, body size, and muscle size in a juvenile longitudinal
sample. Bone 2003;33:317-29.
[30] Petit MA, Beck TJ, Shults J, Zemel B, Foster BJ, Leonard MB. Proximal femur bone
geometry is appropriately adapted to lean mass in overweight children and
adolescents. Bone 2005;36:568-76.
[31] Petit MA, Beck TJ, Hughes JM, Lin HM, Bentley C, Lloyd T. Proximal femur mechanical
adaptation to weight gain in late adolescence: a six‐year longitudinal study. J Bone
Miner Res 2008;23:180-8.
[32] Wetzsteon RJ, Hughes JM, Kaufman BC, Vazquez G, Stoffregen TA, Stovitz SD, et al.
Ethnic differences in bone geometry and strength are apparent in childhood. Bone
2009;44:970-5.
[33] Peacock M, Buckwalter KA, Persohn S, Hangartner TB, Econs MJ, Hui S. Race and sex
differences in bone mineral density and geometry at the femur. Bone 2009;45:218-25.
[34] Travison T, Beck T, Esche G, Araujo A, McKinlay J. Age trends in proximal femur geometry in men: variation by race and ethnicity. Osteoporos Int 2008;19:277-87.
[35] Wang X-F, Duan Y, Beck TJ, Seeman E. Varying contributions of growth and ageing
to racial and sex differences in femoral neck structure and strength in old age.
Bone 2005;36:978-86.
[36] Yan L, Crabtree N, Reeve J, Zhou B, Dequeker J, Nijs J, et al. Does hip strength analysis
explain the lower incidence of hip fracture in the People's Republic of China? Bone
2004;34:584-8.
[37] Matlik L, Savaiano D, McCabe G, VanLoan M, Blue CL, Boushey CJ. Perceived milk
intolerance is related to bone mineral content in 10- to 13-year-old female adolescents. Pediatrics 2007;120:e669-77.
[38] Novotny R, Going S, Teegarden D, Van Loan M, McCabe G, McCabe L, et al. Hispanic
and Asian pubertal girls have higher android/gynoid fat ratio than whites. Obesity
2007;15:1565-70.
[39] Glanz K, Steffen A. Development and reliability testing for measures of psychosocial
constructs associated with adolescent girls' calcium intake. J Am Diet Assoc 2008;108:
857-61.
[40] Shepherd JA, Malkov S, Fan B, Laidevant A, Novotny R, Maskarinec G. Breast density
assessment in adolescent girls using dual-energy X-ray absorptiometry: a feasibility
study. Cancer Epidemiol Biomarkers Prev 2008;17:1709-13.
[41] Yang YJ, Martin BR, Boushey CJ. Development and evaluation of a brief calcium assessment tool for adolescents. J Am Diet Assoc 2010;110:111-5.
[42] Osborne DL, Weaver CM, Mcabe LD, McCabe GM, Novotny R, Boushey C, et al. Tanning
predicts bone mass but not structure in adolescent females living in Hawaii. Am J Hum
Biol 2011;23:470-8.
[43] Martin RB, Burr DB. Non-invasive measurement of long bone cross-sectional
moment of inertia by photon absorptiometry. J Biomech 1984;17:195-201.
[44] Yoshikawa T, Turner CH, Peacock M, Slemenda CW, Weaver CM, Teegarden D, et al.
Geometric structure of the femoral neck measured using dual‐energy X‐ray absorptiometry. J Bone Miner Res 1994;9:1053-64.
[45] Lohman TG, Roche AF, Martorell R eds. Anthropometric Standardization Reference
Manual. Abridged ed. Champaign, Ill: Human Kinetics Books. 1991.
[46] Wong SS, Boushey CJ, Novotny R, Gustafson DR. Evaluation of a computerized
food frequency questionnaire to estimate calcium intake of Asian, Hispanic, and
non-Hispanic white youth. J Am Diet Assoc 2008;108:539-43.
[47] Jensen JK, Gustafson D, Boushey CJ, Auld G, Bock MA, Bruhn CM, et al. Development
of a food frequency questionnaire to estimate calcium intake of Asian, Hispanic, and
white youth. J Am Diet Assoc 2004;104:762-9.
[48] Aaron DJ, Kriska AM, Dearwater SR, Anderson RL, Olsen TL, Cauley JA, et al. The
epidemiology of leisure physical activity in an adolescent population. Med Sci
Sports Exerc 1993;25:847-53.
[49] Aaron DJ, Kriska AM, Dearwater SR, Cauley JA, Metz KF, LaPorte RE. Reproducibility
and validity of an epidemiologic questionnaire to assess past year physical activity
in adolescents. Am J Epidemiol 1995;142:191-201.
[50] Ainsworth BE, Haskell WL, Whitt MC, Irwin ML, Swartz AM, Strath SJ, et al. Compendium of physical activities: an update of activity codes and MET intensities. Med Sci
Sports Exerc 2000;32:S498-504.
[51] SPSS Institute. SPSS; 2012.
[52] Looker AC, Beck TJ, Orwoll ES. Does body size account for gender differences in
femur bone density and geometry? J Bone and Miner Res 2001;16:1291-9.
895
[53] Chen Y, Xiong D-H, Guo Y-F, Pan F, Zhou Q, Zhang F, et al. Pathway-based
genome-wide association analysis identified the importance of EphrinA–EphR
pathway for femoral neck bone geometry. Bone 2010;46:129-36.
[54] Cheung C, Livshits G, Zhou Y, Meigs JB, McAteer JB, Florez JC, et al. Hip geometry
variation is associated with bone mineralization pathway gene variants: the
Framingham study. J Bone Miner Res 2010;25:1564-71.
[55] Karasik D, Hsu Y, Zhou Y, Cupples LA, Kiel DP, Demissie S. Genome‐wide pleiotropy of
osteoporosis‐related phenotypes: the Framingham study. J Bone Miner Res 2010;25:
1555-63.
[56] Zhao L, Liu X, Liu Y, Liu Y, Papasian CJ, Sha B, et al. Genome‐wide association study
for femoral neck bone geometry. J Bone Miner Res 2010;25:320-9.
[57] Mikkola TM, Sipilä S, Rantanen T, Sievänen H, Suominen H, Kaprio J, et al. Genetic and
environmental influence on structural strength of weight‐bearing and non‐weight‐
bearing bone: a twin study. J Bone Miner Res 2008;23:492-8.
[58] Weaver CM, McCabe LD, McCabe GP, Braun M, Martin BR, DiMeglio LA, et al. Vitamin
D status and calcium metabolism in adolescent black and white girls on a range of
controlled calcium intakes. JCEM 2008;93:3907-14.
[59] Zhu K, Greenfield H, Zhang Q, Du X, Ma G, Foo LH, et al. Growth and bone mineral
accretion during puberty in Chinese girls: a five‐year longitudinal study. J Bone
Miner Res 2007;23:167-72.
[60] Wang X, Wang Q, Ghasem‐Zadeh A, Evans A, McLeod C, Iuliano‐Burns S, et al. Differences in macro‐ and microarchitecture of the appendicular skeleton in young Chinese
and white women. J Bone Miner Res 2009;24:1946-52.
[61] Finkelstein JS, Lee M-LT, Sowers M, Ettinger B, Neer RM, Kelsey JL, et al. Ethnic
variation in bone density in premenopausal and early perimenopausal women:
effects of anthropometric and lifestyle factors. JCEM 2002;87:3057-67.
[62] Chevalley T, Bonjour JP, Ferrari S, Rizzoli R. The influence of pubertal timing on
bone mass acquisition: a predetermined trajectory detectable five years before
menarche. J Clin Endocrinol Metab 2009;94:3424-31.
[63] Kardinaal AFM, Hoorneman G, Väänänen K, Charles P, Ando S, Maggiolini M, et al.
Determinants of bone mass and bone geometry in adolescent and young adult
women. Calcif Tissue Int 2000;66:81-9.
[64] Ellison PT. Energetics and reproductive effort. Am J Hum Biol 2003;15:342-51.
[65] Valeggia C, Ellison PT. Interactions between metabolic and reproductive functions in the resumption of postpartum fecundity. Am J Hum Biol 2009;21:
559-66.
[66] Kriemler S, Zahner L, Puder JJ, Braun-Fahrländer C, Schindler C, Farpour-Lambert
NJ, et al. Weight-bearing bones are more sensitive to physical exercise in boys
than in girls during pre- and early puberty: a cross-sectional study. Osteoporos
Int 2008;19:1749-58.
[67] Sayers A, Tobias JH. Fat mass exerts a greater effect on cortical bone mass in girls
than boys. JCEM 2010;95:699-706.
[68] Nurzenski MK, Briffa NK, Price RI, Khoo BC, Devine A, Beck TJ, et al. Geometric indices
of bone strength are associated with physical activity and dietary calcium intake in
healthy older women. J Bone Miner Res 2007;22:416-24.
[69] Uusi‐Rasi K, Sievänen H, Vuori I, Pasanen M, Heinonen A, Oja P. Associations of
physical activity and calcium intake with bone mass and size in healthy women
at different ages. J Bone Miner Res 1998;13:133-42.
[70] Uusi-Rasi K, Sievänen H, Pasanen M, Beck TJ, Kannus P. Influence of calcium intake and
physical activity on proximal femur bone mass and structure among pre- and postmenopausal women. A 10-year prospective study. Calcif Tissue Int 2008;82:171-81.
[71] Valdimarsson Ö, Linden C, Johnell O, Gardsell P, Karlsson M. Daily physical education in the school curriculum in prepubertal girls during 1 year is followed by an
increase in bone mineral accrual and bone width—data from the prospective controlled Malmö Pediatric Osteoporosis Prevention Study. Calcif Tissue Int 2006;78:
65-71.
[72] Bass SL, Saxon L, Daly RM, Turner CH, Robling AG, Seeman E, et al. The effect of
mechanical loading on the size and shape of bone in pre‐, peri‐, and postpubertal
girls: a study in tennis players. J Bone Miner Res 2002;17:2274-80.
[73] Janz KF, Burns TL, Levy SM. Tracking of activity and sedentary behaviors in childhood:
the Iowa bone development study. Am J Prev Med 2005;29:171-8.
[74] Heijmans BT, Tobi EW, Stein AD, Putter H, Blauw GJ, Susser ES, et al. Persistent
epigenetic differences associated with prenatal exposure to famine in humans.
PNAS 2008;105:17046-9.
[75] Bogin B, Smith P, Orden AB, Varela Silva MI, Loucky J. Rapid change in height and
body proportions of Maya American children. Am J Hum Biol 2002;14:753-61.
[76] Malina RM, Peña Reyes ME, Tan SK, Buschang PH, Little BB, Koziel S. Secular
change in height, sitting height and leg length in rural Oaxaca, southern Mexico:
1968–2000. Ann Hum Biol 2004;31:615-33.


© Copyright 2026