
Why Do People Have Drowsy Driving Crashes?
Why Do People Have Drowsy
Driving Crashes?
Input from Drivers Who Just Did
Prepared by:
Jane C. Stutts, Jean W. Wilkins and Bradley V. Vaughn
University of North Carolina Highway Research Center
and University of North Carolina School of Medicine
Prepared for
AAA Foundation for Traffic Safety
1440 New York Avenue, N.W., Suite 201
Washington, D.C. 20005
202/638-5944
www.aaafts.org
November 1999
1
Foreword
This study was funded by the AAA Foundation for Traffic Safety. Founded
in 1947, the AAA Foundation is a not-for-profit, publicly supported charitable research
and educational organization dedicated to saving lives and reducing injuries by preventing traffic crashes.
This report is the latest in a series of research and educational initiatives begun
in 1993 as part of the AAA Foundation’s comprehensive “Wake Up!” campaign
to combat drowsy driving. The campaign’s research-based educational messages have
been delivered through reports, brochures, radio public service announcements, an
audiotape, and material posted on the Foundation’s Internet web site
(www.aaafoundation.org).
This new report is, to the best of our knowledge, the first case-controlled
epidemiological study of drowsy driving crashes. Its large sample size and clever design
have produced some statistically robust findings, which were peer-reviewed prior to the
finalization of this report.
Funding for this study was provided by voluntary contributions from the American
Automobile Association, the Canadian Automobile Association, and their affiliated motor
clubs; from individual AAA members; and from AAA-club-affiliated insurance
companies.
This publication is being distributed by the AAA Foundation for Traffic Safety
at no charge, as a public service. It may not be resold or used for commercial purposes
without the explicit permission of the Foundation. It may, however, be copied in whole or
in part and distributed for free via any medium, provided the AAA Foundation is given
appropriate credit as the source of the material. The opinions, findings, and conclusions
expressed in this publication are those of the authors and are not necessarily those of the
Foundation or of any individual who peer-reviewed the report. The AAA Foundation for
Traffic Safety assumes no liability for the use or misuse of any information, opinions,
findings, or conclusions contained in this report.
© 1999, AAA Foundation for Traffic Safety
2
Table of Contents
Technical Summary ............................................................................................... 5
Chapter 1. Introduction ......................................................................................... 7
Background and Literature Review .............................................................. 7
The Nature of Sleepiness .......................................................................... 7
Sleepiness and Driving ............................................................................. 8
Characteristics of Sleep-related Crashes .................................................. 9
Populations at Risk ................................................................................... 9
Project Overview ........................................................................................ 10
Chapter 2. Method .............................................................................................. 13
Identification of Study Populations ............................................................ 13
Crash-involved Drivers .......................................................................... 13
Crash-free Drivers .................................................................................. 14
Data Collection Procedures ........................................................................ 14
Survey Instrument Development ................................................................ 16
File Development and Analysis .................................................................. 17
Chapter 3. Results ................................................................................................ 19
Description of Study Population ................................................................. 19
Descriptive Comparisons ............................................................................ 23
Awareness of Drowsy Driving ............................................................... 23
Work and Sleep Schedules ..................................................................... 25
Sleep Quality and Sleep Disorders ......................................................... 27
Epworth Sleepiness Scale ....................................................................... 28
Driving Exposure ................................................................................... 29
Crash Circumstances .............................................................................. 31
Measures to Prevent Drowsy Driving Crashes ....................................... 33
Previous Experiences with Drowsy Driving .......................................... 36
Modeling Results ........................................................................................ 37
Risk Factors Related to Work and Sleep Schedules ............................... 38
Risk Factors Related to Sleep Quality .................................................... 40
Excessive Daytime Sleepiness ............................................................... 41
Risk Factors Related to Driving Exposure ............................................. 42
Risk Factors Related to Crash Circumstances ........................................ 42
Identifying Sleep-Related Crashes .............................................................. 45
Chapter 4. Conclusion and Discussion ................................................................ 49
Studying Sleep Related Crashes ................................................................. 49
Key Findings ............................................................................................... 50
Public Awareness of Drowsy Driving .................................................... 50
Work and Sleep Schedules ..................................................................... 50
Sleep Quality and Sleep Disorders ......................................................... 51
Daytime Sleepiness ................................................................................ 51
— continued
3
Contents (continued)
Driving Exposure ................................................................................... 51
Crash Circumstances .............................................................................. 51
Measures to Prevent Drowsy Driving Crashes ....................................... 52
Prior Drowsy Driving Experience .......................................................... 52
Identifying Sleep Related Crashes ......................................................... 53
Implications for Efforts to Reduce Drowsy Driving .................................. 53
References ........................................................................................................... 55
Appendix A.
Appendix B.
Appendix C.
Appendix D.
North Carolina Crash Report Form ............................................... 59
Introductory Letters ....................................................................... 61
Survey Cover Sheet and Interview Form ...................................... 65
Crash Rating Algorithm ................................................................ 79
4
Technical Summary
A number of approaches have been taken to studying the role of drowsiness in
motor vehicle crashes and the characteristics of drivers involved in such crashes. These
approaches include analysis of police-reported crash data, in-depth on-site crash investigations immediately following a crash, and surveys of the general driving population.
The current study takes a different approach: questioning a large sample of drivers
involved in both sleep-related and non-sleep-related crashes soon after the crash.
The study uses a case-control research design. Cases for the study were drivers
involved in recent police-reported crashes in North Carolina whose physical condition at
the time of the crash was identified as either “asleep” or “fatigued” by the investigating
officer. These case drivers are compared to two different populations of control drivers:
(1) drivers involved in recent police-reported crashes in North Carolina who were not
identified as asleep or fatigued, and (2) a second sample of non-crash-involved North
Carolina drivers.
All three populations of drivers were contacted for telephone interviews. Drivers
were questioned about the perceived importance of drowsiness as a causal factor in motor
vehicle crashes; their work and sleep schedules; the quality of their sleep; their usual
level of daytime sleepiness; their driving exposure; measures they may take to reduce
their likelihood of involvement in a drowsy driving crash; and, for the crash-involved
drivers, the specific circumstances surrounding their recent crash. Interviews were
conducted with 467 case drivers (312 sleep, 155 fatigue), 529 control crash drivers, and
407 non-crash drivers, for a total sample size of 1,403 drivers.
The survey results are analyzed both descriptively and by using multiple logistic
regression models. The logistic models produce estimates of the odds ratio for the
occurrence of a sleep-related versus non-sleep-related crash (or the non-occurrence of a
crash) in the presence of a particular risk factor, adjusted for driver age and gender.
Results suggest that the public perceives drowsy driving to be a somewhat less
important cause of motor vehicle crashes than alcohol, but more important than poor
weather conditions, speeding, or driver inexperience, and about equal in importance with
aggressive driving. Three out of four non-crash-involved drivers, and four out of five of
those in recent crashes, said that driver drowsiness was “very important” in causing
crashes.
Work and sleep schedules were both strongly associated with involvement in a
sleep-related crash. Compared to drivers in non-sleep crashes, drivers in sleep crashes
were nearly twice as likely to work at more than one job and their primary job was much
more likely to involve non-standard hours. Working the night shift increased the odds of
a sleep-related (versus non-sleep-related) crash by nearly six times. Time spent asleep
per night was also a strong risk factor: the fewer the hours slept, the greater the odds for
involvement in a sleep-related crash.
Drivers in sleep and fatigue crashes were more likely to report difficulties falling or
staying asleep and were more likely to rate the overall quality of their sleep as “poor” or
“fair.” They were also twice as likely as drivers in non-sleep-related crashes to admit that
they got an inadequate amount of sleep. Few drivers reported having a diagnosed sleep
disorder, but drivers in sleep-related crashes were more than twice as likely to have
elevated Epworth scores, which indicate excessive daytime sleepiness.
5
When asked about the circumstances surrounding their recent crash, drivers in
sleep-related crashes reported being at the wheel significantly longer before their crash,
having been awake for longer the day of their crash, and having slept fewer hours the
night before. Half of the sleep and fatigue crash drivers reported getting six or fewer
hours of sleep the night before their crash, compared to less than 10 percent for other
drivers in crashes. One out of five drivers reported sleeping less than four hours the night
before their crash.
While most drivers agreed with the police officer’s assessment of the role of
sleepiness or fatigue in their crash, not all reported feeling drowsy before crashing. In
fact, 44 percent of the sleep crash drivers and 51 percent of the fatigue crash drivers
reported that they felt either “slightly” or “not at all” drowsy before their crash.
The activities most frequently cited by drivers to help them stay awake while
driving were adjusting the windows or temperature controls in the car, listening to the
radio, tape, or CD player, drinking a caffeinated beverage, and stopping to exercise or
stretch. Less than 12 percent said that they would stop driving and only 8 percent mentioned stopping for a nap. While the percentages varied across the crash populations, the
hierarchy of responses was fairly consistent. While 41 percent of those in sleep crashes
and 36 percent of those in fatigue crashes said that they were more likely to deal with
drowsy driving once it arose rather than try to prevent it from occurring, only one-fourth
of drivers in non-sleep crashes agreed.
As a side analysis, the extent to which sleep-related crashes might be underreported in police crash data was explored. A profile for sleep-related crashes was
developed and hard copies of a sample of the control crash reports were reviewed to
estimate the likelihood that they, too, might be sleep-related. These results were then
compared with the drivers’ responses to questions during the interviews, including the
role they thought drowsiness had played in their crash. The algorithm yielded mixed
results: some crashes classified as sleep-related by the algorithm were reported as not
being caused by driver drowsiness, while others not classified as sleep-related by the
algorithm were attributed to drowsiness by the driver. Generally there was limited
information available from the crash reports for resolving these discrepancies. In addition, there was evidence suggesting that at least some drivers may be unwilling to either
recognize or admit that drowsiness was a factor in their crash.
The results of the study have important implications for educational efforts to
reduce drowsy driving. Drivers must be educated to recognize the symptoms of drowsiness and the necessity of stopping driving once they recognize these symptoms in themselves. They must be convinced that driving drowsy is as dangerous and “wrong” as
driving drunk. While certain segments of the population – shift workers, persons with
sleep disorders, persons taking certain medications – are at increased risk of a sleeprelated crash, the results of this study clearly show that the majority of drivers in sleeprelated crashes simply receive too little sleep. They either sleep too little on a routine
basis, or they got much less than their normal sleep the night prior to their crash.
6
Chapter 1. Introduction
Background and Literature Review
The Nature of Sleepiness
Like hunger and thirst, sleepiness is a basic physiological state, brought about by
the restriction or interruption of sleep. It also results from natural changes in the body’s
level of alertness during each 24-hour sleep-wake cycle. Our internal body clocks
program us to be sleepy twice a day: first during the middle of our nighttime sleep period,
and again 12 hours later, between 2:00 and 4:00 in the afternoon.
Sleepiness is most simply defined as “the inclination to sleep.” It is technically
distinct from fatigue, which has been defined as a “disinclination to continue performing
the task at hand” (Brown, 1994). Fatigue can result from physical labor as well as
repetitive activities such as monitoring a display screen or driving a truck long distances.
An individual can be fatigued without being sleepy, but conditions that produce fatigue
also expose underlying sleepiness. In Principles and Practice of Sleep Medicine, researchers observe that “Heavy meals, warm rooms, boring lectures, and the monotony of
long-distance automobile driving unmask the presence of physiological sleepiness but do
not cause it” (Roth, Roehrs, Carsdadon and Dement, 1994).
The effects of sleepiness and fatigue are very much the same. Studies in the
psychological literature have linked sleepiness and fatigue to decreases in vigilance,
reaction time, memory, psychomotor coordination, information processing, and decision
making (Lyznicki, Doege, Davis and Williams, 1998). For the driver the main effect is a
progressive withdrawal of attention from the road and traffic demands, leading to impaired performance behind the wheel (Brown, 1994). In the case of sleepy drivers, the
ultimate impairment is falling asleep at the wheel.
Recent research has also linked the effects of sleep deprivation to alcohol intoxication. When subjects were kept awake for 17 hours, their performance on a cognitivepsychomotor test was the same as that of a rested person with a blood alcohol concentration (BAC) of 0.05 percent; at 24 hours of sustained wakefulness, performance was
equivalent to a BAC of 0.10 percent (Dawson and Reid, 1997). In sixteen U.S. states,
drivers are legally drunk with a BAC of 0.08; the rest set a level of 0.10. Moreover,
sleepiness has been shown to exacerbate the sedating effects of alcohol so that even low
levels of alcohol make the sleepy driver much more impaired and much more likely to
fall asleep at the wheel (NCSDR/NHTSA, 1998; Roehrs et al., 1994; Dement and
Vaughan, 1999).
Research has shown that individuals are not good judges of how sleepy they are
and how likely they are to fall asleep (FHWA, 1998; Filliatrault et al., 1996; Itoi et al.,
1993). A recent laboratory study conducted at the Stanford Sleep Clinic found that sleepdeprived students had limited and variable ability to predict the onset of sleep. The
study’s authors concluded that “people’s inability to judge sleep onset, and hence their
susceptibility to sleep-related accidents, may be attributable to a scarcity of meaningful
physiological warning signs in some individuals and to a failure to acknowledge the
7
importance of meaningful physiological warning signs in others” (Itoi et al., 1993).
Brown (1993) came to a similar conclusion, noting that drivers who had fallen asleep
while driving experienced virtually the same symptoms as those who had not fallen
asleep. These results have important implications for developing interventions to prevent
sleep-related crashes.
Sleepiness and Driving
Sleepiness would not be a problem if people were never, or seldom, sleepy, or if
they did not drive while sleepy. However, this is clearly not the case. The “1998 Omnibus Sleep in America Poll,” conducted for the National Sleep Foundation, reports that 32
percent of American adults sleep 6 or fewer hours per night, while 64 percent sleep less
than the recommended 8 hours (Johnson, 1998). Two-thirds of adults reported a sleep
problem and one in 13 said they had a diagnosed sleep disorder. Thirty-eight percent
reported excessive daytime sleepiness severe enough to interfere with their jobs. Most
alarmingly, 57 percent of those interviewed for the Omnibus Poll said that they had
driven while drowsy in the past year, while 23 percent said that they had actually fallen
asleep at the wheel (Johnson, 1998).
Similar results have been reported in other studies, both in the United States and
abroad. In a survey of New York State drivers, 55 percent admitted that they had driven
while drowsy in the past year; and over their lifetimes, 23 percent reported that they had
fallen asleep at the wheel but not crashed, 3 percent that they had fallen asleep at the
wheel and crashed, and 2 percent that they had crashed when driving while drowsy
(McCartt, Ribner, Pack and Hammer, 1995). In Great Britain, 29 percent of respondents
to a mail survey reported that they “had felt close to falling asleep while driving” in the
past year (Maycock, 1997). And in Norway, one in 12 drivers reported that they had
fallen asleep while driving during the past 12 months, with 5 percent of these episodes
resulting in a crash (Sagberg, 1988).
The National Highway Traffic Safety Administration estimates that drowsiness is
the primary causal factor in 100,000 police-reported crashes each year, resulting in
76,000 injuries and 1,500 deaths. These numbers represent 1 to 3 percent of all policereported crashes and 4 percent of fatalities (Lyznicki, Doege, Davis and Williams, 1998;
Knipling and Wang, 1995). Other sources have reported higher estimates. In the United
Kingdom, Horne and Reyner (1995) concluded that 16 to 20 percent of motor vehicle
crashes were sleep related based on police-reported data, while Maycock (1997) arrived
at a figure of 9 to 10 percent based on drivers’ self reports of factors contributing to their
recent crashes. In Australia a figure of 6 percent has been reported (Fell, 1994).
Part of the difficulty in determining the contribution of drowsiness to crash occurrence is that in addition to “falling asleep at the wheel,” drowsiness contributes to crashes
by making drivers less attentive and by impairing performance levels. As noted above,
drowsiness also augments the effects of alcohol (Leger, 1995; Lyznicki et al., 1998).
Even in-depth crash investigations cannot always provide definitive answers. As summarized by Lauber and Kayten (1989), “One of the most perplexing problems National
Transportation Safety Board accident investigators face is how to determine what role, if
any, fatigue played in a specific accident. Unlike metal fatigue, human fatigue generally
leaves no telltale signs, and one can only infer its presence from circumstantial evidence.
The problem becomes even more difficult when drugs and alcohol also appear to be
present.” In addition to the 100,000 sleep-related crashes, NHTSA estimates that one
million crashes each year result from driver inattention. Although all of these do not
8
involve sleepiness or fatigue, “sleep deprivation and fatigue make such lapses of attention
more likely to occur” (National Sleep Foundation, undated; Lyznicki et al., 1998).
Characteristics of Sleep-related Crashes
As a group, sleep-related crashes have certain characteristics that set them apart
from other crashes. Compared to non-sleep-related crashes, they are more likely to occur
at night or in midafternoon, times when people have a natural propensity to sleep. They
are also more likely to involve a single vehicle running off the roadway, to occur on
higher-speed roadways, and to result in serious injuries. Typically there is no indication
of braking or other attempts to avoid the crash. The driver is often alone, and is especially
likely to be young and male (NCSDR/NHTSA, 1998; Pack et al., 1995; Horne and
Reyner, 1995). While these characteristics are typical, some sleep-related crashes follow
very different profiles. In addition to run-off-road crashes, sleepy drivers also are likely
to be overrepresented in rear-end and head-on collisions (Knipling and Wang, 1994).
In their analysis of North Carolina data, Pack et al. (1995) presented findings that
support the hypothesis that sleep-related crashes are under-reported. Looking at the time
of day when crashes occurred, the authors found similar mid-afternoon peaks in run-offroad and young (under age 25) driver crashes as they had found in crashes identified by
an investigating officer as sleep-related.
Knowing the characteristics of sleep-related crashes can help in developing and
targeting effective countermeasures. In particular, such knowledge feeds directly into the
identification of high risk populations, described next.
Populations at Risk
Populations at increased risk for involvement in a sleep-related crash include those
who are sleep deprived, those who drive at high-risk times or under high-risk conditions,
and those who consume alcohol or use medications or drugs that interfere with their
ability to maintain alertness.
People are sleep deprived for many reasons. As noted earlier, nearly a third of
American adults report getting 6 or fewer hours sleep at night, and nearly two-thirds
report getting less than the generally recommended 8 hours (Johnson, 1998). William
Dement, a nationally renowned sleep expert, contends that the effects of sleep loss
accumulate over time and do not dissipate (Dement, 1997; Dement and Vaughan, 1999).
Even sleeping 30 or 40 minutes less than needed each night during a normal work week
can result in a 3- to 4-hour sleep debt by the weekend, enough to significantly increase
levels of daytime sleepiness.
Who is most likely to be sleep deprived? Young people and shiftworkers are two
groups that are particularly likely to be sleep deprived (Carskadon, 1990; Lyznicki et al.,
1998; Richardson, Miner and Czeisler, 1990). For young people, sleeping too little is
often a lifestyle choice; but there is also a circadian effect whereby adolescents in particular may find it difficult to go to sleep before late at night, even when they know they have
to get up early the next morning (Carskadon, 1990). Shiftworkers, and especially night
and rotating shift workers, often suffer from poor quality of sleep as well as inadequate
quantity. It has been estimated that 26 percent of men and 18 percent of women in the
U.S labor force perform some sort of shift work (Richardson et al., 1990). Commercial
vehicle operators often fall into this category.
9
Another sleep-deprived group consists of those with untreated sleep disorders. The
National Sleep Foundation estimates that 40 million Americans suffer debilitating sleep
disorders, most of them undiagnosed (NSF, 1999). One of the most common is sleep
apnea, a condition in which a person stops breathing during sleep and must constantly
arouse to resume breathing. Less common, but equally serious, is narcolepsy, a condition
in which a person falls asleep without warning during the daytime. It is believed that less
than a quarter of people with narcolepsy are ever diagnosed (NSF, 1999). Yet another
reason for sleep deprivation is chronic pain, especially among the elderly.
The groups described above are high-risk populations for chronic sleep deprivation.
However, people can also experience more short-term, acute sleep deprivation — for
example, the parent that stays up with a sick child, the student pulling an “all nighter”
before an exam, the late night party-goer. While these episodes can happen to anyone,
they also tend to be more frequent among certain groups, such as college students and
young adults. For someone who is already chronically sleep deprived, an episode of
acute sleep deprivation can be especially damaging. These effects can also manifest
themselves on a broader scale. Coren (1996), for example, presented data that suggested
an increase in crashes occurring in Canada on the Monday after the switch to Daylight
Savings Time (and loss of one hour of sleep time), though other researchers have not
found such differences. Coren reasoned that “as a society we are chronically sleepdeprived. . . [so] that small additional losses of sleep may have consequences for public
and individual safety.”
In addition to people who are either chronically or acutely sleep deprived, persons
who drive at night, who drive on long trips, who drive on long stretches of monotonous
roadway, and who drive by themselves are also high-risk populations for sleep-related
crashes. Commercial vehicle operators frequently meet some, if not all, of these criteria.
As noted earlier, these conditions do not cause someone to fall asleep at the wheel, but
they do make it more likely that a person who is already sleep deprived will find it
difficult to stay awake.
And finally, anyone who consumes alcohol or takes medications (such as certain
antidepressants or antihistamines) that carry a warning that they may cause drowsiness is
at increased risk for a sleep-related crash. Benzodiazepines are prescriptive medicines of
particular concern in this regard (O’Neill, 1998; O’Hanlon, Vermeeren, Uiterwijk, van
Veggel and Swijgman, 1995; Neutel, 1995).
Project Overview
The current study was designed to provide further information that the AAA Foundation
for Traffic Safety and others could use in their efforts to reduce the number of sleeprelated crashes. The study had the following goals:
1. To prioritize target populations for educational efforts to prevent sleep-related
crashes. We were especially interested in examining the extent to which special
population groups (shift workers, young adults, persons with sleep disorders,
etc.) should be targeted, versus the general driving population.
2. To identify messages that need to be conveyed. Why are these people in sleeprelated crashes? Is it due to chronic sleep deprivation, or is acute sleep depriva-
10
tion the bigger problem? What do people already know and practice with regard
to drowsy driving? What do they not know about drowsy driving?
3. To examine potential under-reporting of sleep-related crashes. The literature
suggests that sleep-related crashes are under-reported by law enforcement
officers. We wanted to examine the extent to which drivers’ statements corroborated or refuted the police reports.
The approach to the study was unique: Project staff made weekly visits to the
Division of Motor Vehicles in Raleigh, NC to identify and photocopy crash reports
involving sleepy or fatigued drivers. A control sample of drivers in non-sleep-related
crashes was also identified at the same time. Both populations were subsequently
contacted for a brief telephone interview. A similar interview was conducted with a
random sample of drivers who were not involved in a crash. Thus, the responses of the
sleepy and fatigued drivers could be compared with two populations of control drivers:
drivers in crashes in which sleepiness or fatigue was not identified as a contributing
factor, and drivers who were not involved in crashes at all. Comparisons between the
populations provide evidence of the importance of certain factors (e.g., working multiple
jobs, sleeping fewer hours on average, sleeping fewer hours the night before the crash)
for involvement in a sleep-related crash.
To examine potential under-reporting of sleep-related crashes, an algorithm was
developed for categorizing crashes according to the likelihood that the driver had fallen
asleep (no evidence, possible evidence, probable evidence, definite evidence). The
algorithm took into account such factors as an indication of drowsiness in the report
narrative, the trajectory of the vehicle, evidence of braking, and other indications of
active driving (backing, turning, entering the roadway, etc.). Selected subsets of the crash
report hard copies were reviewed and coded according to the algorithm. The coded
results were then compared to what the driver had said during his or her interview about
the role of drowsiness in the crash. In addition, we also reviewed those cases in which
the police officer indicated that the driver was asleep or fatigued but the driver said
drowsiness was not a factor, as well as the converse, when the driver said that drowsiness
was a factor in his crash but this was not noted by the investigating officer.
The following chapter describes in greater detail the methods used in conducting
the research, including identification of study populations, data collection procedures,
survey instrument development, and data file development and analysis. Chapter 3
presents the study results, beginning with descriptive comparisons of the various study
populations followed by the modeling results pertaining to specific risk factors. Also in
Chapter 3 are the results of the investigation of potential under-reporting of sleep-related
crashes. A final chapter highlights and discusses the key findings from the study and
identifies future research needs.
11
12
Chapter 2. Method
This study uses a case-control design to identify risk factors for sleep- or fatiguerelated crash involvement. Cases in the study were drivers involved in recent policereported crashes whose physical condition at the time of the crash was identified as either
“asleep” or “fatigued” by the investigating officer. These case drivers were compared to
two different populations of control drivers: (1) drivers involved in recent police-reported
crashes who were not identified as asleep or fatigued and (2) a second sample of noncrash-involved drivers. All three populations of drivers were contacted for brief telephone interviews. Following is a more detailed accounting of the methodology
employed.
Identification of Study Populations
Crash-involved Drivers
North Carolina law requires that a standard statewide crash report form be completed by local police, highway patrol, or other trained law enforcement personnel for all
motor vehicle crashes resulting in personal injury or property damage exceeding $1,000.
A paper copy of these crash report forms must be submitted to the Division of Motor
Vehicles Office of Collision Reports in Raleigh, NC within 10 days of the occurrence of
the crash. The paper copies are filed and held for approximately two weeks before being
forwarded to another department for editing and entry into a computerized motor vehicle
crash database.
For the purposes of the current study, permission was obtained to review the paper
copies of the crash reports as they arrived at the DMV office in Raleigh. Trips were
made to Raleigh for this purpose on an approximately weekly basis during four designated data collection periods. Generally there were several thousand reports to review on
each trip. Fortunately, case crashes were easily identifiable from a code of either a “3”
for fatigued or a “4” for asleep in the “physical condition” checkboxes on the front page
of the crash report form (see Appendix A). All reports with these codes were pulled and
photocopied, regardless of driver age, state of residence, availability of contact information (address and telephone number), and type of vehicle being driven.
In addition to these case crashes, the fifth crash report following each identified
sleep or fatigue crash report was pulled as a control case, provided it met the following
conditions:
1. There was at least one driver of a motor vehicle in the crash age 18 or above.
2. Information (address, phone number) was available for contacting at least one
eligible driver.
3. The crash did not involve a sleepy or fatigued driver.
13
If any of these criteria was not met, the next report was selected for review. One
control crash was identified and photocopied for each sleep or fatigue crash, except that
no control crash was pulled if the sleep or fatigue crash involved a driver under age 18,
since under the study protocol approved by the UNC Institutional Review Board for
Research Involving Human Subjects, these persons could not be contacted for an interview.
Each year over 200,000 police-reported crashes occur in North Carolina, including
approximately 1,500 involving sleepy drivers and 800 involving fatigued drivers. In
order to identify an adequate number of case and control drivers for inclusion in the
study, we arranged to identify crashes during four periods of four to five weeks, spread
throughout the year — in February, May, August and November. During each of these
data collection periods, 200 to 225 case crashes and an equal number of control crashes
were identified.
If a control crash involved more than one eligible driver, one of the drivers was
randomly chosen for an interview. For the case crashes, the sleepy or fatigued driver was
always chosen.
Crash-free Drivers
In order to identify a second control population of crash-free drivers, a recent copy
of the North Carolina driver history file was searched and a subset of drivers who had
renewed their license in the past six months identified. This constituted a sample of
approximately 10 percent of the state’s 5.5 million licensed drivers, since drivers in the
state are required to renew their license every five years. This initial step was taken in
order to maximize the probability of a correct address on file. From this sample of
514,000 drivers, reseachers excluded all those who had been involved in at least one
crash during the most recent three-year period. This reduced the total eligible driver pool
to 431,000 drivers. A sample of 1,000 potential survey participants was drawn at random
from this pool.
Since the NC driver history file contains name and address information only and
we wanted to contact potential participants by telephone, the Internet’s “white pages”
directory search capability was used to locate telephone numbers for this sample of
drivers. Only those for whom we were able to obtain a telephone number (approximately
80 percent of the total) were retained for inclusion in the study sample.
Data Collection Procedures
Under a procedure approved by the University of North Carolina School of Public Health
Institutional Review Board for Research Involving Human Subjects, drivers identified
from the review of crash report hard copies were initially sent a letter explaining the
study and requesting their cooperation when contacted later for a brief telephone interview. These letters were generally mailed within two weeks of the date of the crash.
Appendix B contains a copy of the letter. Identical letters were sent to both sleepy/
fatigued and control crash drivers.
14
Cover sheets were prepared for the telephone interviews at the same time letters
were mailed (see Appendix C). These cover sheets contained the name, city and state of
residence, telephone number, age, race, and gender of the driver, but did not identify the
case-control status of the driver (i.e., whether the driver was reported to be asleep or
fatigued at the time of the crash). The cover sheets also provided information on the level
of injury sustained by the driver as well as by other persons in the driver’s vehicle and in
any other vehicle in multi-vehicle crashes. This information was provided to the interviewers primarily to alert them to the need for extra sensitivity in the case of serious
injury crashes. (No attempt was made to contact drivers or family members of drivers in
the few fatal collisions identified.) Finally, each cover sheet included a four-digit “Case
ID” number which linked it back to the police crash report.
Although interviewers were blinded to the case-control status of the person they
were calling, this information was frequently volunteered by the subject during the course
of the interview, especially during the final section of questions about circumstances
surrounding their recent crash.
The interviewers attempted to contact the crash-involved drivers as soon after their
crash as possible; however, the actual time before the interview generally ranged from
two to six weeks after the crash. Delays in interviewing were usually the result of
multiple attempts to contact a particular individual. Generally at least eight contact
attempts were made before classifying subjects as “unable to contact” and removing them
from the subject pool; however, in some cases where interviewers were encouraged to
keep trying (e.g., after being told by a family member when the person was most likely to
be at home), as many as 15 to 20 attempts were made.
Another reason for delay in contacting potential study participants was the scheduling of the mail-outs. The ideal would have been to “pace” letters with the worktime
availability of our telephone interviewers, e.g., by mailing out 10 to 20 letters every few
days. Instead, because of the process used to identify crash reports at the DMV, letters
were sent out in batches of 100 or more each week over four to five consecutive weeks,
followed by eight to 10 weeks during which no letters were mailed. Although the interviewers generally tried to accommodate the high demand periods, because they worked
part-time for the project they could not contact everyone as quickly as we would have
liked.
All telephone interviewing was conducted from HSRC by a core group of five
telephone interviewers hired specially for the project. Three of the interviewers had
previous telephone interview experience at a large marketing research firm; one had
previously worked for HSRC on a project involving face-to-face interviewing of college
students; and the fifth had extensive telephone experience in private sector work. Interviewers generally worked 10 to 20 hours per week, primarily in the evenings and on
weekends, but also during morning and afternoon hours when needed, such as when
attempting to contact subjects who worked evening or night shifts but were home during
the daytime.
Before the interviews, the data collectors participated in a training session. Each
was also monitored both during their initial interviews and randomly throughout the data
collection. Completed survey forms were continuously reviewed and edited by the
Principal Investigator and returned to the interviewers on those rare occasions when
clarification or follow-up was needed.
15
The interviewers maintained a log of the date and time of each call attempt, along
with the outcome. Interviewers also noted the final completion status for each case,
which could include any of the following:
•
Completed interview
•
Partial interview
•
Underage subject (<18) not interviewed
•
Refused interview
•
Unable to contact (no telephone number, incorrect number, etc.)
•
Unable to interview due to language barrier
•
Unable to interview due to physical impairment (injured, sick, unable to hear)
•
Not reached after maximum contact attempts
•
Other
No attempt was made to contact drivers under the age of 18 involved in sleep- or
fatigue-related crashes, even though these crash reports were pulled and logged, because
of strict IRB requirements. Interviews generally took eight to 10 minutes to complete,
but could last as long as 15 to 20 minutes depending on the person being interviewed.
Similar procedures were followed for contacting and interviewing the non-crash
drivers. A copy of the advance letter sent to these subjects is also contained in Appendix
B. The only differences in interviewing control drivers was that they were asked one
question at the outset to confirm that they had not been involved in a crash in the past
three months, since our driver history file did not include the most recent three-month
crash history; and they were not asked questions pertaining to crash circumstances since
they had not been involved in a crash. Although it would have been preferable to intersperse interviews with non-crash drivers throughout the year-long data collection period,
most of the these interviews were conducted during the final four months of the data
collection process (September through December), due to delays in obtaining updated
driver history files from the North Carolina DMV.
Since the non-crash driver interviews were not tied to a particular crash event, we
could better coordinate mailing the advance notice letters and contacting individuals for
interviews. This resulted in a shorter time between initial letter contact and completion of
an interview.
Survey Instrument Development
The specific survey questions were developed in consultation with a sleep specialist at
the University of North Carolina Sleep Disorders Clinic to address the study’s two
primary research questions:
1. What are the risk factors for driver involvement in a sleep-related crash?
2. What do drivers do to prevent being in a sleep-related crash?
16
Appendix C contains a copy of the telephone survey instrument. As noted above,
the same instrument was used for crash-involved and non-crash-involved drivers, except
that for the latter the final crash event section of questions was omitted. All surveys were
filled out in paper format.
There were seven basic sections to the survey, as summarized below:
Section I: Awareness - rate the importance of seven different factors (poor weather
conditions, speeding, driver inexperience, aggressive driving, alcohol, inattention, and drowsiness) as causes of motor vehicle crashes.
Section II: Work /Sleep Schedules - number of jobs worked, total hours on the job,
work schedule, school attendance, hours sleep per day, usual bedtime time, etc.
Section III: Sleep Quality - overall quality of sleep, difficulties staying or falling
asleep, adequacy of sleep, and sleep disorders.
Section IV: Epworth Sleepiness Scale - eight questions that provide a validated
estimate of overall level of daytime sleepiness (see Johns, 1991; Johns, 1992).
The questions pertain to the likelihood of “dozing off” in different situations such
as when reading, watching TV, or lying down to rest in the afternoon.
Section V: Driving Exposure - annual miles driven, driving as part of job, total time
spent driving each day, percentage of driving done at night or from midnight to 6
a.m., frequency of long distance driving.
Section VI: Drowsy Driving Countermeasures - things done to help stay awake and
alert once becoming drowsy, or to prevent becoming drowsy on a long trip.
Section VII: Crash Circumstances - length of time driving prior to crash, amount of
sleep the previous night, how drowsy felt just prior to crash, perceived importance of drowsiness in the crash, whether taking any medications that may induce
drowsiness.
The survey was initially pretested in-house, revised, and pretested again during
interviewer training. A few additional modifications were made after the first few
surveys were completed to clarify some of the questions and to provide more specific
guidelines for the interviewers.
File Development and Analysis
Completed survey forms were checked for accuracy and consistency by the Principal
Investigator and edited for data entry. Actual data entry was carried out on a specially
designed data-entry screen created with Microsoft Access. For cases where an interview
was completed, both the cover sheet information and the completed survey information
were entered. For cases where an interview was not completed (refusal, unable to
contact, driver under age 18, etc.) only the cover sheet information was entered.
In addition to entering the survey data, a second Microsoft Access screen was
created for entering data from the police crash report form for drivers involved in crashes.
17
This screen included 15 variables that could be used to link the survey data to the crash
information in the computerized NC motor vehicle crash file (date, time and county of
crash, driver first and last name, number of vehicles in crash, vehicle position, number of
the case vehicle, etc.). Normally linkage would be accomplished by entering a DMVassigned crash report number. However, the original crash reports had been pulled before
a number was assigned; hence linkage information was needed. (Alternatively, all of the
information from the crash report that might be used in the analysis could have been
entered, but this would have limited the ultimate number of variables that could be
examined and would also have excluded some DMV-calculated variables.)
To create the final data analysis file, survey and crash report files were first merged
using the four-digit case identification number. Using the information recorded from the
hard copies of the police crash reports, the crash-involved drivers were then linked to the
North Carolina crash data file. This required considerable effort and case-by case matching, because any number of factors (mispelling of a name, corrected age on the computerized file, mis-entry of a date or time, etc.) could lead to a “failure” in the match process.
Ultimately, however, all but two of the crash reports filed were matched. Once a crash
was matched, it could be verified by checking additional variables on the hard and
computerized versions of the crash report.
After matching to the computerized crash data, a final merged database was created
containing both the survey data and relevant information from the crash file. Analyses of
the data were carried out using SAS System software (SAS Institute, Inc., Cary, NC).
This included descriptive tabulations using chi-square tests for categorical variables and
t-tests for continuous variables, along with logistic regression modeling to examine the
significance of specific individual factors while controlling for the effects of others.
A side analysis into under-reporting of sleep-related crashes in the police crash data
was performed. A “profile” of a sleep-related crash was developed and hard copies of a
sample of the control crash reports were reviewed to estimate the likelihood that they,
too, might be sleep-related. These results were then compared with the drivers’ responses
to questions during the interviews, including the role they thought drowsiness had played
in their crash.
18
Chapter 3. Results
Description of Study Populations
Researchers identified 2,331 potential study participants, including
613
drivers in sleep-related crashes,
299
drivers in fatigue-related crashes,
861
drivers in control (non-sleep, non-fatigue) crashes, and
558
non-crash involved drivers.
The number of sleep plus fatigue crash cases (912) is greater than the number of control
crash cases because control cases were not pulled for incidents where the sleepy or
fatigued driver was under the age of 18.
As described in Chapter 2, the crash-involved drivers were identified from a review
of paper copies of crash report forms as they were received at the North Carolina Department of Motor Vehicles. Reports were collected over four 4-to-5-week periods spread
throughout the 1998 calendar year. Table 1 provides information on how the three
samples of crash-involved drivers who were identified through this process compare to
the overall population of crash-involved drivers for that year, as reflected in the computerized statewide crash file. There are no significant age or gender differences between
the study samples and the comparison crash populations. The one difference is the
absence of drivers under the age of 18 in the control crash sample, caused by purposely
limiting the sample to drivers 18 and over. (One case was pulled and contacted for an
interview because the driver’s age as recorded on the crash report form was 18, although
it was officially calculated by the DMV as 17.)
Table 1. Comparison of study populations with overall 1998 North Carolina crash data.
Demographic
Variable
Sleep Crash Drivers
Study
All 1998
Sample
Crashes
(N=613)
(N=1485)
Fatigue Crash Drivers
Study
All 1998
Sample
Crashes
(N=299)
(N=821)
Control Crash Drivers
Study
All 1998
Sample
Crashes
(N=861)
(N=417,195)
Age
<18
18-19
20-24
25-29
30-39
40-49
50-59
60-69
70+
7.21
14.9
23.8
13.1
15.2
12.1
7.3
3.6
2.9
7.0
14.8
24.2
12.2
15.9
10.8
7.0
4.5
3.7
5.0
10.0
21.1
16.4
21.4
11.4
8.4
2.7
3.7
4.9
11.2
21.3
15.0
18.6
14.4
7.1
3.9
3.7
0.1
5.7
16.8
14.1
22.9
18.0
10.7
6.4
5.3
6.7
6.5
14.2
12.8
21.6
16.3
10.1
5.6
6.3
Gender
Male
Female
74.5
25.5
74.0
26.0
71.8
28.2
71.9
28.1
56.4
43.6
57.8
42.2
1
Column percent
19
Not shown in Table 1 are the demographic characteristics of the non-crash involved
drivers, since these drivers do not have a counterpart in the 1998 crash file. The average
age of the non-crash drivers was considerably older than for any of the three populations
of crash-involved drivers: 56.5 years versus 31.6 for sleepy drivers, 32.9 for fatigued
drivers, and 38.2 for other crash-involved drivers. The non-crash drivers were also less
likely to be male: 48.4 percent male, compared with 74.5 percent for sleep crash drivers,
71.8 percent for fatigue crash drivers, and 56.4 percent for control crash drivers. These
differences probably reflect the fact that the sample was selected to represent drivers who
had not been involved in any reported crashes during the previous three years.
Table 2 presents the interview completion status for each of the four study populations identified. Overall, just over half of the sleep and fatigue crash drivers were successfully contacted and interviewed, compared to 61 percent of the control crash drivers
and 73 percent of the non-crash drivers. The lower overall completion rate for sleep and
fatigue drivers was not caused by a high refusal rate. Instead, it was caused by inclusion
of drivers under 18, who were not interviewed, and a higher percentage of cases that
could not be contacted. These “unable to contact” cases included drivers who either did
not have a telephone number listed on the crash report form or had unlisted, non-working,
or incorrect phone numbers. In identifying control crash cases, cases were not pulled if
there was no phone number on the crash form, and in identifying non-crash involved
drivers to contact, letters were only sent to persons whose telephone number had been
located through an Internet search.
The interview cooperation rates for the study populations, defined as the number of
completed interviews divided by the number of completions plus refusals, were all quite
similar, and ranged from .86 to .88 (see Table 3).
Table 2. Interview completion status by study population.
Interview Completion
Status
Sleep Crash Drivers
(N=613)
Fatigue Crash Drivers
(N=299)
Control Crash Drivers
(N=861)
Non-Crash Drivers
(N=558)
Completed Interview
50.11
51.8
61.0
72.8
Partial Interview
0.8
0.0
0.5
0.2
Refused Interview
7.5
8.7
10.3
9.9
Under Age 18
7.2
5.0
0.0
0.0
Language Barrier
1.0
1.7
1.5
0.0
Physical Condition
0.3
2.0
0.8
0.9
Unable to Contact
22.0
19.4
14.6
7.0
Maximum Attempts
10.1
8.4
10.2
7.2
Other
1.0
3.0
1.1
2.1
Total
100.0
100.0
100.0
100.1
1
Column percent
20
Table 3. Interview cooperation rates by study population.
Participant Status
Sleep Crash Drivers
Fatigue Crash Drivers
Control Crash Drivers
Non-Crash Drivers
Number Completed
Interviews 1
307
155
525
406
Number Refused Interviews
46
26
89
55
Cooperation Rate2
.87
.86
.86
.88
1
2
Excludes 10 subjects (5 sleep, 4 control, 1 non-crash) with only partially completed interviews
Completed interviews / (completed interviews + refused interviews)
Table 4 provides information on the demographic characteristics of persons who
participated in the study compared to those who were contacted but refused to participate
and to the total population of non-participants. Compared to non-participants, participants were older, more likely to be female, and more likely to be white (p<.001 for each).
The average age of study participants was 43.4 years, compared to 35.2 years for nonparticipants (p<.001). However, there were no significant demographic differences
between those who participated in the study and those who, when contacted, refused to
participate. The average age of refusals was 42.8 years, only slightly lower than that for
participants (43.4, p=0.64). The fact that non-participants were more likely to be young,
male, and non-white probably reflects the greater difficulty in contacting these populations for a telephone survey. In addition, sleepy and fatigued drivers under the age of 18
were automatically classified as non-participants since they could not be interviewed
under the study’s Human Subjects Review Board-approved protocol.
Table 4. Comparison of participants with non-participants and refusals across
demographic variables.
Demographic Variable
Participants
(N=1403)
Refusals
(N=216)
All Non-Participants
(N=928)
Overall
(N=2331)
Age
<18
18-19
20-24
25-29
30-39
40-49
50-59
60-69
70+
0.01
6.2
12.3
9.8
16.3
20.6
13.3
10.8
10.7
0.5
6.5
11.1
12.0
19.0
15.3
14.8
10.2
10.7
6.5
8.9
19.5
14.0
17.1
12.8
10.7
6.0
4.4
2.6
7.3
15.2
11.5
16.6
17.5
12.2
8.9
8.2
Gender
Male
Female
58.4
41.6
57.7
42.3
65.2
34.8
61.1
38.9
Race
White
Black
Other
77.4
20.3
2.3
78.6
20.5
0.9
69.6
23.5
6.8
74.3
21.6
4.1
1
Column percent
21
Finally, Table 5 presents similar demographic information within each of the four
study populations for those who participated in the study. The sleep and fatigue participants were significantly younger and more likely to be male compared to either the
control crash participants or the non-crash participants (p<.001 in both comparisons).
Over a third of the participating sleepy drivers and 28 percent of the fatigued drivers were
under the age of 25. In contrast, only 20 percent of the participating control crash drivers
and none of the non-crash drivers were under 25. In addition, 7 out of 10 of the sleep or
fatigue drivers were male, compared to 55 percent of the control crash drivers and 48
percent of the non-crash drivers. Sleep and fatigue participants did not differ significantly
from control crash participants with respect to race, but all three crash groups were less
likely to be white compared to the non-crash driver group (p<.001).
Overall, these results confirm that representative samples of sleepy, fatigued, and
control crash drivers were identified from the North Carolina crash data, and that drivers
who participated in the telephone interviews were not demographically different from
those who refused to participate. While participants in each of the three crash populations were more likely than non-participants to be older, female, and white, these differences are probably attributable to the increased difficulty of making telephone contact
with young males and minorities. There were also clear differences in the demographic
compositions of the interviewed study populations. Since demographic characteristics,
particularly age and gender, are associated with many of the risk factors explored in this
current study, these differences were taken into consideration in the analyses.
Table 5. Demographic comparisons of participating subjects across study populations.
Demographic Variable
Sleep Crash Drivers
(N=312)
Fatigue Crash Drivers
(N=155)
Control Crash Drivers
(N=529)
Non-Crash Drivers
(N=407)
Age
18-19
20-24
25-29
30-39
40-49
50-59
60-69
70+
14.71
20.5
11.9
16.7
17.0
9.3
5.1
4.8
9.7
18.1
13.6
24.5
14.2
10.3
3.9
5.8
4.9
15.3
13.2
22.1
20.4
11.0
6.2
6.8
0.0
0.0
2.5
5.2
26.0
20.4
23.8
22.1
Gender
Male
Female
71.1
28.9
68.8
31.2
55.4
44.6
48.4
51.6
Race
White
Black
Other
70.7
26.7
2.6
74.0
23.4
2.6
74.0
22.6
3.4
88.2
11.3
0.5
1
Column percent
22
Descriptive Comparisons
This section presents descriptive results based on the telephone interview data.
Percentage distributions of a given variable are presented within each of the four study
populations, and comparisons are made between drivers in sleep-related crashes and
drivers in non-sleep-related crashes, and between drivers in sleep-related crashes and
drivers not involved in crashes. These descriptive results do not make any adjustment for
differences in age and gender among the study populations. The variables are organized
into tables according to the different sections of the survey and include:
•
Awareness of the drowsy driving problem
•
Work and sleep schedules
•
Sleep quality and sleep disorders
•
Usual level of sleepiness
•
Driving exposure
•
Crash circumstances
•
Strategies to prevent drowsy driving
•
Prior experiences with drowsy driving
Results are based on a total of 1,403 completed interviews, including 312 drivers in
sleep crashes, 155 drivers in fatigue crashes, 529 drivers in other crashes, and 407 drivers
not involved in crashes. Drivers involved in sleep-related crashes shared more common
characteristics with drivers in non-sleep-related crashes than with non-crash drivers. This
situation probably reflects the different demographic compositions of the crash and noncrash groups, as noted in Table 5 above. Nevertheless, some important differences
emerged between the sleepy and non-sleepy crash groups that point to risk factors for a
drowsy driving crash.
Awareness of Drowsy Driving
Participants were asked about the importance of seven different factors in causing
motor vehicle crashes, including driver drowsiness. The seven factors were randomly
presented so that their ordering would not be a source of response bias. Results to these
initial questions are summarized in Tables 6 and 7. The vast majority of participants
described all of the factors as either “very” or “somewhat” important, so there were only
slight variations in the overall rankings computed for Table 7.
Alcohol received the highest overall ranking, with approximately 95 percent of the
participants in each study population responding that it was “very important” in causing
motor vehicle crashes. Among sleep crash drivers, driver drowsiness received the next
highest ranking. This may not be surprising, given that these drivers had very recently
been involved in a sleep-related crash. What may be more surprising, however, is that
drowsiness was rated alongside aggressive driving as “very important” or “important” by
98 percent of the drivers in each of the four study populations. Driver inexperience,
speeding, and driver inattention received generally lower ratings, while reaction to poor
weather conditions was mixed. Drivers not involved in recent crashes assigned relatively
23
Table 6. Comparison of study populations across perceived importance of different factors in
causing motor vehicle crashes.
Factor Causing Crashes
Sleep
Crash
Drivers
Fatigue
Crash
Drivers
Control
Crash
Drivers
NonCrash
Drivers
Sleep+Fat
vs.
Control
P-value1
Sleep+Fat
vs.
Non-crash
P-value1
Poor weather conditions
Very important
Somewhat important
Somewhat unimportant
Very unimportant
72.42
25.6
1.6
0.3
81.9
18.1
0.0
0.0
77.3
22.4
0.4
0.0
67.8
30.5
1.5
0.3
.261
.038
Speeding
Very important
Somewhat important
Somewhat unimportant
Very unimportant
68.3
28.5
2.9
0.3
73.6
23.2
3.2
0.0
71.0
25.1
4.0
0.0
77.1
21.2
1.5
0.3
.697
.045
Driver inexperience
Very important
Somewhat important
Somewhat unimportant
Very unimportant
59.2
37.9
2.9
0.0
60.0
33.6
5.8
0.7
58.3
37.9
3.8
0.0
53.7
43.1
3.2
0.0
.889
.131
Aggressive driving
Very important
Somewhat important
Somewhat unimportant
Very unimportant
80.4
17.0
2.6
0.0
77.8
20.9
1.3
0.0
79.2
19.2
1.5
0.0
80.9
18.3
0.7
0.0
.722
.231
Alcohol
Very important
Somewhat important
Somewhat unimportant
Very unimportant
94.9
5.1
0.0
0.0
95.5
4.5
0.0
0.0
95.8
4.2
0.0
0.0
93.8
6.2
0.0
0.0
.561
.430
Driver drowsiness
Very important
Somewhat important
Somewhat unimportant
Very unimportant
84.5
14.8
0.7
0.0
79.9
19.5
0.7
0.0
80.3
18.6
1.1
0.0
74.1
24.7
1.0
0.3
.456
.006
Driver inattention
Very important
Somewhat important
Somewhat unimportant
Very unimportant
66.0
31.7
1.9
0.4
71.6
27.0
1.4
0.0
72.2
26.9
0.9
0.0
72.3
27.0
0.5
0.3
.194
.178
1
2
Chi-squares computed with third and fourth categories of variable combined.
Column percent.
24
Table 7. Comparison of study populations across ranking of factors as causes of
motor vehicle crashes.
Factors Causing
Crashes
Poor weather conditions
Speeding
Driver inexperience
Aggressive driving
Alcohol
Driver drowsiness
Driver inattention
1
Asleep
Crash Drivers
Fatigue
Crash Drivers
Control
Crash Drivers
NonCrash Drivers
41
5
7
3
1
2
6
2
5
7
4
1
3
4
4
6
7
3
1
2
5
6
3
7
2
1
5
4
Ranking in order of most (=1) to least (=7) important, based on the Table 6 results.
less importance to drowsiness and poor weather conditions and greater importance to
speeding. As in all the results presented in this section, age and gender differences
among the groups may influence these findings.
Work and Sleep Schedules
Results pertaining to work and sleep schedules are presented in Table 8. Drivers
involved in sleep-related crashes were much more likely than non-crash drivers, but only
slightly more likely than control crash drivers, to be employed. Given that they were
employed, however, sleep and fatigue drivers were more likely than other drivers in
crashes to work at more than one job (p=.02). This was especially true for drivers who
were described as asleep rather than fatigued. Of employed drivers in sleep crashes, 20
percent worked at more than one job, compared to 13 percent of drivers in fatigue
crashes, 11 percent of drivers in other crashes, and only 7 percent of non-crash drivers.
Sleep and fatigue crash drivers also worked more total hours per week, again with
the sleep drivers coming out on top. Twenty-seven percent of employed sleep crash
drivers, and 21 percent of employed fatigue crash drivers, worked 60 or more hours a
week in the time before their crash.
Just half of the drivers in sleep or fatigue crashes worked regular “8-to-5” jobs and
very few worked only part-time. In contrast, nearly two-thirds of the control crash
drivers worked regular hours and an additional one-fourth worked part-time. Among
sleep drivers, 14 percent worked a night shift job. For fatigue drivers this number jumps
to 24 percent. Sleep and fatigue drivers were also more likely to work rotating shifts and
“other” schedules. The latter includes split shifts and schedules that require full days or
weekends on the job, such as might occur in the military.
Despite their younger age, sleep and fatigue crash drivers were no more likely than
control crash drivers to be students attending school. Fatigue crash drivers did average a
greater number of hours each week studying or attending class – 22.1 hours for fatigue
crash drivers attending school, compared to 19.8 for sleep crash drivers and 19.4 for
control crash drivers. These differences, however, were not statistically significant.
Sleep and fatigue crash drivers also averaged fewer hours of sleep per night than
either control crash drivers or non-crash drivers. The average sleep time for the different
25
populations was 6.5 hours for sleep crash drivers, 6.4 hours for fatigue crash drivers, 7.1
hours for control crash drivers, and 7.2 hours for the non-crash controls. One-fourth of
the sleep crash drivers and over a third of the fatigue crash drivers reported averaging less
than six hours of sleep a night. This is two to three times the percentage reported by
control crash drivers.
Table 8. Comparison of study populations across work / sleep schedule variables.
Work / Sleep Schedule
Sleep
Crash
Drivers
Fatigue
Crash
Drivers
Control
Crash
Drivers
NonCrash
Drivers
Sleep+Fat
vs.
Control
P-value
Sleep+Fat
vs.
Non-crash
P-value
Employment Status
Employed
Not employed
85.11
14.9
83.9
16.1
80.4
19.6
58.3
41.7
.077
.001
Number jobs work 2
1 job
2 jobs
3 or more jobs
80.4
18.1
1.5
86.9
10.8
2.3
89.2
10.1
0.7
93.3
6.3
0.4
.018
.001
Total hours work/week 2
<40
40-49
50-59
60+
Varies
11.0
45.6
16.4
27.0
0.0
15.9
46.0
16.7
20.6
0.8
18.1
49.4
15.0
17.0
0.5
25.2
53.9
12.8
7.7
0.4
.0013
.0013
Work schedule 2
Regular
Part time
Morning
Afternoon/Evening
Night
Rotating shift
Other
Variable
53.3
7.0
2.7
4.3
14.4
4.3
5.5
8.6
48.4
5.5
1.6
3.1
24.2
3.1
5.5
8.6
64.7
10.6
2.2
5.1
4.1
2.2
2.9
8.2
72.9
14.0
0.9
0.9
1.7
2.1
1.3
6.4
.001
.001
Attend school
Yes
No
12.1
87.9
13.5
86.5
13.3
86.7
4.7
95.3
.726
.001
Hours Sleep / Night
Less than 6
6 - 6.9
7 - 7.9
8+
Varies
24.7
28.6
26.0
20.1
0.7
36.1
20.0
17.4
26.5
0.0
11.4
21.5
30.2
36.7
0.2
6.9
25.4
33.7
34.0
0.0
.001
.001
1
Column percent.
Among those employed.
3
“Varies” cases omitted from calculations.
2
26
Sleep Quality and Sleep Disorders
A number of questions pertained to quality and adequacy of sleep, including
possible sleep disorders. These results are summarized in Table 9. Drivers in sleep and
fatigue crashes were more likely than drivers in control crashes to report difficulties in
falling asleep. Drivers in control crashes, in turn, were more likely to have trouble falling
asleep than non-crash drivers. Seventeen percent of sleep drivers and 19 percent of
Table 9. Comparison of study populations across sleep quality variables.
Sleep Quality Variables
Sleep
Crash
Drivers
Fatigue
Crash
Drivers
Control
Crash
Drivers
NonCrash
Drivers
Sleep+Fat
vs.
Control
P-value
Sleep+Fat
vs.
Non-crash
P-value
Trouble falling asleep
Always
Often
Sometimes
Never
6.51
10.7
36.1
46.8
7.1
11.6
38.7
42.6
4.0
6.1
43.1
46.9
2.5
3.9
45.5
48.2
.005
.001
Trouble staying asleep
Always
Often
Sometimes
Never
4.2
11.0
33.6
51.3
7.1
9.0
36.1
47.7
4.9
6.5
34.4
54.3
3.0
9.3
43.2
44.5
.145
.035
Overall quality of sleep
Excellent
Good
Fair
Poor
17.2
49.8
24.9
8.1
18.1
41.9
27.7
12.3
24.3
50.7
21.4
3.6
24.3
57.5
16.7
1.5
.001
.001
Amount of sleep
Too much
Not enough
About right
2.9
46.5
50.7
4.5
45.8
49.7
2.5
23.3
74.2
1.7
15.0
83.3
.001
.001
Loud snorer
Yes
No
Don’t know
41.1
54.4
4.5
43.5
48.1
8.4
43.0
52.3
4.8
54.8
37.0
8.2
.807
.001
Stop breathing during sleep
Yes
No
Don’t know
7.7
76.1
16.1
11.1
77.1
11.8
6.3
84.4
9.3
5.4
88.5
6.1
.006
.001
Diagnosed sleep disorder2
Yes - apnea
Yes - narcolepsy
Yes - other
No
Don’t know
1.3
0.3
1.6
94.8
1.9
0.7
0.0
2.6
96.1
0.7
1.0
0.4
1.3
96.7
0.6
0.7
0.3
0.7
98.3
0.0
.591
.149
1
2
Column percent.
Sleep disorder categories combined for testing.
27
fatigue drivers reported that they always or often had difficulty falling asleep, compared
to 10 percent of control crash drivers and 6 percent of non-crash drivers. Differences
were less pronounced among the populations in the percentage of drivers who reported
difficulty staying asleep.
Sleep and fatigue crash drivers were also more likely to report poor quality of
sleep. One-third of sleep drivers and 40 percent of fatigue drivers perceived the quality
of their sleep to be only “fair” or “poor.” This compares to 25 percent of drivers in
control crashes and 18 percent of non-crash drivers. Sleep and fatigue drivers were three
times as likely as control crash drivers, and six times as likely as non-crash drivers, to
rate their sleep as “poor.”
Sleep and fatigue crash drivers were significantly more likely to report insufficient
sleep. Nearly half of sleep and fatigue crash drivers reported that they did not get enough
sleep, a figure double that for control crash drivers and three times that for non-crash
drivers. Few drivers in any of the groups reported getting too much sleep.
Loud snoring can be symptomatic of obstructive sleep apnea, a condition in which
a person’s throat muscles relax and collapse during sleep, blocking the intake of air. The
sleeper stops breathing, sometimes for a minute or longer, then awakens enough to gasp
for air and falls back asleep. This sleep/gasp cycle can repeat itself hundreds of times a
night. Usually the sleeper does not remember these nighttime awakenings, but suffers
from extreme sleepiness during the daytime. An estimated 5 to 10 million Americans
have severe sleep apnea, but only 5 percent of those have been diagnosed with the
disorder (Dement and Mitler, 1993).
Nearly half of the drivers who participated in the study reported that they were loud
snorers. The non-crash drivers reported the highest incidence of loud snoring (55 percent), while there were no significant differences among the three populations of crashinvolved drivers (each 41 to 43 percent). None of the four study populations reported a
high incidence of diagnosed sleep disorders. Sleep and fatigue crash drivers, however,
were more likely to report that they either stopped breathing during sleep or that they
were not sure if they stopped breathing during sleep. These results suggest that the sleep
and fatigue crash drivers may have a higher frequency of undiagnosed sleep disorders.
Epworth Sleepiness Scale
The Epworth Sleepiness Scale (ESS) measures a person’s general level of daytime
sleepiness. The respondent is asked to rate the likelihood of dozing or falling asleep in
eight situations: sitting and reading, watching TV, sitting inactive in a public space, riding
as a passenger in a car, lying down to rest in the afternoon, talking to someone, sitting
quietly after lunch, and stopped in traffic while driving. Ratings for each item range from
0 (no chance of sleep) to 3 (high chance of sleep). The individual numerical ratings are
then summed for an overall score. Total scores thus range from 0 (minimal sleepiness) to
24 (maximum sleepiness).
While only two respondents (both sleep crash drivers) had Epworth scores that
placed them in the extreme sleepiness category, 26 percent of the sleep crash drivers and
22 percent of the fatigue crash drivers had scores greater than 10, which indicate a
“heavy” level of daytime sleepiness (see Table 10). An additional 35 percent of sleep
crash drivers and 41 percent of fatigue crash drivers had scores of 6-10, suggesting
28
Table 10. Comparison of study populations across Epworth Sleepiness Scale.
Epworth Sleepiness Scale
Epworth Sleepiness Scale1
Slight sleepiness (0-5)
Moderate sleepiness (6-10)
Heavy sleepiness (11-20)
Extreme sleepiness (21+)
Mean Epworth Score (s.d.)
1
2
Sleep
Crash
Drivers
Fatigue
Crash
Drivers
Control
Crash
Drivers
NonCrash
Drivers
Sleep+Fat
vs.
Control
P-value
Sleep+Fat
vs.
Non-crash
P-value
38.72
35.4
25.3
0.7
37.3
41.2
21.6
0.0
53.6
35.8
10.5
0.0
59.0
34.1
7.0
0.0
.001
.001
7.6
(+ 4.4)
7.1
(+ 4.3)
5.6
(+ 3.4)
5.1
(+ 3.4)
Heavy and extreme categories combined for testing.
Column percent.
moderate daytime sleepiness. These differences were significant when comparing sleep
and fatigue crash drivers to control crash drivers as well as to non-crash drivers. Average
Epworth scores were 7.6 for sleep crash drivers, 7.1 for fatigue crash drivers, 5.6 for
control crash drivers, and 5.1 for non-crash drivers.
Driving Exposure
Table 11 presents information on the amount and types of driving in which the
various study populations engaged. There were no significant differences between case
(sleep plus fatigue) and control crash drivers in the total number of miles driven per year,
in whether or not they drove as part of their job, and in the number of days per week they
drove as part of their job. Non-crash drivers, however, had significantly lower exposure
for each case, a result which likely reflects the higher proportion of females and older
drivers in this group.
Sleep and fatigue crash drivers reported significantly higher average daily driving
times than either of the two comparison populations. Mean driving times (not shown in
the table) were 3.1 hours a day for sleep crash drivers, 2.7 hours a day for fatigue crash
drivers, 2.6 hours a day for control crash drivers, and only 1.4 hours a day for non-crash
drivers. Sleep and fatigue crash drivers also reported that a higher percentage of their
driving occurred at night and between midnight and 6 a.m., an especially risky time.
Mean percentages of driving occurring after dark were 33.4, 33.7, 25.9, and 15.5 percent
for sleep, fatigue, control, and non-crash drivers, respectively. Corresponding percentages for midnight to 6 a.m. driving were 12.9, 13.3, 6.2 and 2.0 percent.
Sleep and fatigue crash drivers were also more likely to report driving 30 or more
minutes at a time and driving 3 or more hours at a time, although these differences were
generally not as great. All three crash-involved populations engaged in more frequent
long trips than did the non-crash drivers.
29
Table 11. Comparison of study populations across driving exposure variables.
Driving Exposure
Sleep
Crash
Drivers
Fatigue
Crash
Drivers
Control
Crash
Drivers
NonCrash
Drivers
Sleep+Fat
vs.
Control
P-value
Sleep+Fat
vs.
Non-crash
P-value
Miles drive per year
< 5,000
5,000 - 9,999
10,000 - 14,999
15,000 - 19,999
20,000 - 24,999
25,000+
12.01
17.0
17.7
15.3
11.3
26.7
15.6
18.8
20.1
17.5
7.1
20.8
15.3
20.7
20.1
15.1
6.8
22.1
27.8
28.6
24.1
11.1
2.2
6.2
.307
.001
Drive as part of job
Yes
No
28.8
71.2
25.3
74.7
32.0
68.0
14.4
85.6
.140
.001
Days/week drive on job
<5 days / week
5 days / week
>5 days / week
29.9
41.4
28.7
29.7
29.7
40.5
24.2
47.8
28.0
48.3
35.0
16.7
.241
.023
Total daily driving time
<1 hour
1.0-1.9 hours
2.0-2.9 hours
3.0-4.9 hours
5+ hours
13.9
19.5
29.0
18.8
18.8
14.9
27.9
22.1
20.1
14.9
17.1
31.3
19.2
17.3
15.2
35.7
38.0
17.6
5.2
3.5
.003
.001
% driving when dark
<10 percent
10-24 percent
25-49 percent
50-74 percent
75+ percent
20.9
19.2
24.1
22.8
13.0
16.9
22.7
27.3
23.4
9.7
25.0
25.9
24.8
19.8
4.6
47.8
33.9
10.6
6.4
1.2
.001
.001
% driving midnight-6 a.m.
0 percent
1-9 percent
10-24 percent
25-74 percent
75+ percent
37.5
20.4
19.4
20.4
2.3
38.3
23.4
14.9
18.8
4.6
55.9
21.8
14.0
7.2
1.2
79.8
14.3
3.2
2.7
0.0
.001
.001
Frequency drive 30+ min.
Daily / almost daily
3-5 days/week
1-2 days/week
Couple times/month
Less than once/month
54.9
15.3
14.3
10.1
5.5
53.9
13.6
8.4
13.0
11.0
46.9
12.4
19.8
10.5
10.5
24.2
12.8
26.4
17.8
18.8
.005
.001
Frequency drive 3+ hours
Weekly
Couple times a month
Once every 2-3 months
Couple times a year
Once a year or less
21.7
27.2
18.8
14.6
17.8
16.9
15.6
23.4
22.7
21.4
15.8
19.4
17.7
18.9
28.2
6.2
17.4
19.9
21.8
34.8
.007
.001
1
Column percent.
30
Crash Circumstances
Work schedule, usual amount of sleep, sleep quality, level of daytime sleepiness,
and high-risk driving exposure all represent chronic risk factors for involvement in a
sleep-related crash. In contrast, acute risk factors are linked to the specific circumstances
surrounding a crash. Whereas an individual’s chronic risk factors for involvement in a
sleep-related crash remain relatively constant (changing in response to such events as a
new job, a move, diagnosis and treatment of a sleep disorder, etc.), acute risk factors can
vary from day to day or even hour to hour. A prime example is blood alcohol level.
Studies have shown that even at very low levels of blood alcohol, the risk of a sleeprelated crash increases dramatically. An individual with the same measured level of
daytime sleepiness will fall asleep much more quickly after consuming alcohol than if
alcohol had not been consumed (Dement and Vaughan, 1999).
Acute risk factors examined in the current study include length of time driving
before the crash, hours awake before the crash, and hours slept the night (or day) before.
As shown in Table 12, all three of these factors were strongly associated with sleeprelated crashes. Thirty-eight percent of sleep crash drivers had been driving an hour or
longer when they crashed, compared to 26 percent of fatigue crash drivers and 17 percent
of control crash drivers. The average time driving was 1.5 hours for sleep crash drivers,
1.2 hours for fatigue crash drivers, and 0.8 hours for control crash drivers. Sleep and
fatigue crash drivers had also been awake longer: an average of 13.4 hours for sleep crash
drivers, 12.9 hours for fatigue crash drivers, and 7.4 hours for control crash drivers. One
out of five sleep crash drivers, and nearly that many fatigue crash drivers, had been
awake for 20 or more hours when they crashed. In contrast, over 95 percent of the
control crash drivers had been awake for 15 or fewer hours. These results are consistent
with the overall pattern of sleep-related crashes, which typically happen at night.
Similarly large discrepancies can be found in hours slept the night (or day) before
the crash. Fewer than 18 percent of the sleep crash drivers and only 22 percent of the
fatigue crash drivers reported getting 8 or more hours sleep the night before their crash,
compared to almost half of the control crash drivers. Over half of the sleep crash drivers
slept less than 6 hours the night before their crash, and 22 percent slept less than 4 hours.
Corresponding percentages for control crash drivers were 10 percent and 2 percent.
Average hours slept before the crash were 5.8 hours for both sleep and fatigue crash
drivers, compared to 7.4 hours for control crash drivers. Whereas the 7.4 hours for
control crash drivers was slightly above their reported nightly average, 5.8 hours was
below the reported average of 6.4-6.5 hours for sleep and fatigue crash drivers.
Two issues which do not pertain to risk factors per se but which do have implications for countermeasure development are the driver’s subjective perception of drowsiness just before the crash and the extent to which the driver felt that drowsiness was a
factor in the crash. Not surprisingly, sleep and fatigue crash drivers were much more
likely than control crash drivers to report feeling drowsy and to state that drowsiness was
a factor in their crash. What is perhaps of greater interest is the extent to which sleep and
especially fatigue crash drivers did not feel drowsy prior to their crash. Only 53 percent
of sleep crash drivers and 47 percent of fatigue crash drivers reported feeling very or
moderately drowsy before they crashed; 23 percent of the sleep crash drivers and 31
percent of the fatigue crash drivers reported that they did not feel at all drowsy. While a
few of these drivers also reported that they did not think drowsiness was a factor in their
crash, the vast majority agreed that drowsiness was an important factor. The main
exception was some of the fatigue crash drivers who clearly stated that they were fatigued
31
Table 12. Comparison of study populations across crash circumstance variables.
Crash Circumstances
Sleep
Crash
Drivers
Fatigue
Crash
Drivers
Control
Crash
Drivers
Sleep+Fat
vs.
Control
P-value
Time driving prior to crash
<15 minutes
15-29 minutes
30-59 minutes
1.0-1.9 hours
2.0-4.9 hours
5+ hours
12.51
24.6
24.9
17.7
12.5
7.9
18.8
24.0
31.2
10.4
9.1
6.5
46.5
21.1
15.0
6.3
7.5
3.7
.001
Hours awake prior to crash
<5 hours
5.0-9.9 hours
10.0-14.9 hours
15.0-19.9 hours
20+ hours
Other
17.6
19.2
25.2
17.6
19.9
0.7
17.7
19.6
20.3
25.5
17.0
0.0
33.0
34.0
28.8
3.7
0.6
0.0
.001
Hours slept night/day before
<4 hours
4.0-5.9 hours
6.0-7.9 hours
8 hours
>8 hours
22.3
31.5
28.4
11.3
6.5
12.8
33.1
32.4
12.2
9.5
2.4
7.3
42.9
27.9
19.6
.001
How drowsy feeling before crash
Very drowsy
Moderately drowsy
Slightly drowsy
Not at all drowsy
Don’t know
37.1
16.1
20.7
23.0
3.3
26.5
20.7
20.0
31.0
1.9
1.2
1.0
5.7
91.4
0.8
.001
Extent feel drowsiness a
factor in crash
Very important
Moderately important
Slightly important
Not at all important
Don’t know
78.8
6.5
3.9
6.9
3.9
57.4
7.7
7.7
23.2
3.9
3.2
0.8
3.1
92.4
0.6
.001
Taking any medications with
warning of drowsiness?
Yes
No
Unsure
7.5
91.2
1.3
9.7
87.1
3.2
1.7
98.1
0.2
.001
1 Column percent.
32
(e.g., from hard physical labor), and not drowsy, when their crash occurred. (A later
section of this report examines in greater detail those cases where the officer reported that
the driver was asleep or fatigued but where the driver stated that drowsiness was not an
important factor in the crash. )
A final risk factor examined was whether drivers had taken any medications
marked with warnings that they could cause drowsiness. While the overall frequency was
low, use was clearly higher among the sleep and fatigue crash drivers (8 to 10 percent,
compared to less than 2 percent for control crash drivers).
Measures to Prevent Drowsy Driving Crashes
Table 13 summarizes participants’ responses to the following two open-ended
questions:
1. For those times when you find yourself feeling sleepy or drowsy while driving,
what, if anything, do you do to help yourself stay awake and alert?
2. I have asked you about ways you deal with driving when you’re already sleepy or
feeling drowsy. On the other hand, some people make an effort to prevent
getting in that situation at all. What, if anything, do you do before you start out
on a drive or a long trip to keep yourself from becoming sleepy or drowsy?
Up to five responses were coded for each question. The numbers in the table show the
percentage of drivers indicating each response. Percentages for the non-crash drivers are
generally lower, in part because they averaged fewer total responses. The average
number of responses was 2.3 for sleep crash drivers, 2.2 for fatigue crash drivers, 1.8 for
control crash drivers, and 1.5 for non-crash drivers.
By far the most frequently cited strategy for all groups was to open windows or
adjust the air conditioner or heater to let in fresh air and reduce the temperature in the
vehicle. This was cited by 69 percent of the sleep crash drivers, 57 percent of the fatigue
crash drivers, nearly half of the control crash drivers, and a third of the non-crash drivers.
Next most frequently cited was listening to the radio, a tape, or a CD; respondents
frequently stated that they turned up the volume and quite a few said that they purposely
listened to music or talk shows they found annoying or distasteful. This response was
also cited significantly more frequently by the sleep or fatigue crash drivers. Nearly one
in five crash-involved respondents said that they drank a caffeinated beverage, and an
additional 5 to 6 percent said that they drank something, but did not specify whether it
was caffeinated. Frequently, however, these beverages were “sodas,” which could
contain caffeine. Drivers involved in sleep or fatigue crashes were again more likely to
rely on this particular strategy for staying awake.
Other frequently cited strategies for helping to stay awake and alert while driving
were stopping to exercise, stretch, or walk around; stopping to get something to eat or
drink; and stopping driving altogether. The latter included having someone else in the car
take over the driving and was most often cited by those who had not been involved in a
recent crash (and who also happened to be older and more often female). Interestingly,
sleep and fatigue crash drivers were more likely than the control or non-crash drivers to
mention stopping for a nap, although the overall frequencies were low: 12 percent for the
sleep and fatigue crash drivers, compared to 7 percent for the control crash drivers and 5
percent for the non-crash drivers.
33
Table 13. Percentage of respondents reporting using certain countermeasure strategies
to maintain alertness while driving, across study populations.
Countermeasure Strategy
Sleep
Crash
Drivers
Fatigue
Crash
Drivers
Control
Crash
Drivers
NonCrash
Drivers
Sleep+Fat
vs.
Control
P-value1
Sleep+Fat
vs.
Non-crash
P-value1
Things do to help stay awake
and alert while driving:
Drink caffeine
Drink other
Eat something
Use pills/drugs
Listen to radio/CD
CB radio
Adjust windows, A/C
Talk to passenger
Talk to self
Smoke
Stop to rest
Stop for nap
Stop to eat or drink
Stop to exercise, stretch
Focus attention, concentrate
Slap / hit self
Stop driving
Splash water/ice on face
Move around, adjust seat
Sing to self
Other
Never sleepy
Don’t know of anything
17.32
5.5
3.5
1.0
44.6
2.6
69.2
2.9
1.6
2.6
7.1
12.2
10.6
17.6
1.9
5.5
8.7
2.9
3.5
3.5
7.7
1.0
1.0
17.4
6.5
0.0
1.3
42.6
0.7
56.8
4.5
0.0
5.8
7.7
12.3
9.7
18.1
1.9
3.9
10.3
3.4
8.4
4.5
7.1
0.7
1.9
19.3
5.1
2.1
0.8
29.1
0.6
47.3
3.0
1.3
3.0
7.0
7.2
10.4
15.5
0.8
1.0
10.4
3.2
1.5
3.0
5.7
9.1
2.1
12.5
4.2
3.7
0.3
22.1
0.0
31.5
4.4
1.2
1.5
3.4
4.7
10.8
14.0
0.5
1.2
16.2
2.2
2.5
3.2
4.2
21.1
2.7
n.s.
n.s.
n.s.
n.s.
.001
.050
.001
n.s.
n.s.
n.s.
n.s.
.007
n.s.
n.s.
n.s.
.001
n.s.
n.s.
.001
n.s.
n.s.
.001
n.s.
.047
n.s.
n.s.
n.s.
.001
.005
.001
n.s.
n.s.
.046
.013
.001
n.s.
n.s.
n.s.
.002
.002
n.s.
.041
n.s.
.039
.001
n.s.
Things do before begin a drive
to prevent becoming drowsy:
Avoid driving late, at night
Plan to allow for rest stops
Plan shorter drives
Share driving
Drive with a passenger
Get good night’s sleep
Take nap before leaving
Avoid alcohol
Drink caffeinated beverage
Bring along caffeine, food
Stop at motel / break up trip
Other preventive measure
Other non-preventive meas.
Not applicable / nothing
5.5
8.7
0.6
6.4
3.5
50.0
2.9
1.0
11.2
7.7
0.6
10.9
4.2
21.2
6.5
10.3
0.0
3.9
1.3
45.2
7.7
0.0
18.1
16.8
1.3
19.4
3.2
14.8
6.8
7.8
0.8
6.8
2.3
48.6
3.4
0.6
9.1
8.3
1.9
17.4
2.8
19.1
11.3
16.7
2.0
7.6
0.5
36.4
1.7
0.0
4.4
10.8
1.0
13.5
3.4
21.9
n.s.
n.s.
n.s.
n.s.
n.s.
n.s.
n.s.
n.s.
.027
n.s.
n.s.
n.s.
n.s.
n.s.
.003
.001
.033
n.s.
.009
.001
.020
n.s.
.001
n.s.
n.s.
n.s.
n.s.
n.s.
1
2
“n.s.” signifies a non-significant p-value (i.e., >.05).
Percentages total more than 100 percent due to allowing multiple strategies per respondent.
34
Coding the strategies used began with a defined list, which was expanded as new
strategies were raised by respondents. Earlier responses were recoded from “other” to
conform with these new categories. For example, about 3 percent of respondents mentioned splashing water or ice on one’s face, moving around in or readjusting the seat, and
singing to oneself. The “other” category incorporates many creative alternatives, including driving with one’s head hanging out the window, taking off one’s shoes (one man said
that smelling his dirty feet kept him awake), and, from one older, crash-free man, “wetting my eyes with spit”!
Once a particular strategy was mentioned, the respondents were also asked how
useful that strategy was for keeping them awake and alert – very helpful, somewhat
helpful, not too helpful, or not at all helpful. The vast majority of the drivers rated their
chosen strategies as either “very helpful” or “somewhat helpful” in maintaining alertness
while driving (see Table 14). However, there were some differences both across strategies and across study populations. Strategies most likely to be rated as “very helpful,” in
addition to stopping driving altogether, included stopping for a nap (84 percent rated
“very helpful”), stopping to exercise or get out of the car to walk or stretch (82 percent),
and stopping to rest (81 percent). All of these strategies involve taking a break from
driving. Two less frequently cited strategies that also received a high percentage of “very
helpful” ratings were splashing cold water or ice on the face (82 percent “very helpful”)
and talking to a passenger (79 percent “very helpful”). Popular strategies that were
Table 14. Percentage of respondents rating their identified countermeasure(s) as “very helpful”
in maintaining alertness while driving.1
Countermeasure Strategy
Things do to help stay awake
and alert while driving
Drink caffeine
Drink other
Eat something
Listen to radio/CD
Adjust windows, A/C
Talk to passenger
Smoke
Stop to rest
Stop for nap
Stop to eat or drink
Stop to exercise, stretch
Slap / hit self
Stop driving
Splash water/ice on face
Move around, adjust seat
Sing to self
1
2
Sleep
Crash
Drivers
Fatigue
Crash
Drivers
Control
Crash
Drivers
NonCrash
Drivers
Overall
44.2
41.2
36.4
33.1
37.4
75.0
50.0
71.4
75.7
63.6
79.6
41.2
92.6
87.52
54.5
40.02
51.9
50.0
—
36.9
41.4
57.12
44.42
92.3
94.4
85.7
76.9
16.72
93.8
80.02
41.7
50.02
58.0
59.3
72.7
48.7
58.0
86.7
75.0
83.3
83.8
71.7
81.5
40.02
96.4
77.8
62.52
68.8
65.4
64.7
86.7
50.6
53.5
83.3
83.32
80.0
94.1
70.5
87.0
40.02
93.9
85.72
50.02
46.2
55.8
54.9
67.6
42.6
48.6
79.2
64.1
81.2
84.4
70.8
81.9
36.4
94.5
81.6
51.2
53.3
Only those countermeasures cited by 30 or more respondents included in table.
Percentage based on 10 or fewer responses.
35
generally not judged to be as effective in maintaining alertness were drinking a
caffeinated beverage (56 percent “very helpful”), opening windows or adjusting the car
temperature (49 percent), and listening to the radio, a tape, or CD (43 percent). Perhaps
not surprisingly, drivers involved in sleep-related crashes were less likely to view their
own cited strategies as “very helpful.” Only 44 percent rated drinking caffeinated
beverages as “very helpful,” 33 percent listening to the radio, etc. as “very helpful,” and
37 percent rolling down the windows or adjusting the car temperature as “very helpful.”
By far the most commonly cited strategy for preventing becoming drowsy while
driving was to get a good night’s sleep before a drive (Table 13, bottom). This was noted
by nearly half of the crash-involved drivers and a third of the non-crash drivers. Other
frequently cited strategies were to drink a caffeinated beverage prior to departing and to
bring along food, drinks, or caffeine. Some favorite foods mentioned were M&Ms, hard
candy, peppermint, and anything “loud and crunchy.” Less than 10 percent of the crashinvolved drivers, but 17 percent of the non-crash drivers, said they planned trips to allow
time for rest stops. Interestingly, while some of the drivers said they avoided driving late
at night, this was less likely to be mentioned by the crash-involved drivers, and quite a
few of the latter said that they chose to drive at night because there was not as much
traffic and driving was less stressful.
Previous Experiences with Drowsy Driving
Table 15 presents responses to questions about previous experience with drowsy
driving. Drivers who had fallen asleep on at least one occasion (e.g., in the crash leading
to their interview) were more likely to report multiple incidences of feeling drowsy while
driving. Nearly one out of four drivers in sleep crashes and one out of five drivers in
fatigue crashes reported feeling drowsy on more than 10 occasions during the previous
year. This is three to four times the percentages reported by control and non-crash
drivers. At the same time, the majority of the drivers in all groups reported feeling
drowsy on at least one or two occasions, suggesting that all drivers might benefit from
reminders that they need to take action when they begin feeling drowsy while driving.
Just over 90 percent of the sleep crash drivers and 66 percent of the fatigue crash
drivers admitted they had ever fallen asleep while driving. Of greater interest, perhaps, is
that approximately 29 percent of the drivers who were not in sleep-related crashes also
said that they had fallen asleep behind the wheel. This is almost identical to the percentages reported by McCartt et al. (1995), who surveyed New York State drivers, and
Maycock (1997), who surveyed drivers in Great Britain. Also, it is interesting to note
that many of these “fall asleep at the wheel” events had occurred withing the past few
years.
Finally, when asked whether they were more likely to prevent getting into a sleepy
driving situation, or to simply deal with the situation if it arose, the majority of respondents reported that they were more likely to try to prevent driving while drowsy. However, sleep and fatigue crash drivers were significantly more likely than control or noncrash drivers to report that they were more likely to deal with the situation once it arose:
41 percent of sleep crash drivers chose reaction over prevention, compared to only a
fourth of both the control and non-crash drivers. This could reflect the more youthful and
male profile of the sleep crash population, or the fact that drivers most likely to become
involved in sleep-related crashes are those who think they can “handle” their sleepiness,
or both.
36
Table 15. Comparison of study populations across prior experiences with drowsy driving.
Crash Circumstances
Sleep
Crash
Drivers
Fatigue
Crash
Drivers
Control
Crash
Drivers
NonCrash
Drivers
Sleep+Fat
vs.
Control
P-value
Sleep+Fat
vs.
Non-crash
P-value
2.61
36.1
20.3
16.4
24.6
7.7
36.8
20.7
14.2
20.7
30.5
38.5
14.8
7.9
8.4
46.9
30.4
10.9
6.2
5.7
.001
.001
Ever fallen asleep while driving
Yes
90.6
No
7.1
Unsure
2.3
66.5
31.6
1.9
28.8
69.7
1.5
27.5
72.2
0.3
.001
.001
Fallen asleep while driving
within the past 2-3 years 2
Yes
No
Unsure
95.3
2.9
1.8
86.4
12.6
1.0
46.7
52.6
0.7
25.7
74.3
0.0
.001
.001
More likely to prevent or
deal with drowsy driving
Prevent it
Deal with it
Uncertain
58.1
40.9
1.0
62.6
36.1
1.3
73.0
25.1
1.9
75.7
23.1
1.2
.001
.001
Number of times drowsy while
driving in past year
Never
1-2 times
3-4 times
5-10 times
>10 times
1
2
Column percent.
Asked of those responding “yes” to ever fallen asleep.
Modeling Results
As shown earlier in Table 5, there were clear differences in the age and gender
compositions of the study populations. Any difference in other characteristics, such as
the number of hours worked or level of daytime sleepiness, may simply reflect these age
and gender differences rather than an independent association with occurrence of a sleeprelated crash. In epidemiological terms, age and gender are confounding variables, since
they are independent risk factors and may be differentially distributed among levels of the
exposure or risk-factor variables.
To adjust for the potential confounding effects of age and gender, multiple logistic
regression models were developed to examine the association of each potential risk factor
of interest with the occurrence of a sleep-related crash, while controlling for driver age
and gender. The models took the form:
log (odds of sleep-related crash) = ß0 + ß1 (Risk Factor) + ß2 (Age) + ß3 (Gender)
where ß0 is a constant and ß1, ß2 and ß3 are the estimated model parameters.
37
For these models, sleep and fatigue crashes were combined into the single outcome measure, “occurrence of a sleep-related crash.” Two different outcomes were modeled: (1) the
occurrence of a sleep-related crash versus the occurrence of a non-sleep-related (control)
crash, and (2) the occurrence of a sleep-related crash versus non-occurrence of a crash.
The resulting model parameters, when exponentiated, represent the odds of a given factor
or condition being present. Thus, exponentiated model parameters represent relative odds,
or odds ratios.
It should be stressed that the log odds expression (to the left of the equal sign in the
equation shown above) does not represent the risk of involvement in a sleep-related crash.
Rather, given that a driver is in a crash, or given that a driver is not in a crash during the
previous three years, this expression represents the log odds that a crash that does occur
will be sleep-related.
log (odds) = log
(
sleep - related crash
non - sleep - related crash
)
The following sections present the modeling results, following the same general
format used to present the descriptive results with the variables grouped according to
topic area.
Risk Factors Related to Work and Sleep Schedules
Table 16 presents the results of models developed for each of the variables pertaining
to work or sleep schedules. Persons working more than one job, working non-standard
work schedules (especially night shifts), or getting less than 6 or 7 hours sleep at night
were at significantly higher risk of involvement in a sleep-related crash. Persons working
two jobs were 1.5 times more likely to be in a sleep-related crash compared to a non-sleeprelated crash, and twice as likely to have been in a sleep-related crash versus being crashfree. Persons working three jobs were also at elevated risk, although these results were not
statistically significant because of the small sample sizes for this group of drivers.
Work schedule was also found to be associated with the occurrence of a sleep-related
crash. Individuals who worked at schedules other than the typical 8-to-5 daytime shift were
twice as likely as their fellow workers to be involved in a sleep-related, as opposed to a
non-sleep-related, crash. Those who worked nighttime shifts had nearly 6 times a higher
risk, while those working rotating and other shifts had twice the risk. Persons working
part-time, morning, afternoon, or variable hours were not at increased risk for involvement
in a sleep-related versus non-sleep-related crash. Part-time workers were, however, more
likely to be involved in a sleep-related crash versus no crash, possibly because of the
irregular (nighttime, weekend) hours the jobs frequently entail. The risks associated with
night shift work and other work schedules were more elevated as well, although small
sample sizes in the non-crash population increased the size of the confidence intervals.
Attending school was not associated with involvement in a sleep-related crash.
However, shorter sleep was a strong risk factor for involvement in a sleep-related crash.
The risk increased with decreasing hours of sleep, such that persons averaging 6 to 7 hours
of sleep per night were at twice the risk, those with 5 to 6 hours at a 3 times higher risk,
and those with less than 5 hours at a 4 to 5 times higher risk. These odds were even higher
when sleep crash drivers were compared to non-crash drivers: Those averaging 5 or fewer
hours of sleep at night were 7 times more likely to be involved in a sleep-related crash.
38
Table 16. Work and sleep schedule variables as factors in sleep-related crashes,
adjusted for driver age and gender.
Work / Sleep
Schedule Variables
Sleepy Crash Drivers vs.
Non-sleepy Crash Drivers
O.R.1
95% C.I.
Sleepy Crash Drivers vs.
Non-crash Drivers
O.R.1
95% C.I.
Number jobs
1 job
2 jobs
3 jobs
Ref.
1.53*
2.44
–
1.00
0.61
–
2.35
9.70
Ref.
2.13*
2.98
–
1.07
0.33
–
4.22
27.03
Number hours work/week
<40
40-49
50-59
60+
0.89
Ref.
1.09
1.37
0.58
–
0.72
0.93
1.36
–
1.65
2.00
1.34
Ref.
1.52
3.52**
0.74
–
0.85
1.85
2.41
–
2.73
6.71
Work hours
Regular
Part-time
Other
Ref.
0.96
2.13**
–
0.56
1.56
–
1.65
2.90
Ref.
2.16*
4.00**
–
1.03
2.43
–
4.57
6.58
Work schedule
Regular
Part-time
Morning shift
Afternoon/evening shift
Night shift
Rotating shifts
Variable hours
Other
Ref.
1.00
1.28
0.95
5.72**
2.02
1.23
2.34*
–
0.57
0.49
0.47
3.22
0.86
0.73
1.11
–
1.70
3.36
1.90
10.16
4.78
2.07
4.97
Ref.
2.22*
–
2.77
13.63**
–
2.15
7.85**
–
1.05
–
0.57
4.53
–
0.98
1.98
–
4.74
–
13.43
40.98
–
4.73
31.15
Attend school
No
Yes
Ref.
0.81
–
0.55
–
1.19
Ref.
1.23
–
0.53
–
2.85
Hours sleep per night
<5
5 - 5.9
6 - 6.9
7 - 7.9
8+
4.48**
3.26**
1.84**
1.19
Ref.
2.46
2.08
1.29
0.84
–
8.14
5.10
2.63
1.68
–
6.98**
3.78**
1.28
0.89
Ref.
2.43
1.97
0.82
0.57
–
20.05
7.22
2.00
1.34
–
1
Odds ratio adjusted for age and gender of driver.
* Significant at p≤.05 ** Significant at p≤.01
39
Risk Factors Related to Sleep Quality
Sleep quality factors are examined in Table 17. In general, these factors were less
strongly associated with the occurrence of a sleep-related crash than were work and sleep
schedule factors. However, persons who reported often having trouble either falling or
staying asleep were nearly twice as likely to have been in a sleep-related crash than in a
non-sleep-related crash. Relatively few drivers reported always having trouble falling or
staying asleep, but these results were only significant for the crash versus non-crash
comparison.
Table 17. Sleep quality variables as factors in sleep-related crashes, adjusted for driver age
and gender.
Sleep Quality
Variables
Sleepy Crash Drivers vs.
Non-sleepy Crash Drivers
O.R.1
95% C.I.
Sleepy Crash Drivers vs.
Non-crash Drivers
O.R.1
95% C.I.
Trouble falling asleep
Never
Sometimes
Often
Always
Ref.
0.88
1.82*
1.65
–
0.66
1.12
0.91
–
1.15
2.98
2.98
Ref.
0.91
2.77**
2.47*
–
0.64
1.32
1.02
–
1.30
5.80
6.00
Trouble staying asleep
Never
Sometimes
Often
Always
Ref.
1.21
1.97**
1.29
–
0.91
1.21
0.71
–
1.61
3.21
2.34
Ref.
1.07
1.33
2.69*
–
0.74
0.74
1.13
–
1.55
2.40
6.38
Overall quality of sleep
Excellent
Good
Fair
Poor
Ref.
1.31
1.65*
3.54**
–
0.93
1.12
1.91
–
1.83
2.43
6.55
Ref.
1.22
1.96*
12.12**
–
0.79
1.16
4.22
–
1.89
3.31
34.83
Adequacy of sleep
About right amount
Too much sleep
Not enough sleep
Ref.
1.83
2.81**
–
0.85
2.12
–
3.92
3.73
Ref.
2.04
3.56**
–
0.67
2.27
–
6.26
4.96
Loud snorer
No
Yes
Don’t know
Ref.
0.94
1.15
–
0.72
0.64
–
1.23
2.06
Ref.
0.69*
0.68
–
0.48
0.33
–
0.99
1.42
Stop breathing during sleep
No
Yes
Don’t know
Ref.
1.54
1.72 *
–
0.94
1.15
–
2.52
2.58
Ref.
1.73
2.78**
–
0.91
1.55
–
3.28
4.99
Told have sleep disorder
No
Yes
Ref.
1.42
–
0.67
–
3.01
Ref.
1.88
–
0.69
–
5.18
1
Odds ratio adjusted for age and gender of driver.
* Significant at p≤.05 ** Significant at p≤.01
40
The strongest association was with the person’s subjective assessment of overall
sleep quality. Persons who rated their sleep as “fair” were1.7 times more likely than
those who rated their sleep as “excellent” to be involved in a sleep-related versus nonsleep-related crash; for those who rated their sleep as “poor,” the odds of a sleep crash
increased to 3.5. The odds were even more elevated for a sleep crash versus no crash:
those who reported “poor” overall sleep quality were 12 times more likely to have been
involved in a sleep-related crash.
Self-report of not getting enough sleep was also a significant risk factor for a sleeprelated crash. Drivers who reported that they did not get enough sleep on a regular basis
were nearly three times more likely to be in a sleep-related versus non-sleep-related
crash, and 3.6 times more likely to be in a sleep-related crash versus crash-free.
The final three variables listed in the table related to possible sleep disorders.
There was generally no association between reported loud snoring and involvement in a
sleep-related crash. Persons who reported that they did not know if they stopped breathing at night were at higher risk for involvement in a sleep-related crash, but this may be
due to other potential confounders, such as not having a bed partner to inform them about
their breathing. The results pertaining to the actual diagnosis of a sleep disorder were
ambivalent, in part because of the small sample size (contributing to large confidence
intervals), and in part because of the inability to simultaneously adjust for treatment
status. Approximately half of those reporting a sleep disorder indicated that they were
receiving treatment for the disorder, which could be expected to lower their level of risk
for a sleep-related crash.
Excessive Daytime Sleepiness
The Epworth Sleepiness Scale was administered as an objective measure of general
daytime sleepiness. Average scores of 5 to 6 have been reported in the overall adult
population (Johns, 1991). In the current study population, higher Epworth scores were
strongly associated with the occurrence of a sleep-related crash (Table 18). Persons with
scores in the “moderate sleepiness” range were at 1.4 times higher risk for involvement in
a sleep- versus non-sleep crash, while those with scores in the “heavy sleepiness” range
were at 3 times higher risk, and those with scores in the “extreme sleepiness” range were
at nearly 6 times higher risk. The risks were even greater when involvement in a sleeprelated crash was compared to non-crash involvement. In this comparison, persons with
Table 18. Level of daytime sleepiness as measured by the Epworth Sleepiness Scale
as a factor in sleep-related crashes, adjusted for driver age and gender.
Epworth Sleepiness
Scale Score
Sleepy Crash Drivers vs.
Non-sleepy Crash Drivers
O.R.1
95% C.I.
<5 None or mild sleepiness
6-11 Moderate sleepiness
11-15 Heavy sleepiness
16+ Extreme sleepiness
Ref.
1.43*
2.95**
5.79**
–
1.08
1.97
2.27
1
Odds ratio adjusted for age and gender of driver.
* Significant at p≤.05 ** Significant at p≤.01
41
–
1.91
4.42
14.72
Sleepy Crash Drivers vs.
Non-crash Drivers
O.R.1
95% C.I.
Ref.
1.34
4.20**
15.18**
–
0.92
2.38
3.17
–
1.96
7.43
72.78
“heavy sleepiness” scores were at 4 times higher risk, while those with “extreme sleepiness” scores were at 15 times higher risk (although the confidence interval in the latter
case was large, due to very few non-crash drivers having that elevated an Epworth score).
Risk Factors Related to Driving Exposure
As might be expected, increased miles driven per year and total daily driving time
were associated with increased risk of involvement in a sleep crash versus no crash
(Table 19). However, neither miles driven nor driving time was associated with involvement in a sleep- versus non-sleep crash. High-mileage drivers and those spending even 5
or more hours on the road each day were not at increased risk for involvement in a sleeprelated, versus a non-sleep-related, crash.
Related to the above, it is interesting to note that those who drove as part of their
job were 40 percent less likely to be involved in a sleep-related crash. The overwhelming
majority of these drivers, 92 percent, were not in crashes involving a commercial motor
vehicle.
Only drivers who reported that a very high percentage of their driving occurs in the
dark had an elevated risk for a sleep crash versus a non-sleep crash: drivers who reported
that 75 percent or more of their driving took place at night were 2.5 times more likely to
be in a sleep-related crash. Those who reported that 25 percent or more of their driving
occurred between midnight and 6 a.m. were at 3 to 4 times higher risk. Night shift
workers and those working two or more jobs frequently fall into these categories. Nighttime and midnight-to-6 a.m. driving were also strongly associated with involvement in a
sleep crash compared to no crash.
Frequency of driving 30 minutes or more at a time (which could be an indicator of
longer work commutes) and frequency of driving 3 or more hours at a time (which could
be an indicator of frequent long-distance trips) were not associated with involvement in a
sleep-related crash. Although the odds ratios were generally positive, they were not
statistically significant.
Risk Factors Related to Crash Circumstances
The final table in this section (Table 20) contains information on specific factors or
conditions present at the time of the crash. Many of these directly impact the level of
sleepiness, so it is not surprising that they are strongly associated with the occurrence of a
sleep-related crash. They also fall into the general category of “acute” rather than
“chronic” risk factors. For these factors, the primary focus is not whether the odds ratios
are significant (almost all of them are), or even on the size of the odds ratios (some are
quite large), but rather on the changes in the odds ratios across levels of the variables.
As shown in the descriptive results (Table 12), many more of the non-sleep-related
crashes occurred within 15 minutes of starting a drive. Any driving time longer than this
is associated with a sleep-related crash. However, the risk of a sleep-related crash does
not continue to increase with increased time driving: the highest odds ratio occurs at one
to two hours behind the wheel. Perhaps those who drive longer than this have taken
additional precautions to prevent becoming drowsy, or perhaps this is the upper limit for
long work commutes. Regardless, it is clear that one does not have to take a “long” trip
to be at increased risk for a sleep-related crash.
42
Table 19. Driving exposure variables as factors in sleep-related crashes, adjusted for driver
age and gender.
Driving Exposure
Variables
Sleepy Crash Drivers vs.
Non-sleepy Crash Drivers
O.R.1
95% C.I.
Sleepy Crash Drivers vs.
Non-crash Drivers
O.R.1
95% C.I.
Miles drive per year
< 5,000
5,000 - 9,999
10,000 - 14,999
15,000 - 19,999
20,000 - 24,999
25,000+
Ref.
0.87
0.88
0.94
1.18
0.86
–
0.55
0.55
0.58
0.66
0.55
–
1.38
1.39
1.52
2.09
1.36
Ref.
0.84
0.85
1.22
2.55*
2.52**
–
0.50
0.49
0.66
1.06
1.31
–
1.43
1.46
2.24
6.12
4.85
Drive as part of job?
No
Yes
Ref.
0.63**
–
0.47
–
0.84
Ref.
1.24
–
0.81
–
1.89
Total daily driving time
<1 hour
1.0-1.9 hours
2.0-2.9 hours
3.0-4.9 hours
5+ hours
Ref.
0.82
1.40
1.08
1.03
–
0.54
0.91
0.69
0.64
–
1.24
2.15
1.70
1.65
Ref.
1.06
1.69*
2.82**
3.91**
–
0.67
1.02
1.47
1.88
–
1.68
2.79
5.41
8.16
% driving when dark
<10 percent
10-24 percent
25-49 percent
50-74 percent
75+ percent
Ref.
0.86
1.07
1.16
2.53**
–
0.58
0.72
0.77
1.43
–
1.26
1.57
1.75
4.48
Ref.
0.76
1.91**
2.24**
5.15**
–
0.49
1.14
1.25
1.83
–
1.17
3.19
4.01
14.54
% driving midnight-6 a.m.
0 percent
1-9 percent
10-24 percent
25-74 percent
75+ percent
Ref.
1.29
1.58*
3.64**
3.19**
–
0.92
1.07
2.33
1.19
–
1.82
2.32
5.68
8.56
Ref.
2.02**
5.67**
6.52**
–2
–
1.29
2.85
3.19
–
–
3.15
11.28
13.32
–
Frequency drive 30+ min.
Less than once/month
Couple times/month
1-2 days/week
3-5 days/week
Daily / almost daily
Ref.
1.35
0.74
1.47
1.26
–
0.75
0.43
0.84
0.78
–
2.42
1.28
2.57
2.05
Ref.
0.96
0.64
1.93*
1.69
–
0.50
0.34
1.01
0.95
–
1.86
1.20
3.70
3.01
Frequency drive 3+ hours
Once a year or less
Couple times a year
Once every 2-3 months
Couple times a month
Weekly
Ref.
1.10
1.41
1.35
1.35
–
0.73
0.94
0.91
0.89
–
1.66
2.12
2.01
2.07
Ref.
0.64
0.88
0.95
1.61
–
0.38
0.53
0.57
0.87
–
1.07
1.45
1.59
2.98
1
2
Odds ratio adjusted for age and gender of driver. * Significant at p≤.05
Insufficient cell size for calculation.
43
** Significant at p≤.01
A high percentage of sleep-related crashes occur at night and this is reflected in the
increased odds ratios for drivers who had been awake 15 or more hours. Being awake for
20 or more hours placed a driver at particularly high risk for involvement in a sleeprelated crash. Compared to drivers who had been awake less than five hours, drivers who
had been awake 20 or more hours were over 50 times more likely to be in a sleep versus a
non-sleep crash.
Hours slept the night before was also a critical variable. Sleeping 6 to 8 hours
increased the odds of being involved in a sleep versus a non-sleep crash by a factor less
than 2, but sleeping 4 to 6 hours resulted in 10 times the increase in risk, and sleeping
less than 4 hours an almost 20 times increase in risk. Finally, drivers who reported that
they were taking a medication at the time of their crash that came with a warning that it
may cause drowsiness were 6 times more likely to be involved in a sleep-related crash
compared to a non-sleep-related crash.
Table 20. Crash circumstance variables as factors in
sleep-related crashes, adjusted for driver age and gender.
Crash Circumstance
Variables
Sleepy Crash Drivers vs.
Non-sleepy Crash Drivers
O.R.1
95% C.I.
Time driving prior to crash
<15 minutes
15-29 minutes
30-59 minutes
1.0-1.9 hours
2.0-4.9 hours
5+ hours
Ref.
3.57**
5.35**
7.25**
4.34**
5.50**
–
2.43
3.60
4.38
2.61
2.93
–
5.23
7.98
12.00
7.20
10.33
Hours awake prior to crash
<5 hours
5.0-9.9 hours
10.0-14.9 hours
15.0-19.9 hours
20+ hours
Ref.
1.07
1.46*
9.36**
56.58**
–
0.74
1.01
5.27
17.33
–
1.55
2.10
16.64
184.73
Hours slept night/day before
>8 hours
8 hours
6.0-7.9 hours
4.0-5.9 hours
<4 hours
Ref.
1.06
1.74*
10.42**
19.19**
–
0.64
1.10
6.09
9.29
–
1.77
2.73
17.84
39.61
Ref.
6.29**
–
2.96
–
13.35
Taking medications with
warning of drowsiness
No
Yes
1
Odds ratio adjusted for age and gender of driver.
* Significant at p≤.05 ** Significant at p≤.01
44
Identifying Sleep-Related Crashes
Not all sleep-related crashes will be recognized by the investigating officer. We
wanted to estimate the extent to which “non-sleep” crashes might in fact be sleep-related.
One way of doing this is to review crash reports for those fitting a drowsy-driving profile.
Based on the work of Wang, Knipling and Goodman (1996), Horne and Reyner, (1995),
and Fell (1995), as well as our reviews of identified sleep-related North Carolina crash
reports, we developed an algorithm for rating crash reports. Crashes were rated as
showing no, possible, probable, or strong evidence of drowsiness. Factors lending
credence to drowsiness included officer or driver comments about drowsiness, lack of
change in vehicle trajectory at crash outset, and lack of other active driving such as
steering or braking at crash outset. Evidence against drowsiness included active driving
(backing, turning, slowing) and other crash causes (distraction in car or roadway, speeding or weather sufficient for loss of control). The presence of alcohol or drugs was not
considered presumptive evidence either for or against drowsy driving, but was considered
in combination with other available data. Appendix D contains a copy of the form that
was developed for reviewing and classifying the crash reports.
Using the algorithm, two raters (Stutts and Wilkins) independently reviewed the
crash report for every “non-sleep” crash for which there was a completed telephone
interview with the at-fault driver (N=263). After independently rating crashes, the raters
met to resolve discrepancies by consensus, and a final rating was assigned to each crash.
The raters were blind to the results of the telephone interviews.
This retrospective rating of “non-sleep” crash reports for evidence of sleepiness
proved difficult for two reasons, one leading to possible underestimation of drowsy
crashes and the second leading to possible overestimation. First, “active driving,” such as
turning or backing, was considered as evidence the driver was awake. However, while
“active driving” such as slowing from 55 to 25 mph may show that a driver is awake, it
cannot show that he was not drowsy or slow to react due to sleepiness. The raters frequently found themselves wondering why someone who was “actively driving” had been
poorly attentive or slow to react. The raters felt that their reliance on “active driving”
might have led them to overlook some cases which were in fact drowsiness-related.
Second, the raters’ judgments were based on limited information about the driver’s
behavior just prior to the crash. Frequently the narratives did not comment on why the
crashes occurred. For example, rear-ending a slower or stopped vehicle was common.
This might have been the result of following too closely or of glancing away from traffic
while tuning the radio. Crash reports rarely mentioned such contributing driver errors
and the raters were aware that some crashes with no apparent cause might actually have
an explanation, lacking which the raters might overestimate drowsiness.
Despite these difficulties, consensus ratings were assigned to the 263 “non-sleep”
crashes with completed at-fault driver telephone interviews. As noted, the consensus
ratings were based only on the crash reports and algorithm, with the raters blind to the
telephone survey results. Of the 263 crashes, 215 were rated as no evidence of drowsiness, 38 as possible evidence of drowsiness, 9 as probable evidence of drowsiness, and
one as strong evidence of drowsiness. Those rated either possible, probable, or strong
comprise 18 percent of the crashes, while those rated probable or strong comprise just
under 4 percent of the crashes.
Another way of estimating the number of unidentified drowsy-driving crashes is to
simply ask at-fault drivers whether sleepiness was a factor in their crash. Question 7.5
45
from the telephone survey asked the extent to which the driver thought drowsiness was a
factor in the accident. Choices were not at all important, slightly important, moderately
important, very important, and don’t know. Of the 263 at-fault “non-sleep” drivers, 22
rated drowsiness as a contributor to their crash. This represents 8 percent of the control
crashes. Ten at-fault control drivers said drowsiness was slightly important, 3 said
moderately important, and 9 said drowsiness was very important.
Of course, this method has limitations as well. Sleepiness could be overreported by
drivers looking for a more socially acceptable explanation than alcohol or recklessness.
On the other hand, sleepiness could be under reported by drivers who did not realize that
they dozed off briefly or refuse to admit it.
Did the algorithm predict the drivers’ self assessments of drowsiness as a cause of
crashes? Not very well. Both underprediction and overprediction were noted.
Underprediction by the algorithm will be discussed first. For 198 of the 263 crashes, the
algorithm and the at-fault drivers agreed that drowsiness was not a factor in the crash.
However, there were 16 crashes in which the at-fault driver stated that drowsiness was a
contributor but the algorithm coded no evidence of drowsy driving. These included 5
crashes in which the at-fault driver rated drowsiness as “very important.” As noted above,
evidence of active driving such as turning in front of someone or swerving to avoid an
animal may have misled the raters into believing drowsiness was not a cause, when in
fact it was. On the other hand, some drivers may have blamed drowsiness in order to
save face, such as the driver who left a sharp curve at high speed while drinking.
Overprediction by the algorithm occurred even more frequently. For 8 crashes, the
algorithm and the at-fault driver agreed that drowsiness was a factor. However, there
were 40 crashes that the algorithm coded as possibly, probably, or strongly related to
drowsiness for which the at-fault driver reported no drowsiness. These included 8
crashes the raters considered as showing “probable” evidence of drowsiness. Some form
of awake inattention not recorded on the crash report probably accounts for a number of
these crashes. For example, when interviewed, one driver stated he ran off the road after
spilling hot coffee in his lap, an event not mentioned in his crash report. On the other
hand, it is also possible that some drivers did not recognize or admit their drowsiness and
that they are underreporting drowsiness as a cause. One example, rated by the algorithm
as probable drowsiness, was a man involved in a single vehicle crash who drifted into the
median on the interstate at 6:00 a.m., hitting a wrecker that was parked with its strobe
lights flashing. This driver stated that he routinely sleeps only 4 hours a night, and that
he had previously fallen asleep at the wheel, yet he stated that drowsiness was not at all
important to his recent crash.
One interesting side finding from this investigation was the fact that some drivers
disagreed with the officer’s characterization of their crash as sleep- or fatigue-related.
While the safety community has been concerned that sleep-related crashes might be
under-reported, these drivers actually said the opposite – 21 drivers coded as asleep and
35 drivers coded as fatigued told the telephone interviewer that drowsiness was “not at
all” a factor in their crashes.
Medical explanations were offered by several drivers who said the officers incorrectly coded them as asleep or fatigued. “Blacking out” from causes such as diabetes,
low blood pressure, migraine, and “a slight heart attack” were offered as alternatives to
drowsy driving, and it was impossible to evaluate the probability of these causes in a
brief telephone interview. Some seemed plausible, such as the driver who said he had an
46
epileptic seizure while driving and that he had previously caused a fatality because of a
seizure while driving. Others seemed less certain, such as the young person who thought
she “blacked out” from an illness because she had a fever the previous night.
Misconceptions about the onset of sleep may have led several drivers to deny that
their crashes were sleep-related. For example, one driver who was coded as asleep said
that because he did not remember what happened, he must have “blacked out” rather than
fallen asleep. This driver also reported that he slept five hours a night, snored and
stopped breathing in his sleep, frequently drove while drowsy, had previously fallen
asleep while driving, and had a high Epworth Sleepiness Scale. Another driver who was
coded as fatigued said, “I closed my eyes briefly to gather my thoughts after a stressful
day,” but then said drowsiness was not a factor; he works rotating shifts and admitted to
previously falling asleep at the wheel.
Other drivers who said drowsiness was not a factor contradicted themselves or
perhaps misunderstood interview questions. One driver who works two jobs, including a
third shift, told the interviewer drowsiness was not a factor at all, then later said that
because he was not used to his third shift hours, “that could be a factor.” Another driver
who considered drowsiness irrelevant to his crash later volunteered, “Forget cruise
control – it mesmerizes you or causes a hypnotic effect.” One young driver who works
two jobs and attends school stated, “I wasn’t drowsy, I just fell asleep.”
47
48
Chapter 4.
Conclusions and Discussion
Studying Sleep-related Crashes
There are a number of approaches that one can take to studying sleep-related motor
vehicle crashes. One is to analyze police-reported crash data. Most (though not all)
states have a checkbox or code on their report form that officers can use for identifying a
sleep-related crash. This approach has the advantage of making relatively large numbers
of cases available for analysis. However, it may also omit cases, since police officers
may fail to recognize, and drivers fail to admit, the role that drowsiness played in a crash.
Police-report data also does not reveal much about the underlying circumstances surrounding the crash: We may be told that the driver fell asleep at the wheel, but are not
usually told why he fell asleep. Still, the approach has been successfully used to provide
estimates of the magnitude of the problem and to identify some high-risk populations
(see, e.g., Pack et al., 1995; Knipling and Wang, 1995).
Another approach to studying sleep-related crashes is to rely on data collected from
in-depth on-site investigations immediately following a crash. Such investigations are
often conducted by the National Transportation Safety Board for major highway crashes,
such as those involving heavy trucks and multiple fatalities (NTSB 95; NTSB 1990;
Lauber and Kayten, 1989). In 1995, the National Highway Transportation Administration
(NHTSA) began conducting in-depth investigations on an annual sample of 5,000
passenger vehicle towaway crashes as part of its Crashworthiness Data System (CDS).
This approach offers the advantage of detailed multidisciplinary investigations, including
interviews with drivers and witnesses. However, since the focus of the CDS is on all
towaway crashes, sleep-related crashes comprise only a small part of the overall sample
(130 cases in 1995), limiting analysis possibilities (Wang, Knipling and Goodman, 1996).
A third approach used by some researchers is to survey the general driving population, either by mail or telephone. Questions typically ask about past involvement in
sleep-related crashes or near crashes, along with demographic, lifestyle, and driving
characteristics. This is the approach recently taken by McCartt et al (1996), who interviewed a random sample of 1,000 New York State licensed drivers over the telephone.
Of these, 40 reported having crashed as a result of either falling asleep at the wheel or
driving while drowsy. Fell and his colleagues had conducted similar telephone surveys in
Australia (Fell, 1995; Fell and Black, 1997). In the first of these, 4 percent of the drivers
contacted reported having been in a sleep-related crash and 24 percent in a near crash. In
Great Britain, Maycock (1997) used a mail survey to inquire about crashes in which a
stratified sample of male drivers had been involved during the previous three years and
about the drivers’ opinions on factors contributing to those crashes. From the 4,600
respondents, Maycock estimated that 9 to 10 percent of the reported crashes were related
to tiredness. Similar studies have been carried out in Finland (Martikainen et al., 1992)
and Sweden (Haraldsson et al., 1992).
A weakness of these survey studies is that they rely on self-reports of crash involvement and self-assessments of the role of drowsiness in the reported crashes. They
also typically yield only a relatively small number of crashes that are drowsiness-related,
which limits the data analysis. Perhaps most importantly, there is typically a long time
49
delay between the occurrence of the crash and the survey, which contributes to recall bias
and a potential lack of validity in the reported results. For example, it is questionable
how accurately drivers recalled how long they slept the night before their reported crash
or how tired they felt before the trip, as was done in the study by Fell and Black (1997).
One might also question the usefulness of collecting Epworth data, a measure of general
daytime sleepiness based on a person’s “usual way of life in recent times,” and relating
this to crashes that occurred up to three years earlier, as was done in the Maycock (1997)
study.
The current study was designed to address these weaknesses. A telephone survey
was conducted of a large sample of drivers who had been involved in both sleep-related
and non-sleep-related crashes, with interviews taking place soon after the crash. To the
researchers’ knowledge, this has never been done for a general population of crashinvolved drivers. The study results provide strong evidence of risk factors for involvement in a sleep-related crash, as well as insight into problems associated with the reporting of these crashes.
Key Findings
Public Awareness of Drowsy Driving
The public perceives drowsy driving to be an important cause of motor vehicle
crashes. Three out of four non-crash-involved drivers, and four out of five of those in
recent crashes, said that driver drowsiness was “very important” in causing crashes.
These results place drowsy driving as being less of a contributor to crashes in the public’s
view than alcohol, but more important than poor weather conditions, speeding, or driver
inexperience. Drowsy driving and aggressive driving, which have both received fairly
widespread attention in the media, were rated about the same.
Work and Sleep Schedules
Work and sleep schedules were strongly associated with involvement in a sleeprelated crash. Compared to drivers in non-sleep crashes, drivers in sleep crashes were
nearly twice as likely to work at more than one job and their primary job was more likely
to involve an atypical schedule. Fourteen percent of employed drivers in sleep crashes
and 24 percent of employed drivers in fatigue crashes worked the night shift. Working
the night shift increased the odds of a sleep-related (versus non-sleep-related) crash by
nearly 6 times. Working more than 60 hours a week increased the odds by 40 percent.
Total hours of sleep per night was also a strong risk factor: the fewer the hours
slept, the greater the odds for involvement in a sleep-related crash. Compared to sleeping
8 or more hours a night, sleeping 7 to 8 hours was associated with a 1.2-times higher risk,
6 to 7 hours 1.8 times higher, 5 to 6 hours 3.3 times higher, and less than 5 hours a 4.5
times higher risk for involvement in a sleep-related versus non-sleep-related crash. Onefourth of the drivers in sleep-related crashes and over a third of those in fatigue-related
crashes reported getting less than 6 hours sleep a night.
50
Sleep Quality and Sleep Disorders
Drivers in sleep and fatigue crashes were more likely to report difficulties falling
asleep and more likely to rate the overall quality of their sleep as “poor” or “fair.” Drivers
who rated their sleep as “fair” were 1.7 times more likely to be in a sleep-related than a nonsleep-related crash and those who rated their sleep as “poor” were 3.5 times more likely.
Drivers in sleep-related crashes were also twice as likely to admit that they got an inadequate amount of sleep: 46 percent of both the sleep and fatigue crash drivers said they did
not get enough sleep, compared with 23 percent of control crash drivers and just 15 percent
of non-crash drivers.
Few drivers reported having a diagnosed sleep disorder. While the presence of a
disorder was associated with a modest increase in the odds of a sleep-related crash, these
results were not statistically significant.
Daytime Sleepiness
The Epworth Sleepiness Scale (ESS) was used to assess drivers’ general levels of
daytime sleepiness. Twenty-six percent of drivers in sleep crashes, and 22 percent of those
in fatigue crashes, had Epworth scores greater than 10, indicating that they were excessively
sleepy during the daytime. This was more than double the percentage for drivers in nonsleep-related crashes. An Epworth score of 11-15 was associated with a 3-fold higher odds
for involvement in a sleep-related versus non-sleep-related crash, while an Epworth of 16 or
higher (“extreme daytime sleepiness”) was associated with a nearly 6-fold greater odds.
Driving Exposure
Sleep and fatigue crash drivers did not differ from other crash-involved drivers with
respect to average miles driven per year or driving as part of their job. They did, however,
report longer daily driving times, higher percentages of driving in the dark, and higher
percentages of driving between midnight and 6 a.m. They also reported a higher frequency
of driving 30 or more minutes or 3 or more hours at a time. Although these results were
statistically significant, the overall trends were not especially striking. The only categories
associated with increased odds for involvement in a sleep-related versus non-sleep-related
crash were accumulating 75 percent or more of one’s driving during darkness or doing 25
percent or more of one’s driving between midnight and 6 a.m.
Crash Circumstances
In contrast to driving exposure, the circumstances surrounding the crash were strikingly different between drivers in sleep-related and non-sleep-related crashes: The sleep
and fatigue crash drivers had been at the wheel for a significantly longer time before the
crash, had been awake for a longer time the day of the crash, and had slept fewer hours the
night before. Over a third of the sleep and fatigue crash drivers had been driving for an
hour or more before their crash, a figure twice that for drivers in other crashes. Forty
percent of the sleep and fatigue crash drivers had been awake for 15 or more hours before
their crash, compared to 4 percent for the other crash drivers, and nearly one-fifth had been
awake for 20 or more hours. Regarding hours slept the night (or day) before the crash, half
of the sleep and fatigue crash drivers reported getting 6 or fewer hours of sleep, compared
to less than 10 percent for other drivers in crashes; in addition, 22 percent of the sleep crash
drivers said that they had gotten less than 4 hours of sleep the night before their crash.
51
These results maintained their robustness when adjusted for age and gender in the
logistic regression modeling. The odds of a crash being sleep-related were more than 10
times higher if the driver had been awake for 15 or more hours or slept fewer than 6
hours before the crash. Interestingly, drivers who had been at the wheel for 1 or 2 hours
were at greater risk for being in a sleep-related crash than were drivers who had been
behind the wheel for either shorter or longer times.
Some of the most interesting results pertained to drivers’ reports of how drowsy
they felt before they crashed. Only 53 percent of the sleep crash drivers and 47 percent of
the fatigue crash drivers reported that they felt “very drowsy” or “moderately drowsy”
before the crash; 23 percent of the sleep crash drivers and 31 percent of the fatigue crash
drivers reported feeling “not at all drowsy.” These findings have important implications
for public education efforts. If people do not “feel” drowsy, how can they be convinced
to stop driving when they are tired?
Finally, although relatively few drivers reported taking medications that could
cause drowsiness, such use was associated with a 6 times higher risk of involvement in a
sleep-related crash.
Measures to Prevent Drowsy Driving Crashes
The strategies drivers cited most frequently for promoting alertness while driving
included adjusting the windows or temperature controls in the car; listening to the radio,
tape, or CD player; drinking a caffeinated beverage; and stopping to exercise or stretch.
Less than 12 percent said that they would stop driving and only 8 percent mentioned
stopping for a nap. While the percentages varied some across the crash populations
(drivers in sleep and fatigue crashes, who tended to be younger, were more likely to
report adjusting windows and listening to the radio/tape/CD), the hierarchy of responses
was fairly consistent.
Drivers were also fairly consistent in their reported satisfaction with these measures, although those who had been in a sleep-related crash were less likely to rate them
as “very helpful.” Strategies most likely to be judged “very helpful” involved stopping
driving, at least for a short while (e.g., to nap, get a snack, or walk around a bit). Drinking a caffeinated beverage, opening the car windows, and turning up the radio all received lower percentages of “very helpful” ratings.
When asked what they did ahead of time to prevent becoming drowsy, nearly half
responded that they tried to get a good night’s sleep. Other, less frequent, responses
included planning the trip to allow for rest stops, bringing along caffeinated drinks and
food, and drinking a caffeinated beverage before leaving. Drivers in fatigue crashes were
the most likely to mention drinking caffeine or bringing along caffeine or food. Taking a
nap before leaving, avoiding alcohol, driving with a passenger, sharing driving, and
avoiding driving late at night were each mentioned by fewer than 8 percent of the drivers.
Prior Drowsy Driving Experience
One-fourth of the drivers in non-sleep crashes, but 36 percent of the those in
fatigue crashes and 41 percent of those in sleep crashes, said that they were more likely to
deal with a drowsy driving situation once it arose rather than try to prevent it from
occurring. Perhaps not surprisingly, sleepy and fatigued drivers were also more likely to
have been in situations where they felt drowsy while driving: 25 percent of the sleep
52
crash drivers and 21 percent of the fatigue crash drivers reported that they had been
drowsy while driving more than 10 times in the previous year, compared to only 8
percent of drivers in other crashes and 6 percent of the drivers not involved in crashes.
Identifying Sleep-related Crashes
An algorithm developed for identifying sleep-related crashes proved difficult to
implement, and applying the algorithm to a sample of crash reports yielded mixed
results. Some crashes classified as sleep-related by the algorithm were reported as not
being drowsiness-related by the driver, while others not classified as sleep-related by the
algorithm were attributed to drowsiness by the driver. Generally the crash reports
contained limited information for resolving these discrepancies. In addition, evidence
suggests that some drivers may be unwilling to recognize or admit that drowsiness was a
factor in their crashes.
Implications for Efforts to Reduce Drowsy Driving
Almost all experts agree that the only truly effective strategy drowsy drivers can
take to prevent a crash is to immediately stop driving and get some sleep. If this is not
possible, drivers should be encouraged to stop, drink some caffeine (the equivalent of
two cups of coffee), and take a brief nap before getting back behind the wheel (NCSDR/
NHTSA, 1998). All other countermeasures or strategies that drivers typically employ –
rolling down the car windows, turning up the radio, stopping to stretch – are largely
unsupported by the scientific literature. Yet these strategies were often cited by our
drivers and are believed to be somewhat, if not very, effective.
Certainly drivers need to be educated about steps to take if they find themselves
becoming drowsy while driving. However, there are at least two complicating factors.
First, as shown by the results of the current study, many drivers either do not feel
drowsy or do not recognize or admit their feelings of drowsiness. Nearly one-fourth (23
percent) of the drivers identified by police officers as “asleep” later claimed during their
interview that they felt “not at all drowsy” just before their crash. Other drivers may
recognize their drowsiness but not admit that they are in danger of crashing; they think,
“I can handle this.” This belief is reinforced by the countless other occasions where
they have been drowsy but still managed to arrive safely at their destinations. Onefourth of the drivers in our “fell asleep” crashes reported that they had driven while
drowsy on more than 10 occasions during the past year.
These findings suggest that efforts to educate motorists about the dangers of
drowsy driving must first focus on helping them recognize the symptoms of drowsiness. Considerable work has already been carried out in identifying the key symptoms
that predict onset of sleep (see, for example, Nguyen, Jauregui and Dinges,1998;
Nelson, 1997; and Itoi et al., 1993). The “Drive Alert.. . .Arrive Alive” program initiated by the National Sleep Foundation and supported by the National Highway Traffic
Safety Administration, the AAA Foundation for Traffic Safety, and others, has made
education about warning signs an important component of its program. However, if the
results of the 1998 Omnibus Sleep Survey (Johnson, 1998) are any indication, there is
still much that the American public needs to learn about sleepiness and its effects.
53
In addition to educating drivers about the warning symptoms of drowsiness, we
must also convince them that when they recognize the symptoms of drowsiness they
should stop driving as soon as safely possible. This may require more than the usual
safety threats; after all, the vast majority of drunk drivers also arrive home without
crashing and without being stopped by law enforcement. And as noted earlier, there are
many drivers on the road with considerable experience of “driving while drowsy.” What
is needed is a change in the public’s mindset such that people come to believe that
driving drowsy is as morally unacceptable as driving drunk. Again, efforts are already
being taken to bring about this change: the AAA Foundation for Traffic Safety’s “Wake
Up!” campaign is modeled in many respects after the drunk driving campaigns of the
1960s and 1970s (Willis, 1996).
Finally, the current research suggests that although there are clearly certain segments of the population that are at increased risk for involvement in a sleep-related crash,
it is not just the shift workers, the young males, the persons taking sedating medications,
or those with sleep disorders who are crashing. In many cases it is the average “driver
next door” who just happens to be putting in extra hours at work, adjusting to a new baby
in the household, staying out late for a party, or trying to make it back home after an outof-town trip. Educating all of these persons about the importance of adequate sleep will
not only reduce crashes, but make their lives healthier, happier, and more productive.
54
References
Brown ID (1994). Driver fatigue. Human Factors, 36(2):298-314.
Brown ID (1993). Driver fatigue and road safety. Alcohol, Drugs and Driving, 9(34):239-252.
Carskadon MA (1990). Adolescent sleepiness: increased risk in a high-risk population.
Alcohol, Drugs and Driving, 5(4) and 6(1):317-328.
Coren S (1996). Daylight savings time and traffic accidents (correspondence). The New
England Journal of Medicine 334(14):924.
Dawson D and Reid K (1997). Fatigue, alcohol and performance impairment. Nature,
338:235.
Dement WC (1997). The perils of drowsy driving (editorial). The New England Journal
of Medicine 337(11):783-784.
Dement WC and Mitler MM (1993). It’s time to wake up to the importance of sleep
disorders. JAMA 269(12):1548-1550.
Dement WC and Vaughan C (1999). The Promise of Sleep. New York: Delacorte Press.
Federal Highway Administration (1998). The Driver Fatigue and Alertness Study. U.S.
Department of Transportation, Federal Highway Administration, Office of Motor Carriers, Washington, D.C., 60 pp. (Technical Summary), 562 pp. (Project Report). [Executive
Summary available through OMC home page]
Fell D (1995). The road to fatigue: circumstances leading to fatigue accidents. In
Laurence Hartley, ed., Fatigue and Driving. Bristol PA: Taylor & Francis, Inc.
Fell D (1994). Safety update: problem definition and countermeasure summary: Fatigue.
RUS No. 5, New South Wales Road Safety Bureau, Australia.
Fell DL and Black B (1997). Driver fatigue in the city. Accident Analysis and Prevention
29(4):463-469.
Filliatrault DD, Cooper PJ, King DJ, Siegmund GP and Won PKH (1996). Efficiency of
vehicle-based data to predict lane departure arising from loss of alertness due to fatigue.
In 40th Annual Proceedings of the Association for the Advancement of Automotive Medicine, Vancouver, British Columbia, October 1996.
Horne JA and Reyner LA (1995). Sleep-related vehicle accidents. British Medical
Journal, 310:565-567.
Haraldsson PO, Carenfelt C and Tingvall C (1992). Sleep apnea syndrome symptoms and
automobile driving in a general population. Journal of Clinical Epidemiology 45(8):821825.
Itoi A, Cilveti R, Voth M, Dantz B, Hyde P, Gupta A and Dement WC (1993). Can drivers
avoid falling asleep at the wheel? Washington, D.C.: AAA Foundation for Traffic Safety.
55
Johns MW (1992). Reliability and factor analysis of the Epworth Sleepiness Scale. Sleep,
15(4):376-381.
Johns MW (1991). A new method for measuring daytime sleepiness: the Epworth Sleepiness Scale. Sleep 14(6):540-545.
Johnson EO (1998). 1998 Omnibus Sleep in America Poll. Washington, D.C.: National
Sleep Foundation.
Knipling RR and Wang SS (1995). Revised estimates of the US drowsy driver crash
problem size based on General Estimates System case reviews. 39th Annual Proceedings,
Association for the Advancement of Automotive Medicine, Chicago.
Knipling RR and Wang WS (1994). Crashes and fatalities related to driver drowsiness/
fatigue. Research Note. Washington, D.C.: U.S. Department of Transportation, National
Highway Traffic Safety Administration, Office of Crash Avoidance Research.
Lauber JK and Kayten PJ (1989). Fatigue, alcohol and drug involvement in transportation
accidents. Alcohol, Drugs and Driving 5(3):173-184.
Leger D (1995). The cost of sleepiness: a response to comments. Sleep, 18(4):281-284.
Lyznicki JM, Doege TC, Davis, RM and Williams WA (1998). Sleepiness, driving, and
motor vehicle crashes. JAMA 279(23):1908-1913.
Martikainen K, Urponen H, Partinen M, Hasan J and Vuori I (1992). Daytime sleepiness:
a risk factor in community life. Acta Neurological Scand 86:337-341.
Maycock G (1997). Sleepiness and driving: the experience of U.K. car drivers. Accident
Analysis and Prevention 29(4):453-462.
McCartt AT, Ribner SA, Pack AI and Hammer MC (1996). The scope and nature of the
drowsy driving problem in New York State. Accident Analysis and Prevention 28(4):511517.
National Sleep Foundation (undated). Drive Alert, Arrive Alive - Drowsy Driving Fact
Sheet, Washington, D.C.: National Sleep Foundation, 2 pp.
National Transportation Safety Board (1995). Factors That Affect Fatigue in Heavy
Truck Accidents. Volume 1: Analysis. Washington, D.C. NTSB. [NTSB/SS/-95/01]
National Transportation Safety Board (1990). Safety Study: Fatigue, Alcohol, Other
Drugs, and Medical Factors in Fatal-to-the-Driver Heavy Truck Crashes. Volume 1.
Washington, D.C. NTSB. [NTSB/SS/-90/01]
NCSDR/NHTSA Expert Panel on Driver Fatigue and Sleepiness (1998). Drowsy Driving
and Automobile Crashes, Report No. DOT HS 808 707, National Center on Sleep Disorders Research, National Heart, Lung, and Blood Institute, and National Highway Traffic
Safety Administration, Washington, D.C. April 1998, 30 pp.
Nelson TM (1997). Fatigue, mindset and ecology in the hazard dominant environment.
Accident Analysis and Prevention 29(4):409-415.
Neutel CI (1995). Risk of traffic accident injury after a prescription for a benzodiazepine.
Annals of Epidemiology 5(3):239-244.
56
Nguyen LT, Jauregui B and Dinges DF (1998). Changing Behaviors to Prevent Drowsy
Driving and Promote Traffic Safety: Review of Proven, Promising, and Unproven Techniques. Washington, D.C.: AAA Foundation for Traffic Safety.
O’Hanlon FJ, Vermeeren A, Uiterwijk MMC, van Veggel LMA and Swijgman HF
(1999). Anxiolytics’ effects on the actual driving performance of patients and healthy
volunteers in a standardized test. Neuropsychobiology 31:81-88.
O’Neill D (1998). Benzodiazepines and driver safety. The Lancet 352(9137):1324-1325.
Pack AI, Pack AM, Rodgman E, Cucchiara A, Dinges DF and Schwab CW (1995).
Characterisitics of accidents attributed to the driver having fallen asleep. Accident Analysis and Prevention 27(6):769-775.
Roehrs T, Beare D, Zorick F and Roth T (1994). Sleepiness and ethanol effects on
simulated driving. Alcoholism, Clinical & Experimental Research 18(1):154-158.
Roth T, Roehrs TA, Carsdadon MA and Dement WC (1994). Daytime sleepiness and
alertness. In Kryger MH, Roth T and Dement WC, Principles and Practice of Sleep
Medicine, Second Edition. Philadelphia, PA: W.B. Saunders Company.
Richardson GS, Miner JD and Czeisler CA (1990). Impaired driving performance in
shiftworkers: the role of the circadian system in a multifactorial model. Alcohol, Drugs
and Driving 5(4):265-273.
Sagberg F (1998). Many drivers fall asleep at the wheel. Institute of Transport Economics, Norway: Nordic Road and Transport Research, No. 3, p. 16.
Wang J, Knipling RR and Goodman MJ (1996). The role of driver inattention in crashes;
new statistics from the 1995 Crashworthiness Data System. 40th Annual Proceedings,
Association for the advancement of Automotive Medicine, Vancouver, British Columbia,
Canada.
Willis D (1996). Driving sleepy: AAA Foundation for Traffic Safety initiative to prevent
“fatigue”-related crashes. Washington, D.C.: AAA Foundation for Traffic Safety.
57
58
Appendix A
North Carolina Crash Report Form
(See Separate File)
59
60
Appendix B
Introductory Letters
61
62
Date
Mr. John Doe
333 Main Street
Any City, NC 00000
Dear Mr. Doe:
The UNC Highway Safety Research Center is conducting research to learn more about the role
that drowsy driving plays in traffic accidents and how such accidents might be avoided. The study is
being sponsored by the AAA Foundation for Traffic Safety. Your name was randomly chosen from
drivers recently involved in N.C. accidents, some where sleepiness or drowsiness may have been a
factor and others where it was likely not a factor.
We would like to contact you for a brief telephone interview. All information you provide will
be confidential and will have no effect on your insurance rates or driving record. Once we have completed the interview, we will only keep an identification number in our records – no names, addresses, or
telephone numbers. The interview should take about 10 to 15 minutes.
Your participation in the study is entirely voluntary. If you do not wish to be called, please return
the enclosed postcard. Even if you do not return the postcard, you can decline to participate when
called. The person calling will be either Ms. Terri McClernon or Ms. Penny Noell. Both are employees
of the UNC Highway Safety Research Center.
If you have questions or concerns about the study, please feel free to contact me at the number
below. You can call collect, or if I am unavailable you can leave a message and I will return your call.
Thank you. We would greatly appreciate your cooperation and support of this research effort.
Sincerely,
Jane Stutts, Ph.D.
Project Director
(919) 962-8717
63
Date
Mr. John Doe
333 Main Street
Any City, NC 00000
Dear Mr. Doe:
The UNC Highway Safety Research Center is conducting research to learn more about the role
that drowsy driving plays in traffic accidents and how such accidents might be avoided. The study is
being sponsored by the AAA Foundation for Traffic Safety.
As part of the study, we have been talking with drivers who have been involved in a recent sleeprelated motor vehicle accident. We now need to talk with some drivers who have not been in accidents.
Your name was randomly chosen from a list of all licensed N.C. drivers who have not been in recent
accidents, and we would like to contact you for a brief telephone interview.
All information you provide will be confidential. Once we have completed the interview, we will
only keep an identification number in our records – no names, addresses, or telephone numbers. The
interview should take less than 10 minutes of your time.
We will be trying to call you at home some time within the next two weeks. The person calling
will be either Ms. Jane Folinsbee, Ms. Stacy McMillan, or Ms. Paulette Beacot. All are employees of the
UNC Highway Safety Research Center.
If you do not wish to participate in the study, you need only tell us so when called. If you have
questions or concerns about the study, please feel free to contact me at the number below. You can call
collect, or if I am unavailable you can leave a message and I will return your call.
Thank you. We would greatly appreciate your cooperation and support of this research effort.
Sincerely,
Jane Stutts, Ph.D.
Project Director
(919) 962-8717
64
Appendix C
Survey Cover Sheet and Interview Form
65
66
Subject ID# __ __ __ __
Subject Information
Name:
Date of Accident __ __ / __ __ / __ __
City / State:
Driver Injury:
Telephone:
Home
Other Injuries in Driver’s Vehicle:
Work
Injuries in Other Vehicle(s):
Age __ __
Sex ___
Race __________
Date Consent Letter Mailed: __ __ / __ __ / __ __
Telephone Contact Record
Date
Time
Interviewer
Response
1
2
3
4
5
6
7
8
Interview Completion Status:
1. ___ yes
2. ___ yes, partial
3. ___ no, under 18
4. ___ no, refused
5. ___ no, unable to contact (no phone #, incorrect #, unlisted #, etc.)
6. ___ no, language barrier
7. ___ no, physically unable to be interviewed (injured, sick, hearing, etc.)
8. ___ no, max attempts
9. ___ no, other (describe _________________________________________)
Date Interviewed: __ __ / __ __ / __ __ Interv. (5=Stacy, 6=Paulette. 7=Jane F.) _____
Proxy Used? 1.___ yes 2.___ no 3.___ partial
Results Requested? 1.___ yes
2.___ no
I have obtained the subject’s informed consent and agree to keep all information from this interview confidential.
______________________________
(Signature of Interviewer)
67
____/____/____
(Date)
68
Sleep and Driving Questionnaire
I. Awareness
Note: Randomize presentation AFTER starting with 1.1
1.1 First I’d like to ask your opinion about the importance of six different
factors in causing motor vehicle accidents. The first is poor weather
conditions, such as heavy rain or fog. Would you say that poor weather
conditions are very important in causing motor vehicle accidents, somewhat important, somewhat unimportant, or very unimportant in causing
motor vehicle accidents?
1.
2.
3.
4.
Very important
Somewhat impt
Somewhat unimpt
Very unimportant
1.2 And how would you rate speeding as a factor in causing motor vehicle
accidents? Again, would you say it is very important, somewhat important, somwhat unimportant, or very unimportant in causing motor
vehicle accidents?
1.
2.
3.
4.
Very important
Somewhat impt
Somewhat unimpt
Very unimportant
1.3 How would you rate driver inexperience as a factor in causing accidents? This would cover, for example, young beginning drivers who
have only had their license a short time. Would you say it is very important in causing accidents, somewhat important, somewhat unimportant,
or very unimportant/
1.
2.
3.
4.
Very important
Somewhat impt
Somewhat unimpt
Very unimportant
1.4 What about aggressive driving, such as cutting someone off in traffic, or
tailgating? How would you rate it as a factor in causing accidents?
Would you say it is very important in causing accidents, somewhat
important, somewhat unimportant, or very unimportant?
1.
2.
3.
4.
Very important
Somewhat impt
Somewhat unimpt
Very unimportant
1.5 How would you rate alcohol as a factor in causing accidents? Would
you say it is very important in causing accidents, somewhat important,
somewhat unimportant, or very unimportant?
1.
2.
3.
4.
Very important
Somewhat impt
Somewhat unimpt
Very unimportant
1.6 How would you rate driver drowsiness? By drowsiness, I mean being
so tired that you have trouble keeping your eyes open and could easily
fall asleep. How would you rate drowsiness as a factor in causing
accidents? Would you say it is very important in causing accidents,
somewhat important, somewhat unimportant, or very unimportant?
1.
2.
3.
4.
Very important
Somewhat impt
Somewhat unimpt
Very unimportant
1.7 And finally, how would you rate driver inattention? By inattention, I
mean not being alert to what’s going on around you, being distracted by
others in the vehicle, that sort of thing
1.
2.
3.
4.
Very important
Somewhat impt
Somewhat unimpt
Very unimportant
69
II. Sleep Habits/Circadian/Sleep Debt
Intro Now I’d like to ask a few questions about your daily schedule.
2.1
First, can you tell me if you are currently employed?
(If no, skip to 2.7)
1. Yes
2. No
3. Unsure
2.2
Do you have one job or more than one job?
______ jobs
2.3
How many total hours a week do you typically work at your (first) job?
______ hours
2.3a Do you work a regular schedule, like 8-5 or 9-5, or do you work other
times during the day or night? (Code Part Time if <30 hours/week)
2.3b If other,
Can you tell me the hours you usually work?
(Write in hours if uncertain.)
1. First (morning) shift always
2. Second (afternoon or evening) shift always
3. Third (night) shift always
4. Rotating shifts
5. Split shifts (e.g., 4 hours in AM and 4 more in PM, for same job)
6. Weekends only
7. Hours vary
8. Other (describe) _____________________________________
1. Regular
2. Other
3. Part Time
1.
2.
3.
4.
5.
6.
7.
8.
First
Second
Third
Rotating
Split
Weekends
Hours vary
Other
SKIP TO 2.7 IF ONLY ONE JOB
2.4
And how many hours a week do you work at your second job?
2.4a And can you tell me the hours you usually work?
1. Mornings
2. Afternoons or evenings
3. Nights
4.
5.
6. Weekends
7. Hours vary
8. Other (describe) _____________________________________
SKIP TO 2.6 IF ONLY TWO JOBS
70
____ hours
_____
2.5
And how many hours a week do you work at your third job?
_____ hours
2.5a And can you tell me the hours you usually work?
1. Mornings
2. Afternoons or evenings
3. Nights
4.
5.
6. Weekends
7. Hours vary
8. Other (describe) _____________________________________
_____
2.6
How many TOTAL hours a week, then, do you work?
_____ hours
2.7
Are you enrolled in school or taking classes?
1. Yes
2. No
2.7a If yes, about how many total hours a week do you typically spend
either in class or studying?
_______ hrs.
2.8
On average, how many hours sleep do you get per night? (or per 24
hours) (Record for during week, or when working, if varies.)
_______ hrs.
2.9
What is your usual wakeup time? (24-hour clock, e.g., 0800 for
8 a.m.) (Record for during week, or when working, if varies.)
__ __ __ __
2.10 What is your usual bedtime? (24-hour clock, e.g., 2300 for 11 p.m.)
(Record for during week, or when working, if varies.)
24-Hour Clock Times:
0030 = 12:30 a.m. 1300 = 1 p.m.
0100 = 1 a.m.
1400 = 2 p.m.
...
1500 = 3 p.m.
1200 = noon
1600 = 4 p.m.
1700 = 5 p.m.
1800 = 6 p.m.
1900 = 7 p.m.
2000 = 8 p.m.
71
__ __ __ __
2100 = 9 p.m.
2200 = 10 p.m.
2300 = 11 p.m.
2400 = midnight
III. Sleep Disorders
Intro People vary a lot in their sleep. Some people have trouble falling asleep
and some don’t. Some sleep straight through, while others may wake up
and have trouble getting back to sleep.
3.1
How about you? Would you say that you always have trouble falling
asleep, often have trouble, sometimes have trouble, or never have trouble
falling asleep?
1.
2.
3.
4.
Always
Often
Sometimes
Never
3.2
Do you have trouble staying asleep? Again, please tell me whether
always, often, sometimes, or never.
1.
2.
3.
4.
Always
Often
Sometimes
Never
3.3
How would you rate the overall quality of your sleep? Would you say
that it is excellent, good, fair, or poor?
1. Excellent
2. Good
3. Fair
4. Poor
3.4
In general, do you feel that you get too much sleep, not enough sleep, or
about the right amount of sleep?
1. Too much
2. Not enough
3. About right
3.5
Do you know if you are a loud snorer, or has anyone ever complained to
you about your snoring?
1. Yes
2. No
3. Don’t know
3.6
Do you know if you sometimes stop breathing for a short while during
sleep, or has anyone ever told you that you stop breathing?
1. Yes
2. No
3. Don’t know
3.7
Have you ever been told by a physician that you have a sleep disorder,
such as sleep apnea or narcolepsy?
Sleep apnea is when you briefly stop breathing while sleeping.
Narcolepsy is when you suddenly and uncontrollably fall asleep.
If yes, ask what have been told have. Describe any other disorders below.
1.
2.
3.
4.
5.
Yes - apnea
Yes - narcol
Yes - other
No
Don’t know
___________________________________________________
3.7a
If yes, ask, Are you (currently) being treated for it?
72
1. Yes
2. No
3. Not sure
IV. Epworth Sleepiness Scale
Intro Now I would like to describe some situations to you, and I want you to tell
me how likely you are to doze or briefly nod off to sleep in each situation. Please answer based on your usual way of life in recent times. O.K.?
4.1
The first situation is when sitting and reading. Would you say that you
would never doze, there is a slight chance you would doze, a moderate
chance of dozing, or a high chance of dozing. Remember, I’m talking
about actually dozing off or falling asleep, and not just feeling tired.
0.
1.
2.
3.
Never
Slight
Moderate
High
4.2
When watching TV. Again, would you never doze, is there a slight
chance you’d doze, a moderate chance, or a high chance.
0.
1.
2.
3.
Never
Slight
Moderate
High
4.3
When sitting, inactive in a public space (such as a theater or a meeting).
0.
1.
2.
3.
Never
Slight
Moderate
High
4.4
When riding as a passenger in a car for an hour without a break.
0.
1.
2.
3.
Never
Slight
Moderate
High
4.5
If you lie down to rest in the afternoon, when circumstances permit.
0.
1.
2.
3.
Never
Slight
Moderate
High
4.6
If sitting and talking to someone.
0.
1.
2.
3.
Never
Slight
Moderate
High
4.7
If sitting quietly after a lunch that did not include alcohol.
0.
1.
2.
3.
Never
Slight
Moderate
High
4.8
When at the wheel of a car, stopped for a few minutes in traffic.
0.
1.
2.
3.
Never
Slight
Moderate
High
73
V. Driving Exposure
Intro Now I’d like to ask you a few questions about your driving.
5.1
First, can you tell me about how many miles a year you drive? This
would be the number of miles you yourself drive, as opposed to any
additional miles you may ride as a passenger in a car. Would you say you
drive (read categories at right. Say, 5,000 up to 10,000 miles, 10,000 up to
15,000 miles, etc.)
1.
2.
3.
4.
5.
6.
5.2
Do you drive as part of your job? (Prompt: This would be in addition to
any driving you may do to get to and from your job)
(Ask only if employed. See 2.1)
1. Yes
2. No
If yes, ask How many days a week do you drive, on average, as part of
your job?
_____ days
5.3
5.4
5.5
(Counting both your personal driving and your work driving) How much
total time do you spend, on average, behind the wheel each day?
Remember, I’m wanting the time that you are actually driving, as opposed
to any additional time you may spend as a passenger in a car.
<5,000 mi.
5-10K mi.
10-15K mi.
15-20K mi
20-25K mi.
>25K mi.
___ hr.___ min.
Averaged out over a year’s time, about what percentage of your driving is
done in the evening or at nighttime, when it is dark?
_______ %
And approximately what percentage of your driving is between midnight
and 6 a.m.?
_______ %
5.6
How often do you drive for 30 minutes or more at a time? Would you say
you do this daily or almost daily, 3-5 days a week, one or two days a week,
a couple times a month, or less than once a month.
1.
2.
3.
4.
5.
Daily/almost
3-5 days
1-2 days
Couple / mo.
< 1 / month
5.7
And how often do you drive for 3 hours or more at a time? Would you
say you do this weekly, a couple times a month, once every 2-3 months, a
couple times a year, or once a year or less.
1.
2.
3.
4.
5.
Weekly
Couple / mo.
Once/2-3 mo
Couple /year
<= 1 / year
74
VI. Drowsy Driving/Countermeasures
6.1
Now I have a few questions about driving while you’re sleepy or feeling
drowsy. For those times when you DO find yourself in this situation, can you
tell me what, if anything, you do to help yourself stay awake and alert?
List up to 5 things below. Don’t prompt with ideas. Then go back and ask,
How useful do you feel each of these is for helping you stay awake? Would
you say very helpful, somewhat helpful, not too helpful, or not helpful at all.
Code
a.__________________________________________________________
1. Very helpful 2. Somewhat helpful 3. Not too helpful 4. Not at all helpful
b.__________________________________________________________
1. Very helpful 2. Somewhat helpful 3. Not too helpful 4. Not at all helpful
c.__________________________________________________________
1. Very helpful 2. Somewhat helpful 3. Not too helpful 4. Not at all helpful
d.__________________________________________________________
(Codes)
1. Drink caffeine
2. Drink other
3. Eat something
4. Pills/drugs
5. Radio/CD
6. CB Radio
7. Windows, AC
ventilation
8. Talk to pass.
9. Talk to self
10. Smoke
11. Stop to rest
12. Stop for nap
13. Stop to eat
14. Stop to exer.
15. Focus attent.
16. Slap/hit self
17. Stop driving
18. Water on face
19. Move around
20. Sing to self
1. Very helpful 2. Somewhat helpful 3. Not too helpful 4. Not at all helpful
97. Other
(Describe)
e.__________________________________________________________
1. Very helpful 2. Somewhat helpful 3. Not too helpful 4. Not at all helpful
6.2 Can you tell me about how often over the past year you found yourself in a
situation where you felt sleepy or drowsy while driving? Would you say yo
never experienced this, experienced it once or twice in the past year, 3-4 times,
5-10 times, or more than 10 times during the past year?
75
98. Never sleepy
99. Don’t know of
anything
1.
2.
3.
4.
5.
Never
1-2 times
3-4 times
5-10 times
> 10 times
6.3 O.K. I’ve asked you about ways you deal with driving when you’re
ALREADY sleepy or feeling drowsy. On the other hand, some people
make an effort to PREVENT getting in that situation at all. Can you tell me
what, if anything, you do before you start out on a drive or a long trip to
keep yourself from becoming sleeping or drowsy? Again, I just want to get
your thoughts on this.
Codes to Use:
1. Avoid driving late at night or during times would normally be sleeping.
(e.g., by leaving earlier in the day)
2. Plan trips to allow plenty of time for rest stops, etc. along the way.
3. Don’t plan too long a drive. Break trip up over several days, etc.
4. Share driving with friend, family member, etc.
5. Invite someone along for company. Don’t drive alone.
6. Get a good night’s sleep before setting off on a long trip.
7. Take a nap before leaving on a long trip.
8. Avoid any alcohol before a long trip.
9. Drink caffeinated beverage before a long trip.
10. Stop at motel or other place to sleep.
(i.e., break a long trip up, but not necessarily preplanned as in #3.)
(This not really preventive, but bet people will say it anyway.)
11. Bring along caffeine, food, etc.
Enter up to 5
Codes Below:
a. _______
b. _______
c. _______
d. _______
e. _______
97. Other preventive measure ____________________________
98. Other (not really preventive) __________________________
99. N/A or Nothing (If say never do anything to prevent sleepy driving, or
can’t think of anything do to prevent sleepy driving.)
6.4 If you had to choose one or the other, would you say you are more likely to
PREVENT getting in a sleepy driving situation, or to simply DEAL WITH
the situation if it arises?
1. Prevent it
2. Deal with it
3. Uncertain
6.5 We know from other studies that about 1 out of 4 persons say they have
fallen asleep while driving. Has this ever happened to you?
1. Yes
2. No
3. Uncertain
If yes, ask Has it happened in the last 2-3 years?
1. Yes
2. No
3. Uncertain
76
VII. Crash Information
Intro Now just a few specific questions about your recent accident, and
we’ll be through. Remember that any information you provide is
completelyconfidential. We’re not keeping your name in any of
our records. We’re talking with some people who have been in an
accident where sleepiness may have been a factor, and other
people in accidents where sleepiness was probably not a factor.
I don’t even know which situation applies to you.
7.1
7.2
7.3
Minutes = Decimal
5 = .1
35 = .6
10 = .2
40 = .7
15 = .3
45 = .8
20 = .3
50 = .8
25 = .4
55 = .9
30 = .5
About how long a time had you been driving just before the
accident?
____.___ hours
And for how many hours had you been awake that day?
( Prompt: how long had it been since you slept?)
____.___ hours
Before that (or the night before), can you recall how long you had
slept?
____.___ hours
7.4
How drowsy would you say you were feeling just before your
accident? Would you say that you were very drowsy, moderately
drowsy, slightly drowsy, or not at all drowsy?
1.
2.
3.
4.
5.
Very drowsy
Moderately drow.
Slightly drowsy
Not at all drowsy
Don’t know
7.5
And to what extent do you think drowsiness was a factor in your
accident? Would you say it was a very important factor, moderately important, slightly important, or not at all important in your
accident? (Note: interested in their drowsiness -- not any other
drivers’)
1.
2.
3.
4.
5.
Very important
Moderately impt.
Slightly impt.
Not at all impt.
Don’t know
7.6
At the time of your accident, (do you remember if you) were you
taking any medications that come with a warning that they may
make you drowsy?
1. Yes
2. No
3. Don’t know
VIII. Conclusion
8.1
Thank you. That concludes the survey. Is there anything else
you would like to comment on?
(Note any comments below.)
77
1. Comment
2. No comment
78
Appendix D
Crash Rating Algorithm
79
80
Reviewer: ___________
Date: ______________
Case # ____________
CRASH REPORT CHECKLIST
1. Drowsiness noted on crash report (narrative or checkbox)
___
Officer indicated sleepiness or drowsiness in checkbox (Physical condition = 3 or 4)
___
Officer indicated sleepiness or drowsiness in narrative
___
Driver indicated sleepiness or drowsiness (e.g., told officer fell asleep, was tired, etc.)
___
Other indication of sleepiness or drowsiness (e.g., driver doesn’t remember crash)
Counter-indications
2. No change in vehicle trajectory at crash outset
___
Vehicle going straight ahead (Vehicle maneuver = 4)
___
First harmful event = run-off-road (left, right, or straight ahead)
___
First harmful event = other event with no change of trajectory (e.g., hits fixed object or parked
vehicle, rear-ends slower or stopped vehicle)
3. No other indication of active driving at crash outset (e.g., steering, braking)
___
Not passing, turning, backing, slowing or stopping, starting, merging, avoiding object, etc.
(Vehicle maneuver = other)
___
No tire impressions prior to impact
___
Tire impressions, but could be after crash outset
4. Other Potential Causes
___
Awake Inattention (distraction in car, distraction in roadway — see narrative)
___
Speeding sufficient for loss of control
Est. Speed ____ , Speed Limit ____ ; Contributing circumstances = 7 or 8 ___)
___
Weather/road sufficient for loss of control (Weather≠1 or 2; Road Condition≠1; Narrative)
___
Alcohol/drugs (Contributing circumstances = 2 or 3 ___; Physical condition = 5 ___)
___
Medical condition (Physical condition = 2 or 5 (medicine) ___; Indicated in narrative ___)
___
Other: ________________________________________________________
OVERALL RATING
OF DROWSINESS
1.
Drowsiness
Noted
2.
No Change
in Trajectory
3.
No Active
Driving
4.
No Other
Potential Cause(s)
✓
✓
✓
None Checked
PROBABLE Evidence
✓ or No
✓
✓
Doubtful / Insufficient
POSSIBLE Evidence
✓ or No
✓
✓
Credible / Sufficient
STRONG Evidence
NO Evidence
No
2 and/or 3 questionable
Doubtful / Insufficient
✓
2 and/or 3 questionable
Credible / Sufficient
Not indicated
2, 3 and/or 4 counter-indications or causes
Comments: ____________________________________________________________________________
_____________________________________________________________________________________
_____________________________________________________________________________________
81
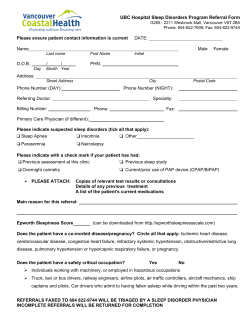


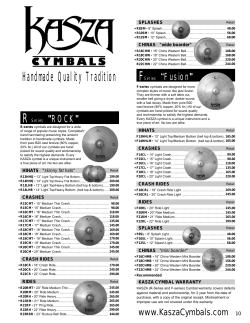


© Copyright 2026